Accounting - LaGrange College · Accounting Netflix, Inc.: A Financial Analysis ... Blockbuster!s...
20
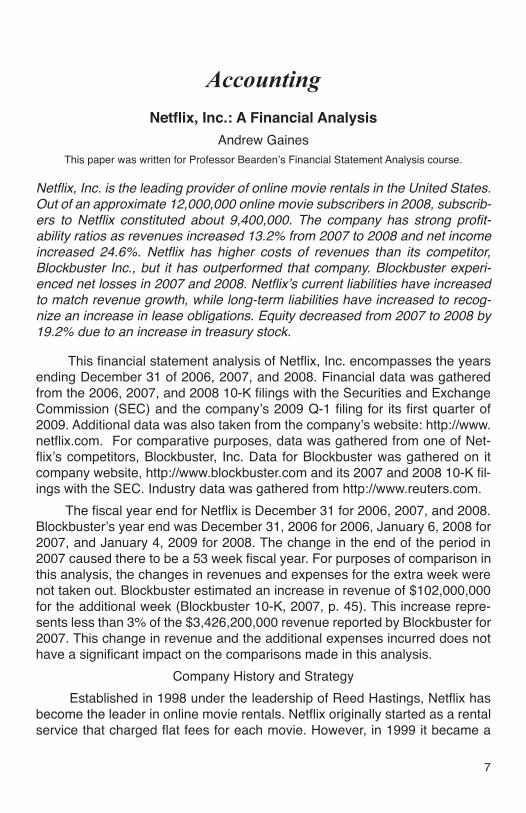
7 Accounting Netflix, Inc.: A Financial Analysis Andrew Gaines This paper was written for Professor Bearden!s Financial Statement Analysis course. Netflix, Inc. is the leading provider of online movie rentals in the United States. Out of an approximate 12,000,000 online movie subscribers in 2008, subscrib- ers to Netflix constituted about 9,400,000. The company has strong profit- ability ratios as revenues increased 13.2% from 2007 to 2008 and net income increased 24.6%. Netflix has higher costs of revenues than its competitor, Blockbuster Inc., but it has outperformed that company. Blockbuster experi- enced net losses in 2007 and 2008. Netflix!s current liabilities have increased to match revenue growth, while long-term liabilities have increased to recog- nize an increase in lease obligations. Equity decreased from 2007 to 2008 by 19.2% due to an increase in treasury stock. This financial statement analysis of Netflix, Inc. encompasses the years ending December 31 of 2006, 2007, and 2008. Financial data was gathered from the 2006, 2007, and 2008 10-K filings with the Securities and Exchange Commission (SEC) and the company!s 2009 Q-1 filing for its first quarter of 2009. Additional data was also taken from the company!s website: http://www. netflix.com. For comparative purposes, data was gathered from one of Net- flix!s competitors, Blockbuster, Inc. Data for Blockbuster was gathered on it company website, http://www.blockbuster.com and its 2007 and 2008 10-K fil- ings with the SEC. Industry data was gathered from http://www.reuters.com. The fiscal year end for Netflix is December 31 for 2006, 2007, and 2008. Blockbuster!s year end was December 31, 2006 for 2006, January 6, 2008 for 2007, and January 4, 2009 for 2008. The change in the end of the period in 2007 caused there to be a 53 week fiscal year. For purposes of comparison in this analysis, the changes in revenues and expenses for the extra week were not taken out. Blockbuster estimated an increase in revenue of $102,000,000 for the additional week (Blockbuster 10-K, 2007, p. 45). This increase repre- sents less than 3% of the $3,426,200,000 revenue reported by Blockbuster for 2007. This change in revenue and the additional expenses incurred does not have a significant impact on the comparisons made in this analysis. Company History and Strategy Established in 1998 under the leadership of Reed Hastings, Netflix has become the leader in online movie rentals. Netflix originally started as a rental service that charged flat fees for each movie. However, in 1999 it became a
Transcript of Accounting - LaGrange College · Accounting Netflix, Inc.: A Financial Analysis ... Blockbuster!s...
7
Accounting
Netflix, Inc.: A Financial Analysis
Andrew Gaines
This paper was written for Professor Bearden!s Financial Statement Analysis course.
Netflix, Inc. is the leading provider of online movie rentals in the United States.
Out of an approximate 12,000,000 online movie subscribers in 2008, subscrib-
ers to Netflix constituted about 9,400,000. The company has strong profit-
ability ratios as revenues increased 13.2% from 2007 to 2008 and net income
increased 24.6%. Netflix has higher costs of revenues than its competitor,
Blockbuster Inc., but it has outperformed that company. Blockbuster experi-
enced net losses in 2007 and 2008. Netflix!s current liabilities have increased
to match revenue growth, while long-term liabilities have increased to recog-
nize an increase in lease obligations. Equity decreased from 2007 to 2008 by
19.2% due to an increase in treasury stock.
This financial statement analysis of Netflix, Inc. encompasses the years ending December 31 of 2006, 2007, and 2008. Financial data was gathered from the 2006, 2007, and 2008 10-K filings with the Securities and Exchange Commission (SEC) and the company!s 2009 Q-1 filing for its first quarter of 2009. Additional data was also taken from the company!s website: http://www.netflix.com. For comparative purposes, data was gathered from one of Net-flix!s competitors, Blockbuster, Inc. Data for Blockbuster was gathered on it company website, http://www.blockbuster.com and its 2007 and 2008 10-K fil-ings with the SEC. Industry data was gathered from http://www.reuters.com.
The fiscal year end for Netflix is December 31 for 2006, 2007, and 2008. Blockbuster!s year end was December 31, 2006 for 2006, January 6, 2008 for 2007, and January 4, 2009 for 2008. The change in the end of the period in 2007 caused there to be a 53 week fiscal year. For purposes of comparison in this analysis, the changes in revenues and expenses for the extra week were not taken out. Blockbuster estimated an increase in revenue of $102,000,000 for the additional week (Blockbuster 10-K, 2007, p. 45). This increase repre-sents less than 3% of the $3,426,200,000 revenue reported by Blockbuster for 2007. This change in revenue and the additional expenses incurred does not have a significant impact on the comparisons made in this analysis.
Company History and Strategy
Established in 1998 under the leadership of Reed Hastings, Netflix has become the leader in online movie rentals. Netflix originally started as a rental service that charged flat fees for each movie. However, in 1999 it became a
8
crease from the United States Postal Service. Postage for first class changed from $0.41 to $0.42 in May. Management did note that discounts were received for outbound mailing (Netflix 10-K, 2008, p. 30). Netflix provides its customers with prepaid return envelopes. The postage on these envelopes is at the full rate. Lastly, content expenses increased 7% from 2007 to 2008 for purchases of new streaming content (Netflix 10-K, 2008, p. 32).
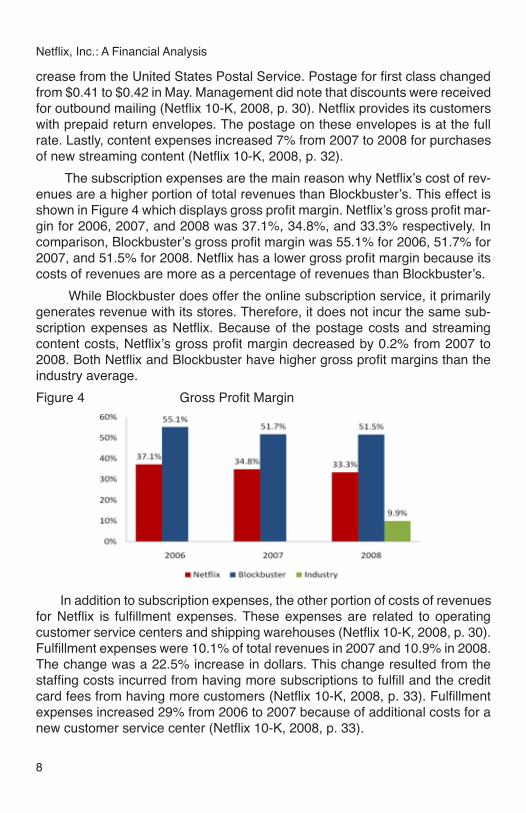
The subscription expenses are the main reason why Netflix!s cost of rev-enues are a higher portion of total revenues than Blockbuster!s. This effect is shown in Figure 4 which displays gross profit margin. Netflix!s gross profit mar-gin for 2006, 2007, and 2008 was 37.1%, 34.8%, and 33.3% respectively. In comparison, Blockbuster!s gross profit margin was 55.1% for 2006, 51.7% for 2007, and 51.5% for 2008. Netflix has a lower gross profit margin because its costs of revenues are more as a percentage of revenues than Blockbuster!s.
While Blockbuster does offer the online subscription service, it primarily generates revenue with its stores. Therefore, it does not incur the same sub-scription expenses as Netflix. Because of the postage costs and streaming content costs, Netflix!s gross profit margin decreased by 0.2% from 2007 to 2008. Both Netflix and Blockbuster have higher gross profit margins than the industry average.
Figure 4 Gross Profit Margin
In addition to subscription expenses, the other portion of costs of revenues for Netflix is fulfillment expenses. These expenses are related to operating customer service centers and shipping warehouses (Netflix 10-K, 2008, p. 30). Fulfillment expenses were 10.1% of total revenues in 2007 and 10.9% in 2008. The change was a 22.5% increase in dollars. This change resulted from the staffing costs incurred from having more subscriptions to fulfill and the credit card fees from having more customers (Netflix 10-K, 2008, p. 33). Fulfillment expenses increased 29% from 2006 to 2007 because of additional costs for a new customer service center (Netflix 10-K, 2008, p. 33).
Netflix, Inc.: A Financial Analysis
9
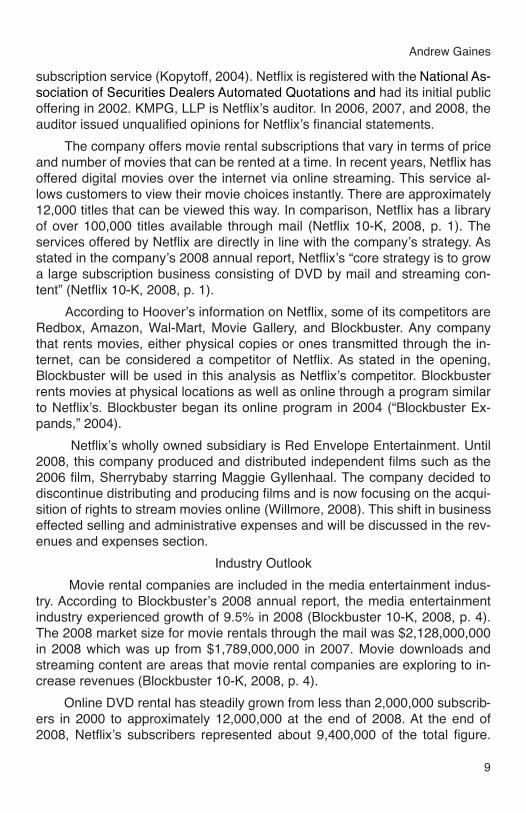
subscription service (Kopytoff, 2004). Netflix is registered with the National As-sociation of Securities Dealers Automated Quotations and had its initial public offering in 2002. KMPG, LLP is Netflix!s auditor. In 2006, 2007, and 2008, the auditor issued unqualified opinions for Netflix!s financial statements.
The company offers movie rental subscriptions that vary in terms of price and number of movies that can be rented at a time. In recent years, Netflix has offered digital movies over the internet via online streaming. This service al-lows customers to view their movie choices instantly. There are approximately 12,000 titles that can be viewed this way. In comparison, Netflix has a library of over 100,000 titles available through mail (Netflix 10-K, 2008, p. 1). The services offered by Netflix are directly in line with the company!s strategy. As stated in the company!s 2008 annual report, Netflix!s “core strategy is to grow a large subscription business consisting of DVD by mail and streaming con-tent” (Netflix 10-K, 2008, p. 1).
According to Hoover!s information on Netflix, some of its competitors are Redbox, Amazon, Wal-Mart, Movie Gallery, and Blockbuster. Any company that rents movies, either physical copies or ones transmitted through the in-ternet, can be considered a competitor of Netflix. As stated in the opening, Blockbuster will be used in this analysis as Netflix!s competitor. Blockbuster rents movies at physical locations as well as online through a program similar to Netflix!s. Blockbuster began its online program in 2004 (“Blockbuster Ex-pands,” 2004).
Netflix!s wholly owned subsidiary is Red Envelope Entertainment. Until 2008, this company produced and distributed independent films such as the 2006 film, Sherrybaby starring Maggie Gyllenhaal. The company decided to discontinue distributing and producing films and is now focusing on the acqui-sition of rights to stream movies online (Willmore, 2008). This shift in business effected selling and administrative expenses and will be discussed in the rev-enues and expenses section.
Industry Outlook
Movie rental companies are included in the media entertainment indus-try. According to Blockbuster!s 2008 annual report, the media entertainment industry experienced growth of 9.5% in 2008 (Blockbuster 10-K, 2008, p. 4). The 2008 market size for movie rentals through the mail was $2,128,000,000 in 2008 which was up from $1,789,000,000 in 2007. Movie downloads and streaming content are areas that movie rental companies are exploring to in-crease revenues (Blockbuster 10-K, 2008, p. 4).
Online DVD rental has steadily grown from less than 2,000,000 subscrib-ers in 2000 to approximately 12,000,000 at the end of 2008. At the end of 2008, Netflix!s subscribers represented about 9,400,000 of the total figure.
Andrew Gaines
10
Each year since 2000, there has been an increase in subscribers, both overall in the industry and for Netflix (Netflix, 2008). This trend in increases over the last nine years gives internet movie rental companies a positive outlook on future growth.
Revenue and Expenses
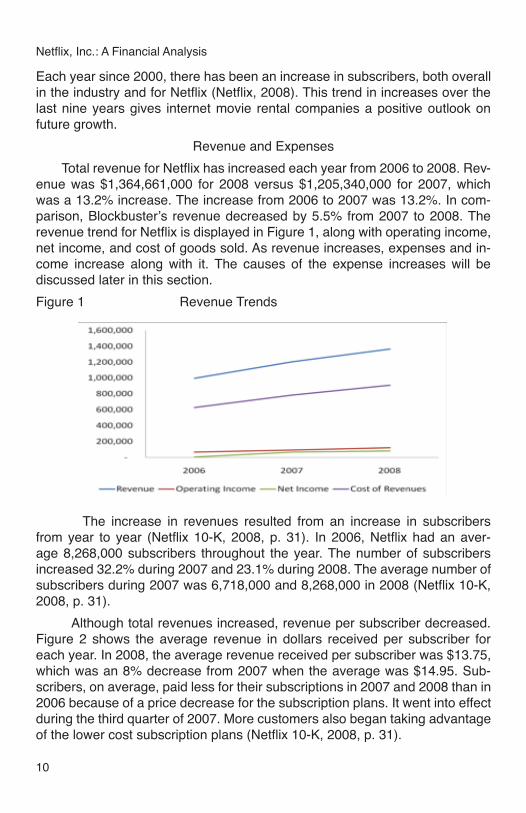
Total revenue for Netflix has increased each year from 2006 to 2008. Rev-enue was $1,364,661,000 for 2008 versus $1,205,340,000 for 2007, which was a 13.2% increase. The increase from 2006 to 2007 was 13.2%. In com-parison, Blockbuster!s revenue decreased by 5.5% from 2007 to 2008. The revenue trend for Netflix is displayed in Figure 1, along with operating income, net income, and cost of goods sold. As revenue increases, expenses and in-come increase along with it. The causes of the expense increases will be discussed later in this section.
Figure 1 Revenue Trends
The increase in revenues resulted from an increase in subscribers from year to year (Netflix 10-K, 2008, p. 31). In 2006, Netflix had an aver-age 8,268,000 subscribers throughout the year. The number of subscribers increased 32.2% during 2007 and 23.1% during 2008. The average number of subscribers during 2007 was 6,718,000 and 8,268,000 in 2008 (Netflix 10-K, 2008, p. 31).
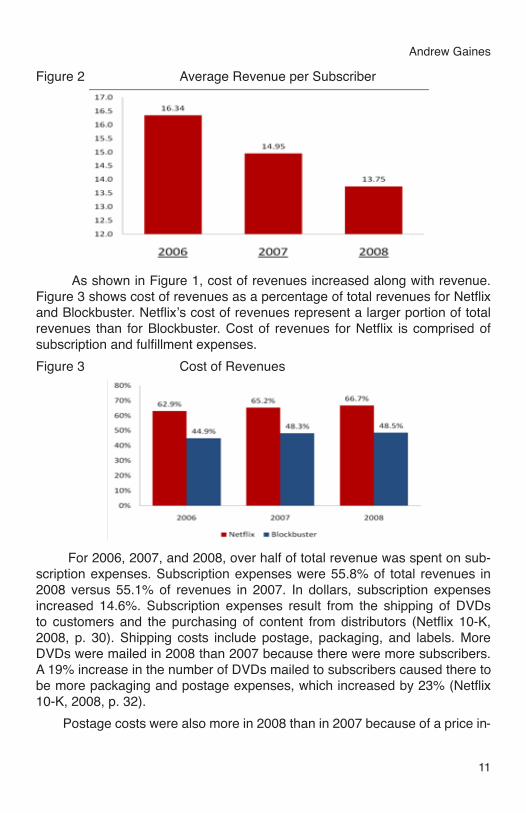
Although total revenues increased, revenue per subscriber decreased. Figure 2 shows the average revenue in dollars received per subscriber for each year. In 2008, the average revenue received per subscriber was $13.75, which was an 8% decrease from 2007 when the average was $14.95. Sub-scribers, on average, paid less for their subscriptions in 2007 and 2008 than in 2006 because of a price decrease for the subscription plans. It went into effect during the third quarter of 2007. More customers also began taking advantage of the lower cost subscription plans (Netflix 10-K, 2008, p. 31).
Netflix, Inc.: A Financial Analysis
11
Figure 2 Average Revenue per Subscriber
As shown in Figure 1, cost of revenues increased along with revenue. Figure 3 shows cost of revenues as a percentage of total revenues for Netflix and Blockbuster. Netflix!s cost of revenues represent a larger portion of total revenues than for Blockbuster. Cost of revenues for Netflix is comprised of subscription and fulfillment expenses.
Figure 3 Cost of Revenues
For 2006, 2007, and 2008, over half of total revenue was spent on sub-scription expenses. Subscription expenses were 55.8% of total revenues in 2008 versus 55.1% of revenues in 2007. In dollars, subscription expenses increased 14.6%. Subscription expenses result from the shipping of DVDs to customers and the purchasing of content from distributors (Netflix 10-K, 2008, p. 30). Shipping costs include postage, packaging, and labels. More DVDs were mailed in 2008 than 2007 because there were more subscribers. A 19% increase in the number of DVDs mailed to subscribers caused there to be more packaging and postage expenses, which increased by 23% (Netflix 10-K, 2008, p. 32).
Postage costs were also more in 2008 than in 2007 because of a price in-
Andrew Gaines
12
For Netflix, operating expenses include technology and development expenses, marketing, and general and administrative expenses. Expenses for technology and development increased 26.6% from 2007 to 2008 because of the increase in personnel needed for the addition of streaming content on the internet (Netflix 10-K, 2008, p. 33). In terms of total revenue, these expenses were 6.6% in 2008 compared to 5.9% in 2007. Marketing expenses decreased 8.5% from 2007 to 2008 and comprised 14.6% of total revenues in 2008 com-pared to 18.1% in 2007. The decrease in marketing expenses reflects Netflix!s decision to decrease the amount of advertisements sent to potential custom-ers (Netflix 10-K, 2008, p. 34). Free trials given to potential customers are al-located to marketing expenses (Netflix 10-K, 2008, p. 30). General and admin-istrative expenses decreased 5.2% from 2007 to 2008 because of a decrease in the amounts allocated to Red Envelope Entertainment (Netflix 10-K, 2008, p. 34). The subsidiary suspended its production and distribution segments in 2008 (Willmore, 2008). Therefore, it did not incur as many expenses.
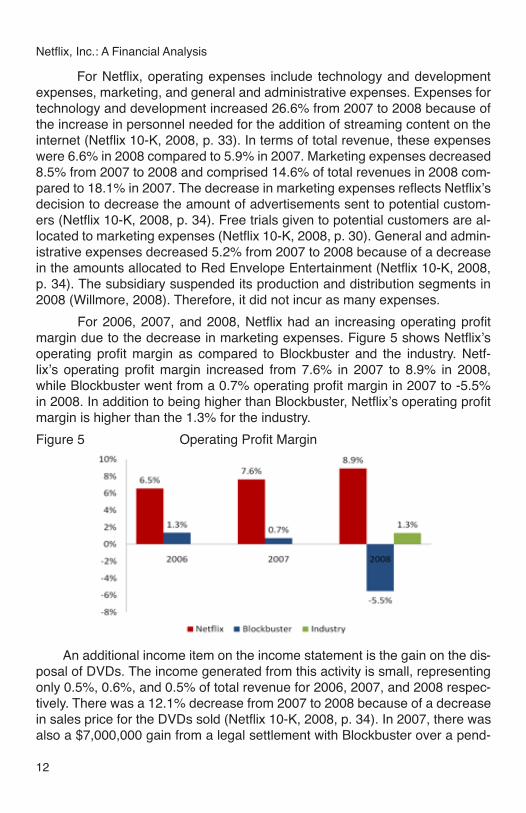
For 2006, 2007, and 2008, Netflix had an increasing operating profit margin due to the decrease in marketing expenses. Figure 5 shows Netflix!s operating profit margin as compared to Blockbuster and the industry. Netf-lix!s operating profit margin increased from 7.6% in 2007 to 8.9% in 2008, while Blockbuster went from a 0.7% operating profit margin in 2007 to -5.5% in 2008. In addition to being higher than Blockbuster, Netflix!s operating profit margin is higher than the 1.3% for the industry.
Figure 5 Operating Profit Margin
An additional income item on the income statement is the gain on the dis-posal of DVDs. The income generated from this activity is small, representing only 0.5%, 0.6%, and 0.5% of total revenue for 2006, 2007, and 2008 respec-tively. There was a 12.1% decrease from 2007 to 2008 because of a decrease in sales price for the DVDs sold (Netflix 10-K, 2008, p. 34). In 2007, there was also a $7,000,000 gain from a legal settlement with Blockbuster over a pend-
Netflix, Inc.: A Financial Analysis
13
ing patent (Netflix 10-K, 2008, p. 35). This gain represented 0.6% of total rev-enue for 2007. Netflix receives income in the form of interest and dividends for investments; however this amount represents less than 2% of total revenues for 2006, 2007, and 2008. Netflix pays interest on its leased assets, but this amount is less than 1% of total revenues for 2006, 2007, and 2008.
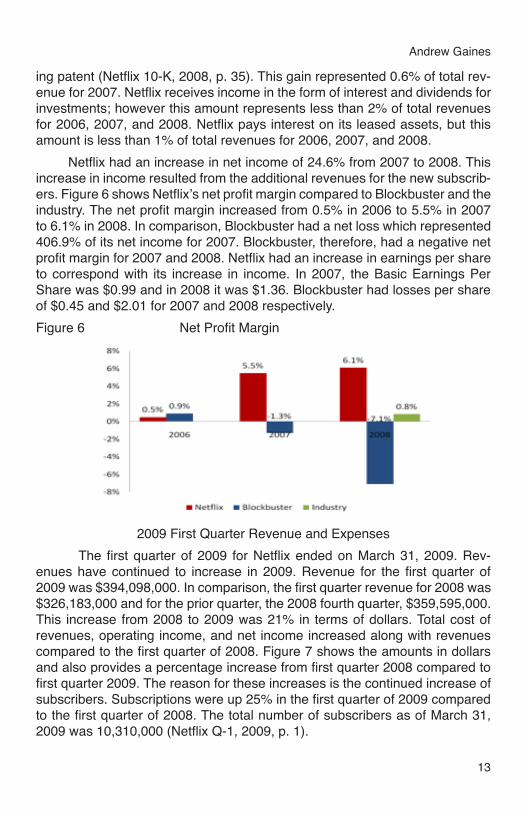
Netflix had an increase in net income of 24.6% from 2007 to 2008. This increase in income resulted from the additional revenues for the new subscrib-ers. Figure 6 shows Netflix!s net profit margin compared to Blockbuster and the industry. The net profit margin increased from 0.5% in 2006 to 5.5% in 2007 to 6.1% in 2008. In comparison, Blockbuster had a net loss which represented 406.9% of its net income for 2007. Blockbuster, therefore, had a negative net profit margin for 2007 and 2008. Netflix had an increase in earnings per share to correspond with its increase in income. In 2007, the Basic Earnings Per Share was $0.99 and in 2008 it was $1.36. Blockbuster had losses per share of $0.45 and $2.01 for 2007 and 2008 respectively.
Figure 6 Net Profit Margin
2009 First Quarter Revenue and Expenses
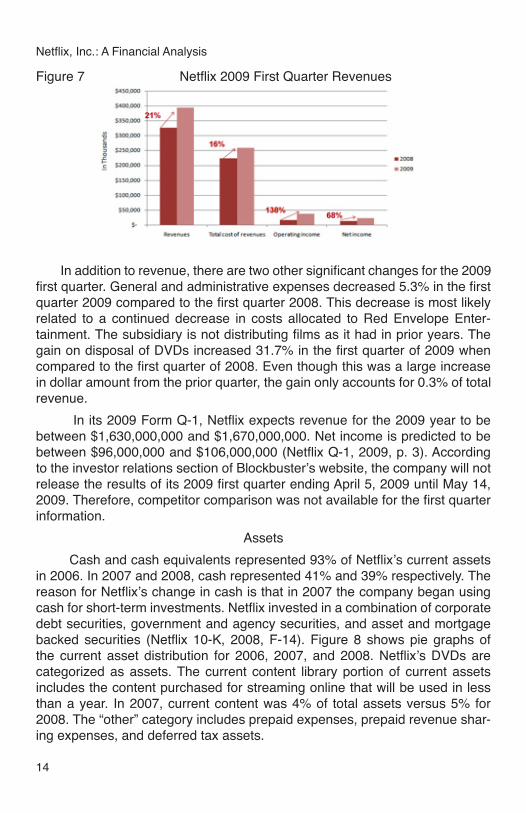
The first quarter of 2009 for Netflix ended on March 31, 2009. Rev-enues have continued to increase in 2009. Revenue for the first quarter of 2009 was $394,098,000. In comparison, the first quarter revenue for 2008 was $326,183,000 and for the prior quarter, the 2008 fourth quarter, $359,595,000. This increase from 2008 to 2009 was 21% in terms of dollars. Total cost of revenues, operating income, and net income increased along with revenues compared to the first quarter of 2008. Figure 7 shows the amounts in dollars and also provides a percentage increase from first quarter 2008 compared to first quarter 2009. The reason for these increases is the continued increase of subscribers. Subscriptions were up 25% in the first quarter of 2009 compared to the first quarter of 2008. The total number of subscribers as of March 31, 2009 was 10,310,000 (Netflix Q-1, 2009, p. 1).
Andrew Gaines
14
Figure 7 Netflix 2009 First Quarter Revenues
In addition to revenue, there are two other significant changes for the 2009 first quarter. General and administrative expenses decreased 5.3% in the first quarter 2009 compared to the first quarter 2008. This decrease is most likely related to a continued decrease in costs allocated to Red Envelope Enter-tainment. The subsidiary is not distributing films as it had in prior years. The gain on disposal of DVDs increased 31.7% in the first quarter of 2009 when compared to the first quarter of 2008. Even though this was a large increase in dollar amount from the prior quarter, the gain only accounts for 0.3% of total revenue.
In its 2009 Form Q-1, Netflix expects revenue for the 2009 year to be between $1,630,000,000 and $1,670,000,000. Net income is predicted to be between $96,000,000 and $106,000,000 (Netflix Q-1, 2009, p. 3). According to the investor relations section of Blockbuster!s website, the company will not release the results of its 2009 first quarter ending April 5, 2009 until May 14, 2009. Therefore, competitor comparison was not available for the first quarter information.
Assets
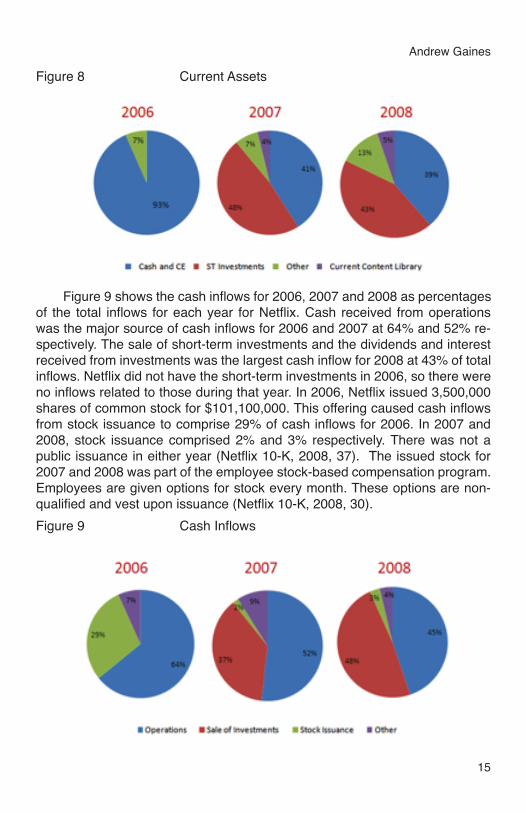
Cash and cash equivalents represented 93% of Netflix!s current assets in 2006. In 2007 and 2008, cash represented 41% and 39% respectively. The reason for Netflix!s change in cash is that in 2007 the company began using cash for short-term investments. Netflix invested in a combination of corporate debt securities, government and agency securities, and asset and mortgage backed securities (Netflix 10-K, 2008, F-14). Figure 8 shows pie graphs of the current asset distribution for 2006, 2007, and 2008. Netflix!s DVDs are categorized as assets. The current content library portion of current assets includes the content purchased for streaming online that will be used in less than a year. In 2007, current content was 4% of total assets versus 5% for 2008. The “other” category includes prepaid expenses, prepaid revenue shar-ing expenses, and deferred tax assets.
Netflix, Inc.: A Financial Analysis
15
Figure 8 Current Assets
Figure 9 shows the cash inflows for 2006, 2007 and 2008 as percentages of the total inflows for each year for Netflix. Cash received from operations was the major source of cash inflows for 2006 and 2007 at 64% and 52% re-spectively. The sale of short-term investments and the dividends and interest received from investments was the largest cash inflow for 2008 at 43% of total inflows. Netflix did not have the short-term investments in 2006, so there were no inflows related to those during that year. In 2006, Netflix issued 3,500,000 shares of common stock for $101,100,000. This offering caused cash inflows from stock issuance to comprise 29% of cash inflows for 2006. In 2007 and 2008, stock issuance comprised 2% and 3% respectively. There was not a public issuance in either year (Netflix 10-K, 2008, 37). The issued stock for 2007 and 2008 was part of the employee stock-based compensation program. Employees are given options for stock every month. These options are non-qualified and vest upon issuance (Netflix 10-K, 2008, 30).
Figure 9 Cash Inflows
Andrew Gaines
16
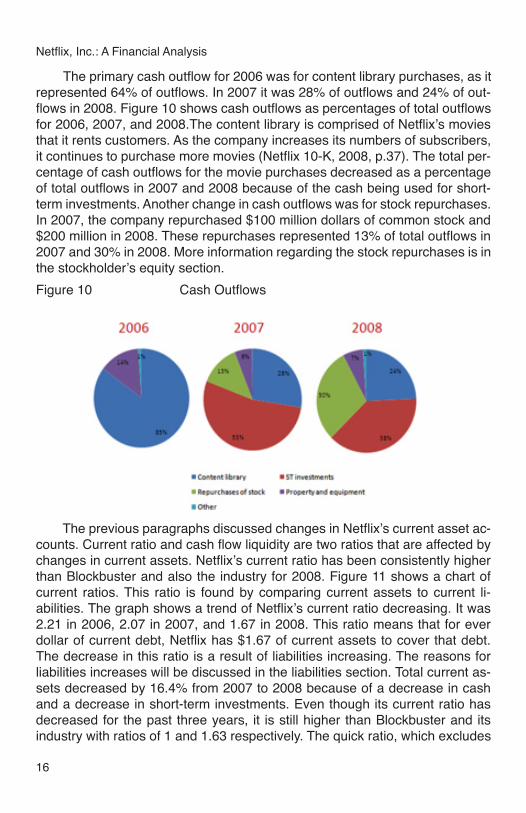
The primary cash outflow for 2006 was for content library purchases, as it represented 64% of outflows. In 2007 it was 28% of outflows and 24% of out-flows in 2008. Figure 10 shows cash outflows as percentages of total outflows for 2006, 2007, and 2008.The content library is comprised of Netflix!s movies that it rents customers. As the company increases its numbers of subscribers, it continues to purchase more movies (Netflix 10-K, 2008, p.37). The total per-centage of cash outflows for the movie purchases decreased as a percentage of total outflows in 2007 and 2008 because of the cash being used for short-term investments. Another change in cash outflows was for stock repurchases. In 2007, the company repurchased $100 million dollars of common stock and $200 million in 2008. These repurchases represented 13% of total outflows in 2007 and 30% in 2008. More information regarding the stock repurchases is in the stockholder!s equity section.
Figure 10 Cash Outflows
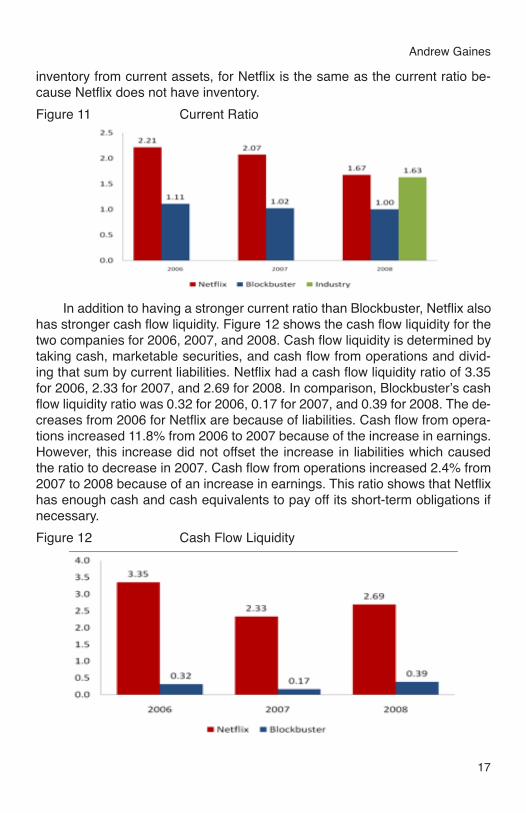
The previous paragraphs discussed changes in Netflix!s current asset ac-counts. Current ratio and cash flow liquidity are two ratios that are affected by changes in current assets. Netflix!s current ratio has been consistently higher than Blockbuster and also the industry for 2008. Figure 11 shows a chart of current ratios. This ratio is found by comparing current assets to current li-abilities. The graph shows a trend of Netflix!s current ratio decreasing. It was 2.21 in 2006, 2.07 in 2007, and 1.67 in 2008. This ratio means that for ever dollar of current debt, Netflix has $1.67 of current assets to cover that debt. The decrease in this ratio is a result of liabilities increasing. The reasons for liabilities increases will be discussed in the liabilities section. Total current as-sets decreased by 16.4% from 2007 to 2008 because of a decrease in cash and a decrease in short-term investments. Even though its current ratio has decreased for the past three years, it is still higher than Blockbuster and its industry with ratios of 1 and 1.63 respectively. The quick ratio, which excludes
Netflix, Inc.: A Financial Analysis
17
inventory from current assets, for Netflix is the same as the current ratio be-cause Netflix does not have inventory.
Figure 11 Current Ratio
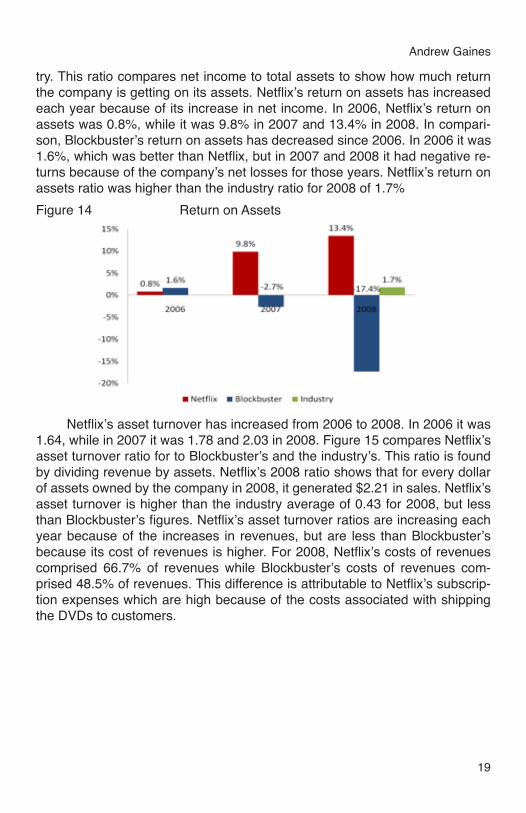
In addition to having a stronger current ratio than Blockbuster, Netflix also has stronger cash flow liquidity. Figure 12 shows the cash flow liquidity for the two companies for 2006, 2007, and 2008. Cash flow liquidity is determined by taking cash, marketable securities, and cash flow from operations and divid-ing that sum by current liabilities. Netflix had a cash flow liquidity ratio of 3.35 for 2006, 2.33 for 2007, and 2.69 for 2008. In comparison, Blockbuster!s cash flow liquidity ratio was 0.32 for 2006, 0.17 for 2007, and 0.39 for 2008. The de-creases from 2006 for Netflix are because of liabilities. Cash flow from opera-tions increased 11.8% from 2006 to 2007 because of the increase in earnings. However, this increase did not offset the increase in liabilities which caused the ratio to decrease in 2007. Cash flow from operations increased 2.4% from 2007 to 2008 because of an increase in earnings. This ratio shows that Netflix has enough cash and cash equivalents to pay off its short-term obligations if necessary.
Figure 12 Cash Flow Liquidity
Andrew Gaines

18
In addition to current assets, Netflix has four other asset sections on the balance sheet: content library, deferred tax assets, other assets and property and equipment. Netflix!s content library contains the DVDs and streaming con-tent it rents to its customers. From 2007 to 2008 there was a 12.1% decrease of movies in the content library. This decrease resulted from the sale of some of the content and the depreciation of the DVDs. The decrease in content library also decreased by $45.8 million dollars because of DVDs gained via revenue sharing agreements instead of purchase (Netflix 10-K, 2008, p. 37). Deferred tax assets and other assets increased from 2006 to 2007 and from 2007 to 2008, but they represent a small portion of total assets: 3.6% for de-ferred tax and 1.7% for other in 2008.
Property and equipment represented 9.1% of total assets in 2006, 16.7% in 2007, and 20.2% in 2008. The increase in property and equipment from 2007 to 2008 related to an increase in equipment purchases, but the increase from 2006 to 2007 was more significant. The company purchased most of the equipment for expansion at its headquarters! office in Los Gatos, California (Netflix 10-K, 2008, p. 37). The company leased a building next to the head-quarters! office in 2006 and the renovations of the building were completed in early 2008 (Netflix 10-K, 2008, p. 37). In 2007, Netflix also purchased automa-tion equipment for its distribution centers. The goal of this purchase was to increase efficiency (Netflix 10-K, 2008, p. 37)
Overall, total assets increased from 2006 to 2007 and decreased from 2007 to 2008. The trend graph in Figure 13 shows these changes. The in-crease from 2006 to 2007 is related to the purchase of short-term investments, equipment, and content for the content library. The decrease from 2007 to 2008 was a result of a 21.2% decrease in cash and a 24.2% decrease in short-term investments.
Figure 13 Total Assets Trend
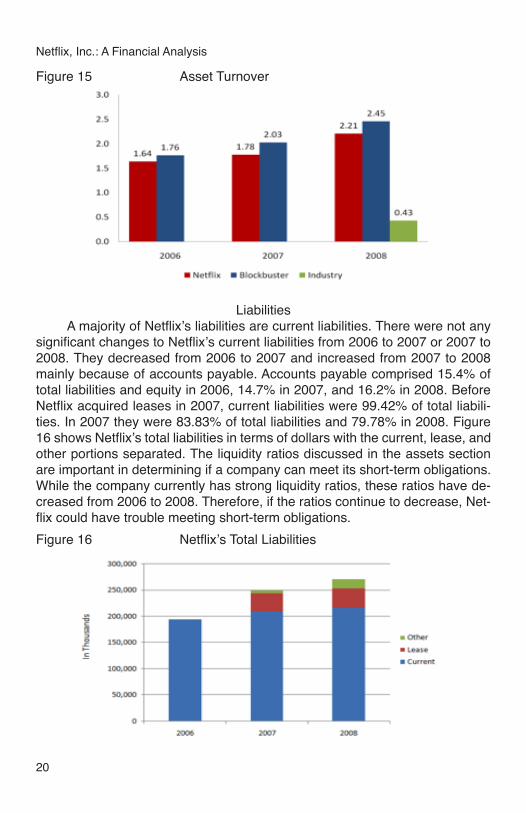
Figure 14 displays return on assets for Netflix, Blockbuster, and the indus-
Netflix, Inc.: A Financial Analysis
19
try. This ratio compares net income to total assets to show how much return the company is getting on its assets. Netflix!s return on assets has increased each year because of its increase in net income. In 2006, Netflix!s return on assets was 0.8%, while it was 9.8% in 2007 and 13.4% in 2008. In compari-son, Blockbuster!s return on assets has decreased since 2006. In 2006 it was 1.6%, which was better than Netflix, but in 2007 and 2008 it had negative re-turns because of the company!s net losses for those years. Netflix!s return on assets ratio was higher than the industry ratio for 2008 of 1.7%
Figure 14 Return on Assets
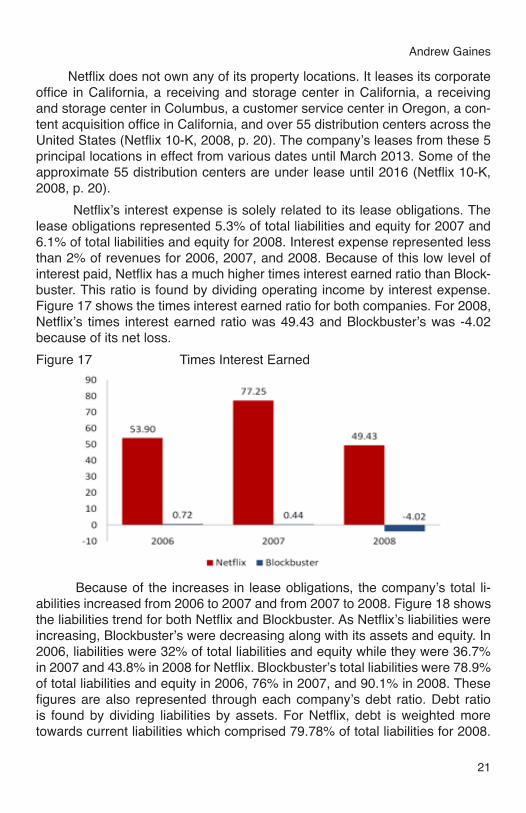
Netflix!s asset turnover has increased from 2006 to 2008. In 2006 it was 1.64, while in 2007 it was 1.78 and 2.03 in 2008. Figure 15 compares Netflix!s asset turnover ratio for to Blockbuster!s and the industry!s. This ratio is found by dividing revenue by assets. Netflix!s 2008 ratio shows that for every dollar of assets owned by the company in 2008, it generated $2.21 in sales. Netflix!s asset turnover is higher than the industry average of 0.43 for 2008, but less than Blockbuster!s figures. Netflix!s asset turnover ratios are increasing each year because of the increases in revenues, but are less than Blockbuster!s because its cost of revenues is higher. For 2008, Netflix!s costs of revenues comprised 66.7% of revenues while Blockbuster!s costs of revenues com-prised 48.5% of revenues. This difference is attributable to Netflix!s subscrip-tion expenses which are high because of the costs associated with shipping the DVDs to customers.
Andrew Gaines
20
Figure 15 Asset Turnover
Liabilities A majority of Netflix!s liabilities are current liabilities. There were not any significant changes to Netflix!s current liabilities from 2006 to 2007 or 2007 to 2008. They decreased from 2006 to 2007 and increased from 2007 to 2008 mainly because of accounts payable. Accounts payable comprised 15.4% of total liabilities and equity in 2006, 14.7% in 2007, and 16.2% in 2008. Before Netflix acquired leases in 2007, current liabilities were 99.42% of total liabili-ties. In 2007 they were 83.83% of total liabilities and 79.78% in 2008. Figure 16 shows Netflix!s total liabilities in terms of dollars with the current, lease, and other portions separated. The liquidity ratios discussed in the assets section are important in determining if a company can meet its short-term obligations. While the company currently has strong liquidity ratios, these ratios have de-creased from 2006 to 2008. Therefore, if the ratios continue to decrease, Net-flix could have trouble meeting short-term obligations.
Figure 16 Netflix!s Total Liabilities
Netflix, Inc.: A Financial Analysis
21
Netflix does not own any of its property locations. It leases its corporate office in California, a receiving and storage center in California, a receiving and storage center in Columbus, a customer service center in Oregon, a con-tent acquisition office in California, and over 55 distribution centers across the United States (Netflix 10-K, 2008, p. 20). The company!s leases from these 5 principal locations in effect from various dates until March 2013. Some of the approximate 55 distribution centers are under lease until 2016 (Netflix 10-K, 2008, p. 20).
Netflix!s interest expense is solely related to its lease obligations. The lease obligations represented 5.3% of total liabilities and equity for 2007 and 6.1% of total liabilities and equity for 2008. Interest expense represented less than 2% of revenues for 2006, 2007, and 2008. Because of this low level of interest paid, Netflix has a much higher times interest earned ratio than Block-buster. This ratio is found by dividing operating income by interest expense. Figure 17 shows the times interest earned ratio for both companies. For 2008, Netflix!s times interest earned ratio was 49.43 and Blockbuster!s was -4.02 because of its net loss.
Figure 17 Times Interest Earned
Because of the increases in lease obligations, the company!s total li-abilities increased from 2006 to 2007 and from 2007 to 2008. Figure 18 shows the liabilities trend for both Netflix and Blockbuster. As Netflix!s liabilities were increasing, Blockbuster!s were decreasing along with its assets and equity. In 2006, liabilities were 32% of total liabilities and equity while they were 36.7% in 2007 and 43.8% in 2008 for Netflix. Blockbuster!s total liabilities were 78.9% of total liabilities and equity in 2006, 76% in 2007, and 90.1% in 2008. These figures are also represented through each company!s debt ratio. Debt ratio is found by dividing liabilities by assets. For Netflix, debt is weighted more towards current liabilities which comprised 79.78% of total liabilities for 2008.
Andrew Gaines

22
Figure 19 shows the debt ratios for Netflix and Blockbuster.
Figure 18 Liabilities Trend
Figure 19 Debt Ratio
Stockholders! Equity
Netflix!s common stock comprised $ 69,000,000 of equity in 2006. This reflected a $101,100,000 sale of common stock in a public offering in 2006. There were not public offerings in 2007 and 2008, but stock was issued through employee purchase plans. Common stock has remained at a constant 0.01% of liabilities and equity because most of the proceeds from the stock sale go to additional paid in capital because the par value of the stock is $0.001 per share.
The reason stockholder!s equity increased from 2006 to 2007 is that in 2007, Netflix repurchased $100,000,000 of its own common stock and then retired it. The reason stockholder!s equity decreased from 2007 to 2008 is that it acquired $100,000,000 in treasury stock in January and then an additional
Netflix, Inc.: A Financial Analysis
23
$100,000,000 in March (Netflix 10-K, 2008, p. 24). The Board of Directors has allowed for a continuation of the stock repurchase plan for 2009. Netflix can purchase up to $175 million of its common stock next year (Netflix 10-K, 2008, p.36).
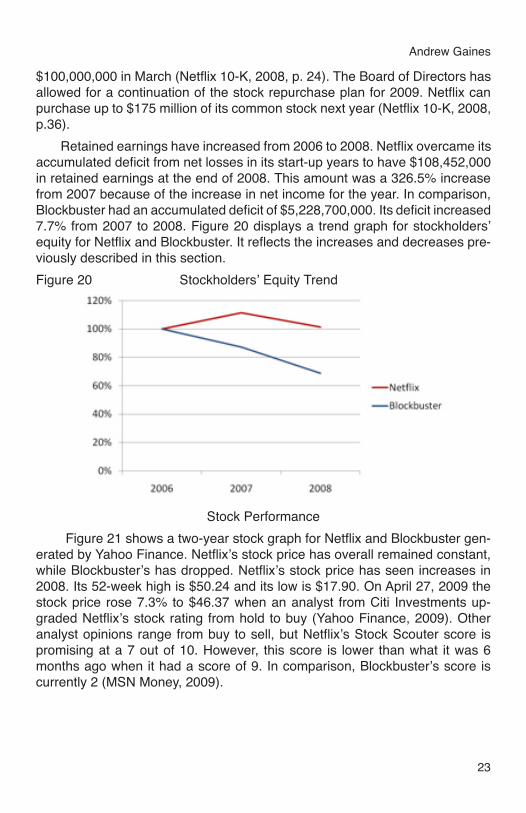
Retained earnings have increased from 2006 to 2008. Netflix overcame its accumulated deficit from net losses in its start-up years to have $108,452,000 in retained earnings at the end of 2008. This amount was a 326.5% increase from 2007 because of the increase in net income for the year. In comparison, Blockbuster had an accumulated deficit of $5,228,700,000. Its deficit increased 7.7% from 2007 to 2008. Figure 20 displays a trend graph for stockholders! equity for Netflix and Blockbuster. It reflects the increases and decreases pre-viously described in this section.
Figure 20 Stockholders! Equity Trend
Stock Performance
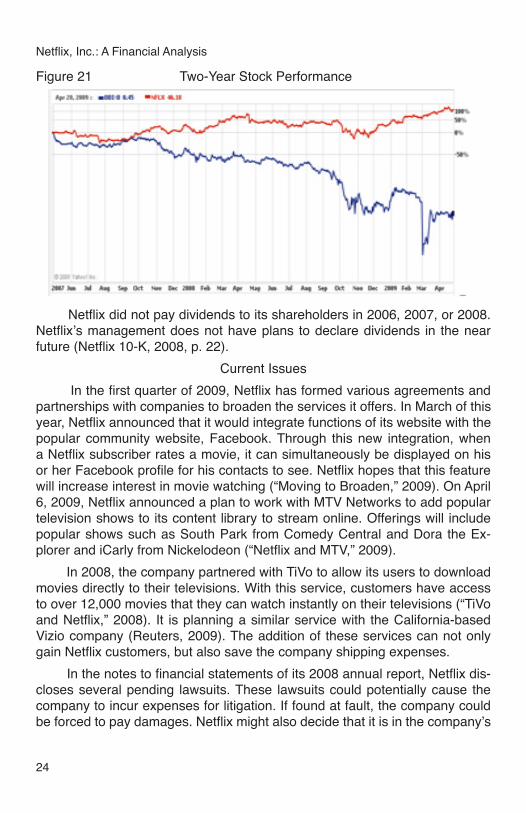
Figure 21 shows a two-year stock graph for Netflix and Blockbuster gen-erated by Yahoo Finance. Netflix!s stock price has overall remained constant, while Blockbuster!s has dropped. Netflix!s stock price has seen increases in 2008. Its 52-week high is $50.24 and its low is $17.90. On April 27, 2009 the stock price rose 7.3% to $46.37 when an analyst from Citi Investments up-graded Netflix!s stock rating from hold to buy (Yahoo Finance, 2009). Other analyst opinions range from buy to sell, but Netflix!s Stock Scouter score is promising at a 7 out of 10. However, this score is lower than what it was 6 months ago when it had a score of 9. In comparison, Blockbuster!s score is currently 2 (MSN Money, 2009).
Andrew Gaines
24
Figure 21 Two-Year Stock Performance
Netflix did not pay dividends to its shareholders in 2006, 2007, or 2008. Netflix!s management does not have plans to declare dividends in the near future (Netflix 10-K, 2008, p. 22).
Current Issues
In the first quarter of 2009, Netflix has formed various agreements and partnerships with companies to broaden the services it offers. In March of this year, Netflix announced that it would integrate functions of its website with the popular community website, Facebook. Through this new integration, when a Netflix subscriber rates a movie, it can simultaneously be displayed on his or her Facebook profile for his contacts to see. Netflix hopes that this feature will increase interest in movie watching (“Moving to Broaden,” 2009). On April 6, 2009, Netflix announced a plan to work with MTV Networks to add popular television shows to its content library to stream online. Offerings will include popular shows such as South Park from Comedy Central and Dora the Ex-plorer and iCarly from Nickelodeon (“Netflix and MTV,” 2009).
In 2008, the company partnered with TiVo to allow its users to download movies directly to their televisions. With this service, customers have access to over 12,000 movies that they can watch instantly on their televisions (“TiVo and Netflix,” 2008). It is planning a similar service with the California-based Vizio company (Reuters, 2009). The addition of these services can not only gain Netflix customers, but also save the company shipping expenses.
In the notes to financial statements of its 2008 annual report, Netflix dis-closes several pending lawsuits. These lawsuits could potentially cause the company to incur expenses for litigation. If found at fault, the company could be forced to pay damages. Netflix might also decide that it is in the company!s
Netflix, Inc.: A Financial Analysis
25
best interest to pay a settlement. An example of one of these cases is a anti-trust suit filed jointly against Netflix and Wal-Mart (Netflix 10-K, 2008, F-19).
Conclusion
Netflix has several key financial strengths. The company has gener-ated strong increases in revenue and net income. Between 2007 and 2008, the company had an increase of net income of 24.6%. Revenues and net in-come have continued to increase in the first quarter of 2009. With its continued increasing revenues and net income, Netflix has boasted strong profitability ratios in 2007 and 2008. The company has lease obligations for its proper-ties, but there are no long-term debt notes that are the responsibility of the company. Netflix!s stock price is strong and has increased in 2009. Analyst!s ratings of the stock vary from buy to sell, but it has a Stock Scouter score of 7 out of a possible 10.
The company has three main weaknesses. First, it does not pay dividends to its shareholders which could be a deterrent for potential investors. Second, its equity has decreased from 2007 to 2008. The decrease is attributable to the treasury stock increases. Lastly, Netflix!s liquidity ratios have been decreasing over the period of 2006 to 2008. The ratios remain higher than Blockbuster and the industry; however there is a potential problem. For example, its cur-rent ratio is still strong at 1.67, but it decreased from 2.21 in 2006 and 2.07 in 2008. The company could face liquidity issues if the decreases continue at the same rate.
Netflix has the opportunity to continue partnering with electronics compa-nies and service providers such as TiVo. By offering its services through new technology, the company can continue to increase its revenue by reaching subscribers who use these products and services. Netflix can also use the current position of the economy to its advantage. With more people not able/wanting to spend money on unnecessary items, entertainment is one area that could be cut from budgets. While people may not want to pay high prices to see movies at theaters or go to other events like plays or concerts, they may want to rent movies to watch in their homes. By using a subscription to Netflix, customers have a set amount they are spending each month.
The company faces the threat that its pending law suits could potentially cost them high legal fees and settlement amounts. Also, one of the company!s major costs is postage, so if the U.S. postal service decides to increase rates, then Netflix!s costs will automatically increase. Netflix also faces the threat that new movie viewing equipment will be introduced. Quickly after the advent of the DVD player, VHS tapes became obsolete. If this happens with DVDs, the company will have to not only have obsolete assets, but it will also have to acquire the movies in the new format. Netflix could also be adversely affected
Andrew Gaines
26
if movie distributors decide to give other companies exclusive rental rights for certain movies.
References
Blockbuster, Inc. Form 10-K – 2007, 2008
Blockbuster expands Netflix-like service. (2004, May 26). CNN Money. Re- trieved April 24, 2009 from http://money.cnn.com
Kopytoff, V. (2004, March 8). Successful Netflix faces competition. San Fran- cisco Chronicle. Retrieved April 27, 2009 from http://www.sfgate.com
Moving to broaden accessibility, Netflix integrates with Facebook Connect. (2009, March 24). Reuters. Retrieved April 22, 2009 from http://www. reuters.com
Netflix, Inc. Form 10-K – 2006, 2007, 2008
Netflix, Inc. Form Q-1 2009
Netflix and MTV network announce deals. (2009, April 6). Reuters. Retrieved April 22, 2009 From http://www.reuters.com
TiVo and Netflix announce partnership. (2008, Oct. 30). SmartBrief. Re- trieved April 24, 2009 From http://www.smartbrief.com
Willmore, A. (2009, July 23). Red Envelope is sealed. Independent Film Channel. Retrieved April 24, 2009 from http://www.ifc.com
Additional Financial Data from:
http://www.blockbuster.com
http://finance.yahoo.com
http://www.hoovers.com
http://moneycentral.msn.com
http://www.netflix.com
http://www.reuters.com
Netflix, Inc.: A Financial Analysis