Accounting conservatism and the cost of capital ...phd.london.edu/xli.phd2005/working papers/Li 2010...
52
Accounting conservatism and the cost of capital: international analysis * Xi Li † London Business School January 6, 2010 Abstract This study examines the contracting benefits of accounting conservatism on inter- national debt and equity markets. Results show that firms domiciled in countries with more conservative financial reporting systems have significantly lower cost of debt and equity capital, after controlling for differences in legal institutions and securities reg- ulations. I use one-year-ahead interest rate to measure the expected cost of debt and use the discount rates extracted from several accounting-based valuation models to estimate the expected cost of equity. Accounting conservatism is proxied by country- level timely loss recognition estimated from modified Basu (1997) model. I conduct a battery of robustness analyses, including adopting different measures for the cost of capital and conservatism and using different sample compositions, and get similar results. Findings in this paper contribute to the literature by highlighting the role of accounting information in assisting a country’s legal system to determine the perfor- mance of its capital markets. Keywords: Cost of debt, Cost of equity, Conservatism, Timely loss recognition JEL classification: M41, M40, F00, G32, G38 * I am grateful to my supervisor Lakshmanan Shivakumar for his guidance and suggestions. I also ap- preciate comments from Eli Amir, Dennis Oswald, Ane Tamayo, Paolo Volpin and Florin Vasvari, and participants at the 7th Transatlantic Doctoral Conference at London Business School, the 2007 European Doctoral Research Conference, the 2009 European Accounting Association Annual Congress, and the 2009 American Accounting Association Annual Meeting. † Tel.: +44 (0)20 7000 8140; Email: [email protected] 1
Transcript of Accounting conservatism and the cost of capital ...phd.london.edu/xli.phd2005/working papers/Li 2010...

Accounting conservatism and the cost of capital:international analysis∗
Xi Li†
London Business School
January 6, 2010
Abstract
This study examines the contracting benefits of accounting conservatism on inter-national debt and equity markets. Results show that firms domiciled in countries withmore conservative financial reporting systems have significantly lower cost of debt andequity capital, after controlling for differences in legal institutions and securities reg-ulations. I use one-year-ahead interest rate to measure the expected cost of debt anduse the discount rates extracted from several accounting-based valuation models toestimate the expected cost of equity. Accounting conservatism is proxied by country-level timely loss recognition estimated from modified Basu (1997) model. I conducta battery of robustness analyses, including adopting different measures for the costof capital and conservatism and using different sample compositions, and get similarresults. Findings in this paper contribute to the literature by highlighting the role ofaccounting information in assisting a country’s legal system to determine the perfor-mance of its capital markets.
Keywords: Cost of debt, Cost of equity, Conservatism, Timely loss recognitionJEL classification: M41, M40, F00, G32, G38
∗I am grateful to my supervisor Lakshmanan Shivakumar for his guidance and suggestions. I also ap-preciate comments from Eli Amir, Dennis Oswald, Ane Tamayo, Paolo Volpin and Florin Vasvari, andparticipants at the 7th Transatlantic Doctoral Conference at London Business School, the 2007 EuropeanDoctoral Research Conference, the 2009 European Accounting Association Annual Congress, and the 2009American Accounting Association Annual Meeting.†Tel.: +44 (0)20 7000 8140; Email: [email protected]
1

1 Introduction
Although conservatism is an important attribute to accounting exhibited by firms all around
the world, capital market regulators, standard setters and academics have consistently op-
posed it. The following paragraph appears in the FASB and IASB board meeting handouts
of July 2005:
“What is the role of conservatism? Does it conflict with neutrality? If not, why not?
Why keep it? [May 2005]
“Financial information needs to be neutral – free from bias intended to influence a de-
cision or outcome. To that end, the common conceptual framework should not include
conservatism or prudence among the desirable qualitative characteristics of accounting in-
formation. However, the framework should note the continuing need to be careful in the face
of uncertainty.”
Recent empirical research on conservatism suggests not only that actual accounting prac-
tice is conservative, but also that practice has become more conservative in the last 30 years
(Watts (2003)). It is puzzling why the notion of conservatism becomes deeply ingrained
in financial statements despite the efforts of standard setters over the decades to change
it (SFAC No. 2, 1980). Enormous research effort has been made to answer this question
by identifying ex ante motivations for conservative accounting. For example, Watts (2003)
argues that contracting benefits, asymmetric shareholder litigation costs, taxation benefits,
and political pressures for standard setters and regulators are four explanations for the exis-
tence of conservatism. Ball, Kothari, and Robin (2000) and Bushman and Piotroski (2006)
find that legal origins and institutional structures, such as the effectiveness of judicial sys-
tems, the enforcement of securities laws, and the size of political economy, create incentives
to shape the properties of reported accounting numbers. However, little research has been
done on the capital market consequences of conservative accounting. In this paper, I focus
on the contracting benefits of conservatism and explore its influence on both debt and equity
capital markets around the world.
The motivations for using an international setting are as follows. First, the majority of
the variation in accounting practice is likely to be across countries rather than within a coun-
2

try or across time, as firms within a country follow the same set of accounting standards and
face the same level of legal enforcement, which are likely to be static across time. Therefore,
the cross-country study provides a powerful setting to investigate the impacts of financial
reporting systems on capital markets. Second, recent studies in corporate finance litera-
ture has highlighted the importance of legal systems for the performance of capital markets
(La Porta, Lopez-de Silanes, Shleifer, and Vishny (1997); Lombardo and Pagano (2002); Hail
and Leuz (2006)). Their findings suggest that the performance of a country’s capital market
is determined by the country’s corporate governance legal standards, the effectiveness of
courts in enforcing such rules, and the ability of stakeholders (shareholders and debtholders)
to verify if their rights have been violated. The effectiveness of a country’s judicial system
in turn depends on the transparency of the corporate accounts and the quality and time-
liness of the information that firms disseminate (Lombardo and Pagano (2000)). Using an
international setting enables me to assess the complementary role of a country’s accounting
system in assisting its corporate governance mechanisms to shape the performance of its
capital markets, an important feature of which is the cost to obtain external capital.1 Third,
while there is much debate on the firm-level measures for conditional conservatism, general
consensus has been achieved on the country-level measures of conservatism as a proxy for
a country’s financial reporting quality (Ball, Kothari, and Robin (2000); Ball, Robin, and
Wu (2003); Bushman and Piotroski (2006); Ball, Robin, and Sadka (2008)).2 Therefore,
examining the contracting benefits in an international context could mitigate measurement
error problems existing in the firm-level analysis.
Existing literature classifies conservatism into two categories based on whether the asym-
metric verifiability requirement for the recognition of gains and losses is conditional on news.
Basu (1997) defines conditional conservatism as the tendency of accountants to require a
higher degree of verification for recognizing good news than bad news in financial state-
ments (i.e. earnings reflect bad news more quickly than good news). Ball and Shivakumar
1The idea that accounting conservatism facilitates corporate governance mechanisms in monitoring man-agers has been supported by empirical studies based on a sample of firms in the United States. For example,Ahmed and Duellman (2007) find evidence consistent with the notion that accounting conservatism assistsdirectors in reducing deadweight losses arising from agency conflicts.
2For example, Givoly, Hayn, and Natarajan (2007) find that the firm-level measures for conservatism basedon Basu (1997) model are too noisy. This potential explains why Francis, LaFond, Olsson, and Schipper(2004) fail to document any significant association between the cost of equity capital and conservatism basedon a sample of firms in the United States.
3

(2005) define unconditional conservatism as the bias toward reporting low book value of eq-
uity. Basu (1997) and Ball and Shivakumar (2005) argue that the downward bias on reported
net worth could be easily contracted around, so unconditional conservatism is inefficient or
at best neutral in contracting. In this study, to investigate the contracting benefits of a con-
servative financial reporting system, I only focus on the conditional form of conservatism. In
the remaining parts of this paper, the terminology accounting conservatism or conservatism
refers to the conditional form of conservatism, or the asymmetric recognition of economic
gains and losses into earnings.
I construct a country-level measure for accounting conservatism based on the pooled
regression of Basu (1997) model within each country. This measure captures the actual ac-
counting practice of average firms within each country and reflects the distributional prop-
erties of reported accounting numbers that suggest different degrees of conservatism across
countries. To examine the effect of conservatism on capital markets across countries, I fur-
ther construct country-level measures of the expected cost of debt and equity capital. The
expected cost of debt is measured as one-year-ahead interest rates averaged across all firms
within each country and the expected cost of equity is the discount rates extracted from
accounting-based valuation models averaged across all firms within each country. After con-
trolling for other determinants of the cost of capital, I find that the conservatism level in
a country’s accounting system is negatively associated with both cost of debt and cost of
equity capital. One standard deviation increase of the measure for timely loss recognition
reduces the nominal cost of debt by 86 basis points and reduces the nominal cost of equity
by 74 basis points. I also conduct extensive analyses to address the concerns about the con-
servatism and the cost of capital measures, the issues associated with potentially correlated
omitted variables and the potential biases introduced by sample selection. Nevertheless, the
results are quite robust across various measures and specifications.
This paper contributes to a strand of research examining the influence of accounting
information on international capital markets. Bhattacharya, Daouk, and Welker (2003) doc-
ument that an increase of a country’s overall earnings opacity significantly increases its cost
of equity and decreases the trading in the stock market. This paper complements their find-
ings by examining another important earnings attribute – conservatism, and its influence
on both debt and equity capital markets. Hail and Leuz (2006) document that firms in
4

countries with more extensive disclosure requirements, stronger securities regulations, and
more effective legal systems have a significantly lower cost of equity capital. Although pro-
found, their conclusions are limited to the role of accounting standards in general. As Ball,
Kothari, and Robin (2000) argue, focusing on the actual reported accounting numbers in-
stead of accounting standards has several advantages. First, much accounting practice is
not determined by accounting standards, because practice is more detailed than standards,
standards lag innovations in practice, and companies do not invariably implement standards.
Second, the extent to which accounting practice is determined for formal standards varies
internationally, and the incentive to follow accounting standards depends on penalties un-
der different enforcement institutions. Therefore, studying accounting standards per se is
incomplete and potentially misleading in an international context. Third, securities laws
and disclosure regulations, reflecting regulators’ willingness or political forces, capture only
the mandated reporting quality, while reported earnings numbers, also reflecting managers’
or shareholders’ incentives, are more relevant in the context of corporate governance and
contracting.
This paper also contributes to studies examining the contracting benefits of conservatism
on capital markets. So far, research in this area is limited to the syndicated loan market in the
United States (e.g., Zhang (2008); Wittenberg-Moerman (2008)) and little is known about
the public debt market or equity market. Having access to private information, banks are able
to customize debt contracts to partially fulfill their demands for unbiased accounting numbers
and are less dependant on conservative accounting (Beatty, Weber, and Yu (2008)). On the
other hand, public debt contracts are generally uniformly designed and based on accounting
numbers prepared under GAAP. Therefore, public debtholders are likely to rely more on
conservative accounting to monitor the borrowers, which makes public debt a more powerful
setting to test the benefits of conservatism. By examining the influence of conservatism on
the cost of debt in general and the cost of equity, this paper completes the understanding
for the contracting benefits of conservatism in the literature.
The rest of this paper is organized as follows. I discuss the hypothesis development in
Section 2. Section 3 describes the sample, data, and research design. Section 4 presents the
empirical results, Section 5 presents robustness analyses and Section 6 concludes. Definitions
of variables and data sources are listed in Appendix B.
5

2 Hypothesis Development
2.1 Economic Framework of Conservatism and Contracting
Two major agency problems exist in public firms: the one between shareholders and man-
agers and the one between shareholders and debtholders. Shareholders delegate the firm’s
operating decisions to managers and incentivize them through compensation contracts based
on a series of performance measures. As performance reports are also produced by managers,
they are likely to embellish the reports in favor of themselves. Therefore, shareholders in-
cur agency costs resulting from information asymmetry and imperfection of compensation
contracts. Kothari, Ramanna, and Skinner (2009) argue that accounting conservatism miti-
gates the agency problem between shareholders and managers from three aspects. First, as
managers are compensated according to current performance, they are likely to be reluctant
to volunteer bad news. Timely loss recognition introduces a contractual obligation through
accounting standards for managers to disclose bad news. Second, withholding bad news
may further induce managers to undertake overly risky investments in the hope of riding
pool performance. Timely loss recognition sends timely signals to shareholders, who could
take actions to curb management’s potential value-destroying decisions either by exercis-
ing greater oversight or by replacing the existing management. Third, because recouping
excessive compensation ex post is extremely costly for the shareholders, managers could
compensate themselves excessively by delaying bad news. Timely loss recognition restricts
managers’ ability to delay bad news and prevents them from receiving overpayments.
Similar to the shareholder-manager conflicts, agency problem also exists between debthold-
ers and shareholders. Debtholders lend capital to shareholders, but shareholders and man-
agers have the full control of the firm’s daily operations as long as the contractual terms
of the debt are being honored. Shareholders’ claims to the firm can be regarded as holding
a call option over the firm’s assets with an exercise price equal to the face value of debt.
Debtholders’ claims are akin to those of a writer of a put option, i.e. their upside is capped
at the principal and interest payments of debt. Due to the conflicts of interests, debtholders
incur agency costs resulting from information asymmetry and imperfection of debt contracts.
Accounting conservatism mitigates the agency problem between shareholders and debthold-
ers in the following way: shareholders have the incentive to transfer wealth to themselves
6

through investing in overly risky assets or overpaying dividends when the call option is close
to the money. Timely loss recognition sends timely signal to debtholders, who could take
actions to restrict shareholders’ self-serving behavior either by taking over the control or by
exercising greater oversight.
To sum up, both shareholders and debtholders demand for the timely recognition of bad
news in financial reporting. However, timely gain recognition is less desirable in contract-
ing. Kothari, Ramanna, and Skinner (2009) argue that recognizing good news timely could
create moral hazard problem between managers and shareholders. For example, if revenues
are recognized before the actual sales happen and managers are compensated accordingly,
managers will not have any ongoing incentive to exert full effort to convert the good news
into real cash flows. Due to the asymmetric payoff function of debt, debtholders have less
incentive to require managers to recognize good news, especially when the firm value is way
above the face value of the debt. Even if self-interested managers voluntarily disclose good
news, such behavior is unlikely to be rewarded in contracting.
One potential argument regarding the contracting benefits of conservatism is that firms
could write contracts in a way to account for the expected bias in financial reporting (Guay
and Verrecchia (2006)). Beatty, Weber, and Yu (2008) address this issue by examining the
adjustments in debt covenants and find that firm-specific modification of debt contracts
do not entirely replace lenders’ demand for conditional conservatism in financial reporting.
Guay (2008) comments that this finding suggests a comparative advantage of conditional
conservatism in satisfying lenders’ demand for timely information about bad news from
managers.
In the following two subsections I discuss in detail how the contracting benefits of con-
servative financial reporting help reduce firms’ cost of debt and equity capital.
2.2 Cost of Debt and Conservatism
Since conditional conservatism sends timely signal to debtholders and mitigates the potental
risk of wealth transfer, debtholders often demand conditional conservatism as a precondi-
tion to lending (Kothari, Ramanna, and Skinner (2009)). As debtholders can price protect
themselves ex ante, ceteris paribus conservative borrowers are likely to obtain outside debt
7
at a lower cost.
Financial reporting system evolves over time to meet the needs of various market partic-
ipants and contracting parties (Guay (2008)). For example, Bushman and Piotroski (2006)
show that accounting conservatism is shaped by the institutional structures of the country,
such as the legal systems, securities laws, political economy and tax regime. The degree of
conservatism in a country’s accounting system, which is not necessarily reflected in the coun-
try’s accounting standards, could be regarded as an ex ante commitment for conservative
financial reporting by firms domiciled in the country. By committing to reporting conser-
vatively as a general accounting practice, borrowers in such country would be rewarded by
paying a lower price for their borrowing. Therefore, I have the following hypothesis:
H1: Firms domiciled in countries with more conservative financial reporting
systems have lower cost of debt.
2.3 Cost of Equity and Conservatism
Accounting conservatism also mitigates the agency problem between managers and share-
holders. However, the way in which better contracting efficiency is translated into lower cost
of equity is less straightforward, because shareholders are the residual claimants of the firm’s
assets and any expected cash flow effect has already been reflected in current stock price,
leaving the expected rate of return unchanged.
Theoretical works relate the quality of accounting information to firm’s cost of equity in
two ways. First, they find that higher quality accounting information reduces the systematic
risk of the market, thereby reducing all firms’ cost of equity capital in the economy. For
example, Hughes, Liu, and Liu (2007) show that information asymmetry about systematic
factors affects factor risk premiums. Therefore, low information asymmetry leads to low
market cost of capital. Similarly, Lambert, Leuz, and Verrecchia (2007) show that better
accounting information directly affects a firm’s assessed covariances with other firms’ cash
flows, thereby reducing the former’s cost of capital. As better disclosure by each firm gen-
erates an externality on other firms’ cost of capital, this effect is not diversifiable and does
not disappear in large economies.
Second, existing theoretical studies also find that higher quality accounting information
8

directly reduces individual firm’s cost of equity capital. Easley and O’Hara (2004) show that
investors demand a higher return to hold stocks with greater private (and correspondingly
less public) information. Since informed investors are better able to shift their portfolio
weights to incorporate new information, uninformed investors who hold stocks with greater
private information bear higher risk and require compensation for this risk. In other words,
information asymmetry increases the cost of equity capital. However, Hughes, Liu, and Liu
(2007) argue that such idiosyncratic risk can be diversified away in large economies. By
assuming that firms have correlated cash flows, Lambert, Leuz, and Verrecchia (2007) show
that better information reduces the amount of cash flows that managers appropriate for
themselves, thereby shifting the ratio of the expected future cash flow to the covariance of
the firm’s cash flow with the sum of all cash flows in the market, which determines the cost
of equity capital.3
Based on the theoretical arguments above, accounting conservatism could reduce firms’
cost of equity through two channels. First, it reduces the deadweight loss in shareholder-
manager conflicts and thereby increases future cash flows available to shareholders (Watts
(2003); Kwon, Newman, and Suh (2001)). Such increase further shifts the ratio of the
expected future cash flow to the covariance of firm’s cash flow with other firms’ cash flows, and
thereby reduces the cost of equity. Second, as accounting conservatism reduces information
asymmetry between managers and shareholders (Ball, Kothari, and Robin (2000); LaFond
and Watts (2008)), shareholders require a lower cost of return from conservative firms and
such effect can not be diversified away in economies with finite numbers of securities.
Since conservative financial reporting system reflects the actual accounting practice of
all firms in the country, its influence on individual firm’s cost of capital is not diversifiable.
Therefore, conservative accounting further reduces the cost of equity capital of firms domi-
ciled in the country by reducing the systematic risk of the market. Therefore, I have the
following prediction in this paper:
3Lambert, Leuz, and Verrecchia (2007) find that the only situation in which accounting information systemhas no impact on the cost of capital is when the manager’s appropriation is exactly a fixed proportion ofthe end-of-period cash flow. As long as there is a component of appropriation that does not vary with therealization of the end-of-period cash flow (e.g., if it depends on the expected future cash flow instead of itsrealization), or the quality of information affects the “fixed” component of appropriation, there is a nonzeroimpact on the cost of capital.
9

H2: Firms domiciled in countries with more conservative financial reporting
systems have lower cost of equity.
3 Data and Research Design
3.1 Measures of Conservatism
Basu (1997) uses the following piecewise linear regression model of accounting income on
stock returns to measure accounting conservatism, or asymmetric timeliness of losses to gains:
NIi,t/Pi,t−1 = β0 + β1 ×DRi,t + β2 ×Ri,t + β3 ×DRi,t ×Ri,t + εi,t. (1)
NIi,t is firm i’s net income before extraordinary items at year t; Pi,t−1 is firm i’s market
value at the beginning of year t; Ri,t is the annual buy-and-hold return; DRi,t is a dummy
variable equal to 1 if Ri,t is negative, and 0 otherwise. Asymmetric timeliness of losses to
gains implies β3 > 0.
Roychowdhury and Watts (2007) argue that, if the above model is estimated across time
and by using single-period returns and earnings, the coefficient β3 reflects asymmetric time-
liness of earnings with respect to news arrival within that one period only. In other words,
which β3 is only an implication of asymmetric verification standards rather than a measure of
aggregate conservatism, which should reflect the cumulative effect of asymmetric timeliness
across all prior periods. Therefore Roychowdhury and Watts (2007) modify Basu’s model
by cumulating earnings and returns over multiple periods. The modified model is as follows:
NIt−j,t/Pt−j−1 = β0 + β1 ×DRt−j,t + β2 ×Rt−j,t + β3 ×DRt−j,t ×Rt−j,t + εt. (2)
NIt−j,t is cumulative net income before extraordinary items during the years t− j to t, and
j varies from 0 to 3; when j = 0, there is no cumulation, and the model is the same as
Basu’s model; Pt−j−1 is the market value of equity at the end of year t − j − 1; Rt−j,t is
the buy-and-hold return, beginning in the fourth month of fiscal year t− j and ending three
months after the end of year t; dummy variable DRt−j,t equals 1 if Rt−j,t is negative, and 0
otherwise.
10

In this paper I estimate conservatism by using earnings and stock returns cumulated over
two years (i.e. j = 1). Cumulating returns backwards also alleviates the concern that equity
markets in certain countries are not efficient enough to reflect news in a timely manner. In the
robustness analyses, I also measure conservatism based on earnings and returns cumulated
over other periods and get similar results.
To obtain the conservatism measure for each country, I estimate Regression (2) for each
country by using all firm-year observations. The stock returns are adjusted for market return
measured as the country’s equally-weighted average return.4 The reason for using country-
level pooled regression is that, as pointed out by Bushman, Piotroski, and Smith (2006),
pooling all firms and industries within a country for all available years achieves maximum
power in estimating timely loss recognition practice. What these country-level estimations
capture, in the presence of diversification, is an estimate of the first-order country component
of financial reporting practice.
Consistent with previous literature, in this paper I use timely loss recognition equal to
β2 +β3 and incremental loss recognition equal to β3 estimated from Equation (2) as the main
proxies for conservatism. I also use incremental R2, which measures asymmetric timeliness of
earnings to bad news and good news, as the third proxy for conservatism. IncR2 is defined
as the adjusted R2 from Regression (2) minus the adjusted R2 from the following linear
regression:
NIt−j,t/Pt−j−1 = β0 + β1 ×Rt−j,t + εt. (3)
Adding non-linear parts (DRt−j,t and DRt−j,t × Rt−j,t) to the above regression allows re-
sponse coefficients for bad news and good news to be different, which increases the overall
explanatory power of economic news to accounting information. All these three measures
are denoted as “CONSERV” in the regression tables.
The financial data for measuring conservatism are obtained from Compustat Global Van-
tage. I delete observations in the top and bottom percentiles for earnings and returns
variables, and require each country-year to have at least five observations to allow for a
reliable calculation of annual market returns. I also require each country to have at least 400
4The adjustment for returns is used as a control for differences in expected return across countries andacross years (Ball, Robin, and Sadka (2008)).
11

firm-year observations to run the pooled regression.5 Table 1 lists estimated conservatism
measures for each country. Numbers are comparable with those reported in Bushman and
Piotroski (2006) but with slightly higher magnitudes, which is consistent with the findings
in Roychowdhury and Watts (2007) that asymmetric timeliness measures conservatism more
efficiently when it is estimated cumulatively over multiple periods.
3.2 Measures of Cost of Capital
3.2.1 Cost of Debt
Interest rate, a proxy for default risk, is widely used as the measure for the cost of debt in the
literature (Francis, LaFond, Olsson, and Schipper (2005); Pittmana and Fortin (2004)). In
this paper, one-year-ahead interest rate, calculated as the ratio of a firm’s interest expenses
at year t + 1 to average interest-bearing debt outstanding during years t and t + 1, is used
as the primary measure for the expected cost of debt. This measure reflects the average cost
of borrowing for both public and private debt and is likely to capture the agency costs for
debtholders as a whole. However, interest rate is simultaneously determined by other features
of the debt contracts, such as the seniority of the debt, the strictness of the covenants, and
the maturity. As such information is not available for global firms, to address this concern,
in the robustness analyses, I use credit ratings of new bond issues as an alternative measure
for the cost of debt, which is considered as closely associated with the eventual payoff of the
interests and principal obligations but less likely to be correlated with other debt features
(Ahmed, Billings, Morton, and Stanford-Harris (2002)).
Table 2 reports the cost of debt (in both nominal and real terms) averaged across time
for each country. Brazil has the highest cost of debt in both nominal (0.175) and real (0.108)
terms, corresponding to a quite low conservatism level (i.e. with β2 +β3 0.108, β3 0.083, and
IncR2 0.009) as reported in Table 1. Because of Japan’s low inflation rate, it has the lowest
nominal cost of debt (0.030), whereas India has the lowest real cost of debt (0.018).
5In unreported analyses, regression results are not sensitive to this data requirement.
12

3.2.2 Cost of Equity
I use internal rates of return implied from accounting-based valuation models to measure the
expected cost of equity. I adopt four different models as suggested by Claus and Thomas
(2001), Gebhardt, Lee, and Swaminathan (2001), Ohlson and Juettner-Nauroth (2005), and
Easton (2004). A detailed description and an empirical implementation of these models
are presented in Appendix A. To mitigate biases and measurement errors existing in each
model, I use the average of four estimates as the proxy for the cost of equity in the regression
analysis (Hail and Leuz (2006)). As suggested by Table 3, these four measures RCT , RGLS,
ROJ , RPEG and their arithmetic mean RE are highly correlated with each other. This table
also suggests that the measures for the cost of debt and the cost of equity are positively
related with each other, with a Pearson correlation coefficient of 0.438.
Table 2 reports the average cost of equity (in both nominal and real terms) across time
for each country. Again, Brazil has the largest value for both nominal and real terms of the
cost of equity (0.314 and 0.229), and Japan has the lowest nominal cost of equity (0.091).
Mexico, which has the highest value for β2 +β3 (0.706) in Table 1, has the lowest real cost of
equity (0.051). In general, the cost of equity is higher than the cost of debt in each country,
reflecting the larger risk premium for equity capital.
3.3 Methodology and Control Variables
I use the following two multivariate regression models to estimate the influence of conser-
vatism on the cost of debt and equity capital, respectively.
Cost of Debtkt = α0 + α1Conservatism Measurek + α2BTMkt
+ α3LEVERAGEkt + α4STDRETkt + α5STDEARNkt
+ α6SIZEkt + α7INTCOVkt + α8GROWTHkt + α9ROAkt
+ α10INFkt + α11CREDk + α12LAWk + α13SECREGk
+ α14FLOWk + α15SECREGk × FLOWk + Year Dummies
+ εkt (4)
Cost of Equitykt = α0 + α1Conservatism Measurek + α2BTMkt
13

+ α3LEVERAGEkt + α4STDRETkt + α5STDEARNkt
+ α6SIZEkt + α7FBIASkt + α8INFkt + α9LAWk
+ α10SECREGk + α11FLOWk + α12SECREGk × FLOWk
+ Year Dummies + εkt (5)
In the above models, k denotes country and t denotes year. The reasons for using country-
level panel data for the analyses are: (1) one motivation of this study is to explore the
variation in country aggregate conservatism, which varies at the country level, not at the
firm level; (2) country-year analyses avoid giving undue weight to large countries with many
firms (Hail and Leuz (2006)). As is seen in Table 2, well-developed economies, such as the US,
the UK and Japan have dominant numbers of firm-year observations in the whole sample. If
regressions are conducted at the firm level, the results are likely to be driven by these three
countries; (3) firms within the same country are likely to be affected by unknown country
factors. However, including country fixed effects in the regressions would over-control for
cross-country differences and remove the effects of conservatism, which has a constant value
for all the firm-years with the same country.
However, the country-level cost of capital are likely to be serially correlated across time.
To address this concern, the standard errors are adjusted for Newey-West heteroscedasticity
and autocorrelation (Hail and Leuz (2006)). To further address this concern, as a robustness
analysis, I also run the above regressions by using country-level cross-sectional data and
the results are unchanged. In the following two subsections, I discuss in detail the control
variables used in the above regressions.
3.3.1 Firm Specific Control Variables
Beta, book-to-market, firm size and leverage ratio are typically regarded as firm-risk measures
(Fama and French (1992)). However, instead of beta, I use return variability (STDRET)
in the cost of equity regressions, because the estimation of beta requires a choice of market
portfolio, which is a common difficulty in international studies and depends on the level of
market integration (Hail and Leuz (2006)). Return variability is measured as the standard
deviation of monthly stock returns over the last 12 months. I define book-to-market (BTM)
as the book value of equity divided by the market value of equity, firm size (SIZE) as the
14

natural log of a firm’s market value of equity, and leverage (LEVERAGE) as the ratio of
interest-bearing debt to total assets. Book-to-market ratio also controls for the difference
in accounting rules, such as unconditional conservatism. Earnings variability (STDEARN),
measured as the standard deviation of annual earnings divided by total assets over the last
five years, captures the volatility of business, and country-year median of earnings variability
also captures the variability of macroeconomy (Hail and Leuz (2006); Francis, LaFond,
Olsson, and Schipper (2005)).
For the regressions on the cost of debt, I also include sales growth (GROWTH), interest
coverage ratio (INTCOV) and return on assets (ROA) as controls for growth, default risk
and profitability, respectively (Ahmed, Billings, Morton, and Stanford-Harris (2002); Francis,
LaFond, Olsson, and Schipper (2005)).
To mitigate the mechanical effects of the international differences in analysts’ forecasting
biases on the cost of equity results, analyst forecasting bias (FBIAS), measured as one-year-
ahead analyst forecast made 10-month after current fiscal year-end minus one-year-ahead
actual EPS scaled by stock price, is also included in the cost of equity regressions (Hail and
Leuz (2006)).6
All the firm-specific control variables are measured as country-year medians in the re-
gressions. A detailed description and an empirical implementation of the these variables are
provided in Appendix B.1.
3.3.2 Country Specific Control Variables
Since all financial and market data are expressed in nominal terms and in local currencies, the
resulting estimates for the cost of capital reflect countries’ expected inflation rates (Hail and
Leuz (2006)). Therefore, I use one-year-ahead inflation rate as the control for cross-country
differences in the expected future inflation.7
6This is consistent with the cost of equity calculation, in which I use analyst forecasts made in month+10 after the fiscal year-end.
7Hail and Leuz (2006) point out that another approach to control for the inflation is to subtract theexpected future inflation rates from the cost of capital estimates, and conduct a regression analysis on theresulting inflation-adjusted estimates. However, this approach essentially forces a coefficient of -1 on theinflation proxy. As the market’s expectation for future inflation is only imperfectly observable, they preferto introduce a separate control variable for cross-sectional differences in inflation. This approach lets thedata determine the relation between the inflation proxy and the cost of capital estimate. They expect the
15

La Porta, Lopez-de Silanes, Shleifer, and Vishny (1997) find that the legal origin deter-
mines the development of capital markets and Ball, Kothari, and Robin (2000) find that
legal origin also shapes the reported accounting numbers. To control for the legal origin,
I include a dummy variable CIV COM indicating that the country has a civil law origin.
Hail and Leuz (2006) find that firms from countries with more extensive disclosure require-
ments, stronger securities regulations and stricter enforcement mechanisms have lower cost
of equity capital. Therefore I control for the effectiveness of a country’s legal systems and
securities regulations by including country-level indices LAW and SECREG. LAW reflects
the law and order tradition in a particular country, and is obtained from La Porta, Lopez-de
Silanes, and Shleifer (2006). SECREG combines the disclosure requirement index with the
liability standards and the public enforcement indices, and is obtained from Hail and Leuz
(2006). Creditors with stronger legal rights are better protected, thereby requiring a lower
rate of return. Therefore, I include country creditor right index (CRED) in the cost of debt
regression analysis. CRED is an index measuring aggregate creditor rights in a country
and is obtained from La Porta, Lopez-de Silanes, Shleifer, and Vishny (1998). The level of
capital market integration could also influence the cost of capital. Highly segmented capital
markets have less liquidity or higher transaction costs, so investors require a higher return
as compensation. On the other hand, in integrated markets, risk is shared and diversified
globally, which reduces firms’ cost of capital (Karolyi and Stulz (2003)). In addition, Lom-
bardo and Pagano (2000) show that the impacts of law and its enforcement on the cost of
capital depend on the degree of capital market integration. In a fully integrated economy,
the reduction in managerial diversion of corporate sources obtained from improving the legal
environment is entirely reflected in the stock price, with no effect on the cost of capital. In
contrast, in an internationally segmented stock market, only a fraction of the benefits ma-
terialize in the stock price and the remainder translate into an increase of the expected rate
of return. Therefore, in the regressions, I use the level of market integration as a separate
control variable and also interact it with securities regulation variable (SECREG)8. FLOW,
coefficient to be positive, but smaller than 1, as measurement error is likely to bias the coefficient towardszero. This approach also controls for the real risk-free rate by assuming that the differences in the nominalrisk-free rate stem only from differences in expected inflation rates, and that real risk-free rate in a givenyear is a yearly constant across countries. Therefore, by including inflation rate and year dummies in theregressions, I could control for the time variation in the real risk-free rate. In the robustness analyses inSection 5.1, I also use local nominal risk-free rates to replace inflation rate in the regressions as a control.
8This approach is consistent with Hail and Leuz (2006)
16

a dummy variable indicating high market integration, is obtained from Hail and Leuz (2006).
It equals one if the sum of a country’s portfolio inflows and outflows divided by its GDP is
above the sample median.
Country-specific variables and data sources are described in detail in Appendix B.2.
Table 1 lists the value of these variables by country. This table shows considerable variation
in these variables. Developed countries, such as Switzerland, Austria, the United Kingdom
and the United States, generally have high values for the LAW and FLOW indices, whereas
developing countries, such as Indonesia, Mexico and the Philippines, have very low LAW
indices, and their capital markets are identified as segmented (FLOW = 0). The United
States and Canada have the strongest securities regulations. The UK and its former colonies,
such as Hong Kong and India, have the strongest creditor rights.
3.4 Sample Selection and Data Processing
Financial and stock price data are obtained from COMPUSTAT Global Vantage. Analyst
forecasts and actual EPS data are obtained from I/B/E/S. The sample selection procedure
follows prior studies: I eliminate firm-years if they are listed outside their home country;9 all
items are denominated in local currencies (Hail and Leuz (2006)); when estimating country-
level conservatism, I delete observations in the top and bottom percentiles for earnings and
returns variables, and require each country to have at least 400 firm-year observations to
estimate Equation (2) (Ball, Robin, and Sadka (2008)); for the cost of debt sample I eliminate
firm-years if the estimated cost of debt value is missing or non-positive (Francis, LaFond,
Olsson, and Schipper (2005)); for the cost of equity sample I eliminate firm-years if any of
the four measures of implied cost of equity is missing, or if its value is outside the range
0 to 1 (Hail and Leuz (2006)); for both debt and equity samples I eliminate country-years
with an inflation rate higher than 25%, to exclude extreme macroeconomic situations (Hail
and Leuz (2006)); since I use country-year medians in all the regressions, for both samples, I
eliminate country-years with less than five observations to allow for a reliable calculation of
annual country median (Hail and Leuz (2006)); for both samples I delete countries without
data on control variables.
9Holthausen (2003) argues that, when doing cross-country studies, we should try to control for or eliminatefirms that are cross-listed.
17

The final cost of debt (equity) sample has 466 (430) country-year observations or 140,774
(62,292) firm-years covering 31 countries and 16 years, from 1991 to 2006.
4 Empirical Results
Table 4 reports Pearson correlation coefficients between conservatism measures and the cost
of capital, as well as institutional variables. Consistent with H1, β2 + β3, β3 and IncR2 are
negatively correlated with the cost of debt, with Pearson correlation coefficients of -0.210,
-0.210 and -0.171, respectively. Consistent with H2, β2 + β3, β3 and IncR2 are negatively
correlated with the cost of equity, with Pearson correlation coefficients of -0.271, -0.311 and
-0.330, respectively.
Although LAW and FLOW are positively correlated with β2 +β3, β3 and IncR2, none of
these coefficients is larger than 50%. Therefore multicollinearity should not be an issue if both
conservatism and these country-level control variables are included in the same regression.
Table 5 presents distributional statistics for conservatism and time-variant variables in
the cost of debt and equity regressions. All variables show considerable variation in both
samples. Statistics for variables BTM, STDRET, FBIAS and INF are very similar to those
reported in Hail and Leuz (2006) (Table 2). Compared with the cost of debt sample, firms
in the cost of equity sample have slightly larger size, probably because analysts are more
likely to follow larger firms. Results from estimating Equations (4) and (5) are reported in
Table 6.
4.1 Cost of Debt and Conservatism
Table 6 reports multivariate regression results for Equation (4). The results are consistent
with the univariate test results reported in Table 4 and the hypothesis that accounting
conservatism reduces firms’ cost of debt capital (H1). The coefficient on conservatism is
negative and significant for all three measures. The coefficient on timely loss recognition
(β2 + β3) is -0.059, indicating that a one standard deviation increase of β2 + β3 reduces the
nominal cost of debt by 86 basis points. The coefficient on incremental loss recognition (β3)
is -0.053, indicating that a one standard deviation increase of β3 reduces the nominal cost
18

of debt by 82 basis points. The coefficient on asymmetric timeliness of good news and bad
news (IncR2) is negative and has a one-tailed p-value of 0.02. Therefore the relation between
the cost of debt and conservatism is statistically and economically significant.
For firm-level control variables, leverage ratio, stock return volatility, earnings volatility,
and interest coverage ratio are important in explaining the variation of firms’ cost of debt.
The coefficient on leverage is negative and significant. Although this finding is similar to that
in Francis, LaFond, Olsson, and Schipper (2005), previous studies generally find a positive
association between leverage and the cost of debt at the firm level. To the best of my
knowledge, there is no study predicting a positive relation between leverage and the cost
of debt at the country level. Since leverage is an endogenous variable and the majority of
its cross-country variation comes from institutional factors, such as bankruptcy codes, the
preparation of financial statements and the availability of different forms of financing (Booth,
Aivazian, Demirguc-Kunt, and Maksimovic (2001); Acharya, Sundaram, and John (2008)),
a country’s leverage ratio is likely to be negatively correlated with its macroeconomic risk.
Therefore, it is not surprising to observe a negative coefficient of leverage in country-level
cost of debt regressions. Consistent with findings in Hail and Leuz (2006) and Francis,
LaFond, Olsson, and Schipper (2005), stock return volatility and earnings volatility have
positive and significant coefficients, implying that both firm risk and macroeconomic risk
are priced by the debt market. The negative coefficient on interest coverage ratio reflects the
positive association between default risk and cost of debt. In contrast, book-to-market, firm
size, sales growth and return on assets contribute little to explaining the cost of debt. The
insignificant coefficient on book-to-market ratio is also consistent with its role as a proxy for
unconditional conservatism.10
Coefficients on country-level control variables show patterns similar to those in previous
studies. Inflation rate is positively related with the nominal cost of debt, with coefficients
around 0.2 and one-tailed p-value 0.01. Civil law countries have lower cost of debt. Countries
with stronger creditor rights, more effective legal systems, better securities regulations, and
more integrated capital markets have lower cost of debt. The positive coefficient of the
interaction term of SECREG and FLOW suggests that the effect of securities regulations
10Ball and Shivakumar (2005) argue that unconditional conservatism is at best neutral and possiblyinefficient in contracting.
19

becomes smaller in integrated markets.
The adjusted R2s reported in Table 6 are around 50% for all three conservatism measures,
indicating substantial explanatory power of the regression model on a country’s average cost
of debt capital.
4.2 Cost of Equity and Conservatism
Table 6 also reports multivariate regression results for Equation (5). Results are consis-
tent with univariate test results reported in Table 4 and the hypothesis that accounting
conservatism reduces firms’ cost of equity capital (H2). The coefficient on conservatism is
significant at the 1% level (one-tailed p-value) for all three measures, and their magnitudes
are comparable with those in the cost of debt regressions. The coefficient on timely loss
recognition (β2 + β3) is -0.051, indicating that a one standard deviation increase of β2 + β3
reduces the nominal cost of equity by 74 basis points. The coefficient for β3 is -0.042, indi-
cating that a one standard deviation increase of β3 reduces the nominal cost of equity by 65
basis points. The coefficient on asymmetric timeliness of good news and bad news (IncR2)
is -0.374, indicating that a one standard deviation increase in IncR2 reduces the nominal
cost of equity by 82 basis points. Therefore the relation between the cost of equity and
conservatism is statistically and economically significant.
Coefficients on control variables show patterns similar to those in the cost of debt regres-
sions. Leverage ratio, stock return volatility, earnings volatility and analyst forecasting bias
are important in explaining the variation of the cost of equity. The coefficient on leverage is
positive and significant, indicating a higher risk premium for highly leveraged firms. Both
stock return volatility and earnings volatility have positive and significant coefficients, im-
plying that firm risk and macroeconomic risk are priced by the equity market. The positive
coefficient of analyst forecasting bias suggests that analyst forecast optimism has been in-
corporated into stock prices. In contrast, book-to-market contributes little to explaining the
cost of equity, consistent with its role as a proxy for unconditional conservatism. Although
the coefficient on firm size is not significant at the conventional level, its sign and magnitude
are consistent with previous studies (e.g., Hail and Leuz (2006)).
The coefficients on the country-specific control variables are consistent with prior studies,
20

and comparable to those reported in the cost of debt regressions. Inflation rate is positively
related with the nominal cost of equity, with coefficients around 0.3 and one-tailed p-value
0.01. Countries with more effective legal systems, better securities regulations, and more
integrated capital markets have significantly lower cost of equity. The effect of securities
regulations on the cost of equity is smaller in integrated markets. The magnitudes of co-
efficients on SECREG, FLOW and SECREG×FLOW are very similar to those reported in
Hail and Leuz (2006) (Table 7).
The adjusted R2s reported in Table 6 are around 47% for all three conservatism measures,
indicating substantial explanatory power of the regression model on a country’s cost of equity
capital.
5 Robustness Analyses
In this section I conduct a battery of robustness analyses. First, I use several alternative
proxies to measure both the cost of capital and conservatism. Second, I address the concern
of correlated omitted variables. Next, I check whether the results are sensitive to the sample
composition. Last, to address the concern about serial correlation, I conduct cross-sectional
regressions with only 31 country-level observations.
5.1 Alternative Measures for Cost of Capital
5.1.1 Bond Credit Ratings
In Section 3.2, I use realized interest rate as the proxy for the cost of debt, and this approach
has several drawbacks. First, realized interest rate measures historical cost of debt and is
influenced by the amortization rate and firm age. Therefore, it is not a current market
measure for the cost of debt. Second, interest rate is also affected by the underlying structure
of debt, such as the maturity and the seniority. Third, it is a noisy proxy for a firm’s interest
rate.11 As the analyses in this paper are conducted at the country level, where the cost of debt
is measured as country-year medians, extreme values should not be a concern. In addition, by
11For example, Pittmana and Fortin (2004) argues that the data need to be trimmed at the 5th and 95thpercentiles to address the extreme observations.
21
using regressions with year fixed-effects, the year dummies are likely to capture the existing
time trend for the changes in the interest rate. Furthermore, since the conservatism measure
is a country-specific variable which does not vary across time and the focus of this paper is to
examine the impact of a country’s conservative financial reporting system on the borrowers’
agency cost of debt on average, using historical cost of debt is unlikely to bias the results. In
the last part of this section, I also run cross-sectional regressions, where the cost of capital
measures are averaged cross time and the results are still unchanged.
Nevertheless, to further address the above concerns, I use debt ratings on new bond issues
as the alternative measure for the cost of debt. Prior literature shows that credit ratings
are closely related with the cost of debt (Ziebart and Reiter (1992); Hand, Holthausen,
and Leftwich (1992)) and also widely uses debt ratings as a proxy for firms’ cost of debt
(e.g., Ahmed, Billings, Morton, and Stanford-Harris (2002)). I collect data on new bond
issues during the sample period for all the sample countries from Thomson Deal (former
SDC) database. Due to the limited coverage of deals outside the United States by Thomson
Deal, the final sample only has 4,267 firm-year observations representing 280 country-year
observations from 30 countries.12 I use Standard&Poor’s bond ratings at the time of offering
as the primary source and use Moody’s rating to fill in the missing values. The bond ratings
are further transformed into numeric scores, with values ranging from 1 (AAA) to 21 (C).
The average rating scores by country are reported in Table 1. Austria, Denmark, Spain
and Japan have low rating scores, suggesting low cost of debt, and Indonesia, Brzail and
Philippines have high rating scores, suggesting high cost of debt. The ratings range from 1
(AAA) to 17 (CCC+ or Caa1) for the whole sample, with a mean of 7.6 (between A- and
BBB+) and a median of 8 (Panel A, Table 5). The rating scores are positively correlated
with the interest rates, with a Pearson correlation coefficient of 0.238 (Table 3).
The results from the univariate test (Table 4) and the OLS regression analysis (Table 7)
are similar to those using realized interest rate as the proxy for the cost of debt.13 Despite the
smaller sample size, the R2s reported in Table 7 are smaller than those reported in Table 6,
probably because debt rating is a rather indirect measure for the cost of debt, compared
12The data on new bond issues are missing for firms in South Africa.13Previous literature generally uses ordered logit model for regressions using numeric debt ratings as the
dependent variable. Since country-year medians of debt ratings are not always ordinal numbers, I use OLSmodel for the regressions.
22

with the interest rate.
5.1.2 Ex Post Stock Returns
Several papers have criticized using accounting-based proxies imputed from prices and con-
temporaneous analysts earnings forecasts to measure the expected returns. Easton and
Monahan (2005) find that these proxies are unreliable and none of them has a positive as-
sociation with the realized returns even after controlling for changes in expectations about
future cash flows and future discount rates. Guay, Kothari, and Shu (2005) find that as
analysts do not incorporate information in stock prices in a timely manner, sluggish analyst
forecasts usually result in downward (upward) biased cost of capital estimates following large
positive (negative) stock returns. As the analyses in this paper are based on country-level
variables, the above problem is less severe and could be mitigated by controlling for analyst
forecasting bias (FBIAS) in the regressions. Botosan and Plumlee (2005) find that the rPEG
estimate is associated with firm risk in a stable and meaningful manner and recommend it
as a firm-level measure for the expected cost of equity capital. In unreported tests, I replace
RE with rPEG in the regressions and get similar results.
Another potential concern with the implied cost of equity proxy is its correlation with
conservatism by construction. As conservative financial reports depress forecasted earnings,
they also introduce downward biases to the cost of equity estimates. To address this concern,
I use the ex post stock returns (RRet), which do not depend on analyst forecasts, as the
alternative measure for the cost of equity. RRet is measured as one-year-ahead realized buy-
and-hold stock returns, adjusted for stock splits and dividends. To have a meaningful proxy
for the cost of capital, and to be consistent with RE, I require realized stock returns to be
in the range 0 to 1, which reduces the sample size to 307 country-years.
The average realized stock returns by country and the distributional statistics for RRet
are reported in Tables 1 and 5, respectively. Compared with RE, RRet has larger a mean,
median and standard deviation. The correlation matrix reported in Table 3 suggests very
small positive correlations between realized returns and the implied cost of equity estimates,
consistent with the findings in Easton and Monahan (2005) and Guay, Kothari, and Shu
(2005). Nevertheless, both univariate (Table 4) and multivariate test (Table 7) results suggest
23

that realized stock returns are negatively associated with conservatism. Moreover, in Table 7,
the magnitudes of the coefficients on conservatism variables are larger than those reported
in Table 6, with one standard deviation increase of β2 + β3 reducing the realized return by
150 basis points.
5.1.3 Country Credit Risk
I also use country risk indices as an alternative proxy for the cost of capital. Country credit
risk score (RCredit) measures the overall risk assessment of the political and macroeconomic
environment within a country. Country financial risk score (RFinancial) measures the risk of
financing and accessing capital markets within a country. The data are obtained from the
EIU Market Indicators and Forecasts database. Because of limited data availability of these
indices, the sample is further reduced. Nevertheless, the results still hold.
The results obtained from Regression (4) by using country risk indices are presented in
Panel A of Table 8. For brevity, only the coefficients and p-values on conservatism measures,
as well as sample size and adjusted R2s are reported. Coefficients on both β2 + β3 and β3
are negative and significant at the 1% significance level.
5.1.4 Risk-free Rate
Although it is the common practice to assume that differences in the nominal risk-free rate
stem only from differences in expected inflation rates, and that the real risk-free rate in a
given year is a yearly constant across countries (Hail and Leuz (2006)), it is likely that local
real interest rates differ across countries. Therefore, to check the sensitivity of the results, I
replace the expected inflation rates in the regressions with the local nominal risk-free rates
using the money market interest rates provided by EIU country database. As EIU analysts
use different rates for different countries, this proxy is might be noisy. Nevertheless, the
results as reported in Panel B of Table 8 are unchanged.14 Conservatism variables continue
to be negative and significant, with one-tailed p-values ranging from 0.00 to 0.02, although
14For most of the countries, EIU analysts use a 3-month interbank offer rate or a 3-month treasury billrate as the risk-free rate. However, for certain countries, they use other types of interest rates. For example,the weighted average rate paid on loans between financial institutions involving firm sales of or repurchaseagreements based on federal securities in the Special Settlement and Custody System is used as the moneymarket interest rate for Brazil and the money market overnight closing rate is used for Hong Kong.
24

the magnitudes of the coefficients are slightly attenuated compared with those in Table 6.
5.2 Alternative Measures for Conservatism
5.2.1 Alternative Cumulating Horizon
Roychowdhury and Watts (2007) argue that the expected slope coefficients in Basu’s model
depend on the intervals over which stock returns and earnings are measured, and conser-
vatism is estimated more efficiently over longer intervals. Whereas in the main analyses I
use a two-year window for both stock returns and earnings to estimate conservatism, here I
re-estimate Equation (2) over different intervals. Table 9 reports results from regressions (4)
and (5). For brevity, I tabulate only the coefficients and p-values for conservatism measures,
as well as adjusted R2s and sample size. Cumulating horizon j = 0, 1, 2, 3 indicates that
β2 + β3 and β3 are measured by using stock returns and earnings over one-, two-, three- and
four-year windows, respectively.
Coefficients on both measures are negative under all cumulating windows, and statisti-
cally significant under all but one scenario. There is no clear pattern on these coefficients,
as the cumulating horizon varies. However, the explanatory power (adjusted-R2) of the re-
gression model increases as the cumulating interval becomes larger, probably because of the
decreasing sample size.
5.2.2 Non-price-based Model
As noted by Bushman and Piotroski (2006), another concern about Basu (1997) model is its
reliance on the assumption that price changes reflect economic gains and losses, and that the
price formation process is equally efficient across all markets. However, in reality, the price
formation process is likely to differ across countries. Ball and Shivakumar (2005) estimate
accounting conservatism without relying on market data. Their model is specified as follows:
ACCRUALSi,t = β0 + β1 ×DCFOi,t + β2 × CFOi,t + β3 ×DCFOi,t × CFOi,t + εi,t. (6)
ACCRUALSi,t is firm i’s accruals at year t, deflated by the beginning of period market
value of equity; CFOi,t−1 is firm i’s operating cash flow deflated by the beginning of period
market value of equity; the dummy variable DCFOi,t equals 1 if CFOi,t is negative, and
25

0 otherwise. β2 is expected to be negative, owing to the negative association between cash
flows and accruals by definition. Positive β3 suggests timely loss recognition. Owing to the
large magnitude and negative sign of β2, β2 + β3 is usually negative. Therefore I use only
β3 as the measure for conservatism, as well as the alternative measure IncR2, defined as the
adjusted R2 from regression (6) minus the adjusted R2 from the regression
ACCRUALSi,t = β0 + β1 × CFOi,t + εi,t. (7)
The regression results by using the above non-price-based conservatism measures are qual-
itatively similar as before, and are reported in Table 10. The coefficient on β3 is negative
and significant at the 1% level (one-tailed p-value) for both the cost of debt and the cost
of equity regressions. The coefficient on IncR2 is significant at the 1% level for the cost of
equity regression, and at the 5% level for the cost of debt regression. Coefficients on other
regression variables are comparable to those reported in Tables 6.
As pointed out by Bushman and Piotroski (2006), this non-price-based model also has
limitations. For example, it relies on the assumptions that the cash flow implications from
a current news event are present in the current year and are persistent, and that operating
cash flow is unbiased. However, the consistent results across these two models and over
different intervals alleviate concerns about the potential errors and biases associated with a
particular model.
5.3 The Issue on Potentially Correlated Omitted Variables
Due to the concern of multicollinearity and small degrees of freedom, so far I only include
control variables that have been identified by previous literature as influencing the cost of
capital. In this section, I discuss variables that are not controlled in the regressions, but
could be potentially correlated with both conservatism and cost of capital.
Prior literature shows that the size of equity or debt market and GDP per capital could
influence conservatism (Ball, Robin, and Sadka (2008)). Therefore, I use the ratio of debt
market capitalization to GDP as a control for the size of debt market (DEBTMKT) in the
cost of debt regression, the ratio of the equity market capitalization to GDP as a control for
the size of equity market (EQUITYMKT) in the cost of equity regression and the natural
26

log of GDP per capital in both regressions. In addition, the accessibility of equity market
(ACCESS) may also reduce the cost of equity capital.
Bushman and Piotroski (2006) show that a country’s legal/judicial system, securities
laws, political economy and tax regime generate incentives that influence the conservatism
level of its reported accounting numbers. To address the concern that these institutional
structures may potentially influence a country’s cost of capital, I further include these con-
trols in the regressions. CIV COM has already been included in the regression as an indicator
for the legal origin of the country, and it is also used as a proxy for the extent of investor
protections under law. The variable JUDIMP measures the quality of the judicial system
and captures whether a trusted legal framework exists for private business to challenge the
legality of government actions or regulation. A motivated public enforcer could elicit honesty
from issuers. Therefore public enforcement (PUBLENF) represents an important dimension
of securities laws. Both RISKEXP, proxy for the risk of outright confiscation of firms’ wealth
or forced nationalization by the state, and SOE, the share of country-level output supplied
by state-owned enterprises, measure government involvement in markets. TAXBURN mea-
sures the tax burden of a country. PRIVDEBT proxies for the prevalence of debt financing
in a country. Both BANKMKT and OWNCONC are used as proxies for the prevalence of
internal monitoring arrangements. Finally, ITENF, the enforcement of insider trading laws,
has been documented as associated with the reduction of the country-level cost of capital
(Bhattacharya, Daouk, and Welker (2003)).
After controlling for the above variables, the regression results become even stronger
(Table 11), with one standard deviation increase of β2 + β3 reducing the cost of equity by
146 basis points. As the effect of these institutional variables on the cost of capital is not of
interest in this paper, I omit the discussion on their regression coefficients for brevity.
5.4 The Issue on Sample Composition
The sample selection procedure requires at least five firms in a country and at least 400
country-year observations for that country to be included in the sample. Although this data
selection process has been used in previous studies, it is rather subjective. To mitigate the
likelihood that the results are driven by a specific sample of firms, I adopt conservatism mea-
27

sures directly from Ball, Robin, and Sadka (2008) in the regressions.15 This data requirement
reduces the final cost of debt (equity) sample to 336 (312) country-year observations covering
22 countries. The regression results as reported in Table 12 are qualitatively similar to those
reported earlier.
Coefficients on conservatism measures β2 +β3 and β3 are negative and significant in both
the cost of debt and the cost of equity regressions.16 Coefficients on other variables are
comparable to those reported in Table 6. The adjusted R2s are higher than before, because
of the smaller sample size.
5.5 Cross-sectional Regressions
To address the issues that country-year regression analyses give undue weight to countries
with a longer sample period, that conservatism and other institutional variables are time-
invariant, and that a country’s cost of capital is serially correlated, I conduct cross-sectional
regression analyses based on 31 country-level observations, where regression variables are
average across time. The results are reported in Table 13. Due to smaller sample size, the
statistic significance for most of the regression variables is smaller than that in the pooled
regressions. Nevertheless, the magnitudes of coefficients on conservatism in the cost of debt
regression are only slightly smaller than before, and those in the cost of equity regression
are even larger.
In summary, analyses in this section show that the main results of this study are robust
and generally support the conclusion that firms in countries with more conservative financial
reporting systems have lower cost of debt and equity capital.
6 Conclusions
In this paper I examine the contracting benefits of conservative accounting on international
debt and equity capital markets and find that the conservatism level of a country’s financial
15Ball, Robin, and Sadka (2008) follow a stricter sample selection procedure. They require each country-year to have at least 25 firms, and discard Hong Kong, Switzerland and Taiwan.
16As Ball, Robin, and Sadka (2008) do not use IncR2 to measure conservatism, the analyses in this sectionare based only on β2 + β3 and β3.
28

reporting system effectively reduces its firms’ cost of debt and equity capital. These effects
are over and above a series of economy-level factors, including legal origins, judicial systems,
securities regulations, and market integration, that have been identified by previous studies
to shape international capital markets. I estimate conservatism and the cost of debt and
equity capital for 31 countries over the period from 1991 to 2006. In the primary analy-
ses, I use timely loss recognition (β2 + β3) and incremental loss recognition (β3) estimated
from a modified Basu model (cumulating two years backwards) to measure conservatism,
and use incremental R2 to measure the asymmetric timeliness of good news and bad news.
I use the one-year-ahead interest rate to measure the expected cost of debt and use the
discount rates extracted four accounting-based valuation models to measure the expected
cost of equity. I conduct a battery of robustness analyses, including using credit ratings of
new bond issues as the alternative measure for the cost of debt, realized stock returns as the
alternative measure for the cost of equity, and the non-price-based model proposed by Ball
and Shivakumar (2005) to estimate conservatism, and find similar results. I further address
the concern about potentially correlated omitted variables by including a dozen of institu-
tional variables suggested by previous studies that determine a country’s conservatism level
in the regressions, and the issue about sample composition by directly using country-level
conservatism measures from Ball, Robin, and Sadka (2008), and results are still unchanged.
Lastly, I conduct cross-sectional regression analyses by using 31 country-level observations,
and the results are qualitatively similar.
By showing the benefits of accounting conservatism on the debt and equity markets
directly, this paper partially solves the puzzle on the long-living conservatism in financial
reports around the world. Findings in this paper also highlight the importance of accounting
information in facilitating corporate governance standards and legal systems. However, the
findings in this paper should not be interpreted as advocating conservative accounting for
firms in all the countries. As Bushman and Piotroski (2006) and Ball, Kothari, and Robin
(2000) find that several institutional variables determine countries’ accounting systems, the
lower cost of capital is by no means the only concern for either standard setters or managers.
Considering the costs of conservatism, such as the reduced discretion of managers to recognize
the economic gains and the lag in the accounting income compared with the economic income,
the existing financial reporting properties should be regarded as the equilibrium outcome of
29

various trade-offs among different incentive sources.
Several caveats are in order. First, while measuring the cost of capital, measurement error
problem permeates the entire literature and this paper is no exception. Although this paper
tries to mitigate it by using alternative measures for the cost of capital, due to international
context, measurement error might still be a concern. Second, I can not completely eliminate
the concerns on selection bias and potentially correlated omitted variables. Due to data
availability, it is likely that only large economies are included in the sample. Although I
include a battery of institutional variables in the regressions, there is still a possibility that
an unknown factor determines both conservatism and the cost of capital.
30

APPENDIX
A Implied Cost of Equity Capital Models
As in Hail and Leuz (2006), I use four accounting-based valuation models suggested in previousliterature to calculate the ex ante cost of equity capital. The first two are special cases of theresidual income valuation model described by Ohlson (1995), and the second two are based on theabnormal earnings growth valuation model developed by Ohlson and Juettner-Nauroth (2005). Thebasic idea of all four models is to substitute price and analyst forecasts into a valuation equation,and to back out the cost of capital as the internal rate of return that equates current stock priceand the expected future sequence of residual incomes or abnormal earnings. The individual modelsdiffer with respect to the use of analyst forecast data, the assumptions regarding short-term andlong-term growth, the explicit forecasting horizon, and whether and how inflation is incorporatedinto the steady-state terminal value.
In the following models, variables are defined as follows:
p0 Current stock price, measured as of month +10 after the fiscal year-end.
bv0 Current book value of equity per share, measured as of fiscal year-end.
et Expected future earnings per share for year t.
dt Expected future dividends per share for year t.
bvt Expected book value of equity per share for year t.
g, gst, glt Expected perpetual, short-term or long-term growth rate.
k Dividend payout ratio.
A.1 Claus and Thomas (2001)
p0 = bv0 +e1 − rCT × bv0
(1 + rCT )+e2 − rCT × bv1
(1 + rCT )2+e3 − rCT × bv2
(1 + rCT )3+e4 − rCT × bv3
(1 + rCT )4
+e5 − rCT × bv4
(1 + rCT )5+
(e5 − rCT × bv4)× (1 + g)(rCT − g)(1 + rCT )5
(A-1)
bvt = bvt−1 + et − et × k
If e3, e4, e5 are missing, they are replaced by e3 = e2×(1+glt), e4 = e2×(1+glt)2, e5 = e2×(1+glt)3.As a proxy for g, I use the expected rate of inflation, which is calculated from country-specific one-year-ahead realized annual inflation rate.17
17Inflationt = (CPIt-CPIt−1)/CPIt−1. CPI data are from EIU Country Data.
31

A.2 Gebhardt, Lee and Swaminathan (2001)
p0 = bv0 +e1 − rGLS × bv0
(1 + rGLS)+e2 − rGLS × bv1
(1 + rGLS)2+e3 − rGLS × bv2
(1 + rGLS)3
+11∑t=4
ROEt − rGLS(1 + rGLS)t
× bvt−1 +ROE12 − rGLS
rGLS × (1 + rGLS)12× bv11 (A-2)
ROEt =1I
I∑i
ROEt,i
ROEt,i = et,i/bvt,i
bvt = bvt−1 + et − et × k
After the explicit forecast period of three years, the residual income series is derived by linearlyfading the forecasted accounting return on equity to the sector-specific average return. I use theaverage return on equity in a given country and year for firms with the same SIC code.
A.3 Ohlson and Juettner-Nauroth(2005)
p0 =e1
rOJ× (gst +
rOJ × d1
e1− glt)/(rOJ − glt) (A-3)
gst = (e2 − e1)/e1
d1 = k × e1
Short-term growth (gst) is defined as in Gode and Mohanram (2003). Long-term growth (glt) istaken as the expected rate of inflation.
A.4 Modified PEG ratio model by Easton(2004)
p0 = (e2 + rPEG × d1 − e1)/r2PEG (A-4)
A.5 Data requirements
Book equity value per share (bv0), dividends payout ratio (k) and current stock price (p0) are fromthe COMPUSTAT Global Vantage Industrial/Commercial (IC) file. e1, e2, e3, e4, e5, and glt areanalyst-forecasted earnings per share and long-term growth from I/B/E/S Summary Unadjustedfile. If e1 or e2 is missing, this data point is deleted. If glt is missing, it is replaced by glt =(e2 − e1)/e1. All estimates are mean analyst consensus forecasts. k is constant dividend payoutratio, which is assumed as the historic three-year average for each firm. If k is missing, or is outsidethe range 0 to 1, it is replaced by the country-year median payout ratio. Stock prices and analyst
32

forecasts are measured as of month +10 after the fiscal year-end, and all financial data are fiscalyear-end data. All data items are adjusted for stock splits and converted to local currency.
I use an iterative program to back out the internal rate of return. This procedure identifies theannual firm-specific discount rate that equates the left-hand-side price to the right-hand-side value.I start iterating the discount rate from 0 to 1 by 0.0001 each time, and stop if the imputed pricefalls within a 0.001 difference of its actual value. If there is no solution, I expand the differencebetween imputed price and actual price to be 0.01.
33

B Definitions of Variables
B.1 Firm Specific Variables
Financial data items are from COMPUSTAT Global Vantage Industrial/Commercial file and GlobalVantage Issues file. Analyst forecast data are from I/B/E/S summary and actual unadjusted files.
RD The primary measure for the cost of debt, calculated as interest expenses (data15) divided byaverage interest-bearing debt outstanding (data106 + data94) during years t and t+ 1.
Rating The alternative measure for the cost of debt. It is a numerical transformation of bondratings from the Standard&Poor’s or Moody’s at the time of offering. Its value ranges from1 (AAA) to 21 (C), with a larger value indicating a higher credit worthy.
RE The primary measure for the cost of equity, calculated as the average of implied cost of equityderived from the four models in Appendix A.
RRet Ex post stock return, the alternative measure for the cost of equity. It is measured as theone-year-ahead buy-and-hold stock return adjusted for stock splits and dividends.
BTM The ratio of book equity value to the market value of equity. Book equity value is calculatedfrom the following equations (in order):
Book Value of Equity = Shareholder’s Equity (data135)+ Deferred Taxes-Balance Sheet (data105)+ Investment Grants and Other Deductions (data79)− Preferred/Preference Capital - Redeemable (data121)
or = Comm on/Ordinary Equity (data146)+ Preferred/Preference Capital-Total (data119)
or = Total Assets (data89)− Total Liabilities (data118)
Market equity value equals stock price multiplying number of shares outstanding.
LEVERAGE Ratio of interest-bearing debt (data106 + data94) to total assets (data89).
STDRET Return variability, measured as the standard deviation of monthly stock returns overthe past 12 months.
STDEARN The standard deviation of net income before extraordinary items (data32) divided byaverage total assets over the past five years. At least three years’ observations are required.
SIZE Natural log of a firm’s market value of equity.
IntCov Interest coverage ratio, measured as operating income (data14) divided by interest ex-penses.
GROWTH Sales growth rate, measured as the annual percentage change of sales (data1).
34

ROA Return on assets, measured as net income before extraordinary items divided by total assets(data89).
FBIAS One-year-ahead analyst forecast error (mean forecast minus actual value) divided by theforecast-period stock price (at month +10).
B.2 Country Specific Variables
The following variables are available annually.
INF One-year-ahead inflation rate, calculated as the percentage change of CPI. (EIU CountryData)
Rf One-year-ahead risk-free rate, defined as 3-month interbank offer rate or 3-month Treasury billrate of the local country. (EIU Country Data)
ITENF An indicator variable equal to one if the country enforced its first insider trading lawsprior or during current year. (La Porta, Lopez-de Silanes, and Shleifer (2006); Bushman andPiotroski (2006))
RCredit Country credit risk index, indicating overall risk assessment of the political and macroeco-nomic environment within the country. It equals the overall country credit risk score dividedby 100. It ranges from 0 to 1. (EIU Market Indicators and Forecasts database)
RFinancial Country financial risk index, indicating the risk of financing and access to capital marketswithin the country. The factors considered include the risk of devaluation, access to localmarkets, banking sector health, and the liquidity of the stock market. It equals the financialrisk score divided by 100. It ranges from 0 to 1. (EIU Market Indicators and Forecastsdatabase)
The following variables are time-invariant.
β2 + β3 Timely loss recognition, measured as β2 + β3 estimated from Equation (2) by using j = 1for each country.
β3 Incremental loss recognition, measured as β3 estimated from Equation (2) by using j = 1 foreach country.
IncR2 Asymmetric timeliness of good news and bad news, measured as adjusted R2 from regression(2) minus adjusted R2 from regression (3) for each country.
CONSERV Conservatism measures, in the form of β2 + β3, β3 or IncR2.
CIV COM A dummy variable takes a value of one for civil law legal origin, namely French,German or Scandinavian legal origin, and zero for common law legal origin.
35
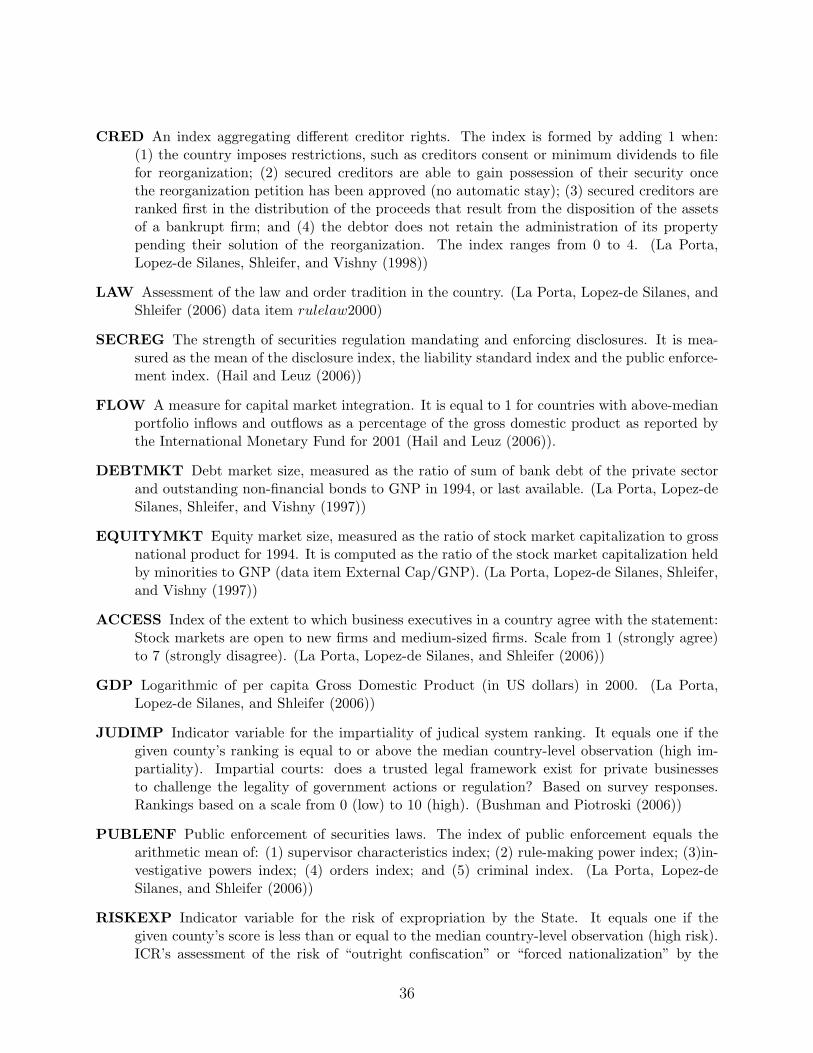
CRED An index aggregating different creditor rights. The index is formed by adding 1 when:(1) the country imposes restrictions, such as creditors consent or minimum dividends to filefor reorganization; (2) secured creditors are able to gain possession of their security oncethe reorganization petition has been approved (no automatic stay); (3) secured creditors areranked first in the distribution of the proceeds that result from the disposition of the assetsof a bankrupt firm; and (4) the debtor does not retain the administration of its propertypending their solution of the reorganization. The index ranges from 0 to 4. (La Porta,Lopez-de Silanes, Shleifer, and Vishny (1998))
LAW Assessment of the law and order tradition in the country. (La Porta, Lopez-de Silanes, andShleifer (2006) data item rulelaw2000)
SECREG The strength of securities regulation mandating and enforcing disclosures. It is mea-sured as the mean of the disclosure index, the liability standard index and the public enforce-ment index. (Hail and Leuz (2006))
FLOW A measure for capital market integration. It is equal to 1 for countries with above-medianportfolio inflows and outflows as a percentage of the gross domestic product as reported bythe International Monetary Fund for 2001 (Hail and Leuz (2006)).
DEBTMKT Debt market size, measured as the ratio of sum of bank debt of the private sectorand outstanding non-financial bonds to GNP in 1994, or last available. (La Porta, Lopez-deSilanes, Shleifer, and Vishny (1997))
EQUITYMKT Equity market size, measured as the ratio of stock market capitalization to grossnational product for 1994. It is computed as the ratio of the stock market capitalization heldby minorities to GNP (data item External Cap/GNP). (La Porta, Lopez-de Silanes, Shleifer,and Vishny (1997))
ACCESS Index of the extent to which business executives in a country agree with the statement:Stock markets are open to new firms and medium-sized firms. Scale from 1 (strongly agree)to 7 (strongly disagree). (La Porta, Lopez-de Silanes, and Shleifer (2006))
GDP Logarithmic of per capita Gross Domestic Product (in US dollars) in 2000. (La Porta,Lopez-de Silanes, and Shleifer (2006))
JUDIMP Indicator variable for the impartiality of judical system ranking. It equals one if thegiven county’s ranking is equal to or above the median country-level observation (high im-partiality). Impartial courts: does a trusted legal framework exist for private businessesto challenge the legality of government actions or regulation? Based on survey responses.Rankings based on a scale from 0 (low) to 10 (high). (Bushman and Piotroski (2006))
PUBLENF Public enforcement of securities laws. The index of public enforcement equals thearithmetic mean of: (1) supervisor characteristics index; (2) rule-making power index; (3)in-vestigative powers index; (4) orders index; and (5) criminal index. (La Porta, Lopez-deSilanes, and Shleifer (2006))
RISKEXP Indicator variable for the risk of expropriation by the State. It equals one if thegiven county’s score is less than or equal to the median country-level observation (high risk).ICR’s assessment of the risk of “outright confiscation” or “forced nationalization” by the
36

state. Average of the months April and October of the monthly index between 1982 and1995. Scale from 0 to 10, with higher scores for lower risk. (Bushman and Piotroski (2006))
SOE Indicator variable for the state-operated enterprises. It equals one if the government enter-prises and investment as a percentage of GDP is equal to or above the median country-levelobservation (high percentage). Data on the number, composition and share of output sup-plied by State-operated enterprises and government investment as a share of total investmentwere used to construct the 0 (high percentage) to 10 (low percentage) ratings. (Bushmanand Piotroski (2006))
TAXBURD Indicator variable for tax burden. It equals one if the given county’s ranking is lessthan or equal to the median country-level observation (low tax burden). Data on the topmarginal tax rate and the income thresholds at which they take effect used to constructrating of taxation. Countries with higher marginal tax rates that take effect at lower in-come thresholds receive lower ratings. Rankings based on a scale from 0 (low) to 10 (high).(Bushman and Piotroski (2006))
BANKMKT Indicator variable for bank economy versus market economy. It equals one if theratio of deposit money bank assets to the market capitalization of equity securities of a givencounty is equal to or above the median country-level observation (bank economy). (Bushmanand Piotroski (2006))
PRIVDEBT Indicator variable for the role of private long-term debt financing in the economy.It equals one if the ratio of private bond market capitalization to the countrys market capi-talization in the given county is equal to or above the median country-level observation (highamount of private debt). (Bushman and Piotroski (2006))
OWNCONC Ownership concentration. It is measured as the average percentage of commonshares owned by the top three shareholders in the ten largest non-financial, privately-owneddomestic firms in a given country. A firm is considered privately-owned if the State is not aknown shareholder in it. (La Porta, Lopez-de Silanes, and Shleifer (2006))
37

References
Acharya, V. V., R. K. Sundaram, and K. John, 2008, “Cross-country variations in capital structures:the role of bankruptcy codes,” Working Paper.
Ahmed, A. S., B. K. Billings, R. M. Morton, and M. Stanford-Harris, 2002, “The role of accountingconservatism in mitigating bondholder-shareholder conflicts over dividend policy and in reducingdebt costs,” The Accounting Review, 77, 867–890.
Ahmed, A. S., and S. Duellman, 2007, “Accounting conservatism and board of director character-istics: An empirical analysis,” Journal of Accounting and Economics, 43, 411437.
Ball, R., S. Kothari, and A. Robin, 2000, “The effect of international institutional factors onproperties of accounting earnings,” Journal of Accounting and Economics, 29, 1–51.
Ball, R., A. Robin, and G. Sadka, 2008, “Is financial reporting shaped by debt markets or by equitymarkets? An international study of timeliness and conservatism,” Review of Accounting Studies,13, 168–205.
Ball, R., A. Robin, and J. Wu, 2003, “Incentives versus standards: Properties of accounting incomein four East Asian countries,” Journal of Accounting and Economics, 36, 235–270.
Ball, R., and L. Shivakumar, 2005, “Earnings quality in U.K. private firms: Comparative lossrecognition timeliness,” Journal of Accounting and Economics, 39, 83128.
Basu, S., 1997, “The conservatism principle and the asymmetric timelines of earnings,” Journal ofAccounting and Economics, 24, 3–37.
Beatty, A., J. Weber, and J. Yu, 2008, “Conservatism and debt,” Journal of Accounting andEconomics, 45, 154–174.
Bhattacharya, U., H. Daouk, and M. Welker, 2003, “The world price of earnings opacity,” TheAccounting Review, 78, 641–679.
Booth, L., V. Aivazian, A. Demirguc-Kunt, and V. Maksimovic, 2001, “Capital structure in devel-oping countries,” Journal of Finance, LVI, 87–130.
Botosan, C. A., and M. A. Plumlee, 2005, “Assessing alternative proxies for the expected riskpremium,” The Accounting Review, 80, 21–53.
Bushman, R., and J. Piotroski, 2006, “Financial reporting incentives for conservative accounting:The influence of legal and political institutions,” Journal of Accounting and Economics, 42,107–148.
Bushman, R., J. Piotroski, and A. J. Smith, 2006, “Capital allocation and timely accountingrecognition of economic losses,” Working Paper.
Claus, J., and J. Thomas, 2001, “Equity premia as low as three percent? Evidence from analysts’earnings forecasts for domestic and internaitional stock markets,” Journal of Finance, 56, 1629–1666.
38

Easley, D., and M. O’Hara, 2004, “Information and the cost of capital,” Journal of Finance, 47,577605.
Easton, P., 2004, “PE ratios, PEG ratios, and estimating the implied expected rate of return onequity capital,” The Accounting Review, 79, 73–95.
Easton, P. D., and S. J. Monahan, 2005, “An evaluation of accounting-based measures of expectedreturns,” The Accounting Review, 80, 501538.
Fama, E., and K. French, 1992, “The cross-section of expected stock returns,” Journal of Finance,47, 427–465.
Francis, J., R. LaFond, P. Olsson, and K. Schipper, 2004, “Cost of equity and earnings attributes,”The Accounting Review, 79, 967–1010.
Francis, J., R. LaFond, P. Olsson, and K. Schipper, 2005, “The marketing pricing of accrualsquality,” Journal of Accounting and Economics, 39, 295–327.
Gebhardt, W., C. Lee, and B. Swaminathan, 2001, “Toward an implied cost of capital,” Journalof Accounting Research, 39, 135–176.
Givoly, D., C. K. Hayn, and A. Natarajan, 2007, “Measuring reporting conservatism,” The Ac-counting Review, 82, 65–106.
Gode, D., and P. Mohanram, 2003, “Inferring the cost of capital using the Ohlson-Juettner Model,”Review of Accounting Studies, 8, 399–431.
Guay, W., S. Kothari, and S. Shu, 2005, “Properties of implied cost of capital using analystsforecasts,” Working Paper.
Guay, W., and R. Verrecchia, 2006, “Discussion of an economic framework for conservative account-ing and Bushman and Piotroski (2006),” Journal of Accounting and Economics, 42, 149–165.
Guay, W. R., 2008, “Conservative financial reporting, debt covenants, and the agency,” Journal ofAccounting and Economics, 45, 175180.
Hail, L., and C. Leuz, 2006, “International differences in the cost of capital: Do legal institutionaland securities regulation matter?,” Journal of Accounting Research, 44, 485–531.
Hand, J. R. M., R. Holthausen, and R. Leftwich, 1992, “The effect of bond rating agency announce-ment on bond and stock prices,” Journal of Finance, 47, 733–753.
Holthausen, R., 2003, “Testing the relative power of accounting standerds versus incentives andother institutional features to influence the outcome of financial reporting in an internationalsetting,” Journal of Accounting and Economics, 36, 271–283.
Hughes, J. S., J. Liu, and J. Liu, 2007, “Information asymmetry, diversification, and cost of capital,”The Accounting Review, 82, 705–729.
Karolyi, A., and R. Stulz, 2003, “Are financial assets priced locally or globally?,” in The Handbookof the Economics of Finance, ed. by G. Constantinides, M. Harris, and R. Stulz. North-Holland.
39

Kothari, S., K. Ramanna, and D. Skinner, 2009, “What should GAAP look like?,” Working Paper.
Kwon, Y. K., D. P. Newman, and Y. S. Suh, 2001, “The demand for accounting conservatism formanagement control,” Review of Accounting Studies, 6, 29–51.
La Porta, R., F. Lopez-de Silanes, and A. Shleifer, 2006, “What works in securities laws?,” Journalof Finance, 61, 1–32.
La Porta, R., F. Lopez-de Silanes, A. Shleifer, and R. Vishny, 1997, “Legal determinants of externalfinance,” Journal of Finance, 52, 1131–1150.
La Porta, R., F. Lopez-de Silanes, A. Shleifer, and R. Vishny, 1998, “Law and finance,” Journal ofPolitical Economy, 106, 1113–1155.
LaFond, R., and R. L. Watts, 2008, “The information role of conservatism,” The Accounting Review,83, 447–478.
Lambert, R., C. Leuz, and R. E. Verrecchia, 2007, “Accounting information, disclosure, and thecost of capital,” Journal of Accounting Research, 45, 385–420.
Lombardo, D., and M. Pagano, 2000, “Legal determinants of the return on equity,” CSEF Discus-sion Paper No. 24.
, 2002, “Law and equity markets: a simple model,” Corporate Governance Regimes: Con-vergence and diversity, pp. 343–362.
Ohlson, J., 1995, “Earnings, book values, and dividends in equity valuation,” Contemporary Ac-counting Research, 11, 661–687.
Ohlson, J., and B. Juettner-Nauroth, 2005, “Expected EPS and EPS growth as determinants ofvalue,” Journal of Accounting Studies, 10, 349–365.
Pittmana, J. A., and S. Fortin, 2004, “Auditor choice and the cost of debt capital for newly publicfirms,” Journal of Accounting and Economics, 37, 113–136.
Roychowdhury, S., and R. L. Watts, 2007, “Asymmetric timeliness of earnings, market-to-book andconservatism in financial reporting,” Journal of Accounting and Economics.
Watts, R., 2003, “Conservatism in accounting Part I: explanations and implications,” AccountingHorizon, 17, 207–221.
Wittenberg-Moerman, R., 2008, “The role of information asymmetry and financial reporting qualityin debt contracting: Evidence from the secondary loan market,” Journal of Accounting andEconomics, 45, 240–260.
Zhang, J., 2008, “The contracting benefits of accounting conservatism to lenders and borrowers,”Journal of Accounting and Economics, 45, 27–54.
Ziebart, D. A., and S. A. Reiter, 1992, “Bond ratings, bond yields and financial information,”Contemporary Accounting Research, 9, 252–282.
40
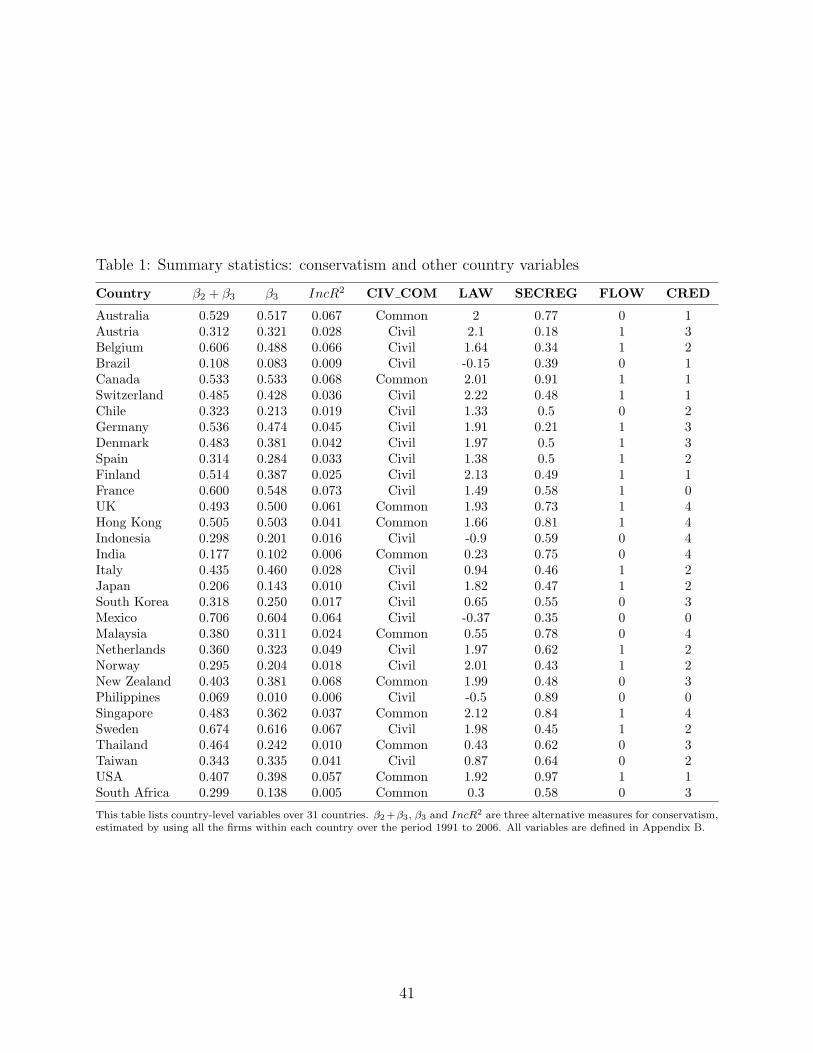
Table 1: Summary statistics: conservatism and other country variables
Country β2 + β3 β3 IncR2 CIV COM LAW SECREG FLOW CRED
Australia 0.529 0.517 0.067 Common 2 0.77 0 1Austria 0.312 0.321 0.028 Civil 2.1 0.18 1 3Belgium 0.606 0.488 0.066 Civil 1.64 0.34 1 2Brazil 0.108 0.083 0.009 Civil -0.15 0.39 0 1Canada 0.533 0.533 0.068 Common 2.01 0.91 1 1Switzerland 0.485 0.428 0.036 Civil 2.22 0.48 1 1Chile 0.323 0.213 0.019 Civil 1.33 0.5 0 2Germany 0.536 0.474 0.045 Civil 1.91 0.21 1 3Denmark 0.483 0.381 0.042 Civil 1.97 0.5 1 3Spain 0.314 0.284 0.033 Civil 1.38 0.5 1 2Finland 0.514 0.387 0.025 Civil 2.13 0.49 1 1France 0.600 0.548 0.073 Civil 1.49 0.58 1 0UK 0.493 0.500 0.061 Common 1.93 0.73 1 4Hong Kong 0.505 0.503 0.041 Common 1.66 0.81 1 4Indonesia 0.298 0.201 0.016 Civil -0.9 0.59 0 4India 0.177 0.102 0.006 Common 0.23 0.75 0 4Italy 0.435 0.460 0.028 Civil 0.94 0.46 1 2Japan 0.206 0.143 0.010 Civil 1.82 0.47 1 2South Korea 0.318 0.250 0.017 Civil 0.65 0.55 0 3Mexico 0.706 0.604 0.064 Civil -0.37 0.35 0 0Malaysia 0.380 0.311 0.024 Common 0.55 0.78 0 4Netherlands 0.360 0.323 0.049 Civil 1.97 0.62 1 2Norway 0.295 0.204 0.018 Civil 2.01 0.43 1 2New Zealand 0.403 0.381 0.068 Common 1.99 0.48 0 3Philippines 0.069 0.010 0.006 Civil -0.5 0.89 0 0Singapore 0.483 0.362 0.037 Common 2.12 0.84 1 4Sweden 0.674 0.616 0.067 Civil 1.98 0.45 1 2Thailand 0.464 0.242 0.010 Common 0.43 0.62 0 3Taiwan 0.343 0.335 0.041 Civil 0.87 0.64 0 2USA 0.407 0.398 0.057 Common 1.92 0.97 1 1South Africa 0.299 0.138 0.005 Common 0.3 0.58 0 3
This table lists country-level variables over 31 countries. β2 +β3, β3 and IncR2 are three alternative measures for conservatism,estimated by using all the firms within each country over the period 1991 to 2006. All variables are defined in Appendix B.
41
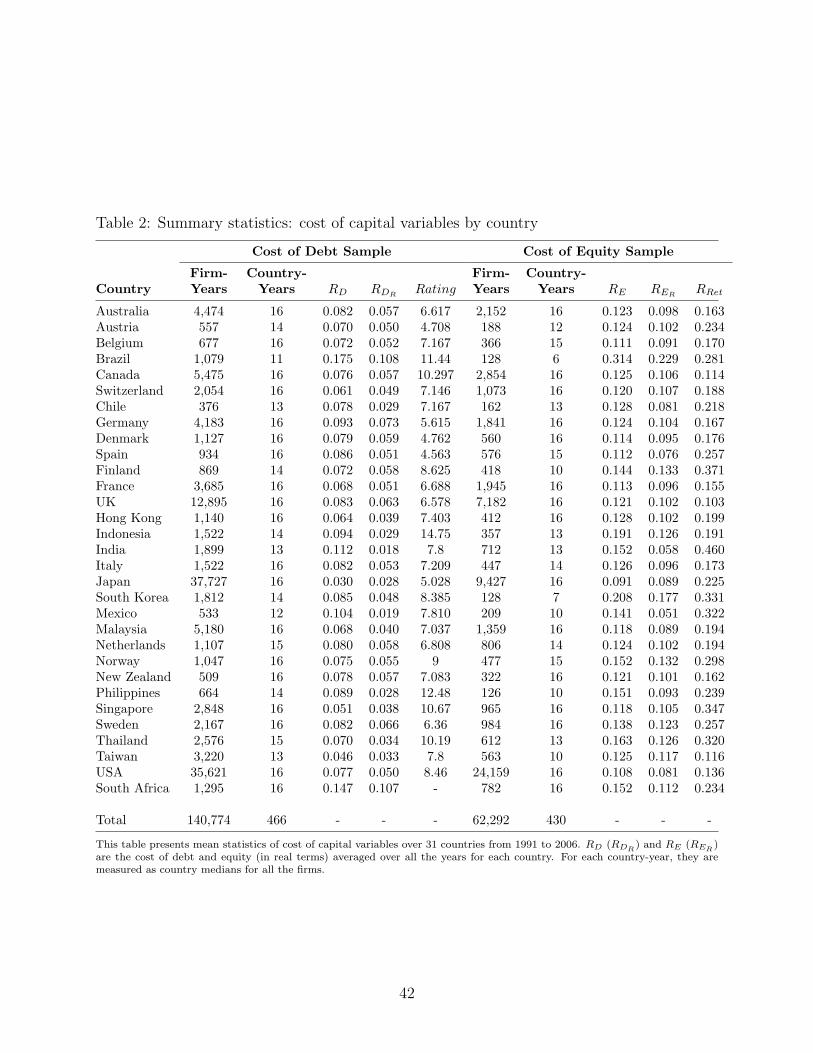
Table 2: Summary statistics: cost of capital variables by country
Cost of Debt Sample Cost of Equity Sample
Firm- Country- Firm- Country-Country Years Years RD RDR
Rating Years Years RE RERRRet
Australia 4,474 16 0.082 0.057 6.617 2,152 16 0.123 0.098 0.163Austria 557 14 0.070 0.050 4.708 188 12 0.124 0.102 0.234Belgium 677 16 0.072 0.052 7.167 366 15 0.111 0.091 0.170Brazil 1,079 11 0.175 0.108 11.44 128 6 0.314 0.229 0.281Canada 5,475 16 0.076 0.057 10.297 2,854 16 0.125 0.106 0.114Switzerland 2,054 16 0.061 0.049 7.146 1,073 16 0.120 0.107 0.188Chile 376 13 0.078 0.029 7.167 162 13 0.128 0.081 0.218Germany 4,183 16 0.093 0.073 5.615 1,841 16 0.124 0.104 0.167Denmark 1,127 16 0.079 0.059 4.762 560 16 0.114 0.095 0.176Spain 934 16 0.086 0.051 4.563 576 15 0.112 0.076 0.257Finland 869 14 0.072 0.058 8.625 418 10 0.144 0.133 0.371France 3,685 16 0.068 0.051 6.688 1,945 16 0.113 0.096 0.155UK 12,895 16 0.083 0.063 6.578 7,182 16 0.121 0.102 0.103Hong Kong 1,140 16 0.064 0.039 7.403 412 16 0.128 0.102 0.199Indonesia 1,522 14 0.094 0.029 14.75 357 13 0.191 0.126 0.191India 1,899 13 0.112 0.018 7.8 712 13 0.152 0.058 0.460Italy 1,522 16 0.082 0.053 7.209 447 14 0.126 0.096 0.173Japan 37,727 16 0.030 0.028 5.028 9,427 16 0.091 0.089 0.225South Korea 1,812 14 0.085 0.048 8.385 128 7 0.208 0.177 0.331Mexico 533 12 0.104 0.019 7.810 209 10 0.141 0.051 0.322Malaysia 5,180 16 0.068 0.040 7.037 1,359 16 0.118 0.089 0.194Netherlands 1,107 15 0.080 0.058 6.808 806 14 0.124 0.102 0.194Norway 1,047 16 0.075 0.055 9 477 15 0.152 0.132 0.298New Zealand 509 16 0.078 0.057 7.083 322 16 0.121 0.101 0.162Philippines 664 14 0.089 0.028 12.48 126 10 0.151 0.093 0.239Singapore 2,848 16 0.051 0.038 10.67 965 16 0.118 0.105 0.347Sweden 2,167 16 0.082 0.066 6.36 984 16 0.138 0.123 0.257Thailand 2,576 15 0.070 0.034 10.19 612 13 0.163 0.126 0.320Taiwan 3,220 13 0.046 0.033 7.8 563 10 0.125 0.117 0.116USA 35,621 16 0.077 0.050 8.46 24,159 16 0.108 0.081 0.136South Africa 1,295 16 0.147 0.107 - 782 16 0.152 0.112 0.234
Total 140,774 466 - - - 62,292 430 - - -
This table presents mean statistics of cost of capital variables over 31 countries from 1991 to 2006. RD (RDR) and RE (RER
)are the cost of debt and equity (in real terms) averaged over all the years for each country. For each country-year, they aremeasured as country medians for all the firms.
42

Table 3: Correlation matrix for cost of capital measures
Variables RCT RGLS ROJ RPEG RRet RD Rating
RE 0.915§ 0.860§ 0.961§ 0.966§ 0.089 0.438§ 0.236§
RCT - 0.790§ 0.888§ 0.858§ 0.101† 0.490§ 0.243§
RGLS - - 0.761§ 0.783§ 0.009 0.369§ 0.159§
ROJ - - - 0.966§ 0.119‡ 0.417§ 0.248§
RPEG - - - - 0.070 0.390§ 0.255§
RRet - - - - - 0.026 0.057
RD - - - - - - 0.238§
RCT , RGLS , ROJ and RPEG are derived as the internal rate of return in the Claus and Thomas (2001), the Gebhardt, Lee,and Swaminathan (2001), the Ohlson and Juettner-Nauroth (2005) and the Easton (2004) models, respectively. These modelsare described in detail in Appendix A. All variables are defined in Appendix B. §, ‡ and † indicate 1%, 5%, and 10% significance,respectively.
Table 4: Pearson correlation for regression variables
Variables β2 + β3 β3 IncR2 N
RD -0.210§ -0.210§ -0.171§ 466
Rating -0.181§ -0.200§ -0.149§ 280
RE -0.271§ -0.311§ -0.330§ 430
RRet -0.138‡ -0.201§ -0.257§ 430
LAW 0.415§ 0.500§ 0.504§ 31
SECREG -0.113 -0.072 0.045 31
FLOW 0.364‡ 0.464§ 0.368§ 31
CRED -0.124 -0.157 -0.263 31
β2 +β3, β3 and IncR2 are three alternative measures for conservatism, estimated by using all the firms within each country overthe period 1991 to 2006. All variables are defined in Appendix B. §, ‡ and † indicate 1%, 5%, and 10% significance, respectively.
43

Table 5: Distributional statistics for regression variables
Panel A: Cost of debt sample
Variable N Mean Min. Q1 Median Q3 Max. Std. dev.
RD 466 0.080 0.017 0.060 0.075 0.092 0.372 0.033
β2 + β3 466 0.416 0.069 0.314 0.435 0.514 0.706 0.146
β3 466 0.352 0.010 0.242 0.381 0.488 0.616 0.155
IncR2 466 0.037 0.005 0.018 0.036 0.061 0.073 0.022
BTM 466 0.870 0.003 0.571 0.738 0.990 4.309 0.524
LEVERAGE 466 0.258 0.090 0.211 0.254 0.290 0.650 0.076
STDRET 466 0.104 0.042 0.078 0.096 0.118 0.325 0.038
STDEARN 466 0.030 0.005 0.018 0.027 0.037 0.097 0.015
SIZE 466 7.410 3.583 5.662 6.734 8.578 14.26 2.437
INTCOV 466 3.40 0.283 2.037 3.080 4.304 13.152 1.903
GROWTH 466 0.082 -0.100 0.039 0.077 0.117 0.409 0.066
ROA 466 0.036 -0.091 0.023 0.035 0.050 0.095 0.020
INF 466 0.030 -0.039 0.014 0.023 0.037 0.206 0.029
Rating 280 7.597 1 5 8 9 17 3.018
Panel B: Cost of equity sample
Variable N Mean Min. Q1 Median Q3 Max. Std. dev.
RE 430 0.132 0.058 0.111 0.124 0.144 0.454 0.038
β2 + β3 430 0.423 0.069 0.314 0.435 0.514 0.706 0.141
β3 430 0.360 0.010 0.242 0.381 0.488 0.616 0.152
IncR2 430 0.039 0.005 0.018 0.037 0.061 0.073 0.022
BTM 430 0.649 0.002 0.495 0.596 0.758 3.137 0.269
LEVERAGE 430 0.228 0.054 0.180 0.225 0.269 0.601 0.072
STDRET 430 0.097 0.053 0.075 0.090 0.110 0.286 0.033
STDEARN 430 0.026 0.005 0.017 0.024 0.032 0.072 0.011
SIZE 430 8.073 4.829 6.134 7.307 9.414 14.94 2.514
FBIAS 430 0.007 -0.026 -0.000 0.002 0.006 0.362 0.025
INF 430 0.029 -0.039 0.014 0.022 0.035 0.206 0.029
RRet 307 0.212 0.002 0.070 0.175 0.298 0.931 0.172
Panels A and B present descriptive statistics of regression variables over 31 countries from 1991 to 2006 for the cost of debtand equity samples, respectively. β2 + β3, β3 and IncR2 are three alternative measures for conservatism, estimated by usingall the firms within each country over the period 1991 to 2006. Country-year medians are used for the computations of othervariables. All variables are defined in Appendix B.
44

Tab
le6:
Reg
ress
ion
anal
ysi
sof
cost
ofca
pit
alon
conse
rvat
ism
Cos
tof
Deb
t(R
D)
Cos
tof
Equ
ity
(RE
)
Var
iab
les
β2
+β
3β
3IncR
2β
2+β
3β
3IncR
2
Coeff
.p-v
alu
eC
oeff
.p-v
alu
eC
oeff
.p-v
alu
eC
oeff
.p-v
alu
eC
oeff
.p-v
alu
eC
oeff
.p-v
alu
e
CO
NS
ER
V-0.0
59§
(0.0
0)-0.0
53§
(0.0
0)-0.2
34‡
(0.0
2)-0.0
51§
(0.0
1)-0.0
42§
(0.0
0)-0.3
74§
(0.0
0)
BT
M-0
.002
(0.3
6)-0
.002
(0.3
2)-0
.005
(0.2
1)0.
010
(0.2
1)0.
010
(0.2
4)0.
006
(0.3
3)
LE
VE
RA
GE
-0.1
35§
(0.0
0)-0.1
41§
(0.0
0)-0.1
27§
(0.0
0)0.
061‡
(0.0
3)0.
063‡
(0.0
2)0.
071§
(0.0
1)
STD
RE
T0.
078†
(0.0
7)0.
074†
(0.0
9)0.
082†
(0.0
6)0.
100†
(0.0
6)0.
096†
(0.0
6)0.
073
(0.1
1)
STD
EA
RN
0.22
8§(0
.01)
0.19
7‡(0
.03)
0.16
2†(0
.06)
1.05
0§(0
.00)
1.01
7§(0
.00)
1.03
8§(0
.00)
SIZ
E-0
.001
(0.1
2)-0
.001
(0.2
1)0.
001
(0.2
8)-0
.001
(0.2
0)-0
.000
4(0
.34)
-0.0
01(0
.15)
INT
CO
V-0.0
06§
(0.0
0)-0.0
07§
(0.0
0)-0.0
07§
(0.0
0)-
--
--
-
GR
OW
TH
0.04
2(0
.13)
0.04
2(0
.13)
0.03
2(0
.82)
--
--
--
RO
A0.
123
(0.1
3)0.
092
(0.2
1)0.
107
(0.1
7)-
--
--
-
FB
IAS
--
--
--
0.16
2‡(0
.03)
0.15
9‡(0
.04)
0.15
2‡(0
.04)
INF
0.17
5‡(0
.02)
0.19
6§(0
.01)
0.20
8§(0
.01)
0.29
5§(0
.01)
0.31
1§(0
.01)
0.30
9§(0
.01)
CIV
CO
M-0.0
20§
(0.0
0)-0.0
20§
(0.0
0)-0.0
17§
(0.0
0)-0
.002
(0.3
4)-0
.003
(0.3
1)0.
001
(0.4
0)
CR
ED
-0.0
05§
(0.0
0)-0.0
05§
(0.0
0)-0.0
05§
(0.0
0)-
--
--
-
LA
W-0.0
13§
(0.0
0)-0.0
12§
(0.0
0)-0.0
12§
(0.0
0)-0.0
07‡
(0.0
4)-0.0
06†
(0.0
7)-0
.004
(0.1
9)
SEC
RE
G-0.1
28§
(0.0
0)-0.1
22§
(0.0
0)-0.1
08§
(0.0
0)-0.1
02§
(0.0
0)-0.0
93§
(0.0
0)-0.0
93§
(0.0
0)
FL
OW
-0.0
45§
(0.0
0)-0.0
43‡
(0.0
2)-0.0
43‡
(0.0
3)-0.0
52‡
(0.0
2)-0.0
47§
(0.0
2)-0.0
59§
(0.0
1)
SEC
RE
G*F
LO
W0.
083§
(0.0
0)0.
080§
(0.0
0)0.
072§
(0.0
1)0.
086§
(0.0
1)0.
080§
(0.0
1)0.
093§
(0.0
1)
Yea
rdu
mm
ies
Yes
Yes
Yes
Yes
Yes
Yes
Adj
-R2
52.2
%51
.2%
49.0
%47
.1%
46.5
%47
.3%
Th
eco
stof
deb
t(e
qu
ity)
sam
ple
com
pri
ses
466
(430)
cou
ntr
y-y
ear
med
ian
sfr
om
31
cou
ntr
ies
over
1991
to2006.
Th
eta
ble
rep
ort
sO
LS
regre
ssio
nco
effici
ents
an
d,
inp
are
nth
eses
,on
e-ta
iled
p-v
alu
esbase
don
stand
ard
erro
rs,
ad
just
edfo
rN
ewey
-Wes
th
eter
osc
edast
icit
yan
dau
toco
rrel
ati
on
.β2
+β3,β3
an
dIncR
2are
thre
ealt
ern
ati
ve
mea
sure
sfo
rco
nse
rvati
sm,
esti
mate
dby
usi
ng
all
the
firm
sw
ith
inea
chco
untr
yover
the
per
iod
1991
to2006.
All
vari
ab
les
are
defi
ned
inA
pp
end
ixB
.§,‡
an
d†
ind
icate
1%
,5%
,an
d10%
sign
ifica
nce
,re
spec
tivel
y.
45
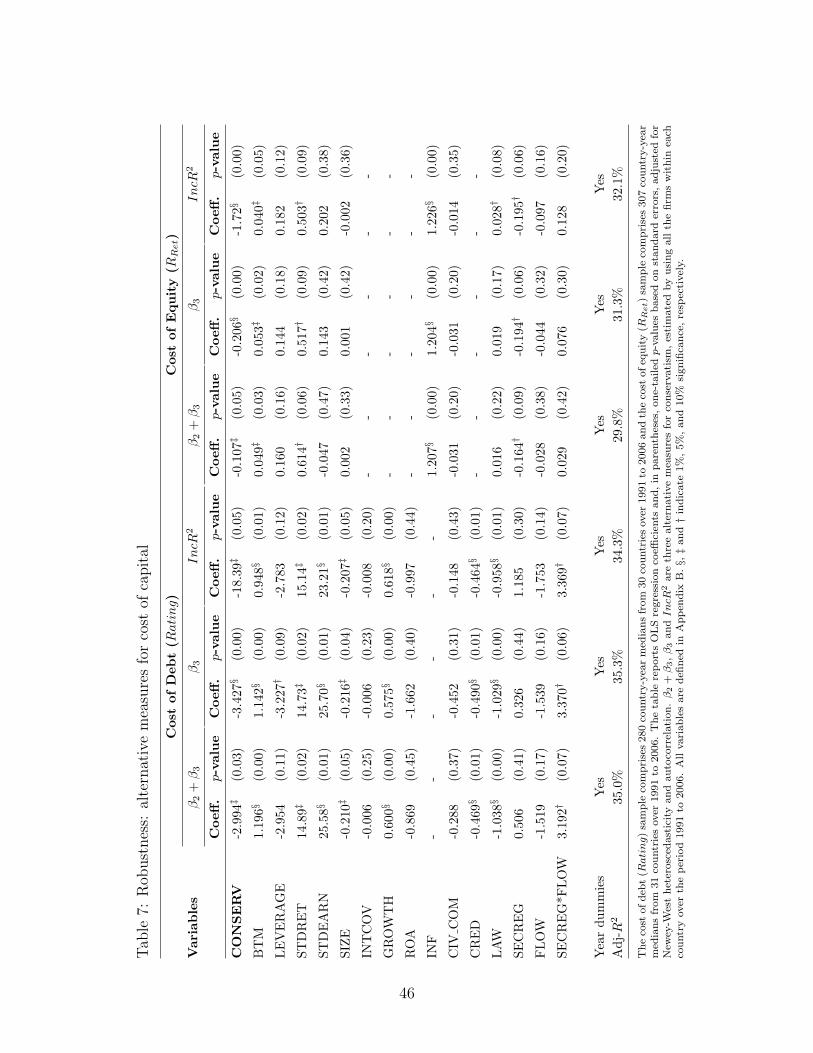
Tab
le7:
Rob
ust
nes
s:al
tern
ativ
em
easu
res
for
cost
ofca
pit
al
Cos
tof
Deb
t(Rating)
Cos
tof
Equ
ity
(RR
et)
Var
iab
les
β2
+β
3β
3IncR
2β
2+β
3β
3IncR
2
Coeff
.p-v
alu
eC
oeff
.p-v
alu
eC
oeff
.p-v
alu
eC
oeff
.p-v
alu
eC
oeff
.p-v
alu
eC
oeff
.p-v
alu
e
CO
NS
ER
V-2.9
94‡
(0.0
3)-3.4
27§
(0.0
0)-1
8.39‡
(0.0
5)-0.1
07‡
(0.0
5)-0.2
06§
(0.0
0)-1.7
2§(0
.00)
BT
M1.
196§
(0.0
0)1.
142§
(0.0
0)0.
948§
(0.0
1)0.
049‡
(0.0
3)0.
053‡
(0.0
2)0.
040‡
(0.0
5)
LE
VE
RA
GE
-2.9
54(0
.11)
-3.2
27†
(0.0
9)-2
.783
(0.1
2)0.
160
(0.1
6)0.
144
(0.1
8)0.
182
(0.1
2)
STD
RE
T14.8
9‡(0
.02)
14.7
3‡(0
.02)
15.1
4‡(0
.02)
0.61
4†(0
.06)
0.51
7†(0
.09)
0.50
3†(0
.09)
STD
EA
RN
25.5
8§(0
.01)
25.7
0§(0
.01)
23.2
1§(0
.01)
-0.0
47(0
.47)
0.14
3(0
.42)
0.20
2(0
.38)
SIZ
E-0.2
10‡
(0.0
5)-0.2
16‡
(0.0
4)-0.2
07‡
(0.0
5)0.
002
(0.3
3)0.
001
(0.4
2)-0
.002
(0.3
6)
INT
CO
V-0
.006
(0.2
5)-0
.006
(0.2
3)-0
.008
(0.2
0)-
--
--
-
GR
OW
TH
0.60
0§(0
.00)
0.57
5§(0
.00)
0.61
8§(0
.00)
--
--
--
RO
A-0
.869
(0.4
5)-1
.662
(0.4
0)-0
.997
(0.4
4)-
--
--
-
INF
--
--
--
1.20
7§(0
.00)
1.20
4§(0
.00)
1.22
6§(0
.00)
CIV
CO
M-0
.288
(0.3
7)-0
.452
(0.3
1)-0
.148
(0.4
3)-0
.031
(0.2
0)-0
.031
(0.2
0)-0
.014
(0.3
5)
CR
ED
-0.4
69§
(0.0
1)-0.4
90§
(0.0
1)-0.4
64§
(0.0
1)-
--
--
-
LA
W-1.0
38§
(0.0
0)-1.0
29§
(0.0
0)-0.9
58§
(0.0
1)0.
016
(0.2
2)0.
019
(0.1
7)0.
028†
(0.0
8)
SEC
RE
G0.
506
(0.4
1)0.
326
(0.4
4)1.
185
(0.3
0)-0.1
64†
(0.0
9)-0.1
94†
(0.0
6)-0.1
95†
(0.0
6)
FL
OW
-1.5
19(0
.17)
-1.5
39(0
.16)
-1.7
53(0
.14)
-0.0
28(0
.38)
-0.0
44(0
.32)
-0.0
97(0
.16)
SEC
RE
G*F
LO
W3.
192†
(0.0
7)3.
370†
(0.0
6)3.
369†
(0.0
7)0.
029
(0.4
2)0.
076
(0.3
0)0.
128
(0.2
0)
Yea
rdu
mm
ies
Yes
Yes
Yes
Yes
Yes
Yes
Adj
-R2
35.0
%35
.3%
34.3
%29
.8%
31.3
%32
.1%
Th
eco
stof
deb
t(Rating)
sam
ple
com
pri
ses
280
cou
ntr
y-y
ear
med
ian
sfr
om
30
cou
ntr
ies
over
1991
to2006
an
dth
eco
stof
equ
ity
(RR
et)
sam
ple
com
pri
ses
307
cou
ntr
y-y
ear
med
ian
sfr
om
31
cou
ntr
ies
over
1991
to2006.
Th
eta
ble
rep
ort
sO
LS
regre
ssio
nco
effici
ents
and
,in
pare
nth
eses
,on
e-ta
iled
p-v
alu
esb
ase
don
stan
dard
erro
rs,
ad
just
edfo
rN
ewey
-Wes
th
eter
osc
edast
icit
yan
dau
toco
rrel
ati
on
.β2
+β3,β3
an
dIncR
2are
thre
ealt
ern
ati
ve
mea
sure
sfo
rco
nse
rvati
sm,
esti
mate
dby
usi
ng
all
the
firm
sw
ith
inea
chco
untr
yover
the
per
iod
1991
to2006.
All
vari
ab
les
are
defi
ned
inA
pp
end
ixB
.§,‡
an
d†
ind
icate
1%
,5%
,an
d10%
sign
ifica
nce
,re
spec
tivel
y.
46

Table 8: Robustness: country risk indices and risk-free rate
Panel A: Country risk indices as proxies for cost of capital
Credit risk(RCredit) Financial risk(RFinancial)
β2 + β3 β3 β2 + β3 β3
CONSERV -0.152§ (0.00) -0.143§ (0.00) -0.217§ (0.00) -0.270§ (0.00)
N 324 324 120 120Adj-R2 89.1% 88.8% 88.7% 89.5%
Panel B: Using risk-free rates (Rf) to replace inflation rates
Cost of debt(RD) Cost of equity(RE)
β2 + β3 β3 β2 + β3 β3
CONSERV -0.028‡ (0.02) -0.028‡ (0.02) -0.041§ (0.01) -0.037§ (0.00)
N 456 456 420 420Adj-R2 65.0% 65.0% 49.1% 48.9%
Panel A presents OLS regression results of country risk indices on conservatism and control variables as in Equation (4). Creditrisk sample comprises 324 country-year medians from 31 countries over 1996 to 2006. Financial risk sample comprises 120country-year medians from 30 country over 2001 to 2006. Panel B presents OLS regression results of cost of debt and equity onconservatism and control variables as in Equations (4) and (5) by replacing inflation rate with risk-free rate. β2 +β3 and β3 aretwo measures for conservatism, estimated by using all the firms within each country over the period 1991 to 2006. One-tailedp-values are based on standard errors, adjusted for Newey-West heteroscedasticity and autocorrelation. Year dummies areincluded in all regressions. Coefficients and one-tailed p-values for other regression variables are omitted. §, ‡ and † indicate1%, 5%, and 10% significance, respectively.
47

Table 9: Robustness: conservatism measures using alternative cumulating horizons
Panel A: Cost of debt (RD)
Cumulating horizon
j = 3 j = 2 j = 1 j = 0
CONSERV(β2 + β3) -0.052§ -0.064§ -0.059§ -0.037§
p-value (0.00) (0.00) (0.00) (0.01)
Adj-R2 59.8% 54.8% 52.2% 48.5%
CONSERV(β3) -0.034§ -0.056§ -0.053§ -0.022†
p-value (0.00) (0.00) (0.00) (0.04)
Adj-R2 57.9% 52.3% 51.2% 47.9%
N 408 452 466 490
Panel B: Cost of equity (RE)
Cumulating horizon
j = 3 j = 2 j = 1 j = 0
CONSERV(β2 + β3) -0.025‡ -0.039§ -0.051§ -0.047§
p-value (0.02) (0.01) (0.01) (0.01)
Adj-R2 59.0% 47.1% 47.1% 45.5%
CONSERV(β3) -0.007 -0.029§ -0.042§ -0.031‡
p-value (0.21) (0.00) (0.00) (0.02)
Adj-R2 58.3% 46.1% 46.5% 44.8%
N 377 418 430 448
Panels A and B presents OLS regression results of cost of debt and equity on conservatism, respectively. β2 + β3 and β3 areestimated from Equation (2) by using all the firms within each country over the period 1991 to 2006. Cumulating horizons 0,1, 2, and 3 indicate that earnings and stock returns are cumulated over one, two, three and four years, respectively. One-tailedp-values are based on standard errors, adjusted for Newey-West heteroscedasticity and autocorrelation. Year dummies areincluded in all regressions. Coefficients and p-values for other regression variables are omitted. §, ‡ and † indicate 1%, 5%, and10% significance, respectively.
48

Table 10: Robustness: conservatism measures from non-price-based model
Cost of debt(RD) Cost of equity(RE)
Variables β3 IncR2 β3 IncR2
Coeff. p-value Coeff. p-value Coeff. p-value Coeff. p-value
CONSERV -0.021§ (0.01) -0.098‡ (0.02) -0.031§ (0.00) -0.221§ (0.00)
BTM -0.003 (0.29) -0.004 (0.22) 0.011 (0.22) 0.007 (0.31)
LEVERAGE -0.110§ (0.00) -0.109§ (0.00) 0.069‡ (0.02) 0.086§ (0.00)
STDRET 0.114‡ (0.03) 0.102‡ (0.04) 0.150§ (0.01) 0.122‡ (0.03)
STDEARN 0.136† (0.09) 0.182‡ (0.04) 1.033§ (0.00) 1.154§ (0.00)
SIZE -0.0002 (0.40) -0.000 (0.48) -0.0001 (0.43) -0.0002 (0.43)
INTCOV -0.006§ (0.00) -0.006§ (0.00) - - - -
GROWTH 0.029 (0.22) 0.024 (0.27) - - - -
ROA 0.100 (0.16) 0.107 (0.15) - - - -
FBIAS - - - - 0.163‡ (0.04) 0.149‡ (0.03)
INF 0.195‡ (0.02) 0.196‡ (0.02) 0.295§ (0.01) 0.268‡ (0.02)
CIV COM -0.016§ (0.01) -0.020§ (0.00) 0.002 (0.36) -0.004 (0.24)
CRED -0.005§ (0.00) -0.005§ (0.00) - - - -
LAW -0.015§ (0.00) -0.013§ (0.00) -0.008‡ (0.03) -0.003 (0.20)
SECREG -0.092§ (0.00) -0.094§ (0.00) -0.071§ (0.01) -0.076§ (0.01)
FLOW -0.035‡ (0.04) -0.035‡ (0.04) -0.047‡ (0.03) -0.055§ (0.01)
SECREG*FLOW 0.056‡ (0.03) 0.055‡ (0.03) 0.068‡ (0.03) 0.073‡ (0.02)
Year dummies Yes Yes Yes YesAdj-R2 48.9% 48.5% 46.4% 48.0%
Cost of debt (equity) sample comprises 466 (430) country-year medians from 31 countries over 1991 to 2006. The tablereports OLS regression coefficients and, in parentheses, one-tailed p-values based on standard errors, adjusted for Newey-Westheteroscedasticity and autocorrelation. β3 is estimated from Equation (6). IncR2 is estimated from Equations (6) and (7). Allother variables are defined in Appendix B. §, ‡ and † indicate 1%, 5%, and 10% significance, respectively.
49
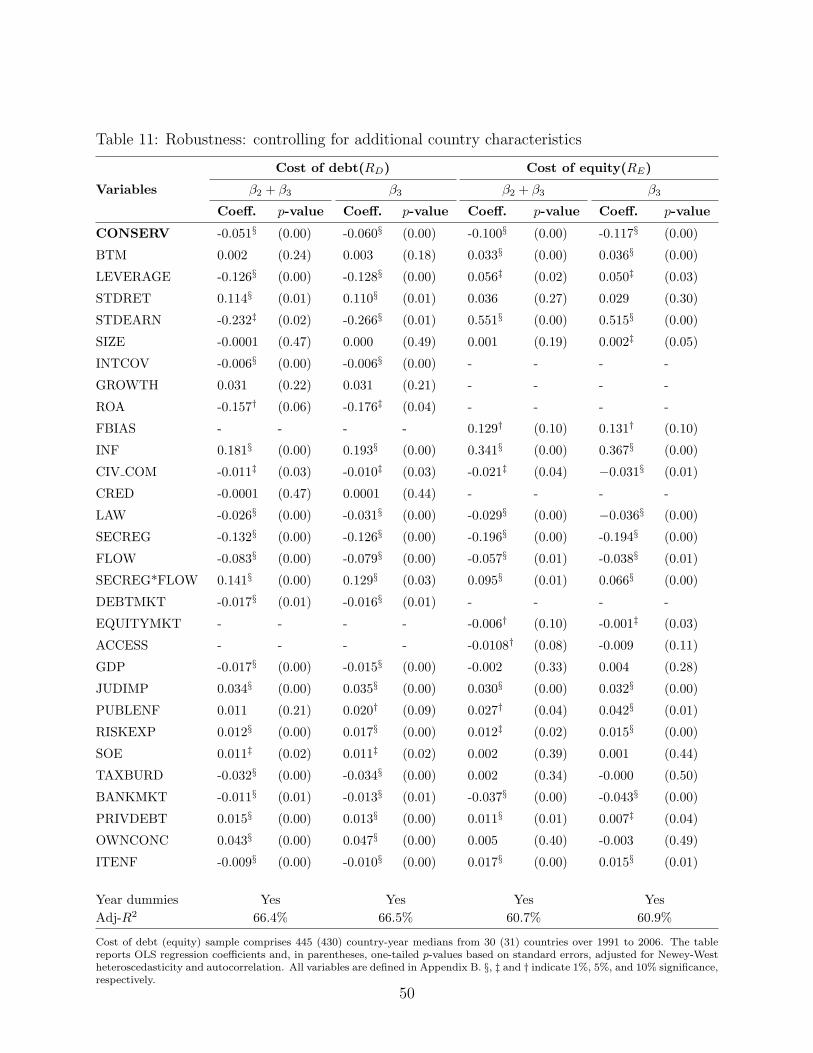
Table 11: Robustness: controlling for additional country characteristics
Cost of debt(RD) Cost of equity(RE)
Variables β2 + β3 β3 β2 + β3 β3
Coeff. p-value Coeff. p-value Coeff. p-value Coeff. p-value
CONSERV -0.051§ (0.00) -0.060§ (0.00) -0.100§ (0.00) -0.117§ (0.00)
BTM 0.002 (0.24) 0.003 (0.18) 0.033§ (0.00) 0.036§ (0.00)
LEVERAGE -0.126§ (0.00) -0.128§ (0.00) 0.056‡ (0.02) 0.050‡ (0.03)
STDRET 0.114§ (0.01) 0.110§ (0.01) 0.036 (0.27) 0.029 (0.30)
STDEARN -0.232‡ (0.02) -0.266§ (0.01) 0.551§ (0.00) 0.515§ (0.00)
SIZE -0.0001 (0.47) 0.000 (0.49) 0.001 (0.19) 0.002‡ (0.05)
INTCOV -0.006§ (0.00) -0.006§ (0.00) - - - -
GROWTH 0.031 (0.22) 0.031 (0.21) - - - -
ROA -0.157† (0.06) -0.176‡ (0.04) - - - -
FBIAS - - - - 0.129† (0.10) 0.131† (0.10)
INF 0.181§ (0.00) 0.193§ (0.00) 0.341§ (0.00) 0.367§ (0.00)
CIV COM -0.011‡ (0.03) -0.010‡ (0.03) -0.021‡ (0.04) −0.031§ (0.01)
CRED -0.0001 (0.47) 0.0001 (0.44) - - - -
LAW -0.026§ (0.00) -0.031§ (0.00) -0.029§ (0.00) −0.036§ (0.00)
SECREG -0.132§ (0.00) -0.126§ (0.00) -0.196§ (0.00) -0.194§ (0.00)
FLOW -0.083§ (0.00) -0.079§ (0.00) -0.057§ (0.01) -0.038§ (0.01)
SECREG*FLOW 0.141§ (0.00) 0.129§ (0.03) 0.095§ (0.01) 0.066§ (0.00)
DEBTMKT -0.017§ (0.01) -0.016§ (0.01) - - - -
EQUITYMKT - - - - -0.006† (0.10) -0.001‡ (0.03)
ACCESS - - - - -0.0108† (0.08) -0.009 (0.11)
GDP -0.017§ (0.00) -0.015§ (0.00) -0.002 (0.33) 0.004 (0.28)
JUDIMP 0.034§ (0.00) 0.035§ (0.00) 0.030§ (0.00) 0.032§ (0.00)
PUBLENF 0.011 (0.21) 0.020† (0.09) 0.027† (0.04) 0.042§ (0.01)
RISKEXP 0.012§ (0.00) 0.017§ (0.00) 0.012‡ (0.02) 0.015§ (0.00)
SOE 0.011‡ (0.02) 0.011‡ (0.02) 0.002 (0.39) 0.001 (0.44)
TAXBURD -0.032§ (0.00) -0.034§ (0.00) 0.002 (0.34) -0.000 (0.50)
BANKMKT -0.011§ (0.01) -0.013§ (0.01) -0.037§ (0.00) -0.043§ (0.00)
PRIVDEBT 0.015§ (0.00) 0.013§ (0.00) 0.011§ (0.01) 0.007‡ (0.04)
OWNCONC 0.043§ (0.00) 0.047§ (0.00) 0.005 (0.40) -0.003 (0.49)
ITENF -0.009§ (0.00) -0.010§ (0.00) 0.017§ (0.00) 0.015§ (0.01)
Year dummies Yes Yes Yes YesAdj-R2 66.4% 66.5% 60.7% 60.9%
Cost of debt (equity) sample comprises 445 (430) country-year medians from 30 (31) countries over 1991 to 2006. The tablereports OLS regression coefficients and, in parentheses, one-tailed p-values based on standard errors, adjusted for Newey-Westheteroscedasticity and autocorrelation. All variables are defined in Appendix B. §, ‡ and † indicate 1%, 5%, and 10% significance,respectively.
50
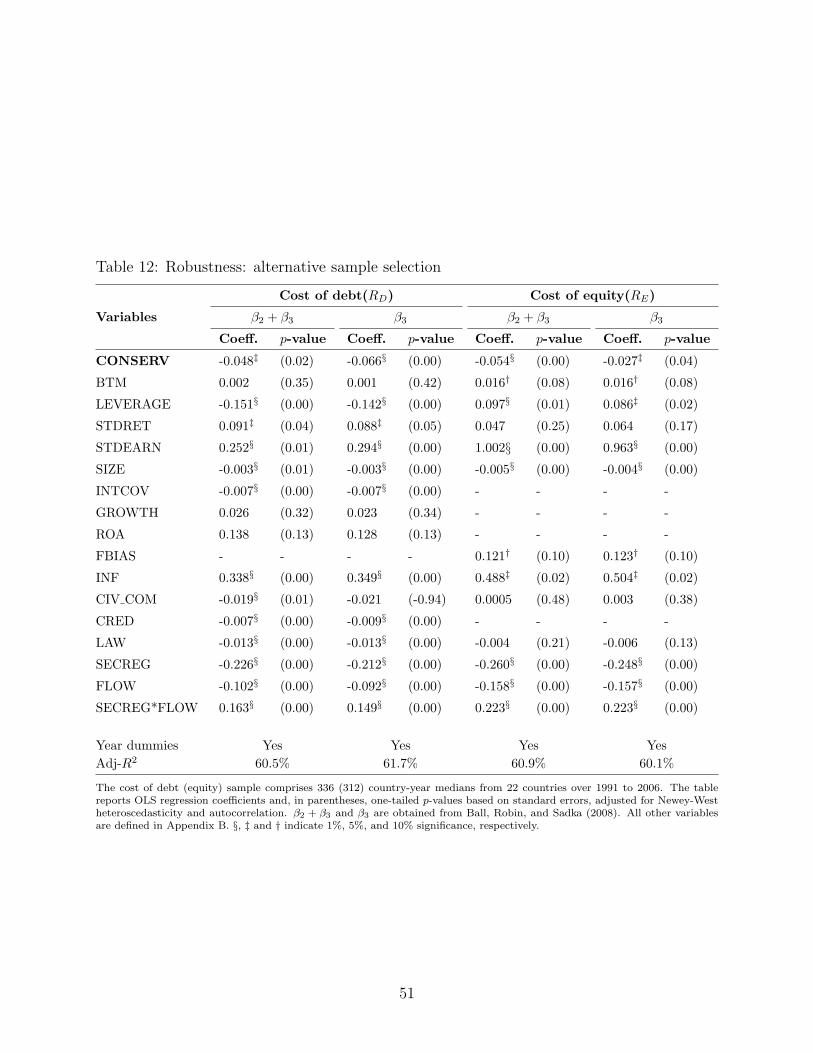
Table 12: Robustness: alternative sample selection
Cost of debt(RD) Cost of equity(RE)
Variables β2 + β3 β3 β2 + β3 β3
Coeff. p-value Coeff. p-value Coeff. p-value Coeff. p-value
CONSERV -0.048‡ (0.02) -0.066§ (0.00) -0.054§ (0.00) -0.027‡ (0.04)
BTM 0.002 (0.35) 0.001 (0.42) 0.016† (0.08) 0.016† (0.08)
LEVERAGE -0.151§ (0.00) -0.142§ (0.00) 0.097§ (0.01) 0.086‡ (0.02)
STDRET 0.091‡ (0.04) 0.088‡ (0.05) 0.047 (0.25) 0.064 (0.17)
STDEARN 0.252§ (0.01) 0.294§ (0.00) 1.002§ (0.00) 0.963§ (0.00)
SIZE -0.003§ (0.01) -0.003§ (0.00) -0.005§ (0.00) -0.004§ (0.00)
INTCOV -0.007§ (0.00) -0.007§ (0.00) - - - -
GROWTH 0.026 (0.32) 0.023 (0.34) - - - -
ROA 0.138 (0.13) 0.128 (0.13) - - - -
FBIAS - - - - 0.121† (0.10) 0.123† (0.10)
INF 0.338§ (0.00) 0.349§ (0.00) 0.488‡ (0.02) 0.504‡ (0.02)
CIV COM -0.019§ (0.01) -0.021 (-0.94) 0.0005 (0.48) 0.003 (0.38)
CRED -0.007§ (0.00) -0.009§ (0.00) - - - -
LAW -0.013§ (0.00) -0.013§ (0.00) -0.004 (0.21) -0.006 (0.13)
SECREG -0.226§ (0.00) -0.212§ (0.00) -0.260§ (0.00) -0.248§ (0.00)
FLOW -0.102§ (0.00) -0.092§ (0.00) -0.158§ (0.00) -0.157§ (0.00)
SECREG*FLOW 0.163§ (0.00) 0.149§ (0.00) 0.223§ (0.00) 0.223§ (0.00)
Year dummies Yes Yes Yes YesAdj-R2 60.5% 61.7% 60.9% 60.1%
The cost of debt (equity) sample comprises 336 (312) country-year medians from 22 countries over 1991 to 2006. The tablereports OLS regression coefficients and, in parentheses, one-tailed p-values based on standard errors, adjusted for Newey-Westheteroscedasticity and autocorrelation. β2 + β3 and β3 are obtained from Ball, Robin, and Sadka (2008). All other variablesare defined in Appendix B. §, ‡ and † indicate 1%, 5%, and 10% significance, respectively.
51
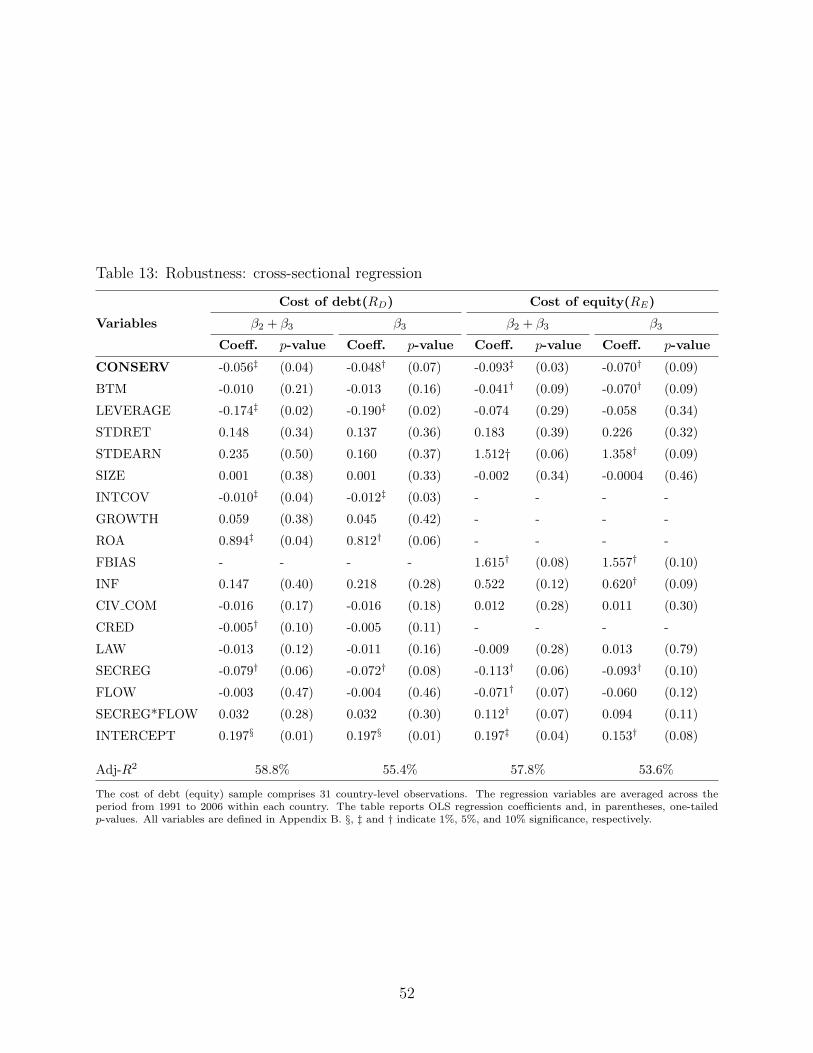
Table 13: Robustness: cross-sectional regression
Cost of debt(RD) Cost of equity(RE)
Variables β2 + β3 β3 β2 + β3 β3
Coeff. p-value Coeff. p-value Coeff. p-value Coeff. p-value
CONSERV -0.056‡ (0.04) -0.048† (0.07) -0.093‡ (0.03) -0.070† (0.09)
BTM -0.010 (0.21) -0.013 (0.16) -0.041† (0.09) -0.070† (0.09)
LEVERAGE -0.174‡ (0.02) -0.190‡ (0.02) -0.074 (0.29) -0.058 (0.34)
STDRET 0.148 (0.34) 0.137 (0.36) 0.183 (0.39) 0.226 (0.32)
STDEARN 0.235 (0.50) 0.160 (0.37) 1.512† (0.06) 1.358† (0.09)
SIZE 0.001 (0.38) 0.001 (0.33) -0.002 (0.34) -0.0004 (0.46)
INTCOV -0.010‡ (0.04) -0.012‡ (0.03) - - - -
GROWTH 0.059 (0.38) 0.045 (0.42) - - - -
ROA 0.894‡ (0.04) 0.812† (0.06) - - - -
FBIAS - - - - 1.615† (0.08) 1.557† (0.10)
INF 0.147 (0.40) 0.218 (0.28) 0.522 (0.12) 0.620† (0.09)
CIV COM -0.016 (0.17) -0.016 (0.18) 0.012 (0.28) 0.011 (0.30)
CRED -0.005† (0.10) -0.005 (0.11) - - - -
LAW -0.013 (0.12) -0.011 (0.16) -0.009 (0.28) 0.013 (0.79)
SECREG -0.079† (0.06) -0.072† (0.08) -0.113† (0.06) -0.093† (0.10)
FLOW -0.003 (0.47) -0.004 (0.46) -0.071† (0.07) -0.060 (0.12)
SECREG*FLOW 0.032 (0.28) 0.032 (0.30) 0.112† (0.07) 0.094 (0.11)
INTERCEPT 0.197§ (0.01) 0.197§ (0.01) 0.197‡ (0.04) 0.153† (0.08)
Adj-R2 58.8% 55.4% 57.8% 53.6%
The cost of debt (equity) sample comprises 31 country-level observations. The regression variables are averaged across theperiod from 1991 to 2006 within each country. The table reports OLS regression coefficients and, in parentheses, one-tailedp-values. All variables are defined in Appendix B. §, ‡ and † indicate 1%, 5%, and 10% significance, respectively.
52