ACCIDENTS AT MAINTENANCE AND UTILITY WORK … · AT MAINTENANCE AND UTILITY WORK by Bradley T....
50
VEHICLE ACCIDENTS AT MAINTENANCE AND UTILITY WORK by Bradley T. Hargroves Faculty Research Engineer ZONES (The opinions, findings, and conclusions expmessed mepomt are those of the author and not necessamily the sponsoming agencies.) in this those of Virginia Highway & Transportation Research (A Cooperative Organization Sponsored Jointly by Department of Highways & Transportation the University of Virginia) Council the Virginia and In Cooperation with the U. S. Federal Highway Department of Transportation Administration Charlottesville, Virginia October 1978 VHTRC 79-R22
Transcript of ACCIDENTS AT MAINTENANCE AND UTILITY WORK … · AT MAINTENANCE AND UTILITY WORK by Bradley T....

VEHICLE ACCIDENTS AT MAINTENANCE AND UTILITY WORK
by
Bradley T. Hargroves Faculty Research Engineer
ZONES
(The opinions, findings, and conclusions expmessed mepomt are those of the author and not necessamily
the sponsoming agencies.)
in this those of
Virginia Highway & Transportation Research (A Cooperative Organization Sponsored Jointly by
Department of Highways & Transportation the University of Virginia)
Council the Virginia and
In Cooperation with the U. S. Federal Highway
Department of Transportation Administration
Charlottesville, Virginia
October 1978 VHTRC 79-R22

M.AINTENANCZ RESEA2.CH ADVISORY COMMITTEE
MR. C. M. CLARKE, Chairman, Asst. Dist:ict Engineer, VDHST
MR. D. R. COLLINS, Resident Engineer, VDH%T
MR. R. H. CONNOCK, JR., Asst. District Engineer, VDHST
ME. J. A. COPP, Residency Maintenance Supervisor, VDHST
MR. W. L. HAYDEN, Asst. Materials Engineer, VDH$T
MR. C. 0. LF.IGH, Maintenance Engineer, VDHgT
.MR. J. C. MCCABE, Area Engineer, FHWA
MR. J. K. MCEWEN, Residen• Engineer, VDHST
MR. D. C. MAHONE, Senior Research Scientist, VH$TRC
MR. J. R. MILLER, Equipment Engineer, VDHgT
MR. R. L. M00R•, Resident Engineer, VDH•T
-MR. C. B. PERRY, Resident Engineer, VDH•T
MR. D. S. ROOSEVELT, Resident Engineer, VDHET
MR. M. B. VANN, Ass=. Cons•=uction Engineer, VDHST
MR. J. E. WILLIAMS, Asst. DisZ.-ict Engineer, VDHST
SAFETY RESEARCH ADVISORY COMMITTEE
MR. R. W. DUVAL, Chairman, Deputy Director, Virginia Department of Transportation Safety
MR. FR7%NK ALTOBELLI, Regional Administrator, National Highway Traffic Safety Administration
MAJOR C. M. BOLDIN, Investigation and Planning Supervisor, Virginia Department of State Police
MR. WALTER E. DOUGLAS, Assistant Director, Virginia Department of Transportation Safe•y
MR. WAYNE S. FERGUSON, Assistant Head, Virginia Highway and Transportation
Research Council
MR. J. L. HAZELWOOD, JR., Driver Services Administrator, Virginia Division of Motom Vehicles
MR. C. P. HEITZLER, JR., Program Manager, Division of Management Analysis and Systems Development
JULIAN K. HICLMAN, VASAP Evaiuator, Virginia Department of TransporTation Safety
MR. BILLY G. JOHNSON, Supervisor, Driver Education, StaTe Department of Education
MR. HIRAM R. JOHNSON, Management Information Systems Director, Office of Secretary of Transportation
MR. DAVID 0. MCALLISTER, Traffic Engineer, Virginia DeparTment of Transportation Safe•.y
MR. R. F. ]{CCARTY, Safety Program Coomdinator, Fedemal Highway Administration
MR. R. M. MCDONALD, Project Director, Highway Safety Training Center, AdminisTration of Justice and Public Safety
MR. A. L. THOM•S, Assistant Traffic and Safety Engineer, Virginia Department of Highways Transportation
MR. •{BROSE WOODROOF, Assistant AtTorney General, Division of Motor Vehicles
ii

TABLE OF CONTENTS
LIST OF FIGURES
LIST OF TABLES
ABSTRACT
ACKNOWLEDGEMENTS
INTRODUCTION
OBJECTIVES
STUDY
Task A
Task B
Task C:
TASKS
Review Instructions
Review Designated Accident Reports Assess Completeness of Work Zone Acci.dent Reports
INSTRUCTI 0NAL REVIEW
Instruction
Trooper Questionnaire Construction Project Check
ANALYSIS OF ACCIDENT REPORTS
Methodology Accident Location
Time of Accident
Roadway and Environmental Factors
Characteristics of the Work Zone
Factors Relating to the Cause of the Accident
Accident Severity
S[•MARY AND CONCLUSIONS
Instructional Review-
Accident Characteristics
RECOMMENDATIONS FOR FUTURE STUDY
REFERENCES
APPENDIX: ACCIDENT REPORT FORMS
page
vii
ix
xi
i0
I0
12
14
17
2O
23
27
27
28
28
29
31
iii


LIST OF FIGURES
Page
Figure I. Designation of "Road Under Repair" on Accident Report
Figure 2. Trooper Questionnaire
Figure 3. M/U Accidents by Month of the Year 15
Figure 4. Accidents by Hour of the Day 16
Figure 5. Accident Location in the Work Zone 22


LIST OF TABLES
Table i. Percentages of Accidents Designated "Road Under Repair" I0
Table 2. Accident Location by Locality Type 12
Table 3. Accident Location by Route Classification-- 13
Table M/U Accidents by Type of Roadway
Table 5. Accidents by Road Alignment 18
Table 6. Accidents by Road Surface Condition 18
Table 7. Accidents by Light Conditions 19
Table 8. Accidents by Weather Conditions 19
Table 8. Indication Diagram and
of the Work Zone in the Accident Accident Description 20
Table 10. M/U Accidents by Type of Work Zone 21
Table ii. M/U Accidents by Work Zone Characteristics and Traffic Control 21
Table 12. Principal Cause of M/U Accidents 24
Table 13. M/U AccidenZs by Type of Collision 25
Table 14. M/U Accidents by Traffic Violations 26
Table 15. Was Congestion a Contributing Factor in the Accident? 26
Table 16. Accident Severity 27
vii


ABSTRACT
The objective of this study was to determine the magnitude and characteristics of safety problems, in terms of reported acci- dents, that are associated with moving vehicular traffic around and through highway maintenance and utility work zones. This was accomplished by examining 280 maintenance and utility work zone accidents that occurred on the Virginia state highway network over
a period of •4 months. These represented approximately 0.4% of the total number of accidents reported during that period. A review of accident reporting procedures, however, indicated that the sample of accidemts examined did not include a variety of work zone acci- dents where the roadway was not under physical repair (e.g., sweep- ing and landscaping) or where the first event in the accident was not related to the work activity (e.g., driver falling asleep).
The report discusses several characteristics of the maintenance and utility work zone accidents including general and specific loca- tions of the accident, time of the accident, roadway and environ- mental factors, characteristics of the work zone, cause of the accident, and accident severity. Where data were available compari- sons were made between the maintenance and utility work zone acci- dents and all reported accidents.
ix


AC KN OWLE DGEMENT S
This study was requested and funded by the U. S. Department of Transpomtation, Federal Highway Administration. Throughout the project, the cooperation and assistance of a number of indi- viduals in the Virginia Department of State Police and Virginia Depamtment of Highways and Transportation were sincerely appme- ciated. Particular appreciation is extended to Mike Martin, graduate student at the University of Virginia, for his diligent work in coding and analyzing the accident data, and to Robin Southworth, undergraduate at the University of Virginia, for her assistance in coding the data.
xi


VEHICLE ACCIDENTS AT MAINTENANCE AND UTILITY WORK ZONES
by
Bradley T. Hamgroves Faculty Research Engineer
INTRODUCTION
The safety of the motoring public in highway maintenance and utility work areas has become an issue of growing concern. While notable effomts have been made to improve maintenance and utility work zone practices and the traffic control procedures used in these work areas, little is known about the specific safety problems involved. Consequently, this study was undertaken to determine the magnitude and characteristics of motor vehicle acci- dents in highway maintenance and utility work zones. Since there was essentially no prior work in this area, the primary goal of this study was to determine the need for future studies. The study was based on an analysis of 14 months of Virginia accident data.
OBJECTIVE
The objective of this research was to d.etermine the magnitude and characteristics of safety problems, measured in terms of ported accidents, associated with moving vehicular traffic around and through highway maintenance and utility work zones. This ob- jective was accomplished by examining Virginia motor vehicle acci- dent reports marked "Road Under Repair." In addition, an assess-
ment was made of the consistency and completeness with which in- vestigating officers checked the designation "Road Under Repair" fo• accidents occurring at maintenance and utility work zones or accidents relating to traffic conditions caused by these zones.
STUDY TASKS
In order to accomplish the above objective the following tasks were performed.

Task A" Review Instructions
A review was undertaken of the instructions and guidelines, both written and oral, that are given to State Police officers for using the "Road Under Repair" designation, the "Accident Diagram" and the "Accident Description" sections of the Virginia Motor Vehicle Accident Report (form FR-•00). As parZ of this re- view, training officers and field officers were interviewed to determine both ins trucZ ions and typical interpretations. In addi- tion, a questionnaire was used to identify field officers' inter- pretations of these instructions.
Task B" .Re.vie.w .Designated. A.cci.dent Reports
The accident reports specified above were examined to deter- mine (a) if the accident occurred in the maintenance or utility work zone; (b) if the accident was related to the presence of the work zone; and (c) if the accident occurred upstream of the work zone and was directly related to traffic conditions caused by the work zone. Other items on the accident report form (e.g., traffic control, light and surface conditions, roadway alignment, weather, and accident severity) were examined to further describe the charac- teristics of accidents in these areas.
The sample of accident reports used in the analysis consisted of those Virginia accident report forms (FR-300) for the state high- way system marked "Road Under Repair" that could not be related to accidents having occurred in construction zones. Fourteen months of accident data were used in the analysis.
Tas_k C: Asse.s,s ,Cq.mpleteness.., of W0,rk_.Zone Accident Reports
Based on the results of Tasks A and B an assessment was made of the consistency and completeness of the reporting of maintenance and utility work zone accidents design,ated "Road Under Repair" and/ or indicated in the "Accident Description" section of the accident report form. In addition, a separate assessment was made by re- viewing all of the accident reports for several long-term construc- tion projects to determine the number of reports not marked "Road Under Repair. "

INSTRUCTIONAL REVIEW
Instruction
The Virginia Department of State Police conducts a compre- hensive, in-house training program which is required for all prospective state troopers. Recruits first attend a 6-day, 53- hour orientation, after which they proceed immediately to field training wherein they "ride" with selectively chosen officers. This field training continues until the next regularly scheduled training school (training schools typically are scheduled at 6- month intervals). After attending the training school, which lasts 20 weeks (I,011 hours), the recruits become regular troopers.
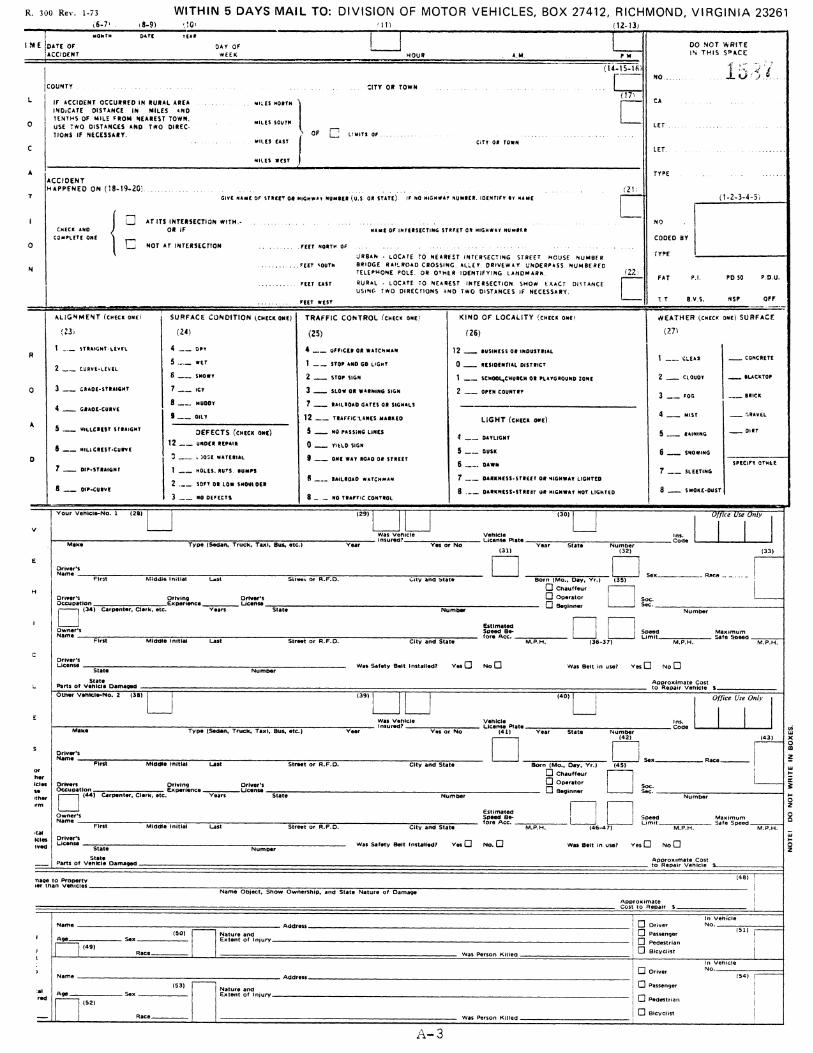
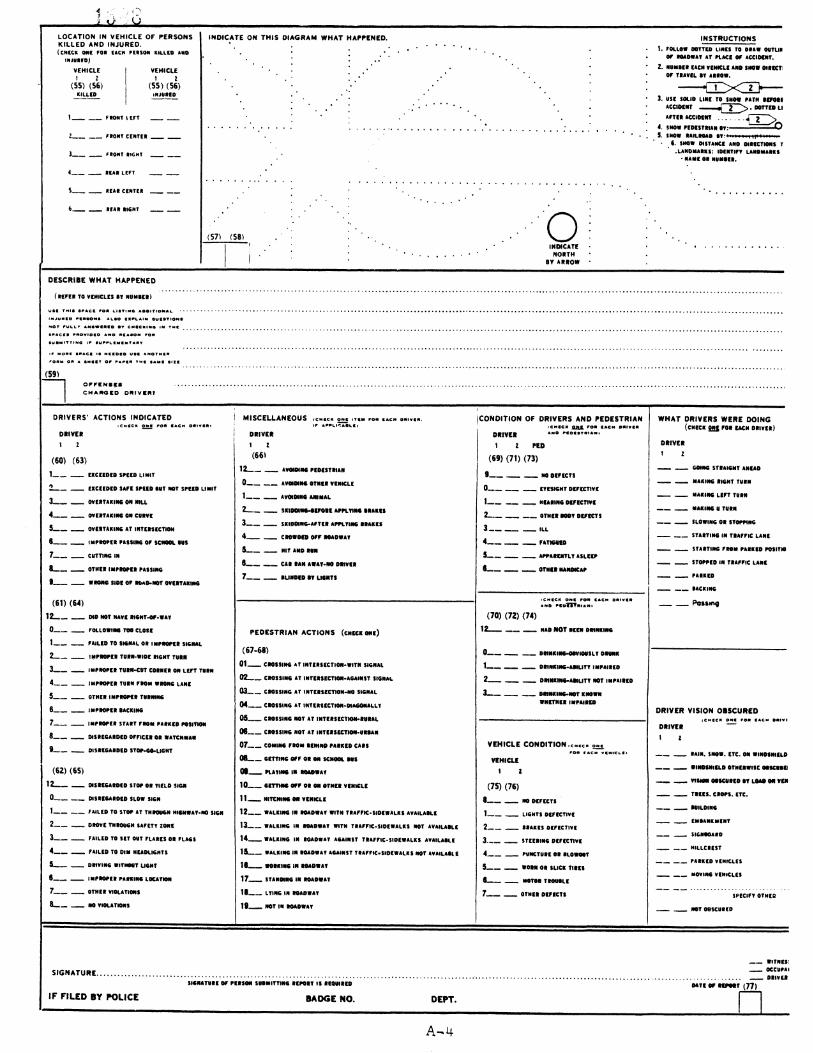
Of particular interest in the present study was the training in accident investigation and reporting given recruits. Approxi- mately 6 hours of in-class training are devoted to instruction in and discussion of accident investigation and reporting procedures. The instruction includes an examination of the instruction mate- rials and discussion of written and oral assignments. Approximately 2 of the 6 hours are devoted specifically to instructions for filling out the accident reports. Copies of parts of the FR-300 accident report are included in the Appendix. It is noteworthy that on January i, 1978, a new FR-300 with an extensively revised format was adopted.
In regard to the specific instructions for completing the FR-300, three items were of interest to this investigation, namely, the "Road Under Repair" designation, the "Accident Diagram", and the "Accident Description." An examination of the tmaining mate- rials (see references I and 2) and interviews with state police training officers indicated that the written and oral ins.tructions were identical. The pertinent points of this instruction are de- scribed below.
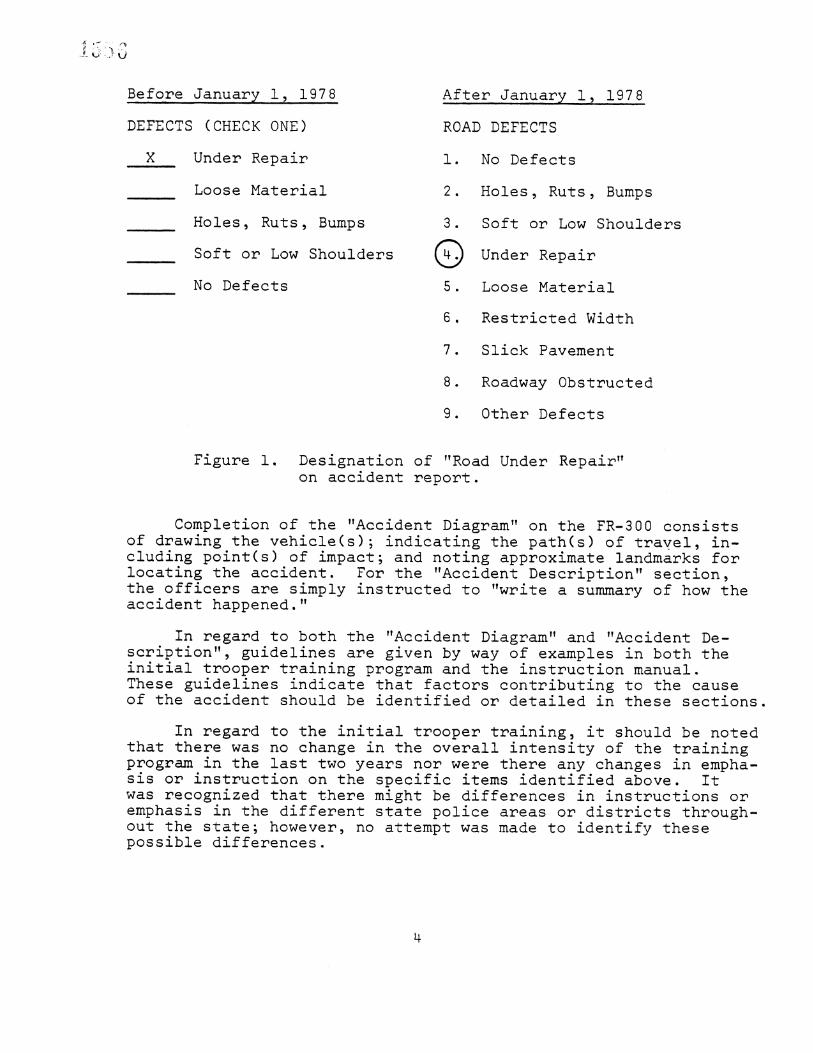
The investigating officer is instructed to indicate on the FR-300 any road defects which contribute to the accident by check- ing off the appropriate item in the "Roadway Defects" block (see Figure i). For the case where multiple responses are possible, the officer is instructed to indicate only the one item that is considered to have contributed most to the accident or that best describes its cause. For example., if the defect could be classified as "soft or low shoulders" and "under repair" the officer would have to decide which best describes the cause of the accident. From noting the different items in the "Road Defects" block and discus- sions with training officers it was assumed that some accidents that could be identified as "under repair" were in fact classified under a more explicit classification. No attempt was made, however, to determine how often this occurred.
Before Janu.ary i..,.. 19 7,8
DEFECTS (CHECK ONE)
X Under Repair
Loose Material
Holes, Ruts, Bumps
Soft or Low Shoulders
No Defects
After January i., !978
ROAD DEFECTS
i. No Defects
2. Holes, Ruts, Bumps
3. Soft or Low Shoulders Under Repair
5. Loose Material
6. Restricted Width
7. Slick Pavement
8. Roadway Obstructed
9. Other Defects
Figure i. Designation of "Road Under Repair" on accident report.
Completion of the "Accident Diagram" on the FR-300 consists of drawing the vehicle(s) indicating the path(s) of travel, in- cluding point(s) of impact and noting approximate landmarks for locating the accident. For the "Accident Description" section, the officers are simply instructed to "write a summary of how the accident happened. "
In regard to both the "Accident Diagram" and "Accident De- scription", guidelines are given by way of examples in both the initial trooper training program and the instruction manual. These guidelines indicate that factors contributing to the cause of the accident should be identified or detailed in these sections.
In regard to the initial trooper training, it should be noted that there was no change in the overall intensity of the training program in the last two years nor were there any changes in empha- sis or instruction on the specific items identified above. It was recognized that t-here might be differences in instructions or emphasis in the different state police areas or districts through- out the state; however, no attempt was made to identify these possible differences.

It is also noteworthy that before the new accident report forms went into use (January i, 1978), field training teams from state police headquarters were used to explain their use. While this instruction had no direct impact of importance to this study, it should be recognized that the use of the new forms probably changed the relative number of accidents being designated as "Road Undem Repair." That is, by including more specific items under the category of Road Defects (see Figure i) it is more likely that an "under repair" situation would be classified under one of the new and more specific items (e.g., restricted width or roadway obstmucted) than under the items previously listed.
TFoopgF ,Quest ionnaire
The purpose of the troopers' questionnaire was to determine the personal guidelines or criteria used by the investigating officers in filling out the FR-300. In particular, the responses were used to determine the specific circumstances under which the troopers checked off "Road Under Repair. " One hundred question- naires representing roughly a 12% sample of active Virginia State Police troopers were used in the analysis. The troopers completing the questionnaire represented a variety of experience and areas of regular patrol (i.e., urban and rural) including different road- way types (i.e., interstate, primary, and secondary highways)
In the instructions for filling out the questionnaire, the troopers were advised that the questions were largely opinion type and that their personal responses, without discussion with others, were desired. The questionnaire with a summary of results is shown in Figure 2.
Question I was designed to determine the proportion of offi- cers that would check off "Road Under Repair" in a variety of specific accident scenarios. A wide variety of scenarios was selected to make the choices more obvious and to reduce question- naire bias. As shown in Figure 2, the responses to this question indicated that the troopers were likely to check off "Road Under Repair" when (i) the maintenance/utility activity was in or physi- cally on the roadway, thus necessitating a lane closure; (2) when there was work related debris in the roadway; and (3) when there was a malfunction in the traffic control system. The questionnaire also showed that the troopers were less likely to check off "Road Under Repair" when the work activity was not physical repair of the roadway and when the first event in the accident sequence was not related to the work area (e.g., vehicle runs off road and hits some component of the work area).

I. Assume you are the inves=iga=ing officer at the scene of an accident. In the following scenarios, please mark ve•s! if you would check off "under repair" for the category "roadway defects" on the FR 300.
_.a•-,•_------opening in concrete barrier fails to yield •. • to oncoming vehicle (2); vehicle (2) side-
swipes vehicle (3).
2. %---- Temporary lane closure for bridge repairs _-_•'•__•}"•_. (using cones) creates substantial congas- • ',x,•,,.-.• .'" cion upstream. Rear end collision takes
[ place upstream of work area.
YES NO
39 61
67 33
3. Driver falls asleep vehicle runs off road and hics conscruction 20 80 barrels on shoulder.
4. _• _C•-•_•2_'•, • Rear end collision; first vehicle stop-
i•" "'•.•" ping for cone blown into roadway from 56 44 road work on shoulder.
Utility trench across two lane rural road filled in at night. Vehicle runs off road in curve due to dirt/mud left in roadway.
85 15
6. dr iver vls ion. Rear end collision wi•h street sweeper; dust may have obscured
7.
8.
9,
I0.
Ii.
Utility pole being set near edge of a
two-lane rural road; poor advance sight distance of the work zone causes driver to over react and veer into path of on- coming car.
16
36
84
64
Resurfaclng operaclon has been completed on a two-lane rural road, but has yet to be marked (wi•h edge lines and center lines) vehicle runs off road a• night due •o poor delineation 46 54 in a curve. •
Maintenance vehicle (X) working on • •I •|•-'/"--'• overhead signal; sideswipe accident. 38 62
Vehicle runs off road at night and hi•s • e•osed s•orm drain (X) under cons=ruc-
• •-- •ion in •he middle of a 60' depressed open median; evident tha• no work has 4 96 taken place in las• few weeks.
..,.due •o lane closure for work in manhole. 6• 37
12. Run off road accident skidding on loose" gravel; tar and gravel •rea•men• finished several days before but gravel still loose, i5 •5
(See Reverse)
Figure 2. Trooper questionnaire.
While investigating an accident, you may someclmes feel chat certain changes in traffic control (e.g., better signing or delineacio• could prevent future acci- dents. Have you ever made chase suggestions to ehe VDH&T? If yes, briefly explain how (e.g., memo •o Resident Engineer).
2. Check the iCam in •he list below which best describes when you check "Road Under Repair." Ii_ If •here are any M/U (.maintenance or utility) •raffic control devices in
area (e.g., cones, barriers, signs) i0 If there is any physical evidence of M/U work in the area. (e.g., new
surface without pavemen• markings).
53_ Only if M/U activity was a contributing factor in the accident.
17 Only if M/U activity was the direct cause of accident.
,9. Ocher, briefly describe. (see •exZ)
3. Check any of •he activities below cha• you would classlf7 as "•oad Under •epalr" if they were •he direct cause of an accident.
Work Actually in Travel Way
YES NO YES NO
•_.•7 3__3 A. Painting Edge Line •1__ 3__9 F. Ut:ll£Cy Trenching
l__• 8.•6 B. Street Sweeping 100_•_. ,_..•0 G. Pot •ole Repair
9• • D, Resurfac•g 8• !• I. Joint •pair
• 3• E. •ole/Utili=y Work
Work On Shoulder Or Bezoud
YES NO
7._•0 313 j. Grading Shoulder
•8 52 K. Guard Rail Repair
•_• 8__i L. Sign Replacement
i__! 89 M. Tree Trinm•g
19 81 N. Mowing
17 •$ O. Landscaping
General Comments (see ZexZ)
Longer Term Activities
YES NO
92 8 P. Lane Addition on Interstate
8• 16 Q. Adding Left Turn in Median of Primary Road
87__ i_• R. Extending AccleraCion Ramp on Interstate
70.•_ 3__0 S. Conscrucnion of Overpass
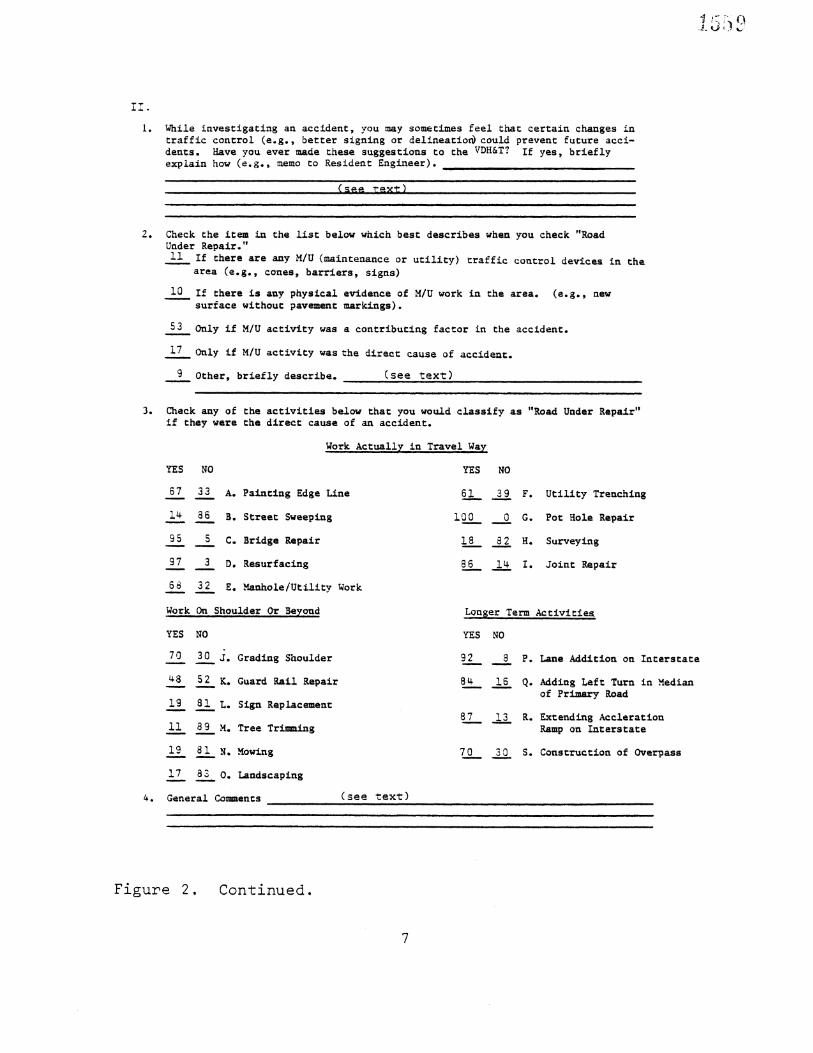
Figure 2. Continued.

While not related to the central purpose of the study, question II-i (see Figure 2) was included to identify the fre- quency and mode of suggestions or recommendations the troopers had regarding the prevention of accidents at specific locations. The regular procedure used by the Virginia Department of State Police makes use of the Highway Hazard Report. This is a formal memorandum to the appropriate resident engineer which is initiated whenever some element of the highway environment requires correction or repair. It may be initiated through accident investigation or through routine patrol. For example, this form is used to alert the resident engineer that missing or damaged signs need to be replaced. In addition to noting that they had used the Highway Hazard Report, a number of the troopers (11%) indicated that they had also developed verbal lines of communication with resident engineers or maintenance shop supervisors.
Question 11-2 was designed to examine the relationship be- tween the maintenance-utility (M/U) activity and the cause of the accident. As shown in Figure 2 the majority of troopers (70%) indicated that they would check off "Road Under Repair" only if the M/U activity was a contributing factor or the direct cause of the accident. Twenty-one percent of the troopers said that only some indication of the M/U activity (i.e., traffic control devices or physical evidence of work) was necessary to warrant their checking "Road Under Repair." The remaining nine responses fell under the category of "other" and consisted of multiple responses.
The final question (II-3) was designed to determine how the troopers interpreted "road repair"; that is, which situations or
work activities qualify as road repair and which do not. A variety of activities were chosen to reflect different work locations (i.e., on roadway, on shoulder, and beyond shoulder) and different work types (i.e., moving, less than one day, several days, and long- term construction activities).
The results of the questionnaire indicated that, as before, the troopers are not likely to check off "Road Under Repair" when the work activity is not concerned with physical repair of the roadway surface (e.g., sweeping, tree trimming, surveying, mowing, landscaping, and sign replacement). Excluding shoulder grading, only 22.8% of the troopers indicated that accidents directly_ caused by work activity on or beyond the shoulder would warrant checking off "Road Under Repair". In contrast, 82.0% indicated that work in the traveled way (excluding sweeping and surveying) would qualify. This is very close to the average response (83%) for the long-term construction activities listed (e.g., lane addi- tion on interstate).
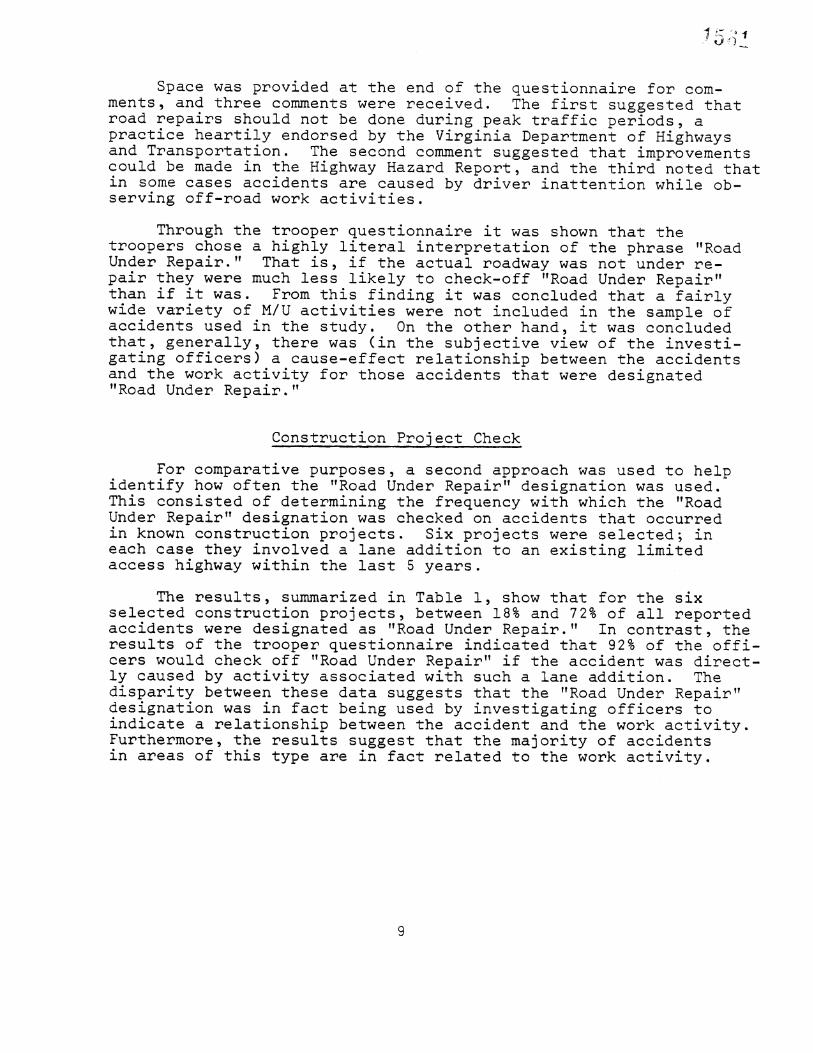
Space was provided at the end of the questionnaire for com- ments, and three comments were received. The first suggested that road repairs should not be done during peak traffic periods, a practice heartily endorsed by the Virginia Department of Highways and Transportation. The second comment suggested that improvements could be made in the Highway Hazard Report, and the third noted that in some cases accidents are caused by driver inattention while ob- serving off-road work activities.
Through the trooper questionnaire it was shown that the troopers chose a highly literal interpretation of the phrase "Road Under Repair." That is, if the actual roadway was not under re- pair they were much less likely to check-off "Road Under Repair" than if it was. From this finding it was concluded that a fairly wide variety of M/U activities were not included in the sample of accidents used in the study. On the other hand, it was concluded that, generally, there was (in the subjective view of the investi- gating officers) a cause-effect relationship between the accidents and the work activity for those accidents that were designated "Road Under Repair."
Construction Prgject Check
For comparative purposes, a second approach was used t.o help identify how often the "Road Under Repair" designation was used. This consisted of determining the frequency with which the "Road Under Repair" designation was checked on accidents that occurred in known construction projects. Six projects were selected; in each case they involved a lane addition to an existing limited access highway within the last 5 years.
The results, summarized in Table i, show that for the six selected construction projects, between 18% and 72% of all reported accidents were designated as "Road Under Repair." In contrast, the results of the trooper questionnaire indicated that 92% of the offi- cers would check off "Road Under Repair" if the accident was direct- ly caused by activity associated with such a lane addition. The disparity between these data suggests that the "Road Under Repair" designation was in fact being used by investigating officers to indicate a relationship between the accident and the work activity. Furthermore, the results suggest that the majority of accidents in areas of this type are in fact related to the work activity.

Table i
Percentages of Accidents Designated as "Road Under Repair"
Project
3 Projects Using Port- able Concrete Barriers (Represent 16 Months of Data)
3 Projects Using Timber Barricades (Represent 20 Months of Data)
Percentage of Accidents Designated as "Road Under Repair"
72
69
18
66
53
38
Weighted Average
Weighted Average
51
63
ANALYSIS OF ACCIDENT REPORTS
Methodology
To examine the nature of M/U zone accidents an analysis was undertaken to (i) identify the specific characteristics of M/U accidents, and (2) compare selected characteristics of those acci- dents with the characteristics of Virginia traffic accidents in general. To facilitate this analysis approximately 50 items of information from the FR-300 forms were coded for automatic data processing. While a regular state coding procedure was available, (see reference 3) a separate procedure was used because the anal- ysis required several pieces of data that are not included in the state's coding. This separate coding was possible because of the relatively few number of accidents used in the analysis.
The sample of M/U accidents used was based on those accident reports for the state highway system* from March 1977 through April 1978 where "Road Under Repair" was designated and the work activity could not be identified as a construction project.**
*The state highway system accounts for approximately 81% of the total mileage of roads in Virginia. It consists primarily of the inter- state system and all nonurban roads. Roughly 72% of the annual ve- hicle miles of travel occur on the state highway system.
**Virginia law requires the reporting of all accidents in which per- sons are injured or killed or in which property damage of $250 or
nlore occults.
I0

In determining if the "Road Under Repair" designation referred to construction activity the following general criteria were used. Construction activity was characterized as work-
i. being performed by a contracting agency,
2. involving an improvement to design standards, and
3. being more expensive and longer in duration than M/U work.
Maintenance activity, on the other hand, was characterized as work-
I. being performed by highway agency personnel,
2. involving restoration of previous conditions and
3. requiring less time and money than construction activity, or
4. being performed by utility company personnel.
As noted above, where possible selected characteristics of the M/U accidents were compared with those of motor vehicle accidents in general. Since the sample of M/U accidents examined included primarily rural accidents, "all 1977 rural accidents" were used as the basis for comparison. Because of the time constraints on the study, only published summary data were available for the "all 1977 rural accidents". Consequently, some desirable comparisons could not be made. Also, since slightly different time periods were involved, only rate comparisons could be made.
Since March 1977 approximately 3.0% of all the rural motor ve- hicle accident reports (roughly 68,500 per year) have come under the designation fo "Road Under Repair". For the 14 months of accident data used in this analysis, all but 280 accidents were identified as having occurred in construction areas. This figure represents approximately 13% of the "Road Under Repair" accidents and 0.4% of the total number of reported accidents on the rural state high- way system.*
The next section describes the procedure used to identify the accident reports used in this analysis, and the succeeding sections describe the characteristics of those accidents, including accident location, time of accident, roadway and environmental factoms, characteristics of the work zone, accident causes, and accident severity.
*It is noteworthy that 70% of the 280 accident reports were completed by State Police officers. The remaining 30% were completed by county police officers (26%) and town police (4%) who used the same training materials discussed earlier. No significant differences in reporting were observed between the different groups.
!!

Accident Location
Accident location was identified by locality type and by route type. As shown in Table 2, over half of the M/U accidents occurred in areas designated as "open country". A comparison with all 1977 rural accidents shows only a relatively larger number of M/U accidents in residential areas.
Table 2
Accident Location by Locality Type
Location Type M/U Accidents Number Percent
lil uln fill -Ill mnur nnn!i.l,,l,,
Open Country Bus ines s / Indus trial Residential
Other $ Not Stated
Total
159
54
44
23
280
56.8.
19.3
15.7
8.2
i00.0
*Source" Virginia .,Crash Fa,gt.S :,.
!, 977.
All 1977 Rural Accidents, Percent*
roll
58.2
19.2
20.0
2.6
I00. 0
In Table 3 accidents are shown by route classification. As shown, the M/U accidents are most common at grade intersections and on primary and secondary highways. The comparison with all 1977 rural accidents only shows that relatively fewer M/U accidents occur at intersections.
Additional information on accident location by roadway type is given in Table 4. As shown, over half of the reported M/U acci- dents occurred on two-lane roads. Comparable data for all 1977 accidents were not available. However, the information in Table 4, coupled with that above, indicates that in general M/U accidents are relatively more prevalent on two-lane primary and secondary highways, and at grade intersections.
12

Table 3
Accident Location by Route Classification
Route Type
Intersection
Interstate
Primary Secondary Interchange
Total
M/U Accidents NUmber -P'e'•C ent
87 31.i
32 11.4
77 27.5
74 26.4
i0 3.6 /
280 I00.0
*Source"
L(68.9) All. 1977 Rural
Accidents, Percent*
/
i00.0
Virginia Crash Facts, 1977.
Table 4
M/U Accidents by Type of Roadway I Roadway Type
•'' •"
Two Lane
Four Lane
Undivided
No Access Control
Partial Access Control
Full Access Control
Six Lane
All Others and Not Stated
Total
Number Percent \Ill iiii i•llllll
160 57 .i
12 4.3
20 7 .i
25 8.9
36 12,9
10 3.6
17 6 .i
280 i00.0
13

Within the location analysis, an attempt was made to establish a relationship between the number of M/U accidents and highway maintenance expenditures at the district level.* Unfortunately, this approach provided no useful information.
Time of Accident
All of the M/U accidents were identified by month and by hour of the day. Figure 3 shows the monthly variation. As ex- pected, M/U accidents are more frequent in the warmer months when regular maintenance and utility work is typically scheduled. From May to October there were an average of 31.5 accidents per month. During the rest of the months in the March '77 to February '78 period the rate dropped to ii.i accidents per month.
The breakdown of M/U accidents by the hour of day is shown in Figure 4. As can be seen, the lowest number of accidents occur in the late evening and early morning hours. There is a small peak during the typical morning traffic peak (7-9 a.m.); the number then rises steadily to late afternoon (3-5 p.m.), then drops off rapidly. Not unexpectedly, the hourly variation in M/U accidents matches the variation in all 1977 accidents. The one notable exception is that there are relatively more M/U accidents from midmo•ning (i0 a.m.) to midafternoon (3 p.m.). This exception is due, no doubt, to the relatively larger amount of maintenance and utility activity that occurs during this period.
*Virginia is divided into eight highway districts.
14

1977 Mare. 14
Apr. 12
May 25
June 33
July 37
Aug.
Sept. 31
Oct. 35
NOV. 21
1978
Dec.
Jan.
14
Feb.
Mar. 18
Apr.
i0 20
Number of Accidents 3O 4O
Figure 3. M/U accidents by month.
15

"'/U Accidents
s%u•p3ooV •/.6I IIV
16,

Roadway and Environmental Factors
In this section the results of an examination of roadway alignment, surface condition, and light and weather conditions are presented. Since the information for these factors is regularly coded on all accident reports, comparisons between M/U accidents and all 1977 rural accidents were possible.
Table 5 shows the number of accidents that occurred on different types of roadway alignments. As can be seen there is reasonably close agreement between the M/U accidents and all 1977 rural accidents. The notable exceptions are the relatively larger number of M/U accidents under straight-grade conditions and the relatively fewer M/U accidents under level-curve con- ditions. The first exception suggests that there may be braking problems in work areas located on grades.
Accidents are broken down by road surface condition in Table 6. Over 80% of both the M/U accidents and all 1977 rural accidents occurred on dry pavement. The slightly higher percentage of M/U accidents occurring on muddy and oily surfaces may have been a direct influence of the work activity. This speculation could not, howe•ver, be verified from the accident reports. The lower per- centage of M/U accidents on wet pavement may suggest that motorists are more cautious under these conditions or that M/U work activity is curtailed during wet weather.
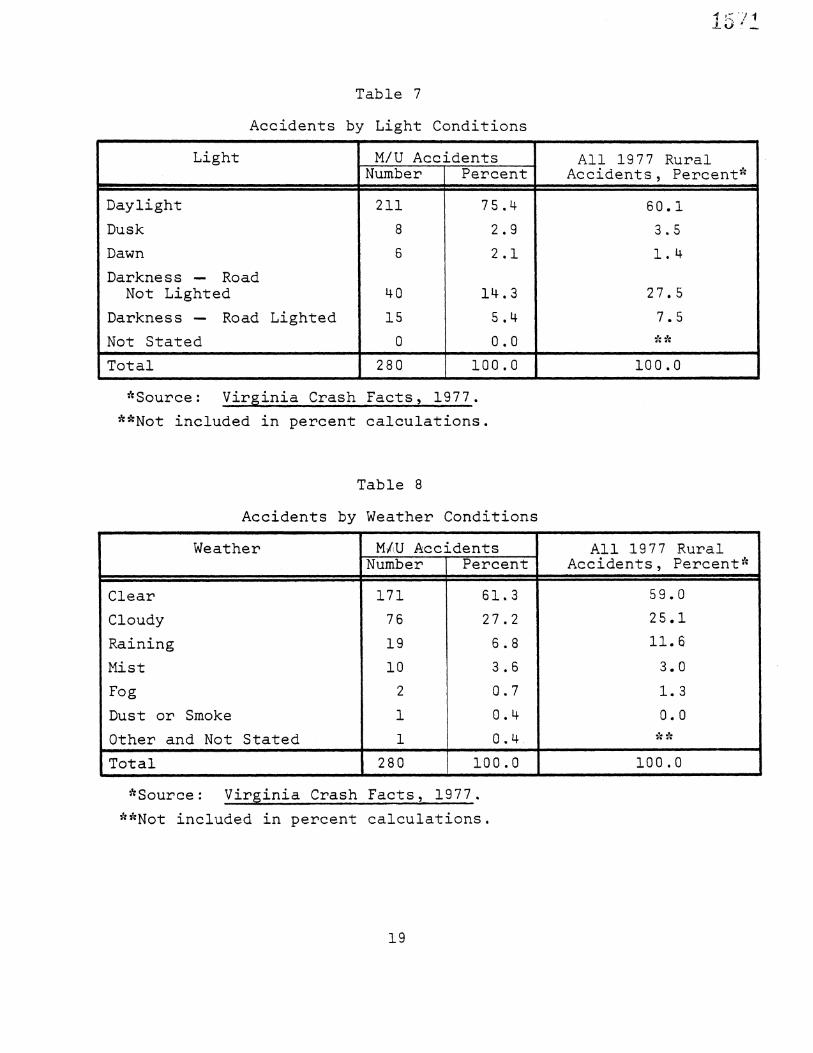
Table 7 shows the breakdown of accidents by light conditions. Approximately 75% of the M/U accidents occurred during daylight compared to 60% for all 1977 rural accidents. This is due most likely to the fact that more M/U work activity is performed under daylight than under other conditions. The other major difference between the M/U accidents and all 1977 rural accidents is the relatively fewer number of M/U accidents under the "darkness road not lighted" condition. This finding suggests that less M/U work is performed at night, that traffic control techniques used at night are effective, or both.
In Table 8 accidents are shown by weather conditions. The only significant difference between the M/U accidents and all 1977 rural accidents is the relatively fewer number of M/U accidents occurring under rainy conditions. As noted above, this finding may suggest that motorists are more cautious under these conditions or that M/U work activity is curtailed during rainy weather.
17

Table 5
Accidents by Road Alignment
Alignment
Level-Straight Level-Curve
Grade-Straight Grade-Curve
Hillcrest-Straight Hillcrest-Curve
Dip-Straight Dip-Curve Not Stated
M/U Accidents All 1977 Rural Numbe'• Percent- Accidents, Percent* •, ,' •,' •, ,'•-: ,,' •',• ,',,,",, ',,',
44.4
5.4
26.9
124
15
75
16.8
5.0
0.7
0.4
0.4
:L00. 0
47
42.8 12.8
20.5 17.2
1..5
0,9
i00.0" Total 280
*Source Virginia Crash Facts, 1977.
**Not included in percent calculations,
Table 6
Accidents by Road Surface Condition
Surface Condition M/U Accidents NUmber Per6eht
',•. '1 •'1 ',', III i ,[•
Dry 229 82,1
Wet 38 13.6
Muddy 6 2.2
0ily 6 2.2
Other and Not Stated i **
Total 280 lO0 0
*Source' Virg•n.ia Cra..sh" Facts, 1.97_7. **Not included in percent calculations.
All 1977 Rural Accidents, Percent*
ill
77.9
21.7
0.2
0.2
i00.0
18
Tab le 7
Daylight Dusk
Dawn
Accidents by Light Conditions
Light M/U Acc.idents Number Percent
211 75.4
8 2.9
6 2.1
Darkness Road Not Lighted 40
Darkness Road Lighted 15
Not Stated 0
Total 280
• Source" Virginia Crash Facts, 1977.
• *Not included in percent calculations.
All 1977 Rural Accidents, Percent*
14.3
5.4
0.0
i00.0
60.1
27.5
7.5
i00.0
Table 8
Accidents by Weather Conditions
Weather
ll.'lli "Imm ll]l llJl| -'1", •llll
Clear
Cloudy Raining Mist
Fog Dust or Smoke
Other and Not Stated
Total
M/,.U Accidents "Number
lllll•il •ll Ill
i?i
All 1977 Rural Percent Accidents, Percent
.., !._ .,.!, ,•-.•
76
19
I0
2
i
i
280
*Source" Virginia Crash Facts, 1977.
**Not included in percent calculations.
61.3
27.2
6.8
3.6
0.7
0.4
0.4.
i00.0
59.0
25 .I
II.6
3.0
1.3
0.0
i00.0
19

Characteristics of the Work Zone
This section reports on several characteristics of the M/U work zones that were examined. These include the type of work activity being performed, the characteristics of the traffic control used, and the location of the accident within the work zone. Data for this examination were taken almost entirely from the "Accident Diagram" and "Accident Description" sections of the accident reports. Table 9 shows the frequency with which the work zone was cited in these sections.
Table i0 shows that in only 54 of the 280 M/U accidents (19.3%) was the nature of the work activity described in the Acci- dent Diagram or Accident Description. In half of those 54 acci- dents, the work activity was identified as resurfacing operations.
Table ii also gives some information on the nature of the work activity. In 54 of the 280 acc'ident reports (19.3%) a lane closure was indicated. In 23 of the reports (8.2%) the presence of a flagman or an automatic signal was noted in the "Accident Diagram" or "Accident Description". From other information coded on the reports, however, a traffic officer or flagman was cited as the type of traffic control in 9.8% of the accidents.
Not shown in Table Ii is the fact that temporary speed limit signs were indicated as being in use in 18.2% of the work areas and that 14.2% of the accident reports indicated the presence of slow or warning signs. No traffic control was noted on 29.1% of the M/U accident reports.
Table 9
Indication of the Work Zone in the Accident Diagram and Accident Description
Number
55
5•
Indication In
Diagram Only Description Only Both
Neither
Total
147
28O
Percent
8.6
19.6
19.3
52.5
i00.0
2O
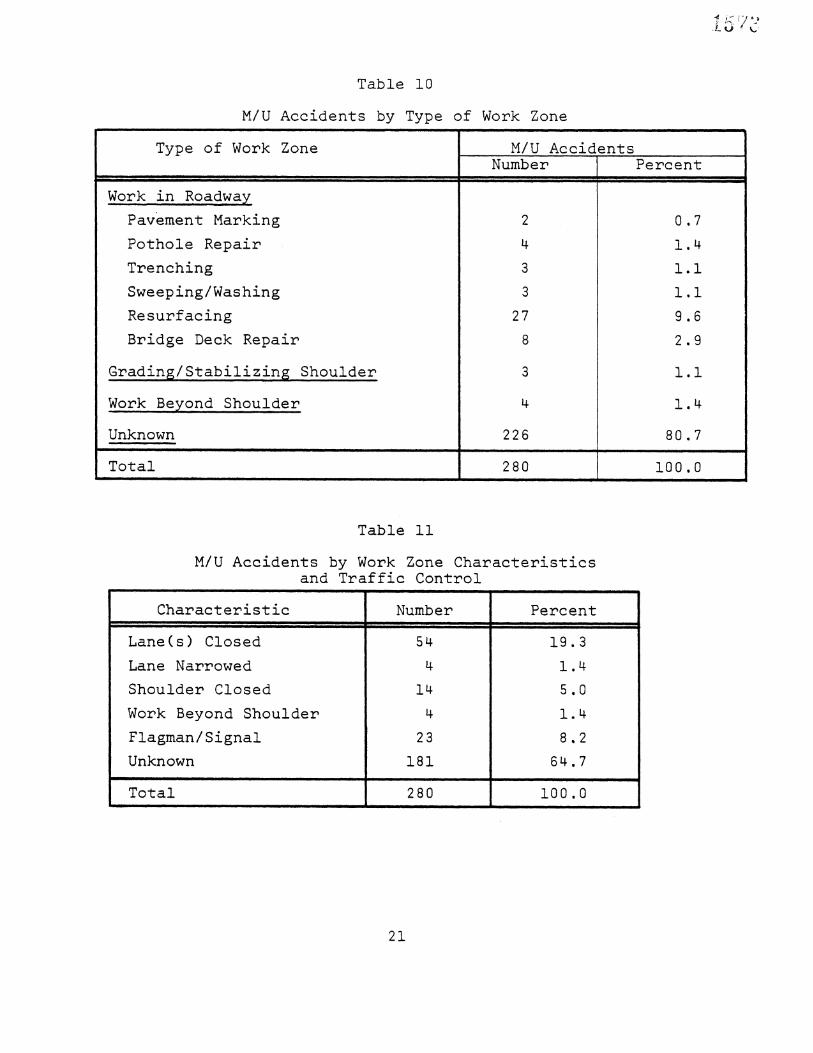
Table i0
M/U Accidents by Type of Work Zone
Type of Work Zone
.W,,o•,k in •0adway Pavement Mamking Pothole Repair Trenching Sweep ing / Was hing Resurfacing Bridge Deck Repaim
Grading/Stabi!i.zing, Shoulder
•..,ork Beyon d Sho.u,l.der Unknown
Total
M/U Accidents Number
2
4
3
3
27
8
226
280
Percent
0.7
1.4
i.I
i.I
9.6
2.9
80.7
100.0
Table ll
M/U Accidents by Work Zone Characteristics and Traffic Control
Char act er i st i c Number Perc en t !IJi! _ill [Ii!I i. IIiIi ]IIi ii•'I ',I
Lane(s) Closed
Lane Narrowed
Shoulder Closed
Work Beyond Shoulder
Flagman/Signal Unknown
Total
54
14
4
23
181
280
19.3
1.4
5.0
1.4
8.2
64.7
i00.0
21

In addition to the location analysis described above, a microscopic approach was used Zo locate the accident within the work zone. For this analysis the amea surrounding a typical work amea was divided into six ovemlapping ameas (see Figure 5). Fmom the information in the AccidenZ Diagmam and the Accident Descmiption, locations fore 122 of the 280 •eporZed accidents weme detemmined.
As shown in Figure 5, 59 accidents (48.4% of those located) occurred immediately adjacent to the work area. Further analysis showed that 15.3% of these were rear end accidents, 13.5% side- swipe, 10.2% fixed object in roadway, and 8.5% angle accidents. Of the 46 accidents positively located in advance of the work area, 34.8% were identified as being rear end type.
Location"' of end work sign or end of return taper
Location' 0f first"t•affic' control device excluding advance warning signs
After Work Zone
(5)
(4)
Work Zone
(Ii) i (25) Work Area
(59)
0
0 0 0 0 0 o o 0
Before Work Zone
(21)
Figure 5. Accident location within the womk zone. (Note" Numbems in parentheses indicate the numbem of accidents located in that amea.)
22
F.ac, tors Re!a,ti..ng to, t, he .,.C.a.,u...se, o.f the Accident
In this section several factors relating to the causes of M/U accidents are identified. These factors include the principal cause of the accident, the type of collision, traffic violations, and the relationship between the accidents and traffic congestion. The data used were taken largely from the "Accident Diagram" and "Accident Description" sections. However, in some cases, informa- tion was available from items regularly coded on the accident reports. Consequently, some comparisons could be made between M/U accidents and all 1977 accidents.
Table 12 shows that the primary cause of 221 of the M/U acci- dents (79%) was driver error. In only 49 of the accidents (18%) was some specific characteristic of the M/U activity cited as the primary cause. Nearly 70% of these were due to Unsafe Movement of M/U Vehicles (e.g., pulling out into traffic) and Road Defects or M/U Debris (e.g., loose material on roadway).
While most of the accidents were in fact attributed to driver error, the specific cause of the error was of interest. For ex- ample, why didn't the motorist perceive the need to reduce speed or yield to a lane closure when specifically instructed to do so? Obviously questions of this type could not be answered in this investigation; however, they do point to two critical underlying questions. How much additional caution should the motorist be expected to exercise while traveling through an M/U work area? And, what are the most effective methods of communicating to the driver the need for increased caution?
The types of collisions in M/U accidents are shown in Table 13. As shown, the greatest percentage of collisions by type were rear end accidents (29.4%), followed by angle collisions (15.2%), and non-collision (14.9%). Of the 48 vehicles that hit fixed objects, 7 were identified as hitting work zone barriers or signs, and 13 as having collided with M/U vehicles or equipment. A comparison of the M/U accidents with 1976 accident data for the state network indicates that rear end type accidents were roughly 50% more common in M/U areas.*
*Data for 1976 shows that approximately 19% of all accidents on the state .network were rear end accidents.
23

Table 12
Principal Cause of M/U Accidents
Cause Number of Accidents ,,,,,,.• ,, ",','',,•,,,",,•,,,,. •',-,•,,"•, ,,•,• ,,,,,, .,, ,,!,,,,•,,
DRIVER ERROR INDICATED
Speed And Too Fast For Conditions
Driver Inattention
Did Not Have Right-Of-Way Following Too Closely On Wrong Side Of Road
Improper Passing Or Backing
M/U ACTIVITY ERROR INDICATED
Unsafe Movement Of M/U Vehicle
Road Defect Or M/U Debris
Inadequate Advance Signing Poor Delineation Of Work Area
Inadequate Transition
Poor Pavement Delineation
Flagman Error
OTHER AND UNKNOWN
TOTAL
221
49
I0
$4
4S
43
38
21
20
17
17
5
4
3
2
i
28 0
Information on traffic violations was taken directly from the regularly coded data on the accident reports. This information con- sists of the number of drivers that were cited with traffic viola- tions as a result of the accident. As shown in Table 14, the break- down of violations in M/U accidents is quite similar to that for all 1977 rural accidents. There is a slight tendency, however, for M/U accidents to involve relatively more improper passing and following too closely violations. In both the M/U accidents and all 1977 rural accidents roughly 52% of the drivers were cited with some violation.
24
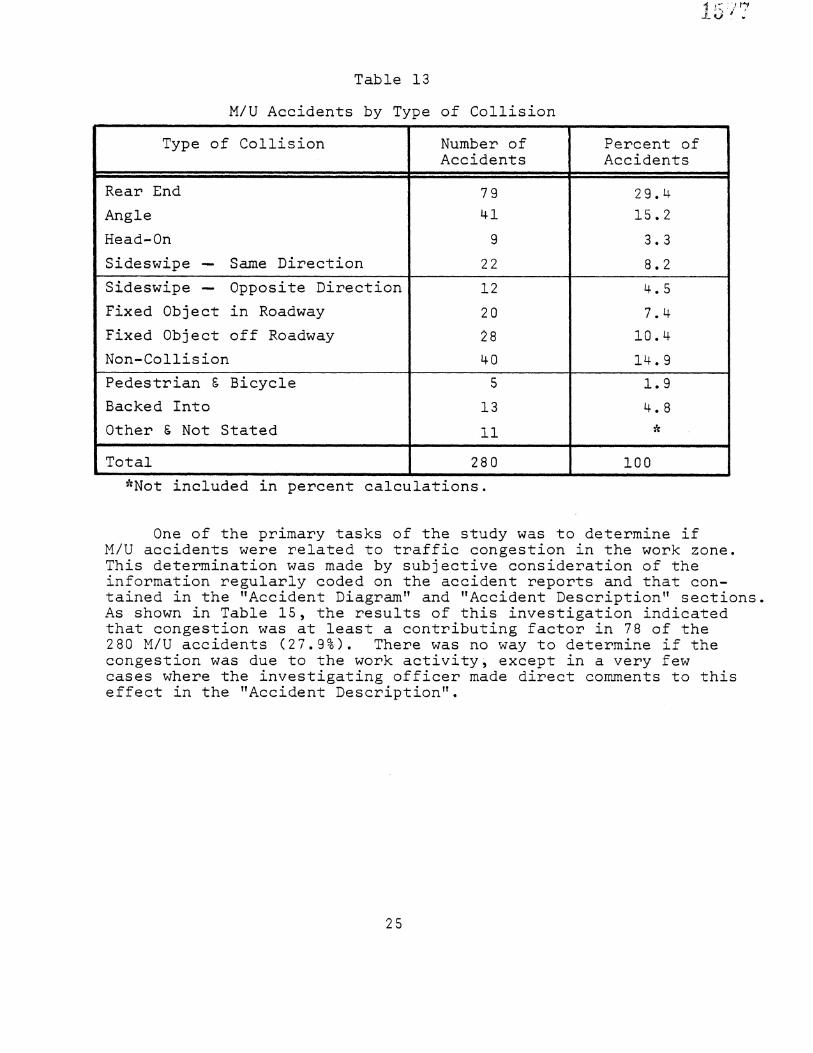
Table 13
M/U Accidents by Type of Collision
Type of Collision
Rea• End
Angle Head-0n
Sideswipe Same Direction
Number of Accidents
illil'l !1 lull
79
41
22
Percent of Accidents
29.4
15.2
Sideswipe- 0pposit$ Direction
Fixed Object in Roadway Fixed Object off Roadway Non-Collision
Pedestrian $ Bicycle Backed Into
Other & Not Stated
Total
12
2O
13
280
4.5
7.4
10.4
14.9
1.9
4.8
IO0
*Not included in percent calculations.
One of the primary tasks of the study was to determine if M/U accidents were related to traffic congestion in the work zone. This determination was made by subjective consideration of the information regularly coded on the accident reports and that con- tained in the "Accident Diagram" and "Accident Description" sections. As shown in Table 15, the results of this investigation indicated that congestion was at least a contributing factor in 78 of the 280 M/U accidents (27.9%). There was no way to determine if the congestion was due to the work activity, except in a very few cases where the investigating officer made direct comments to this effect in the "Accident Description".
25

Dmivem Actions
Table 14
M/U Accidents by T•affic Violations
M/U Accidents Numbem And (Pemeent)
28 (10.4)
29 (10.8)
15 (5.•)
i (0.4) 19 (7.1)
42 (15.7)
Exceeding Legal Speed Limit
Exceeding Safe Speed Limit
Improper Pas sing Failure to Signal Improper Turning and Backing Following Too Close
Disregard Stop Sign Disregard Traffic Signal
4 (1.5)
2 (0.7) (9.3) (38.5)
i00.0
Didn't Have Right-of-Way 25
Other Violations i03
No Violations Or Not Stated 251
Total 519
*Source" Virginia Cra.sh Fact.s ,
.!..97•7. •{•Not included in percent calculations.
All 1977 Rural Accidents (Percent)*
(9.4) (12.6) (1.7) (0.7) (5.1) (9.7) (1.6) (1.2) (16.1) (41.9) ( ** )
i00.0
Table 15
Was Congestion a Contributing Factor in the Accident?
Congestion Number of Accidents
Yes 78
No 108
Unable to Determine 94
Total 280
*Not included in percent calculations.
Percent of Accidents
Jill.Ill Ill iJl i111 ill
41.9
58 .i
I00.0
26

Accident Severity
To evaluate the relative severity of the M/U accidents, a variety of severity indicators where formulated. As shown in Table 16, the typical M/U accident was slightly more severe than the typical 1977 rural accident in that more vehicles were involv- ed per accident. This was due perhaps to the relatively larger number of rear end accidents (and therefore the larger number of multiple vehicle accidents) in M/U areas than in all 1977 rural accidents. There was, however, a consistent, albeit small, tendency for the typical M/U accident to be less severe than all 1977 rural accidents in terms of personal injury and property damage. In all of the accident severity indicators the differ- ences between the M/U accidents and all 1977 acciden• were extreme- ly small.
Table 16
Accident Severity
Severity Index
No. of Vehicles Involved Per Accident
No. of Persons Killed* or Injured Per Accident
Percent of Injury Accidents
Percent of Property Damage
Property Damage (Dollars) Per Accident
MIU Accidents
1.85
0.436*
29.6%
70.0%
$1,027
All 1977 Rural Accidents
1,66
0.464
30.7%.
68.2%
$1,104"*
*0nly one fatality occurred in the 280 M/U accidents. **Average property damage for all 1977 accidents, urban and rural.
SUMMARY AND CONCLUSIONS
The objective of this study was to determine the magnitude and characteristics of safety problems in terms of reported accidents, that are associated with moving vehicular traffic around and through highway maintenance and utility work zones. This objective was accomplished by examining 14 months of Virginia accident reports where "Road Under Repair" was designated. Accidents occurring in construction projects were removed and the remaining sample was assumed to represent maintenance and utility work zone accidents. Because of the small sample used in the analysis, caution should be exercised in interpreting and generalizing the results.
27

Instructional Review
The first task involved a review of the written and oral in- structions given State Police for using the "Road Under Repair" designation and "Accident Diagram" and "Accident Description" sections of the accident reports. As part of this review a questionnaire was used to identify field troopers' interpretation of the instructions. The major finding of this review was that the investigating officers used a highly literal interpretation of the "Road Under Repair" designation. That is, they were not likely to mark an accident as "Road Under Repair" unless the road- way was physically under repair or the first event in the accident was related to the work zone. It was concluded, therefore, that a wide variety of accidents that occurred in maintenance and utility zones were probably not included in the sample of accidents used in this analysis because they did not have the "Road Under Repair" designation. Based on the results of the trooper questionnaire and the types of work activity cited in the accident reports, it was subjectively estimated that half of the accidents that occurred in M/U areas were not designated "Road Under Repair".
Accident Characteristics
The primary purpose of analy.zing the M/U accident reports was. to determine if (i) the accident occurred in the work zone; (2) if the accident was related to the presence of the work zone; (3) if the accident occurred upstream of the work zone and was directly related to traffic conditions caused by the work zone. For this study 280 accidents occurring from March 1977 through April 1978 were identified as carrying the "Road Under Repair" designation and not being associated with construction activity. These 280 accidents made up 13% of the 1.5% of the accidents that were des- ignated as "Road Under Repair". (These 280 accidents represented approximately 0.2% of the total number of reported accidents.)
The major findings of this analysis are as follows"
i. In contrast to all 1977 rural accidents, M/U accidents were more likely to occur in straight-grade alignments, and from midmorning to late afternoon; they were less likely to occur in rainy weather, at night, in residen- tial areas and at intersections. Rear end type accidents were 50% more common in M/U areas when compared to all 1976 accidents on the state network.
2. Nearly 60% of all the M/U accidents studied occurred on two-lane roads; they were also nearly three times more frequent in the period from May to October than during the rest of the year.
28

3. I• roughly half of the M/U accident reports the "Accident Diagram" and/or "Accident Description" was used to identify some characteristic of the work activity or associated traffic control. The actual type of work activity was identified, how- ever, in only 20% of the reports. Nearly half of these were resurfacing operations.
4. In 122 of the 280 accidents the specific location of the crash relative to the work zone was identified. From this information it was determined that 16 of the 46 accidents (35%) that occurred in advance of the work zone were rearend accidents.
5. In 78 of the 280 accidents (28%) traffic congestion was identified as being at least a contributing factor. In 94 of the reports no determination could be made.
6. In only 49 of the 280 accidents (18%) was some aspect of the M/U work activity or traffic control cited as the principal cause of the accident.
7. On the average, M/U accidents involved slightly more vehicles per accident than did the average 1977 rural accident. The average property damage and number of persons killed or injured per M/U accident, however, was slightly less than the average reported for all 1977 rural accidents.
RECOMMENDATIONS FOR FUTURE STUDY
Based on the results of this investigation the following recommendations for future study are made. First, research should be undertaken to determine" (I) in general, how much additional caution the typical motorist should be expected to exercise when traveling in highway maintenance and utility work areas, and (2) specifically, the most effective methods of communicating the need for increased caution to the motorist. In this regard it is recommended that research on the effectiveness of various traffic control practices and devices in highway work areas be continued.
Because of the inherent difficulties involved in using acci- dent data it is recommended that research be undertaken to evaluate highway work area traffic control procedures by criteria other than reported accidents. The application of methods such as the traffic
29

conflicts technique to a variety of field installations may provide a great deal of insight into what motorists expect to encounter.
Finally, it is recommended that a study be undertaken to de- termine the special traffic control problems and needs in highway work zones in urbanized areas.
3O
l
REFERENCES
Instructions for the Filing of Accident Report Forms SR-300 Police, Commonwealth of Virginia, Departmen,t of State Police and Division of Motor Vehicles (Used prior to January i, 1978).
Police Officer's Instruction Manual for Investigating Traffic Accidents FR-300M, Commonwealth of Virginia, Division of Motor Vehicles (used after January i, 1978).
Coding Manual for Highway Analysis of Motor Vehicle Accidents, Joint Venture of the Department of State Police Division of Safety and the Department of Highways Division of Traffic and Safety, Commonwealth of Virginia, January i, 1977.
Virginia• Crash F.actS ,...
1977, Commonwealth Of Virgini• Department of State Police,
Summary, of. A..,,.ccide,n...t D.a,,t.a. 1.976 Department Tmansportatmon. Commonwealth of Vimginia.
of Highway and
31


APPENDIX
ACCIDENT REPORT FORMS
Accident Report Form (sides i and 2) Used prior
to January i, 1978
Accident Report Form (with overlay) Used since
January i, 1978

IF QUESTIOIt OOES NOT APPLY, ENT• AN "X". IF AN ANSWER IS UNKNOWN, ENTER A "U". "9TNER" EXPLAIN iN ACCIOCdlT DESCRIPTION. FR.3OOP •/78
TRAFRC CONTROL
1, NO TRAFFIC CONTROL 2. 0FF•CER OR WATCHMAN 3. TRAFFIC SIGNAL
STOP SIGN 5. SLOW OR WARNING SIGN ft. TRAFFIC LANES MARKED • NO PASSING LINES
YIELD SIGN 91 0NE 'NAY ROAD 0R STREET 10. ,RAILROAO CROSSING WITH MARKINGS ANO SIGNS 11. RAILROAO CROSSING WITH SIGNALS 12. RAILROAD CROS•Nf3 WITH GATE AND SIGNALS 13. OTHER
9•VF.R• ACTION
2. EXCEEDED SPEED LIMIT 3. EXCEEDED SAFE SPEED BUT NOT SPEED LIMIT 4. OVERTAKING ON HILL 5. OVERTAKING ON CURVE 6. OVERTAKING AT INTERSECTION '7. IMPROPER PASSING OF SCHOOL BUS B. CUFFING IN g. OTHER IMPROPER PASSING
10. WRONG SiDE OF POAO NOT OVERTAKING 11. DID NOT HAVE RIGHT OF-WAY 12. FOLLOWING TOO CLOSE 13. FAIL TO SIGNAL OR IMPROPER SK•NAL
20. DISREGARDED OFRCER OR WATCHMAN 21. DISREGARDED STOP GO L!GHT 22. DISREGARDED STOP OR YIELD SIGN 23. DRIVER INATTENTION 24. FAIL TO STOP AT THROUGH HIGHWAY NO SiGN 25. DRIVE THROUGH SAFET• ZONE 26. FAIL TO SET OUT FLARES OR FLAGS 27. FAIL TO DIM HEADLIGHTS 28. DRIVING WITHOUT LIGHTS 29. iMPROPER PARKING LOCAI'ION 30. AVOIDING PEDESTRIAN 31. AVOIDING 0FHER VEHICLE
vEHICLE--"--J i"•8
. AS A • • CO.•
0• • •.•,
• B• •1 •T IMP"OPER TURN- WIOE RIGHT TURN 32. kVOIOING AN•IAL
•. 'MPROPER TURN-CUT CORNER ON LEFT TURN 3& CROWDED OFF ROADWAY 1. YES 16 IMPROPER TURN FROM WRONG LANE 34. HIT AND RUN 2. NO 17. OTHER IMPROPER TURNING 35. CAR RAN AWAY NO 0RIVER
18. IMPROPER BACKING 36. BLINOED BY LIGHTS "AI'IG'•T, 19. IMPROPER START FROM PARKED POSITION 37. OTHER VIOLATIONS
1. STRAIGHT LEVEL 6. HILLCREST -CURVE YENCLE MANEgYER 2. CURVE-LEVEL 7. OIP- STRAIGHT 3. GRAOE STRAIGHT B. DiP- CURVE 4. GRAOE CURVE 9. OTHER 1. GOING STRAIGHT AHEAD 6. STARTING IN TRAFFIC LANE 11. PARKED L• 5. HILLCREST STRAIGHT 2. MAKING RIGHT TURN STARTING FROM PARKED POSITION 12. BACKING
4. MAKING U TURN 9. RAN OFF ROAO-RIGHT 14. CHANGING LANES WE 3. MAKING LEFT TURN 8. STOPPED IN TRAFFIC LANE 13. PASSING
5. SLOWING OR STOPt•NG 10 RAN OFF ROAD LEFT 15. OTHER
4. MIST 9. OTHER 1-REAR END 9. FIXED OBJECT-OFF ROAO 5. RAINING 2. ANGLE I0. 0EER 3. HEAD ON 11. OTHER ANIMAL SECONO EVENT: VEHICLE, 2= 4. SIDESWIPE SAME DIRECTION 12. PEDESTRIAN NOr• • SURFAI• CONOITION 5. S•OESWIPE -OPPOSITE D•ECTION 13. BICYCLIST •
1. DRY 5. MLIOOY B. RXED OBJECT IN ROAD 14. MOTORCYCLIST •,5 2. WET 6. OILY 7. TRAIN 15. BACKED INTO
•.H•2E
NO OEFECTS RESTRICTED WIDTH 2. TREES 7. BRIDGE UNDERPASS, CULVERT. ETC.
•" 21 •t.ES. 3. u'nUTY POLE B. •N. TRAFFIC SIGNAL RUTS. BU•PS PAVEMENT 4. FENCE OR FENCE POST 9. IMPACT CUSHIONING DEVICE
•/ 3. SOFT OR LOW SHOULDER 8. ROAOWAY 08STRLICTEO ,5. GUARD RAIL OR POST 10. OTHER •,6 4. UNDER REPAIR 9. OTHER DEFECTS
•' 1. NOT 0OSCUREO 8. SIGNBOARD
• 3. W•NOSH•-LO OTHERWISE OBSCURED 10. PARKED VEHICLES DAWN •. W•N OmSCURED BY LOAO ON VEHICLE 1',. MOVING VEHICLES
• 2. DAYLIGHT ,5. TREES. CROPS. ETC. 12. SUN OR HEADLIGHT GLARE K,,• 3. •SK 6. BUILDING 13. OTHER NO_2-'/ • 4. DARKNESS. STREET 0g HIGHWAY LIGHTED 7. EMBANKMENT
'"q 5. DARKNESS STREET OR HIGHWAY NOT LIGHTED COMMONWEALTN OF¥11•INIA CONDITION
OF •lllVrr.•S AND P•I•$TRIAN o,vmoN o• •o•o• vBcus
•. NO DEFECTS ••...._• KIND OF LOC4LITY POLICE ACCIDENT REPORT • HEARINGEYES;GHTDEFECTIvEDEFECTIVE
4. OTHER BODY DEFECTS • • 5. BUSINESS/tNOUSTR,AL iNJURY TYPE Z. CHURCH 6. RESE}ENTIAL 5. iLL f-""-I/ PLAYGROUNO 7. INTERSTATE fi. FATIGUEO 41 OPEN COUNTRY ft. OTHER I. DEAO BEFORE REPORT MADE 7. APPARENTLY ASLEEP pEDE__•.__. _•=
5TBIAN 30
WHICH VEHICLE OCCUPtEO
1. 'VEHICLE NO. 2. VEHICLE NO.
B. BICYCLIST PEDESTRIAN
POSITION IN/ON VEHICLE
.1. DRmVER Z:7. PASSF, N•ERS 8. F{IOINGtHANGING ON OUTSIOE
SAFE'TY EOUII•IENI USB}
,",tO RESTRAINT USED 2. LAP BELT 3. HARNE•
LAP BELT ANO HARNESS 5. CHILD. BES•AINT ft, AIR BAG
FROM VEHICLE
1. NOT EJECTED 2. PARTIALLY EJECTED 3. E,ECTE0
O•TORTEO MEMBER: OR HAO TO BE CARRIED FROM SCENE 3. OTHER VISIBLE INJURY. AS BRUISES. ABRASIONS, SWELUNG, LIMI•IG. ETC. 4. NO VISIBLE INJURY BUT COMPLAINT OF PAIN OR
0. OTHER MOMENTARY UNCONSCIOUSNESS
i•IAN A•I'IONS
OTHER
1. CROSSING AT INTERSECTION WITH SIGNAL 2. CROSSING AT INTERSECTION AGAINST SIGNAL 3. CROSSING AT INTERSEOTION NO SIGNAL 4. CROSSING. AT INTERSECTION DIAGONALLY 5. CROSSbNG NOT AT iNTERSECTION RURAL 6. CROSSING NOT AT INTERSECTION GRBAN 7. COMING FROM BEHINO PARKED CARS 8. GEl'rING OFF OR ON SCH(•L BUS 9. PLAYING IN ROAOWAY
10. GETTING OFF OR ON OTHER VEHICLE 11. HITCHING ON VEHICLE 12. WALKING IN ROAOWAY WITH TRAFFIC.
SIDEWALKS AVAILABLE 13. WALKING IN ROAOWAY WITH TRAFI:qC
SIDEWALKS NOT AVAILABLE 14. •NALKING IN ROADWAY AGAINST TRAFFIC.
SIDEWALKS AVAILABLE 15. WALKING IN ROADWAY AGAINST TRAFFIC.
SIDEWALKS NOT AVAILABLE 16. 'NORKING IN ROADWAY 17. STANDING IN ROADWAY •8. LYING IN ROADWAY 19. ,NOT IN ROADWAY 20. OTHER
DRINKIN6 V• •,•.....• ,•,/NO.
1. HAD NOT BEEN 0RINKING ..•
2. 0PINKING- OBVIOUSLY DRUNK 3. DRINKING- ABILITY IMPAIRED 4. 0RINKING ABILITY NOT IMPAIRED 5. DRINKING NOT KNOWN WHETHER IMPAIRED
VEHICLE CONDITION
!. NO 0EFECTS i!: L}GHTS DEFECTIVE BRAKES DEFECTIVE
",/EH•CLE STEERING DEFECTIVE
SKIDOING
2. AFTER APPLICAT'ON OF BRAKES 3. BEFORE •NO AFTER ,.,•
•PPLICATION OF BRAKES •NO. • •,,/
NAMES OF iNJURED IF 0ECEASED, INCLUDE ],AFE OF OEATH
R. S0o •,:,,,. 1-73 WITHIN 5 DAYS MAIL TO: DIVISION OF MOTOR VEHICLES, BOX 27412, RICHMOND, VIRGINIA 23261 16-7• •8-91 tt0• •11• (12-13j
M IRATE DO NOT WRITE
.-
IF ACCIDENT OCCURRED tN RURAL AREA INDICATE DISTANCE IN MILES •ND TENT•$ OF MILE FROM NEAREST TOWN. USE TWO DISTANCES AND TWO OIR•C. •lONS IF NECESSARY. OF • LET
LET
TYPE •CCIOENT HAPPENED ON (•8-19-2G) (2t',
OR iF INT|IISECTING C0uPLETE CODED BY •
NOT AT INTERSECTION FEET NORTH
URBAN LOCATE TO NEAREST •NT[g%ECTING STREET •OUSE NUMBFR. TYPE
•EET •OUTN BRIDGE RAILROAD CROSSING. ALLEY DRIVEWAY UNDERPASS NUMBERED TELEPHONE POLE. OR OTHER IDENTIFYING
USING TWO DIRECTIONS =NO TWO DISTANCES IF NECESSARY. •T B.V.5. ASP OFF
ALIGNMENT (C•EC• o• WEATHER (CHECK ONE) SURFACE
(27• SURFACE CONDITION (CN(CK
(2.4)
HOLES. RUTS,
sOFA LOW 5•OQI
DE•ECTS
TRAFFIC CONTROL (cH[c• oN[]
(zs)
STOP GO LIGHT
STOP
0 YtELO
ONE RO•O
IlILIOID
NO CONtrOL
SLEETING
5MO•E-OUST
CONCRETE
_,.,,BLACKTOP
KIND OF LOCALITY
(Z6)
12 IIUSIN[$50l
RESIDENTIAL
SCNOOLtCHURCH
OPEN COUNTRY
LIGHT (c.¢c•
DAYLIGHT
DUSK
OARKNESS-$TREEt
DI•KN[SS*STNEET NOT
Your
Mike
[:)river's
Driver's Driving Occupation Experience (34) Carpenter, Clerk,
Name First Middle
Driver's
State
Parts Damaged Otll•r (38)
13OI •._•' Year Yes Type (Sedan, Truck, Taxi, Bu•, etc.)
R.F.D. •ity
Plate
1311
Drivec's
State Number
OfficeUse Only
(33t State
(32)
(Me., Day, Yr.) 1351
[] Operator Soc. [] Beginner NumOer
Estimated •j •
Speed Speed .S•eed
R.F.D. City State (36°37)
MIKe Type (Sedan, Truck, Taxi, Bus, etc.)
Driver's Name #;r•t Middle Last Street R,F.O.
Ort•et• Driving Driver's OcJ=upation •xperience License
(441 Carpeflte¢, Clerk, •Years State
Firs• Middle R.F.D.
Driver's
State
State Parts Damaged
Safety [] [] [] []
Year No Plate
(41)
City State
mated Speed fore
City State
Safety [] []
Approximate Repair
(40) O[•'ce Use Only
Code
(42) (43)
(Me., Day, Yr.) (45)
[] Operator Soc. [] Beginner
(46-47) Speed
M.P.H.
[] []
Approximate Repair
Property (48)
Object, Ownership, State Damage Approximate
Repair
Name (50)
A• --• 1491
153) --• 1521
Race
Address Nature
Injury
Nature Extent Injury
[] [] Passenger
(51)
[] •'] BiCyCliSt
[] (54)
[] Passenger
[] Pedestrian
LOCATION IN VEHICLE OF PERSONS KILLED AND INJURED. (CHECK
INJURIrD) VEHICLE VEHICLE
(55) (S6) (55) (56) KILLED
|EFT
FRONT CEHI•ER
LEFT
INDICATE ON THIS DIAGRAM WHAT HAPPENED.
(57• (58)
INSTRUCTIONS |. FOLLOW DOTTED LIHE$ TO OUTLI|
OF IOAOWAT PLACE ACCIDIHT. Z. NUMBEII [ACN VEHICLE AND SNOW OOR•CTI
3o USE SOLID LINE TO $NO• PATN liE]rOll| ACCJOENI' .,.m•--'•--•. DOTTID LI
4. SNOW PEDESTRIAN S. SNOW IIAILII@AD
|. SHOW DISTANCE AND OIIIECTIONS .LANOMANKS: IDENTIFY LANDMARKS
NAME NUMBER.
DESCRIBE WHAT HAPPENED
INDICATE NORTH
BY ARROW
(IIEFEII TO V(HICL[S lit NUMBEII)
•eo c•l•c
DRIVERS' ACTIONS INDICATED
DRIVER
(60) (63) 1__ IXCEEDED SP([D LIMIT
•.•.._ [XCEEDED SAFE SPIED BUT NOT SKID LIMIT
3__ OVERTAKING ON HILL
4__ OV[IITAKING ON
5____ OVIIITAKING AT INTEIISECTION
6____ ,•PNOP[II FASSING SCNOOL BUS
7___ CUTTING
8_.__ OTHEII mPROP[II PASSiNG
|__ WDONG Sml OF RO•O-NOT OVlliTAmNG
(61) (64) 12__• DID NOT HAVE IIIGNT*OF-WAT
0____ IrOLLOWlNO TOO CLOSE
1__ FAILED TO SIGNAL MPlN)P(I SIGNAL
•---- IMPIOP[II TUIIN-WIDE IIIGHT TURN
3__ mp•op(ll TUlin-CU• ¢OON[I L[• Tll•N
4__ IMpBOP(II TUIN FIIOM WliONG LANE
IMPROP[II TIIIINtlI•
6____ IMPROPER BACKING
•____ IMPlOP(II START F•M PARKED PeSITION
8____ DISIIEGARDED OFFIC[II WATCHMAN
•--__ DISIIEGAIIDED STOP-GO-LIGHT
(62) (65) 1•..___ OISIEGAID[D STOP O11 ¥1(LD SIGH
DISliIG•IID[D SLOW
FAILED TO STOP TNIIQUGN HIGNMAT-NO SiGN
2____ DROVE THROUGH SAFETY ZONE
3____ FAILID TO SIT OUT FLAR[S FLAGS
4____ FAIL[D TO DIM HL4•IGHTS
• WiTNOUT UGNT
6____ ]MPliOP(I LOCATION
7____ OTHll VIOLATIONS
8____ NO V;OLATmS
PEDESTRIAN ACTIONS (CHECK OI•E)
(67-68) 01__ CROSSING INT[IIS[CTIONoWlTN
•--.. CROSSING INT|IISECTIOII-AGAINST SIGNAl.
0• CIOSSING INT(IIS(CTIONoNO SIGNAL
04__ CROSSING INTERSECTION-DIAGONALLY
0• CROSSING NOT AT INTEIISECTION*IIMRAL
I)6• CliOSSING NOT AT INT[IISECTIOII*REBAN
07__._. COMING FROM OEm•D PARKED CARS
0•.__ G(TTIIIG OFF OR ON SCNOOL
01__ •A'VN0S iS RO,AOWAV
|0__ G• OFF O11 ON DTHIB Vlm•LE
1•___ IALKING IIO, ADIAI TIIAFIrlC-SIDIIALK| AVAILARI,.E
13____ IALKING •DIAT TIAFFIC-.SlDllALEI NOT AVAILABLE
14..,,.,.,... IALKING IIOADIAI TIAFFIC-SIOEIALKS AVAILADt,.E
15...__ AGAINST TIAFFIC-SI•IALKS NOT AVAILAIL
16__ wORE(raG NO•OWAT
17__ STAnmmS llOAOWAl
18____ IIOAOWAT
19__ NOT ROADWAY
iCONDITION OF DRIVERS AND PEDESTRIAN
P[D
(71) (73)
NO DEFECTS
ETESIG.T OL•ECTIVl
NIAEtNG O[FICTIV|
OTHER lOOT olJrlCTS
FATIGMEO
APPARENTLY ASLEEP
OTHII Na•OICAP
MAD NOT Olin DII•NKIIIG
0 DRINKING-OIVlOIISL O•UNN
DRINKING-AIIUTT IMPAIII(O
2__ DIIINI(ING.ARIUTT NOT IMPAII[O
3--.__ DroninG-NOt KNOWN INETMEII MPAIIIEO
VEHICLE CONDITION, ,__o,,c
VEHI¢I,[
(75) (76) •---- DEFECTS
1---- LIGHTS D[FICTIV!
2__ .,KIS OEFECT,Vl
STEEliNG OEFtCt•vl
4.___ ,Um:TUliE RI.O•IT
5__-- WO•H ON SUCR TIN.
P+__ OTmll DIFICTI
WHAT DRIVERS WERE DOING (C.iCK •.1 FOR •CN omvlll)
DRIVER
• STIIAllltT AHEAD
MAEING fliGHT TURN
MAKING LIFT TUIIN
MAKING TURN
SLOWING O11 STOPPiNG
STAIITING TRAFFIC LANE
STAIITING FROM PAIIKIO POSlTIO
STOPPED TRAFFIC LAII(
PARKED
|ACKIHG
Possm•
DRIVER VISION OBSCURED
DRIVER
IIAIH. SNOW. ETC. MINDSNIELD
WINDSHIELD OTllEiWll[ DOKIIII
VlSMII ONS4",UIID LOA• ON VIUI
TillS. CIIOPS. ETC.
IOILDING
[MUANKMENT
NILLCIIIST
PARKED VENICLES
VINICLES
SPECIFY OTHER
NOT ODSCUIIED
fflTNlS•
SIGNATURE. O•CUPA| oll0vu
SlGNATUll OF PELION SBIMITTING IEPORT IS IEODIIID DATE OP ,u•f (77) IF FILED BY POLICE BADGE NO. DEPT. •']
I,

•IfI•S•N CtJTf•r•l•i• ZP f•II. IOSCTOtJTrI,rISOII•LA(I•
FtAILROAO•ItO•SING SIGNIL• II. DID H•VE •I•HT-OF.WAY 29. IP•PI4OPER P•RKING LOCATION
13 OTHER 13. FAIL TO SIGP•AL OR IMPROPER SIGNAL 31 AVOIDING OTHER VEHICLE • WAS TRAFFIC CONTROL DEVICE WORKING
IMPROPER TURN-WIDE nlGI4T TLInN 32. AVOIDING ANIMAL 15. IMPROPER TURN.CUT CORN[•t ON LEFT TURN ]], CROWDED OFF ROADWAY 16. IMPROPER TURN FROM WRONG LANE 34 AND RUN BEFORE ACCIDENT? IT. OTHER IMPROPER ¢URNING 35 CAR RAN AW&Y-NO DRIVER • YES 18. IMPROPER BACKING 3•. OLINOEO BY LIGHTS •O 19. IMPROPER START FROM P•RKED POSITION 37 OTi4ER VIOLATIONS ALIGNMENT
STR•tGHT.L EVEL H•LLCRERT.CURVE CURVE LEVEL Ol• STn•IGHT VEHICLE MANEUVER
• • CHlOE.STRaiGHT 8 DIP CURVE GOING STRAIGHT AHEAD 6. STARTING tRAFFIC LANE 11. PARKED • GRADE CURVE •. OTHER 2. MAKING RIGHT TURN STARTING FROKe PARKED POSITION 12. BACKIF•G
HILLCREST STRAIGHr 3. MAW•NG LEFT TURN STOPPFO TRAFFIC LANE I•. PASSING MAKING U-TURf4 9. RAN OFF •O•0 RIGHT 14 CHANGING LANE• 5. SLOWING OR STO•ING 10. RAN OFF ROAO.LEFT I•. OTHER
WEATHER
CLEAR SNOWING • CLOUOV SLEETING TYPEOF COLLISION ¢=RST EVENT: • FOG 8. SMOKE OUST
I. REAR END 9. FIXED OBJECT -OFF ROAD M=ST •. OTHER 2. ANGLE 10. DEER R•INING 3, HEAO ON OTHER ANIMAL 4. SIDESWIPE SAME DIRECTION 12 PEDESTRIAN SECONO EVENT: 5. SIOESWIPE-OPPOSITE OIRECTION 13. B•CVCL=ST
SURFACE CONDITION 6. F=XEO OBJECT •N ROAO MOTORCYCLIST 7. TRAIN 15. 8ACKEO INTO • DRY 5, UOOY 8. NON:COLLISION 16. OTHER
• WET S, O•LV • SNOW• 7. OTHER • ICY COLLISION WITH FIXED OBJECT
I BANK OR LEDGE 6. PA•KEO VEHICLE 2. T•Sv
p.,,• On,OGE. UNDERPASS.CULVERT, ETC.
ROADWAY DEFECTS 3. u OLE B. SIGN. TRAFFIC SIGNAL NO DEFECTS •. RESTRICTED WIDTH 4. FENCE OR FENCE POST 9- IMPACT CUSHIONING DEVICE • 2. HOLES. RUTS. BUMPS 7 SL•CK P•EMENT 5. GUARD RAIL OR POST 10. OTHER
• •. SO• O• LOW S•4OULOER 8. ROADWAY OBSTRUCTED 4. UNOER •EP•lH •. OTHER DEFECTS 5. LOOSE M&TERt•L DRIVER VISION OBSCURED
NOT OBSCURED 8. SIGNflOARO RAIN. SNOW, ETC ON WINOSHIELO •, HILL GRFqT
V LIGHT 3. WINDSHIELD OTHERWISE OBSCURED 10 PARKED VEHICLES
4. VISION OBSCURED BY LO•O ON VEHICLE 11. MOVING VEHICLES 5. TREES, CRO•. ETC. I•. SUN OR HEADLIGHT GLARE
3. OTHER
10•WN 2. DAYLIGHT 3. DUSK
6. BUILOING
OIRKNESS.STREET OR HIGHWAY LIGHTED 7. EMOANKMENT
OF DIVISION OF MO •OR VEHICLES CONDITION OF ORIVERS • PEOESTRIAN P N ,. •o o•, Ec •s
• •CHOOL $. 0USlNESS/INOUSTRIAL 3. HEARING DEFECTIVE
VEHICLE 2 CHURCH RESIDENTIAL OTHER BOOY DEFECTS N• LE
• 3. PLAY.ROUND 7 INTERSTAte 0
u.m+•+, e+c.
WHICH VEHICLE O•CUP•EO mOmeNt•m+ UNCONSOOUSNeSS Om•NK•NG v•C•e
VEHICLE NO g. BICYCLIST O. OTHER HAD NOT BEEN OR'NKING N• VEHICLE NO. P. PEDESTRIAN 20RINKING DEVIOUSLY DRUNK
3. DRINKING.A•ILITY IMPAIREO PEDESTRIAN ACTIONS DRINKING.ABiLITY NOT IMPAIRED VE•ICLE
DRINKING.NOT KN•N WHETHER IMPAIRED NOlO "=•2 POSITION IN/ON •EHICLE
I. CROSSING AT INTERSECTION-WITH SIGNAL
I. DRIVER 2.7 PASSENGERS 2. CROSSING AT INTERSECTION AGAINST SIGNAL
8. RIDING/HANGING ON OUTSIDE 3. CROSSING AT INTERSECTION NO SIGNAL CROSSING AT INTERSECTION•IAGONALLY PEDESTRIAN
5. CR•SING NOT AT INTERSECTION-RURAL 6. CROSSING •T AT •NTERSECT•ON-URBAN V
SAFETY EQUI•ENT USED 7. COMING FROM BEHIND PARKED CARS VEHICLE CONDITION 8. GETTING OFF OR ON SCHOOL 8US
NO DEFEC NO RESTRAINT USEO 7. OTHER g. PLAYING IN ROADWAY
LIGHTS DEFECTIVE VEHICLE 2. LAP BELT 10. GETTING OFF OR ON OTHER VEH CLE •IC•E
3. •NESS A L•P BELT AND H•RNESI 1•. HtT•HING ON VEHICLE 43 STEERtNG•R•KE• OEEE•ECTIvEECTtVE NO.
/ • S. CHILD RESTRAINT •2. WALKING ROADWAY WI•N TRaFfIC. SIOEW•LKS AV•ILA•LE S. •UNC•URE 0 BLO•UT •. AIR BAG
13. WALKING IN ROADWAY Wit TRAFFIC, H•CLE WORN O SLICK TIRES VEHICLE MOTOR TROUBLE NO SlOEWALKS NOT VA LABLE O
8•8 14, WALKING IN ROADWAY AGAINST TRAFFIC. 8. CHAINS IN USE • WA K 90THEROEFECT• EJECTION FROM VEHICLE OE 8LE 15. WALKING IN ROAOWA• AGAINST TRAFFIC,
NOT EJECTEO SIOEWALKS NOT AVAILABLE 2. PARTIALLY EJECTEO 16 WORKING IN ROADWAY SKIDDING VE)•C•E 3. EJECTED
2. AFTER APPLICATION OF BRAKES
BIRTH DATE SEX •. OTHER APPLICATION OF BRAKES
MONTH DAY YEAR • • • • • • • • • NAMESOF INJURED IF DECEASED, INCLUDE DATE OF OE•TH
OVERLAY FOR POLICE REPORT

Month[ Day Year • OR TOWN • OF
ROUTE NO. OR STREET NAME AT SCENE
COMMONWEALTH OF VIRGINIA OIVISION OF MOTOR VEHICLES DMV COPY POLICE ACCIDENT REPORT
AM PM I•F WITHIN 150 FEET
N S W
FR-3OOP 1/78
ROUTE NUMBER OR STREET NAME
DRIVERS NAME (LAST, FIRST, MIDDLE)
ADDRESS (STREET & NO.)
VEHICLE NO.
OCCUPATION
CITY
"',,,4 DATE OF BIRTH ]SEX DRIVER'S LICENSE NUMBER Month Day Year]
VEHICLE OWNER'S NAME (LAST, FIRST, MIDDLE)
I•DDRESS (STI•EET '• NO.)
YEARS OF DRIVING EXPERIENCE
STAT• ZIP CODE
VEHII•.E NO. (OR PEOESTRIAN) DRIVER'S NAME (LAST, FIRST, MIDOLE) OCCUPATION
ADDRESS (STREET & NO.)
CITY r•)TATE
ISTATE [I::)ATEOFBIRTH ISE• IDRIVER'SLICENSENUMBER] IM°nm] Oay Year
VEHICLE OWNER'S NAME (LAST, FIRST, MIODLE)
YEARS OF DRIVING EXPERIENCE
ZIP COOE
STATE
ADDR•S• (STREET & NO.)
MAKE & TYPE OF VEHICLE (SHOW MOPED, MOTORCYCLE, AMBULANCE, ETC TYPE OF VEHICLE (SHOW MOTORCYCLE, .AMBULANCE, ETC YEAR •3OST
61 LICENSE PLATE NUI•BER' A'
STATE NAME OF I•ISURA•ICE CO. (NOT A(•EN:r). L)CEN--'--S' PLATE NUMBER STAT•-i,AME OF INSUR•I,•IC• •. ('•l; AGENT
]D M GE TO r'k, OBJECT STRUCK (TREE FENCE, ETC.) OWNER'• NAI•IE' (LAST FIRS'I: I•II"DDLE) ADDRESS -R•.PAIR COST PROPERTY IX,
[OTHER THAN / VEHICLES V
VEHICLE NO. DAMAGE
CHECK POINTS OF IMPACT
FRONT .J•[,
SPEED •AxiMuM 'BEFORE LIM
,A, CC•DEN•" ,T, SAF•
ACCIDENT DIAGRAM
N•1 DAMAG'•S: • OVERTURNED
UNKNOWN •-'I
NO DAMAGE MOTOR ACCIDENT .DESCRIPTION:
OFFENSES CHARGED ORIV.ER:
10 11 12
UNDERCARRIAGE
TOTALED
VEHICLE NO. DAMAGE CHECK POINTS OF IMPACT
FRONT oJ•,,1
•" • a •-.,, .,"4
'i"' OTHER UNK, NOWN J'• NO, DAMAGE MOTOR TOTALED l, OTHER
13 14 15 16 NAMES OF INJURED -IF DECEASED, INCLUDE-DATE OF DEATH
RE•/II•WING oFFICER DATE REPORT FILED