Accident Analysis and Barrier Function (AEB) Method
25
SKI Report 00:6 KSSSSSSSSSSSSSSSSSSSSSSSSSSSSSSSSSS^^ Accident Analysis and Barrier Function (AEB) Method Manual for Incident Analysis Ola Svenson February 2000 ISSN 1104-1374 ISRNSKI-R-00/6-SE SKI
Transcript of Accident Analysis and Barrier Function (AEB) Method
SKI Report 00:6KSSSSSSSSSSSSSSSSSSSSSSSSSSSSSSSSSS^^
Accident Analysis and BarrierFunction (AEB) Method
Manual for Incident Analysis
Ola Svenson
February 2000
ISSN 1104-1374ISRNSKI-R-00/6-SE SKI

SKI Report 00:6
Accident Analysis and BarrierFunction (AEB) Method
Manual for Incident Analysis
Ola Svenson
Stockholm University, Department of Psychology, SE-106 91 Stockholm,SwedenandNetherlands Institute for Advanced Study in the Humanities and SocialSciences, NL-2242 Wassenaar, The Netherlands
February 2000
SKI Project Number 97176
This report concerns a study which hasbeen conducted for the Swedish NuclearPower Inspectorate (SKI) and NetherlandsInstitute for Advanced Study in the Huma-nities and Social Sciences. The conclusionsand viewpoints presented inthereportarethose of the author and do not necessarilycoincide with those of the SKI.
Summary
The Accident Analysis and Barrier Function (AEB) Method models an accident or incident as aseries of interactions between human and technical systems. In the sequence of human andtechnical errors leading to an accident there is, in principle, a possibility to arrest thedevelopment between each two successive errors. This can be done by a barrier function who,for example, can stop an operator from making an error. A barrier function can be performedby one or several barrier function systems. To illustrate, a mechanical system, a computersystem or another operator can all perform a given barrier function to stop an operator frommaking an error. The barrier function analysis consists of analysis of suggestedimprovements, the effectiveness of the improvements, the costs of implementation, probabilityof implementation, the cost of maintaining the barrier function, the probability thatmaintenance will be kept up to standards and the generalizability of the suggestedimprovement.
The AEB method is similar to the US method called HPES, but differs from that method indifferent ways. To exemplify, the AEB method has more emphasis on technical errors thanHPES. In contrast to HPES that describes a series of events, the AEB method models onlyerrors. This gives a more focused analysis making it well suited for checking other HPES-typeaccident analyses. However, the AEB method is a generic and stand-alone method that hasbeen applied in other fields than nuclear power, such as, in traffic accident analyses.
Sammanfattning [Summary in Swedish]
AEB metoden beskriver en olycka eller olyckstillbud som en serie av interaktioner mellan demanskliga och tekniska system som ar inblandade. En olycka beskrivs i en serie av manskligaoch tekniska fel som foljer pa varandra dar det mellan varje fel i princip firms en mojlighet attgenom en barriarfunktion stoppa utvecklingen. Efter upprattandet av en olycksmodell utforsbarriarfunktionsanalys. En barriarfunktion kan t ex hindra en operator att gora fel i en visssituation. Barriarfunktionen kan exekveras av ett eller flera barriarfunktionssystem. Sa kan tex ett mekanisk system, ett datorsystem eller en annan operator utfora en given barriarfunktionsom forhindrar ett och samma felaktiga beteende.Barriarfunktionsanalysen omfattar forslag av forbattringar, analys av effektiviteten i foreslagnaforbattringar, kostnader for implementering av barriarfunktionen, sannolikhet forimplementering, kostnader for att vidmakthalla barriarfunktionen, sannolikheten att underhalletav barriarfunktionen kommer att ha tillracklig kvalitet och generaliserbarheten till andrafelsekvenser.
AEB metoden har likheter med den inom karnkraften anvanda HPES, men skiljer sig franderma i olika avseenden t ex genom en storre vikt pa tekniska systemfel i analysen. Till skillnadfran HPES baserade modeller beskriver AEB endast fel och inte hela handelsesekvensen, vilketger en mer kondenserad analys. Darfor kan AEB anvandas som ett kompletterandeanalysredskap vid granskningen av HPES baserade analyser. AEB metoden ar emellertid ettgenerellt analysinstrument som har anvants pa t ex vagtrafikolyckor.

Table of Contents
Summary
2
1.
Introduction 4
2. The AEB
Model 5
2.1 Graphical Representation of the AEB Model 5
2.2 Systems and Components in the AEB model 6
2.2.1 The Human Factors
Systems 6
2.2.2 Technical
Systems 7
2.2.3 Error Event Boxes and Accident Evolution Analysis 7
2.2.4 Barrier Function Systems and Barrier Functions 8
2.2.5 Graphical Representations Used in an AEB Analysis 10
3. The
Analysis 11
3.1 Performing an AEB
Analysis 11
3.2 When not to Search Any Earlier Errors Upstream the Accident Evolution? 13
4. Barrier Function Analysis and Protected Systems Analysis 13
4.1 Barrier Function
Systems 14
4.1.1 In Depth
Analysis 14
4.1.2 Steps in Barrier Function
Analysis 15
4.2 Protected Systems Analysis
16
4.3 Systems Context Analysis: Organization and Technical Systems 16

4.4 Reporting the
Results 17
5.
References 17
6. Pictorial Examples of AEB Analyses
19
6.1 A Road Traffic
Accident 19
6.2 The Dialysis
Accident 21
6.3 A Nuclear Power Plant
Example 23
1. Introduction
The Accident Evolution and Barrier Function AEB model provides a method for analysis of
incidents and accidents that models the evolution towards an incident/accident as a series of
interactions between human and technical systems (Svenson, 1991). The interaction consists of
failures, malfunctions or errors that could lead to or have resulted in an accident. The method
forces analysts to integrate human and technical systems simultaneously when performing an
accident analysis starting with the simple flow chart technique of the method.
The flow chart initially consists of empty boxes in two parallel columns - one for the human
systems and one for the technical systems. Figure 1 provides an illustration of this diagram.
During the analysis these error boxes are identified as the failures, malfunctions or errors that
constitute the accident evolution. In general, the sequence of error boxes in the diagram
follows the time order of events. Between each pair of successive error boxes there is a
possibility to arrest the evolution towards an incident/accident. Barrier function systems (e.g.,
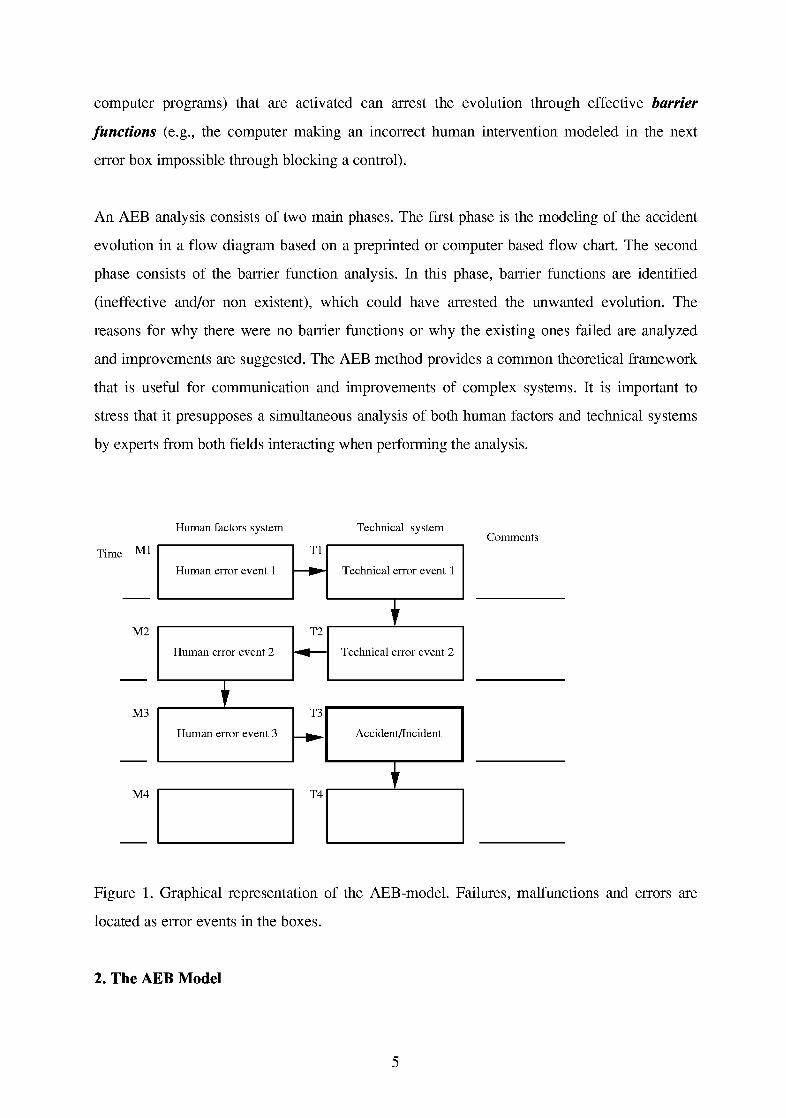
computer programs) that are activated can arrest the evolution through effective barrier
functions (e.g., the computer making an incorrect human intervention modeled in the next
error box impossible through blocking a control).
An AEB analysis consists of two main phases. The first phase is the modeling of the accident
evolution in a flow diagram based on a preprinted or computer based flow chart. The second
phase consists of the barrier function analysis. In this phase, barrier functions are identified
(ineffective and/or non existent), which could have arrested the unwanted evolution. The
reasons for why there were no barrier functions or why the existing ones failed are analyzed
and improvements are suggested. The AEB method provides a common theoretical framework
that is useful for communication and improvements of complex systems. It is important to
stress that it presupposes a simultaneous analysis of both human factors and technical systems
by experts from both fields interacting when performing the analysis.
Time Ml
Human factors system
Human error event 1
Tl
Technical system
Technical error event 1
M2
M3
M4
Human error event 2
IHuman error event 3
T2
T3
ITechnical error event 2
Accident/Incident
Comments
Figure 1. Graphical representation of the AEB-model. Failures, malfunctions and errors are
located as error events in the boxes.
2. The AEB Model

2.1 Graphical Representation of the AEB Model
As mentioned above, an incident/accident that is analyzed using the AEB method describes
the accident evolution in a flow diagram. Sometimes, the flow diagram can be only
approximately chronological because a sequential model is used to approximate the interaction
of complex systems much of which goes on simultaneously. As illustrated by Figure 1, the
AEB model makes use of a decomposition of the sequence of errors into human and a
technical systems categories. It is establishment of this sequence of error events that is the first
main focus of an AEB analysis.
2. 2 Systems and Components in the AEB Model
2. 2.1 The Human Factors Systems
Humans always play a role in an accident either as actors in the accident evolution or as
designers of failing or inadequate technology or organizations that contribute to the accident
evolution. Therefore, one of the main components in an AEB analysis is the human systems
component modeled in the left column of boxes in the flow diagram describing an accident. To
exemplify, an operator initiating an action at the wrong time would be modeled in an error box
in the human systems part of the diagram. In the right column of the flow diagram the
technological errors are located. The erroneous technological system state or process resulting
from the inappropriate operator action mentioned above, should be modeled in the next box of
the technology systems part of the diagram.
Factors that have an influence on human performance have been called performance shaping
factors (Swain & Guttman, 1983) or performance moderating factors. Examples of such
factors are alcohol, drugs, lack of sleep and stress. In applications of the AEB model those
factors are included in the flow diagram only as PSFs and they are analyzed after the diagram

has been completed. Performance shaping factors are included in the flow diagram in cases
where it is possible that the factor could have contributed to one or more human error events.
Factors such as alcohol and age, are modeled as performance shaping factors, PSFs, but never
as human error events or failing barrier functions. To exemplify, a driver who drives through
red lights under the influence of alcohol would be analyzed as an error event of "the driver
driving through red traffic signals" with alcohol (under the influence of alcohol), that is, one of
several possible PSFs.
Note, however, that AEB does not analyze organizational factors as PSFs, which contrasts
with Swain and Guttman's (1983) approach. Instead, organization can be integrated as a
barrier function system with failing or inadequate barrier functions. Organizational factors
should always be treated in a special way in AEB analyses because they include both human
and technical systems.
2.2.2 Technical Systems
As mentioned earlier the right side column of an AEB flow diagram describes technical errors.
Such errors can relate to construction, maintenance, processes and other aspects of technical
systems. An example of technical errors in the road traffic area is insufficient or failing brakes.
Also latent errors, earlier dormant in the system but revealed during the accident sequence
have to be modeled. In this case, the location of the error box can be very early in the accident
sequence or it can be located when the needed technology fails. Sometimes, it is appropriate to
repeat the latent error box in a sequence. For example, if the dormant error could have been
detected and eliminated at different points in the accident evolution there should be error boxes
at those locations. For example, a valve that is erroneously left open and that was inspected
without error detection, and finally allowed mass to pass can be modeled as open both before
inspection and before the box representing the consequence of the erroneous flow of mass.
2. 2. 3 Error Event Boxes and Accident Evolution Analysis

Failures malfunctions and errors that contribute to the development of an accident/incident are
described in the error event boxes. It is very important to stress that AEB only models errors
and that it is not an event sequence method (as, e.g., HPES, INPO, 1987). The most common
error made by novice analysts starting to use AEB is that they model also correct events. Error
event boxes are numbered and marked H for human error events, and T for technical error
events.
Arrows link the error event boxes together in order to show the evolution of the
accident/incident. It is not allowed to let more than one arrow lead to an error box. An error
box cannot have more than one arrow going from it. Because, systems interactions are
modeled, it may be tempting to try to model multiple influences or energy flows but this is not
allowed. The barrier function analysis phase can be used for modeling of subsystems
interactions that cannot be represented sequentially in AEB.
The course of events is described in an approximate chronological order. At what point in time
a certain error event occurred, is written (if such information is available) in the time column to
the left of the flow diagram. It should be pointed out that the description of the course of
events in the AEB analysis, is primarily approximately chronological, and that each link is not
always ( but in a great majority of the cases) causal. Thus, the analysis presupposes that a time
order is assigned, even if this assignment can be only approximate in some respects.
The choice of a starting point for an AEB analysis is to some extent depending on the analysts
and their knowledge and motivations. Svenson (1991) has commented on this in relation to
AEB and we shall return to this later in this manual. In addition, the definition of accident is
also partly depending on the analysts. To exemplify, a road traffic accident may provide the
definition of an accident in one analysis, while the injuries caused by the accident can be the
accident in another analysis.
Therefore, it is important to observe that the chain of errors in an AEB analysis is not
necessarily complete with the box describing the accident. The AEB model can also be applied
to analysis of courses of events following the accident event. An example of such an error
event is the above mentioned human injuries following a road accident. The purpose of
including also post accident errors is to stimulate identification of as many as possible barrier
8

functions. For example, one may ask if there are any actions that could have prevented human
injury although the accident in itself could not have been prevented. An AEB analysis can also
be used to describe hypothetical evolutions of events after the accident. In some cases, fault
event trees can be appended to the AEB analysis, when possible post accident failures and
errors are analyzed.
2. 2. 4 Barrier Function Systems and Barrier Functions
A barrier function represents a function that can arrest the accident/incident evolution so that
the next event in the chain will not be realized. A barrier function is always identified in relation
to the system(s) it protects, protected or could have protected. Barrier function systems are
the systems performing the barrier functions . Barrier function systems can be an operator, an
instruction, a physical separation, an emergency control system, other safety-related systems
etc.
The same barrier function can be performed by different barrier function systems. An example
of this is the blocking of a robot moving into a prohibited area, a function that can be
performed by an operator or a computer. Correspondingly, a barrier function system can
perform different barrier functions. An example of this is an operator who can perform a
number of different barrier functions directed towards protecting different subsystems.
An important purpose of conducting an AEB analysis is to identify broken barrier functions
and suggest how they can be improved and or supported by other yet non existing barrier
functions - often executed by other barrier function systems. Thus, in the course of events
described in an AEB analysis, barrier functions are identified that can arrest the unwanted
evolution of an accident/incident. Barrier functions belong to one of three main categories.
• Ineffective barrier functions - barrier functions that were ineffective in the sense that they
did not prevent the development toward an accident/incident.
• Non-existing barrier functions - barrier functions who, if they had been present, would
have stopped the accident/incident evolution.
• Effective barrier functions - barrier functions that actually prevented the progress toward
an accident/incident. Effective barrier functions are normally not included in an AEB
analysis except at the very end of the chain since the AEB model is based on errors.
If a particular accident/incident should happen, it is necessary that all barrier functions in the
sequence are broken and ineffective. Thus, the specific chain of malfunctions, errors, and
barrier function failures appearing in an accident evolution are sufficient for the
accident/incident to occur. The objective of an AEB analysis is to understand why a number of
barrier functions failed, and how they could be reinforced or supported by other barrier
functions. From this perspective, identification of a root-cause of an accident/incident is
meaningless. The starting point of the analysis cannot be regarded as the root cause because
the removal of any of all the other errors in the accident evolution would also eliminate the
accident.
When performing an accident analysis it is sometimes difficult to know if an error should be
modeled as an error or as a failing barrier function. This is because a barrier function failure
can sometimes be seen as an error and be modeled in a box of the diagram. To exemplify, an
error consisting of an act or function that was not performed can be modeled either as a barrier
function failure or as an error in a box. When the error is modeled in a box, this straight away
permits more detailed analyses of the two links connecting the box in the accident evolution
chain. As a rule of thumb, when uncertain the analysts should choose a box and not a barrier
function representation in the initial AEB analysis.
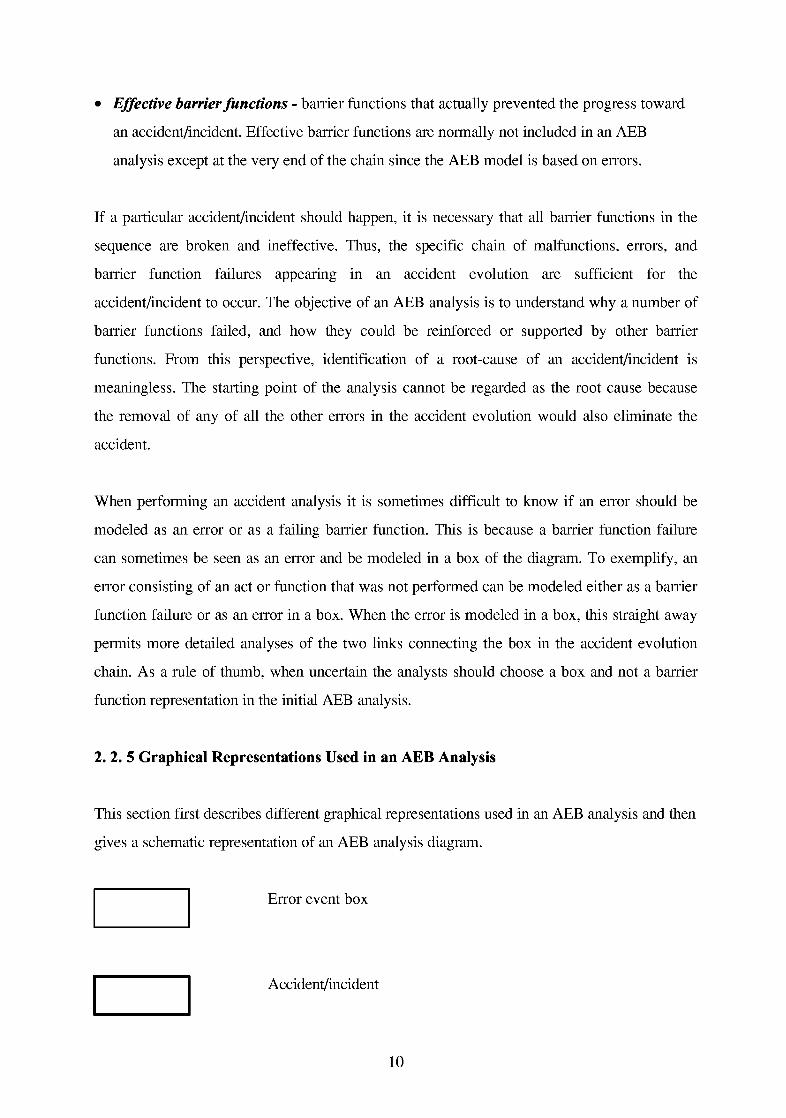
2. 2. 5 Graphical Representations Used in an AEB Analysis
This section first describes different graphical representations used in an AEB analysis and then
gives a schematic representation of an AEB analysis diagram.
Error event box
Accident/incident
10

Arrows describe the development of the accident evolution in an
approximately chronological order
Represents possible barrier functions, which could have arrested
the accident and barrier function that were ineffective. Failing and
possible barrier functions described in the margin for later barrier
function analysis.
-II-I
I
PSF
Represent a barrier function that arrested the accident evolution.
Effective barrier functions are normally not included in an AEB
analysis except at the very end of the evolution.
Represents a performance shaping factor (PSF). PSFs
are marked in the flow diagram above relevant human error event
boxes, described in the margin and later analyzed. PSFs represent
conditions , such as , tiredness and time pressure that affect human
performance. AEB does not analyze organizational factors as PSFs,
but recommends detailed analyses of the organization as a context
to the accident.
TimeHI
Human factors system Technical system
/ TlComments
Human error event 1
PSFH2
H3
H4
Human error event 2
Human error event 3
Technical error event 1 //. Failing or/and possiblebarrier functions
T2
Technical error event 2
T3
T4
Accident/Incident
Performanceshaping factor
Effective barrier function
11

Figure 2. Graphical representation of an AEB analysis. The meanings of the symbols were
described in the previous paragraph.
3. The Analysis
3.1 Performing an AEB analysis
At least two analysts should cooperate when performing an analysis. One of them should be a
human factors specialist and the other a systems expert familiar with the (technical) system that
had the accident. The following describes the different steps in an AEB analysis.
1. A general but detailed description of the accident/incident, the narrative, is first secured and
studied. The narrative can be based on data of different kinds obtained from interviews,
computer logs, written reports and other sources. The goal when establishing the narrative
is to get a very comprehensive and yet general view of what has occurred.
2. Next the first error event is located in an error box. One way of doing this is to select an
important error or failure in the middle of the diagram. Another way is to locate the
accident in the error box. Starting from the top with an early error seems less practical than
starting elsewhere.
3. Starting with the error box first marked, the analysts then identify earlier failures preceding
the first located failure and indicate them in the flow diagram. In this process several
iterations are usually needed to arrive at a accident sequence model that is satisfactory.
Failures further down the evolution toward the accident/incident are also identified if the
analysis did not start with the final accident. The description of the course of error events
includes identification of barrier functions that failed to arrest the sequence towards an
accident/incident.
4. As a fourth step, the flow diagram is completed with barrier functions that could have
arrested the accident evolution chain. The goal is to identify sequences where barrier
functions could have been present to prevent the same or a similar accident evolution. A
recommendation is to go through the evolution chain starting from the top and to analyze
every link between consecutive error event boxes and try to find out if some possible barrier
function could have arrested the development. This can be done several times by experts
12

with different backgrounds. For some of these barrier functions, there are existing technical,
human factors or organizational solutions, but for others those solutions have to be invented
by the analysts.
5. Each existing barrier function is analyzed according to the guidelines provided later in this
manual in the section about barrier function analysis.
6. Characteristics of the technical, human factors and organizational systems which may
change the strength of each existing barrier function are identified.
7. This step includes a presentation of proposals for new barrier functions and what is needed
for their maintenance.
8. Finally, an AEB analysis concludes with a written document giving the account of the
accident and recommendations concerning how to improve safety of the systems analyzed.
3.2 When not to Search Any Earlier Errors Upstream the Accident Evolution ?
There are four informal criteria that often seem to be used to stop an accident analysis from
going further back. Thus, an analysis can be stopped when:
• the chain of events cannot be traced further backwards in time because necessary
information is missing.
• a well known abnormal event has been found and accepted as a valid explanation. Here,
there is, a risk of routine errors or errors that fit the fashion of the time as initiating errors in
an accident evolution sequence.
• a barrier function is encountered that can be easily fixed perhaps as a result of earlier
experience. There is the obvious risk of accepting just one effective barrier function as the
most prominent even though defense in depth requires several effective barrier functions.
• there is input to a system from another less well known system. This stop rule depends on
the analyst's background. To exemplify, if an electrician makes the analysis and finds out
that an incident was caused by a human error, his analysis is likely not to go further back
beyond a human error. In contrast, an analysis performed by a human factors expert would
go further back in order to discover the evolution beyond the human error.
13

4. Barrier Function Analysis and Protected Systems Analysis
A broken or non-existing barrier function signals that there is something wrong. There is a
protected system and there are barrier function systems. In order to avoid further errors the
barrier function systems can be changed or the protected system can be changed. A failing
barrier function system can be substituted or reinforced. But the protected system can also
be changed to eliminate failures in the future. In addition, the context of the systems can be
changed to improve safety. For example, organizational routines or technical solutions can
be altered to avoid future risks of malfunction and error.
4.1 Barrier Function Systems
Before the first error box and between all pairs of consecutive errors there are opportunities
for barrier functions to arrest the accident evolution. In the barrier function analysis all these
possibilities are considered. Therefore, the analysis starts from the top of the AEB diagram
and proceeds down towards the accident.
As mentioned earlier, barrier functions are defined by the system(s) they protect and the
system(s) that execute the barrier function. The essential point is to find barrier functions
protecting the system, and other conditions being equal, it does not matter which barrier
function system executes a particular barrier function as long as it is effective.
In the first round of analysis all existing barrier functions are identified including the last
barrier function(s) that, hopefully, arrested the incident. When this has been done, the
diagram is again processed, this time with the purpose of finding means to strengthen
existing barrier functions and/or alternative barrier systems to execute the functions that
failed. To give an example of the former, improved training could strengthen an operator as
a barrier function system. An example of the latter is that when an operator makes a
commission error (the operator did something that the technology was not prepared for as
input) this could have been blocked by a computer safety system. Then the barrier functions
would be performed by that system.
4.1.1 In Depth Analysis
14

Some barrier functions are candidates for systematic in depth analysis. Such analyses can be
performed using different techniques. One such technique is to apply AEB once more, but
now in a level 2 analysis., The error following the failing barrier function that one wants to
analyze is modeled as the accident in the level 2 analysis. The failing barrier function is
modeled as an AEB series of error boxes, when the detailed story behind a failing barrier
function is analyzed. Another technique is the causal tree technique with "and" nodes, in
which the failing barrier function is given the top position and the different conditions that
could be derived behind the failure are interconnected in the tree. After another level of
AEB or other kinds of analysis follow, namely general organizational, technical and human
factors systems analyses.
Figure level 2 AEB analysis
15

However, for practical reasons, most barrier functions are analyzed directly using
engineering and human factors expertise. When this is done it is important both to follow
some kind of scheme and to document the sources to the evidence that the analysts use.
4.1.2 Steps in Barrier Function Analysis
For each existing and possible barrier function position, the analysts should first indicate the
system(s) executing the function.
First, improvements concerning existing barrier functions.
(1) Suggested improvements.
(2) The effectiveness of the suggested improvements if implemented, e.g., the probability
that the improvements will arrest another accident.
(3) The costs of implementation - manpower, economy and other aspects.
(4) Probability of implementation
(5) The costs of maintaining the barrier function - manpower, human attention resources,
economy etc.
(6) The probability that maintenance will be kept up to standards
(7) The generalizability (to other accident sequences) of the suggested improvement.
Second, following this analysis (or in parallel), possible barrier functions (other than those
who failed) are listed. The above sequence, from (1) to (7) is then followed in the analysis
of the suggested barrier functions and barrier function systems.
4.2 Protected Systems Analysis
Subsystems that should be protected by barrier functions in complex technological systems
are integrated in those complex systems. In addition to questions concerning barrier
function systems, there are issues related to the protected subsystems. If protected
subsystems that are likely to fail are substituted with less failure prone systems, a risk has
been decreased or eliminated. The two most important questions concerning protected
subsystems are.
(1) Can the protected subsystem be substituted by another and safer subsystem?
(2) Can the protected subsystem be eliminated?
16

If the answer is yes to any of these questions, the new situation has to be assessed in a risk
analysis.
4.3 Systems Context Analysis: Organization and Technical Systems
All barrier function failures, incidents and accidents take place in man - technology -
organization contexts. Therefore, an AEB analysis also includes issues about the context in
which the incident or accident took place. The organizational and technological context
provides the framework for an accident. Therefore, the following questions have to be
answered.
(1) To increase safety, how is it possible to change the organization, in which the failure,
incident or accident took place?
(2) To increase safety, how is it possible to change the technical systems context, in which
the failure, incident or accident took place?
It is very important to stress that when changes are made at in the organizational and
technical systems at the context level far reaching effects can be attained. In general, the
higher in the organizational context a change is made, the more general and wide spread are
the effects. To exemplify, improving the organization for maintenance and or changing the
safety culture in a plant influences not only the sequence in which the accident occurred, but
also other sequences that can be safer in the future. Theory and application of organizations
and of technical process systems are the tools for understanding fundamental problems at
the organizational and technical systems levels identified in an AEB analysis.
4.4 Reporting the Results
Just as in all accident analysis methods a well structured results and recommendation
section should follow the analysis. It is recommended that forms for collecting the data are
prepared in advance and that the structure of the forms are used when summarizing the
results. Examples of flow diagram charts are given last and the forms used in the analyses
according to 4.1 - 4.3 can easily be prepared by the analysts themselves.
5. References
Svenson, O. (1990) The Accident Evolution and Barrier Model Applied to incident analysis
in the processing industries. Paper presented at the International Atomic Energy Agency:
17
Technical Committee Meeting on "Human reliability data collection and modeling".
February 26 - March 2, 1990.
Svenson, O. (1991) The accident evolution and barrier function (AEB) model applied to
incident analysis in the processing industries. Risk Analysis, 11, 499 - 507.
Svenson, O., Lekberg, A. & Johansson, A.E.L. (1999) On perspective, expertise and
differences in accident analyses: Arguments for a multidisciplinary integrated approach.
Ergonomics, in press.
Acknowledgements
This manual is based on the paper by Svenson (1991), in which the AEB model was
presented in a fully developed form. After the publication of that paper, applications
followed of which Svenson et al. (1999) is the most recent. Among the persons who have
worked with applications of the AEB method, I want to mention Lars Andemo, Irene
Blom, Anne Edland, Pia Jacobsson, Lena Jacobsson Kecklund, Gunnar Johansson, Anders
Johansson Hammarberg, Christer Karlsson, Anna Lekberg, Nils Malmsten and Petra
Sjostedt. I learned a lot from you all. In particular, I want to thank Anne Edland and Nils
Malmsten who co-authored an early Swedish manual. Thank you all.
18

5. Examples
All examples in this section are based on real accidents.
5.1 Example 1 - A Road Traffic Accident
General description of the accidentA car is driven northwards on a highway in daylight. The surface of the road is wet from astrong shower of rain with pools of water. The driver is in the left lane after having passed car.While the road curves to the right, the driver intends to bring the vehicle back into the rightlane. During the maneuver the car skids and the driver looses control. The car spins aroundand goes backwards off the road ending up on the roof.
19

Human factors systemPSF
Technical system CommentsIII
Driver missjudges thesituation/risk.
112
- ^
The road is incorrectlyconstructed, pools ofwater left on the road
PSF TDriver drives too fast • Car is driven too
fast
LDriver makes a toosharp steering maneuver
Car changes lanestoo fast
¥ //4
Back tyres are too worn
Worn bumper +heavy load
1Car skids
Personal injury +car damage
111. Correct the road way112. Education
//3. Education, or physicalobstacle, to make it impossibleto change lane
IIA. Change back tyres
1/5. Improve bumper
116. Seat belt,Air bag?
20
5. 2 Example 2 - The Dialysis Accident
General description of the accident
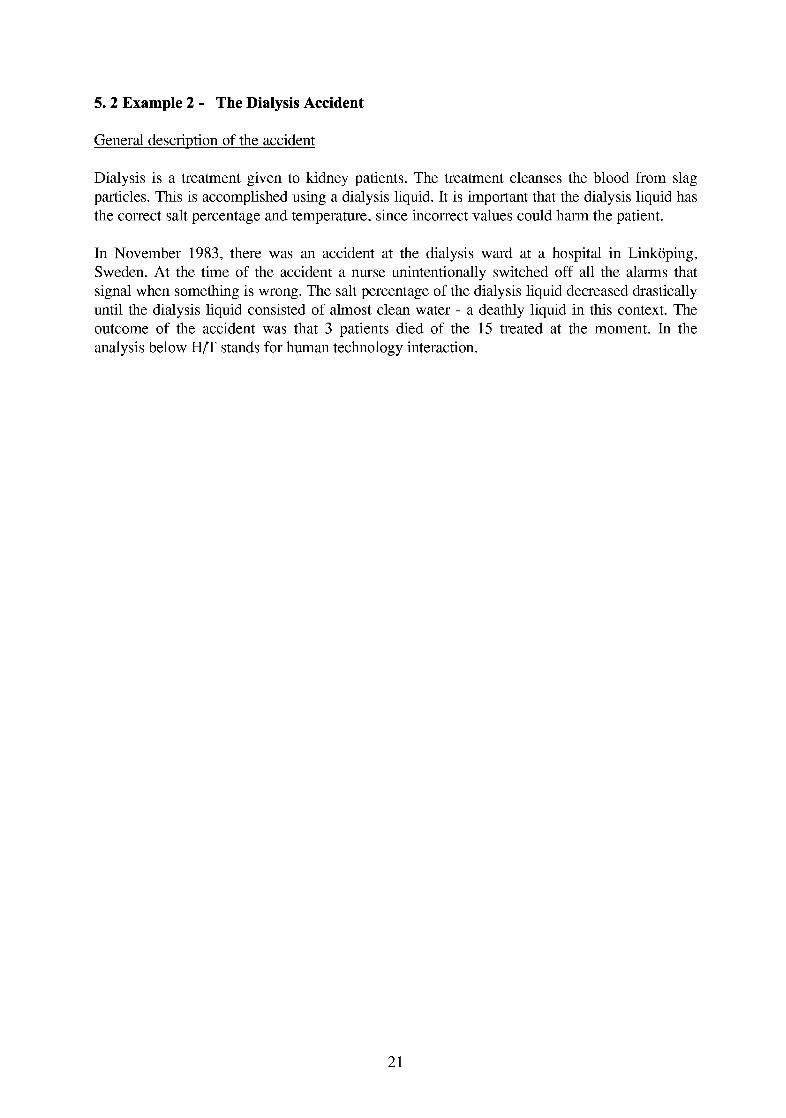
Dialysis is a treatment given to kidney patients. The treatment cleanses the blood from slagparticles. This is accomplished using a dialysis liquid. It is important that the dialysis liquid hasthe correct salt percentage and temperature, since incorrect values could harm the patient.
In November 1983, there was an accident at the dialysis ward at a hospital in Linkoping,Sweden. At the time of the accident a nurse unintentionally switched off all the alarms thatsignal when something is wrong. The salt percentage of the dialysis liquid decreased drasticallyuntil the dialysis liquid consisted of almost clean water - a deathly liquid in this context. Theoutcome of the accident was that 3 patients died of the 15 treated at the moment. In theanalysis below H/T stands for human technology interaction.
21
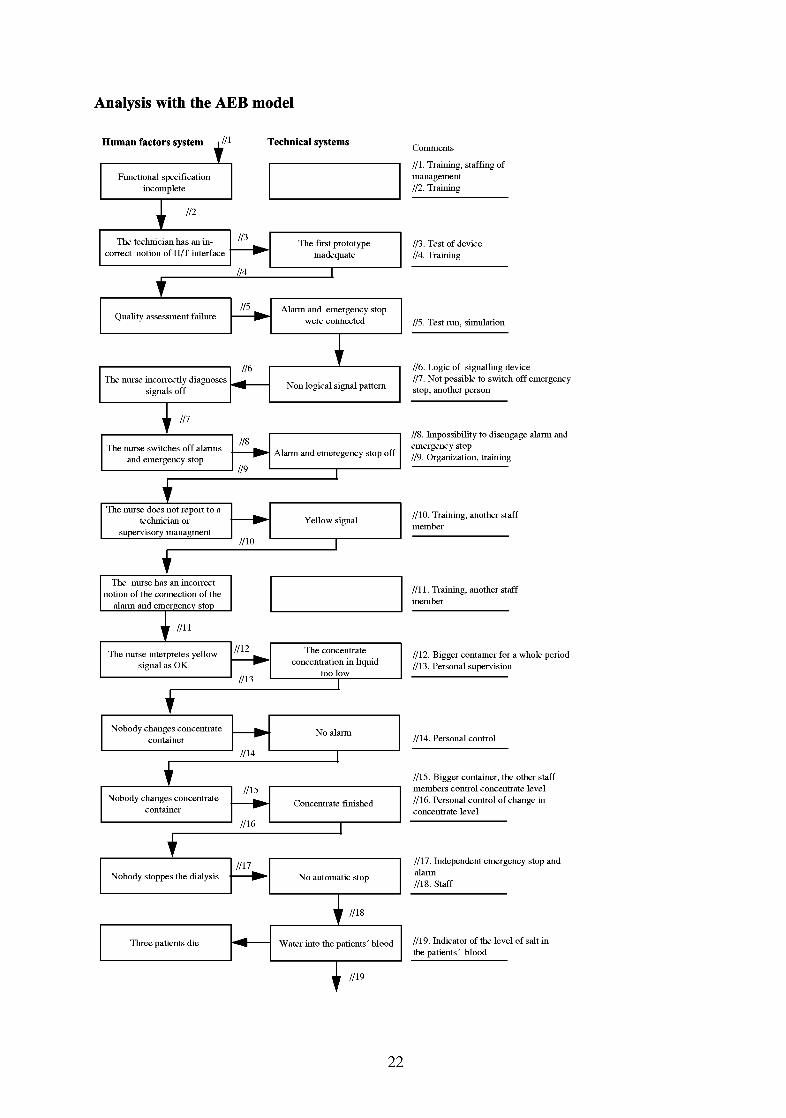
Analysis with the AEB model
Human factors system I Technical systems
Functional specificationincomplete
I 112
The technician has an in-correct notion of HAT interface
113 The first prototypeinadequate
Comments
//I. Training, staffing ofmanagement112. Training
I 13. Test of device114. Training
±Quality assessment failure
115 Alarm and emergency stopwere connected
The nurse incorrectly diagnosessignals off
I115. Test run, simulation
Non logical signal pattern
116. Logic of signalling device111. Not possible to switch off emergencystop, another person
IP
The nurse switches off alarmsand emergency stop
119
Alarm and emeregency stop off
£The nurse does not report to a
technician orsupervisory managment
//10
Yellow signal
IIS. Impossibility to disengage alarm andemergency stop119. Organization, training
//10. Training, another staffmember
fThe nurse has an incorrect
notion of the connection of thealann and emergency stop
IIlll. Training, another staffmember
I l l l
The nurse interpretes yellowsignal as OK.
1112
1113
The concentrateconcentration in liquid
too low
1112. Bigger container for a whole period1113. Personal supervision
fNobody changes concentrate
container
//14
No alarm
£Nobody changes concentrate
container
//15
1116
Concentrate finished
//14. Personal control
III 5. Bigger container, the other staffmembers control concentrate level1116. Personal control of change inconcentrate level
£Nobody stoppes the dialysis
I l l lNo automatic stop
Three patients die
IIlll. Independent emergency stop andalarmIII8. Staff
//18
Water into the patients' blood
T1119. Indicator of the level of salt inthe patients' blood
1119
22

4.3 Example 3 - A nuclear power plant example
The following example is taken from a nuclear power plant. The course of events that isdescribed below is taken from an incident that took place in Sweden..
General description of the incident
At the regular load test of DG220 the DG220-S was supposed to be synchronized intoDHC22. Instead, the operator choose to synchronize DT220-0, 5-S (he thought that he wassynchronizing DG220-S). When the synchronizing was not successful the operator thoughtthat there was an error in the indication device, so he switched off the DT220-0, 5-S.Consequently, the DHC22 lost power. The train of subsystems was correctly poweredaccording to an automatic system and loaded according to the start sequence (automaticsystem)), by switching on the DG220-S. The operator was still focusing on an indicationdevice error and was not prepared for the behavior of the diesel (that was running very unevencaused by the automatic start sequence). The operator decided that the diesel could getdamaged and therefore switched of DG220-S. At this point he realized that the DT switch wasoff which explained why the diesel train was out of power. After repeating the sequence theoperator managed to accomplish a stable feeding to the diesel train and the plant returned tothe normal state.
23

Analysis with the AEB model
Human factors system
IIIThe operator mixes
up DT220 andDG220 with DHC22
y inThe operator
synchronized intoDT220
TThe operator believesthat the synchronizingsucceeded
| / / 5
The operator does notdetect signal as anindication of error
y ii6
The operatorswitched off DT220
The operator detects anuneven operation of asan error
i moThe operator switchedoff DG220 (does notknow that DT220 is off)
Technical system
•
111
119
//ll
The synchronizingfailed (wrong object)
I
DT220 off
DHC22 out of power
Diesel generatorautomatic start,
uneven operation
DG220 off
y //12
DHC22 out of power
Comments
III. Ergonomic design, instruction
112. Feed back about object113. Technical information about operati
114. Experience, knowledge, technicalfeedback
115. Independent control
1/6.11/1. Technical off of DT220 not possible
//8. Another function
24