
Accessibility Study of Road and Metro Network in Shanghai
33
1 Configurational Accessibility Study of Road and Metro Network in Shanghai ZHANG Lingzhu 1 , CHIARADIA Alain 2 , ZHUANG Yu 3 1 Tongji University, CAUP, Shanghai, PRC [email protected] 2 Cardiff University, CPLAN, Cardiff, UK [email protected] 3 Tongji University, CAUP, Shanghai, PRC [email protected] Abstract Accessibility determination has become one of the key issues to interpret the relationship between urban form and travel pattern in metropolitan areas. Although the use of urban planning and design and associated accessibility influence travel makes intuitive sense, researchers have found it difficult to provide clear evidence of the influence of urban form. At the same time, it is generally recognized that land use patterns and transportation patterns are closely related to each other through accessibility change. The spatial organization of human activities creates a pattern of personal travel and goods transport, thus influences the mobility behaviour of actors such as households and firms. Conversely the availability of infrastructure makes certain locations more or less accessible. This paper identifies spatially desegregated micro-macro configurations of structural flow derived from accessibility analysis and their relationships with urban block size, road and metro-line network design, metro stations and bus stop locations, commercial land use locations distribution and station usage in Shanghai, China. Using GIS and spatial Design Network Analysis (sDNA) software to perform multi-level accessibility analysis of each link in each network, this revealed that most of the metro stations, bus stops and commercial land use are co-located on parts of the road network with the highest level of micro to macro accessibility. This indicates a ‘coupling multiplier effect’ between metro stations, commercial land use and multi-level multi network structural flow derived from accessibility analysis. Moreover block size is revealed as an important variable. These findings suggest the possibility of strategically appraising the impact of block size and land use planning on micro-macro accessibility change due to transportation system change and thus further the potential for systematically guiding transport oriented development planning and design place making. The objective of this paper is to identify the spatial configuration and composition details of multi- modal networks using micro-macro relative accessibility and the derived structural flow to understand configuration and composition of urban block size, road and metro-line network design, metro stations and bus stop co-locations, commercial land use co-locations distribution and station usage in Shanghai. Using GIS and spatial Design Network Analysis (sDNA) software to perform multi- level accessibility analysis of each link in each network, we found that most of metro stations, bus stops and commercial land use are co-located on the part of the road network with the highest level of micro to macro accessibility, indicating a coupling multiplier effect between metro stations,
Transcript of Accessibility Study of Road and Metro Network in Shanghai

1
Configurational Accessibility Study of Road and Metro Network in Shanghai
ZHANG Lingzhu1, CHIARADIA Alain2, ZHUANG Yu3 1 Tongji University, CAUP, Shanghai, PRC
[email protected] 2Cardiff University, CPLAN, Cardiff, UK
[email protected] 3Tongji University, CAUP, Shanghai, PRC
Abstract
Accessibility determination has become one of the key issues to interpret the relationship between
urban form and travel pattern in metropolitan areas. Although the use of urban planning and design
and associated accessibility influence travel makes intuitive sense, researchers have found it difficult
to provide clear evidence of the influence of urban form. At the same time, it is generally recognized
that land use patterns and transportation patterns are closely related to each other through
accessibility change. The spatial organization of human activities creates a pattern of personal travel
and goods transport, thus influences the mobility behaviour of actors such as households and firms.
Conversely the availability of infrastructure makes certain locations more or less accessible. This
paper identifies spatially desegregated micro-macro configurations of structural flow derived from
accessibility analysis and their relationships with urban block size, road and metro-line network
design, metro stations and bus stop locations, commercial land use locations distribution and station
usage in Shanghai, China. Using GIS and spatial Design Network Analysis (sDNA) software to perform
multi-level accessibility analysis of each link in each network, this revealed that most of the metro
stations, bus stops and commercial land use are co-located on parts of the road network with the
highest level of micro to macro accessibility. This indicates a ‘coupling multiplier effect’ between
metro stations, commercial land use and multi-level multi network structural flow derived from
accessibility analysis. Moreover block size is revealed as an important variable. These findings
suggest the possibility of strategically appraising the impact of block size and land use planning on
micro-macro accessibility change due to transportation system change and thus further the
potential for systematically guiding transport oriented development planning and design place
making.
The objective of this paper is to identify the spatial configuration and composition details of multi-
modal networks using micro-macro relative accessibility and the derived structural flow to
understand configuration and composition of urban block size, road and metro-line network design,
metro stations and bus stop co-locations, commercial land use co-locations distribution and station
usage in Shanghai. Using GIS and spatial Design Network Analysis (sDNA) software to perform multi-
level accessibility analysis of each link in each network, we found that most of metro stations, bus
stops and commercial land use are co-located on the part of the road network with the highest
level of micro to macro accessibility, indicating a coupling multiplier effect between metro stations,

2
commercial land use and multi-level multi network structural flow derived from accessibility
analysis. Moreover block size is revealed as an important variable.
These findings suggest the possibility of evaluating and appraising strategically the effectiveness of
block size and land use planning in relation to micro-macro accessibility change due to
transportation system change and thus further the potential for systematically guiding transport
oriented development planning and design place making.
Keywords: accessibility, transportation system, metro system, network, land-use, urban block
* Sponsored by Natural Science Foundation of China, No. 51178318

3
1. INTRODUCTION
Major cities in China, most notably Beijing and Shanghai, are building and expanding rail transit
systems as a strategy to reduce the negative environmental and social consequences of fast-paced
motorization. Transit systems play an important role in urban public policy. They are increasingly
seen as an essential element in policy packages that aim to reduce congestion, make more efficient
use of road space, reduce pollution, and keep the lid on increasing energy consumption in the
transportation sector and as a counter-measure to automobile-driven and automobile-dependent
suburbanization.
Between 1993 and 2013, the high-capacity metro network of Shanghai has expanded very rapidly
and played a major part in the sustainable public transportation system. In this short period, the
major change in accessibility introduced by the metro system kept pace with massive increase in
population and land use intensification and diversification of the urban form. For urban planners
and designers, a better configurational understanding of the relationship between travel pattern and
the 5Ds: public transport networks, public transport access point accessibility, land use location as
destination accessibility and urban form as pattern of street and urban block is becoming important
for interpreting the relationship between urban form and travel pattern in metropolitan areas.
However, most previous TOD empirical studies relied on discrete variable descriptions using large
geographic scale, few of them focused on the detailed analysis of public transport access point co-
location configurations and compositions.
Objectives of this paper
This paper identifies spatially desegregated micro-macro configurations of structural flow derived
from accessibility analysis and their relationships with urban block size, road and metro-line network
design, metro stations and bus stop locations, commercial land use locations distribution and station
usage in Shanghai.
Structure of the paper
The paper is organized as follows, in the next section, we set out the literature context of the present
paper. In the subsequent two sections, we introduce the methodology, the data and software. In
section 4, the road network accessibility and urban block size is computed. The relationships
between road network accessibility and commercial land use, between road network accessibility
and metro stations, bus stops are then presented in Section 5 and 6. Regression analysis is applied
in Section 6 to discuss the interaction between the above systems. In the last part, we discuss and
contextualize the analysis results.

4
2. CONTEXT AND LITERATURE
The relation between Built Environment and travel pattern
A recent meta-analysis of more than 200 studies of the built environment–travel pattern literature
(Ewing & Cervero, 2010) and empirical studies (Ewing, et al., 2014) found that of all of the
environmental variables considered, none on their own has a significant impact. Still, the combined
effect of several such variables on travel pattern could be quite large. Consistent with prior work, it
was found that “vehicle miles travelled is most strongly related to the measures of accessibility to
destinations and secondarily to the street network design variables. Walking is most strongly related
to the measures of land use diversity, intersection density, and the number of destinations within
walking distance. Travel by bus and train use are equally related to proximity to transit access points
and street network design variables, with land use diversity a secondary factor.” Surprisingly,
population composition and densities were found to be only weakly associated with travel behaviour
once these other variables were controlled for. We can identify a set of key urban design indicators:
road network design variables such as intersection density i.e. urban block size, non-residential land
use location diversity and clustering as destination, destination accessibility, and public transport
service access point accessibility. In Shanghai, studies of travel behaviour and built environment (Pan,
et al., 2009; Zacharias , 2005) and suburbanization (Cervero & Day, 2008) corroborate the meta-
analysis. These indicators seem to be usable in Shanghai. However, these studies did not make an
attempt to assess the accessibility evaluation methods or the details of urban layout configurations.
The relationships between transport networks, land use and accessibility
The impact of transport on land use is well recognized (Hansen, 1959; Banister, 1995; Giuliano, 2004;
Wegener & Furst, 1999; Geurs & van Wee, 2004; Borzachiello, et al., 2010). While accessibility
change due to new infrastructure is instantaneous, despite land use planning anticipatory
coordination, it is obvious that land use with much longer investment cycle lag in taking advantage
of these accessibility changes. Exactly how developments in the transport system influence the
locational behaviour of landowners, investors, firms, and households is less clearly understood as
other influences such as planning, take a longer time to have an impact. Understanding their
configuration changes and cycles over time is important.
The idea of the “land use transport feedback cycle” (Giuliano, 2004; Meyer & Miller, 2001; Wegener
& Fuerst, 2004) is often used to illustrate the complex relationship between land use, transport and
change in accessibility. In this cycle, land use and accessibility patterns both influence each other.
Land use patterns are partly conditional on accessibility advantage, which causes the locational
sorting of human urban activities such as living, working, shopping, education, and leisure; in other
words, the distribution of human activities reflect the different requirements of and competition for
accessibility advantage while pursuing benefiting of urban agglomeration economies. The transport
system changes the pattern of accessibility by overcoming, with different level of ease, the distance
between the locations where these activities take place. The increase and clustering of activities
create new travel demand and, consequently, a need for transportation services, whether in the
form of new infrastructure or more efficient operation of existing facilities, e.g. change in level of
service which in turn change accessibility. The resulting increase in accessibility co-determines the

5
location decisions of landowners, investors, households and firms and so results in changes of the
land use, starting the cycle again. This process continues until a (provisional) equilibrium is reached
or until some external factor intervenes (Meyer & Miller, 2001). A key to understanding the cycle is
understanding change in accessibility configurations and the co-variation of land use density and
diversity co-locations.
Beyond TOD, exploring Node-Place effect of Metro Stations in Shanghai
In Shanghai, the first metro line opened in 1993. In 2014 there were 14 metro lines and 329 stations
with an operating route length of 538 km making it the longest in the world. The ridership was 2.5
billion in 2013. On a normal weekday over 8 million people use the Shanghai metro. At the end of
1993, the population of Shanghai was 13 million; in in 2013, it was estimated to be 23.9 million1.
The metro system has radically changed the accessibility pattern of the Shanghai metropolitan area.
As noted by a number of researchers, transit oriented development (TOD) has become widely
adopted in China (Cervero & Day, 2008; Pan & Ren , 2005; Thomas & Deakin, 2008). Pan et al. (2011)
reviewed the origination and development of TOD in the USA, studying the case of Songjiang District
in Shanghai. In a recent publication, Zhang (2007) explored a specifically “Chinese edition of transit-
oriented development”. He argued that most of the TOD performance standards developed in the
United States were not applicable directly to China. In their place, he presents a modified TOD model
derived from the experience of urban development around transit in Hong Kong and Taipei, Taiwan.
This modified model was characterized by such key features as Differentiated Density, “Dockized”
District, ‘Delicate’ Design, Diverse Destination and Distributed Dividends. The set is called the 5D2
(5D squared). ‘Differentiated density’ refers to a desired “upward-sloping density towards the
station”. The upper and lower bound vary according to the station location (main centrality - higher
vs sub-centrality – lower). The idea is based on bid-rent theory which is a sound theoretical
grounding yet, as recognised by the author would need further elaboration and empirical research
to be operationalised. Such empirical work has emerged in the UK and China it shows that
accessibility analysis is for example well related to property prices (Chiaradia, et al., 2013; Xiao, et
al., 2014). ‘Dockised District’ relate to the extent of spatial delineation of the TOD district defined by
people willingness to walk. This is affected by walking level of services, for example the distance and
ease of walking to the metro station such as perceived safety, security, street scene, pedestrian-scale
lighting and amenities, and presence of other pedestrians – the factor that impact on both
willingness to walk and pedestrian route choice preference. ‘Delicate Design’ is used here to stress
the importance of high standards and fine details of environmental design in the TOD area beyond
being pedestrian friendly. ‘Diverse Destination’ concerns the functional composition of TOD at both
the local and the regional scale. It relates to the embedding of the metro station both in the metro
network and other transport networks, the networks configuration and design but also the intensity
composition of density. ‘Distributed Dividend’ is the principle of capturing part or all of the added
value due to improvement in accessibility to properties surrounding the TOD. Excluding the
Distributed Dividend, which is an important point in financing public transport policy, most of
Zhang’s points (2007) have a focus on place design: (Dockised District and Delicate Design)
complementing the 5Ds identified by Ewing & Cervero in (2001); Density, Diversity (Land Use),
1http://worldpopulationreview.com/world-cities/shanghai-population/
6
Destination Accessibility, Design, Distance to public transport elaborated further in 2010 (Ewing &
Cervero) and empirically corroborated in 2014 (Ewing, et al.).
Parallel to the TOD tradition in the USA and its adaptation in China, a Node and Place model was
developed in Europe (Bertolini, 1996; 1998; 1999; Bertolini & Spit, 1998; Trip, 2007). A Node and
Place approach enables a multi-scale spatial approach in relating station and station surroundings,
land use mix and intensity, accessibility and the urban buzz of place.
Within the Node and Place frame, the rail station emerges as a new central place in metropolitan
cities. It becomes both a hub of networks due to their high accessibility by different modes of
transport mirrored by a broad range of users and also one of the very few places in the contemporary
city where the participants in its increasingly heterogeneous communities still physically meet
(Bertolini, 1996). The fact that all these people pass through public transportation nodes does not
necessarily imply, of course, that people are also interacting with each other there. However, these
intense and diverse flows of people do have the potential of translating into equally intense and
diverse patterns of human interaction. If the right conditions are met, social, cultural and economic
activities still requiring physical proximity can thrive in these areas. Moreover, this potential can be
realized in a relatively sustainable way, as it can be coupled with environmentally more effective
transport, land-use patterns and urban structure and design. More importantly these locations
appear to be the locus where the micro-foundations of urban agglomerations conceptualized as
“matching, learning and sharing” (Duranton & Puga, 2004), have a great potential to unfold.
The Node and Place model follows the reasoning of the transport land use feedback cycle outlined
above. This feedback pattern is mediated by planning regulation and development conditions fuelled
by increase in property value around transit station that are well documented in the US, China (Pan,
et al., 2014) and in the UK (Network Rail, 2011). In Shanghai, exploratory studies are showing a
similar pattern (Pan & Zhang, 2008; Pan, et al., 2014). The metro station, which is the transport
service’s access point, together with its surroundings, are the interface which produces and attracts
movements of significant magnitude, and therefore constitutes opportunities for mixed use and
commercial development. This has been documented as a dynamic coupling process (Pan & Ren ,
2005).
Lastly, the Node and Place model is also elaborated within an economic framing of competitive
advantage of place (Porter, 1985; Florida, 2000). This is relevant to Shanghai as it is transitioning
from industrial to service economies and the rise of creative industries and urban place
competiveness (Florida, 2000; Storper & Venables, 2004).
Toward operationalizing node and place in Shanghai
Florida (2000) and Storper and Venables (2004) used a range of indicators of ‘place’ at metropolitan
scale to monitor policy effectiveness, but these are not usable by urban planners and urban
designers (Trip, 2007). Zhang (2007) while giving guidance, does not provide a set of indicators to
operationalize an adapted TOD model in China. In the most recent node and place model study
(Chorus & Bertolini, 2011), the ‘node’ value of a station is evaluated with transport mode frequency
and range, proximity to CBD by metro, bus stops and lines from the station; that is, the transport
networks accessibility position of the station. The ‘place’ value is evaluated by population and job

7
levels around the station, and mixed use clustering – the functional position of the station. The
functional diversity and intensity dimensions – also found in Zhang (2007) as differentiated density
and diverse destination – while part of place-making and useful to urban planner, remain much less
operational for urban designer but much more relevant to architect. An important point to note is
that if population composition and density are dynamically coupled with station accessibility levels,
this would clarify why these variables may become less significant in the meta-literature review
(Ewing & Cervero, 2010) as population composition and density will be highly co-linear to level of
accessibility and connectivity of the station itself.
Beyond accessibility, what will differentiate the stations will be their place value. A review of place
literature and the related aspects of development form while relevant to this discussion is beyond
the scope of this paper. Aspect of development forms that embed place ontologies can be
categorized as follow: ‘place as visual attributes’, ‘place as product’, ‘place as process’, ‘place as
values’ (Arefi & Triantafillou, 2005). Briefly stated according to these authors Place as visual attribute
relates to the configuration of image, townscape, picturesque, visual excitement,
contradiction/complexity, iconography, and visual layering. Place as product relate to iconic
architecture, new urbanism, morphology, experience economy, staged sets, street scene and theme
parks. Place as process relates to “being and becoming,” uneven development, spatial political
economy of place, social, cultural, environmental economic production of place. Place as meaning
relates to Sense of place, sacred and the profane, mythical and real place, “betweenness of place,”
phenomenology, territoriality, and liveability.
For an introduction to a detailed discussion of the analysis of quality of place around station see Trip
(2007, pp. 67-83) which echo Zhang’s “delicate design” (2007) that stress the importance of high
standards and fine details of environmental design in the TOD area. Zhang’s last dimension, ‘value
capture’ has been widely researched in the UK. In the UK, a growing body of seminal research
investigated the economic value of urban design. The research ranges from the value of street public
realm improvement (CABE, 2007; Transport for London, 2011), to the social and environmental value
of park and public space (CABE Space, 2003), the value of green space (GLA Economics, 2003; 2010;
Dunse, et al., 2007; Rogers, et al., 2012; CABE Space, 2009; Jim & Chen, 2010), the value of blue
space (Garrod & Willis, 1994; Fisher, 1999; Rouwendal , et al., 2014; Goetgeluk, et al., 2005), the
value of station investment (Network Rail, 2011), the value of housing and urban layout (CABE,
ODPM, Design for Homes, 2003; The Prince’s Foundation for the Built Environment, 2007; Chiaradia,
et al., 2013), the value of mixed use street (Jones, et al., 2007; Chiaradia, et al., 2012), the value of
urban design (CABE, UCL, DETR, 2001; British Council for Offices, 2006), and more recently resilient
urban form, governance and the creation of long term value (Grosvenor, 2013). All of these studies
link “delicate design” characteristics of the built environment to economic value. They investigate
the relationship between physical configuration or condition (e.g. layout, perceived street quality,
etc.) to economic value and in some studies, the social and environmental economic value. They
also employ various methodologies in answering these questions, drawing on different data sources
in different ways. However, they all link “urban design” with “value” through inferring relationships
from a small sample to large population. A variety of methods are used and there is an explicit
recognition of design value. Overall they are more robust and detailed than earlier research
examining the “Value of Urban Design” (CABE, UCL, DETR, 2001). Within these studies and along
8
several literature review on urban design value have been published (CABE, 2003; Ministry for the
Environment, NZ, 2005; McIntyre, 2006). While the results are fragmented, some of these
conceptualization and assessment techniques of good design, correlates against economic value
findings and economic underpinning. While yet to be consolidated by further research, they have
been integrated and operationalized by consultancies (CBuchanan, 2008; Tribal Urban Studio,
CBuchanan, 2008; Amion Consulting; Taylor Young; Donaldsons; University of Liverpool, 2007)
advising local authorities on capturing the value of public investment in good urban design
(Chiaradia, et al., 2015). Following Zhang (2007) we doubt that these studies are directly transferable
to Shanghai; more research is needed. While there are similarities between TOD, Zhang’s adapted
TOD model (2007) and the node and place model (Bertolini, 1999), it is the node and place model
that here provides the basis of a systematized approach.
Station areas are, ambivalently, both ‘nodes’ and ‘places’ (Bertolini, 1996). They are (or may become)
important ‘nodes’ in both transport and non-transport (e.g. business, consumption) networks.
Conversely, station areas also identify a ‘place,’ a both permanently and temporarily inhabited area
of the city, a dense and diverse conglomeration of uses and forms accumulated over time, which
may or may not share in the life of the node. Any successful development strategy for station areas
needs to deal with this complex, node-place dynamics. Insight into the characteristics of such
dynamics, its underlying factors, and the possibilities of influencing it, would seem a necessary
precondition for effective action (Bertolini, 2008). The underlying idea is the land use transport
feedback cycle mediated by accessibility: “By improving transport provision in a location will,
because of improved accessibility, create conditions favourable to the further intensification and
diversification of land uses there. In its turn, intensification and diversification of land uses in a
location (or increase in its place-value) will, because of growth in the demand for connections, create
conditions favourable to the further development of infrastructure there. The emphasis on
‘conditions’ is important, as it implies a distinction between existence of a development potential
and its actual realisation, which will by and large, depend on factors other than transport and land
use” (Bertolini, 2008). The node-index is a measure of the accessibility of the station area. Intensity
and diversity of transport supply are the key criteria (train, metro, tram, bus, car, and bicycle).
Surprisingly, the place-index is only a measure of the intensity and diversity of activities in the station
area.
In this paper which is the first part of a detailed study on the synergy between the ‘node’ and ‘place’
functions of metro stations and their surroundings, in Shanghai. Our analytical focus and
contribution is on ‘multi-level accessibility’ characteristics including pedestrian and aspect of
development form that are structural to metro station as central place. Shanghai’s metro stations
are located in the metro network, in the bus network, in the street network in urban areas with
varying urban block size, block form and street network layout, resulting in multi-scale accessibility.
Our focus in this paper is on configuration of the co-locations of all the Ds components subject to
their dynamic constraints. The importance of urban block size in relationship to central place i.e.
central business district has been studied in the American and Australian cities (Siskna, 1990; Siskna,
1997) and was singled out by Jane Jacobs (1961). Our research questions in relation to metro stations
and their surroundings are as follows:
What are the relations between metro network accessibility position in the metro network,
structural flow and station usage?

9
What are the relations between the metro stations and bus stops co-locations?
What are the relationship of the metro station location, bus stops location, and commercial
land use relative to street network multi scale structural flow derived from accessibility?
What are the relationship of colocation between metro stations, bus stops, commercial land
use locations relative to street network multi scale structural flow derived from accessibility?
What are the relationship between street network micro-structural flow derived from micro-
accessibility and urban block size?
Are there any desirable or undesirable consequences which result from the choice of block
sizes and form, street layout, multi-level layout?
Urban block size and form dynamics and accessibility measures
The city block and their configuration, shaping and shaped by the street network are fundamental
elements of the physical structure of urban areas. It is a key urban planning and design component.
As Siskna (1997) notes it might be expected that the properties of different sizes and shapes and
configuration of block would be well and documented. Surprisingly, this is not the case. There is still
little knowledge about the properties and performances characteristics of different block sizes
configuration in terms of circulation, land use, building forms and others aspects. Siskna’s (1997)
study revealed that block size and form in American and Australian city centre have crucial and
predictable effects on evolutionary urban patterns. Extensive alterations to the original layout can
occur through successive modifications often by un-coordinated actions that might lead to optimal
collective patterns over time, yet this is not always the case and there is a need for better
coordination of block size and layout. Two main dynamic processes are observed. In cities with small
and medium initial block sizes, the street and block layout has remained intact whereas in cities with
large initial blocks the layout has been considerably modified by addition of street and alleys,
creating smaller block and sub-blocks. Smaller medium blocks are more suitable than larger blocks
for the general functioning of the centre, which are areas of intense pedestrian activity as they
produce and permit fine meshed circulation, affording better change in travel direction which is a
good indicator of ease of movement and thus accessibility; small blocks increase dispersion, reduce
congestion and enable better level of services. This principle can also be seen applied within
department stores and shopping malls, a stacking strategy, where on each floor small display islands
minimize distance between each island while maximizing display surface by providing a greater
length of island perimeter. Contemporary development has included the commercial centre, multi-
level shopping and entertainment mall directly connected to station. While these developments
have often high internal permeability they often encapsulate this increased permeability within a
building which itself acts as impermeable superblock. The “Delicate Design” and node and place
model can be improved by including an assessment of the urban block for accessibility of the station
and its surroundings, whether of its size and form, or as multi-level complex environment.
In the past decades, various definitions of the accessibility as well as indicators have been developed
and used to describe accessibility (Reggiani, 1998; Geurs & van Eck, 2001; Geurs & van Wee, 2004),
most of them derived from the seminal work of (Hansen, 1959), which first defines accessibility as
“the potential of opportunities for interaction”, formalised as:
𝑨𝒊 = ∑ 𝑺𝒋 𝒆𝒙𝒑(−𝒃𝒔𝒊𝒋)𝒏𝒋=𝟏𝒋≠𝒊
area i = 1, 2,…, n (1)

10
where the accessibility A at area i varies directly with the sizes S of the other locations j, and inversely
with the spatial separation s between i and j. This is akin to a gravity model. Size is measured with
respect to quantities such as retail floor area, population, employment, retail sales, etc., while spatial
separation is measured with respect to distance, travel cost, travel time and other similar, spatial
distance variables. This is a field accessibility between areas.
If we recognize the co-determination of accessibility and land use and want to identify the role urban
block and size impact on street network layout configuration in shaping accessibility, we need to use
indices of accessibility that are not weighted by land use to begin with. The alternative to Hansen’s
weighted version of accessibility (type 1) is an unweighted accessibility measure (type 2) which omits
the size variable (Ingram, 1971).
𝑨𝒊 = ∑ 𝑺𝒊𝒋𝒏𝒋=𝟏𝒋≠𝒊
area i = 1, 2,…, n (2)
Ingram (1971) notes that “The use of average distances, rather than sums of distances..., facilitates
comparison with the literature on area 1 moments” (Ingram, 1971) does not define n explicitly but
clearly intends it to refer to the n-1 distances to each single j, rather than the n points.
This focuses on the spatial separation variable (Pooler, 1995). Spatial separation is easy to
understand and calculate. This is of particular interest in intra-urban situations to disentangle the
role of accessibility in the potential for interaction between land use diversity and intensity which
are thickly and continuously intertwined with transport service access points.
On network, the first unweighted definition of accessibility can be found in Shimbel (1953). Within
the context of network analysis using graph theory, Shimbel defines the unweighted accessibility of
a network vertex with respect to the sum of the distances at that vertex:
𝐴𝑖 = ∑ 𝑑𝑖𝑗 𝑛𝑗=1𝑗≠𝑖
i = 1, 2, …, n (3)
where dij is the shortest path from vertex i to vertex j.
In order to measure the overall network dispersion, Shimbel defines another elementary measure:
𝐴𝑖 = (∑ ∑ 𝑑𝑖𝑗 )𝑛𝑗=1𝑗≠𝑖
𝑛𝑖=1
−1 i = 1, 2, …, n (4)
Equation (3), representing the simple sum of the distances, is described usually as a measure of the
compactness of network relative to each vertex.
Equation (4) measure the overall “network dispersion”. This is the mean shortest path length on
network. Christaller (1933-1966) and Reilly (1931) were also early pioneers of “mean shortest path
length”.
Shimbel (1953) defines “stress” on a vertex k as the “count of all the minimum paths which pass
through site k, then we have a measure of the "stress" which site k must undergo during the activity
of the network. In transport this is also called ‘path overlap’. This is a definition of structural potential
flow in route assignment through the network sampling each link origin as all or nothing to link
destination (Pooler, 1995). Shimbel’s (1953) work on network was applied later in transport network

11
analysis (Kansky, 1963), and by geographers for the analysis of networks geography. For an extensive
review see Haggett & Chorley (1969).
More recently, analysis on spatial network have invoked centrality measures from social network
analysis such as closeness and betweenness centrality analysis (Cutini, 2001; Porta, et al., 2006;
Newman, et al., 2006; Borzachiello, et al., 2010; Xiao, et al., 2013). Closeness is referenced in Social
Network Analysis studies (Bavelas, 1950) as is Betweennness (Freeman, 1977). The farness of a node
x is defined as the sum of its distances from all other nodes, and its closeness was defined by Bavelas
as the reciprocal of the farness:
𝐶(𝑥) = ( ∑ 𝑑(𝑦, 𝑥𝑦≠𝑥 )−1
Thus, the more central a node is the lower its total distance from all other nodes, its closeness. It is
also called spatial separation (Pooler, 1995). Betweenness centrality quantifies the number of
times a node acts as a bridge along the shortest path between two other nodes. It was introduced
as a measure for quantifying the control of a human on the communication between other humans
in a social network by Freeman (1977). We can see that closeness and betweenness centrality are
the same than Shimbel’s accessibility and “stress” also called path overlap or structural flow (Pooler,
1995). In the reminder of the paper we will use respectively accessibility and structural flow. The
foundation of such analysis is by the mathematician Euler who, in 1736, solved analytically the “first
travelling salesman problem” for Konigsberg, inventing at once network codification, graph theory
and transport network analysis (Coupy, 1851). Euler also showed that network layout can make
certain travel route patterns impossible.
The classic spatial interaction model (Wilson, 2000)estimates the flow of people, material or
information between locations in geographic space. Factors can include origin propulsive variables
such as the number of commuters in residential areas, destination attractiveness variables such as
the amount of office space in employment areas, and proximity-accessibility relationships between
the locations measured in terms such as distance or travel time. Spatial interaction models are
usually aggregate and top-down: they specify an overall proximity-accessibility governing
relationship for flow between locations. This characteristic is also shared by urban models such as
those based on mathematical programming, flows among economic sectors, or bid-rent theory.
Traditionally accessibility analysis is seen as such a top-down aggregate approach. An alternative
modelling perspective is to represent the system at the highest possible level of disaggregation and
study the bottom-up emergence of complex patterns and relationships from behaviour and
interactions at the individual level. This bottom up approach is deployed in two modelling traditions:
the use of Cellular Automata (CA) and Agent Based Modelling (ABM). CA modelling imposes a fixed
spatial framework such as grid cells and specifies rules that dictate the state change over time. The
cell spatial notation loose the spatial specificity that urban block size and configuration requires.
ABM focuses on agents that have purposeful behaviour and can react, interact and modify their
environment while seeking their objectives. Unlike the cells in CA, ABM can allow agents to be
mobile over actual spatial spaces with their specific geometries. Although these models are valuable
for assessing opportunities for encounter at a microscopic level, their usefulness becomes
compromised when insights into broader spatial trends are needed. We are suggesting a third way

12
based on combining generic micro-economic behavioural route choice preferences and
desegregated spatial notation through the use of the detailed spatial network. Research findings on
route choice preferences of driver, cyclist and pedestrian (Hill, 1982; Bovy & Stern, 1990; Golledge,
1995; Verlander & Heydecker, 1997; Raford, et al., 2005; Chiaradia, 2007; Menghini, et al., 2010;
Hood, et al., 2011; Broach, et al., 2012) suggest that that driver, cyclist and pedestrian share
behavioural sensitivity to the effects of distance and turn frequency i.e. angular change frequency.
Each mode also has more specific sensitivity. For example, cyclists are sensitive to slope, intersection
control (e.g. presence or absence of traffic signals), and traffic volumes (Broach, et al., 2012). For the
purpose of this paper, such micro-economic behavioural foundations provide an extension of the
utility-theoretic framework to multi-modal accessibility analysis using spatially desegregated (link-
based) and based on agents’ general mobility behaviour. Complex adaptive systems theory applied
to urban spatial analysis suggests that simple interactions among proximal entities can lead to
intricate, persistent and functional spatial entities at aggregate levels. Patterns that can emerge from
the simple interactions between network configuration and composition include land use
distribution and travel pattern. We suggest to systematically simulate mobility patterns within
detailed networks using such approach.
3. METHODOLOGY
In Shanghai, we propose to follow a three-step methodology described below.
We calculate:
1) Street network angular accessibility unweighted by land use to derive structural flow levels at
micro, meso, and macro spatial scales for the street networks (radius at 600 m, 2,000 m, 5,000
m) within Shanghai outer ring. The radii correspond to walking, cycling for a short distance, e-
bike and bus ride journey, and both short and long car trips.
2) Urban block size and show a choropleth map of block size in Shanghai within the outer ring.
3) Metro lines network topological accessibility unweighted by land use to derive structural flow
levels.
We explore:
4) the relationships between structural flow level indices and urban block size, metro stations, bus
stops and commercial land use location distribution in order to understand the mutual
relationships between network configuration and composition i.e. the colocation of network,
metro station usage, and land use using frequency distribution analyses. We do this because the
circular causation nature of these relationships imply generalized spatial auto-correlations.
Hence the point here is not to eliminate auto-correlation as one might in a normative statistical
analyses. Instead, we want to systematically understand the profile of the auto-correlations
across the different analysis which give an indication of the network coordination and synergies.

13
What spatial unit is used?
The spatial unit of analyses is the link. This is standard in transportation. The link is within the
node/link network notation standard, the central path between two junctions. A street link has
length, angularity along its path, connectivity with other links, incidence with other links at junction.
The node/link principle can be extended to pedestrian and cycling path network and to complex
multi-level environment.
What analytical catchment should we use?
Zhang (2007) in the section on “Dockized District” discusses the issue of choosing an analytical
catchment area (e.g. 400 m) from the station. He recommend that the underlying behavioural
principle should be defined by people’s willingness to walk.
Calthorpe (1993, p. 53) used 600m as comfortable walking distance in his TOD theory. Studies in
Shanghai showed that 500-600m is also the comfortable walking distance (Pan, et al., 2007, p. 93;
Bian, 2006; Liu, 2012, p. 20). Moreover 600m is half of the median distance between Shanghai’s
metro stations. In Shanghai, when trip distance increases to 2,000-2,500 m, people switch from
walking to cycling (Pan, et al., 2003; Zacharias, 2005). The majority of within-city trips are less than
5 km in Shanghai, and this is also the upper limit of non-motorized trips (Zacharias, 2005).
The micro, meso and macro radii are associated with different uses of the road network, 800 m,
2,000 m, 9,000-18,000 m have been used as walking, cycling, car trip distance in Wuhan (Xiao, et al.,
2013). Thus we propose to use the radius (600 m, 2,000 m, 5,000 m) which related to travel
behaviour in Shanghai.
However, we agree with Zhang (2007) that the willingness to walk or cycle is strongly affected by
other “Delicate Design” factors affecting level of services (LOS) of walking, for example, perceived
safety, security, architectural interest, pedestrian-scale lighting and amenities, and presence of other
pedestrians (Krambeck, 2006). For this level detail a whole level of very detailed descriptors will be
required that can be accommodated easily with the link codification (Lin & Moudon , 2010; Parks &
Schofer, 2006). See for example, Link and Place model (Boujenko , et al., 2007) developed in the UK
which has become part of transport planning policy (DfT, 2007; CIHT, 2010).
What analytical metrics should be used?
In using accessibility analyses i.e. mean shortest path and resulting structural flow, the underlying
metric should relate to route choice behaviours for the various mode choice: walking, cycling, driving,
and riding a bus. In the recent literature we found three types of metric: topological, Euclidean, and
angular. Euclidean is the standard measure of ‘shortest distance’, often criticized because it does not
account for the potential value of speed (which does not apply to walking) and is rather blind to
geometry. While a topological metric captures directness, it has been criticized because it is
relatively blind to Euclidean distance. Finally, the least angular metric is associated with capturing
both geometric directness and the geometry of speed. Ideally it would be best to combine Euclidean
and angular metrics. An angular metric associated with an Euclidean radius is appropriate for taking
into account of Euclidean distance changes. An analysis of shortest paths in Shanghai according to
these three metrics provides the results shown in Table 1. The results demonstrate that the angular
metric is also a very good proxy for the Euclidean metric. This should be the urban design metric of
choice as it is simple and provides the best account for change in design.
14
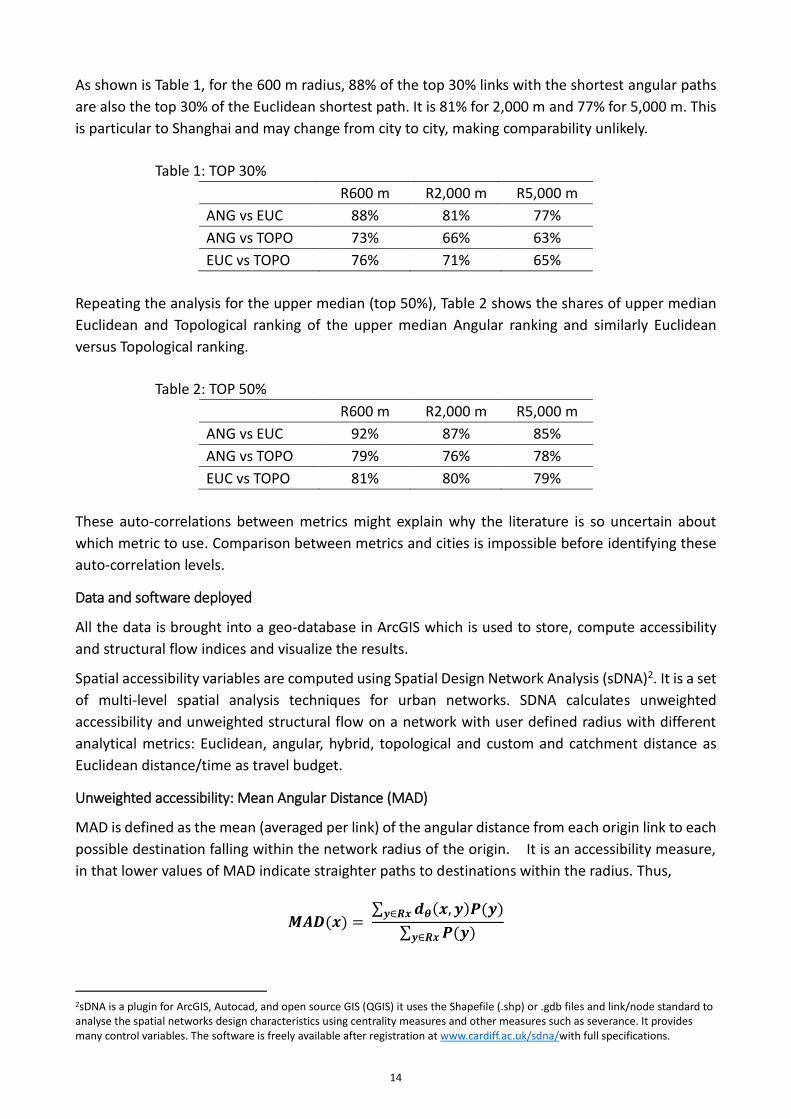
As shown is Table 1, for the 600 m radius, 88% of the top 30% links with the shortest angular paths
are also the top 30% of the Euclidean shortest path. It is 81% for 2,000 m and 77% for 5,000 m. This
is particular to Shanghai and may change from city to city, making comparability unlikely.
Table 1: TOP 30%
R600 m R2,000 m R5,000 m
ANG vs EUC 88% 81% 77%
ANG vs TOPO 73% 66% 63%
EUC vs TOPO 76% 71% 65%
Repeating the analysis for the upper median (top 50%), Table 2 shows the shares of upper median
Euclidean and Topological ranking of the upper median Angular ranking and similarly Euclidean
versus Topological ranking.
Table 2: TOP 50%
R600 m R2,000 m R5,000 m
ANG vs EUC 92% 87% 85%
ANG vs TOPO 79% 76% 78%
EUC vs TOPO 81% 80% 79%
These auto-correlations between metrics might explain why the literature is so uncertain about
which metric to use. Comparison between metrics and cities is impossible before identifying these
auto-correlation levels.
Data and software deployed
All the data is brought into a geo-database in ArcGIS which is used to store, compute accessibility
and structural flow indices and visualize the results.
Spatial accessibility variables are computed using Spatial Design Network Analysis (sDNA)2. It is a set
of multi-level spatial analysis techniques for urban networks. SDNA calculates unweighted
accessibility and unweighted structural flow on a network with user defined radius with different
analytical metrics: Euclidean, angular, hybrid, topological and custom and catchment distance as
Euclidean distance/time as travel budget.
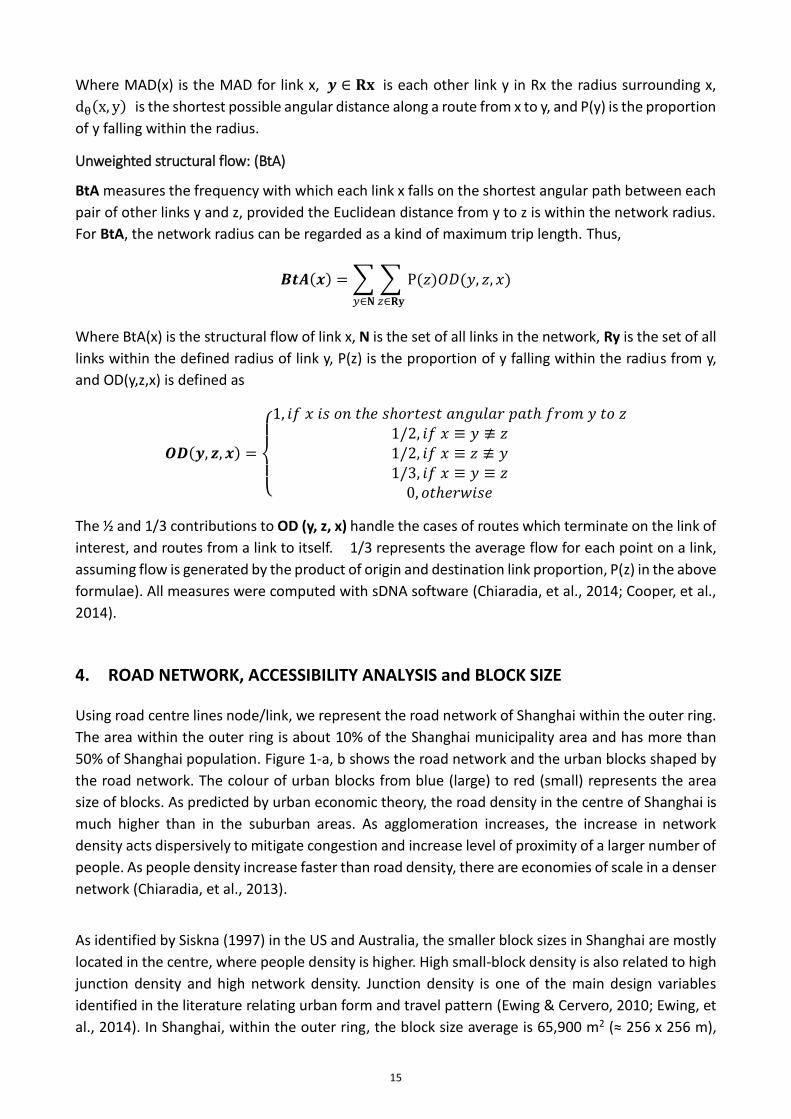
Unweighted accessibility: Mean Angular Distance (MAD)
MAD is defined as the mean (averaged per link) of the angular distance from each origin link to each
possible destination falling within the network radius of the origin. It is an accessibility measure,
in that lower values of MAD indicate straighter paths to destinations within the radius. Thus,
𝑴𝑨𝑫(𝒙) = ∑ 𝒅𝜽(𝒙, 𝒚)𝑷(𝒚)𝒚∈𝑹𝒙
∑ 𝑷(𝒚)𝒚∈𝑹𝒙
2sDNA is a plugin for ArcGIS, Autocad, and open source GIS (QGIS) it uses the Shapefile (.shp) or .gdb files and link/node standard to analyse the spatial networks design characteristics using centrality measures and other measures such as severance. It provides many control variables. The software is freely available after registration at www.cardiff.ac.uk/sdna/with full specifications.
15
Where MAD(x) is the MAD for link x, 𝒚 ∈ 𝐑𝐱 is each other link y in Rx the radius surrounding x,
dθ(x, y) is the shortest possible angular distance along a route from x to y, and P(y) is the proportion
of y falling within the radius.
Unweighted structural flow: (BtA)
BtA measures the frequency with which each link x falls on the shortest angular path between each
pair of other links y and z, provided the Euclidean distance from y to z is within the network radius.
For BtA, the network radius can be regarded as a kind of maximum trip length. Thus,
𝑩𝒕𝑨(𝒙) = ∑ ∑ P(𝑧)𝑂𝐷(𝑦, 𝑧, 𝑥)
𝑧∈𝐑𝐲𝑦∈𝐍
Where BtA(x) is the structural flow of link x, N is the set of all links in the network, Ry is the set of all
links within the defined radius of link y, P(z) is the proportion of y falling within the radius from y,
and OD(y,z,x) is defined as
𝑶𝑫(𝒚, 𝒛, 𝒙) =
{
1, 𝑖𝑓 𝑥 𝑖𝑠 𝑜𝑛 𝑡ℎ𝑒 𝑠ℎ𝑜𝑟𝑡𝑒𝑠𝑡 𝑎𝑛𝑔𝑢𝑙𝑎𝑟 𝑝𝑎𝑡ℎ 𝑓𝑟𝑜𝑚 𝑦 𝑡𝑜 𝑧
1/2, 𝑖𝑓 𝑥 ≡ 𝑦 ≢ 𝑧1/2, 𝑖𝑓 𝑥 ≡ 𝑧 ≢ 𝑦1/3, 𝑖𝑓 𝑥 ≡ 𝑦 ≡ 𝑧0, 𝑜𝑡ℎ𝑒𝑟𝑤𝑖𝑠𝑒
The ½ and 1/3 contributions to OD (y, z, x) handle the cases of routes which terminate on the link of
interest, and routes from a link to itself. 1/3 represents the average flow for each point on a link,
assuming flow is generated by the product of origin and destination link proportion, P(z) in the above
formulae). All measures were computed with sDNA software (Chiaradia, et al., 2014; Cooper, et al.,
2014).
4. ROAD NETWORK, ACCESSIBILITY ANALYSIS and BLOCK SIZE
Using road centre lines node/link, we represent the road network of Shanghai within the outer ring.
The area within the outer ring is about 10% of the Shanghai municipality area and has more than
50% of Shanghai population. Figure 1-a, b shows the road network and the urban blocks shaped by
the road network. The colour of urban blocks from blue (large) to red (small) represents the area
size of blocks. As predicted by urban economic theory, the road density in the centre of Shanghai is
much higher than in the suburban areas. As agglomeration increases, the increase in network
density acts dispersively to mitigate congestion and increase level of proximity of a larger number of
people. As people density increase faster than road density, there are economies of scale in a denser
network (Chiaradia, et al., 2013).
As identified by Siskna (1997) in the US and Australia, the smaller block sizes in Shanghai are mostly
located in the centre, where people density is higher. High small-block density is also related to high
junction density and high network density. Junction density is one of the main design variables
identified in the literature relating urban form and travel pattern (Ewing & Cervero, 2010; Ewing, et
al., 2014). In Shanghai, within the outer ring, the block size average is 65,900 m2 (≈ 256 x 256 m),

16
the median is 22,718 m2 (≈ 151 x 151 m), while within the inner ring (115 km2) and central Shanghai,
the block size average is 36,300 m2 (≈ 190 x 190 m i.e. -45%), the median is 15,966 m2 (≈ 126 x 126 m
i.e. -30%).
Siskna (1997) provides a yardstick in evaluating block size performance in CBD as follow:
- 60-70 m (3,600 to 4,900 m2) – very fine meshed – optimal for pedestrians
- 100 m (10,000 m2) – fine meshed – very convenient for pedestrians
- 200 m (40,000 m2) – very coarse meshed – inconvenient for pedestrians
From, the above it seems that block size are rather oversized in the central area of Shanghai (inner
ring) were 85 metro stations are located (26% of the total). A further analysis shows that street
network length within 500 m of the central metro stations is 648 km using crow fly and 385 km using
network distance. The area covered is 61 km2 (53% coverage of the inner ring area) using 500 m
crow fly from the station and 31 km2 (27% coverage) using street network. For central Shanghai,
using a block size model we have estimated that the block size profile within 500 m of the stations
is on average 200 m which is deemed to be inconvenient for pedestrian.
Street network, structural flow
a b
Figure 1. Road Network (a) & Urban Block Size (b) of Shanghai in 2010
17
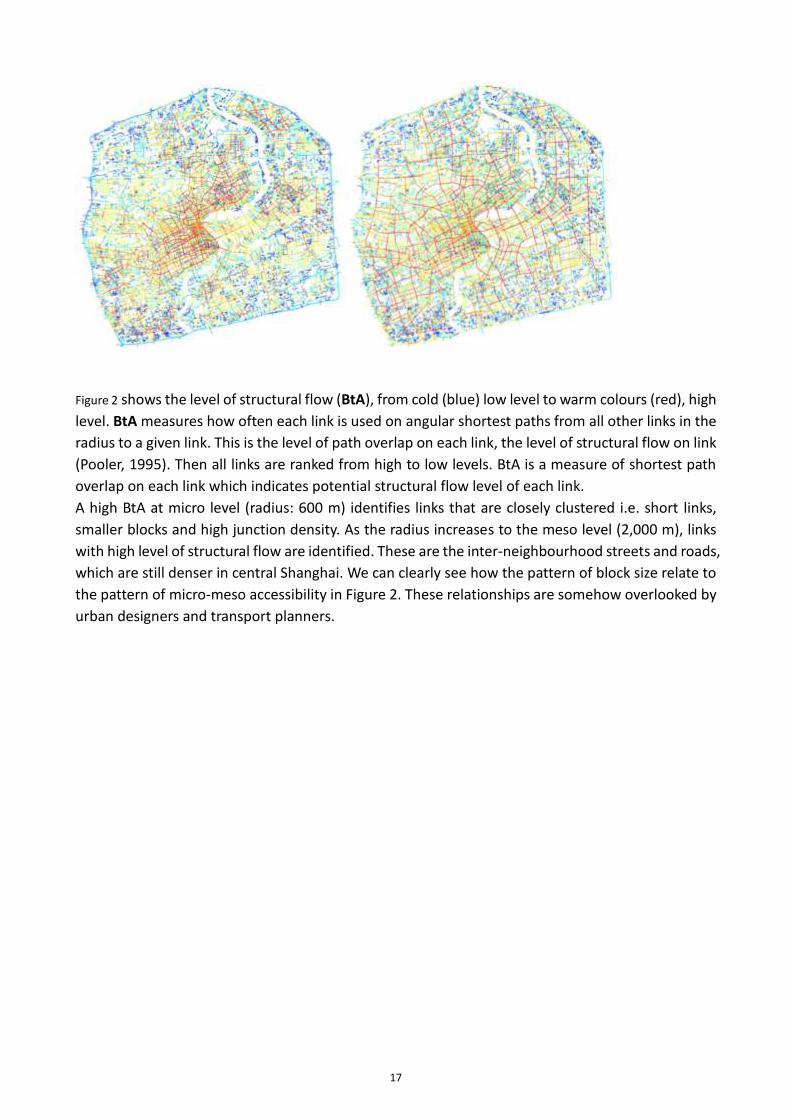
Figure 2 shows the level of structural flow (BtA), from cold (blue) low level to warm colours (red), high
level. BtA measures how often each link is used on angular shortest paths from all other links in the
radius to a given link. This is the level of path overlap on each link, the level of structural flow on link
(Pooler, 1995). Then all links are ranked from high to low levels. BtA is a measure of shortest path
overlap on each link which indicates potential structural flow level of each link.
A high BtA at micro level (radius: 600 m) identifies links that are closely clustered i.e. short links,
smaller blocks and high junction density. As the radius increases to the meso level (2,000 m), links
with high level of structural flow are identified. These are the inter-neighbourhood streets and roads,
which are still denser in central Shanghai. We can clearly see how the pattern of block size relate to
the pattern of micro-meso accessibility in Figure 2. These relationships are somehow overlooked by
urban designers and transport planners.
18
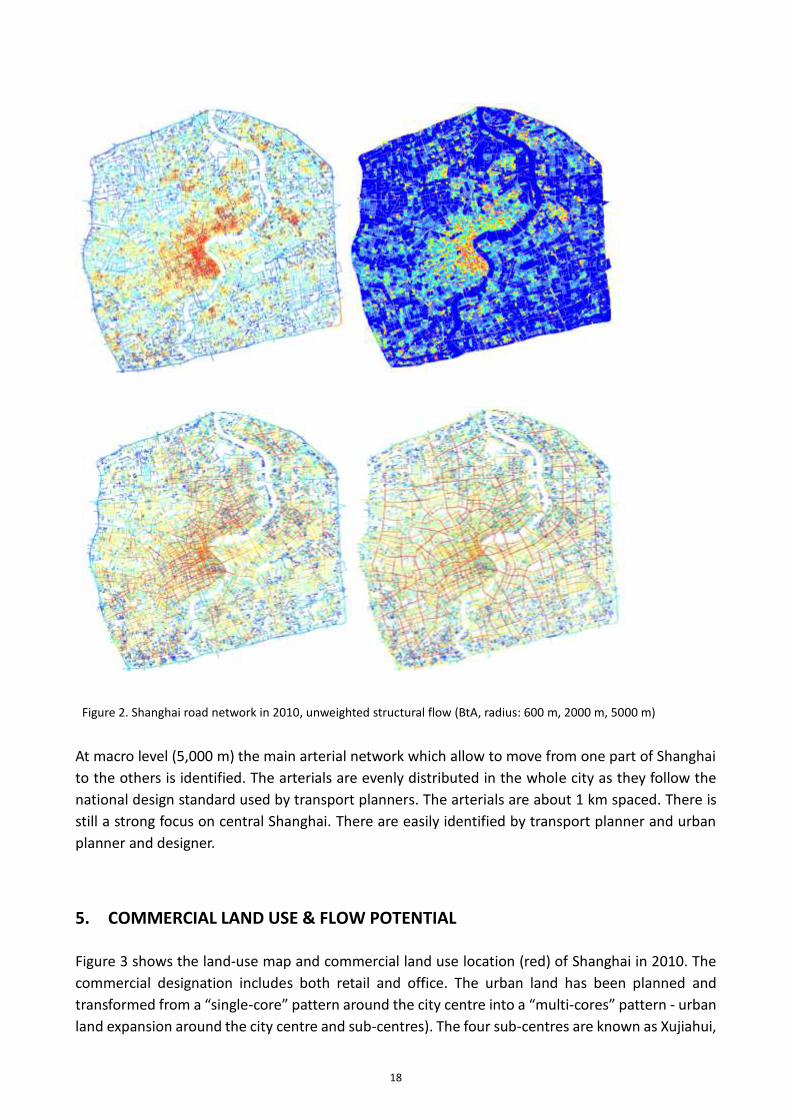
At macro level (5,000 m) the main arterial network which allow to move from one part of Shanghai
to the others is identified. The arterials are evenly distributed in the whole city as they follow the
national design standard used by transport planners. The arterials are about 1 km spaced. There is
still a strong focus on central Shanghai. There are easily identified by transport planner and urban
planner and designer.
5. COMMERCIAL LAND USE & FLOW POTENTIAL
Figure 3 shows the land-use map and commercial land use location (red) of Shanghai in 2010. The
commercial designation includes both retail and office. The urban land has been planned and
transformed from a “single-core” pattern around the city centre into a “multi-cores” pattern - urban
land expansion around the city centre and sub-centres). The four sub-centres are known as Xujiahui,
Figure 2. Shanghai road network in 2010, unweighted structural flow (BtA, radius: 600 m, 2000 m, 5000 m)

19
Zhenru, Wujiaochang, and Huamu. Some large commercial clusters are also located in proximity of
the ring roads.
To understand the relationship between commercial land use and structural flow, we first divided
the roads into 2 categories according to their structural flow levels: the roads with the 50% highest
flow potential and the roads with the 50% lower flow potential, then calculated the frequency
distribution of commercial block. From Figure 4-a, we can see that across radii, 72% of the
commercial land use is located at the roads with highest structural flow levels. We repeat the
frequency distribution analysis with deciles. Figure 4-b shows the density distribution of commercial
land use location by structural flow (level 1 highest, level 10 lowest).
Commercial land use seems to maximize locational advantage from micro to macro structural flow
level. 17%, 19%, 19% respectively of commercial land use locates on the link with highest 10%
structural flow level at different scales (radius 600, 2,000 m, 5,000 m). Cumulatively the top 30% of
the links with highest flow potential have almost 60% of commercial land use located on them.
a b
Figure 3. Urban Land use (a) and Commercial land use location (b) of Shanghai in 2010
a b Figure 4. The density distribution of commercial land use in relation to link multi-level BtA (a. divide road accessibility into 2 categories; b. divide road accessibility into 10 deciles)
69% 73% 73%
0%
20%
40%
60%
80%
100%
Lowest 50%
Highest 50%
0%
10%
20%
30%
40%
1 2 3 4 5 6 7 8 9 10
BtAWl600c
BtAWl2000c
BtAWl5000c
Xujiahui
Wujiaochang
Huamu
Zhenru
Xujiahui
20
6. METRO STATIONS, BUS STOPS & STRUCTURAL FLOW
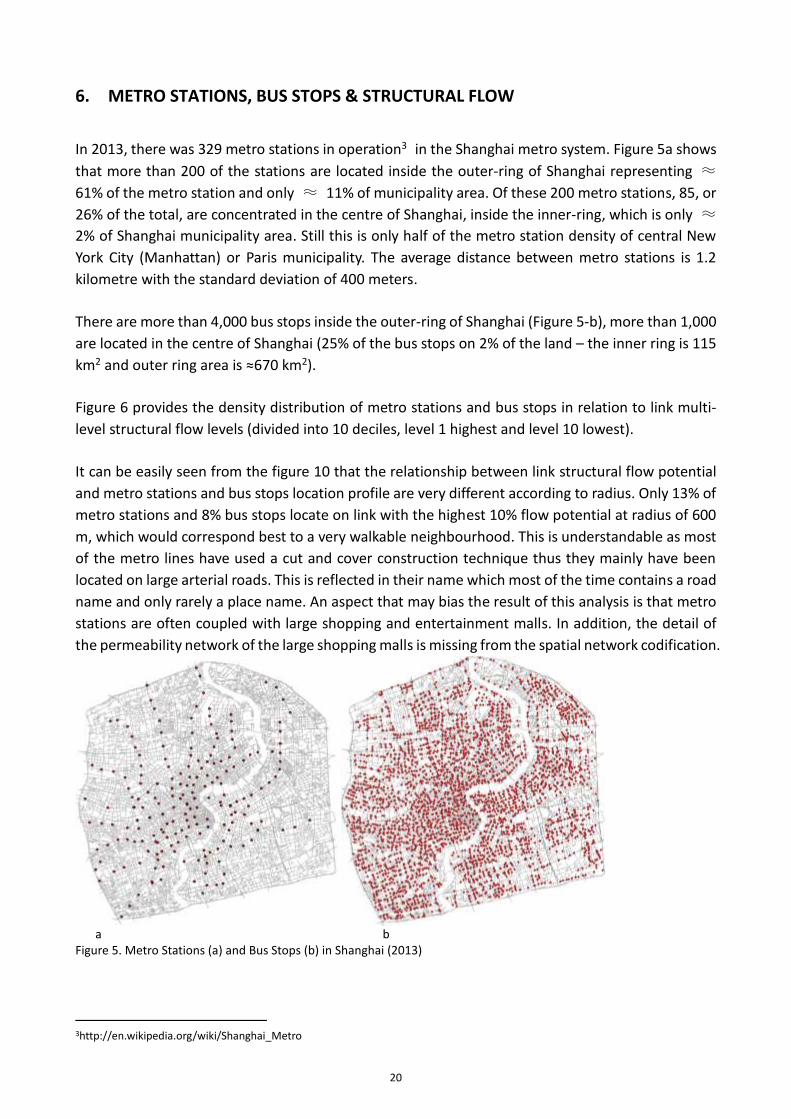
In 2013, there was 329 metro stations in operation3 in the Shanghai metro system. Figure 5a shows
that more than 200 of the stations are located inside the outer-ring of Shanghai representing ≈
61% of the metro station and only ≈ 11% of municipality area. Of these 200 metro stations, 85, or
26% of the total, are concentrated in the centre of Shanghai, inside the inner-ring, which is only ≈
2% of Shanghai municipality area. Still this is only half of the metro station density of central New
York City (Manhattan) or Paris municipality. The average distance between metro stations is 1.2
kilometre with the standard deviation of 400 meters.
There are more than 4,000 bus stops inside the outer-ring of Shanghai (Figure 5-b), more than 1,000
are located in the centre of Shanghai (25% of the bus stops on 2% of the land – the inner ring is 115
km2 and outer ring area is ≈670 km2).
Figure 6 provides the density distribution of metro stations and bus stops in relation to link multi-
level structural flow levels (divided into 10 deciles, level 1 highest and level 10 lowest).
It can be easily seen from the figure 10 that the relationship between link structural flow potential
and metro stations and bus stops location profile are very different according to radius. Only 13% of
metro stations and 8% bus stops locate on link with the highest 10% flow potential at radius of 600
m, which would correspond best to a very walkable neighbourhood. This is understandable as most
of the metro lines have used a cut and cover construction technique thus they mainly have been
located on large arterial roads. This is reflected in their name which most of the time contains a road
name and only rarely a place name. An aspect that may bias the result of this analysis is that metro
stations are often coupled with large shopping and entertainment malls. In addition, the detail of
the permeability network of the large shopping malls is missing from the spatial network codification.
3http://en.wikipedia.org/wiki/Shanghai_Metro
a b
Figure 5. Metro Stations (a) and Bus Stops (b) in Shanghai (2013)

21
Bus stop locations can be explained by the fact that bus lines have to trade off proximity to patronage
and service speed and thus cannot only be located on very local streets. The links with 30% highest
level of flow potential, at radius 5,000 m, are where 76% of the stops are located. 64% and 38% of
stops are located on links with 20% and 10% highest flow potential, respectively. These are very
remarkable spatial distributions because of the asymmetry of the probability distribution. The
distribution is much alike Pareto’s 80/20% - 70/30%. For bus stops the links with 30% highest level
of flow potential (5,000 m) are where 65% of the bus stops are located.
We can see a pattern emerging of extreme coordination between flow potential levels, commercial
land use, bus stops, and metro stations locations. This coordination is best explained by circular
causation presented above.
7. METRO NETWORK FLOW POTENTIAL ANALYSIS
Derrible and Kennedy (2009; Derrible, 2012) demonstrate that network topologies play a key role in
attracting people to use public transit; ridership is not solely determined by cultural characteristics,
city design or driven by land use demand but also by the transport supply side configuration and
composition – the network of network effects. Therefore, we now turn to the configuration of the
metro lines network and evaluate the network effect on entry and exit usage. A network was created
to represent the metro line network topology using one link between each station. The analysis is
structural flow potential, i.e. using topological distance (one link = 1 distance unit). This is taking in
consideration that while comparing route choice to destination metro rider count number of
stations. To model transfer between connected lines at the level of ‘station’, each transfer between
two lines was considered as a topological distance of two thus adding two short links. This approach
was taken because a limited market research showed that between two alternative routes to the
same destination with changes at station level, people choose to switch to the route with the change
if the difference in station number was reduced by at least two stations i.e. one change is the
substitute of at least the distance between two stations. This makes the distance of line change in
the model equal to two metro stops. A more elaborated model could be made by considering
transfer between “virtual” station i.e. stations that are not interconnected but close enough to be
reach with a short walk. In Shanghai, Metro cardholder will be able to transfer between “virtual”
without incurring extra charge.
a b Figure 6. Correlation between BtA and the location of Metro Stations (a), Bus Stops (b)
0.00%
10.00%
20.00%
30.00%
40.00%
1 2 3 4 5 6 7 8 9 10
BtAWl600c
BtAWl2000c
BtAWl5000c
0.00%
10.00%
20.00%
30.00%
40.00%
1 2 3 4 5 6 7 8 9 10
BtAWl600c
BtAWl2000c
BtAWl5000c

22
Figure 8 show the results of topological structural flow analysis (BtT) of Shanghai Metro network.
We can see that the network configuration conform to the schematic evolution of metro network
(Roth, et al., 2012); “A large `ring' encircles a core of stations. Branches radiate from the core and
reach further areas of the urban system. The branches are essentially characterized by their size and
their spatial extension”. The core is characterized by the connection degree of the stations and the
number of station. Yet this characterisation miss the differentiation that is due to the network
configuration. In Shanghai it seems that that east-west lines form a stronger core than the north
south line. Figure (8-a-b) show the 2011 entry and exit usages. The structural flow levels were
compared to actual station entry/exit movement rates. Correlation analysis shows that the structural
flow level of metro network model for each station correlated with entry/exit r2=0.407 (p<0.0001)
(weekend), and r2=0.497 (p<0.0001) (weekday). Given that the Shanghai metro system has grown at
an exponential pace and is set to grow by almost 50% in the next 5 years, and that land use is and
will obviously lag behind such a massive accessibility change, it would be important to capture this
accessibility change dynamic to understand each station overall node change status in the whole
system and plan accordingly.
Figure 7.Topological structural flow (BtT) of Shanghai Metro Network 2013. The thicker and the darker the higher
structural flow and vice versa.

23
Figure 11 show that the metro station location relation to street network link structural flow BtT
(5,000 m), the number of bus stops in the metro areas (600m), and the Exit/Entry movement of
metro stations have similar decile distributions.
8. DISCUSSION
We started this paper with a review of a meta-analysis relating urban form indicators to travel
behaviour and identify particular urban form indicators including non-residential land use (diversity),
distance to public transport access points, design of transport networks, destination accessibility
related to these travel behaviours. Prior to 2010 this was known in the literature as the 5Ds (Ewing
& Cervero, 2001). More recently transport network composition and layout were found as important
factors (Ewing & Cervero, 2010; Banister, 2012; Ewing, et al., 2014). One of the surprising findings of
the empirical study in 15 conurbations in the USA (Ewing, et al., 2014) is that the population
a b
Figure 8. Shanghai Metro Network: a. Weekday Exit/Entry; b. Weekend Exit/Entry
Figure 9.Relationship between Location of Metro Stations, Number of Bus stops in metro areas, Exit/Entry movement
of Metro Stations and structural flow (5,000m)
0.00%
10.00%
20.00%
30.00%
40.00%
1 2 3 4 5 6 7 8 9 10
Metro Stations
Bus stops
Exit/Entry Weekend
24
composition and density play a minor role once other urban form variables are taken into account.
What play a role is employment density. Basically, those who live in highly accessible places
(characterised by these five D variables) and larger metropolitan areas are better able to make do
without car trips. We delineated the circular causation model between accessibility and
development which in part would explain such a ‘surprising’ finding. Urban form has evolved from
being simply measured in terms of ‘density’ (Newman & Kenworthy, 1989) to become understood
as the 3Ds (Cervero & Kockelman, 1997), the 5Ds (Ewing & Cervero, 2001; Ewing, et al., 2014) and
more recently ‘the spatial distribution of activities and the composition and layout of transport
networks’ (Bourdic, et al., 2012), i.e. the configuration of their co-locations.
We reviewed the TOD model’s adaptation to China and introduced the ‘node and place’ model, that
extend and systematize this model’s application to study Shanghai’s metro stations and their
surroundings as new locii of multi-scale centralities. In other words, we aimed at characterising the
multi-scale accessibility profile of metro stations in Shanghai. Since local accessibility is predicated
on urban block size and configuration, and studies of “traditional” centrality i.e. CBD in the US and
Australia show the important role of block size and configuration, we used accessibility indicators
that are unweighted by size effect to explore the role structural flow derived from accessibility
mediated by urban block size and form. This was in order to better understand their co-locations
configuration.
The advantage of these spatial accessibility indicators is that they constitute a unified multi-level
analytical framework for strategic multi modal network design analysis i.e. at options appraisal stage.
Our objective was to use these indicators to distinguish between network design effect, resulting
spatial accessibility and structural flow on network in relation to a range of and land use locations in
Shanghai within the outer ring. To our knowledge, no such extensive and detailed accessibility
analysis in relationship to land use has been performed in such large area.
We investigated the relation between urban block size and form and network morphology using
network structural flow analysis with Geometric, Euclidean and topologic metrics, settling for the
geometric analysis given the overlap with the other metrics and because it effectively discriminates
the morphology of the transport network design and also be theoretically interpreted as generic
structural flow based on cross modal route choice preferences. We then investigated the empirical
relationship between these multi-level accessibility indicators in relation to public transport access
points i.e. distance to transit and commercial land use, and metro station usage.
In Shanghai we found that:
To recapitulate: the outer ring total area ≈ 670 km2; area within 600 m of Metro stations =
196 km2 (29%). Total Bus stop = 4,042; bus stops within 600m of Metro stations = 1,619 (40%).
Total Commercial plot area = 61,889,229 m2; Commercial plot area within 600 m of Metro
stations = 27,419,968 m2 (44%).

25
The frequency distribution of the relationship between multi-scale structural flow and land
use are approximating a Pareto distribution the 80-20 / 70-30 which is found in many
phenomena.
Commercial land use location is strongly distributed on the road network that has high level
of micro to macro accessibility, a multi-scale locational differentiation and advantage;
Most metro stations and bus stops have location distribution that follow the same pattern: a
strong location bias to macro for high structural flow level at large radii. This is the coupling-
multiplier effect for land-use surrounding metro stations identified by Pan et al. (2007) and
Pan & Zhang (2008).
Following Derrible and Kennedy (2009; Derrible, 2012)we found a strong and positive
relationship between metro station entry/exit usage and metro network configuration. The
metro network configuration, the station location, the supply side of the metro network play
an important role in the movement generating pattern. More importantly it help to
understand the Node position of each metro station in relationship to the whole metro
network. It is an important for planning that indicator help to anticipate and understand
Node change interaction according to change in the whole metro network.
As the metro system is set for high growth while the arterial street system is likely to remain
relatively similar to its present condition, the accessibility profile of the metro stations, the
node value is likely to change according to change in the metro network. These changes are
metropolitan in nature i.e. global. We provided an analytical approach that can anticipate
these changes. Meanwhile, the surroundings of each station, the place value might be
adapted to the change in node value. These changes are most likely to be local. Given the
importance of block size and its role in shaping local accessibility, urban planning and design
policy maker should consider shaping the pattern of block size and shape around metro
station within at least 400 to 600m. Or to put it a more flexible way to consider shaping the
details of the public permeability pattern within 400-600 m of each station.
Overall our contribution through this exploratory cross-sectional analysis is to show how an intensive
and dynamic structural coordination is at work between locations of commercial land use, bus stops,
metro station location identified through multi-scale accessibility and derived flow potential levels.
We would also argue that at the structural level the understanding the “Delicate Design” around
metro station will require the understanding of the relationship between urban block size and form
in relationship to local accessibility. Beyond this initial cross sectional analysis, this is also the starting
point of future time series analyses.
We conclude this discussion with future research and an urban design perspective.
The node-place model of (Bertolini, 1999) provides an established starting reference to more fully
adapt the TOD model to a Chinese context. The node-place model, usually used in the context of
train station, could be appropriately transposed to the high capacity Shanghai metro system. The

26
model is of interest as it follows the reasoning of the a multi-modal transport land use feedback
cycle and aims at further exploring the underlying relationships, with a focus on station areas. The
basic idea is that improving the transport provision (or the node value) of a location will, by
improving accessibility, create conditions favourable to the further development of the location. In
turn, the development of a location (or an increase in its place value) will, because of a growing
demand for transport, create conditions favourable to the further development of the transport
system. This circular dynamic causation is predicated on multiple equilibrium conditions. The node-
place model’s emphasis on “conditions” is important, as it indicates a development potential that
may or may not be realized, as other factors may also affect the outcome (Chorus & Bertolini, 2011).
Bertolini (Bertolini, 1999) and Trip (2007) have emphasized the role of urban design, place making
and urban quality to maximize value (Network Rail, 2011).
The node-place model distinguishes five different profiles for a station area. Each profile reflects
particular relative position of a station area value on the node or place hierarchy in the urban system.
Future research will investigate the detailed node-place profile of metro stations in Shanghai in
relation to place quality. To this end, the development of a better understanding between block
size/multi-level configurations surrounding the metro station, and the quality of place in relation to
pedestrian usage will be of great importance. At local level the link-place model (Boujenko , et al.,
2007; DfT, 2007; CIHT, 2010) coupled with route choice preference captured by local accessibility
analysis and pedestrian environment walkability assessment methods (Kelly, et al., 2011) could
provide a both a theoretical framework and operational method of interest.
At a strategic level, a new research direction could be undertaken: how should multi networks
accessibility be coordinated and distributed to balance accessibility equity, congestion, quality of
place and agglomeration economies?
9. References
Amion Consulting; Taylor Young; Donaldsons; University of Liverpool, 2007. Economic Value of
Urban Design, Liverpool: Amion Consulting.
Arefi, M. & Triantafillou, M., 2005. Reflections on the Pedagogy of Place in Planning and Urban
Design. Journal of Planning Education and Research, 25(1), pp. 75-88.
Banister, D., 1995. Transport and Urban Development. London: Spon.
Banister, D., 2012. Assessing the reality—Transport and land use planning to achieve sustainability.
The Journal of transport and Land Use, 5(3), pp. 1-14.
Bavelas, A., 1950. Communication Patterns in Task‐Oriented Groups. Journal of the acoustical
Society of America, 22(6), pp. 725-730.
Bertolini, L., 1996. Nodes and places: complexities of railway station redevelopment. European
Planning Studies, 4(3), pp. 331-346.
Bertolini, L., 1998. Station area redevelopment in five European countries. An international
perspective on a complex planning challenge. International Planning Studies, 3(2), pp. 163-184.
Bertolini, L., 1999. Spatial development patterns and public transport: the application of an
analytical model in the Netherlands. Planning Practice and Research, 14(2), pp. 199-210.
27
Bertolini, L., 2008. Station areas as nodes and places in urban networks: An analytical tool and
alternative development strategies. In: F. Bruinsma, et al. eds. Railway Development. Heidelberg:
Physica-Verlag HD, pp. 35-57.
Bertolini, L. & Spit, T., 1998. Cities on Rails. The Redevelopment of Railway Station Areas. London:
Spon.
Bian, J., 2006. Metropolitan space development and rail transit (in Chinese). Beijing: China
Architecture & Building Press.
Borzachiello, M. T., Nijkamp, P. & Koomen, E., 2010. Accessibility and urban development: a grid-
based comparative statistical analysis of Dutch cities. Environment and Planning B: Planning and
Design, 37(1), pp. 148-169.
Boujenko , N., Marshall, S. & Jones, P., 2007. Link and Place - A Guide to Street Planning and
Design. London: Local Transport Today.
Bourdic, L., Salat, S. & Nowacki, C., 2012. Assessing cities: a new system of cross-scale spatial
indicators. Building Research Information, 40(5), pp. 592-605.
Bovy, P. H. & Stern, E., 1990. Route choice: Wayfinding in transport networks, Studies in
Operational Regional Science, No. 9. Dordrecht: Kluwer Academic Publishers.
British Council for Offices, 2006. Offices, value and design. [Online]
Available at: http://www.bco.org.uk/Research/Publications/Officesv2606.aspx
[Accessed 01 July 2014].
Broach, J., Dill, J. & Gliebe., J., 2012. Where Do Cyclists Ride? A Route Choice Model Developed
with Revealed Preference GPS Data. Transportation Research Part A: Policy and Practice, 46(10),
p. 1730–40.
CABE Space, 2003. The Value of Public Space, How high quality parks and public spaces create
economic, social and environmental value. [Online]
Available at: https://www.designcouncil.org.uk/sites/default/files/asset/document/the-value-of-
public-space.pdf
[Accessed 01 July 2014].
CABE Space, 2009. Making the invisible visible the real value of park assets. [Online]
Available at: https://www.designcouncil.org.uk/sites/default/files/asset/document/the-real-
value-of-park-assets.pdf
[Accessed 01 July 2014].
CABE, ODPM, Design for Homes, 2003. The Value of Housing Design and Layout. [Online]
Available at:
http://webarchive.nationalarchives.gov.uk/20110118095356/http:/www.cabe.org.uk/files/the-
value-of-housing-design-and-layout.pdf
[Accessed 01 July 2014].
CABE, UCL, DETR, 2001. The Value of Urban Design. Analysing commercial developments to see
how excellent design adds economic, social and environmental value. [Online]
Available at: www.designcouncil.org.uk/publications/the-value-of-urban-design/
[Accessed 21 11 2013].
CABE, 2003. A bibliography of design value. [Online]
Available at:
http://webarchive.nationalarchives.gov.uk/20110118095356/http:/www.cabe.org.uk/files/a-

28
bibliography-of-design-value.pdf
[Accessed 01 07 2014].
CABE, 2007. Paved with Gold: The Real Value of Street Design. [Online]
Available at:
http://webarchive.nationalarchives.gov.uk/20110118095356/http://www.cabe.org.uk/files/pave
d-with-gold.pdf
[Accessed 01 07 2014].
Calthorpe, P., 1993. The Next American Metropolis: Ecology, Community, and the American Dream.
New York(NY): Princeton Architectural Press.
CBuchanan, 2008. A Programme-Level Evaluation of One NorthEast's Quality of Place activities,
2002-07. [Online]
Available at: http://www.onenortheastlegacy.co.uk/file.aspx?id=75
[Accessed 01 July 2014].
Cervero, R. & Day, J., 2008. Suburbanization and transit-oriented development in China. Transport
Policy, Volume 15, pp. 315-323.
Cervero, R. & Kockelman, K., 1997. Travel demand and the 3Ds: Density, diversity, and design.
Transportation Research Part D: Transport and Environment, 2(3), pp. 199-219.
Chiaradia, A., Crispin, C. & Webster, C., 2014. sDNA a software for spatial design network analysis.
[Online]
Available at: www.cardiff.ac.uk/sdna/
[Accessed 15 June 2014].
Chiaradia, A. J. F., 2007. Emergent route choice behaviour, motorway and trunk road network: the
Nantes conurbation. Istanbul, ITU Faculty of Architecture, pp. 078.1-078.18.
Chiaradia, A. J. F., Hillier , B., Schwander, C. & Wedderburn, M., 2012. Compositional and urban
form effects in centres in Greater London. Urban Design and Planning - Proceedings of the ICE ,
March, 165(1), p. 21–42.
Chiaradia, A. J. F., Hillier, B., Schwander, C. & Barnes, Y., 2013. Compositional and urban form
effects on residential property value patterns in Greater London. Urban Design and Planning -
Proceedings of the ICE, June, 166(3), p. 176–199.
Chiaradia, A. J. F., Sieh, L. & Plimmer, F., 2015. Learning Values in Urban Design A Studio-Based
Approach. Forthcoming.
Chorus , P. & Bertolini, L., 2011. An application of the node place model to explore the spatial
development dynamics of station areas in Tokyo. The Journal of Transport and Land Use, 4(1), pp.
45-58.
Christaller, W., 1933-1966. Die zentralen Orte in Suddeutschland - Places in Southern Germany.
Jena: Fisher - Prentice Hall.
CIHT, 2010. Manual for Streets 2 Wider application of the principles, London: The Chartered
Institution of Higways & Transportation.
Cooper, C., Chiaradia, A. & Webster, C., 2014. Spatial Design Network Analysis(+). [Online]
Available at: www.cardiff.ac.uk/sdna/
[Accessed 16 June 2014].
Coupy, E., 1851. Solution d'un problème appartenant à la géometrie de situation, par Euler.
Nouvelles annales de mathématiques 1re série, Volume 10, pp. 106-119.

29
Cutini, V., 2001. Centrality and land use: three case studies on the configurational hypothesis.
Cybergeo: European Journal of Geography [On line], Systèmes, Modélisation, Géostatistiques,
Volume 188.
Derrible, S., 2012. Network Centrality of Metro Systems. PloS ONE, 7(7), p. e40575.
Derrible, S. & Kennedy, C., 2009. Network Analysis of World Subway Systems Using Updated Graph
Theory. Transportation Research Record: Journal of the Transportation Research Board, Volume
2112, pp. 17-25.
DfT, 2007. Manual for Streets 1, London: Department for Transport.
Dunse, N., White, M., White, M. & Dehring, C., 2007. Urban parks, open space and residential
property values. London, RICS Research Paper Series, pp. 1-8.
Duranton, G. & Puga, D., 2004. Micro-Foundations of Urban Agglomeration Economies. In: J. V.
Henderson & J. F. Thisse, eds. Handbook of Regional and Urban Economics, Cities and Geography.
1st ed. London: Elsevier, pp. 2063-2117.
Ewing, R. & Cervero, R., 2001. Travel and the built environment. Transportation Research Record,
Volume 1780, pp. 87-114.
Ewing, R. & Cervero, R., 2010. Travel and the Built Environment. Journal of the American Planning
Association, 76(3), pp. 265-294.
Ewing, R. et al., 2014. Varying influences of the built environment on household travel in 15 diverse
regions of the United States. Urban Studies, pp. 1-19.
Fisher, D. R., 1999. Waterside properties. [Online]
Available at: https://www.waterways.org.uk/pdf/restoration/trh_waterside_properties_2
[Accessed 01 July 2014].
Florida, R., 2000. Competing in the age of talent: quality of place and the new economy. Pittsburgh:
Carnegie Mellon.
Freeman, L. C., 1977. A set of measures of centrality based on betweenness. Sociometry, 40(1), pp.
35-41.
Garrod, G. & Willis, K., 1994. An economic estimate of the effect of a waterside location on
property values. Environmental and Resource Economics, 4(2), pp. 209-217.
Geurs, K. T. & van Eck, R., 2001. Accessibility measures: review and applications, Bilthoven:
National Institute of Public Health and the Environment.
Geurs, K. T. & van Wee, B., 2004. Accessibility evaluation of land-use and transport strategies:
review and research directions. Journal of Transport Geography, 12(2), pp. 127-140.
Giuliano, G., 2004. Land use impacts of transportation investments: Highway and transit. In: The
Geography of Urban Transportation. New York: Guildford Press, pp. 237-273.
GLA Economics, 2003. Valuing Greenness, Green spaces, house prices and Londoners’ priorities.
[Online]
Available at:
http://www.london.gov.uk/mayor/economic_unit/docs/valuing_greenness_report.pdf
[Accessed 01 July 2014].
GLA Economics, 2010. Working Paper 42 Valuing housing and green spaces: Understanding local
amenities, the built environment and house prices in London. [Online]
Available at: http://www.london.gov.uk/sites/default/files/GLAE-wp-42.pdf
[Accessed 01 July 2014].
30
Goetgeluk, R., Kauko, T. & Priemus, H., 2005. Can Red Pay for Blue? Methods to Estimate the
Added Value of Water in Residential Environments. Journal of Environmental Planning and
Management, 48(1), pp. 103-120.
Golledge, R. G., 1995. Path Selection and Route Preference in Human Navigation: A Progress
Report. Berlin, Springer, pp. 207-222.
Grosvenor, 2013. Evolving cities, resilient urban form, governance and the creation of long term
value, London: The London School of Economics and Political Science.
Haggett, P. & Chorley, R. J., 1969. Network Analysis in Geography. London(UK): Hodder &
Stoughton Educational.
Hansen, W. G., 1959. How accessibility shape land use. Journal of American Institute of Planners,
25(2), pp. 73-76.
Hill, M. R., 1982. Spatial Structure and Decision-Making of Pedestrian Route Selection through an
Urban Environment. Nebraska: PhD thesis, University of Nebraska. ETD collection for University of
Nebraska - Lincoln. Paper AAI8306484.
Hood, J., Sall, E. & Charlton, B., 2011. GPS based bicycle route choice model for San Francisco,
California. The International Journal of Transportation Research, 3(1), pp. 63-75.
Ingram, D. R., 1971. The concept of accessibility: a search for an operational form. Regional
Studies, 5(2), pp. 101-107.
Jacobs, J., 1961. The death and life of great American cities. 1994 ed. London: Penguin Books.
Jim, C. Y. & Chen, W. Y., 2010. External effects of neighbourhood parks and landscape elements on
high-rise residential value. Land Use Policy, 27(2), p. 662–670.
Jones, P., Roberts, M. & Morris, L., 2007. Rediscovering mixed-use streets The contribution of local
high streets to sustainable communities, Bristol: The Policy Press.
Kansky, K. J., 1963. Structure of transport networks: relationships between network geometry and
regional characteristics, Chicago: University of Chicago.
Kelly, C. E., Tight, M. R., Hodgson, F. C. & Page, M. W., 2011. A comparison of three methods for
assessing the walkability. Journal of Transport Geography, Volume 19, pp. 1500-1508.
Krambeck, H. V., 2006. The global walkability index. [Online]
Available at: http://dspace.mit.edu/handle/1721.1/34409
[Accessed 01 May 2014].
Lin, L. & Moudon , A. V., 2010. Objective versus subjective measures of the built environment,
which are most effective in capturing associations with walking?. Health & Place, 16(2), pp. 339-
348.
Liu, J., 2012. Urban multi-level development and rail transit, Nanjing: South (in Chinese). s.l.:East
University Press.
McIntyre, M. H., 2006. A literature review of the social economic and environmental impact of
architecture and design, Edinburgh: Information and Analytical Services Division, Scottish
Executive Education Department.
Menghini, G., Carrasco, N., Schussler, N. & Axhausen, K. W., 2010. Route choice of cyclists in Zurich.
Transportation Research Part A: Policy and Practice, 44(9), p. 754–765.
Meyer, M. & Miller, E., 2001. Urban Transportation Planning: A Decision-Oriented Approach.
Boston: McGrawHill.
Ministry for the Environment, NZ, 2005. The Value of Urban Design: The economic, environmental
and social benefits of urban design. [Online]

31
Available at: https://www.mfe.govt.nz/publications/urban/value-urban-design-full-report-
jun05/index.html
[Accessed 01 July 2014].
Network Rail, 2011. The Value of Station Investment. [Online]
Available at:
http://www.steerdaviesgleave.com/sites/default/files/newsandinsights/Station_Investment_Rep
ort.pdf
[Accessed 01 July 2014].
Newman, M., Barabasi, A.-L. & Watts, D. J., 2006. The structure and dynamics of networks.
Princeton and Oxford: Princeton University Press.
Newman, P. G. W. & Kenworthy, J. R., 1989. Cities and Automobile Dependance: A sourcebook.
Aldershot: Gower Technical.
Pan, H., Liu, X. & Zacharias, J., 2003. Street Design Characteristic and Green Transportation Choice
(in Chinese). Urban Planning Forum, Volume 6, pp. 42-48.
Pan, H. & Ren , C., 2005. Study of the Spatial Coupling Between the Metro and Urban Activity
Center—Case Study of Shanghai (in Chinese). Urban Planning Forum, Volume 4, pp. 76-82.
Pan, H., Ren, C. & Yang, T., 2007. A Study on the Impact on the Land Use of Station Areas Brought
by Urban Rail Transport in Shanghai (in Chinese). Urban Planning Forum, Volume 4, pp. 92-97.
Pan, H., Shen, Q. & Chang, L., 2011. Transit-Oriented Development at the Urban Periphery, Insights
from a Case Study in Shanghai, China. Transportation Research Record: Journal of the
Transportation Research Board, Volume 2245, pp. 95-102.
Pan, H., Shen, Q. & Zhang, M., 2009. Influence of Urban Form on Travel Behaviour in Four
Neighbourhoods of Shanghai. Urban Studies, 46(2), pp. 275-294.
Pan, H. & Zhang, M., 2008. Rail Transit Impacts on Land Use, Evidence from Shanghai, China.
Transportation Research Record: Journal of the Transportation Research Board, Volume 2048, pp.
16-25.
Pan, Q., Pan, H., Zhang, M. & Zhong, B., 2014. The Effects of Rail Transit on Residential Property
Values: A Comparison Study on the Rail Transit Lines in Houston and Shanghai. Transportation
Research Record: Journal of the Transportation Research Board.
Parks , J. R. & Schofer, J. L., 2006. Characterising neighbourhood pedestrian environment with
secondary data. Transportation research Part D: Transport and Environment, 11(4), pp. 250-263.
Pooler, J. A., 1995. The use of spatial separation in the measurement of transportation accessibility.
Transport Research A: Policy and Practice, 29(6), pp. 421-427.
Porta, S., Crucitti, P. & Latora, V., 2006. The Network Analysis of Urban Streets: A Dual Approch.
Physica A: Statistical Mechanics and its Applications, 369(2), p. 853–866.
Porter, M. E., 1985. Competitive Advantage. Free Press. New York: Free Press.
Raford, N., Chiaradia, A. J. F. & Gil, J., 2005. Critical mass: Emergent cyclist route choice in central
London. Delft, Techne Press, pp. 527-540.
Reggiani, A., 1998. Accessibility, trade and location behaviour: an introduction. In: A. Reggiani, ed.
Accessibility, Trade and Location Behaviour. Aldershot: Ashgate, pp. 1-16.
Reilly, W. J., 1931. The law of retail gravitation. New York: Knickerbocker Press.
Rogers, K., Jaluzot, A. & Neilan, C., 2012. Green benefits in Victoria Business Improvement District.
[Online]
Available at: http://www.victoriabid.co.uk/wp-

32
content/uploads/2012/10/VBID_Green_Benefits_2012.pdf
[Accessed 01 July 2014].
Roth, C., Kang, S. M., Batty, M. & Barthelemy, M., 2012. Evolution of subway networks. physics.soc-
ph arXiv:1105.5294v3, pp. 1-11.
Rouwendal , J., Van Marwijk , R. & Levkovich , O., 2014. The Value of Proximity to Water in
Residential Areas. [Online]
Available at: http://papers.ssrn.com/sol3/papers.cfm?abstract_id=2427687
[Accessed 01 July 2014].
Shimbel, A., 1953. Structural parameters of communication networks. The bulletin of
mathematical biophysics, 15(4), pp. 501-507.
Siskna, A., 1990. A Comparative Study of Block Size and Form: (in Selected New Towns in the
History of Western Civilization Centres). St. Lucia(Qld): Thesis (PhD) - University of Queensland.
Siskna, A., 1997. The effects of block size and form in North American and Australian city centres.
Urban Morphology, Volume 1, pp. 19-33.
Storper, M. & Venables, A. J., 2004. Buzz: the economic force of the city. Journal of Economic
Geography, 4(4), pp. 351-370.
The Prince’s Foundation for the Built Environment, 2007. Valuing sustainable urbanism, A Report
Measuring & Valuing New Approaches to Residentially Led Mixed Use Growth. [Online]
Available at: http://www.princes-foundation.org/sites/default/files/0707vsureport_0.pdf
[Accessed 01 July 2014].
Thomas, A. & Deakin, E., 2008. Land Use Challenges to Implementing Transit-Oriented
Development in China: Case Study of Jinan, Shandong. Transportation Research Record: Journal
of the Transportation Research Board, Volume 2077, pp. 80-86.
Transport for London, 2011. Valuing Urban Realm. [Online]
Available at: https://toolkit.urban-realm.co.uk/
[Accessed 01 July 2014].
Tribal Urban Studio, CBuchanan, 2008. Baseline Report of the Quality of Place longitudinal study
(Capturing the Impacts of Quality of Place), London: CBuchanan.
Trip, J. J., 2007. What makes a city? Planning for 'quality of place'. [Online]
Available at: http://repository.tudelft.nl/assets/uuid:a0ee18b2-8cf3-45f7-8e2b-
45141ab28ef4/otb_trip_20070320.pdf
[Accessed 01 May 2014].
Trip, J. J., 2007. What makes a city? Planning for 'quality of place'. TU Delft Centre for Sustainable
Urban Areas ed. Delft: IOS Press BV.
Verlander , N. Q. & Heydecker, B. G., 1997. Pedestrian route choice: An empirical study. London,
PTRC Education and Research Services , pp. 39-49.
Wegener , M. & Furst, F., 1999. Land-use transport interaction: State of the art, Dortmund: s.n.
Wegener, M. & Fuerst, F., 2004. Land-Use Transport Interaction: State of the Art. [Online]
Available at: http://ssrn.com/abstract=1434678
[Accessed 01 May 2015].
Wilson, A., 2000. Complex Spatial Systems: The Modelling Foundations of Urban and Regional
Analysis. London: Routledge.

33
Xiao, Y., Webster, C. J. & Chiaradia, A., 2013. How urban form shapes land use: empirical findings in
Wuhan, China. Beijing, The Second International Workshop on Regional Urban and Spatial
Economics in China.
Xiao, Y., Webster, C. & Orford, S., 2014. Identifying house price effects of changes in urban street
configuration: An empirical study in Nanjing, China. Urban Studies 0042098014560500, pp. 1-20.
Zacharias , J., 2005. Non-motorized Transportation in Four Shanghai Districts. International
Planning Studies, 10(3-4), pp. 323-340.
Zacharias, J., 2005. Non-motorized transportation in four Shanghai districts. International Planning
Studies, 10(3-4), pp. 323-340.
Zhang, M., 2007. Chinese Edition of Transit-Oriented Development. Transportation Research
Record: Journal of the Transportation Research Board, Volume 2038, pp. 120-127.


![Métro service disruptions - STM©tro service disruptions ... Delhi Guangzhou Hong Kong Shanghai ... PPT - Metro Service Disruption1.ppt [Mode de compatibilité] Author: gaudy](https://static.fdocuments.net/doc/165x107/5affe9277f8b9a89598bd0d6/mtro-service-disruptions-stm-service-disruptions-delhi-guangzhou-hong-kong.jpg)