Access to Services and the Value Chain in Food Production ... · in Food Production and...
30
Access to Services and the Value Chain in Food Production and Distribution FOOD SECURITY WORKSHOP MEDAN, INDONESIA 27 JUNE 2013 SHERRY STEPHENSON – PECC AND SENIOR FELLOW, ICTSD
Transcript of Access to Services and the Value Chain in Food Production ... · in Food Production and...
Access to Services
and the Value Chain
in Food Production
and Distribution
FOOD SECURITY WORKSHOP MEDAN, INDONESIA 27 JUNE 2013
SHERRY STEPHENSON – PECC AND
SENIOR FELLOW, ICTSD

Food Security
“Food security exists when all people, at all times, have
physical and economic access to sufficient, safe and nutritious
food that meets their dietary needs and food preferences for
an active and healthy life”.
(World Food Summit, 1996)
4 dimensions of food security:
Food Availability
Food Access
Utilization
Stability
Farming-related services; food
engineering to ensure the proper quality
Logistics and Distributional Services
Adequate diet, clean water, sanitation
and health care
Referring to both access and utilization
S
E
R
V
I
C
E
S

New context for Trade: Intermediate
Goods and GVCs lead International Trade Flows
► “Made in the World” (WTO-JETRO 2011 Report ): Not one country but many countries involved in producing a single good
► New pattern of Trade Global Value Chain (GVC), also affecting food production and distribution
► As a consequence, transport services have increased…
Logistics Costs are more and more
important and constitute a key
factor in competitiveness
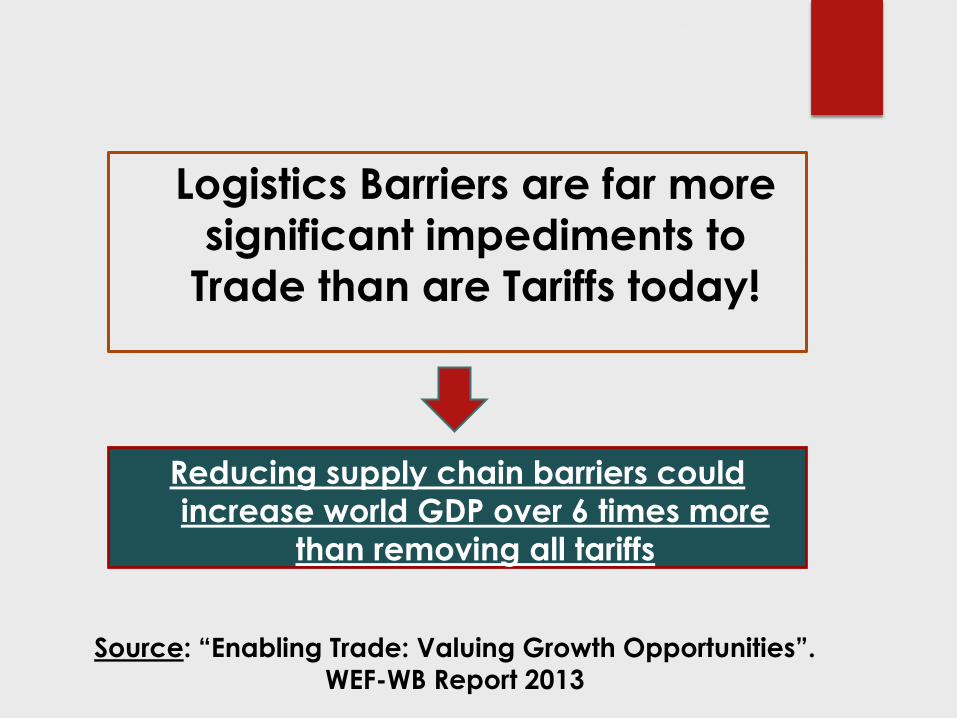
Logistics Barriers are far more
significant impediments to
Trade than are Tariffs today!
Reducing supply chain barriers could
increase world GDP over 6 times more
than removing all tariffs
Source: “Enabling Trade: Valuing Growth Opportunities”. WEF-WB Report 2013

What are the main impediments to
Trade today? Policy makers should focus
on: SUPPLY CHAIN BARRIERS
► Today, the biggest deterrents to trade are the lack
of infrastructure, border policies, efficient services and institutions that create obstacles to the
movement of goods
► 4 main issue areas affecting supply chains before
and after the border (WEF Global Enabling Trade
Report 2012)
► Market Access
► Border Administration
► Telecommunications and Transportation
Infrastructure (SERVICES)
► Business Environment

Supply Chain Barriers to Trade
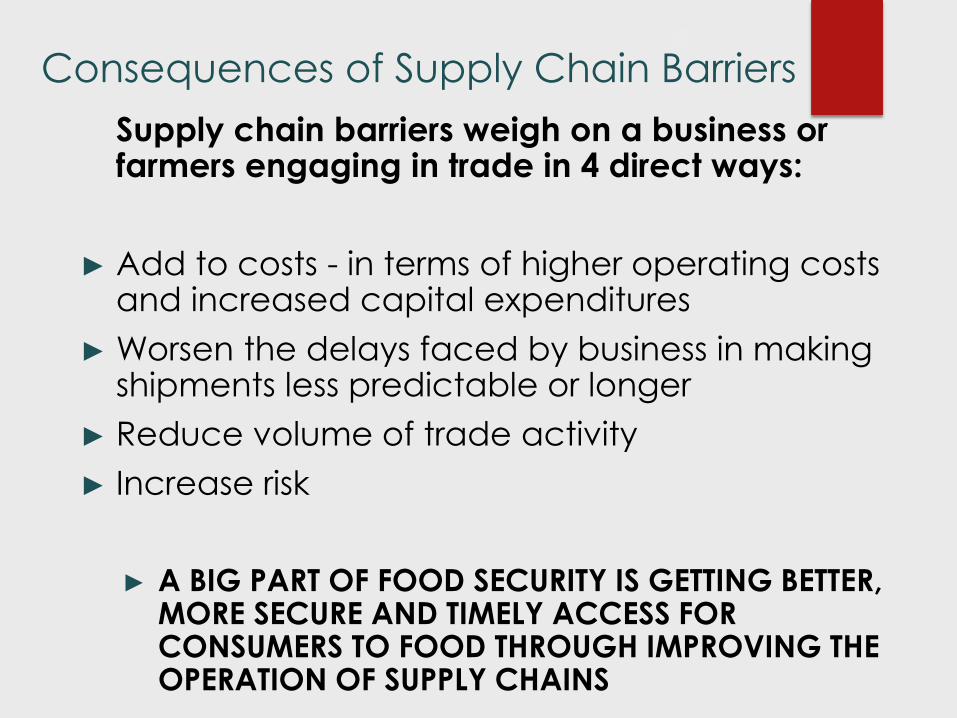
Consequences of Supply Chain Barriers
Supply chain barriers weigh on a business or farmers engaging in trade in 4 direct ways:
► Add to costs - in terms of higher operating costs and increased capital expenditures
► Worsen the delays faced by business in making shipments less predictable or longer
► Reduce volume of trade activity
► Increase risk
► A BIG PART OF FOOD SECURITY IS GETTING BETTER, MORE SECURE AND TIMELY ACCESS FOR CONSUMERS TO FOOD THROUGH IMPROVING THE OPERATION OF SUPPLY CHAINS
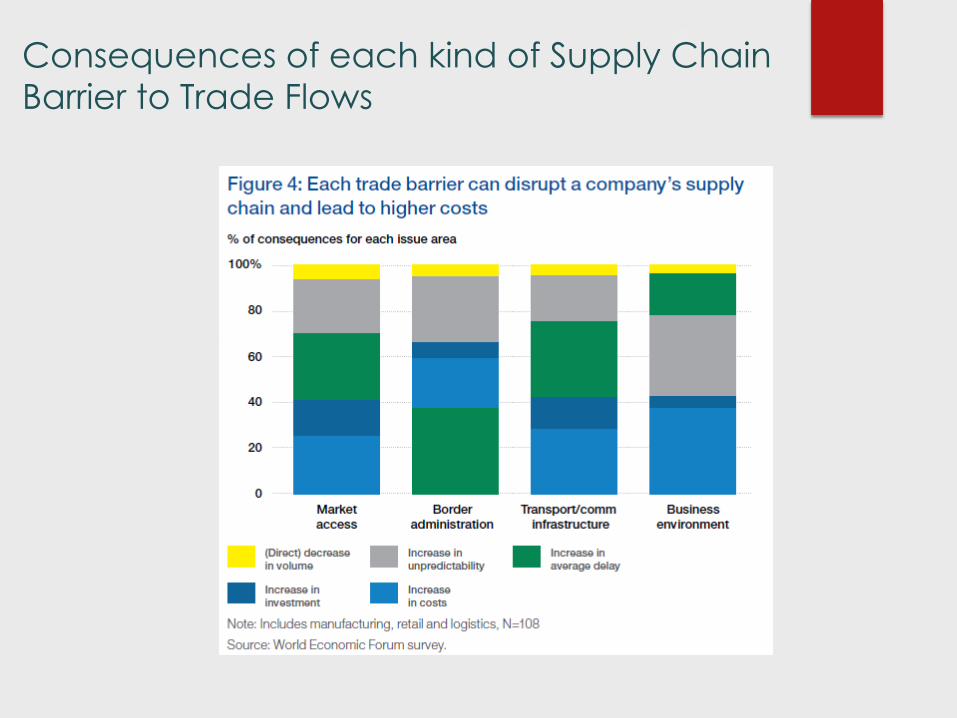
Consequences of each kind of Supply Chain
Barrier to Trade Flows

How do firms deal with Supply Chain Barriers to their Trade?
► A company/ farmer’s experience will vary by
the specific barrier encountered and the actions taken in response
► Example: A company/farmer that must contend
with frequent truck breakdowns resulting from
badly maintained roads (poor transportation
infrastructure) might:
► accept a higher average delay in shipments; or
► purchase additional trucks, thereby increasing capital
expenditure;
► BOTH RESPONSES INCREASE COSTS

How do firms deal with Supply Chain Barriers to their Trade?
► For instance, transportation delays will be more
harmful to a company / farmer that sells fresh fish
than to one that sells canned tuna.
► Whatever response will necessarily increase costs and
be reflected in input higher prices to other producers
using the product and passed on to consumers, or
passed on directly in higher final prices.
Operational Priorities Industry Characteristics
What defines how an individual company responds to a
barrier to trade?

Growth of GDP and Trade to be derived
from reducing Supply Chain Barriers
Two key
components of
supply chain behind
these calculations:
1. BORDER
ADMINISTRATION
2. TRANSPORT AND
COMMUNICATIONS
INFRASTRUCTURE
(SERVICES)
Source: “Enabling Trade: Valuing Growth Opportunities”. WEF-WB Report, 2013

Why does lowering Supply Chain
Barriers produce such large gains?
► Because it eliminates resource waste, whereas
abolishing tariffs mainly reallocates resources.
► Moreover, the gains from reducing barriers are
more evenly distributed among nations than the
gains from eliminating tariffs, reducing inequality
worldwide.
Source: “Enabling Trade: Valuing Growth Opportunities”. WEF Report, 2013

Distribution of the Gains to Trade and GDP
from REDUCTION OF LOGISTICS BARRIERS
► Gains in GDP associated with trade facilitation would
take place in all regions, though they would be
concentrated in those with the greatest improvements.
► These regions would include sub-Saharan Africa, South
Asia, parts of Central and West Asia, as well as other
developing regions.
Economic gains from barrier reductions are
more evenly distributed across countries than
the gains associated with tariff elimination

Implications by Region
(under the ambitious scenario)
Source: “Enabling Trade: Valuing Growth Opportunities”. WEF Report, 2013

Increase in GDP (%) by Region from reduction
of Logistics Barriers to Trade: SE Asia benefits
more than any region but Africa

Who are the main beneficiaries from reduction
in LOGISTICS COSTS TO TRADE?
► Reducing supply chain barriers lowers costs and hence lowers prices,
both for consumers and for firms that use these inputs.
► Consumers gain access to a wider variety of goods
► Workers benefit also – should stimulate employment growth.
► In the long run, this promotes a shift in resources to more productive
industries and firms, thereby increasing productivity and wages.
Reducing supply chain barriers also makes
locations more attractive for off-shoring
investment.
Source: “Enabling Trade: Valuing Growth Opportunities”. WEF Report, 2013

Case Studies FOOD OPERATIONS USING SUPPLY CHAINS

o Poor infrastructure and logistics hobble operations
► Ports operate beyond capacity result in delays
► Lagging telecommunications infrastructure makes it difficult to track containers, rendering operations and planning
cumbersome and time consuming. Sometimes ships depart
half-empty since the containers are “lost” within the system.
► Weak road and rail infrastructure make it difficult to reach
many inland markets. In order to reach some markets CPG
Co. must set up additional regional plants to cover the
geography must carry excess inventories at each point of
the supply chain.
► Risk and uncertainty from poor logistics impact on ability of
CPG Co. to arrange financing which sometimes leads to
interrupted selling operations
Case Study I: CPG - Consumer
Packaged-Goods Producer
operating in Africa

Case Study II: Hugo Restrepo y Cía –
chili pepper paste provider for Tabasco
► Hugo Restrepo y Cía – Colombian enterprise and the main provider of chili pepper paste for Tabasco Leading worldwide hot sauce brand
► Hugo Restrepo y Cía organizes farmers located in the Colombian southwest to grow the chili pepper required by Tabasco, which it then processes, packages and sends abroad, through a supply chain
► Hugo Restrepo y Cia frequently outsources the production of chili pepper paste. This outsourcing often takes place across borders, because crop locations respond to climate and soil conditions.
Source: IDB (2012) International Product Fragmentation and the Insertion of Latin America and the Caribbean in Global
Production Networks. Colombian Case Studies

Chili Paste Value Chain
Chili pepper
production
Chili paste
production
Packing &
storage Hot sauce
production
Distribution &
marketing Inputs
Seeds
Fertilizers
Agrochemical
s (Herbicides,
fungicides & pesticides)
Farm
equipment
Irrigation
equipment
Chili
peppers:
Tabasco
Cayenne
Habanero
Chipotle
Jalapeño
Others
Chili pepper
paste
Brine
Barrel Bottles of
different hot
sauce recipes Containers
ACTIVITIES
ACTORS
PRODUCTS
Producers Processors Traders Producer
firms
Inputs
suppliers
Supermarkets
Food services
Wholesalers
Retailers
Bottles of
different hot
sauce recipes
Source: IDB (2012) International Product Fragmentation and the Insertion of Latin America and the
Caribbean in Global Production Networks. Colombian Case Studies
Case Study II: Hugo Restrepo y Cía –
chili pepper paste provider for Tabasco
Hugo Restrepo
involved in…
Hugo Restrepo
does not own
lands of crops -
link to small
farmers bound
by contractual
agreements

43%
5%
22%
30%
Breakdown of the costs of chili pepper
paste sold in the international market
Agricultural input
Stock-up and
Processing Costs
Packaging and
Storage
International
Logistics
Case Study II: Hugo Restrepo y Cía –
chili pepper paste provider for Tabasco
57% correspond to the stages in
which the firm is directly involved: - stock-up and
processing costs (5%);
- packaging and storage (22%);
- international logistics
(30%).
Logistics account for 1/3 of final costs of
product sold in international market.

► Alimentos SAS A fruit-pulp producer with more
than 350 active customers; participation in the
global market as exporter of tropical fruit pulps
naturally concentrated, and frozen cut fruit.
► Products made by Alimentos SAS fruit pulp, whole
and cut frozen fruit, and fruit juices. Produced and
sold through a supply chain, with exports accounting
for 26%.
► Firm’s customers food chain stores and business or
institutional clients around the world (fast food chain
restaurants, hotels, restaurants, educational
institutions, and hospitals).
Case Study III: Alimentos SAS – fruit-pulp
producer taking part in international market

Fruit pulp value chain
Transport &
distribution
Extraction
of pulp
Freezing/
pasteurization
Product
preparation
Distribution &
marketing
Fruit crops and
harvesting
Fruits Fruits Fruit pulp
Cut fruit
Frozen fruit
pulp
Preserves
Beverages
ACTIVITIES
ACTORS
PRODUCTS
Transporters Processors Firms Farmers
Supermarkets
Food services
Wholesalers
Retailers
Fruit pulp (different
presentations)
Industrial
firms
Sugar
confectionery
Other fruit
products
Pasteurized
fruit pulp
Case Study III: Alimentos SAS – fruit-pulp
producer taking part in international market

The firm and its linkages
► Products delivered to final customers in Bogotá or elsewhere.
Transport is outsourced from independent transporters. ► Alimentos has had a long-term contract with an offshoring client
in the supply chain – Matosantos - the marketer providing fruit-
pulp for juices in Puerto Rico.
► Matosantos terminated its contract with Alimentos SAS and
replaced firm with a Costa Rican supplier able to offer the
product at a better price due to better logistics, distribution and refrigerating services. Why? stated need to maintain
competitive position in the supply chain; logistics components of
Alimentos production had become too expensive
Case Study III: Alimentos SAS – fruit-pulp
producer taking part in international market

Case IV: Transport Costs –
Chickens in Indonesia
Source: “Indonesia’s Poultry Value Chain. Costs, Margins, Prices, and Other Issues”. Nathan
Associates Inc and USAID. (2013)
4.7% of the retail price for broilers Transport Costs
The highest cost
is for transport of imported raw
materials to get
from the port to
the mill

Why is this transport cost elevated?
► The high import component of Indonesian poultry
feed
► Inefficient port handling facilities (insufficient berths in
Jakarta)
► Excess demurrage due to slow turnaround of vessels
► Slow time for transport from port to mill requiring 2-4
times as many trucks to execute the process (with
associated over capitalization of the trucking sector)
High costs reflect inefficiencies in port and road infrastructure
Case IV: Transport Costs –
Chickens in Indonesia

Increased Total Factor Productivity derived
from liberalization in Services in Indonesia:
Comparison with Korea and Brazil
If Indonesia were to
match policies of these
service sector reform
champions, the
productivity gains for
Indonesian
manufacturing firms
would be over 5%, instead of the 3.5%
realized as results of current reforms
Source: Duggan, Rahardja, Varela. “Service Sector Reform and Manufacturing Productivity. Evidence
from Indonesia” (WB, 2013)

BUT – THERE IS MUCH MORE TO BE DONE TO
IMPROVE PRODUCTIVITY AND LOGISTICS
► Logistics costs in Indonesia are estimated
to be nearly double those in South Korea,
and nearly three times those in Japan
► Total factor productivity gains accrue
disproportionately to those firms that are relatively
more productive; those gains are directly linked to
the relaxation of restrictions in the transport and
electricity, gas, and water sectors.
(WB Study for Indonesia, 2013)
Source: Duggan, Rahardja, Varela. “Service Sector Reform and Manufacturing Productivity. Evidence from Indonesia” (WB, 2013)

Importance of non-food inputs
for better FOOD SECURITY
► Food production and distribution dependent upon SERVICES all along the value chain
► Especially IMPORTANT logistics and distributional services, as well as trade facilitation (E.g. extra cost at customs ; inefficient port handling; poor road or telecom systems)
► Key role of technology along Food GVCs can improve food security as well (E.g. specialized seeds / development of new methods to maintain fruit-pulp fresh / development of new packages in order to optimize logistics)
► Agriculture negotiations need to take better account of the important role of Services
Trade facilitation agreement at the WTO will contribute to
food security since many of the barriers that affect food
GVCs have to do with logistics and supply chain barriers