
ACCESS for ELLs® Interpreting the Results Developed by the WIDA Consortium.
30
ACCESS for ELLs® Interpreting the Results Developed by the WIDA Consortium
-
Upload
valentine-mathews -
Category
Documents
-
view
223 -
download
0
Transcript of ACCESS for ELLs® Interpreting the Results Developed by the WIDA Consortium.

ACCESS for ELLs®Interpreting the Results
Developed by the WIDA Consortium

2Interpreting ACCESS for ELLs® Scores
OverviewOverview
Description of ACCESS for ELL® Scores-2007
Changes to Reporting for the 2007 Administration
Use of Grade Level Cut Scores
Score Reports: Description and Uses
Q&A

3Interpreting ACCESS for ELLs® Scores
ACCESS for ELLs® OverviewACCESS for ELLs® Overview
Secure, large-scale test
Anchored in WIDA’s ELP Standards
Assesses academic language
Three overlapping tiers for each grade level cluster Tier A: Proficiency levels 1-3 Tier B: Proficiency levels 2-4 Tier C: Proficiency levels 3-5
One third of test items replaced annually
Administered once per year as required by No Child Left Behind
Indicator of student’s ability to perform on state content test

4Interpreting ACCESS for ELLs® Scores
Tier Structure of ACCESS for ELLs®Tier Structure of ACCESS for ELLs®
ENTERING BEGINNING DEVELOPINGEXPANDING BRIDGING
1 2 3 4 5
Tier A
Tier B
Tier C

5Interpreting ACCESS for ELLs® Scores
Structure of ACCESS for ELLs®Structure of ACCESS for ELLs®
Grade Levels
and Tiers
K
1-2
3-5
6-8
9-12
Adaptive (no tiers)
A B C
A B C
A B C
A B C
101 (roll-out Winter 2006)
102 (roll-out Winter 2007)
103 (roll-out Winter 2008)
Listening — group administered, machine scored
Reading — group administered, machine scored
Speaking — individual administered, TA scored
Writing — group administered, rater scored
Domains
Series

6Interpreting ACCESS for ELLs® Scores
ACCESS for ELLs®: Types of ScoresACCESS for ELLs®: Types of Scores
ACCESS for ELLs® Scores
Raw Scale ELP Levels

7Interpreting ACCESS for ELLs® Scores
ACCESS for ELLs® ScoresACCESS for ELLs® Scores
ACCESS for ELLs® Scores
Listening
Speaking
Reading
Writing
Composite Scores
Oral
Literacy
Comprehension
Overall

8Interpreting ACCESS for ELLs® Scores
Composite ScoresComposite Scores
Oral Score
Literacy Score
Comprehension Score
Overall Composite
Score
Listening (50%)
Reading (50%)
Listening (30%)
Listening (15%)
Speaking (50%)
Writing (50%)
Reading (70%)
Reading (35%)
Speaking (15%)
Writing (35%)
=
=
=
=
+
+
+
+

Important Changes to Reporting for 2007 Administration

10Interpreting ACCESS for ELLs® Scores
Scoring CapsScoring Caps
Kindergarten form of ACCESS for ELLs® maximum overall English language proficiency level that a student taking the can receive is 3.7
Tier A or Tier B scores for the language domains of Listening and Reading (and the Comprehension composite) are capped. Students cannot receive an ELP level above 4.0 for Tier A and above 5.0 for Tier B.

11Interpreting ACCESS for ELLs® Scores
Teacher Report FormatTeacher Report Format
Writing raw scores are presented by standard next to the maximum number of points for the given standard(s) and scoring category reported

12Interpreting ACCESS for ELLs® Scores
Proficiency Grade Level Cut ScoresProficiency Grade Level Cut Scores
Scale scores have not changed
Cut scores have been adjusted to show progress by grade level rather than by cluster level for each language domain
Changes in proficiency level cut scores from year to year now account for both maturational and language proficiency growth of English language learners

13Interpreting ACCESS for ELLs® Scores
Composite Scores interpreted using Grade Vs Cluster Cut ScoresComposite Scores interpreted using Grade Vs Cluster Cut Scores
Prof Level Score of Average Overall Composite Scale Score by Grade
1.0
2.0
3.0
4.0
5.0
6.0
1 2 3 4 5 6 7 8 9 101112
Grade
Pro
fien
cy
Le
vel
S
co
re
Cluster Cuts
Grade Level

14Interpreting ACCESS for ELLs® Scores
Use of Grade Level Cut ScoresUse of Grade Level Cut Scores
Provides a more precise measurement of ELLs’ annual progress in English language proficiency
Eases the creation of a trajectory of estimated student growth, in any one or combination of language domains, from year to year
Facilitates articulation from grade to grade, and teacher to teacher, of the status of ELLs
Helps in the calculation of Annual Measurable Achievement Objectives (AMAOs). States with at least three consecutive years of data have trend data.

ACCESS for ELLs® Reports- 2007

16Interpreting ACCESS for ELLs® Scores
Considerations on the use of ACCESS for ELLs® ReportsConsiderations on the use of ACCESS for ELLs® Reports
1. Target certain reports to specific stakeholders
2. Offer Professional Development on how to understand and use the information on the reports
3. Consider summarizing or consolidating the suggestions for using the information from each score report according to target audience
4. Look at different configurations of data in the reports for individual and group placement or to develop a plan for organizing services for English Language Learners for the coming school year
5. Archive copies of the interpretive guide along with copies of the score reports so that new personnel for the 2007-08 academic year can become acclimated with data from ACCESS for ELLs®
17Interpreting ACCESS for ELLs® Scores
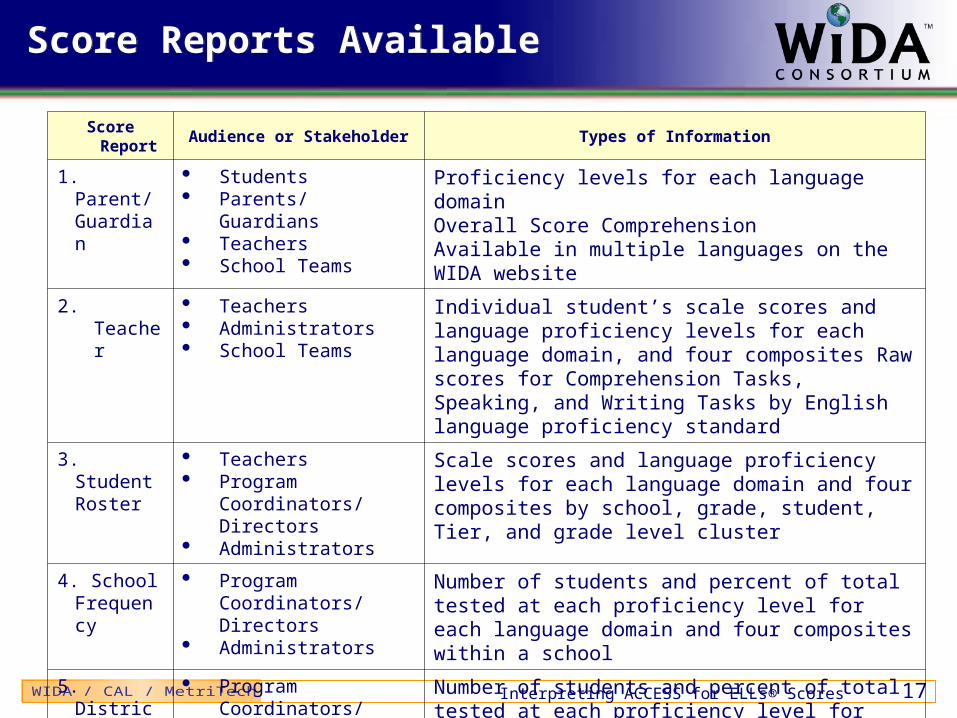
Score Reports AvailableScore Reports Available
Score Report Audience or Stakeholder Types of Information
1. Parent/ Guardian
Students Parents/ Guardians Teachers School Teams
Proficiency levels for each language domain Overall Score ComprehensionAvailable in multiple languages on the WIDA website
2. Teacher Teachers Administrators School Teams
Individual student’s scale scores and language proficiency levels for each language domain, and four composites Raw scores for Comprehension Tasks, Speaking, and Writing Tasks by English language proficiency standard
3. Student Roster
Teachers Program Coordinators/
Directors Administrators
Scale scores and language proficiency levels for each language domain and four composites by school, grade, student, Tier, and grade level cluster
4. School Frequency
Program Coordinators/ Directors
Administrators
Number of students and percent of total tested at each proficiency level for each language domain and four composites within a school
5. District Frequency
Program Coordinators/ Directors
Administrators Boards of Education
Number of students and percent of total tested at each proficiency level for each language domain and four composites by proficiency levels for grades within a district

18Interpreting ACCESS for ELLs® Scores
Parent ReportParent Report
Student’s parent or guardian gets the report
Provided in English and 18 additional languages (visit www.wida.us)
A letter to accompany the report in parents’ primary language is suggested
Other stakeholders – student, teachers, school teams

19Interpreting ACCESS for ELLs® Scores
Demographic Information About
the Student
Description of the ELP Levels
Student’s ELP Level by Domain
Comprehension Score
Overall Score

20Interpreting ACCESS for ELLs® Scores
Teacher ReportTeacher Report
Teachers and other stakeholders, such as administrators, have access to this report
The Overall Score summarizes student’s global language proficiency and allows examination of strengths and weakness by domain
Individual report components offer a starting point for informing the areas of curriculum, instruction and assessment of ELL’s. Suggestions for the differentiation across levels of language proficiency can be found in the strands of the model performance indicators
Rubrics in Interpretative Guide –Writing and Speaking –scaffold across levels of language proficiency and may be used in classroom instruction and assessment throughout the year

21Interpreting ACCESS for ELLs® Scores
Demographic Information About
the Student
Description of the ELP Levels
Student’s ELP Level by Domain
Student’s Composite
Scores
Student’s Scale Score by Domain
Student’s Scale
Composite Scores
Student’s Comprehension
by Standard
Student’s Speaking Performance by
Standard
Student’s Writing
Performance by Standard

22Interpreting ACCESS for ELLs® Scores
Communication of Data from the ReportCommunication of Data from the Report
No single score or language proficiency level should be used as the sole criteria for making decisions regarding a student’s English language proficiency.
Sharing student information from score reports is encouraged for all educators who work with English language learners.
Data in the reports need to be contextualized to be meaningful; include both historical and demographic information on the students when presenting the results.
When disseminating information on the students’ productive language, refer to criteria in the speaking and writing rubrics.
CAN DO Descriptors may help further explain student expectations at each level of English language proficiency.

23Interpreting ACCESS for ELLs® Scores
Each language domain has its own scale; one cannot compare scale scores across Listening, Speaking, Reading, and Writing. Proficiency Levels (as scale score interpretations) may be used to make comparisons between independent or combinations of language domains.
Scale scores for Oral Language, Literacy, Comprehension, and the Overall Score are weighted. Reading and Writing (Literacy) are emphasized over Listening and Speaking (Oral Language) to reflect the stress of these domains stressed in instruction and assessment.
Comprehension Tasks, Speaking Tasks, and Writing Tasks is based on a small number of tasks and the results should not be generalized. Model performance indicators associated with the ELP standards of the specific grade level cluster as well as additional student work samples may be helpful in targeting instruction and classroom assessment.
A student’s progress or growth in English language proficiency can only be determined when two consecutive years of data are available. Three years of data can help project a trend.

24Interpreting ACCESS for ELLs® Scores
Student Roster ReportStudent Roster Report
Audience includes Teachers, Program Coordinators, and Administrators
District administrators may examine scores from each language domain within a Tier and grade level cluster to detect any patterns. To what extent are there differences in student performance between the language domains and are these differences attributed to second language development or delivery of instructional services?
Development of school and district improvement plans for ELL’s
A starting point for grouping students for support services according to their Overall Score or by their profiles according to language domains (ex: homogeneous groupings for reading in elementary schools).

25Interpreting ACCESS for ELLs® Scores
Student Roster ReportStudent Roster Report
Scale Score and ELP Level by
Domain
Scale Score and ELP Level by Composite:
Oral Language, Literacy,
Comprehension and Overall
Cluster
Tier

26Interpreting ACCESS for ELLs® Scores
School Frequency ReportSchool Frequency Report
Indicates number of students and percent of total tested for language domains (including range of scaled scores). Comprehension, Oral Language, and Literacy by proficiency levels for grade levels within a school
Results should not be generalized and needs to be contextualized in order to provide meaningful information on curricular, instructional or assessment decisions
School Frequency Reports for two consecutive years provide cross-sectional data
In communicating results of this report, use both the numbers and their corresponding percents. If numbers are low, the percent may appear distorted if shown in isolation
Use the information contained in the report to gain a sense of the school-wide effort in educating English language learners

27Interpreting ACCESS for ELLs® Scores
Highest & Lowest Scores
Total Tested
Number of Students Tested who scored at each ELP level by Domain and Composite
% of Total Students Tested who scored at each ELP level by Domain and Composite

28Interpreting ACCESS for ELLs® Scores
District Frequency ReportDistrict Frequency Report
Audience includes Program Coordinators, Boards of Education, and Administrators
Indicates number of students and percent of total tested for language domains (including the range of scale scores), Comprehension, Oral Language, and Literacy by proficiency levels for grade levels within a district.
Data can be graphically displayed in various forms Information will be useful in planning, designing, or restructuring program services.
Based on an individual state’s criteria for “attainment” of English language proficiency and its definition of cohort groups this report may serve as a district’s estimate of the number and/or percent of students who have met that criterion for Annual Measurable Achievement Objectives (AMAO’s).

29Interpreting ACCESS for ELLs® Scores
Highest & Lowest Scores
Total Tested
Number of Students Tested who scored at each ELP level by Domain and Composite
% of Total Students Tested who scored at each ELP level by Domain and Composite

For more information, please contact the WIDA Hotline:1-866-276-7735 or www.wida.us/helpform
World Class Instructional Design and Assessment, www.wida.us
Center for Applied Linguistics, www.cal.org
Metritech, Inc., www.metritech.com
Questions
or
Comments?


![[PPT]Lesson Planning for ELLs Using the WIDA/ELP …esl.ncwiseowl.org/UserFiles/Servers/Server_4502383/File... · Web viewTitle Lesson Planning for ELLs Using the WIDA/ELP Standards](https://static.fdocuments.net/doc/165x107/5ae27bea7f8b9a0d7d8c6741/pptlesson-planning-for-ells-using-the-widaelp-esl-viewtitle-lesson-planning.jpg)


