Access & Excellence Initiative* What is it like to be a SHEEO? Can better information help? Paul...
47
Access & Excellence Initiative* What is it like to be a SHEEO? Can better information help? Paul Lingenfelter and Charlie Lenth July, 2006 * Funded by the Lumina Foundation for Education
-
Upload
posy-sutton -
Category
Documents
-
view
215 -
download
0
Transcript of Access & Excellence Initiative* What is it like to be a SHEEO? Can better information help? Paul...

Access & Excellence Initiative*What is it like to be a SHEEO?
Can better information help?
Paul Lingenfelter
and Charlie Lenth
July, 2006
* Funded by the Lumina Foundation for Education

• Students & parents
• Faculty & staff
• Presidents, all sectors
• Board members & business leaders
• Legislators
• The Governor
• The Public interest
Who are the SHEEO constituents?Who are the SHEEO constituents?

• Low prices, and generous aid
• Admission to high status schools
• Convenient class schedules
• Good food, housing, recreation
• Safety (parents) freedom (students)
• Small classes, contact with faculty
• Degrees and certificates
• A good job
What do students and parents want?What do students and parents want?

• Above average pay and benefits
• Job control – working conditions, hours, time, office space, etc.
• Respect and deference
• A strong role in choosing leaders
• Academic freedom and more
• Secure, generous retirement
What do faculty and staff want?What do faculty and staff want?

• More money
• Less operational regulation
• Freedom to set tuition & fees
• Zero academic regulation
• Minimal reporting
• Deference
What do presidents want?What do presidents want?

• Happy students, parents, faculty, & staff
• An ample supply of able graduates
• Efficient operations
• Low prices, low taxes
• Extra (“fair”) benefits for their business or institution
What do Board & business leaders want?What do Board & business leaders want?

• Respect and deference
• Ability to deliver for constituents
• Happy students, parents, faculty, & staff
• An ample supply of able graduates
• Efficient operations
• Low prices, low taxes
• Extra (“fair”) benefits for their business or institution
What do legislators want?What do legislators want?

• A political future
• A legacy of significant contributions
• Visible leadership in government
• Efficient operations
• Low prices and low taxes
• Ability to reward supporters
• Respect and deference
What do Governors what?What do Governors what?

To double the degree production
of the 1960s with
no compromise in quality.
What does the public need? What does the public need?

• Global competition
• Aging workforce
• More disadvantaged students
• A low-tax/high service demand vise
• Constituents in conflict
The SHEEO environmentThe SHEEO environment

Global Competition
The SHEEO environmentThe SHEEO environment

Forces Flattening the Global Playing FieldForces Flattening the Global Playing Field
Fall of Berlin Wall
First Mainstream Web Browser
Work Flow Software
Open Sourcing
Outsourcing
Offshoring
Supply-chaining
Insourcing
In-forming
“The Steroids” Wireless Mobile Digital Communication
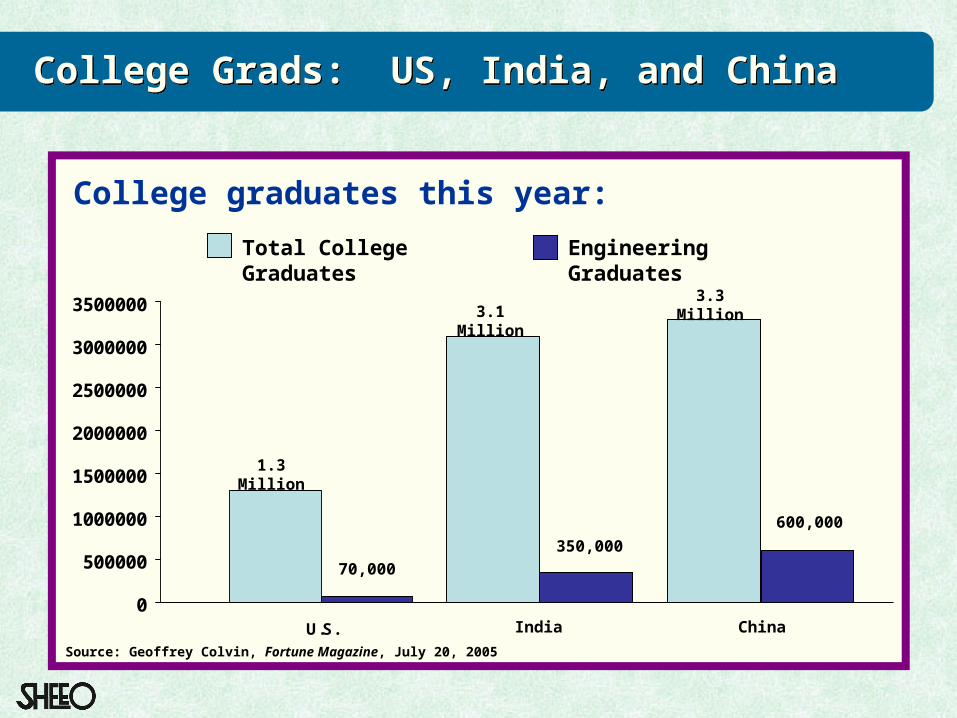
College graduates this year:
Source: Geoffrey Colvin, Fortune Magazine, July 20, 2005
Total College Graduates Engineering Graduates
0
500000
1000000
1500000
2000000
2500000
3000000
3500000
U.S.
1.3 Million
70,000
India
3.1 Million
350,000
China
3.3 Million
600,000
College Grads: US, India, and ChinaCollege Grads: US, India, and China
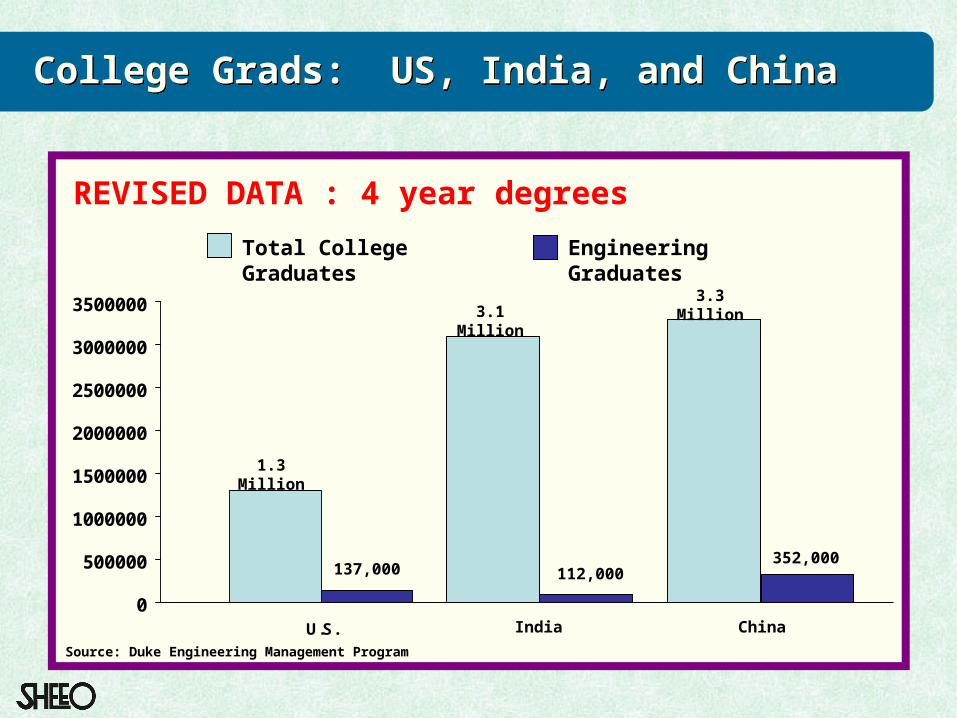
Total College Graduates Engineering Graduates
0
500000
1000000
1500000
2000000
2500000
3000000
3500000
U.S.
1.3 Million
137,000
India
3.1 Million
112,000
China
3.3 Million
352,000
REVISED DATA : 4 year degrees
Source: Duke Engineering Management Program
College Grads: US, India, and ChinaCollege Grads: US, India, and China

The SHEEO environmentThe SHEEO environment
Aging Workforce
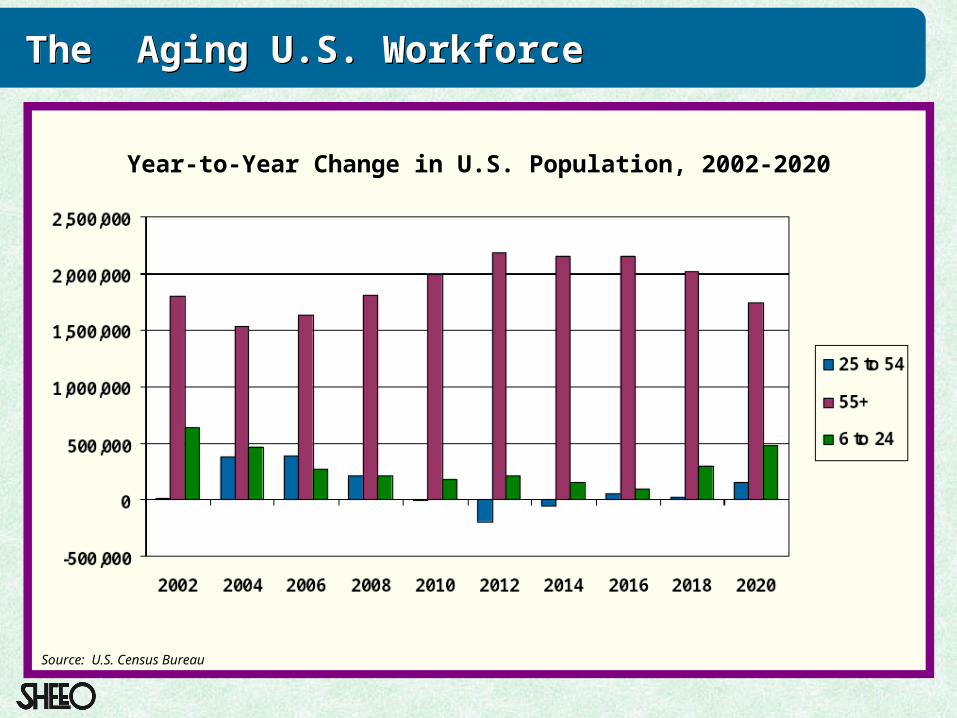
The Aging U.S. WorkforceThe Aging U.S. Workforce
Source: U.S. Census Bureau
Year-to-Year Change in U.S. Population, 2002-2020

More Disadvantaged
Students
The SHEEO environmentThe SHEEO environment

College Participation By Achievement Test and Socioeconomic
Status Quartile
SES Quartile
Lowest Highest
AchievementQuartile
Highest 78% 97%
Lowest 36% 77%
Source: Access Denied, Department of Education, February 2001
College Participation by SES StatusCollege Participation by SES Status

Source: Demography and the Future of Higher Education Policy, Richard Fry, April 2001
0
5
10
15
20
25
30
35
1970 1980 1990 1995 2000 2010 202018
- to
24
-Ye
ar-
Old
Po
pu
lati
on
(in
mill
ion
s)
Traditional College-Age PopulationTraditional College-Age Population

Non-Hispanic White18%
Asian/Pacific Islander 16%
Non-Hispanic Black16%
Native American1%
Hispanic 49%
New 18-24 Year Olds by RaceNew 18-24 Year Olds by Race
Source: Demography and the Future of Higher Education Policy, Richard Fry, April 2001
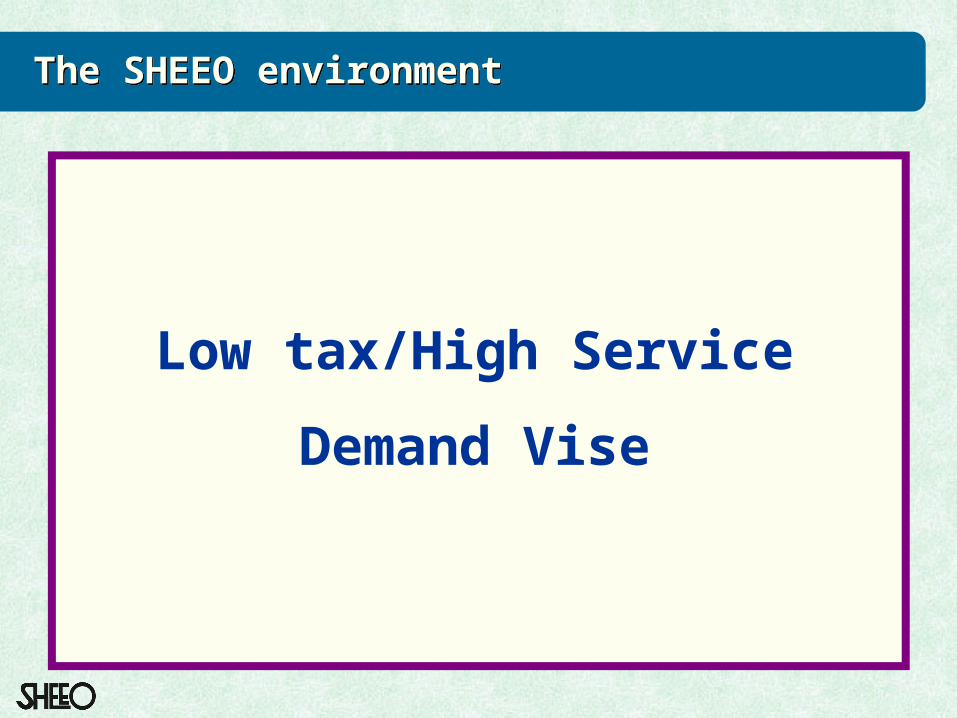
Low tax/High Service
Demand Vise
The SHEEO environmentThe SHEEO environment

-0.5 -1
.0
-1.0 -1
.6 -2.1
-2.3 -2
.8
-2.9
-3.0 -3
.3 -3.8
-3.9 -4
.2
-4.2
-4.3
-4.3
-4.4
-4.4 -4
.8
-4.8
-4.8 -5
.1
-5.2
-5.2
-5.3 -5
.6
-5.6
-5.7
-5.7
-5.7
-5.8
-5.8
-5.9 -6
.2
-6.3
-6.5
-6.7
-6.8
-6.9
-7.0
-7.0 -7
.4 -8.0
-8.2 -8
.9 -9.3
-9.3 -9
.8 -10
.5
-10
.7
-12
-9
-6
-3
0
UtahM
ontana
New Hampshire
DelawareNew Jersey
Maine
Maryland
Massachusetts
WisconsinVerm
ontO
hioNorth Dakota
ConnecticutKansas
ArkansasVirginia
NebraskaO
klahoma
MinnesotaColorado
West Virginia
KentuckyM
ichiganArizona
New YorkG
eorgiaHawaiiIllinois
PennsylvaniaAlaska
Rhode IslandU
nited States
New Mexico
CaliforniaIowa
IndianaNorth Carolina
FloridaIdaho
South CarolinaSouth Dakota
Missouri
Washington
OregonTexas
NevadaTennesseeM
ississippiLouisianaAlabam
aProjected State and Local Budget Deficits as a Percent of Revenues, 2013Projected State and Local Budget Deficits as a Percent of Revenues, 2013
Source: NCHEMS; Don Boyd (Rockefeller Institute of Government), 2005

Federal budget – Comptroller GeneralFederal budget – Comptroller General
Composition of Spending as a Share of GDPAssuming Discretionary Spending Grows with GDP after 2005
and All Expiring Tax Provisions are Extended
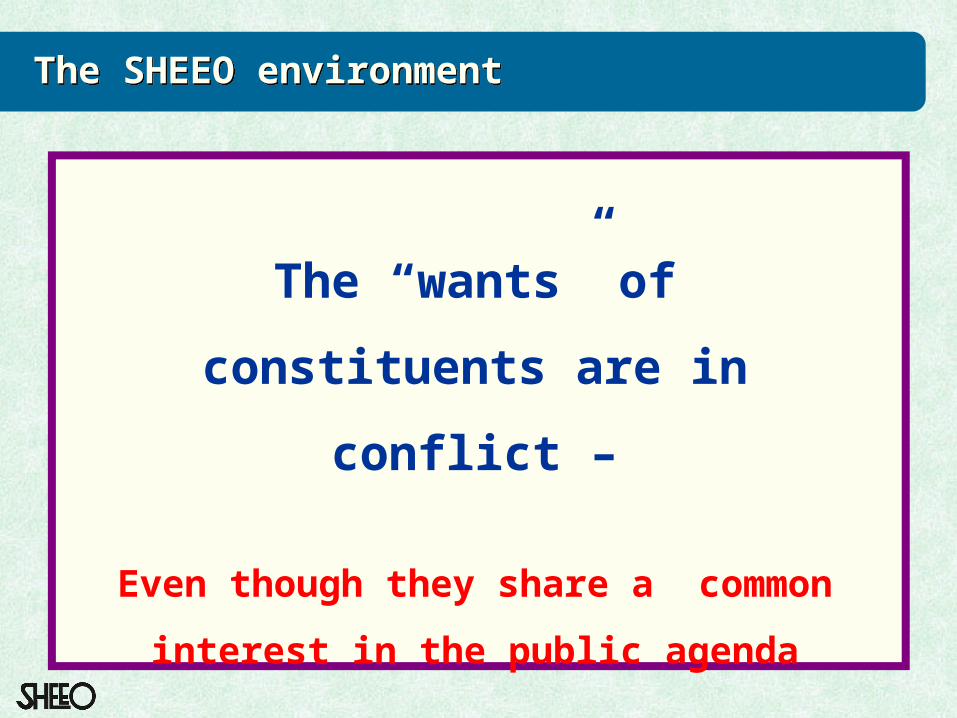
The “wants” of
constituents are in conflict
–
Even though they share a common
interest in the public agenda
The SHEEO environmentThe SHEEO environment

1) What are the relevant facts about education in your state?
2) What needs to change?
3) How can you help make necessary changes?
The strategic questions for SHEEOsThe strategic questions for SHEEOs

• Constituents loyal to the SHEEO?
• Tickets to sporting events?
• Legal powers?
• Loyal alumni?
• A big budget?
• Professional expertise?
• Personal credibility?
• Access to compelling information?
What resources does a SHEEO have?What resources does a SHEEO have?

How can SHEEOs enhance:
• Professional expertise
• Personal credibility
• Access to compelling information for:
Building consensus on needs and objectives
Identifying obstacles and opportunities Developing operating strategies
The strategic issue –The strategic issue –

1. Student indicators (preparation, participation, progress, learning, and outcomes)
2. Economic/social indicators (workforce, economic development, community needs, civic values, etc.)
3. Financial indicators (costs, productivity, and investment returns)
Questions:What’s available? Missing? Needed?Appropriate context and cautions for using indicators? How can SHEEO “add value” to what’s available?
Access & Excellence working groupsAccess & Excellence working groups

• College preparation and readiness:Alignment – Rigor – High expectations
• Postsecondary participation:Enrollment – Progression – Completion
• Education outcomes:Learning – Instructional quality – Post-college employment and education
• Adult-learning needs and status
Student and Learning Indicators (Group I)Student and Learning Indicators (Group I)

Is math achievement improving?Is math achievement improving?
8th Graders Scoring At or Above Proficient in NAEP math: 1992-2005
43%
28%
35%29%
23%
20%
0% 25% 50% 75% 100%
Top Improver(MA)
Nation
North Dakota
1992
2005

19.6%
11.1%
0%
2%
4%
6%
8%
10%
12%
14%
16%
18%
20%
New Mexico Nation
59.8
35
22.1
10.3
68.2
38.6
26.2
17.9
90.6
61.8
44.2
27.6
Graduate from HighSchool
Enter College Still Enrolled TheirSophomore Year
Graduate within 150%of Normal Time
46.2%
41.9%
37.7%
40.3%
-5% 5% 15% 25% 35% 45% 55%
NM Private 4-Year Insts
NM PublicUniversities
NM Community Colleges
NM Total
Student Pipeline Results (2002): Of 100 Ninth Graders, How Many . . . .
New Mexico
US
Top Performing State
Pell Grant Recipients as a Percentage of Fall 2003 Undergraduate Enrollment
Adult Undergraduate Enrollment as a Percentage of Adult (25-64) Population with Only a HS Diploma or Equivalent
Source: HigherEdInfo.org
PA
ND
ND
NJ
Measuring Up 2004 Report Card
NEW MEXICO
Source: Postsecondary Education OPPORTUNITY Source: HigherEdInfo.org, from IPEDS and U.S. Census
US average = 35.4%
US average = 30.7%
US average = 31.0%
US average = 31.1%
Source: Measuring Up 2004, highereducation.org
Student Participation and ProgressStudent Participation and Progress

1. Education attainment and income
2. Demand and graduates in critical fields (e.g., teaching, STEM fields, high tech occupations)
3. Extent / benefits of R&D
4. Economic “transformation” (start-ups, entrepreneurism, spin-offs, etc.)
5. Civic values, community needs, and other non-economic benefits
Economic/Social Indicators (Group II)Economic/Social Indicators (Group II)

Education , Income, and Economic StrengthEducation , Income, and Economic Strength
Percent of the Adult Population Ages 25 to 64 with a Bachelor’s Degree or Higher
AL
AK
AZ
AR
CA
CO
CT
DE
GA
IL
IN
IA
KS
KY
LA
ME
MDMA
MS
NE
NV
NJ
NY
NC
ND
OH
OK
ORPA
SC
SD
UT
VT
VA
WA
ID
MI
MN
MO
NH
NM
TN TX
WV
WI
WY
$15,000
$20,000
$25,000
$30,000
15% 20% 25% 30% 35% 40%
Personal Income Per Capita, 2000
MT
HI RIFL US
Low Income, High Educational AttainmentLow Income, Low Educational Attainment
High Income, High Educational AttainmentHigh Income, Low Educational Attainment
State New Economy Index (2002)
Top Tier
Middle Tier
Low Tier
Educational Attainment, Personal Income, and Economic Strength
Source: Patrick Kelly, NCHEMS

NM
Valencia
UnionTorrance
Taos
Socorro
Sierra
Santa Fe
Sandoval
San Miguel
San J uan
Roosevelt
Rio Arriba
Quay
Otero
Mora
McKinley
Luna
Lincoln
LeaHidalgo
Harding
Guadalupe
Grant
Eddy
Dona Ana
DeBaca
Curry
Colfax
Cibola
Chaves
Catron
Bernalillo
10%
15%
20%
25%
30%
35%
40%
$9,000 $14,000 $19,000 $24,000
Personal Income per Capita
Ad
ult
s ag
e 25
-64
wit
h B
ach
elo
rs D
egre
e o
r H
igh
er (
%)
Los Alamos: (64.0%, $34,646)
AL
AK
AZ
AR
CA
CO CT
DE
FL
GA
HI
ID
IL
IN
IA
KS
KY
LA
ME
MD
MA
MI
MN
MS
MO
MTNE
NV
NH
NJ
NM
NY
NC
ND
OH
OK
OR
PA
RI
SC
SD
TN
TX
UT
VT VA
WA
WV
WI
WY
US
15%
20%
25%
30%
35%
40%
$15,000 $18,000 $21,000 $24,000 $27,000 $30,000
Personal Income per Capita
Ad
ult
s a
ge
25
-64
wit
h B
ac
he
lors
De
gre
e o
r H
igh
er
(%)
By State For New Mexico Counties
Educational Attainment and Personal IncomeEducational Attainment and Personal Income
Source: US Census Bureau 2000, HigherEdInfo.org

5,060
2,714
810
501
861
1,131
11,077
0 3,000 6,000 9,000 12,000
1,895
689
-2,731
-162
-1,849
464
-1,694
-3,000 -2,000 -1,000 0 1,000 2,000 3,000
New Mexico22- to 29-Year-Olds 30- to 64-Year-Olds
Less than High School
High School
Some College
Associate
Bachelor’s
Graduate/Professional
Total
Net Migration by Degree Level and Age GroupNet Migration by Degree Level and Age Group
Source: U.S. Census Bureau, 2000 Census; 5% Public Use Microdata Sample (PUMS) Files

Federal R&D Expenditures Per Capita in Colleges and Universities, 2002Federal R&D Expenditures Per Capita in Colleges and Universities, 2002
Source: National Science Foundation; U.S. Census Bureau
$0
$50
$100
$150
$200
$250
$300
Mary
land
Massa
chuse
ttAla
ska
Pennsy
lvania
Connecticu
tN
ew
Colo
rado
Rhode Isla
nd
New
Mexico
Uta
hVerm
ont
Haw
aii
New
York
Wash
ingto
nIo
wa
North
Ala
bam
aW
isconsin
Califo
rnia
Misso
uri
Ore
gon
Unite
d S
tate
sN
orth
Dakota
Monta
na
Mich
igan
Illinois
Texas
Dela
ware
Georg
iaM
ississippi
Min
neso
taO
hio
Virg
inia
Tennesse
eArizo
na
Nebra
ska
Kansa
sIn
dia
na
Louisia
na
South
Wyom
ing
Nevada
Kentu
cky
New
Jerse
yFlo
rida
West V
irgin
iaO
kla
hom
aId
aho
South
Dakota
Ark
ansa
sM
ain
e

Research & Development Growth per Capita over TimeResearch & Development Growth per Capita over Time
Growth in Total R&D per CapitaFY 1987 to 2000
$-
$500
$1,000
$1,500
$2,000
$2,500
MA MD NJ U.S. PA VA NY NC GA
1987 1995 2000
56%
61%78%
68%68%
66% 56%81%
48%
pct change for the period

1. Net price of attendance (by income quartiles) – data not available
2. Public support and net tuition (per student and other outcomes)
3. Completions by credit hours, average to degree (disaggregated, including transfers and adult students)
4. Returns on public investments
Financial Indicators (Group III)Financial Indicators (Group III)

U.S. Public Postsecondary Enrollment, Educational Appropriations per FTE, and Total Educational Revenues per FTE, Fiscal 1980-2005
United States Public Postsecondary Enrollment, Educational Appropriations per FTE, and Total Educational Revenues per FTE, Fiscal 1980-2005
$6,934$7,117
$6,309$5,825
$7,976
$9,196
$10,079
$9,246
6.5
7.0
7.5
8.0
8.5
9.0
9.5
10.0
10.5
1980
1981
1982
1983
1984
1985
1986
1987
1988
1989
1990
1991
1992
1993
1994
1995
1996
1997
1998
1999
2000
2001
2002
2003
2004
2005
Pu
blic
FT
E E
nro
llmen
t (i
n m
illio
ns)
$3,000
$4,000
$5,000
$6,000
$7,000
$8,000
$9,000
$10,000
$11,000
Do
llars
per
FT
E
FTE EdApprops/FTE TotEdRevs/FTE
National Recession
Constant 2005 dollars adjusted for inflation with SHEEO Higher Education Cost Adjustment (HECA).
Public Higher Education Enrollment and Revenue HistoryPublic Higher Education Enrollment and Revenue History

$7,027
$7,418
$9,862
$7,620
$8,380
$9,021
$10,810
$8,768
40,000
45,000
50,000
55,000
60,000
65,000
70,000
75,000
80,000
1980
1981
1982
1983
1984
1985
1986
1987
1988
1989
1990
1991
1992
1993
1994
1995
1996
1997
1998
1999
2000
2001
2002
2003
2004
2005
Pu
blic
FT
E E
nro
llmen
t
$0
$1,000
$2,000
$3,000
$4,000
$5,000
$6,000
$7,000
$8,000
$9,000
$10,000
$11,000
Do
llars
per
FT
E
FTE EdApprops/FTE TotEdRevs/FTE
Dollars adjusted for inflation, state cost of living, and relative cost of the state's public postsecondary system enrollment mix.
New Mexico Public Postsecondary Enrollment, Educational Appropriations per FTE, and Total Educational Revenues per FTE, Fiscal 1980-2005
Constant 2005 HECA dollars adjusted for state cost of living and the relative cost of the state’s public postsecondary system enrollment mix.
Public Higher Education Enrollment and Revenue HistoryPublic Higher Education Enrollment and Revenue History

$5,955
$5,215
$5,757
$4,413
$7,693$7,981
$8,552
$7,897
25,000
27,000
29,000
31,000
33,000
35,000
37,000
1980
1981
1982
1983
1984
1985
1986
1987
1988
1989
1990
1991
1992
1993
1994
1995
1996
1997
1998
1999
2000
2001
2002
2003
2004
2005
Pu
blic
FT
E E
nro
llmen
t
$0
$1,000
$2,000
$3,000
$4,000
$5,000
$6,000
$7,000
$8,000
$9,000
Do
llars
per
FT
E
FTE EdApprops/FTE TotEdRevs/FTE
Constant 2005 HECA dollars adjusted for state cost of living and the relative cost of the state's public postsecondary system enrollment mix.
North Dakota Public Postsecondary Enrollment, Educational Appropriations per FTE, and Total Educational Revenues per FTE, Fiscal 1980-2005
Public Higher Education Enrollment and Revenue HistoryPublic Higher Education Enrollment and Revenue History

Total Educational Revenues per FTE, by State: Percent Change and Current Standing Relative to U.S. Average
AL
AK
AZ
AR
CA
CO
CT
DE
FL
GA
HI
ID
IL
IN
IA
KS
KY
LA
ME
MD
MA
MIMN
MS MO
MT
NE
NV
NH
NJ
NM NY
NC
ND
OH
OK
OR PA
RI
SC
SD
TN
TX
UT
VT
VA
WA
WV
WI
WY
US
-30%
-20%
-10%
0%
10%
20%
30%
40%
0.6 0.7 0.8 0.9 1.0 1.1 1.2 1.3 1.4 1.5 1.6
Total Educational Revenues per FTE, Indexed to the U.S. Average in FY 2005
Per
cent
Cha
nge,
Tot
al E
duca
tiona
l Rev
enue
s pe
r F
TE
, F
Y 1
991-
2005
Notes: 1) Figures are adjusted for inflation, public system enrollment mix, and state cost of living.2) Funding and FTE data are for public non-medical students only.
% CHANGE: above avgCURRENT: below avg
% CHANGE: below avgCURRENT: below avg
% CHANGE: below avgCURRENT: above avg
% CHANGE: above avgCURRENT: above avg
States in RelationshipStates in Relationship
Source: SHEEO SHEF

Net Tuition Revenue per FTE, by State:Percent Change and Current Standing Relative to the U.S. Average
US
WY
WI
WV
WA
VA
VTUT
TX
TN
SD
SC
RI
PA
OR
OK
OH
ND
NC
NYNM
NJ
NHNV
NE
MT
MO
MS
MN
MI
MA
MD
ME
LA
KY
KS
IAIN
ILID
HI
GA
FL
DE
CT
CO
CA
AR
AZ
AK
AL
-40%
-30%
-20%
-10%
0%
10%
20%
30%
40%
50%
60%
70%
80%
90%
100%
110%
120%
130%
140%
0.3 0.4 0.5 0.6 0.7 0.8 0.9 1.0 1.1 1.2 1.3 1.4 1.5 1.6 1.7 1.8 1.9 2.0 2.1 2.2 2.3 2.4
Indexed to the U.S. Average in FY 2005
Per
cen
t C
han
ge,
FY
199
1 -
2005
% CHANGE: above avgCURRENT: below avg
% CHANGE: below avgCURRENT: below avg
% CHANGE: below avgCURRENT: above avg
% CHANGE: above avgCURRENT: above avg
Notes: 1) Figures are adjusted for inflation, public system enrollment mix, and state cost of living.2) Funding and FTE data are for public non-medical students only.
Source: SHEEO SHEF
States in RelationshipStates in Relationship

Source: National Association of State Student Grant & Aid Programs
Six Largest States
$0
$500
$1,506
$-
$200
$400
$600
$800
$1,000
$1,200
$1,400
$1,600
Georg
ia
So
uth
Ca
rolin
a
New
York
New
Je
rsey
Ke
ntu
cky
Pe
nnsy
lvan
ia
Illin
ois
We
st V
irg
inia
India
na
Ve
rmo
nt
Lo
uis
ian
a
Nevad
a
Flo
rida
Wa
shin
gto
n
Min
neso
ta
U.S
.
Nort
h C
aro
lina
Ohio
Calif
orn
ia
Mic
hig
an
Vir
gin
ia
Dela
ware
New
Me
xic
o
Wis
consi
n
Conn
ect
icut
Iow
a
Colo
rado
Ark
ansas
Main
e
Mass
achuse
tts
Mary
land
Te
nne
ssee
Rhod
e I
sla
nd
Te
xas
Okl
ahom
a
Mis
sis
sip
pi
Mis
souri
Ore
go
n
Ka
nsa
s
Nebra
ska
Idah
o
New
Ham
pshire
Mon
tan
a
Nort
h D
ako
ta
Uta
h
Ala
bam
a
Ari
zona
Haw
aii
Wyo
min
g
Ala
ska
So
uth
Da
kota
Non-need Grant
Need Grant
State Undergraduate Grant Aid per Undergraduate Student by State, 2003-04
State Student Aid per FTEState Student Aid per FTE

Taxable Resources and Effective Tax Rate Indexed to the U.S. Average, by State, 2003
ALAK
AZ
ARCA
CO
CT
DE
FLGA
HI
IDILIN
IAKS
KYLA
ME
MDMA
MIMNMS
MO
MT
NE
NVNH
NJNM
NY
NC
ND
OH
OK
OR
PA
RI
SC
SD
TNTX
UT
VT
VA
WA
WV WI
WYUS
0.5
0.6
0.7
0.8
0.9
1.0
1.1
1.2
1.3
1.4
1.5
0.6 0.7 0.8 0.9 1.0 1.1 1.2 1.3 1.4 1.5 1.6 1.7
Total Taxable Resources Index (US Avg = 1.0)
Eff
ecti
ve T
ax R
ate
Ind
ex (
US
Avg
= 1
.0)
STATE WEALTH: below avgEFFECTIVE TAX RATE: above avg
STATE WEALTH: above avgEFFECTIVE TAX RATE: above avg
STATE WEALTH: below avgEFFECTIVE TAX RATE: below avg
STATE WEALTH: above avgEFFECTIVE TAX RATE: below avg
Red states w ere w ithin +/- 5% of the national average actual tax revenues (ATR) per capita in 2003. States above and to the right exceeded the average ATR per capita by 5% or more; states below and to the left trailed the average ATR per capita by 5% or more.
Taxable Resources and Effective Tax RateTaxable Resources and Effective Tax Rate
Source: SHEEO SHEF

Bachelor’s Degrees Awarded per 100 FTE Undergraduates, and Total Funding per FTE1, Public Research Institutions, 2002-03
Source: Patrick Kelly and Dennis Jones. (2006.) A New Look at the Institutional Component of Higher Education Finance: A Guide for Evaluating Performance Relative to Financial Resources. Boulder, CO: NCHEMS.
Notes: 1. Total Funding per FTE = (state and local appropriations + net tuition and fees) per full-time equivalent (FTE) student.
Performance Relative to Resources: Degree-to-Enrollment RatioPerformance Relative to Resources: Degree-to-Enrollment Ratio
AL
AK
AZ
AR
CA
CO
CT
DEFL
GAHI
ID
IL
IN
IA
KS
KY
LAME
MD
MAMI
MN
MS
MO
MTNE
NV
NHNJ
NM
NYNC
ND
OH OK
ORPA
RI
SC
SD
TN
TX
UT
VT
VA
WA
WV
WI
WY
US
5
10
15
20
25
30
9000 11000 13000 15000 17000 19000 21000 23000

Contact informationContact information
Paul Lingenfelter
paul@ sheeo.org
Charlie Lenth
Contact InformationContact Information