Access and Usage of Financial Services by MSMEs in Regions of Armenia
74
Access and Usage of Financial Services by MSMEs in Regions of Armenia Baseline Assessment Results 14 November, 2014 Economic Development and Research Center (EDRC)
-
Upload
armeniafed -
Category
Economy & Finance
-
view
133 -
download
1
Transcript of Access and Usage of Financial Services by MSMEs in Regions of Armenia

Access and Usage of Financial Services by
MSMEs in Regions of Armenia
Baseline Assessment Results
14 November, 2014
Economic Development and Research Center (EDRC)

2
AGENDA
11
22
33 Main Results
The Methodology
General overview of financial sector and Micro-Small and Medium Entrepreneurship in Armenia
• Usage of Financial Services and Business Financing
• Needs and Preferences
• Perceptions (Satisfaction, Confidence, Awareness, Literacy)
• Main Sources of Financial Information
• Financial Access

3
THE METHODOLOGY

4
OBJECTIVE AND SCOPE OF THE STUDY
The scope: Assessment of the awareness, literacy, confidence, needs, usage and access of
financial services
The target group: MSMEs operating in Marzes of Armenia with total personnel less than
100 employees.
The objective: to identify the pre-project (baseline) situation, periodically monitor the
progress and provide final evaluation.
Involves 3 stages:
Baseline Assessment (2013);
Mid-term Assessment and Evaluation (2015);
Final Evaluation (2016).

5
METHODOLOGY
Obtain comparable data - time series for 2013-2016,
Include both registered and non-registered enterprises,
Include all Marzes and sectors,
Reveal gender versus owner/director, and other relevant issues / features,
Country level representativeness (at 95% CL with maximum error margin of 5.5%).
Major Requirements

6
METHODOLOGY
Desk reviews;
Participatory rapid appraisals (PRAs), in particular, Key informant interviews (KII);
Enterprises sample survey:
Sample survey of MSMEs (registered enterprises)
Sample survey of Farms (non-registered enterprises)
Research methods

7
METHODOLOGY
Two-stage stratified random sampling;
Separate study of MSMEs and Farms;
Regional coverage: all Marzes, 105 settlements (55 and 50 villages);
Actual sample size: 724 enterprises;
Non-response rate of 50%.
Sample design

8
METHODOLOGY
Structure of the Questionnaire:
Section 1. Business description/general information
Section 2. Bank accounts and transactions
Section 3. Business financing
Section 4. Sources of financial information
200 primary variables for each enterprise
Mainly quantitative, as well as qualitative data
Research instruments

9
Financial sector and MSMEs in Armenia: general overview

10
GENERAL OVERVIEW OF FINANCIAL SECTOR
The financial sector is one of the fast growing sectors with high-income yields.
Value added in the financial sector is equivalent to 4.5% of the GDP.
Labor productivity and salary levels are the highest in this sector.
The banking system is the largest player in the Armenian financial sector. As of the beginning 2013, 89.7% of financial sector assets belonged to the banking.
Concentration indicator of the Armenian banking sector is relatively high.
The level of financial intermediation and depth is behind Eastern European countries.
During 2008-2012, volumes of both loans extended and deposits attracted by commercial banks increased by about 2.5 times.
The number of plastic cards also grows along with number and volumes of non-cash payments.
The non-bank financial sector continues to remain underdeveloped. The securities market is very small.

11
GENERAL OVERVIEW OF FINANCIAL SECTOR
Indicators describing the Armenian financial system
Beginning 2004
Beginning 2008
Beginning 2013
Number of commercial banks 20 22 21 Sub-branches of commercial banks 232 347 474Credit organizations 6 21 32 Sub-branches credit organizations 1 40 102Investment companies - 15 9Insurance companies - 9 9Pawn shops - 63 103Accountable issuers - 16 14Foreign exchange trade offices 284 250 226Money transfer operators 0 7 6
Source: CBA and EDRC calculations

12
GENERAL OVERVIEW OF FINANCIAL SECTOR
Indicators describing the payment system
2008 2012 2012/2008Number of ATMs 538 1170 2.17Number of POS-terminals 2,280 6,674 2.93Number of cards in circulation 454,357 1,322,949 2.91Number of card transactions in the territory of Armenia 6,586,134 18,867,715 2.86Volumes of card transactions in the territory of Armenia, AMD mln
326,371 999,771 3.06
Number of bank transfers through non-cash payment systems
5,043,571 14,350,895 2.85
Volumes of bank transfers through non-cash payment systems, AMD mln
15,135,666 29,836,587 1.97
Source: CBA and EDRC calculations

13
Source: State Revenue Committee of RA and EDRC calculations
THE ENTREPRENEURSHIP IN ARMENIANumber of enterprises operating in Armenia

14
ENTREPRENEURSHIP IN ARMENIASize of enterprises based on number of employees
Up to 10 11-100More than
100Total
Total 92.3 6.9 0.8 100
Yerevan 91.1 7.8 1.1 100
Marz 93.7 5.9 0.4 100
Source: State Revenue Committee of RA and EDRC calculations

15
MICRO-SMALL AND MEDIUM ENTREPRENEURSHIP IN ARMENIAMSMEs in Marzes per legal status
Source: State Revenue Committee of RA and EDRC calculations

16
MICRO-SMALL AND MEDIUM ENTREPRENEURSHIP IN ARMENIA
Source: State Revenue Committee of RA and EDRC calculations
Distribution of MSMEs per Marzes

17
MICRO-SMALL AND MEDIUM ENTREPRENEURSHIP IN ARMENIA
Source: State Revenue Committee of RA and EDRC calculations
Distribution of MSMEs per sectors

18
OVERVIEW OF MSMEs and AGRICULTURAL FARMS
SP LP Total
Manufacturing 13.5 32.9 17.9
Food industry 8.4 20.5 11.1
Other productions 5.2 12.3 6.8
Trade 73.7 46.6 67.6
Other Services 12.7 20.5 14.5
Total 100.0 100.0 100.0
Female Male Total
Manufacturing 25.9 74.1 100.0
Food industry 36.1 63.9 100.0
Other productions 9.1 90.9 100.0
Trade 36.2 63.8 100.0
Other Services 42.9 57.1 100.0
Total 38.9 61.1 100.0
Source: MSMEs Baseline Survey 2013, EDRC
Sectors of MSME activities ,%

19
OVERVIEW OF MSMEs and AGRICULTURAL FARMS
Source: Agricultural Farms Baseline Survey 2013, EDRC
Breakdown of Farms per sectors of activities and agricultural production, %

20
USAGE OF FINANCIAL SERVICES

21
USAGE OF FINANCIAL SERVICESNumber of bank accounts. MSMEs
SP LP Total
Availability of bank accounts in AMD 100.0 100.0 100.0
Have one account 71.7 61.6 69.4
Have two or more accounts 4.8 38.4 12.3
Do not have accounts 23.5 0.0 18.2
Availability of bank accounts in foreign currencies 100.0 100.0 100.0
Have one accounts 10.0 24.7 13.3
Do not have accounts 90.0 75.3 86.7
Source: MSMEs and Agricultural Farms Baseline Survey 2013, EDRC

22
USAGE OF FINANCIAL SERVICESNumber of bank accounts. Agricultural farms
As % in total agricultural farmsAs share in agricultural farms
with bank accounts
Have accounts 38.5 100.0
Have 1 account 26.3 68.2
Have 2 accounts 8.7 22.7
Have 3 and more accounts 3.5 9.1
No accounts 61.5 -
Total 100.0 -
Source: MSMEs and Agricultural Farms Baseline Survey 2013, EDRC

23
USAGE OF FINANCIAL SERVICESNumbers of transactions. MSMEs
SP LP Total
Do not use 4.7 0.0 3.4
1 service 17.1 6.8 14.8
2 services 28.7 28.8 28.7
3 services 19.1 11.0 17.3
4 services 8.0 20.5 10.8
5 and more services 0.0 32.9 7.4
Total 100 100 100
Source: MSMEs and Agricultural Farms Baseline Survey 2013, EDRC

24
USAGE OF FINANCIAL SERVICESNumbers of transactions. Agricultural farms
Source: MSMEs and Agricultural Farms Baseline Survey 2013, EDRC
79 percent of Agricultural farms used some type of bank services:

25
USAGE OF FINANCIAL SERVICESBank transactions. MSMEs
Source: MSMEs Baseline Survey 2013, EDRC
SP LP Total
Tax payments 39.4 82.2 49.1
Loan service 43.4 50.7 45.1
Encashment 31.9 60.3 38.3
Purchase of goods and services 19.1 58.9 28.1
Utility and communication services 21.5 45.2 26.9
Sale of goods and services 8.4 49.3 17.6
Salary payments 0.0 13.7 3.1

26
USAGE OF FINANCIAL SERVICESBank transactions. Agricultural farms
Agricultural farms that use bank
transactionsAgricultural farms that have bank
accounts
Share in total agricultural farms
Share in the respective group
Share in total agricultural farms
Share in the respective group
Loan service 45.8 57.5 23.0 59.7
Money transfers from abroad 30.5 38.4 10.5 27.3
Salaries, pensions, benefits 20.5 25.8 18.5 48.1
Utility/communication service payments 18.8 23.6 9.5 24.7
Taxes, stamp duties, mandatory payments 8.3 10.4 4.8 12.3
Other payments related with agricultural activity
4.5 5.72.0 5.2
Receipt for sales of their harvest 4.0 5.0 2.5 6.5
Total (using at least one service) 79.5 100 38.5 100Source: MSMEs Baseline Survey 2013, EDRC

27
USAGE OF FINANCIAL SERVICES
MSMEsAgricultural
farms
No necessity, no need 66.0 73.3
Did not have occasion, not used to 46.0 40.3
Our partners do not agree 10.3 0.3
Processes are to complex 9.8 2.3
Tariffs and commission fees are high 8.9 5.0
Do not trust banks, not safe 6.2 6.8
Source: MSMEs and Agricultural Farms Baseline Survey 2013, EDRC
Main reasons for not using bank transfers, %
28
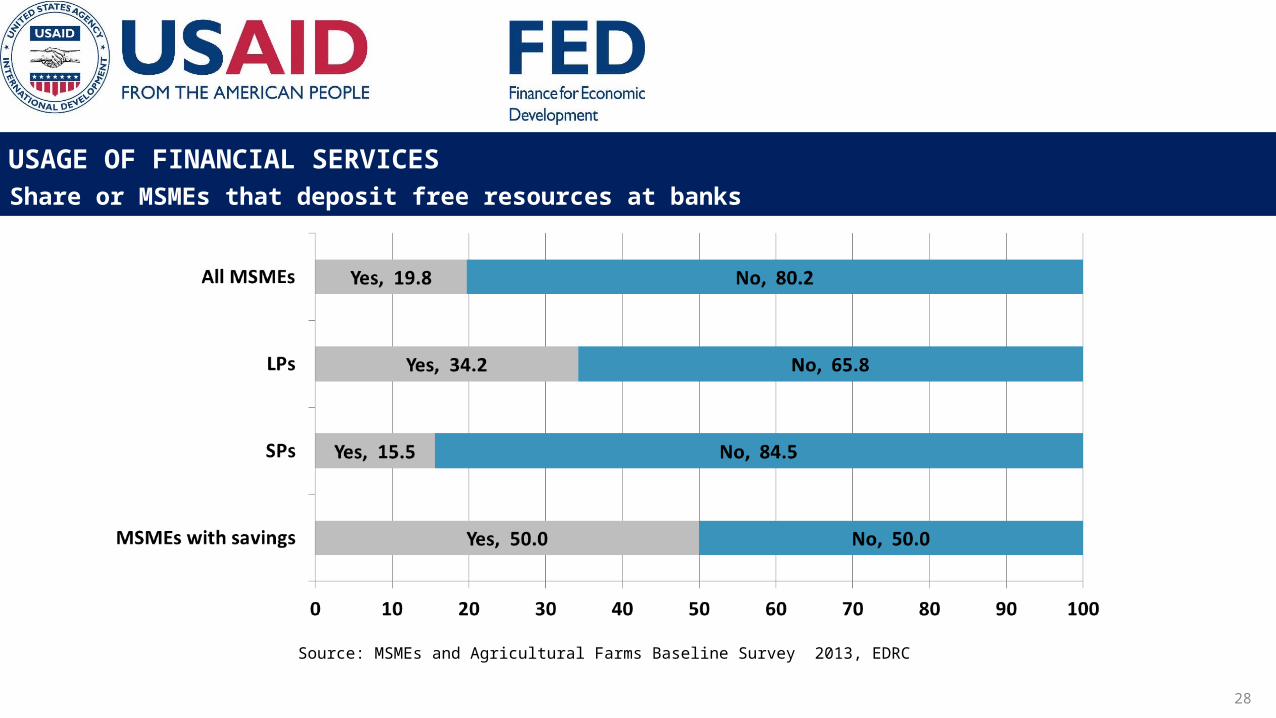
USAGE OF FINANCIAL SERVICESShare or MSMEs that deposit free resources at banks
Source: MSMEs and Agricultural Farms Baseline Survey 2013, EDRC

29
USAGE OF FINANCIAL SERVICESShare or MSMEs that deposit free resources at banks
Source: MSMEs and Agricultural Farms Baseline Survey 2013, EDRC
MSMEsAgricultural
farms
Do not trust banks, not safe 26.9 26.0
No necessity, no need 58.1 14.8
Did not have occasion, not used to 27.7 3.8
Proposed interest rates (income) is low 21.5 1.3
Never had free resources 75.4 65.5
% in total for each group

30
USAGE OF FINANCIAL SERVICESMain sources for business financing and investment
Source: MSMEs and Agricultural Farms Baseline Survey 2013, EDRC
MSMEs

31
USAGE OF FINANCIAL SERVICESMSMEs with debt liabilities
Source: MSMEs Baseline Survey 2013, EDRC

32
USAGE OF FINANCIAL SERVICES
Source: Agricultural Farms Baseline Survey 2013, EDRC
Agricultural farms with debt liabilities
38 percent of all agricultural farms have some type of debt liability:

33
USAGE OF FINANCIAL SERVICES
MSMEs Agricultural Farms
Interest rate For bank loansFor credit
organizations
Interest rate
For bank loans
For credit organization
s Less than 10% 5 -
10-12% 31.5 11.1 10-12% 21.8 5.113-14% 13.3 11.1 13-14% 23.8 7.715-17% 21.0 11.1 15-17% 13.9 2.618-20% 21.0 22.2 18-20% 21.8 20.521-24% 13.3 40.7 21-25% 13.9 64.1
Above 25% - 3.7 Average annual
interest rate 15.3% 19.0%
15.6% 21.3%
Average size of loans 4,4 mln 1.05 mlnSource: MSMEs and Agricultural Farms Baseline Survey 2013, EDRC
Distribution of loans per interest rates

34
USAGE OF FINANCIAL SERVICESBreakdown of loans per type of collateral. MSMEs
Source: MSMEs and Agricultural Farms Baseline Survey 2013, EDRC
29 percent of MSMEs borrowed from banks and credit organizations without collateral.

35
USAGE OF FINANCIAL SERVICESBreakdown of loans per type of collateral. Agricultural farms
Source: MSMEs and Agricultural Farms Baseline Survey 2013, EDRC
16.5 percent of Agricultural farms borrowed from banks and credit organizations without collateral.

36
USAGE OF FINANCIAL SERVICESInvestment directions broken down per MSMEs that borrowed from banks or did not
Source: MSMEs and Agricultural Farms Baseline Survey 2013, EDRC
Yes No Total
Real estate acquisition 9.6 9.5 9.6
Capital construction and renovation 44.1 26.5 36.1
Investments in mobile property 25.4 21.8 23.8Purchase, renovation and modernization of devices and equipment
40.1 35.4 38.0
Expansion of current activities 84.7 86.4 85.5Testing and introduction of new products, activities or technologies
7.9 9.5 8.6
Employee Trainings 0.0 2.7 1.2
Repayment of debt 24.9 15.0 20.4
Real estate acquisition 100 100 100

37
USAGE OF FINANCIAL SERVICESUses of loans of Agricultural farms
Source: MSMEs and Agricultural Farms Baseline Survey 2013, EDRC

38
NEEDS AND PREFERENCES

39
NEEDS AND PREFERENCESEstimates in case of additional financing
Source: MSMEs and Agricultural Farms Baseline Survey 2013, EDRC

40
NEEDS AND PREFERENCESBehavior in case of need for finance or investments
MSMEs Agricultural farms
Source: MSMEs and Agricultural Farms Baseline Survey 2013, EDRC

41
NEEDS AND PREFERENCESNeed of additional investments
Source: MSMEs and Agricultural Farms Baseline Survey 2013, EDRC
Agricultural farms

42
NEEDS AND PREFERENCESDirections of planned investments
Source: MSMEs and Agricultural Farms Baseline Survey 2013, EDRC
MSMEs Agricultural farms

43
NEEDS AND PREFERENCESWillingness to borrow on market terms
Source: MSMEs and Agricultural Farms Baseline Survey 2013, EDRC
Agricultural farmsMSMEs

44
NEEDS AND PREFERENCESWillingness to borrow on market terms for MSMEs and Agricultural farms that plan or need investments
Source: MSMEs and Agricultural Farms Baseline Survey 2013, EDRC

45
NEEDS AND PREFERENCES
Reasons for refusing the loans at current market terms. MSMEs
Source: MSMEs and Agricultural Farms Baseline Survey 2013, EDRC

46
NEEDS AND PREFERENCES
Reasons for refusing the loans at current market terms. Agricultural farms
Source: MSMEs and Agricultural Farms Baseline Survey 2013, EDRC
47
PERCEPTION OF FINANCIAL INSTITUTIONS AND SERVICES
SATISFACTION, CONFIDENCE, AWARENESS, LITERACY

48
SATISFACTIONSatisfaction of MSMEs from banks servicing their accounts
Source: MSMEs and Agricultural Farms Baseline Survey 2013, EDRC

49
SATISFACTIONReasons for dissatisfaction from bank account servicing or current transactions
Source: MSMEs and Agricultural Farms Baseline Survey 2013, EDRC

50
SATISFACTIONSatisfaction from loans or other debt liabilities
Source: MSMEs and Agricultural Farms Baseline Survey 2013, EDRC

51
SATISFACTIONReasons for dissatisfaction or complaints from loans or other debt liabilities among MSMEs and agricultural farms
Source: MSMEs and Agricultural Farms Baseline Survey 2013, EDRC

52
CONFIDENCEDistrust in bank deposits and credits
Source: MSMEs and Agricultural Farms Baseline Survey 2013, EDRC

53
CONFIDENCEDistrust in borrowing from financial institutions
Source: MSMEs and Agricultural Farms Baseline Survey 2013, EDRC

54
AWARENESSAwareness on bank deposit terms and conditions
Source: MSMEs and Agricultural Farms Baseline Survey 2013, EDRC

55
AWARENESSAwareness on presented financing options
Source: MSMEs and Agricultural Farms Baseline Survey 2013, EDRC
56
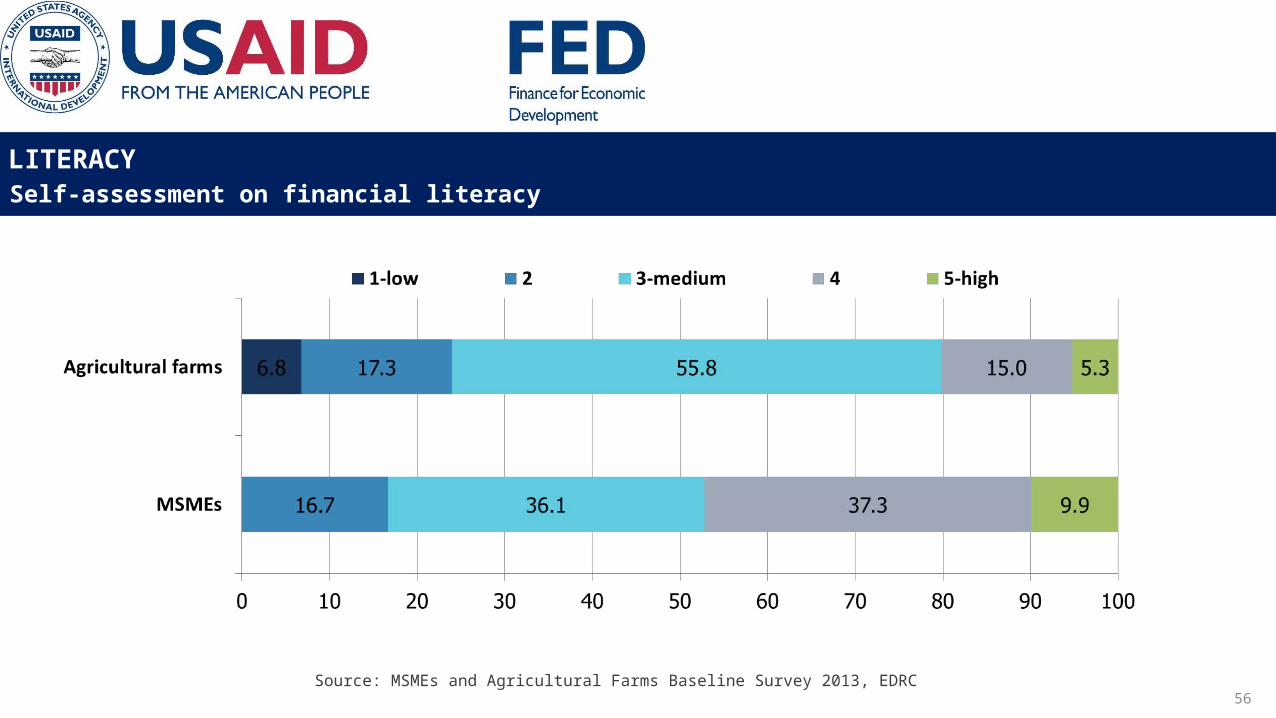
LITERACYSelf-assessment on financial literacy
Source: MSMEs and Agricultural Farms Baseline Survey 2013, EDRC

57
LITERACYWillingness to improve financial literacy
Source: MSMEs and Agricultural Farms Baseline Survey 2013, EDRC

58
MAIN SOURCES OF FINANCIAL INFORMATION

59
MAIN SOURCES OF FINANCIAL INFORMATION Satisfaction with available information
Source: MSMEs and Agricultural Farms Baseline Survey 2013, EDRC

60
MAIN SOURCES OF FINANCIAL INFORMATION Willingness to receive financial information regularly
Source: MSMEs and Agricultural Farms Baseline Survey 2013, EDRC

61
MAIN SOURCES OF FINANCIAL INFORMATION Preferred sources to receive financial information
MSMEs* Agricultural farms*
TV 59.6 62.1
Internet 56.3 28.0
Radio or press 15.8 3.1
SMS 49.2 27.3
Printed materials/booklets 17.5 26.1
*- of those who are willing to regularly receive information
Source: MSMEs and Agricultural Farms Baseline Survey 2013, EDRC

62
MAIN SOURCES OF FINANCIAL INFORMATION Preferred information types
MSMEs Agricultural farms
On loans 97.3 94.4
On deposits 39.9 18.6
Account service and bank transfers 51.4 13.7
On securities 13.1 6.2
On other financial tools and transactions 6.0 0.6
*- of those who are willing to regularly receive information
Source: MSMEs and Agricultural Farms Baseline Survey 2013, EDRC

63
ASSESSMENT OF FINANCIAL ACCESS

64
ASSESSMENT OF FINANCIAL ACCESSFinancial inclusion
“Overall” financial inclusion
Source: MSMEs and Agricultural Farms Baseline Survey 2013, EDRC

65
ASSESSMENT OF FINANCIAL ACCESSFinancial inclusion
“Comparatively deep” financial inclusion
Source: MSMEs and Agricultural Farms Baseline Survey 2013, EDRC
66
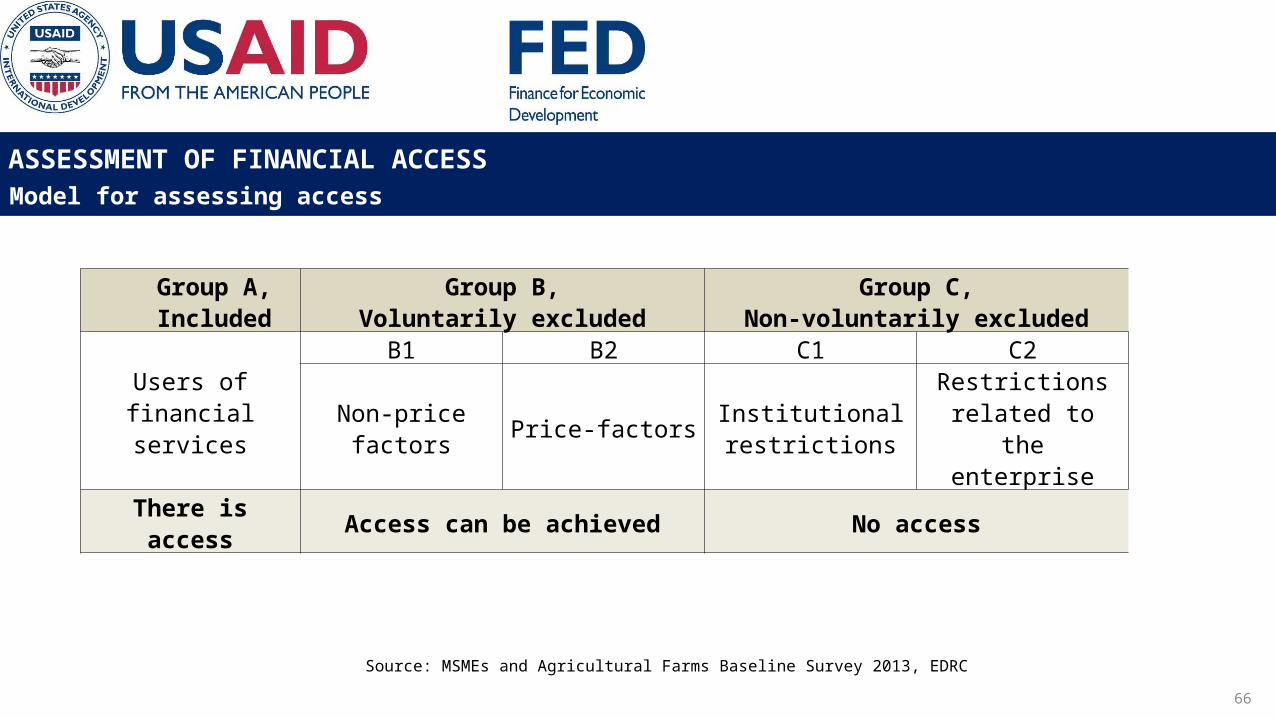
ASSESSMENT OF FINANCIAL ACCESSModel for assessing access
Source: MSMEs and Agricultural Farms Baseline Survey 2013, EDRC
Group A,Included
Group B,Voluntarily excluded
Group C,Non-voluntarily excluded
Users of financial services
B1 B2 C1 C2
Non-price factors Price-factorsInstitutional restrictions
Restrictions related to the enterprise
There is access Access can be achieved No access
67
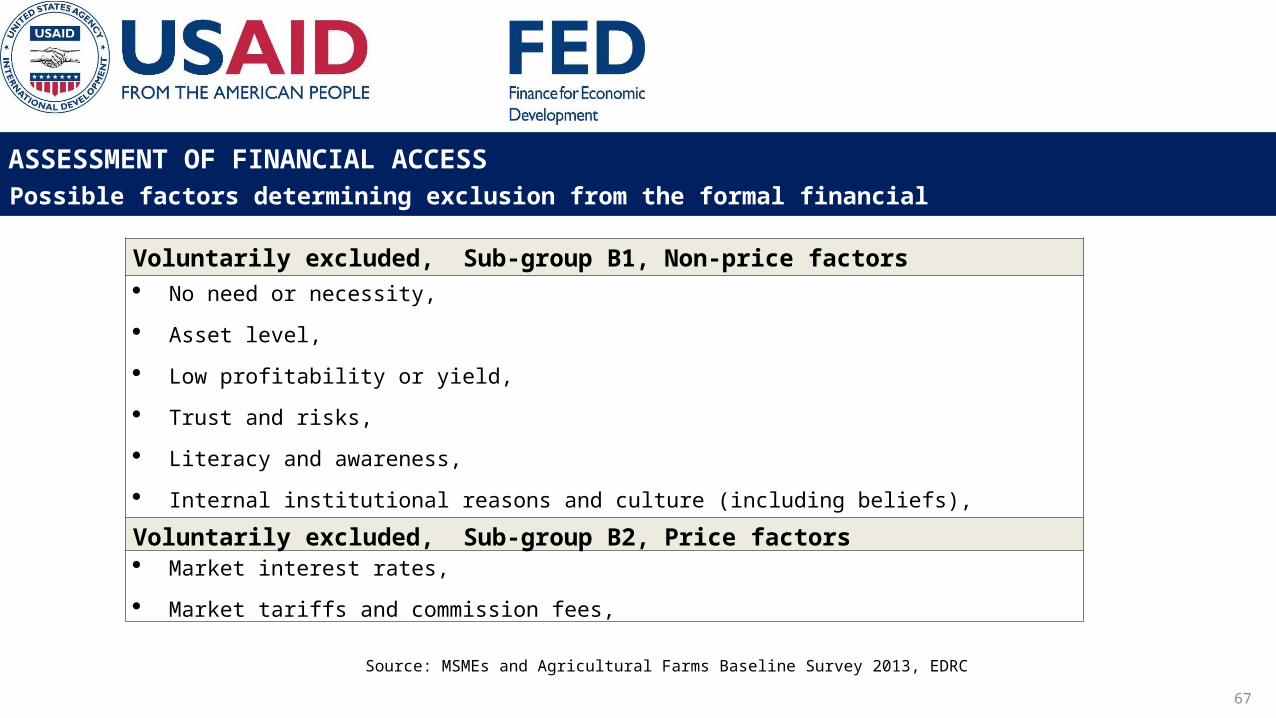
ASSESSMENT OF FINANCIAL ACCESSPossible factors determining exclusion from the formal financial system
Source: MSMEs and Agricultural Farms Baseline Survey 2013, EDRC
Voluntarily excluded, Sub-group B1, Non-price factors No need or necessity,
Asset level,
Low profitability or yield,
Trust and risks,
Literacy and awareness,
Internal institutional reasons and culture (including beliefs),
Voluntarily excluded, Sub-group B2, Price factors Market interest rates,
Market tariffs and commission fees,

68
ASSESSMENT OF FINANCIAL ACCESSPossible factors determining exclusion from the formal financial system
Source: MSMEs and Agricultural Farms Baseline Survey 2013, EDRC
Non-voluntarily excluded, Sub-group C1, Institutional obstacles or obstacles related to the product Physical, geographical restrictions,
Activity sector,
Restrictions related to the availability or adequacy of services,
Tariff restrictions (non-market conditions),
Non-voluntarily excluded, Sub-group C2, Restrictions related to enterprise characteristics Assets, income, turnover, number of employees, expertise etc.

69
ASSESSMENT OF FINANCIAL ACCESSFinancial inclusion - bank transactions
Source: MSMEs and Agricultural Farms Baseline Survey 2013, EDRC

70
ASSESSMENT OF FINANCIAL ACCESSCategorization of non-inclusion reasons in savings accounts and deposit transactions
MSMEs
Agricultural farms
Voluntary non-inclusion Price factors
Proposed interest rate (income) is low 21.5 1.3Tariffs and commission fees are high 2.7 0.5
Non-price factorsNo free resources/savings 75.4 69.7Non necessity or need 58.1 15.7There was no occasion or not used to 27.7 4Do not trust bank, not safe 26.9 27.7Not aware 1.9 9.6Terms and conditions are not acceptable 6.9 1.3Partners or other HH members do not agree 0.8 3.2
Non-voluntary exclusionBank is too far, physically inconvenient 1.9 0.5Processes are too complex 2.3 0.3

71
ASSESSMENT OF FINANCIAL ACCESSEstimates of ease of borrowing from banks and credit organizations

72
ASSESSMENT OF FINANCIAL ACCESSInclusion of MSMEs and agricultural farms per loans

73
ASSESSMENT OF FINANCIAL ACCESSCategorization of main factors determining non-inclusion
MSMEs
Agricultural farms
Voluntary non-inclusionPrice factorsInterest rates, service fees are high 49.6 13.6
Non-price factorsRisky, do not trust 38.4 53.7Income is unstable 11.2 50No necessity, no need 8.8 3.3Process is too complex, difficult to collect all documents 8 0.5Have negative prior experience 0.8 4.2Beliefs - 1.9
Non-voluntary exclusionRequired documents 50 9.1Collateral requirement 35 25Loan terms (duration) 45 18.2Absence of financing or small volumes 7.5 25No guarantor - 4.5Age limitations - 2.3

74
THANK YOU
WWW.EDRC.AM
WWW.FACEBOOK.COM/EDRC.ARMENIA
WWW.ARMENIAFED.COM