Acceptance solid state NMR test procedure rev04€¦ · · 2016-03-25Acceptance Solid State NMR...
42
Acceptance Solid State NMR Test Procedure Final test / Applications NMR _______________________________________________________________________________ Index: 04 Number: B92999 Page: 1 (42) Acceptance Solid State NMR Test Procedure for Avance NMR Systems Manual P/N B92999 Acceptance Solid State NMR Test Procedures for AVANCE systems
Transcript of Acceptance solid state NMR test procedure rev04€¦ · · 2016-03-25Acceptance Solid State NMR...
Acceptance Solid State NMR Test Procedure Final test / Applications NMR
_______________________________________________________________________________ Index: 04 Number: B92999 Page: 1 (42)
Acceptance Solid State NMR Test Procedure
for Avance NMR Systems
Manual P/N B92999
Acceptance Solid State NMR Test Procedures
for AVANCE systems
Acceptance Solid State NMR Test Procedure Final test / Applications NMR
_______________________________________________________________________________ Index: 04 Number: B92999 Page: 2 (42)
1. Purpose 2. Area of application 3. Referenced documents 4. NMR experiments for probe tests
4.1 Introduction 4.1.1 B0-Field Adjustment, Referencing 4.1.2 Sample Preparation 4.1.3 MAS Monitoring
4.2 Setting the magic angle with KBr 4.3 1H π/2 pulse Adamantane 4.4 Direct polarization 13C on Adamantane / resolution test 4.5 Cross polarization 1H - 13C on Adamantane 4.6 Sensitivity 13C Glycine 4.7 13C π/2 pulse determination (optional experiment) 4.8 Sensitivity 15N Glycine 4.9 15N π/2 pulse determination (optional experiment) 4.10 31P CPMAS experiment 4.11 31P π/2 pulse determination (optional experiment) 4.12 Double CP experiment 4.13 Double CP experiment tuning stability test 4.14 HFX experiments
4.14.1 HF experiment and FH experiment 4.14.2 FC CPMAS experiment 4.14.3 FC(H) CPMAS experiment
5. Setup 4Phase Modulator 6. Shimming a CP MAS probe
Revision Record: Index Date Text Initials 00 02/01/2001 Created JOS 06/11/2001 Revised HCL, JOS 03/27/2002 Edited ASF, JOS 01 04/28/2003 Revised JOS 09/03/2003 Revised JOS 02 02/24/2004 Revised JOS 03 12/22/2004 Revised JOS, BRC 04 11/11/2005 Extended with DCP and HFC experiments JOS

Acceptance Solid State NMR Test Procedure Final test / Applications NMR
_______________________________________________________________________________ Index: 04 Number: B92999 Page: 3 (42)
1. Purpose This manual describes the procedures for the NMR tests that are necessary to set up Solid State NMR MAS experiments in order to demonstrate the high performance of Bruker Avance Instruments. It includes basic specification tests such as 13C resolution (line width at half height) and sensitivity tests, as well as some advice on shimming MAS probes. More advanced experiments and their setup can be found in the help menu of XWIN-NMR (other topics - solids users’ manual) or using NMR-Guide.
All test procedures are subject to change without notice.
2. Area of application This manual is for all Bruker Service personnel engaged in final testing, service and installation of NMR instruments, as well as for customers. The manual is a complement to the Acceptance and Test Procedures for Avance NMR systems, ZUEP0102. The manual complements the solids part of the ATP program and can be used only for systems with the software Release XWIN-NMR 3.1 patch level 11 and higher with AQS electronics. Note: The CP pulse programs and related parameter sets do not work on systems with AQX/AQR electronics. Pulse programs for D*X systems are available in the software release under ‘<Xwin-nmrhome>/exp/stan/nmr/lists/pp.dsolids'. Appropriate adjustments to the parameter sets need to be done as well.
3. Referenced documents ZUEP0102 Acceptance test procedures for Avance spectrometers and documents referenced in ZUEP0102 H9321 Solids user manual Z31401 SB MAS Operation Manual B3072 SB Wideline Probe Manual Bxxx HR-MAS Standard Test Procedures

Acceptance Solid State NMR Test Procedure Final test / Applications NMR
_______________________________________________________________________________ Index: 04 Number: B92999 Page: 4 (42)
4. NMR experiments for probe tests
4.1 Introduction
4.1.1 B0-Field Adjustment, Referencing
Solid-state NMR probes have no 2H lock channel. As a result, referencing is done for each nucleus with standard samples. For a general spectrometer setup one basic referencing is needed and one convenient standard sample is used. The built in frequency list - following R.K. Harris IUPAC recommendations - guarantees appropriate cross-referencing.
The general spectrometer referencing is done using the most convenient sample and related nucleus. If, for example, one uses the 1H resonance of water or TMS if available, the liquid sample is centered in a MAS rotor as outlined below.
The parameter set ZGSOLIDS is loaded, using rpar ZGSOLIS all in the command line of XWIN-NMR. The nucleus 1H is selected either in the eda or in the edsp editor. Before starting, make sure that in eda the parameter locnuc is set to off, and that neither the lock nor the sweep buttons on the BSMS keypad are lit. If no keypad is available, open the BSMS display/lock window and check the state of field sweep and lock. Both must be off.
The 1H transmitter offset O1P is set to 4.7 ppm, temperature should be around room temperature, furthermore, a recycling delay d1 = 0.5 seconds, td = 4096 and sw = 20ppm is chosen. For excitation one uses a power level of pl1 = 10 dB and a pulse length p1 = 5 us. The interactive experiment is started by typing gs into the command line. In order to observe the signal, switch to the acquisition window by typing acqu. Dial the field (BSMS keyboard or BSMS display / shim window) while pulsing, until the FID is on resonance. Then the experiment is stopped by typing stop and an acquisition is started with ns =1 and ds = 0, by typing zg into the command line. The signal is processed with ft and appropriately phased. When TMS is used in the sample, change the BSMS field until the TMS signal is exactly on Zero the Zero frequency position.
Sample Nucleus Shift (ppm)
Water 1H 4.7
TMS 1H 0
KBr 79Br About 60 ppm R.K. Harris IUPAC recommendation, updated in TOPSPIN release from XWINNMR 3.1 where it was 41.1ppm
Adamantane 13C 29.5 38.56 (Earl et al. JMR 48, 50 (1982)
TTMSS 29Si -8.9
Glycine 13C 176 (Carbonyl line)
Table 1: Some chemical shifts that one can use for referencing.
Acceptance Solid State NMR Test Procedure Final test / Applications NMR
_______________________________________________________________________________ Index: 04 Number: B92999 Page: 5 (42)
The procedure has the advantage of allowing the spectrometer frequencies in the parameter sets to be used more easily on other spectrometers (if these spectrometers are referenced as well and use Bruker's frequency list). With O1 and O2 in ppm, different magnetic fields do not matter for parameter transfer.
4.1.2 Sample Preparation A water sample should be made with a CRAMPS insert or, if that is not available, with some Teflon tape at the bottom of the rotor to center the sample. A drop of water with or without TMS is set on top of the insert or Teflon tape and the upper part of the rotor remains unfilled. Insert the rotor into the probe and do not spin. Some shimming may be done on this sample to improve the line width, using the x or y and z shims.
It is advantageous to prepare one rotor with a mixture of KBr and adamantine (except for the 2.5 mm rotors, for reasons of signal intensity). This sample is easier to pack than a pure KBr sample and a number of setup experiments can be done without changing the sample. The 79Br resonance of KBr is used to set the magic angle. This process is described in section 4.2. Pulse lengths for 13C and 1H and the HH contact are determined on the adamantane 13C (and 1H) signals. A second rotor filled with Glycine is needed to determine the 13C and 15N sensitivity. A rotor filled with ammonium-dihydrogenphosphate is used to measure 31P signals, determine pulse lengths and sensitivity (31P has no official sensitivity specification but the experiment is useful for obtaining an overall impression of the probe).
For SB CPMAS probes and 2.5 mm probes it is advantageous to have a sample with 15N labeled glycine or ammonium chloride available to determine pulse lengths and power levels needed for the 15N cross polarization (CP) experiment.
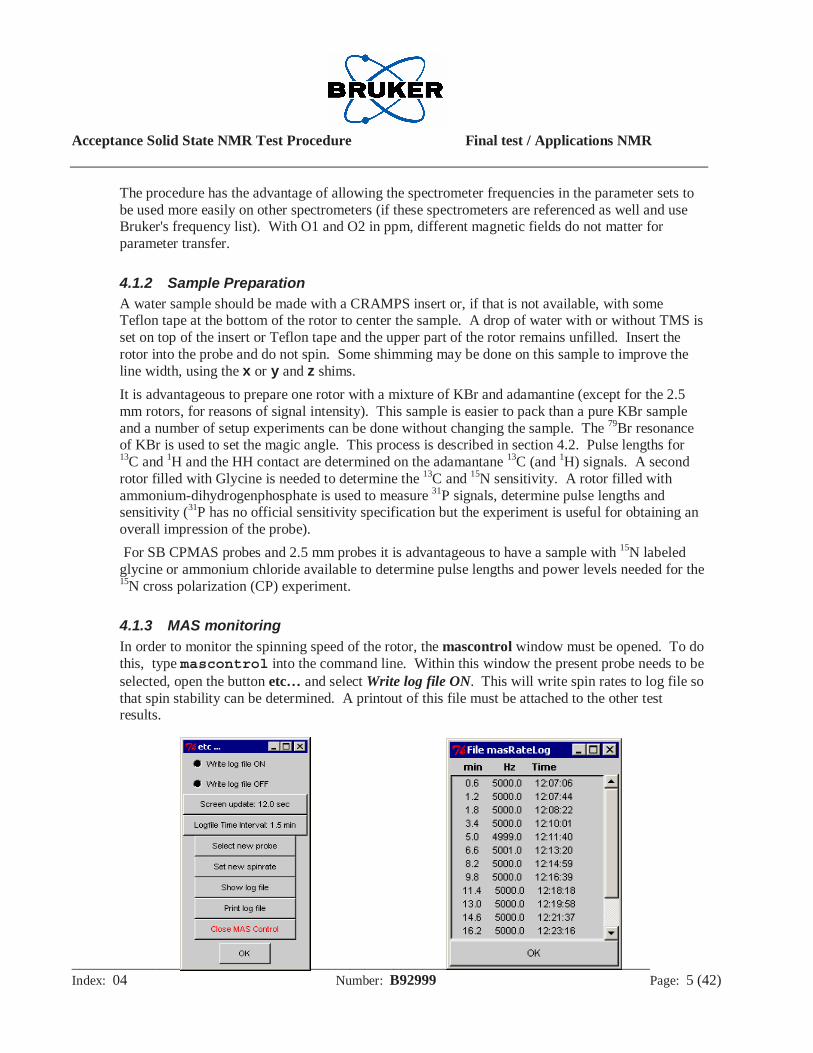
4.1.3 MAS monitoring In order to monitor the spinning speed of the rotor, the mascontrol window must be opened. To do
this, type mascontrol into the command line. Within this window the present probe needs to be selected, open the button etc… and select Write log file ON. This will write spin rates to log file so that spin stability can be determined. A printout of this file must be attached to the other test results.
Acceptance Solid State NMR Test Procedure Final test / Applications NMR
_______________________________________________________________________________ Index: 04 Number: B92999 Page: 6 (42)
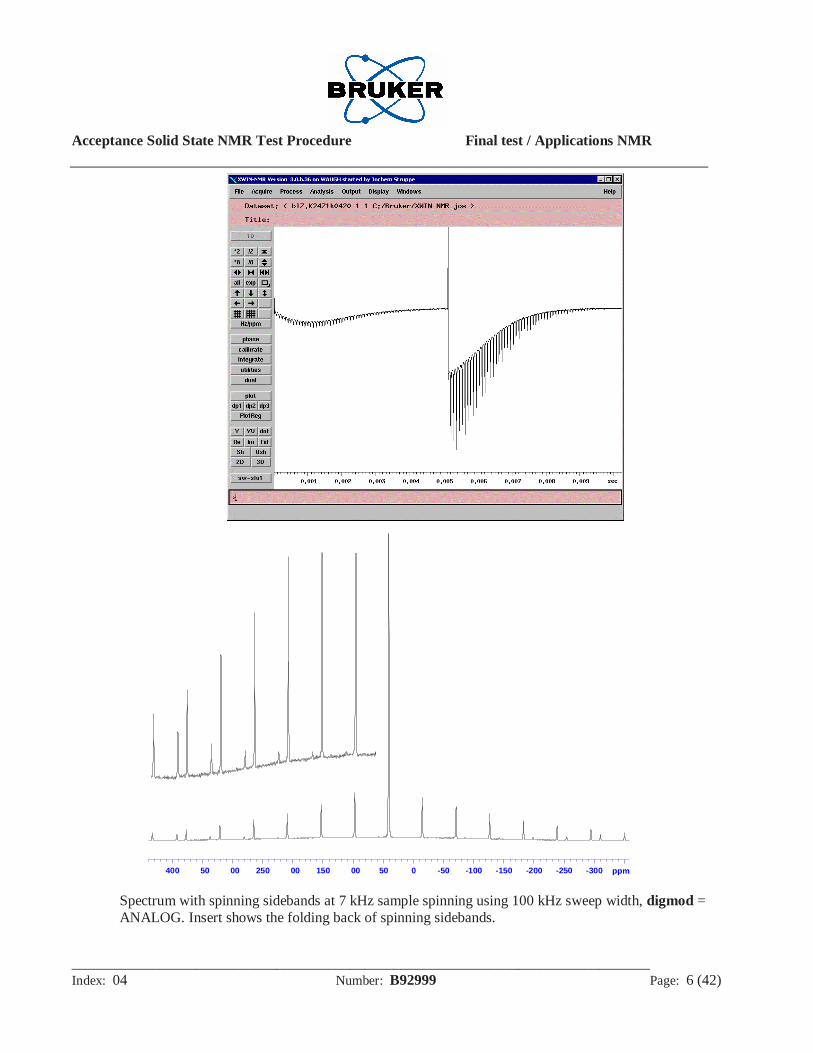
-300-250-200-150-100-50400 50 00 250 00 150 00 50 0 ppm
Spectrum with spinning sidebands at 7 kHz sample spinning using 100 kHz sweep width, digmod = ANALOG. Insert shows the folding back of spinning sidebands.
Acceptance Solid State NMR Test Procedure Final test / Applications NMR
_______________________________________________________________________________ Index: 04 Number: B92999 Page: 7 (42)
4.2 Setting the magic angle with KBr For more information on how to adjust the angle using the FID in the gs mode, see manual Z31401 page 45 ff..
Test Sample: KBr or KBr +Adamantane Spinning rate: 7 kHz
Spectrometer edsp: NUC1 79Br
Parameter set : KBr
Pulse program: ;zg ;#include <Avance.incl> 1 ze ;pl1=power level f1 channel
2 d1 ;p1 =f1 channel high power pulse p1 ph1 ;d1 =relaxation delay = 1 - 5* T1 go=2 ph31 wr #0 ;write data to disk
exit ph1 = 0 2 2 0 1 3 3 1
ph31= 0 2 2 0 1 3 3 1
Parameters: Acquisition: PULPROG zg NS 4 P1 4us DW 5us D1 500ms PL1 as determined in the following: DIGMOD analog O1P 41 ppm AQ about 8 msec MASR 6000 Hz and higher NOT a multiple of 5 kHz Setting Transmitter power: If the correct power level for the X-channel is not already known, start using 50% of the maximum power for the used channel using the power handling data sheet that comes with each probe. For the appropriate power level settings use 50% of the nominal transmitter power for the power level 0 if CORTAB has not been done and 25% if it has been done. Then use the fact that the power decreases or increases by 50% for a 3dB change above 0dB and below 0dB only if CORTAB has been done. As an example we want to use 75W on a 2.5 mm CPMAS probe with a linearized (CORTAB done) 1000W transmitter. Then we have 250W at 0 dB, 125W at 3 dB and 75 W at about 5.5 dB. As a reminder dB is defined as:
Acceptance Solid State NMR Test Procedure Final test / Applications NMR
_______________________________________________________________________________ Index: 04 Number: B92999 Page: 8 (42)
( )2
1log10dB powerpowery ⋅= .
That is exactly what you can use to calculate the power level change for a certain change of the pulse width or a nutation frequency, but as you are using amplitudes and not power it changes to:
( )2
1log20dB pulsewidth
pulsewidthy ⋅= .
In order to find a new pulse width for a given power level it reads:
20/)( 211012 powerlevelpowerlevelpulsewidthpulsewidth −⋅=
1. Read in the parameter set KBr, by typing rpar KBr all into the command line.
2. Set the power level PL1 following the suggestions above; match and tune the probe.
3. Type edasp and check the default button, the routing should now go through the high power amplifiers.
4. Type wobb and toggle with acqu into the acquisition window.
5. Match and tune the probe.
6. Type gs in the command line and switch with acqu to the acquisition window.
7. Make fine adjustment of O1 in the gs-window until the signal is full on resonance and set the receiver phase, phref, so that the full signal is in one channel in the ush (unshuffle) mode.
8. Adjust the magic angle, observing the FID and dialing the MA adjustment so that the spinning sidebands extend as far as possible. The spinning sidebands are seen in the time domain signal, the free induction decay (FID), as spikes riding on the on resonance signal of the central transition. The sidebands should extend as far as possible to the end of the 8-10 ms acquisition time.
9. Stop gs and start zg to get a spectrum.
Plotting: Plot the whole spectrum Note: A sweep width of 250 kHz can also be used to see the whole spinning sideband pattern. Such a sweep width can be achieved either in analog mode or in digital mode with DSPFIRM on smooth. At a spinning rate of 6 to 8 kHz, one can see the sidebands going almost all the way out to the end of the spectral window (depends on S/N! i.e. rotor size) and being reflected. Print the spectrum as proof for good setting of magic angle, use 16 to 64 transients to obtain a good enough intensity of the reflected signal. A sweep width of 250 kHz cannot be achieved on systems using SADC digitizers. For such systems use swh = 100 kHz and digmod=analog.

Acceptance Solid State NMR Test Procedure Final test / Applications NMR
_______________________________________________________________________________ Index: 04 Number: B92999 Page: 9 (42)
-2e+004-1e+0042e+004 1e+004 0e+000 Hz
Final Test BH065700 Operator JOSPH MASVTN 500 WB BL7 15N-31P/1H
Adamantane 1HSpinning speed 7 kHz

Acceptance Solid State NMR Test Procedure Final test / Applications NMR
_______________________________________________________________________________ Index: 04 Number: B92999 Page: 10 (42)
4.3 1H 90 degree pulse Adamantane The Adamantane sample is used to determine the 1H 90º pulse. While this is done a check of sample spinning needs to be performed order to check whether the probe spins well and to demonstrate stability of MAS controller. 7mm, 4mm and 2.5mm MAS probes need to run at the limit of 7 kHz, 15 kHz and 35 kHz respectively. A log file of the MAS controller must be created according to the procedures outlined in sections 4.1.3. Print this file as proof that stable spinning at the highest spinning speed was achieved. Make sure that the rotor is not too old if going to the fastest rotation speeds. With normal wear and tear I would suggest that for acceptance tests in the field the rotor should not be older than 50 high speed tests. It is advised to maintain a usage log for all rotors, speed, when filled last, trips and special issues (dropped etc.). Indeed, it is annoying to have a rotor crash in the field.
Test Sample: Adamantane
Spinning rate limit of probe
Spectrometer edsp: NUC1 1H
Parameter Set ZGSOLIDS Pulse program zg Parameters Acquisition: PULPROG zg TD 2048 NS 4 P1 4us DW 5us DE 6us D1 2s PL1 as determined in the following: DIGMOD digital 01P 2.3 ppm Transmitter power: see 4.1 Plotting: Plot the whole spectrum. Choose Hz for x-axis units. Note: Use the experiment to determine the pl1 for a 4 us 90-degree pulse on 1H, the power level for the decoupling pulse (e.g. 2.5 us for 4mm CPMAS probe) and write the obtained value for the high power decoupling pulse into edprosol 1H F1A1 in the field for p90 (see appendix). Having those data available allows a fast setup of the CP as well as the sensitivity experiment. With CORTAB done, write the power level and for a 2, 3 and 4 us 1H pulse into the prosol table on F1 use either all solvents or create a solvent solids following the instructions on the ICONNMR manual extension for solid state NMR.

Acceptance Solid State NMR Test Procedure Final test / Applications NMR
_______________________________________________________________________________ Index: 04 Number: B92999 Page: 11 (42)
29303132333435363738394041 ppm
Final Test BH065700 Operator JOSPH MASVTN 500 WB BL7 15N-31P/1H
Adamantane 13CResolution in Hz
Acceptance Solid State NMR Test Procedure Final test / Applications NMR
_______________________________________________________________________________ Index: 04 Number: B92999 Page: 12 (42)
4.4 13C Direct Polarization on Adamantane Direct detection of 13C is done on Adamantane in order to determine the 90-degree 13C pulse at various pulse lengths and power levels. The experiment can, in principle, be used for shimming, however, more signal is available through the CP experiment (see 4.5). Begin with aq = 100ms and adjust 90-degree pulses at various pulse lengths as deemed necessary. For shimming, aq can be increased up to 500ms if the 1H decoupling is kept moderately low, see note. Attention: Be extra careful during that experiment: check aq if sw, dw, or td values are changed and make sure it stays below 0.1 s, otherwise the probe could be damaged. Use power levels that provide a 5us 90-degree pulse for a 4mm probe - see note below. Test Sample: Adamantane
Spinning rate: 5 kHz or higher
Spectrometer edsp: NUC1 13C
NUC2 1H
Parameter Set: DirectC13 Pulse program: hpdec.av
;hpdec.av ;acquisition on X with hp proton decoupling
1 ze ;set RCU to replace mode 2 d1 do:f2 ;recycle delay (p1 ph1):f1 ;transmitter pulse on F1 with power level pl1 1u cpds2:f2 ;use cpdprg2 cw or tppm at power pl12 go=2 ph31 ;make sure the adc is finished, turn decoupling off 1m do:f2 wr #0 ;save data in current data set exit ph0= 0 ;constant phase for acquisition ph1= 0 1 2 3 ;simple pulse phase list ph31=0 1 2 3 ;signal routing corresponds to pulse phase list
Parameters: Acquisition: PULPROG hpdec.av
TD 2048 NS 4 P1 4us DW 50 µs CPDPRG2 tppm15 (or cw at low field instruments) PL1 approach as determined in 4.2 and 4.3 PL12 pl for 5.5us 90degree on 1H (45 kHz B1 field) for 4 mm and 6.3 us (40 kHz) for 7 mm probes

Acceptance Solid State NMR Test Procedure Final test / Applications NMR
_______________________________________________________________________________ Index: 04 Number: B92999 Page: 13 (42)
P31 2*p3-0.2us as start value – optimize! Might require a decent shim already. O1P 32 ppm O2P 2.3 ppm ZGOPTNS -Dtppm Plotting: Plot main part of spectrum and determine line width with the au
program hwcal. Note the line width in title, if the experiment was used for shimming.
Note 1: If no previous referencing has been done using the BSMS field or the BSMS display/lock window, set the right hand line to 29.5 ppm. If the spectrometer is referenced properly with the field and spectrometer frequency, use the values given in the parameter set. If the ‘sr’ command is used to set the reference, use a frequency right between both lines as the O1 for the experiment. Then, measure the absolute frequency of the left line and multiply that frequency by 3.976787 in order to find the right SFO2 for the 1H decoupling. Note 2: This experiment can also be used for shimming the probe. Then it might be necessary to set aq to higher values, up to 500ms. In that case, we reduce the decoupling power as much as possible but try to stay high enough so that dipolar coupling cannot influence the line width. A maximum of 500 ms for aq can be used with reduced decoupling power. This is at the power level of a 5 us pulse, equivalent to a B1 field of approximately 50 kHz. for 4 mm probes and 40 kHz for 7mm probes. Pay attention that in such cases the recovery delay D1 is 10 s. One must not exceed a maximum of 500 ms for aq. Note 3: In the most recent release the au-program au_cp, changes the decoupler power level used for the experiment based on the acquisition time. The au_program uses and sets a hidden pulse programs permitting aq up to 1s by reducing the amplitude of the decoupler rf signal by 25% for 50ms < aq < 200ms and by 50% for 200ms < aq < 1s. The decoupler power in the prosol table must be 80% of the max. value, i.e. 80kHz for 4mm (3.1us), 56 kHz for 7mm (4.5us) and 125 kHz for 2.5mm (2.1us) CPMAS probes.
Decoupling programs: The decoupling program cw: 0.5u pl=pl12 1 100up:0 fq=cnst21 jump to 1 TPPM decoupling: TPPM (Two Pulse Phase-Modulation) has been invented 1995 by the Griffin group at MIT: A.E. Bennett, C.M. Rienstra, M. Auger, K.V. Lakshmi, and R.G. Griffin; Heteronuclear decoupling in rotating solids, J. Chem. Phys. 103 (16); 6951 – 6958 (1995)

Acceptance Solid State NMR Test Procedure Final test / Applications NMR
_______________________________________________________________________________ Index: 04 Number: B92999 Page: 14 (42)
TPPM decoupling surpasses the traditional cw decoupling and is now standard in solid state NMR experiments. TPPM is not needed for the experiment with adamantane.
The decoupling programs tppm: (the frequency offset cnst21 can be set to 0 for these setup experiments)
tppm15 tppm20 0.3u fq=cnst21 0.5u pl=pl12 1 p31:0 p31:15 p31:0 p31:15 p31:0 p31:15 p31:0 p31:15 p31:0 p31:15 p31:0 p31:15 p31:0 p31:15 p31:0 p31:15 p31:0 p30:15 jump to 1
0.3u fq=cnst21 0.5u pl=pl12 1 p31:0 p31:20 p31:0 p31:20 p31:0 p31:20 p31:0 p31:20 p31:0 p31:20 p31:0 p31:20 p31:0 p31:20 p31:0 p31:20 p31:0 p30:20 jump to 1

Acceptance Solid State NMR Test Procedure Final test / Applications NMR
_______________________________________________________________________________ Index: 04 Number: B92999 Page: 15 (42)
22232425262728293031323334353637383940414243444546474849 ppm
Acceptance Solid State NMR Test Procedure Final test / Applications NMR
_______________________________________________________________________________ Index: 04 Number: B92999 Page: 16 (42)
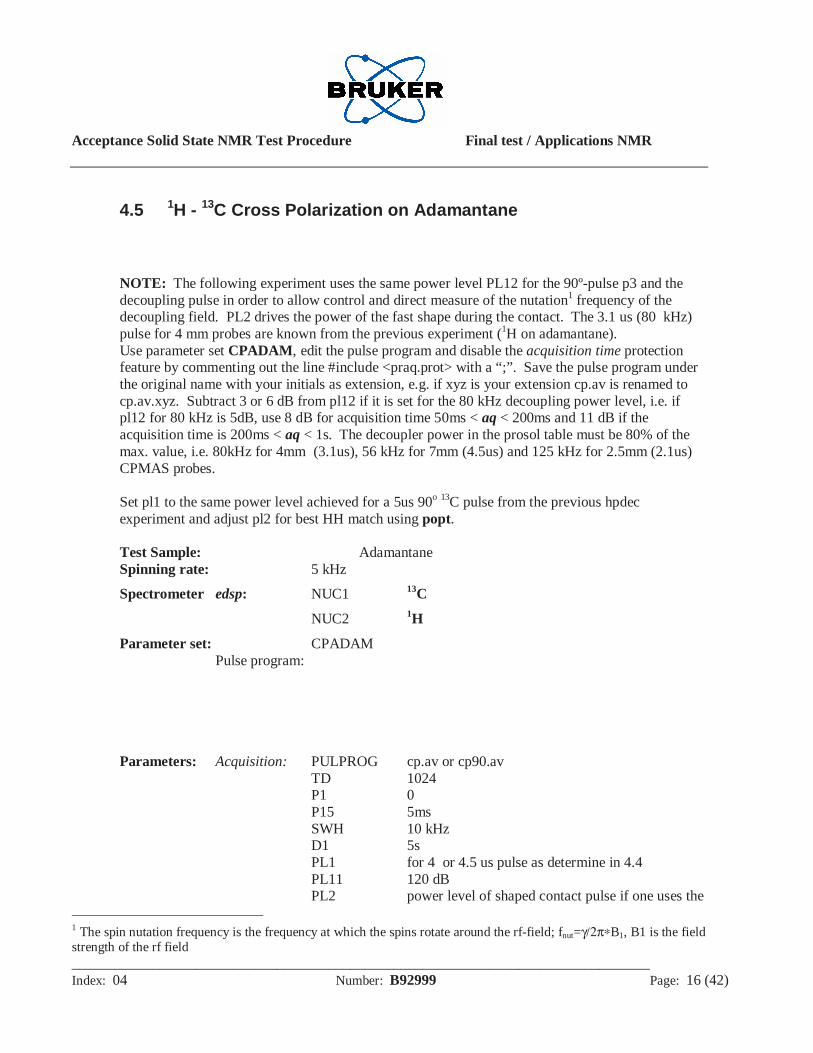
4.5 1H - 13C Cross Polarization on Adamantane
NOTE: The following experiment uses the same power level PL12 for the 90º-pulse p3 and the decoupling pulse in order to allow control and direct measure of the nutation1 frequency of the decoupling field. PL2 drives the power of the fast shape during the contact. The 3.1 us (80 kHz) pulse for 4 mm probes are known from the previous experiment (1H on adamantane). Use parameter set CPADAM, edit the pulse program and disable the acquisition time protection feature by commenting out the line #include <praq.prot> with a “;”. Save the pulse program under the original name with your initials as extension, e.g. if xyz is your extension cp.av is renamed to cp.av.xyz. Subtract 3 or 6 dB from pl12 if it is set for the 80 kHz decoupling power level, i.e. if pl12 for 80 kHz is 5dB, use 8 dB for acquisition time 50ms < aq < 200ms and 11 dB if the acquisition time is 200ms < aq < 1s. The decoupler power in the prosol table must be 80% of the max. value, i.e. 80kHz for 4mm (3.1us), 56 kHz for 7mm (4.5us) and 125 kHz for 2.5mm (2.1us) CPMAS probes. Set pl1 to the same power level achieved for a 5us 90o 13C pulse from the previous hpdec experiment and adjust pl2 for best HH match using popt.
Test Sample: Adamantane Spinning rate: 5 kHz
Spectrometer edsp: NUC1 13C
NUC2 1H
Parameter set: CPADAM Pulse program:
Parameters: Acquisition: PULPROG cp.av or cp90.av TD 1024 P1 0 P15 5ms SWH 10 kHz D1 5s PL1 for 4 or 4.5 us pulse as determine in 4.4 PL11 120 dB PL2 power level of shaped contact pulse if one uses the 1 The spin nutation frequency is the frequency at which the spins rotate around the rf-field; fnut=γ/2π∗B1, B1 is the field strength of the rf field

Acceptance Solid State NMR Test Procedure Final test / Applications NMR
_______________________________________________________________________________ Index: 04 Number: B92999 Page: 17 (42)
ramp and pl1 for 4 us excitation pulse we need then the power level for 4 or 4.5 us 1H as determined in 4.3 minus 3 dB SPNAM0 ramp.100 PL12 see text P3 goes with pl12 – if pl12 was changed by 3 dB,
multiply the original pulse with with 1.4, if it was changed by 6 dB double the original pulse width. If e.g. original pulse parameters were 3.1us at 5 dB, change to 8 dB gives 3.1*1.4=4.3us, and a change to 11 dB gives a 6.2 us pulse width.
CPDPRG tppm15 (or cw for low field instruments) P31 2*p3-0.2us (see above) ZGOPTNS -Dlacq (switches protection file off for long
acquisition times – see note below for decoupling power limitations at long acquisition times)
Note: This experiment is used for shimming the probe and demonstration of power handling capability. It might be necessary to set aq to higher values. In that case, make sure that the decoupling pulse does not exceed 50 kHz (for 4 mm probes and 40 kHz for 7mm probes) and that the recovery delay D1 is 10 s. Save parameter setas CPADAM. Do not exceed a maximum of 500 ms for aq.
Attention: If aq >50ms, then the probe protection increases the attenuation (the power level) by 3dB for 50ms < aq < 200ms and by 6dB for 200ms < aq < 1s in recent pulse programs

Acceptance Solid State NMR Test Procedure Final test / Applications NMR
_______________________________________________________________________________ Index: 04 Number: B92999 Page: 18 (42)
-2040 220 200 80 60 140 120 00 80 60 40 0 0 ppm
Carbonyl peak Aliphatic peak

Acceptance Solid State NMR Test Procedure Final test / Applications NMR
_______________________________________________________________________________ Index: 04 Number: B92999 Page: 19 (42)
4.6 13C Sensitivity on Glycine Having the best HH match from the previous experiment, it is necessary to optimize the HH match on for the glycine sample again if the spinning speed was changed. Spin at N kHz where N is defined by the 1H spectrometer frequency divided by 100MHz (e.g. for a 500.13MHz spectrometer N=5). Then p3 is measured in a nutation experiment (increment p3 using popt) in order to verify the measurements at the 1H experiment. Then calculate the power level for a 2.5 us pulse, which is a 100 kHz B1 field (4mm probe) or 75 kHz (7mm probe), using pulse in the 1H adamantane experiment (section 4.3.) Remember, using the au program pulse requires values be placed in pl1 and p1, not pl2 and p3. Set to the obtained new values for p3 and pl12 and repeat the measurement. The obtained pl value in dB is then used for pl12. Measure p3 with popt in order to verify the calculation. A good p31, the pulse for TPPM decoupling, is estimated from p3 using p31=2*p3-0.2us. The power handling test should be done at that stage of the test procedure. The experiment must be done with the pulse program cp90.av (cp4c.98 for D*X spectrometers) with the protection features implemented. NOTE: In more recent releases, the pulse program uses the relations file solids_cp. If this is not the case, the use of the relations file can be obtained by adding the line prosol relations=<solids_cp> between the comments and the first line with an include statement into the pulse program. This requires that the power levels and pulses are entered correctly into the prosol table (see appendix).
Test Sample: Glycine
Spinning speed: Spin at N kHz where N is defined by the 1H spectrometer frequency divided by 100MHz
(e.g. for a 500.13MHz spectrometer N=5). Spectrometer edsp: NUC1 13C
NUC2 1H
Parameter set: CPGLY Pulse program: cp.av Parameters: Acquisition: PULPROG cp90.av
TD 2048 SW 300ppm D1 5s NS 4 PL1 for 4 or 4.5 us pulse as determine in 4.4 P15 2000 µµµµs PL2 power level for 4 - 4.5 us 1H pulses minus 3 dB SPNAM0 ramp.100 PL12 Power level for excitation pulse P3 and decoupling. Use
100% of the maximum values for sensitivity specs and 80% for the PROSOL

Acceptance Solid State NMR Test Procedure Final test / Applications NMR
_______________________________________________________________________________ Index: 04 Number: B92999 Page: 20 (42)
table (56kHz, 80 kHz and 120 kHz for 7, 4 and 2.5 mm probes)! Max. decoupling is 75 kHz, 100 kHz and 150 kHz for 7 mm, 4mm and 2.5 mm MAS probes, respectively. Acquire one experiment with maximum decoupling and aq=50 ms to document power handling.
P3 Use the maximum values, 2.5us, 3.3us and 2us for 4mm, 7mm and 2.5mm MAS probes, respectively. Measure the 80% values and put those into the PROSOL table, i.e. use 3us, 4.5 and 2.1 us for 4mm, 7mm and 2.5mm MAS probes, respectively.
P31 2*P3-0.2us to be optimized O1P 100 ppm O2P 3.5 ppm (to be optimized in steps <=500 Hz CPDPRG2 tppm15 or SPINAL64 (cw for 300MHz and Lower field spectrometers) Processing: LB 0 Hz
Note: If the carbonyl peak comes properly up at 176 ppm the O2 parameter above can be used. If not, set the carbonyl peak to 176 ppm. In order to get the right decoupler frequency, measure SFO1 at the carbonyl peak and multiply this number with 3.976245. Using popt with 400 Hz steps can also be used to find the best position for the decoupler frequency. For more advice, consult one of the references given above. Sensitivity is determined by measuring the signal height of the aliphatic peak and noise over a 10 ppm wide region. Use the au program sinocal. Signal region 50 ppm to 30 ppm, range for noise determination from 250 ppm to – 50 ppm and noise 10 ppm. When using ATP the appropriate parameters for sinocal are readily available and sinocal loads those parameters automatically.

Acceptance Solid State NMR Test Procedure Final test / Applications NMR
_______________________________________________________________________________ Index: 04 Number: B92999 Page: 21 (42)
-1 -2 -3 -4 -5 -6 -7 -8 -9 -10 -11 -12 -13 -14 -15 -16 -17 -18 -19 ppm
Acceptance Test ProcedureDetermination of 90 deg pulse for 13C
poptau for p1 finished.ZERO at experiment 4.671153: p1 = 4.671153
NEXP=20
Acceptance Solid State NMR Test Procedure Final test / Applications NMR
_______________________________________________________________________________ Index: 04 Number: B92999 Page: 22 (42)
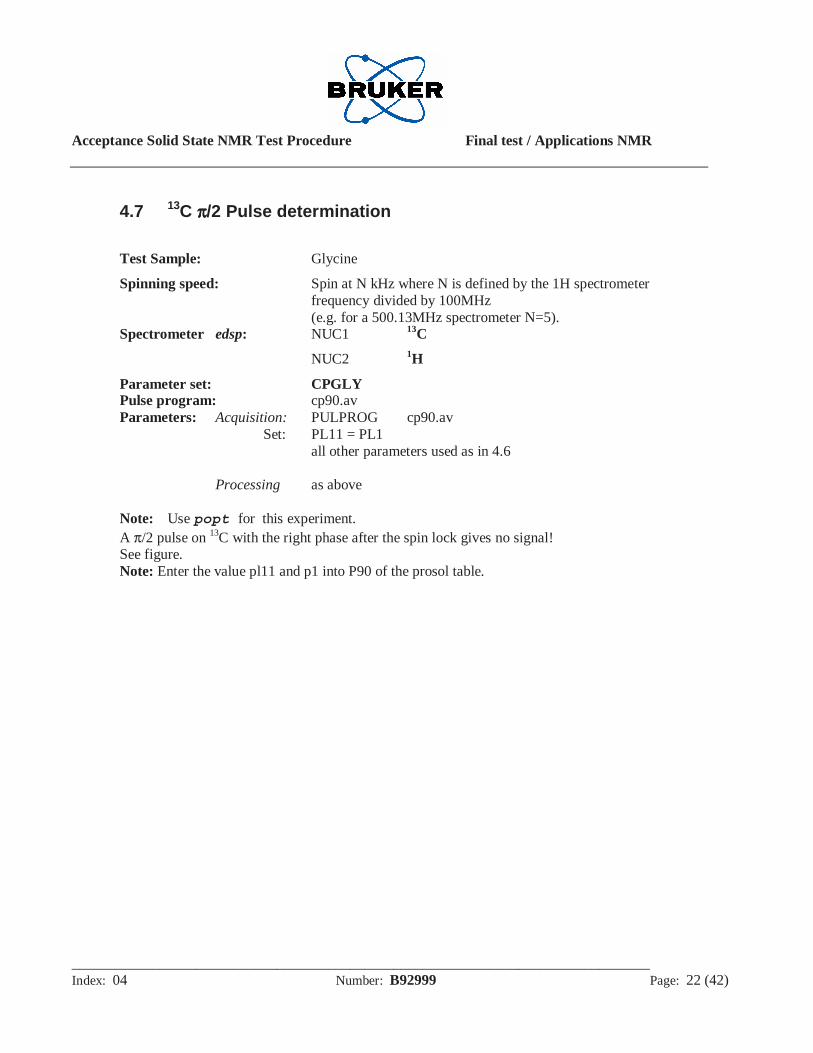
4.7 13C ππππ/2 Pulse determination
Test Sample: Glycine
Spinning speed: Spin at N kHz where N is defined by the 1H spectrometer frequency divided by 100MHz
(e.g. for a 500.13MHz spectrometer N=5). Spectrometer edsp: NUC1 13C
NUC2 1H
Parameter set: CPGLY Pulse program: cp90.av Parameters: Acquisition: PULPROG cp90.av Set: PL11 = PL1 all other parameters used as in 4.6 Processing as above Note: Use popt for this experiment. A π/2 pulse on 13C with the right phase after the spin lock gives no signal! See figure. Note: Enter the value pl11 and p1 into P90 of the prosol table.

Acceptance Solid State NMR Test Procedure Final test / Applications NMR
_______________________________________________________________________________ Index: 04 Number: B92999 Page: 23 (42)
-250-200-150-100-50300 250 200 150 100 50 0 pp
Final Test Probe B0628/101: PH MAS WB BL-4 1H/X/YDone by: JOS
Glycine 15N cp experimentSpinning speed 5000 Hz
After some optimization: S/NSignal from 40.00 to 25.00 ppmNoise from 179.00 to 159.00 ppm
Final Test Probe B0628/101: PH MAS WB BL-4 1H/X/Y Done by: JOS
Glycine 15N CP experiments Spinning speed 11000Hz
Signal to Noise: Signal from 40 to 25 ppm Noise from 179 to 129 ppm

Acceptance Solid State NMR Test Procedure Final test / Applications NMR
_______________________________________________________________________________ Index: 04 Number: B92999 Page: 24 (42)
4.8 15N Sensitivity on Glycine
Test sample: Glycine, 15N natural abundance For parameter optimization: use 15N enriched Glycine
Spinning speed: Spin at N kHz where N is defined by the 1H spectrometer frequency divided by 100MHz
(e.g. for a 500.13MHz spectrometer N=5). Spectrometer edsp: NUC1 15N NUC2 1H Parameter set: CPN15 Pulse program: cp90.av Parameters: Acquisition: PULPROG cp90.av
TD 2024 P1 5.5us ( goes with PL11) P15 3 ms SW 400ppm D1 5s RG 8096 PL1 Power level for 5 or 5.5 us pulse PL11 120 dB PL2 power level for 5 or 5.5 us 1H pulse + 3dB SPNAM0 ramp.100 PL12 Use same decoupling as in previous experiment
with 13C O1P 0 ppm O2P 5 ppm optimize
Note: A good starting point for the choice of power levels is to use the power level of the 13C and subtract 3dB ( double the power) and add 3dB to the proton power level pl2 used for 1H-13C CP-MAS experiment. The 15N peak is approximately at 33 ppm if the reference procedure was used following chapter 4.1 or 4.4. For o2p use o2p from Glycine sensitivity experiment and add 5.5 ppm. The best decoupler position can also be found using popt with 400 Hz steps. In order to setup HH and all other parameters it is advantageous to use a 15N labeled glycine, if available. Another good and easy sample is 15N enriched ammonium nitrate (allows direct polarization almost without any decoupling). Sensitivity is determined by measuring the signal integral over the peak and noise over a 20-ppm wide region. Use the au program sinocal. Signal region = 35 ppm to 25 ppm, whole spectrum 300 ppm to -300 ppm and noise 50 ppm. Then the program will look for the best noise region and return the values for noise region, signal region and S/N.

Acceptance Solid State NMR Test Procedure Final test / Applications NMR
_______________________________________________________________________________ Index: 04 Number: B92999 Page: 25 (42)
4.9 15N ππππ/2 Pulse determination
Use same parameters as in 4.8 15N Sensitivity on Glycine and measure the pulse width as described in 4.7 13C π/2 Pulse determination.

Acceptance Solid State NMR Test Procedure Final test / Applications NMR
_______________________________________________________________________________ Index: 04 Number: B92999 Page: 26 (42)
-100-80-60-40-20100 80 60 40 20 0 ppm
Acceptance Test Procedures Solid State NMR
31P SINO
Acceptance Solid State NMR Test Procedure Final test / Applications NMR
_______________________________________________________________________________ Index: 04 Number: B92999 Page: 27 (42)
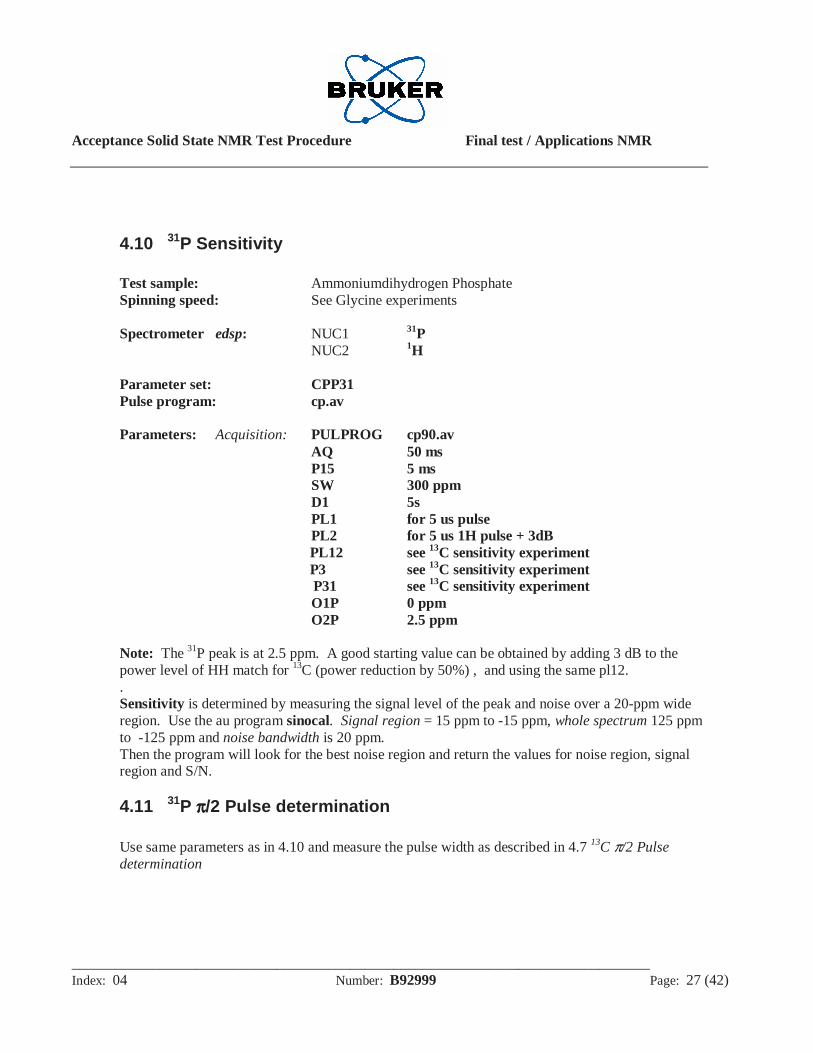
4.10 31P Sensitivity
Test sample: Ammoniumdihydrogen Phosphate Spinning speed: See Glycine experiments Spectrometer edsp: NUC1 31P NUC2 1H Parameter set: CPP31 Pulse program: cp.av Parameters: Acquisition: PULPROG cp90.av AQ 50 ms
P15 5 ms SW 300 ppm D1 5s PL1 for 5 us pulse PL2 for 5 us 1H pulse + 3dB PL12 see 13C sensitivity experiment P3 see 13C sensitivity experiment P31 see 13C sensitivity experiment O1P 0 ppm O2P 2.5 ppm
Note: The 31P peak is at 2.5 ppm. A good starting value can be obtained by adding 3 dB to the power level of HH match for 13C (power reduction by 50%) , and using the same pl12. . Sensitivity is determined by measuring the signal level of the peak and noise over a 20-ppm wide region. Use the au program sinocal. Signal region = 15 ppm to -15 ppm, whole spectrum 125 ppm to -125 ppm and noise bandwidth is 20 ppm. Then the program will look for the best noise region and return the values for noise region, signal region and S/N.
4.11 31P ππππ/2 Pulse determination
Use same parameters as in 4.10 and measure the pulse width as described in 4.7 13C π/2 Pulse determination

Acceptance Solid State NMR Test Procedure Final test / Applications NMR
_______________________________________________________________________________ Index: 04 Number: B92999 Page: 28 (42)
4.12 Double CP (DCP) experiment Setup using 13C – 15N labeled glycine in center-packed rotor and rotate at 11 kHz The Setup is done in three steps. Step one is CP parameter determination and measurement for 15N, Step 2 is CP parameter determination and measurement for 13C at 11 kHz sample rotation and step 3 is the optimization of the second CP step in the DCP experiment. In edasp the signal should be routed for each experiment as needed for the final DCP experiment. The routing for the 15N 1H CP experiment is shown in figure 1. The DCP routing can be used for the 13C 1H CP setup as well and is shown in figure 2.
Figure 1: Setup for 15N 1H CP experiment, can be obtained from routing as in figure 3 by checking the Switch F1/F3 button.

Acceptance Solid State NMR Test Procedure Final test / Applications NMR
_______________________________________________________________________________ Index: 04 Number: B92999 Page: 29 (42)
Figure 2: Routing for CP experiment with 13C and the double CP experiment Even if the CP conditions are known, it is advantageous to determine the 90 pulse of the X and Y nucleus using cp90.av. The 90 degree pulse is found, where the signal crosses Zero (see 4.7 and 4.9). The knowledge of the 90 degree pulse allows calculating the right HH condition by: B1_15N (Hz) = B1_13C (Hz) + spinning rate in Hz. Run a CP experiment 13C{1H} with 16 scans as reference to measure DCP yield.. Call the pulse program doubcp1.av. Use all the parameters from CP experiments: Test sample: center-packed U 13C – 15N enriched glycine Spinning speed: 11 kHz Spectrometer edsp: NUC1 13C NUC2 1H NUC3 15N Parameter set: DCPNC Pulse program: doubcp1.av Parameters: Acquisition: PULPROG doubcp1.av
Acceptance Solid State NMR Test Procedure Final test / Applications NMR
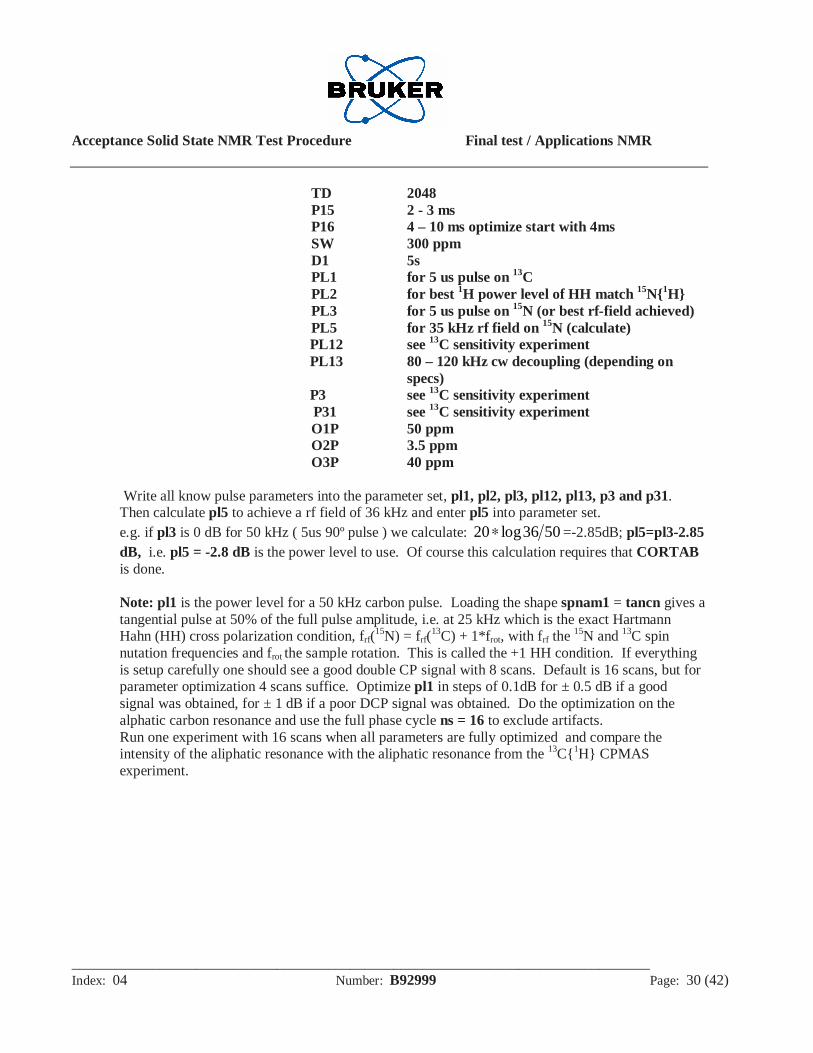
_______________________________________________________________________________ Index: 04 Number: B92999 Page: 30 (42)
TD 2048 P15 2 - 3 ms P16 4 – 10 ms optimize start with 4ms SW 300 ppm D1 5s PL1 for 5 us pulse on 13C PL2 for best 1H power level of HH match 15N{1H} PL3 for 5 us pulse on 15N (or best rf-field achieved) PL5 for 35 kHz rf field on 15N (calculate) PL12 see 13C sensitivity experiment PL13 80 – 120 kHz cw decoupling (depending on
specs) P3 see 13C sensitivity experiment P31 see 13C sensitivity experiment O1P 50 ppm O2P 3.5 ppm O3P 40 ppm
Write all know pulse parameters into the parameter set, pl1, pl2, pl3, pl12, pl13, p3 and p31. Then calculate pl5 to achieve a rf field of 36 kHz and enter pl5 into parameter set. e.g. if pl3 is 0 dB for 50 kHz ( 5us 90º pulse ) we calculate: 5036log20∗ =-2.85dB; pl5=pl3-2.85 dB, i.e. pl5 = -2.8 dB is the power level to use. Of course this calculation requires that CORTAB is done. Note: pl1 is the power level for a 50 kHz carbon pulse. Loading the shape spnam1 = tancn gives a tangential pulse at 50% of the full pulse amplitude, i.e. at 25 kHz which is the exact Hartmann Hahn (HH) cross polarization condition, frf(
15N) = frf(13C) + 1*frot, with frf the 15N and 13C spin
nutation frequencies and frot the sample rotation. This is called the +1 HH condition. If everything is setup carefully one should see a good double CP signal with 8 scans. Default is 16 scans, but for parameter optimization 4 scans suffice. Optimize pl1 in steps of 0.1dB for ± 0.5 dB if a good signal was obtained, for ± 1 dB if a poor DCP signal was obtained. Do the optimization on the alphatic carbon resonance and use the full phase cycle ns = 16 to exclude artifacts. Run one experiment with 16 scans when all parameters are fully optimized and compare the intensity of the aliphatic resonance with the aliphatic resonance from the 13C{1H} CPMAS experiment.

Acceptance Solid State NMR Test Procedure Final test / Applications NMR
_______________________________________________________________________________ Index: 04 Number: B92999 Page: 31 (42)
Figure 3: DCP optimization on PL1 in 0.1 dB steps.
4.13 Tuning Stability Test (optional) Having setup DCP create a new experiment with edc, load pulse program doubcp1_stab.av change in eda to 2D experiment and set td to 1 – 8k, set pl12 to 100 kHz decoupling, D1 = 5s, ns = 8 and start experiment for an overnight run.
Figure 4: Double CP experiments in a hard instrument stability test over night with 8192 experiments 2 scans per experiment. Note the horizontal line from an arcing event.

Acceptance Solid State NMR Test Procedure Final test / Applications NMR
_______________________________________________________________________________ Index: 04 Number: B92999 Page: 32 (42)
Figure 5: Double CP experiments column extracted from above 2D data set. The signal amplitude varies between 90% and 100% except for the arcing event. The tuning stability is well within the acceptance limits (20% instability).
4.14 HFX Probes: HF – Setup General cannel setup for HFC experiments benefits from 19F preamplifier module like for example the XBB19F 2HS module (figure 6)
Figure 6: HFC experiment setup example with routing table and preamplifier selection.

Acceptance Solid State NMR Test Procedure Final test / Applications NMR
_______________________________________________________________________________ Index: 04 Number: B92999 Page: 33 (42)
4.14.1 FH – HF experiment Use the pulse program hpdec.av. Use all the known parameters from CP experiments. And do 19F and 1H detect experiment with 1H and 19F decoupling experiments. Test sample: PVDF Spinning speed: 15 kHz or 35 kHz if possible Spectrometer edsp: NUC1 19F NUC2 1H Parameter set: FH_dp Pulse program: hpdec.av Parameters: Acquisition: PULPROG hpdec.av TD 2048
DW 5us D1 5s PL1 for 3.1 us pulse on 19F see probe specs PL12 for 80 kHz 1H decoupling O1P – 100 ppm O2P 3.5 ppm
4.14.2 13C{ 19F} CPMAS experiments Use all the known parameters from CP experiments and from above HF – experiments. With 2.5 mm probes at high spinning speed, > 20 kHz, use for the contact pulse spnam0 = ramp80.100. Test sample: PVDF Spinning speed: 15 kHz or 35 kHz if possible Spectrometer edsp: NUC1 13C NUC2 19F or 1H NUC3 1H or 19F Parameter set: CPCF Pulse program: cp.av Parameters: Acquisition: PULPROG cp.av TD 2048
DW 5us D1 5s PL1 CP power level for 4 us pulse f1
Acceptance Solid State NMR Test Procedure Final test / Applications NMR
_______________________________________________________________________________ Index: 04 Number: B92999 Page: 34 (42)
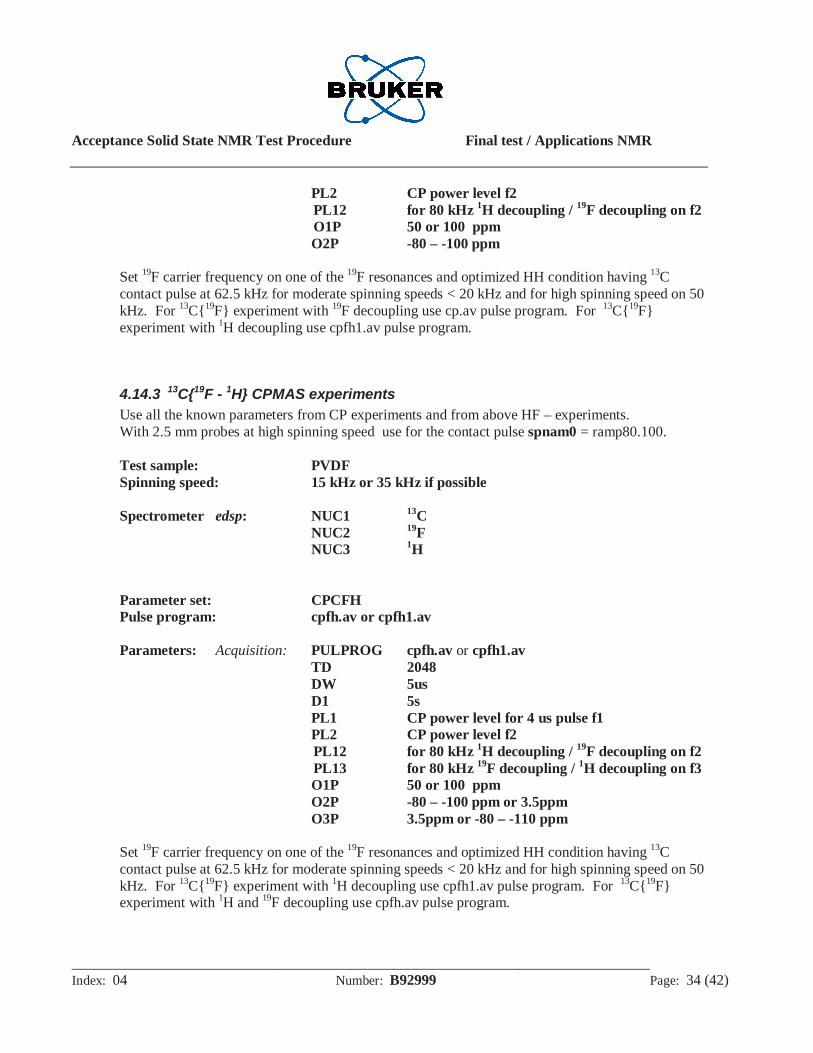
PL2 CP power level f2 PL12 for 80 kHz 1H decoupling / 19F decoupling on f2 O1P 50 or 100 ppm O2P -80 – -100 ppm
Set 19F carrier frequency on one of the 19F resonances and optimized HH condition having 13C contact pulse at 62.5 kHz for moderate spinning speeds < 20 kHz and for high spinning speed on 50 kHz. For 13C{19F} experiment with 19F decoupling use cp.av pulse program. For 13C{19F} experiment with 1H decoupling use cpfh1.av pulse program.
4.14.3 13C{19F - 1H} CPMAS experiments Use all the known parameters from CP experiments and from above HF – experiments. With 2.5 mm probes at high spinning speed use for the contact pulse spnam0 = ramp80.100. Test sample: PVDF Spinning speed: 15 kHz or 35 kHz if possible Spectrometer edsp: NUC1 13C NUC2 19F NUC3 1H Parameter set: CPCFH Pulse program: cpfh.av or cpfh1.av Parameters: Acquisition: PULPROG cpfh.av or cpfh1.av TD 2048
DW 5us D1 5s PL1 CP power level for 4 us pulse f1 PL2 CP power level f2 PL12 for 80 kHz 1H decoupling / 19F decoupling on f2 PL13 for 80 kHz 19F decoupling / 1H decoupling on f3 O1P 50 or 100 ppm O2P -80 – -100 ppm or 3.5ppm O3P 3.5ppm or -80 – -110 ppm
Set 19F carrier frequency on one of the 19F resonances and optimized HH condition having 13C contact pulse at 62.5 kHz for moderate spinning speeds < 20 kHz and for high spinning speed on 50 kHz. For 13C{19F} experiment with 1H decoupling use cpfh1.av pulse program. For 13C{19F} experiment with 1H and 19F decoupling use cpfh.av pulse program.

Acceptance Solid State NMR Test Procedure Final test / Applications NMR
_______________________________________________________________________________ Index: 04 Number: B92999 Page: 35 (42)
4.14.4 13C{ 1H – 19F} CPMAS experiments Use all the known parameters from CP experiments and from above HF – experiments. With 2.5 mm probes at high spinning speed use for the contact pulse spnam0 = ramp80.100. Test sample: PVDF Spinning speed: 15 kHz Spectrometer edsp: NUC1 13C NUC2 1H NUC3 19F Parameter set: CPCFH Pulse program: cpfh.av or cpfh1.av Parameters: Acquisition: PULPROG cpfh.av or cpfh1.av TD 2048
DW 5us D1 5s PL1 CP power level for 4 us pulse f1 PL2 CP power level f2 PL12 for 80 kHz 1H decoupling / 19F decoupling on f2 PL13 for 80 kHz 19F decoupling / 1H decoupling on f3 O1P 50 or 100 ppm O2P -80 – -100 ppm or 3.5ppm O3P 3.5ppm or -80 – -110 ppm
Use optimized HH condition from 13C sensitivity experiment. For 13C{1H} experiment with 19F decoupling use cpfh1.av pulse program. For 13C{1H} experiment with 1H and 19F decoupling use cpfh.av pulse program. Set 19F carrier frequency on one of the 19F resonances.
7. Shimming a CP MAS probe
When shimming a high-resolution liquids probe there is a distinction between on-axis (Z) and off-axis (X, Y etc.) shims. Spinning the sample parallel to the magnetic field direction averages the off-axis inhomogeneity, which may result in spinning sidebands. In MAS spectroscopy the spinner axis is at an angle, θm with the magnetic field direction and the distinction between the traditional on-axis and off-axis shims no longer holds. The spinning rates in MAS spectroscopy, however, are typically at least a few kilohertz; much larger than the magnetic
Acceptance Solid State NMR Test Procedure Final test / Applications NMR
_______________________________________________________________________________ Index: 04 Number: B92999 Page: 36 (42)
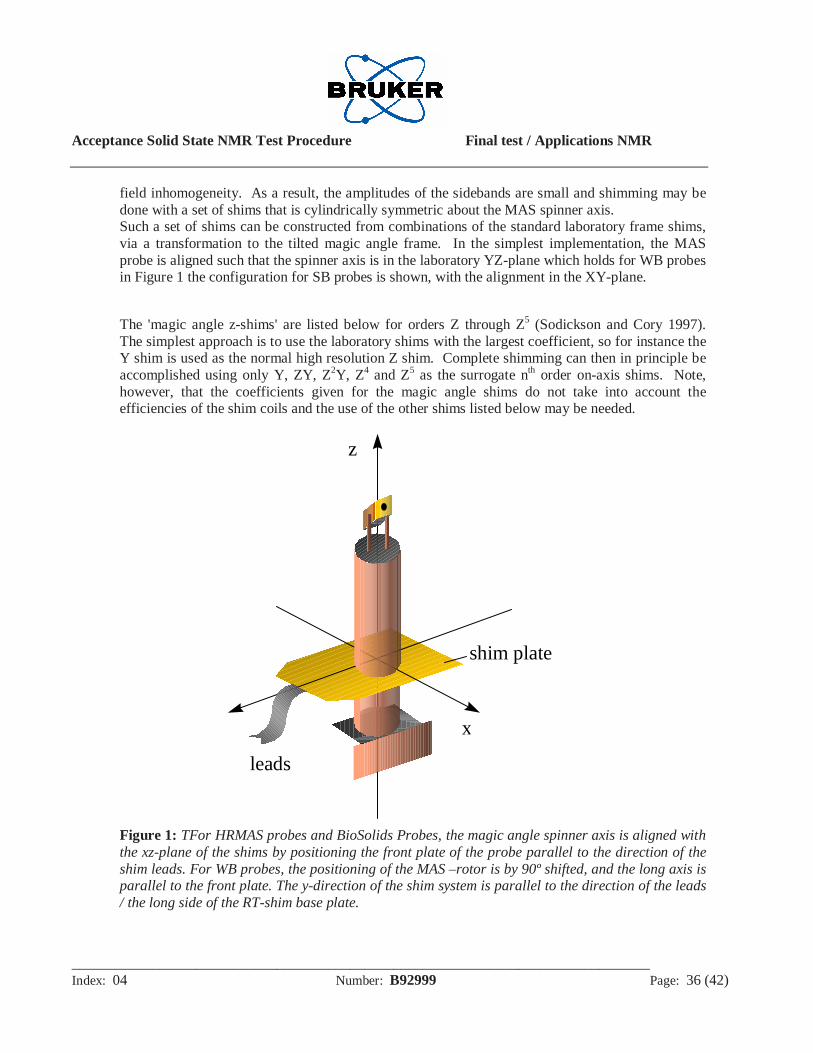
field inhomogeneity. As a result, the amplitudes of the sidebands are small and shimming may be done with a set of shims that is cylindrically symmetric about the MAS spinner axis. Such a set of shims can be constructed from combinations of the standard laboratory frame shims, via a transformation to the tilted magic angle frame. In the simplest implementation, the MAS probe is aligned such that the spinner axis is in the laboratory YZ-plane which holds for WB probes in Figure 1 the configuration for SB probes is shown, with the alignment in the XY-plane. The 'magic angle z-shims' are listed below for orders Z through Z5 (Sodickson and Cory 1997). The simplest approach is to use the laboratory shims with the largest coefficient, so for instance the Y shim is used as the normal high resolution Z shim. Complete shimming can then in principle be accomplished using only Y, ZY, Z2Y, Z4 and Z5 as the surrogate nth order on-axis shims. Note, however, that the coefficients given for the magic angle shims do not take into account the efficiencies of the shim coils and the use of the other shims listed below may be needed.
z
x
yshim plate
leads
Figure 1: TFor HRMAS probes and BioSolids Probes, the magic angle spinner axis is aligned with the xz-plane of the shims by positioning the front plate of the probe parallel to the direction of the shim leads. For WB probes, the positioning of the MAS –rotor is by 90º shifted, and the long axis is parallel to the front plate. The y-direction of the shim system is parallel to the direction of the leads / the long side of the RT-shim base plate.

Acceptance Solid State NMR Test Procedure Final test / Applications NMR
_______________________________________________________________________________ Index: 04 Number: B92999 Page: 37 (42)
MAS shims Laboratory shims Z
m
Y3
2Z
3
1 −
Zm2 ZY22)2Y-2(X −
Zm3 2Y
63
5-)Z2Y2(X
3
5+
6
13Z33
2- −− Y2Z
Zm4 - 7
18Z4
Zm5 -1
6 3Z5
To shim the MAS probe, a sample of adamantane is suggested. Make sure the magic angle is adjusted before shimming the probe. Spin the sample at a rate suggested in the following section. It is always best to shim up the probe already under the conditions used later for the real samples. See also chapter 4.4 and 4.5 for discussion regarding the use of direct polarization or cross polarization to shim. Cross polarization is needed if shimming a 2.5 mm CPMAS probe as it gives more signal intensity. Alternatively, make use of a lock control board if available, fill the rotor with D2O and lock through the X channel on D2O. Then, shimming on the lock signal is easily possible. Lock the sample if D2O is used, tune the probe and start shimming using the Y, ZY, Z2Y, Z4 and Z5 shims as described above. If one of the shims requires an excessive shim current, reduce the current and continue shimming by adding current to another shim from the same group as shown in the table. For instance if the current in ZX is too high, reduce the value and optimize the line shape by adding current to the (X2-Y2)Z shim. If the probe is not exactly aligned with the xz plane (see Figure 1), then a small amount of X and XZ may be needed for optimal shimming. A second shim set should be obtained for rotors with spacers (CRAMPS or hr-MAS rotors), and the optimal shim settings for these will be somewhat different. Under normal conditions the shim values obtained as described above, will be close to optimal for all other samples. When changing samples, only Y, Z (and ZY) need to be adjusted. Both shim value sets should be stored on disk. Make sure when the shim values are stored that the MAS probe is defined as the current probe in the EDHEAD command. Note: The alignment of the spinner axis in hr-MAS probes is shifted by 90 degrees. The spinner lies in the XZ plane. Through symmetry, the appropriate shims to use are now X, Z, XZ, XZ2 etc.. See table 3 in the reference.
Reference: A. Sodickson and D.G. Cory, Shimming a High-Resolution MAS Probe, J. Magn. Reson. 128, 87-91 (1997)
Acceptance Solid State NMR Test Procedure Final test / Applications NMR
_______________________________________________________________________________ Index: 04 Number: B92999 Page: 38 (42)
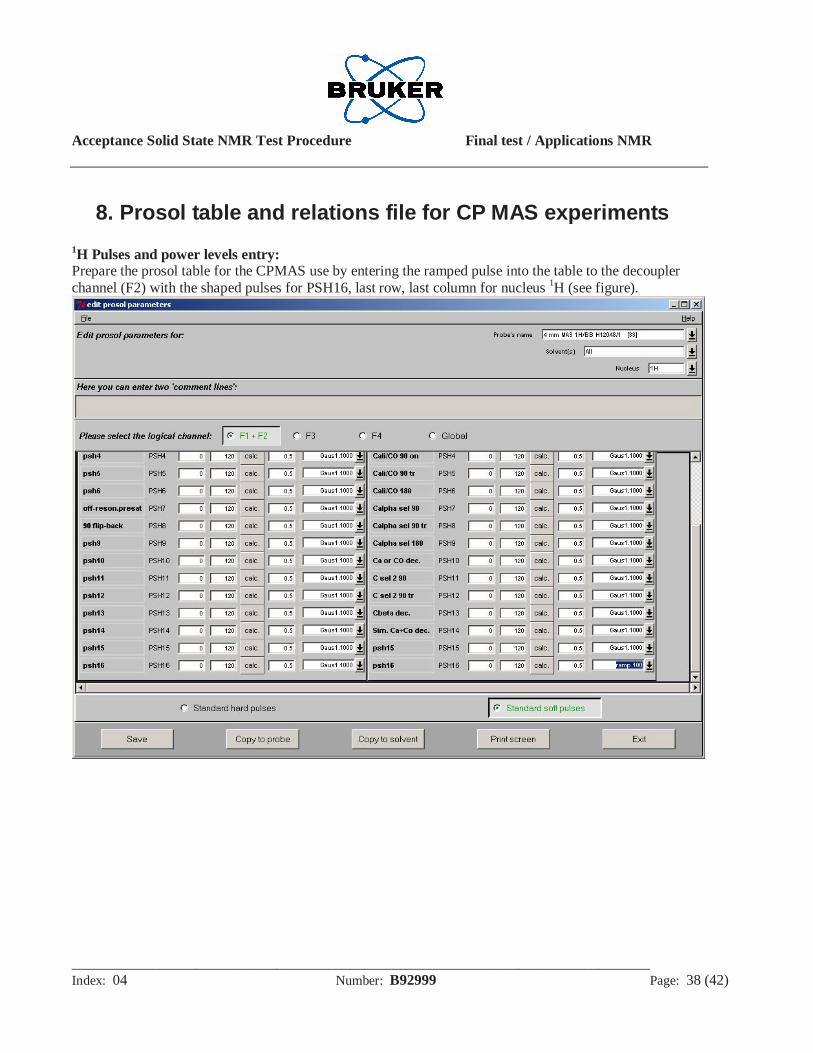
8. Prosol table and relations file for CP MAS experiments 1H Pulses and power levels entry: Prepare the prosol table for the CPMAS use by entering the ramped pulse into the table to the decoupler channel (F2) with the shaped pulses for PSH16, last row, last column for nucleus 1H (see figure).

Acceptance Solid State NMR Test Procedure Final test / Applications NMR
_______________________________________________________________________________ Index: 04 Number: B92999 Page: 39 (42)
Then return to the standard hard pulses. Write pulses and power levels into the prosol table as usual for the 1H experiment with adamantane into F1. Use for the decoupling pulse a pulse width of 120% as compared to the maximum possible decoupling field, i.e. for a 4mm WB CPMAS probe this would be 2.5us (100 kHz) for the maximum and then 3.1us (80kHz) for the entry into the field PCPDP. Enter the obtained value for the power level also into the next field for PLCPD2. If P3 is measured – during the CP experiments with glycine, this value is entered as P90 into the appropriate field on the right block, F2, with the power level from PL12 of the experiment, “1H on channel F2 routed to amplifier A2”. The power level for the contact pulse is calculated in the field PLNOE using 62500 Hz. The adjustment for the ramped contact pulse is done in the prosol file automatically during loading!

Acceptance Solid State NMR Test Procedure Final test / Applications NMR
_______________________________________________________________________________ Index: 04 Number: B92999 Page: 40 (42)
13C pulses and power levels: Enter the value for the 4us 90 degree pulse into the field for P90 and calculate the HH match power level for 62500 Hz in the field PLCW.
9. Listings: Relations file, pulse program:cp.av.xyz #******************************************************************* # # $Source: /sc/CvsTree/sc/gen/src/prg/scripts/tix/prosol/lib/lists/solids_cp,v $ # # Copyright (c) 1999 # BRUKER ANALYTIK GMBH # D-76287 Rheinstetten, Germany # # All Rights Reserved #

Acceptance Solid State NMR Test Procedure Final test / Applications NMR
_______________________________________________________________________________ Index: 04 Number: B92999 Page: 41 (42)
# # $Id: solids_cp,v 0.0.0 2003/04/26 14:48:33 bau Exp $ # #******************************************************************* #../conf/instr/spect/prosol/relations/solids_cp P[0]=P90[F1]; P[1]=P90[F1]; # 90 degree pulse at power level pl11 for x or y
# nucleus P[2]=P90[F1]*2; # 180 degree pulse at pl11 P[3]=PCPDP[F2]; # 90 degree pulse on 1H at pl12 P[4]=P90[F2]*2; # 180 degree pulse on 1H at pl12 P[11]=P90[F3]; # 90 degree pulse on F3 P[12]=P90[F3]*2; # 180 degree pulse for REDOR on F3 P[22]=P90[F2]*2; # 180 degree pulse for pi decoupling P[31]=PCPDP[F2]*2-0.2u; # TPPM decoupling pulse width PL[1]=PLCW[F1]; # power level for HH contact pulse F1 set to 62.5kHz PL[2]=PLNOE[F2]-3; # power level for HH contact pulse F2 62.5kHz -3dB as
# we use ramp.100 in parameter set which is a 6dB # amplitude change
# set PLNOE to 62.5kHz PL[3]=PL90[F3]; # power level for pulse on F3 PL[11]=PL90[F1]; # power level for hard pulse F1 PL[12]=PLCPDP[F2]; # set PLCPD to 80 kHz (3.1us pulse with for 4mm probe
#(80% of max. possible decoupling field PL[13]=PLHD[F2]; # power level for homonuclear decoupling, e.g FSLG set
# to 80 kHz SPNAM0=PNSH16[F2]; # set to ramp.100 as default for 1H on F2 P[15]=P_grad1*2; # HH contact pulse width for 1H-X polarization transfer
;cp.av prosol relations=<solids_cp> #include <lgcalc.incl> ;cnst20=RF field achieved at pl13 ;cnst24:additional LG-offset #include <trigg.incl> ;10 usec trigger pulse at TCU connector I cable 6 #include <tppm.incl>

Acceptance Solid State NMR Test Procedure Final test / Applications NMR
_______________________________________________________________________________ Index: 04 Number: B92999 Page: 42 (42)
1 ze ;accumulate into an empty memory if "aq < 1.0s" goto 2 print "acquisition time exceeds 1s time limit!" goto HaltAcqu 2 d1 do:f2 ;recycle delay, decoupler off in go-loop #include <prp15.prot> ;make sure p15 does not exceed 10 msec ;let supervisor change this pulseprogram if ;more is needed #ifndef lacq /* disable protection file for long acquisition change decoupling power !!! or you risk probe damage */ /* if you set the label lacq (ZGOPTNS -Dlacq), the protection is disabled */ #include <praq.prot> ;allows max. 50 msec acquisition time, supervisor ;may change to max. 1s at less than 5 % duty cycle ;and reduced decoupling field #endif 1u fq=cnst21:f2 10u pl12:f2 pl1:f1 ;preselect pl12 drive power for F2, pl1 for F1 trigg ;trigger for scope, 10 usec p3:f2 ph1 ;proton 90 pulse 0.3u (p15 ph2):f1 (p15:spf0 pl2 ph10):f2 ;contact pulse with square or ramp ;shape on F2, at pl2 proton power level 1u cpds2:f2 go=2 ph31 ;select appropriate decoupling sequence, cw or ;tppm, both executed at power level 12, or lgs ;executed at power level pl13 1m do:f2 ;decoupler off wr #0 ;save data to disk HaltAcqu, 1m ;jump address for protection files exit ;quit ph0= 0 ph1= 1 3 ph2= 0 0 2 2 1 1 3 3 ph10= 0 ph31= 0 2 2 0 1 3 3 1