Accenture Revealing Values New Energy Consumer
44
Revealing the Values of the New Energy Consumer Accenture end-consumer observatory on electricity management 2011
-
Upload
joaquin-perez-de-ayala -
Category
Documents
-
view
23 -
download
0
Transcript of Accenture Revealing Values New Energy Consumer
Revealing the Values of the New Energy ConsumerAccenture end-consumer observatory on electricity management 2011

Foreword 3
Accenture’s end-consumer research program 4
Key Finding No. 1 8While consumers regard their utilities as the primary provider for energy-related products and services, dynamic business models are emerging
Key Finding No. 2 16Price is the pivotal factor in the acceptance of electricity management programs, but price alone will not drive adoption
Key Finding No. 3 24A wide array of consumer preferences is driving the need for differentiated propositions and experiences
Key Finding No. 4 28Consumers will respond to programs that consider their full spectrum of values and preferences
Implications for utilities/electricity providers 38
Contents

Around the world, utilities/electricity providers are facing a broad spectrum of opportunities and challenges. As the industry continues to respond to concerns over climate change, security of supply and volatile energy prices, new opportunities are emerging due to the introduction of disruptive technologies and associated value-added products and services. Smart technologies are enabling a marketplace for in-home consumer technologies, demand-side management programs and related support services. However, proliferation in the ‘‘beyond-the-meter” market may also create new pressures from nontraditional players as diverse as product retailers to telecommunications companies. Accenture believes
that a combination of converging forces is evolving the new energy marketplace.
The utilities industry is currently faced with a broad range of perspectives on what utilities/electricity providers should focus on beyond the meter. Accenture’s experience working around the world with utilities/electricity providers and our ongoing global end-consumer research program has shown that no one approach fits for all providers, but certain market trends are emerging. To further our understanding of the new energy consumer landscape, Accenture is pleased to present the second installment in our multi-year research program—Revealing the Values of the New Energy Consumer.
Foreword
“As more consumers gain access to smart in-home technologies, utilities have the opportunity to offer new, value-added products and services in both regulated and competitive markets. However, these opportunities will likely attract new market players and may lead to industry convergence. Utilities that embrace the perceptions and behaviors of their consumers will ultimately generate the most value in the evolving energy marketplace.”
Greg Guthridge, global managing director, Accenture Retail and Business Services for Utilities

4
Accenture’s end-consumer research programTo help utilities/electricity providers meet the challenges and opportunities presented by the evolving energy marketplace, Accenture launched a multi-year global research program aimed at gaining a deeper understanding of consumers’ attitudes, opinions and preferences toward energy management programs. Completed in 2010, phase one of the program, Understanding Consumer Preferences in Energy Efficiency, was a global consumer survey that produced fascinating insights into consumer preferences in energy efficiency and their readiness and willingness to take action (see page 6 for more information).
To create a more comprehensive set of insights, in 2011, we moved on to phase two of the program—Revealing the Values of the New Energy Consumer—a research study among more than 10,000 end consumers
worldwide, to further explore their preferences, opinions and priorities toward the value they perceive in beyond-the-meter products and services. Through our latest research, Accenture set out to investigate:
• What are the energy consumer’s traditional and nontraditional values surrounding in-home technologies, electricity management programs, and related products and services?
• How much value do consumers place on smart home technologies, mobile applications and nontraditional channels?
• How can utilities/electricity providers differentiate electricity management programs?
• Do consumers value electricity management programs that are convenience-focused?
• Are consumers interested in the delivery of energy management programs through third parties?
The findings of the ongoing research program provide new insights into the opportunities for value creation in the evolving energy marketplace.

5
Countries included in the multi-year research program, with number of participants
2010 2011 2010 2011
Australia 500 500 Japan 530 530
Belgium - 512 Netherlands 500 544
Brazil 518 510 Singapore 501 510
Canada 500 500 South Africa 500 500
China 500 502 South Korea 500 537
Denmark 500 505 Spain 500 550
France 500 514 Sweden 514 511
Germany 513 500 United Kingdom
500 724
Italy 527 548 United States 1,005 1,202
Total 9,108 10,199
Revealing the Values of the New Energy Consumer
Our latest global survey is based on questionnaire-led interviews with 10,199 residential end customers in 18 countries, conducted for Accenture in December 2010 by Harris Interactive. The selected countries represent a range of regulated and deregulated markets. For countries with large and/or diverse populations, the participants were selected from a broad spectrum of locations.
The survey probed consumer attitudes toward electricity management programs and the beyond-the-meter market by asking attitudinal and behavioral questions, as well as demographic questions. The survey also presented choice-based questions about various combinations of six key components of electricity management programs. The information was evaluated using a conjoint analysis to understand how much consumers weight each component of a program in their adoption decision, to probe
consumer preferences among different options and to segment them according to their preferences.
The survey sample was statistically representative of the general population in each country, with the exceptions of Brazil, China and South Africa, where the sample was representative of the urban populations. Each survey was conducted online in local languages.
Understanding Consumer Preferences in Energy Efficiency
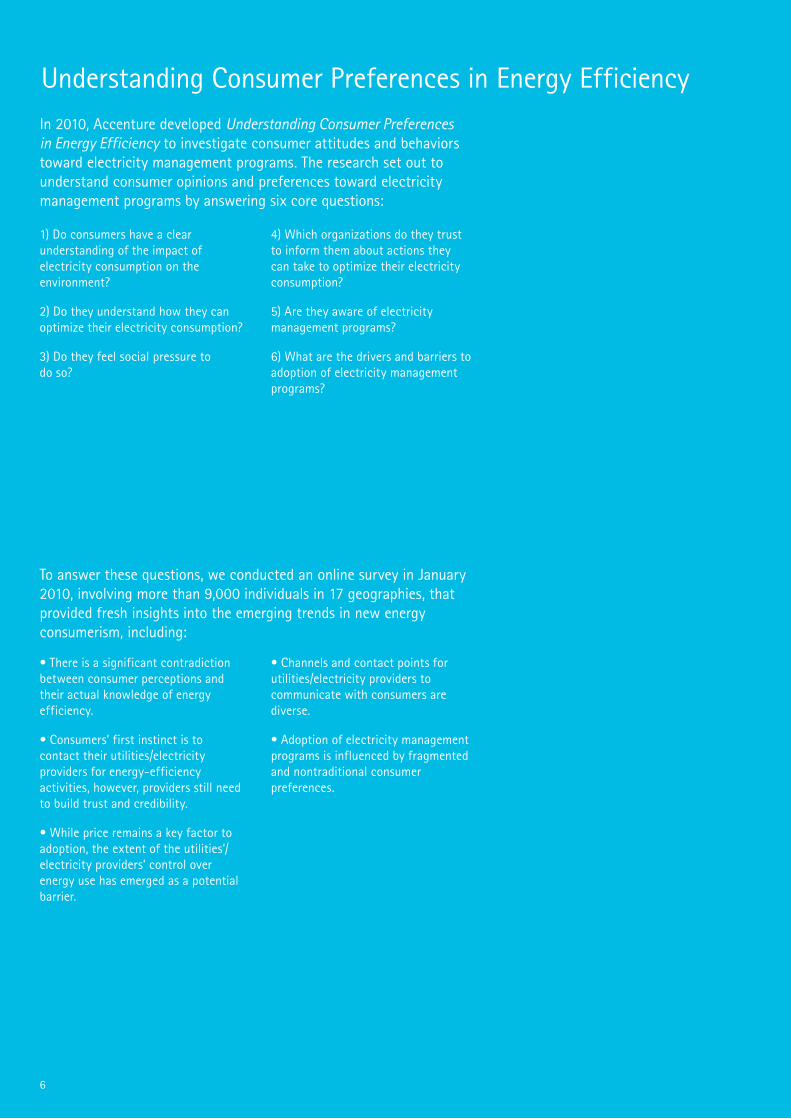
• There is a significant contradiction between consumer perceptions and their actual knowledge of energy efficiency.
• Consumers’ first instinct is to contact their utilities/electricity providers for energy-efficiency activities, however, providers still need to build trust and credibility.
• While price remains a key factor to adoption, the extent of the utilities’/electricity providers’ control over energy use has emerged as a potential barrier.
• Channels and contact points for utilities/electricity providers to communicate with consumers are diverse.
• Adoption of electricity management programs is influenced by fragmented and nontraditional consumer preferences.
1) Do consumers have a clear understanding of the impact of electricity consumption on the environment?
2) Do they understand how they can optimize their electricity consumption?
3) Do they feel social pressure to do so?
4) Which organizations do they trust to inform them about actions they can take to optimize their electricity consumption?
5) Are they aware of electricity management programs?
6) What are the drivers and barriers to adoption of electricity management programs?
In 2010, Accenture developed Understanding Consumer Preferences in Energy Efficiency to investigate consumer attitudes and behaviors toward electricity management programs. The research set out to understand consumer opinions and preferences toward electricity management programs by answering six core questions:
To answer these questions, we conducted an online survey in January 2010, involving more than 9,000 individuals in 17 geographies, that provided fresh insights into the emerging trends in new energy consumerism, including:


Key Finding No. 1While consumers regard their utilities as the primary provider for energy-related products and services, dynamic business models are emerging

Utility 73% 54% 67%
Your retailer 25% 50% 26%
Purchase electricity and choose an electricity pricing program for your home.
Purchase energy-efficient products (e.g., smart thermostat).
Get personalized information on your electricity usage allowing you to understand which appliances are using the most electricity.
23% 22% 27%Your phone or cable provider
21% 32% 29%Your online site (e.g., Amazon, Google)
Base: All respondents
Figure 1. Please select all of the providers that you would be ready to consider for the following products and services.
When consumers are asked which provider they would approach for energy-related services, products and advice, their first instinct is to go to their utility (see Figure 1). Almost three-quarters (73 percent) of the 10,199 respondents in our survey say they would first consider their utility for electricity purchasing and pricing choices. At the same time, two-thirds would look to their utility for personalized advice on usage, and 54 percent would even consider their utility as a source for energy-efficient products—a higher proportion than any other option.
However, these results mask a wide diversity of responses from different consumer groups by age and location. Across all three of the product and service choices in Figure 1, older consumers are more likely than their younger counterparts to consider their utility as the source. A similar split emerges between developed and emerging markets, with consumers living in developed markets proving consistently more likely to consider their utility than those in emerging markets.

Figure 2. You may currently, or in the future, have new companies offering you electricity, energy-efficient products (e.g., smart thermostat), and/or related services (i.e., customized information on your electricity consumption) on top of their traditional products and services. Would you consider purchasing electricity, energy-efficient products and/or related services from the following providers?
Respondents that would consider at least one provider (i.e., retailer, phone or cable provider, online site) other than a utility/electricity provider = 73%
45%Online site (e.g., Amazon, Google)
49%Phone or cable provider
Retailer 59%
Base: All respondents
Looking beyond the utility for beyond-the-meter purchases When asked directly, most consumers would be willing to consider alternative providers to their utility for purchasing both electricity and beyond-the-meter products and services. We outlined a current or future scenario in which consumers have new companies offering them electricity, energy-efficient products such as smart thermostats, and/or related services such as customized information on their electricity consumption, on top of the traditional products and services. As Figure 2 illustrates, some 73 percent of consumers would consider at least one provider other than their utility for these products and services. Retailers emerge as the top alternative choice, followed closely by phone or cable companies and then online providers. This finding is particularly interesting in the deregulated energy markets where regulatory frameworks
may provide fewer entry barriers for alternative providers to provide commodity services as well as value-added products and services.

Figure 3. Would you consider purchasing electricity, energy-efficient products and/or related services from retailers, phone or cable providers or online sites?
Respondents that would consider at least one provider (i.e., retailer, phone or cable provider, online site) other than a utility/electricity provider
23%
50%
59%
60%
60%
65%
68%
69%
73%
75%
77%
79%
82%
90%
91%
95%
96%
China 96%
74%
Japan
Average
Australia
Canada
Brazil
South Korea
United States
United Kingdom
France
Italy
South Africa
Singapore
Netherlands
Denmark
Germany
Belgium
Spain
Sweden
Base: All respondents
Figure 4. Would you consider purchasing electricity, energy-efficient products and/or related services from retailers, phone or cable providers or online sites?
%100
90
80
70
60
50
40
30
20
0
10
China Japan
Average
AustraliaCanada
Brazil
South KoreaUnited States
United Kingdom
FranceItaly
South Africa
Singapore
NetherlandsDenmark
Germany
BelgiumSpain Sweden
Retailer Phone or cable provider Online site Base: All respondents
A closer analysis of the responses reveals some significant variations between different consumer groups. Men, higher-income earners, younger consumers aged 25 to 34 years and people in emerging markets all tend to be more likely to consider alternatives to their utility. Consumers in China, South Africa and Singapore are the most willing to consider a nonutility when purchasing electricity, energy-efficient products and/or related services, while those in France and Belgium are least willing (see Figure 3).
Consumers in Singapore are the most likely to consider a retailer or phone/cable provider, those in Brazil are the most willing to consider an online site (see Figure 4).

Figure 5. When are you most likely to be interested in learning about electricity management programs?
Top three moments of truth*
Base: All respondents*All moments of truth appeared among respondents’ top three
53%When I am purchasing new appliances/household electronics
46%When I get my bill
61%When my electricity prices increase
28%When I am renovating my home
3%When I meet with a community organization that I belong to
42%When I am moving into a new home
12%When I sign up for telephone or internet service
55%When I sign up for electricity service
Consumers’ interest in learning about electricity management programs can be met by specific events and providers (see Figure 5). While the utilities/electricity providers are well-positioned to connect with consumers during their top two preferred moments of truth, alternative providers have the opportunity to also reach consumers at key moments during the decision-making process.

Figure 6. What organizations do you trust to inform you about actions you can take to optimize your electricity consumption?
Base: All respondents
49%
53%
51%
28%
29%
20%
13%
13%Retailers/equipment manufacturers 28% 58% 14%
Home service providers (e.g., cable television provider, telecommunications provider, etc.)
28% 57% 15%
Online service providers (e.g., Google, Microsoft) 16% 62% 22%
Utilities/electricity providers 25% 47% 28%
Government/governmental organizations 25% 45% 30%
Academics/schools/scientific associations 6% 41% 53%
Environmental associations 10% 36% 54%
Consumer associations 6% 39% 55%
TrustDo not trust
2011 2010 (% trust)
Neither trust nor distrust
Consumer trust: utilities’/electricity providers’ lead narrows slightlyUtilities/electricity providers enjoy a stronger base of trust among consumers than other potential providers (see Figure 6). However, utilities/electricity providers are less trusted by consumers than those organizations perceived as taking an independent view on energy matters, such as consumer associations, environmental associations, academic institutions or government. Similar to our findings in 2010, utilities/electricity providers have the opportunity to increase the level of consumer trust when it comes to both engaging consumers and remote control over home appliances and devices.
However, these results also contain some less positive messages for utilities/electricity providers. Consumers’ level of trust in utilities/electricity providers has declined slightly over the past year despite additional investment, while trust in each of their potential competitors has increased marginally during the same period. The trust advantage that has existed for utilities/electricity providers is gradually narrowing—suggesting they would be well-advised to continue engaging consumers to reinforce their status as a trusted advisor.

Figure 7. Do you trust your utilities/electricity providers to inform you about actions you can take to optimize your electricity consumption?
Base: All respondents
Trust - 2011 Trust - 2010
41%40%China
34%33%Japan
23%20%Australia
31%26%Canada
Brazil
40%47%South Korea
29%28%United States
19%France
34%
32%32%
32%
32%South Africa
54%54%Singapore
24%Belgium
Spain 18%21%
Netherlands 29%20%
United Kingdom 17%16%
Germany 10%14%
Sweden 16%14%
Italy 21%14%
Average 29%28%
Denmark 39%40%
Observing the levels of trust voiced by consumers in different countries, it is clear that trust in utilities/electricity providers tends to be more volatile in those geographies with active energy-efficiency and pricing programs in place. Between our 2010 and 2011 studies, trust in utilities/electricity providers improved significantly in countries including France, South Korea and Germany. In contrast, trust in these providers declined in countries such as the Netherlands, Italy and Canada (see Figure 7).


Key Finding No. 2Price is the pivotal factor in the acceptance of electricity management programs, but price alone will not drive adoption

Figure 8. What factors would most encourage you to use electricity management programs?
Top three factors*
Base: All respondents
*All factors appeared among respondents’ top three
68%
51%
It would better allow me to control the heating/cooling in my home
41%
38%
It would decrease the time required to manage my electricity use
91%
88%It would decrease the amount of my electricity bill
16%
9%
Knowing that I am one of the highest electricity users in my peer group
69%
66%It would decrease my personal environmental impact
20102011
Figure 9. When consumers make decisions regarding electricity management programs, they place different levels of importance on the components.
Program
Impact on your electricity bill
Program elements:• Information display • Service • Usage adjustment • Provider • Loyalty rewards
Impact on your electricity bill choices:• 15% reduction • 5% reduction• No change• 5% increase
Base: All respondentsMethodology note: Results based on a conjoint analysis
17%
83%
The consumers participating in our study say the opportunity to reduce their electricity bill remains the most important fact that would encourage them to adopt an electricity management program (see Figure 8). However, other factors are also gaining in importance, especially the opportunity to gain greater control over domestic heating and cooling.
As Figure 9 illustrates the “impact on the electricity bill” receives the greatest weight at 83 percent of the decision to adopt, while the aggregate of the program elements (usage adjustment, provider, information display, service and loyalty rewards) weighted at 17 percent. The finding illustrates that price alone is not necessarily enough to entice consumers to adopt a program. Consumers require other program elements to be fully satisfied with the value offered by an electricity management program.

Figure 10. When consumers make decisions regarding electricity management programs, they place a decreasing level of importance on the reduction of the bill.
60%
Base: All respondentsMethodology note: Results based on a conjoint analysis. Simulation test with “Existing device, full set up, manual adjustment, single provider, with loyalty rewards.”
100%
90%
80%
70%
60%
50%
29%
33%39%
47%
57%
65%
81%85% 89% 90%
94%
73%
40%
30%
20%
0%
10%
% of adoption (certainly and probably)
5% 4% 3% 2% 1% 0% 1% 2% 3% 4% 5% 6% 7% 8% 9% 10% 11% 12% 13% 14% 15%
% increase on the electricity bill % reduction on the electricity bill
However, when looking more closely at the weighting on the impact on the electricity bill, surprisingly, up to 29 percent of consumers would adopt a program that increased their bill by 5 percent (see Figure 10). Furthermore, when consumers make decisions regarding electricity management programs, they seem to place a decreasing level of importance on the reduction of the bill. For utilities/electricity providers, it would appear that differentiation beyond price may become an important facet in developing products and services for the new energy consumer.

Figure 11. Relative importance (weight) of each component in the decision to adopt electricity management programs.
Program elementsImpact on your electricity bill
Italy 27%73%
France 33%67%
Belgium 25%75%
Canada 21%79%
Denmark 21%79%
Singapore 21%79%
United States 20%80%
Germany 19%81%
South Africa 18%82%
Average 17%83%
Netherlands 16%84%
Australia 16%84%
South Korea 16%84%
Sweden 16%84%
United Kingdom 15%85%
Brazil 14%86%
Spain 12%88%
Japan 8%92%
China 18%82%
Base: All respondents
In contrast to some other question areas in the research, the importance of the impact on the bill is reasonably consistent across geographies. At the top end of the spectrum, Japan and Spain place the most weight on the impact on the electricity bill, while on the other end of the spectrum, Italy and France place the least (Figure 11).

Figure 12. Consumers place different levels of importance (weight) on the program elements.
Base: All respondentsMethodology note: Results based on a conjoint analysis
Usage adjustment To optimize your electricity bill, you have to change the time at which you use some appliances (e.g., heating/cooling of your home, dishwasher and clothes-washing machine). You have the choice between manual turn-on/off (based on real-time pricing information) or automatic turn-on/off through a device.
Provider You can receive your device, information and pricing program from a single provider or multiple providers.
Information displayThe program gives you the ability to monitor and adjust your electricity usage through a device. This device may be a separate unit that only provides information on your electricity usage, or may be incorporated into already existing devices in your home (i.e., computer, television, telephone or mobile device).
ServiceYou may choose to set-up and service the device(s) on your own, or you may choose to have a certified technician do it for you.
Loyalty rewardsYou may have an opportunity to enroll in a rewards program. This rewards program will allow you to collect points which can be redeemed for goods and services (e.g., travel and personal electronics).
Usage adjustment4%
Provider9%
Information display10%Service30%
Loyalty rewards47%
Relative importance of each element in the decision to adopt electricity management programs
Weighting the elements beyond priceAside from price, we tested five elements that might encourage a consumer to adopt an electricity management program. These are: the option to adjust usage to optimize the time when appliances are used; the number of providers; an information display, enabling monitoring and management of usage; service options for setting up and servicing devices; and loyalty rewards. In Figure 12, we have analyzed our consumers’ responses to understand the weighting for each of these nonprice elements within their decisions on whether to adopt an electricity management program. As this weighting shows, loyalty rewards represent the most important nonprice consideration, while usage adjustment is the least important.

Figure 13. Relative importance (weight) of each element in the adoption of electricity management programs.
Netherlands 23%35%11%21%10%
France 20%28%11%41%
Sweden 24%48%8%19%
1%
Italy 29%23%20%27%
1%
South Korea 35%16%12%15%22%
Canada 36%22%9%4%29%
Japan 38%19%11%16%16%
Denmark 39%42%11%
3%
5%
United States 41%18%9%5%27%
Australia 45%28%7%13%7%
Germany 47%32%13%6%
2%
Singapore 48%33%
2%
10%7%
Brazil 49%22%17%5%7%
Spain 49%23%20%
1%
7%
China 52%23%4%20%
United Kingdom 13%
South Africa 71%14%4%9%
2%
Belgium 42%40%
1%
14%
3%
Average 47%30%10%9%4%
1%
65%16%5%
1%
Loyalty rewardsServiceInformation displayProviderUsage adjustment
Base: All respondentsMethodology note: Results based on a conjoint analysis
As previously highlighted, the level of importance consumers attach to the effect of electricity management programs on their bill is quite consistent across different geographies worldwide.However, the importance of the other program elements fluctuates significantly between different countries, reflecting local priorities. For example, “usage adjustment” is regarded as especially important by consumers in Canada, the United States, South Korea and China; the “provider” in France, Italy, Netherlands and Sweden; the “information display” in Italy, Spain and Brazil; “service” in Sweden, Denmark, Belgium, Netherlands, Singapore and Germany; and “loyalty rewards” in South Africa, the United Kingdom and China (see Figure 13).
These differences underline the need for utilities/electricity providers to tailor electricity management programs to match consumer priorities.
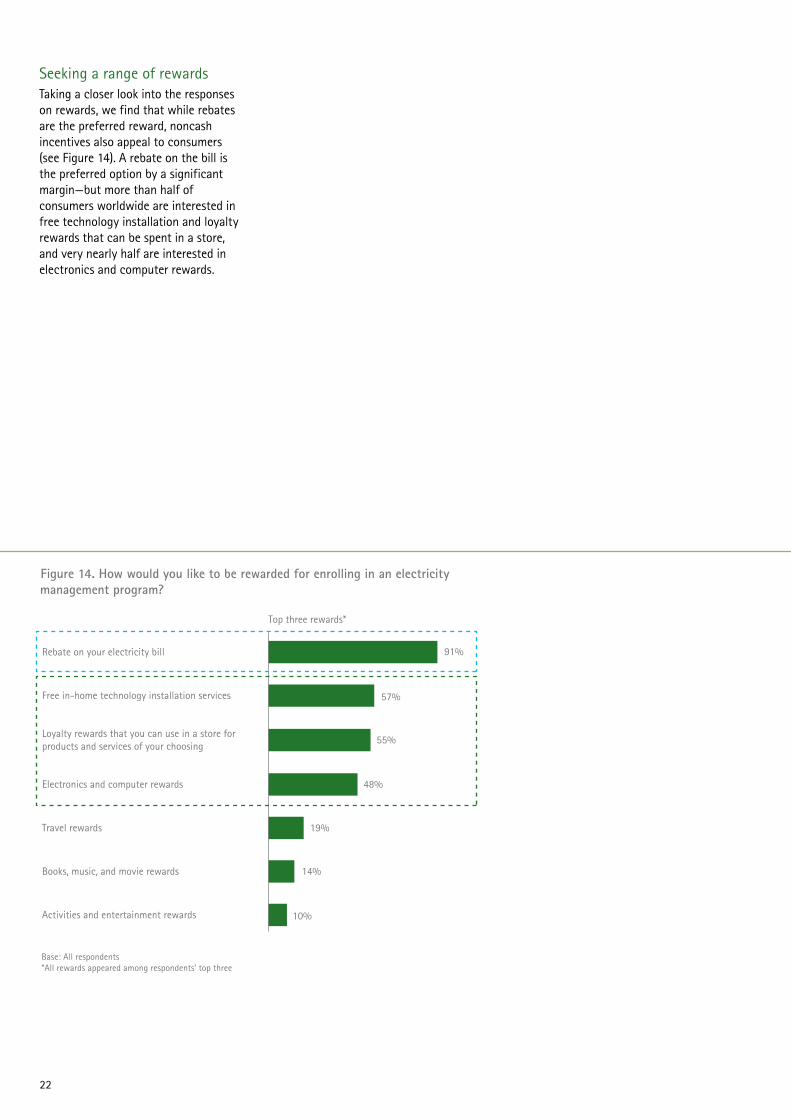
Figure 14. How would you like to be rewarded for enrolling in an electricity management program?
Top three rewards*
Base: All respondents*All rewards appeared among respondents’ top three
19%Travel rewards
14%Books, music, and movie rewards
91%Rebate on your electricity bill
10%Activities and entertainment rewards
55%Loyalty rewards that you can use in a store for products and services of your choosing
48%Electronics and computer rewards
57%Free in-home technology installation services
Seeking a range of rewardsTaking a closer look into the responses on rewards, we find that while rebates are the preferred reward, noncash incentives also appeal to consumers (see Figure 14). A rebate on the bill is the preferred option by a significant margin—but more than half of consumers worldwide are interested in free technology installation and loyalty rewards that can be spent in a store, and very nearly half are interested in electronics and computer rewards.
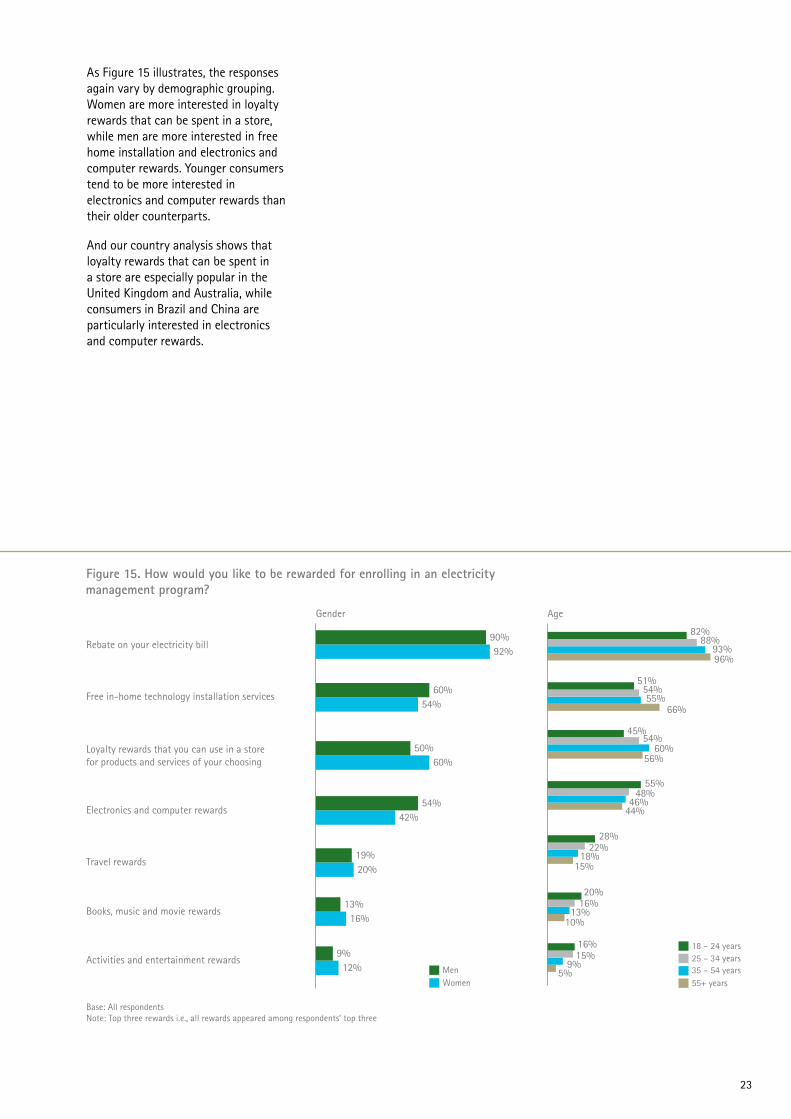
Figure 15. How would you like to be rewarded for enrolling in an electricity management program?
MenWomen
35 – 54 years55+ years
18 – 24 years25 – 34 years
39%41%90%92%42%
Rebate on your electricity bill
Gender Age
19%20%
Travel rewards
13%16%
Books, music and movie rewards
9%12%
Activities and entertainment rewards
45%54%
60%56%
20%16%
13%10%
16%15%
9%5%
23%82%
88%93%96%
Base: All respondentsNote: Top three rewards i.e., all rewards appeared among respondents’ top three
39%
60%54%
Free in-home technology installation services
50%60%
Loyalty rewards that you can use in a store for products and services of your choosing
54%42%
Electronics and computer rewards
55%48%
46%44%
28%22%
18%15%
51%54%55%
66%
As Figure 15 illustrates, the responses again vary by demographic grouping. Women are more interested in loyalty rewards that can be spent in a store, while men are more interested in free home installation and electronics and computer rewards. Younger consumers tend to be more interested in electronics and computer rewards than their older counterparts.
And our country analysis shows that loyalty rewards that can be spent in a store are especially popular in the United Kingdom and Australia, while consumers in Brazil and China are particularly interested in electronics and computer rewards.

Key Finding No. 3 A wide array of consumer preferences is driving the need for differentiated propositions and experiences

Building on the insights of our previous consumers segments illustrated in Understanding Consumer Preferences in Energy Efficiency, our latest research illustrates how consumer preferences are evolving. To generate deeper insights into consumers’ priorities around the various elements of an electricity management program, we have analyzed the interrelationships between their responses across the full spectrum of adoption variables—namely information display, service/set-up, usage adjustment, provider and loyalty rewards. This has enabled us to identify a balanced distribution of six core consumer segments, each accounting for between 13 and 22 percent of our entire consumer sample, and each present to varying degrees in every country in our study (see Figures 16 and 17).
For a closer look at each segment, highlighting their adoption characteristics and demographic mix, see pages 26 and 27.
Figure 16. Six core consumer segments.
Base: All respondentsMethodology note: Results based on a conjoint analysis
Self-reliants
Social independents
Cost-sensitives
Service-centrics
Traditionalists
Tech-savvys
13%
18%
22%18%
15%
14%
Figure 17. The six segments are present in all countries.
Self-reliants
Social independents
Cost-sensitives
Service-centrics
Traditionalists
Tech-savvys
United States 20%15%23%17%14%11%
Canada 12% 17% 14% 22% 15% 20%
Australia 16%15%23%15%16%15%
Denmark 15% 10% 25% 20% 16% 14%
Netherlands 14%21%13%21%18%13%
Germany 13% 10% 20% 25% 18% 14%
Brazil 13%26%26%14%9%12%
South Africa 12%18%32%13%11%14%
Italy 17% 20% 17% 13% 20% 13%
United Kingdom 11%18%28%14%17%12%
Spain 13% 15% 18% 20% 23% 11%
Sweden 11%20%14%21%20%14%
Singapore 13% 9% 25% 31% 13% 9%
China 17% 13% 17% 26% 19% 8%
Japan 18% 14% 17% 17% 25% 9%
South Korea 25% 10% 15% 20% 20% 10%
Belgium 11%18%18%23%17%13%
France 11%11%10%22%31%15%
Average 14% 15% 18% 22% 18% 13%
Base: All respondentsMethodology note: Results based on a conjoint analysis

Self-reliants—13 percent
"I prefer to manage my electricity consumption on my own”
Adoption attributes Self-reliants exhibit the highest willingness to manually manage their appliances based on real-time pricing information. They also show higher interest in monitoring and adjusting their electricity usage through an existing device.
They are more uncomfortable than the average consumer about sharing data with a third party for commercial purposes, but have a higher readiness to purchase energy-efficient products from online sites.
DemographicsSelf-reliants have a higher proportion of women and have a higher proportion of consumers who are 55 years old or older.
Social independents—18 percent
"I like testing new technologies”
Adoption attributesSocial independents express the highest interest in personally setting up their in-home device, and are more interested than other consumers in monitoring and adjusting their electricity usage through a new device. They also exhibit the highest interest in receiving their device, information and pricing program from multiple providers.
They are relatively uncomfortable about sharing data with a third party to make a program work, and while they generally have the lowest interest in loyalty rewards, they would value electronics/computer rewards. They are more likely to be dissatisfied about poor communication of changes to the program.
DemographicsSocial independents have a higher proportion of men, and are found at all ages and levels of income. They value a program that allows them to connect with a community and share experiences, and like the idea that a program would be regarded as “trendy” by family and friends.
Cost-sensitives—22 percent
"I look above all for the best financial rewards”
Adoption attributesCost-sensitives have the highest level of interest in loyalty rewards, especially loyalty rewards that can be used in a store for products and services of their choosing. They also exhibit the highest sensitivity to a program that would reduce their bill. An increase in their bill is likely to act as a catalyst to make them eager to learn about a program, and they are especially interested in programs that can be customized to their personal needs and usage.
DemographicsCost-sensitives have a higher proportion of women, and include a relatively high proportion of consumers who are 25 to 34 years old. This segment has a higher than average share of lower-income consumers.

Service-centrics—18 percent
"I want the best service for my family and me.”
Adoption attributesService-centrics are the segment most interested in full set-up of the device and assistance by a certified technician, and exhibit the highest sensitivity for a program that would allow them to better control the heating/cooling of their home. Their interest in learning about a program is more likely to be stimulated by moving into a new home.
They are more likely than the average consumer to be dissatisfied by a program with poor customer support and poor product installation, and have the highest preference for dealing with their utilities/electricity providers. They also express higher interest in a program that is easy to use for the whole family, and in an in-home device display installed at no cost.
DemographicsService-centrics have a higher proportion of women, and are spread across all ages and income levels.
Traditionalists—15 percent
"I prefer a familiar experience”
Adoption attributesTraditionalists have the highest interest in receiving their device, information and pricing program from a single provider, and represent the segment most likely to purchase energy-efficient products from their utilities/electricity providers. Similarly, they have lower readiness to go to a retailer, telephone/cable provider or online site to purchase electricity, energy-efficient products, and/or related services. They are more likely to be interested in learning about a program when they are renovating their home.
DemographicsTraditionalists are divided equally between the genders and levels of income, but have a higher proportion of consumers who are 55 years old or older.
Tech-savvys—14 percent
"I value convenience and efficiency”
Adoption attributesTech-savvys represent the segment with the highest interest in automatic management of their appliances by a device, and are generally more interested than other consumers in full set-up of the device and assistance by a certified technician. They are the segment most likely to install a “SetAndForget” program that switches their devices on and off automatically, and have the highest interest in monitoring their consumption on their mobile telephone or another personal electronic device. Tech-savvys also exhibit the highest readiness to consider online sites for purchasing electricity, energy-efficient products and/or related services.
DemographicTech-savvys have a higher proportion of men. They include relatively high proportions of consumers 25 to 34 years old and who are high-income earners. They are more likely to choose a program that simplifies their life.

Key Finding No. 4 Consumers will respond to programs that consider their full spectrum of values and preferences

Figure 18. How important would each of the following characteristics be in your selection of an electricity management program?
Base: All respondents
51%Includes the latest technologies 36% 15%
47%Allows me to connect with a community to share experience and tips
11%36%
92%42% 50%Is customized to my personal needs and usage
18% 6% 24%Is regarded as trendy by my family and friends
40% 49% 89%Is easy to use for the whole family
14%39% 53%Is fun to use
45%45% 90%Simplifies my life
Somewhat important Very important
In planning, developing and marketing electricity management programs, it is important to remember that consumers are complex individuals with distinct and often idiosyncratic needs and requirements. With this in mind, it is significant that the characteristic they value most highly in an electricity management program is that it is customized to their personal needs and usage. Our respondent consumers also further underline the need for tailored solutions by expressing interest in a broad set of unconventional values and preferences, many of which are more emotional in nature than practical or financial.
Figure 18 illustrates some of these preferences. The abilities of a program to “simplify my life” and be “easy to use for the whole family” are nearly as important as its being “customized to my personal needs and usage.” More than half of consumers also want a program that is “fun to use,”
narrowly ahead of “including the latest technology” and enabling “sharing of experience and tips” with a community. Nearly one-quarter of respondents regard it as important that that their program is regarded as “trendy” by friends and family, underlining the potential power of strong brands in this space.
Again, there are significant demographic variations. More men than women believe it is important that programs include the latest technologies, while more women than men are looking for programs that simplify their lives and are easy for the whole family to use. Younger respondents are especially keen on programs that use the latest technologies, are fun to use and are regarded as trendy. Lower-income respondents are more interested in being able to connect with a community to share experience and tips. Consumers in emerging markets are also keen on programs that enable
them to connect with a community, as well as includes the latest technologies, being fun to use and being regarded as trendy.

Figure 19. Would you be interested in any of the following functionalities/features that may be included with an electricity management program?
Base: All respondents
60%Technology that can completely automate the management of my electricity
36%Monitoring and managing my usage through the latest personal electronics (e.g., tablet PC)
35%The ability to customize the design of the in-home display or the online portal of my electricity management program
32%Applications I can download on my mobile phone to measure my personal electricity consumption in real time
Family activities/games around electricity consumption (e.g., contest on who is consuming the least each week)
20%
Automatic integration of my electricity usage with popular social Internet websites (e.g., Facebook, Twitter) which allows me to share and compare my success against friends
13%
Yes
Figure 20. Would you be interested in any of the following functionalities/features that may be included with an electricity management program?
39%31%
Base: All respondents
The ability to customize the design of the in-home display or the online portal of my electricity management program
36%29%
Applications I can download on my mobile phone to measure my personal electricity consumption in real time
64%56%
Technology that can completely automate the management of my electricity
15%12%
Automatic integration of my electricity usage with popular social Internet websites (e.g., Facebook, Twitter) which allows me to share and compare my success against friends
20%21%
Family activities/games around electricity consumption (e.g., contest on who is consuming the least each week)
41%31%
Monitoring and managing my usage through the latest personal electronics (e.g., tablet PC)
WomenMen
The importance of technologyA common theme running though all of these findings is the importance of program components that are enabled by technology, such as customization and ease of use. The importance that consumers attach to technology as a key component of electricity management programs is reinforced by the findings illustrated in Figure 19, where we ask our respondents whether they would be interested in a defined list of additional functionalities and features.
In general, interest in technology solutions tends to be greater among men. Globally, some 60 percent of all consumers—including 64 percent of male consumers and 66 percent of high-income earners—are interested in technology that can completely automate the management of the electricity they use. In aggregate, these findings point toward a large segment of the population who are convenience-oriented and thus prefer programs that contain “SetAndForget” functionality. More than one-third (36 percent) of consumers, including 41 percent of men, would be interested in being able to monitor and manage their usage through the latest personal electronics, such as tablet computers. And 32 percent (including 36 percent of men) would like to be able to measure their personal electricity usage in real time using a mobile application (see Figures 19 and 20).

Figure 21. Would you be interested in any of the following functionalities/features that may be included with an electricity management program?
Technology that can completely automate the management of my electricity
Monitoring and managing my usage through the latest personal electronics
The ability to customize the design of the in-home display
Applications I can download on my mobile phone to measure my personal electricity consumption
Family activities/games around electricity consumption
Automatic integration of my electricity usage with popular social Internet websites
65
%60%60%60%
58%
35%
44%
42%
26%
40%
38%
30%
33%
50%
44%
29%
17%
27% 23%
20%
11%
6%
30%
20%
9%
60
55
50
45
40
35
30
25
20
15
10
5
0
18 – 24 years 35 – 54 years 55+ years25 – 34 years
Base: All respondents
The idea of a mobile application that monitors personal power consumption is especially popular in emerging markets, where 60 percent express an interest in it, compared to just 26 percent in developed markets. While the percentage of respondents interested in technology that can completely automate the management of their electricity is relatively constant at around 60 percent across age groups, there is a marked difference in other areas. For example, where 50 percent of 18 to 24 year-olds and 44 percent of 25 to 34-year-olds are interested in applications they can access from their mobile phone to measure their personal consumption, only 17 percent 55 years or older indicate an interest (see Figure 21).

Base: All respondents
No
Yes
63%
37%
Figure 22. Some electricity providers may need to work with third parties to deliver electricity management programs. With your consent, these third parties may have access to your usage data to make the program work. Would this prevent you from signing up?
Sharing personal data: a smaller obstacle than anticipated?While consumers do think of their utilities/electricity providers first for energy-efficiency information and energy-related products and services, they are in the middle of the pack when it comes to the level of consumer trust. Furthermore, Understanding Consumer Preferences in Energy Efficiency found that the extent of utilities’/electricity providers’ control over energy use was almost equally weighted by consumers as the impact on the electricity bill. Consumers may be influenced by factors such as remote adjustments by the utility of personal home appliances, data privacy and security, lifestyle implications and the idea of the utility or other third parties watching over their energy use. The results of our previous research highlighted that many consumers prefer to maintain ultimate control over their home and require the ability to override any external control factors.
Interestingly, our follow-up research illustrates that to operate electricity management programs some consumers may “opt-in” to allow third-party providers access to personal usage information if they perceive value. As Figure 22 illustrates, 63 percent of our respondents say that the prospect of approved third parties gaining access to their usage data under an electricity management program to make the program work would not prevent them from signing up for it. Interestingly, a higher proportion of younger respondents and low-income earners would be reluctant to give access to a third party.

Figure 23. Some electricity providers may need to work with third parties to deliver electricity management programs. With your consent, these third parties may have access to your usage data to make the program work. Would this prevent you from signing up?
No Base: All respondents
77%Denmark
72%South Africa
72%Sweden
69%Japan
67%United States
67%Belgium
66%Australia
66%Spain
64%Singapore
64%Italy
63%Average
63%United Kingdom
62%Canada
61%Germany
61%South Korea
58%France
55%Brazil
53%Netherlands
41%China
Figure 24. If you provide consent, your utility may share your personal information with third parties. These third parties may come back to you to offer additional services outside of the electricity management program to help you save on your electricity bill. Would this prevent you from signing up for an electricity management program?
Base: All respondents
No
Yes
48%
52%
And consumers in emerging markets are relatively less willing than those in developed countries to allow third-party access—especially in China (41 percent saying this would not prevent them from signing up). Danish consumers are the most willing to share their usage data with third parties, with 77 percent saying this would not stop them joining a program (see Figure 23).
Moreover, 48 percent of consumers state that third parties having access to their personal information for the purposes of offering additional services to help them save on their electricity bill would not prevent them from signing up for an electricity management program (see Figure 24). As before, a higher proportion of younger respondents, low-income earners and consumers in emerging markets would be reluctant to give access to third parties under these circumstances.
The implication for utilities/electricity providers is that consumers will opt-in and share personal usage information when they first trust their electricity provider and when the utility can clearly explain and alleviate concerns related to the level of control implicit in the program offer.

Figure 25. In the future, the price you pay for electricity will change throughout the day. Electricity could be more expensive in the morning and cheaper at night (this may already be the case in your country). This new pricing can save you money on your electricity bill if you actively manage the hours at which you use major appliances. If you don’t, your electricity bill will increase. Given this electricity pricing, changes in behavior could have an impact on your electricity bill. Please select your preferred response.
I turn on or off preselected appliances four times a day, resulting in a 15-percent savings on my electricity bill
Base: All respondents
I install a smart device that automatically turns on or off preselected appliances resulting in a 5-percent savings on my electricity bill (SetAndForget program)
I don’t take any actions resulting in no savings or even an increase in my bill of up to 10 percent
55%
35%
10%
Figure 26. In the future, the price you pay for electricity will change throughout the day. Electricity could be more expensive in the morning and cheaper at night (this may already be the case in your country). This new pricing can save you money on your electricity bill if you actively manage the hours at which you use major appliances. If you do not, your electricity bill will increase. Given this electricity pricing, changes in behavior could have an impact on your electricity bill. Please select your preferred response.
I turn on or off preselected appliances four times a day, resulting in a 15-percent savings on my electricity bill
Base: All respondentsNote: Low income = bottom 25% in each country; medium income = 50% in each country; high income = top 25% in each country.
I install a smart device that automati-cally turns on or off preselected appliances resulting in a 5-percent savings on my electricity bill (SetAndForget program)
I don’t take any actions resulting in no savings or even an increase in my bill of up to 10 percent
Income
35%
10%
Medium
55%58%
29%
13%
Low
41%
8%
High
51%
More convenience at a premiumA further significant behavioral finding is that nearly half of all consumers would also opt for more convenience at a premium. In Figure 25, we outlined a scenario in which consumers are effectively given a straight choice between three options: turning devices off themselves four times a day to save 15 percent off their bill; installing a smart device to save 5 percent; or taking no action and paying an extra 10 percent.
As Figure 25 illustrates, 55 percent of consumers opt for the option of turning devices off themselves to save 15 percent. This group includes a higher number of lower-income consumers.
In contrast, high-income consumers are more likely than other groups to be among the 35 percent opting for a smart device-enabled SetAndForget program that automatically turns devices on or off to save 5 percent (see Figure 26).

Figure 27. How would you want to purchase a SetAndForget program?
63% prefer interactingwith a staff member to purchase a SetAndForget program
Base: All respondents interested in SetAndForget program
With a staff member over the telephone
With a staff member at my place of residence
With a staff member at an in-store location
Online with no interaction with a staff member
9%
25%
38%
28%
Figure 28. Some programs allow you to purchase energy-efficient products (e.g., smart thermostat) at a discount. How would you want to purchase such a product?
66% prefer interacting with a staff member to purchase energy-efficiency products
Base: All respondents
With a staff member over the telephone
With a staff member at my place of residence
With a staff member at an in-store location
Online with no interaction with a staff member
5%
14%
52%
29%
Face-to-face has reemerged More than one-third of consumers are ready to sign up for SetAndForget programs. But how would they like to buy them? As Figure 27 illustrates, this is a transaction where many consumers want the comfort and reassurance of face-to-face contact with a person. Some 63 percent of all consumers would prefer to interact with a staff member to buy a program, whether in a store location or at home. Only 28 percent would like to buy a SetAndForget program online with no personal interaction. Interestingly, a higher proportion of younger respondents would purchase their SetAndForget program in a store, while a higher proportion of the 55+ year-old age group would rather buy it from a staff member coming to their place of residence.
A similar pattern emerges with the channel options for buying energy-efficient products, such as smart thermostats at a discount (see Figure 28). Overall, two-thirds of consumers would rather do this face to face with a staff member. Men and higher income seem to be more interested in online interactions.

Figure 29. Some programs allow you to purchase energy-efficient products (e.g., smart thermostat) at a discount. How would you want to purchase such a product?
Base: All respondents
With a staff member at an in-store location
With a staff member at my place of residence
Online with no interaction with a staff member
With a staff member over the telephone
China 28% 51%8%13%
Italy 28% 55%12%5%
United States 31% 6% 15% 48%
Singapore 12% 67%15%6%
Belgium 18% 56%22%4%
Canada 18% 61%13%8%
France 19% 54%24%3%
Australia 21% 53%17%9%
Sweden 22% 63%10%5%
South Africa 24% 58%16%
2%
South Korea 14%7% 48%31%
Netherlands 48%15%5%32%
2%
Denmark 49%15%34%
Brazil 46%8%4%42%
United Kingdom 33%12%8%47%
Average 5% 14%29% 52%
Spain 28% 11% 58%3%
Japan 54%5%38% 3%
Germany 30% 28% 40%
2%
The majority of consumers in countries other than the United Kingdom would prefer to purchase energy-efficient products in a face-to-face interaction. In Germany, 28 percent of respondents indicated a preference for an in-home interaction. A web-based interaction is most popular with respondents from the United Kingdom, with nearly half of consumers wanting to purchase products online with no interaction with a staff member (see Figure 29).

Implications for utilities/electricity providersThe findings of this report highlight four critical implications for utilities/electricity providers as they seek to address the evolving energy marketplace

1. Make information the new currencyFocus on analytics to gain a deeper understanding of consumers
Customer segmentation is criticalOur research shows that consumers have a diverse set of preferences, creating a need for differentiated propositions and experiences. So providers will need the ability to understand their customers, develop tailored products and services and bundle these with value propositions that will resonate with their target consumer segments.
This means that information will not just be a tool for delivering a commodity, but a vital currency that becomes the lifeblood of the organization. In the evolving energy marketplace, data—along with the ability to manage and analyze it—will power success with customers and operations and may even become the core of competitive differentiation. Therefore, utilities/electricity providers should use customer analytics to learn from consumers, understand the preferences of different segments and develop tailored customer solutions.
Utilities/electricity providers will need to take a strategic and disciplined approach to customer and operational analytics. This approach will enable them to cater more effectively to consumer needs, and capture stronger top- and bottom-line growth. As a utility/electricity provider enhances its approach to data analytics, it can leverage previous successes in other industries, primarily around building a framework for reporting and accountability, engaging and retaining the right talent and—most importantly—fostering an information-driven culture.

2. Embed innovation into customer operationsUse an analytics-driven understanding of consumer segments to develop tailored products and services
Innovation needs to fuel product and service development to create consumer value Utilities/electricity providers must focus on not only understanding how energy savings influence the decision to adopt a program, but also on building and managing programs that cater to many different needs and values. This means developing innovative offerings that blend the optimal mix of attributes, such as loyalty rewards and installation services. As a result, the traditional commodity service may no longer be at the heart of utilities’/electricity providers’ offering set, but just one component of a whole range of services making up the entire product offer.
This need for product and service innovation requires a shift in focus. While utilities/electricity providers have excelled at innovation in the past, their investment in innovation has traditionally focused on providing and delivering services specific to the
commodity. With many disruptive technologies—electric vehicles, distributed generation, micro grids and energy storage capabilities—fragmenting the value chain, providers may no longer be consumers’ default provider for beyond-the-meter products and services.
Successful customer-focused innovation is not a one-time endeavor. Instead, providers need to take their new understanding of what energy consumers value, and feed this insight into an industrialized innovation engine within their customer operations to develop and deliver energy products and services that meet those consumer requirements. Successful innovation can develop products and services that will achieve the desired levels of adoption. This will also mean utilities/electricity providers changing from single-product, commodity organizations to consumer-focused businesses skilled at developing, delivering and supporting multiple products and services.
Ultimately, the implication is that providers will need to restructure their organization and evolve their capabilities to support two competencies: product life-cycle management for innovative products and services, and portfolio management for effectively managing multiple offerings. These capabilities will require deep consumer insights—first to drive customer-focused innovation, and second to bundle multiple product components into tailored, value-added offerings.

3. Redefine the meaning of “consumer”Address the service and channel requirements of all consumer segments
Providers need to employ a cross-channel approach to marketing, sales and service to meet the needs of consumers.Our study shows that consumers’ choices of energy management programs are influenced not only by their preferences toward the composition of products and services, but also by how those products and services are acquired and delivered. Most respondents are interested in technology that can completely automate the management of their electricity—and more than half of 18 to 24 year-olds are interested in using mobile phone apps to measure their personal consumption. At the same time, consumers favor face-to-face interaction for buying energy-efficiency products and enrolling in energy management programs, yet they also want energy management programs that leverage multi-channel capabilities and leading technologies.
These findings point to new opportunities for differentiated channel and consumer treatments.
While consumers have traditionally been defined as a “bill payer attached to a fixed premise” consuming energy, tomorrow’s providers must think of them as much more than just the bill payer. Cross-channel approaches, including social networking and mobile devices directed at the “right” segments, will enable new energy products and services that meet consumers’ lifestyle demands for convenience, simplicity and technological innovation.
As utilities/electricity providers navigate the evolving energy marketplace, they will need to accommodate a wide array of customer channels that are aligned and have a single point of accountability. By doing so, targeted and tailored messaging will be provided to customers through an integrated cross-channel approach. As a result, these providers will be better-positioned to identify and manage different customer segments—encouraging lower-value transactions to migrate to low-cost channels, while
engaging and more effectively serving higher-value interactions.
To prepare for this future, providers need to move now to create or partner with third parties to develop a network of retail outlets and field agents that can educate consumers and encourage adoption of energy management programs. Customer service call centers will likely be the first level of escalation for technology and device support. Therefore, traditional call center capabilities may need to be redesigned to exceed customer expectations and build consumer engagement.

4. Rethink traditional business models to maximize valueNavigate the evolving energy marketplace
Collaborate to accelerateUtilities/electricity providers still maintain a trust advantage with energy consumers when compared to other commercial providers; however, as evidenced in this research, consumers have expressed a willingness to purchase energy-related products and services from a broad set of providers. Even in regulated markets, other companies can enter the energy marketplace and potentially insert themselves into the relationship between the utility/electricity provider and their customers. Utilities/electricity providers may find that the entrants into the evolving energy marketplace excel at delivering tailored products and services and excellent customer experiences through the channels consumers prefer. Many of these providers may already offer other products and services consumers value and have convenient in-person channels. As the level of “competition” intensifies, utilities/electricity providers will be forced to reevaluate their go-to-market strategies.
To acquire and scale the necessary capabilities, utilities/electricity providers may decide to create a partnership ecosystem to help them engage consumers, build trust and drive growth in the beyond-the-meter market. These partnerships will extend beyond outsourcing, operational and customer-facing partnerships to include engagement with cities, municipalities, governments and other stakeholders to drive the development of projects such as intelligent cities.
As providers around the world respond to the challenges and opportunities of industry convergence, they will also need to transform their operating models to be more consumer-focused, agile and flexible enough to meet the changing consumer needs. Dynamic business models are emerging and leading providers will assess or reevaluate their approach to their markets and consumer. Some providers may choose to enter the beyond-the-meter market by offering value-added products and services across the offering spectrum. Others may choose to focus on commodity
sales and asset management, while allowing other providers to fill demand in the beyond-the-meter market. While some other providers, especially those in regulated markets with specific conservation targets, may choose to take on an advisory role to the marketplace, connecting consumers with other providers that offer energy efficiency and conservation products and services. Regardless of the strategy chosen, many utilities/electricity providers will require bold and sweeping changes to realize the true value of the evolving energy marketplace.

Conclusion
Learn moreThe New Energy Consumer: Strategic Perspectives on the Evolving Energy Marketplace, has been designed for utilities and energy providers in both regulated and deregulated environments, to help them prepare their retail business or customer operations for the next decade. The perspectives and insights contained within this guide are based not only on Accenture’s end-consumer research program, but also on a wide variety of other industry research, interviews with clients and industry experts, cross-industry experiences and Accenture’s own knowledge of managing utility operations.
This comprehensive guide discusses:
• The macro trends creating the evolving energy marketplace in both regulated and deregulated environments.
• The critical focus areas utilities must consider when preparing for the evolving energy marketplace, including the need for innovation, shifts in the consumer-utility relationship, the challenges and opportunities of increased data and the need for collaboration.
• The strategic business model options available to utilities to navigate the disruptive changes in the industry.
• Immediate actions utilities can take to address current challenges, while at the same time preparing for future opportunities.
The New Energy Consumer: Strategic Perspectives on the Evolving Energy Marketplace can be found on www.accenture.com
Revealing the Values of the New Energy Consumer identified four key findings for the evolving energy marketplace:
While consumers regard their utilities as the primary provider for energy-related products and services, dynamic business models are emerging. In both regulated and competitive markets, other providers such as commercial retailers are targeting the new energy consumer. At the same time, the traditional advantage of consumer trust that utilities have enjoyed over other providers has begun to narrow.
Price is the pivotal factor in the acceptance of electricity management programs, but price alone will not drive adoption. Although price remains key to consumer behavior change, price alone will not drive consumer adoption of energy management programs.
Understanding intrinsic consumer values may ultimately drive sustained behavior change.
A wide array of consumer preferences is driving the need for differentiated propositions and experiences. Consumer preferences are varied as a result of behaviors, attitudes and needs. Fulfilling specific preferences for different consumer segments will allow for differentiation of value-added products and services.
Consumers will respond to programs that consider their full spectrum of values and preferences. Products and services must be designed to address the full spectrum of consumer values. Product attributes and features including convenience orientation and technology-enabled functionalities should be considered in program design.
Acting upon these four key findings will enable success in the evolving energy marketplace. Leading energy providers understand that creating value is more than enabling new channels, installing in-home technologies and deploying smart meters. They understand that the industry dynamics are such that energy consumers’ behaviors, attitudes and preferences must be incorporated to offer products and services that drive value. Providers that recognize and act on the need for better approaches to data and analytics, customer-centric innovation, next-generation customer service and creative partnerships will be positioned to maximize value and achieve high performance in the evolving energy marketplace—in the near term and the long run.

Copyright © 2011 AccentureAll rights reserved.
Accenture, its logo, and High Performance Delivered are trademarks of Accenture.
About AccentureAccenture is a global management consulting, technology services and outsourcing company, with more than 215,000 people serving clients in more than 120 countries. Combining unparalleled experience, comprehensive capabilities across all industries and business functions, and extensive research on the world’s most successful companies, Accenture collaborates with clients to help them become high-performance businesses and governments. The company generated net revenues of US$21.6 billion for the fiscal year ended Aug. 31, 2010. Its home page is www.accenture.com.
ACC11-0016/11-2677
About Accenture ResearchAccenture Research is Accenture's global organization devoted to economic and strategic studies. The staff consists of 150 experts in economics, sociology and survey research from Accenture's principal offices in North America, Europe and Asia/Pacific. This study involved our European experts in survey research.
Gregory S. GuthridgeGlobal managing director, Accenture Retail and Business Services for Utilities
Ann V. BurnsAsia Pacific, Accenture Retail and Business Services for Utilities
Jeffrey D. HutchesonNorth America, Accenture Retail and Business Services for Utilities
Pierfederico PelottiEurope, Africa and Latin America, Accenture Retail and Business Services for Utilities
Owen Blackwell
Michael Britt
Stephanie Bronchard
Michael Dary
Richard Hepworth
José Gómez Herrera
Prashob Menon
Naomi Manley-Casimir
Shan Parmar
Tim Porter
Charlotte Raut
Melina Viglino
Barb West
Contacts Research team