Accelerating Viewership Trends— What You Need to Know Now.
10
Accelerating Viewership Trends— What You Need to Know Now. For U.S. Only
Transcript of Accelerating Viewership Trends— What You Need to Know Now.

Accelerating Viewership Trends—
What You Need to Know Now.
For U.S. Only

Methodology
The insights and trends contained within this paper are derived from proprietary data gathered by Samsung ACR technology on U.S. Samsung Smart TVs only and additional proprietary data in the U.S. to understand linear viewership, connected device and app usage behaviors.
Samsung Ads compared changes between the first full week of 2020 (1/6/20 – 1/12/20) and the last week full week of Q1 2020 (3/23/20 – 3/29/20) to isolate changes over the course of the quarter. Additional data is sourced from May–July 2019; from Q3 and Q4 of 2019; from the entirety of Q1 of 2020 and from Q2 2020 through the week ending May 10, 2020.
It’s important to note that Samsung Ads Smart TV viewer data is deterministic. It is not projected to a national population, but it represents behavior from the largest source of TV data covering 60% of the available U.S. ACR footprint from 50M+ Smart TVs¹.
¹ ComScore Connected Home, U.S. April 2017 and Statista 2018 Smart TVs in U.S. Households 2
Behind the Screens: Accelerating Viewership Trends - What You Need to Know Now.

chart chart
A historic shiftStreaming accounts for more TV time than linear: nearly 60% of all TV viewing time.Already in Q4 2019 — in what seems like an entirely different lifetime — streaming time spent had reached the tipping point and surpassed linear viewing time.
With the stay at home orders, video viewing doubled by the end of Q1 vs. first full week of 2020. This accelerated the trend toward streaming. In fact, by the end of Q1 2020, streaming accounted for 58% of all TV viewing time, an increase of +14% since Q4.
Streaming has taken over prime time, too.
Streaming in prime time, across both SVOD and AVOD, has jumped +9 percentage points since January 2020 and has surpassed linear in the coveted day part².
² When comparing the first week of January 2020 to the last week of March 2020. 3
Share of TV Time Spent
Q4 2019
49%Linear
51%Streaming
42%Linear
58%Streaming
Share of TV Time Spent
Q1 2020
Early Morning
Jan 6–12 Mar 22–29
49%
+4%
53%
Jan 6–12 Mar 22–29
Day Time
+5%
48% 53%
Jan 6–12 Mar 22–29
Prime Time
+9%
46% 55%
Jan 6–12 Mar 22–29
Late Night
+5%
47% 52%
Behind the Screens: Accelerating Viewership Trends - What You Need to Know Now.
Behind the Screens: Accelerating Viewership Trends - What You Need to Know Now.
4
Streaming
Linear
+127%Streaming
+47%Linear
Feb 3Football Weekend
End of Q1
Mar 9–15Sports go dark
Mar 11WHO Announcement
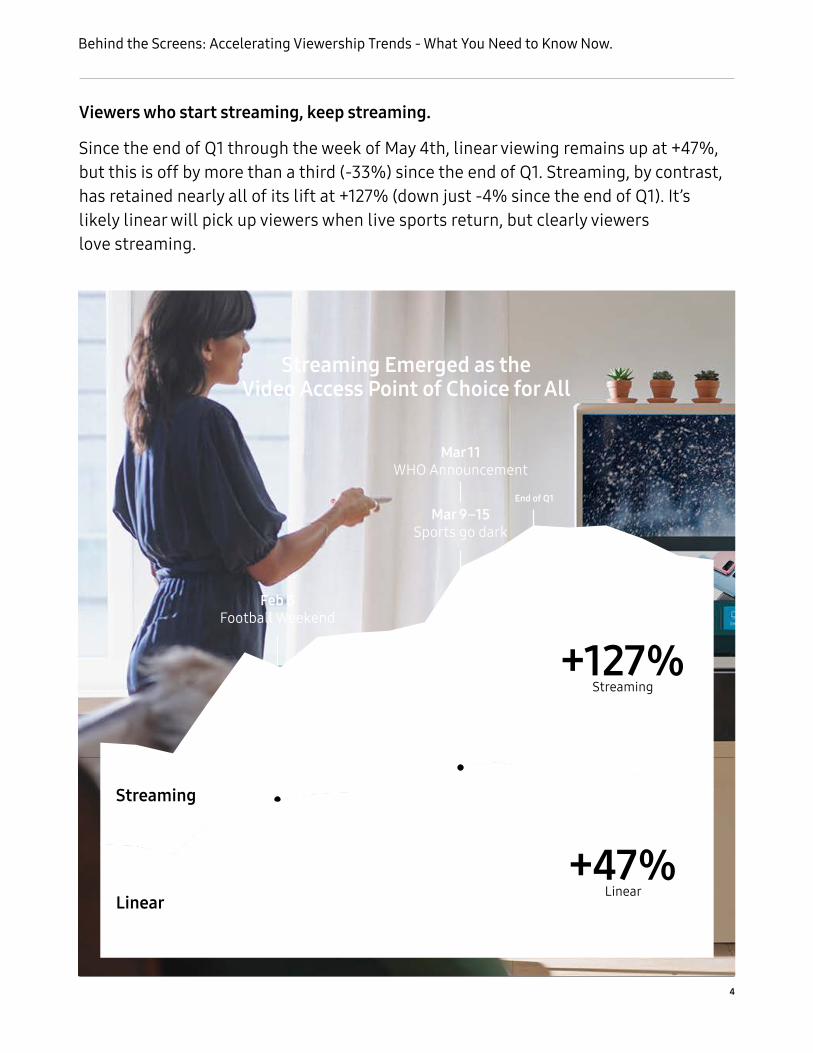
Viewers who start streaming, keep streaming.
Since the end of Q1 through the week of May 4th, linear viewing remains up at +47%, but this is off by more than a third (-33%) since the end of Q1. Streaming, by contrast, has retained nearly all of its lift at +127% (down just -4% since the end of Q1). It’s likely linear will pick up viewers when live sports return, but clearly viewers love streaming.
Streaming Emerged as the Video Access Point of Choice for All

Behind the Screens: Accelerating Viewership Trends - What You Need to Know Now.
For the week ending May 10, time spent in TVOD remained high at +103% as TV-based movie releases continue.
With movie theaters closed, studios used direct-to-consumer TVOD platforms to drive viewership of premieres and recent releases.
Movies that might have been in-theater blockbusters, like “Trolls World Tour”, still performed incredibly well.
Cable sports networks lose 23M weekly viewing hours during Q1
Isolating linear Sports Viewers, we found that their time spent with sports networks dropped -45%³ the week after live sports went dark and by the end of Q1 was down -13%⁴ vs. the first full week of 2020.
Sports Viewers turn to streaming. Reach increased +32% for AVOD.Linear Sports Viewers doubled the amount of time they spent with streaming in the week after live sports went dark vs. the time spent streaming in early January. A third more Sports Viewers accessed AVOD content compared to early January.
Weekly Linear Network Growth – Q1 2020
³ Sports Network viewership time (3/16/20 - 3/22/20 vs. 3/2/20 - 3/8/20)⁴ Sports Network viewership time (3/23/20 - 3/29/20 vs. 1/6/20 - 1/12/20)
5
“Film is like parachute jumping. You get one shot, if it doesn’t open, it’s dead.”—Robert Evans
–13%Sports
0%
19%
–1%
Major sport leagues begin to pause
Behind the Screens: Accelerating Viewership Trends - What You Need to Know Now.
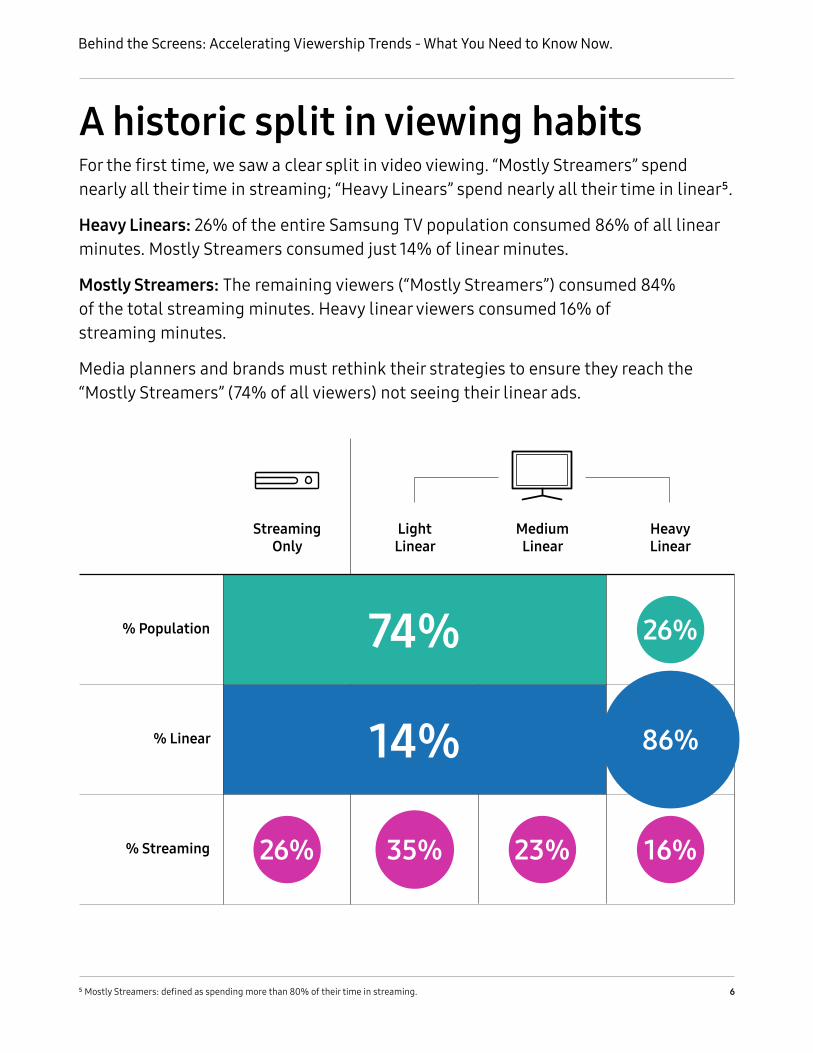
A historic split in viewing habitsFor the first time, we saw a clear split in video viewing. “Mostly Streamers” spend nearly all their time in streaming; “Heavy Linears” spend nearly all their time in linear⁵.
Heavy Linears: 26% of the entire Samsung TV population consumed 86% of all linear minutes. Mostly Streamers consumed just 14% of linear minutes.
Mostly Streamers: The remaining viewers (“Mostly Streamers”) consumed 84% of the total streaming minutes. Heavy linear viewers consumed 16% of streaming minutes.
Media planners and brands must rethink their strategies to ensure they reach the “Mostly Streamers” (74% of all viewers) not seeing their linear ads.
⁵ Mostly Streamers: defined as spending more than 80% of their time in streaming. 6
StreamingOnly
26%
0% 1%
22%
35% 23%
26%26%
13%
16%
26%
LightLinear
MediumLinear
HeavyLinear
% Streaming
% Linear
% Population 74%
14% 86%

75%Q4’2019
+25%over
Q3’2019
Behind the Screens: Accelerating Viewership Trends - What You Need to Know Now.
In Q4 2019, 75% of Streamers accessed AVOD, up 25% over Q3.
While the early days of streaming were dominated by SVOD services, a large majority of Streamers now regularly access AVOD. By the end of Q4 2019, 75% of all Streamers were accessing AVOD — and it seems all but certain AVOD audiences will continue to grow. Already, AVOD is nearing parity with SVOD in terms of time spent.
The Power of Samsung TV Plus
Installed on nearly 50M devices (TVs) worldwide, Samsung TV Plus is the #2 watched AVOD app on Samsung TVs in the U.S. More than half of Samsung TV Plus viewers are cord cutters or cord-nevers.
STVP UI hardware
7
AVOD nearing parity with SVOD in time spent
AVOD SVOD
+10% –7%
44% 56%
40% 60%May–July 2019
Oct–Dec 2019

Behind the Screens: Accelerating Viewership Trends - What You Need to Know Now.
What Advertisers Need to Know
8
Streaming now accounts for more TV time than linear: nearly 60% of all TV viewing time.
Streaming has taken over prime time, too.
Viewers who start streaming, keep streaming.
Sports Viewers have turned to streaming
Time spent in TVOD remains high at +103% as TV-based movie releases continue
A historic split in viewing habits: “Mostly Streamers” spend nearly all their time in streaming; “Heavy Linears” spend nearly all their time in linear.
In Q4 2019, 75% of Streamers accessed AVOD, up 25% over Q3.
Advertisers must adjust their strategies to reach viewers where they are. Balancing reach and frequency among Streamers is now critical to success.
Linear has trained viewers to show up at prime time and the largest audience is still reachable in this day part. However, must-see TV has shifted to mostly-streaming TV. The days of streaming as an emerging behavior are over; it’s core to how people watch.
Nearly all the viewers who tried streaming during the pandemic are still finding content they love in streaming.
Advertisers need ACR data to understand what sports fans are watching instead of sports and deliver the right reach and frequency. Don’t ignore streaming, especially AVOD, where reach increased +32%.
Now is a good time to leverage ACR data to find the audiences who will love the genre and the stars of your upcoming film release. Entertainment advertisers will continue to need varying regional approaches, depending on which states have open movie theaters and which do not.
Now more than ever, it’s very easy to overexpose heavy linear viewers and miss other audiences entirely. Planners and brands must rethink their strategies to match how people watch now.
The assumption that audiences are unreachable in streaming is simply untrue. AVOD is nearing parity with SVOD in terms of time spent. Consumers are watching AVOD. Advertisers need to lever-age this medium as a critical part of their media buying strategy.
New viewing behavior Implications

Behind the Screens: Accelerating Viewership Trends - What You Need to Know Now.
Glossary
Viewership of video content occurring through a cable or satellite subscription or via an antenna.
Ad-supported video on demand. Viewership of video content occurring over the top through a service that does not require a paid subscription.
Subscription video on demand. Viewership of video content occurring over the top through a service that requires a paid subscription.
Transaction video on demand. Viewership of premium video content occurring over the top where a per transaction fee is required.
Viewers of video content whose consumption of linear viewership represents 14% of the total linear viewership use, and spend more than 80% of their time in streaming environments.
Bottom 33% ranked viewers in linear time spent. Average less than 1 hour of linear viewership per month.
Middle 33% ranked viewers in linear time spent. Average 18 hours of linear viewership per month.
Top 33% ranked viewers in linear time spent. Average 120+ hours of linear viewership per month.
TVs in linear Sports Tastegraph or linear sports network viewers or sports app users, 1 min+ consecutive time spent viewing to qualify, Jan-Mar 2020.
Linear TV
AVOD
SVOD
TVOD
Mostly Streamers
Light Linear
Medium Linear
HeavyLinear
Sports Viewers
9

Behind the Screens: Accelerating Viewership Trends - What You Need to Know Now.
About Samsung Ads
Samsung Ads delivers advanced TV advertising at scale. Our Smart TV advertising solutions are built on the largest source of TV data, from more than 50M Smart TVs. Today we boast more than 60% of the U.S. ACR footprint.
Samsung Ads provides the holistic view advertisers need, connecting linear, OTT, gaming and more. Advertisers can leverage those insights to buy media across TV, mobile and desktop.
They turn to our managed service and programmatic offerings to achieve incremental reach, compliment linear TV campaigns, manage frequency, find difficult-to reach audiences and most importantly measure outcomes.
Launched in 2015, Samsung Ads has offices in the United States, the United Kingdom, Canada, South Korea and Australia. Samsung Ads is a division of Samsung Electronics, the #1 TV manufacturer globally.
Get in touch at [email protected] samsungads.com