
ACCELERATED MATHEMATICS IN GRADES 4–6doc.renlearn.com/KMNet/R003476325GEFECD.pdf · ACCELERATED...
32
P ROF . D R . R AINER H. L EHMANN D R . S USAN S EEBER ACCELERATED MATHEMATICS IN GRADES 4–6 SUMMARY OF A QUASI-EXPERIMENTAL STUDY IN NORTH RHINE-WESTPHALIA,GERMANY
-
Upload
nguyentruc -
Category
Documents
-
view
218 -
download
0
Transcript of ACCELERATED MATHEMATICS IN GRADES 4–6doc.renlearn.com/KMNet/R003476325GEFECD.pdf · ACCELERATED...
P R O F. D R . R A I N E R H . L E H M A N N
D R . S U S A N S E E B E R
A C C E L E R AT E D M AT H E M AT I C S
I N G R A D E S
4 – 6
S U M M A R Y O F A Q U A S I - E X P E R I M E N T A L
S T U D Y I N N O R T H
R H I N E - W E S T P H A L I A , G E R M A N Y
A C C E L E R A T E D
M A T H E M A T I C S
I N G R A D E S
4–6Prof. Dr. Rainer H. Lehmann
Dr. Susan Seeber
Copyright ©2005 by Renaissance Learning, Inc.
All rights reserved. No portion of this book may be reproduced,
by any process or technique, without the express written con-
sent of the publisher.
Accelerated Math, Accelerated Reader, “Better Data, Better
Learning,” Renaissance, Renaissance Learning, Renaissance
Place, STAR Early Literacy, STAR Math, STAR Reading, and
StandardsMaster are trademarks of Renaissance Learning, Inc.,
registered or pending registration in the United States and other
countries.
R E N A I S S A N C E L E A R N I N G
PO Box 8036
Wisconsin Rapids, WI 54495-8036
(866) 846-7323
www.renlearn.com
A C C E L E R A T E D M A T H E M A T I C S I N G R A D E S 4–6
3
A C C E L E R A T E D
M A T H E M A T I C S
I N G R A D E S
4–6
S U M M A R Y O F A Q U A S I -
E X P E R I M E N T A L S T U D Y I N N O R T H
R H I N E - W E S T P H A L I A , G E R M A N Y
A C C E L E R A T E D M A T H E M A T I C S I N G R A D E S 4–6
4
Overview . . . . . . . . . . . . . . . . . . . . . . . . . . . . . . . . . . . . . . . . . . . . . . . . . . . . . . . . 5
About Accelerated Math . . . . . . . . . . . . . . . . . . . . . . . . . . . . . . . . . . . . . . . . . . . . 7
Study Design. . . . . . . . . . . . . . . . . . . . . . . . . . . . . . . . . . . . . . . . . . . . . . . . . . . . . 8
Sampling Structure: Schools and Classes . . . . . . . . . . . . . . . . . . . . . . . . . . . . . . 10
Study Characteristics at the Beginning of Study . . . . . . . . . . . . . . . . . . . . . . . . 12
Results by Grade . . . . . . . . . . . . . . . . . . . . . . . . . . . . . . . . . . . . . . . . . . . . . . . . . 16
Selected Case Studies: Teachers who Taught
Both Accelerated Math and Control Classes . . . . . . . . . . . . . . . . . . . . . . . . . . . 24
Teacher and Student Evaluations of Accelerated Math . . . . . . . . . . . . . . . . . . . 25
Conclusion . . . . . . . . . . . . . . . . . . . . . . . . . . . . . . . . . . . . . . . . . . . . . . . . . . . . . 27
Bibliography of Full Report . . . . . . . . . . . . . . . . . . . . . . . . . . . . . . . . . . . . . . . . 28
C O N T E N T S
A C C E L E R A T E D M A T H E M A T I C S I N G R A D E S 4–6
5
In 2004, a developmental German
adaptation of the Accelerated Math program was implemented in 22 fourth-,
fifth-, and sixth-grade classrooms in 14 schools in the German state of North
Rhine-Westphalia (NRW). The classrooms using Accelerated Math were
matched with an approximately equal number of same-school, same-grade
control classrooms that used their regular instructional methods.
A total of more than 1,200 students participated in the study.
The following describes key results from a report authored by Dr. Rainer H.
Lehmann and Dr. Susan Seeber of Humboldt University in Berlin titled
Accelerated Mathematics in Grades 4–6: Evaluation of an Experimental
Innovation in North Rhine-Westphalia. The report describes a quasi-experi-
mental study of the effectiveness of Accelerated Math, a curriculum-based
instructional management system developed by U.S.-based Renaissance
Learning, Inc.
This evaluation demonstrated the effectiveness of the Accelerated Math
approach in terms of growth in mathematics achievement over a period
of just four months. Specific findings include:
• Achievement gains were unexpectedly high both in Accelerated Math and
control classrooms. Fifth-grade students using Accelerated Math achieved
an increase from pre- to post-test that was approximately twice that of the
control group. In grades four and six, the Accelerated Math students and
control students experienced similar levels of growth.
• Classrooms in which the Accelerated Math program was used very exten-
sively achieved the largest gains. Classrooms in which Accelerated Math
was not fully implemented achieved about the same gains as control classes.
O V E R V I E W
A C C E L E R A T E D M A T H E M A T I C S I N G R A D E S 4–6
6
• Some teachers who used Accelerated Math also taught same-school, same-
grade control classes using traditional methods. In these cases, the influence
of the teacher can be controlled while examining results. Of those classes,
most (six out of nine) Accelerated Math classes outperformed their control
counterparts taught by the same teachers.
• When surveyed about their experiences with Accelerated Math, overall,
teachers accepted the program as an interesting new approach to teaching
mathematics. From the teachers’ point of view, Accelerated Math is not
only a promising approach to increased instructional differentiation and
improved diagnostic reliability, but it also promotes the creation of learning
environments that support self-regulated, highly individualized learning.
More detailed information on the study design and findings can be found
in the following sections of this summary. Alternatively, the full report in
German can be obtained at: http://www2.hu-berlin.de/empir_bf/lehmann.html.
In addition to summarizing the full report, this document contains a
description of the Accelerated Math system as well as a brief description of
the German school system.
A C C E L E R A T E D M A T H E M A T I C S I N G R A D E S 4–6
7
Accelerated Math is a curriculum-
based instructional management system that was developed by U.S.-based
Renaissance Learning, Inc. It is intended to accelerate the learning of
mathematics when used in conjunction with the existing instructional
practices and textbook already in place in the classroom. It is designed to:
• Keep track of individual students’ daily activities (the program prints
and scores personalized practice assignments and tests for each student);
• Provide immediate feedback to students and teachers through information
generated from individual or class diagnostic reports;
• Alert teachers when students are having difficulty with certain math
objectives; and
• Monitor student achievement.
Accelerated Math is intended to help both teachers and students ensure that
students are working at an appropriate level, mastering new objectives, and
reviewing skills they have already mastered. With the information provided
by Accelerated Math, teachers have the opportunity to make informed
instructional decisions and tailor math interventions to meet the needs of
individual students.
Several independent studies conducted in the United States have been able
to demonstrate positive effects of Accelerated Math on student performance.
This study is the first to evaluate a German version of Accelerated Math.
The piloted system included student content in German and teacher
materials in English.
A B O U T A C C E L E R A T E D M A T H
A C C E L E R A T E D M A T H E M A T I C S I N G R A D E S 4–6
8
In 2003, the educational ministry of
NRW expressed interest in piloting a German version of Accelerated Math.
The study was designed to both inform future development of the German
version of Accelerated Math, and to provide information to the educational
ministry of NRW in making decisions about future use of the system. Prof.
Dr. Rainer H. Lehmann of Humboldt University in Berlin was selected to
conduct the study.
The study was designed to answer the following major research questions:
• To what extent are there evidence-supported differences in math perform-
ance gains for students in grades four, five, and six who participate in
Accelerated Math versus a control group of students in their same grade?
• What is the relationship between student achievement gain and the
intensity of Accelerated Math implementation?
• How do teachers evaluate the realization of didactic intention, the
curricular differentiation and the implementation of Accelerated Math
in the classroom?
To answer these questions, the researchers selected a battery of standardized
assessment tools and evaluation instruments to measure achievement gains
and comprehensively evaluate the didactic and methodological aspects of this
approach. In addition to the two achievement tests designed to measure the
mathematical competency of the students at the beginning and end of the
evaluation, a nonverbal intelligence test and questionnaires for students and
teachers measuring their attitudes about and motivation for mathematic
instruction were used. In addition, a teacher questionnaire was employed to
determine the teachers’ general attitude toward their work and profession,
self concept in connection with selected aspects of mathematical instruction,
and the teachers’ evaluation of the use of Accelerated Math. Each test instru-
ment is described briefly below.
S T U D Y D E S I G N
A C C E L E R A T E D M A T H E M A T I C S I N G R A D E S 4–6
9
Mathematics Test. Students in grades four and five were assessed using
the Hamburger Schulleistungstest fur 4. and 5. Klassen – HST 4/5. Sixth-
grade students were assessed using the Hamburger Schulleistungstest fur 6.
and 7. Klassen – HST 6/7. Both tests have been used successfully in the past,
including a longitudinal school achievement census conducted in the City
of Hamburg (Lehmann, Peek, & Gaensfuss, 1997; Lehmann, Gaensfuss, &
Peek, 1999). This approach allows comprehensive comparisons of the stu-
dents in the present study with those of the Hamburg study.
The HST 4/5 includes a wide array of mathematical competencies.
Topics include numerical and digital values, the relationship between
verbal and non-verbal representations of numbers, basic arithmetic opera-
tions, histograms, measurement, and computation. The HST 6/7 focuses
on arithmetic, geometry, and algebra.
Both tests use a multiple-choice format with four response categories.
The time to solve all problems without use of a calculator was 45 minutes.
The test used two pseudo-parallel forms that differed only in the order of
items and response categories. At post-test, the students received the parallel
form they had not done at pre-test.
Intelligence Test. In order to control for individual differences in learn-
ing ability, the mathematics test was complemented by an adapted short
version of Cattell’s non-verbal Culture Fair Intelligence Test – CFT 20
(Weiss, 1998). The test aims to measure “fluid intelligence,” which includes
aspects of reasoning abilities. The items are organized into four sub-tests:
Continuation of Sequences, Classifications, Matrices, and Topological
Reasoning. The format of this standardized test allows it to be virtually
independent of the command of the language of instruction, as well as of
substantive subject-matter knowledge. In short, it helps identify discrepan-
cies between a student’s cognitive resources and his/her achievement in the
subject. The adapted short version requires about 40 minutes to complete.
Like the HST, the CFT 20 also was administered in the Hamburg
longitudinal study.
A C C E L E R A T E D M A T H E M A T I C S I N G R A D E S 4–6
1 0
Student Questionnaire. Students were asked for their attitudes and beliefs
regarding mathematics, including their self-efficacy and interest in the subject.
The questionnaire was also used to collect information about the educational
environment at home. In addition to social background characteristics, such as
the language spoken in the home, parents’ education, and other indicators,
information about resources specifically relevant to education, such as access to
books, computers, the Internet, and places to study, was collected. Students in
experimental classrooms were asked additional questions about their experi-
ences with Accelerated Math.
Teacher Questionnaire. Teachers were asked to characterize mathematics
instruction in their classrooms. They were also asked for their general attitudes
toward their school and instructional strategies, as well as their satisfaction
with work and perceived stress and pressure on the job. Teachers who had
implemented Accelerated Math in their classrooms were asked additional
questions about their experiences with the system.
The NRW education
ministry selected schools to participate in the study that would represent a
wide range of student abilities. A total of 15 schools participated in the pre-
test; 14 schools participated in post-testing. Because one elementary school
decided to discontinue its participation in the study, the evaluation is based
on only 14 schools. As a result, four primary schools serving fourth-grade
students participated, with one Accelerated Math class and one control class
each for a total of eight classrooms. A total of 10 secondary schools participat-
ed, among them three Hauptschulen (Basic), three Realschulen (Intermediate),
two Gesamtschulen (Comprehensive) and two Gymnasium (Academic) with
18 Accelerated Math classrooms and 21 control classrooms1. A total of 47
classrooms with 1,243 students participated continuously in the study.
S A M P L I N G S T R U C T U C E : S C H O O L S A N D C L A S S E S
A C C E L E R A T E D M A T H E M A T I C S I N G R A D E S 4–6
1 1
As previously mentioned, the original sample experienced a small amount
of attrition over the course of the study. Originally, five primary schools had
been identified to participate, but one discontinued participation at the
beginning of the experiment, resulting in the loss of that school and its class-
es (one Accelerated Math class and one control class) from the sample. This
school participated in the pre-test, but was not included in subsequent analy-
ses. In addition, due to technical difficulties encountered early in the experi-
ment, one teacher who had originally been assigned to implement
Accelerated Math was not able to, and was thus redefined as a control class.
This resulted in a distortion of the test design with a higher number of con-
trol classes. The final distribution of Accelerated Math and control classes by
school type, grade level, and class are summarized in Table 1 (page 12).
Pre-testing was completed in February and March of 2004, and the
post-testing was completed in June and July of 2004. Students in both
Accelerated Math and control classrooms had a minimum of four months
of instruction between pre- and post-test.
1In the German educational system, children in grades 1–4 attend elementary school(Grundschule). Following fourth grade, students are sent to one of three types of schoolsdepending on their academic performance and their family’s preference: Hauptschule, in which subjects are taught at a relatively slower pace and ultimately leads students to enroll in vocational schools; Realschule, which often leads to vocational or higher vocational schools;or Gymnasium, which prepares students for university or combination academic-vocationaldegrees. Many German states, including North Rhine-Westphalia, also have the Gesamtschule,or combined school, which enrolls students of all ability levels. Source: Ashwill, M.A.,Foraker, W., Nerison-Low, R., Milotich, M., & Milotich, U. (1999). The educational system in Germany: Case study findings. Washington, DC: U.S. Department of Education. Availableonline: <http://www.ed.gov/PDFDocs/GermanCaseStudy.pdf>.
A C C E L E R A T E D M A T H E M A T I C S I N G R A D E S 4–6
1 2
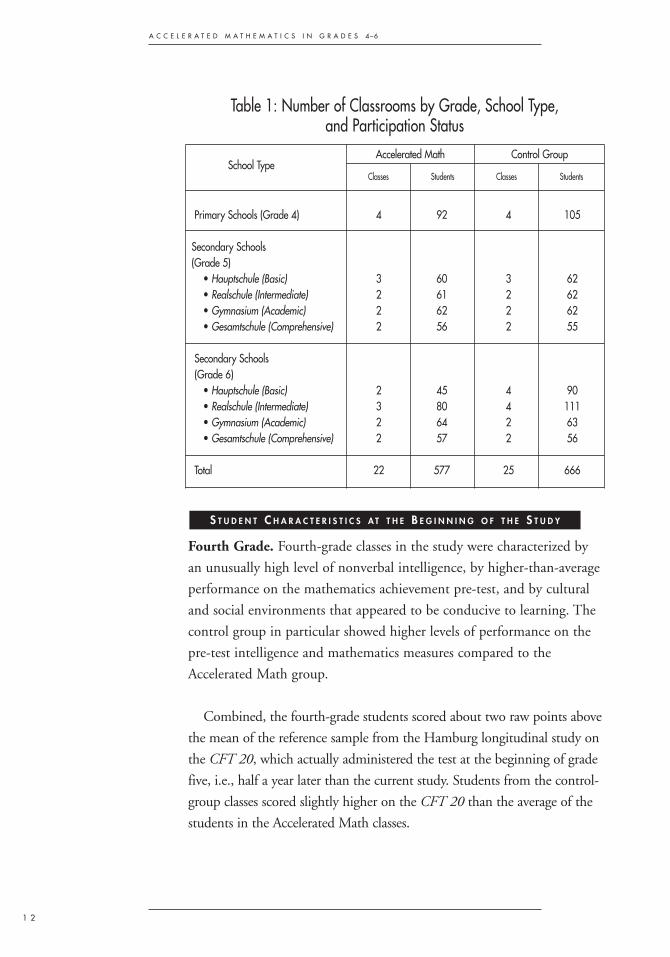
Fourth Grade. Fourth-grade classes in the study were characterized by
an unusually high level of nonverbal intelligence, by higher-than-average
performance on the mathematics achievement pre-test, and by cultural
and social environments that appeared to be conducive to learning. The
control group in particular showed higher levels of performance on the
pre-test intelligence and mathematics measures compared to the
Accelerated Math group.
Combined, the fourth-grade students scored about two raw points above
the mean of the reference sample from the Hamburg longitudinal study on
the CFT 20, which actually administered the test at the beginning of grade
five, i.e., half a year later than the current study. Students from the control-
group classes scored slightly higher on the CFT 20 than the average of the
students in the Accelerated Math classes.
S T U D E N T C H A R A C T E R I S T I C S A T T H E B E G I N N I N G O F T H E S T U D Y
Classes Students Classes StudentsSchool Type
Accelerated Math Control Group
Table 1: Number of Classrooms by Grade, School Type, and Participation Status
Primary Schools (Grade 4) 4 92 4 105
Secondary Schools(Grade 5)
• Hauptschule (Basic) 3 60 3 62• Realschule (Intermediate) 2 61 2 62• Gymnasium (Academic) 2 62 2 62• Gesamtschule (Comprehensive) 2 56 2 55
Secondary Schools(Grade 6)
• Hauptschule (Basic) 2 45 4 90• Realschule (Intermediate) 3 80 4 111• Gymnasium (Academic) 2 64 2 63• Gesamtschule (Comprehensive) 2 57 2 56
Total 22 577 25 666
A C C E L E R A T E D M A T H E M A T I C S I N G R A D E S 4–6
1 3
Like their performance on the intelligence test, fourth-grade students in
the study exhibited a relatively high level of proficiency on the HST 4/5
mathematics achievement test. To evaluate individual mathematical ability,
the raw HST scores were converted to proficiency scores using the one-
dimensional Rasch Model based on Item Response Theory (IRT). Using
proficiency scores, researchers can determine achievement gains. The
parameters used in this context allow for a comparison of the study results
with other national performance studies, including the aforementioned
Hamburg longitudinal study and the Berliner Studie Element (Lehmann
& Nikolova, 2004). The fourth-grade students in this study had pre-test
results that were clearly above reference values for students in both Hamburg
and Berlin.
The control students scored higher on the pre-test than the average test
result of the Accelerated Math group by one-half standard deviation (116 to
103 proficiency score points). At the classroom level, the differences
between both groups were even more apparent. The classroom with the
lowest mean proficiency score achieved about one-half of a standard devia-
tion below the grand mean for all fourth-grade classes, while the classroom
with the highest mean score performed at a mean level of almost two-thirds
of a standard deviation above the grand mean.
The results of the student questionnaire confirmed that the fourth-
graders in the study came from backgrounds that are conducive to learning.
These students had good access to resources relevant to education. In addi-
tion, only the percentage of students from immigrant families (approx. 17
percent) was far below the national average. Of the immigrant group, about
half reported regularly speaking German at home, which implies a high
degree of cultural integration and underlines the positive selection of ele-
mentary schools in this study.
Since the participation of schools and teachers in the study was volun-
tary, one may assume that schools with favorable patterns of motivation,
greater interest in adopting innovative practices, and relatively higher levels
of mathematics achievement were more likely to participate than others and
that there was a tendency within these schools for the higher achieving
classrooms to join the sample.
A C C E L E R A T E D M A T H E M A T I C S I N G R A D E S 4–6
1 4
Fifth Grade. Similar to the fourth-grade students in the study, the fifth-
grade students were characterized by a level of nonverbal intelligence that was
above average, by higher-than-average performance on the mathematics
achievement pre-test, and by cultural and social environments that appeared to
be conducive to learning. But unlike grade four, the grade-five Accelerated
Math group showed slightly higher levels of performance on the pre-test intel-
ligence and mathematics measures compared with the control group.
On the CFT 20 intelligence test, fifth-grade students scored about two raw
points higher than the adjusted age norm in the CFT 20 calibration sample,
and about three raw points higher than fifth-graders from the Hamburg longi-
tudinal study. The CFT 20 scores among fifth-graders were more widely dis-
tributed than the fourth-graders’. Accelerated Math students displayed higher
cognitive abilities than those of the control group.
With respect to the mathematical abilities of participants from the fifth
grade, achievement also exceeds the reference values from the Hamburg longi-
tudinal study. The Accelerated Math group’s performance was slightly higher
than the control, by about one proficiency point (117 to 116).
Via the questionnaire, fifth-grade students were asked about their home
environments. Like the fourth-graders, they described home environments
shown by various empirical studies to have a significant effect on academic
achievement. About 86 percent reported having a room of their own, about
three-quarters had access to a dictionary, encyclopedia or books on specific
subjects at home, and more than half had a computer of their own. Again, the
survey showed a markedly small percentage of students from immigrant fami-
lies, which is lower than the average percentage for all students in NRW if
measured by the language spoken in the home. About one-third of these stu-
dents speak primarily German, which is conducive to learning in children
from immigrant families.
A C C E L E R A T E D M A T H E M A T I C S I N G R A D E S 4–6
1 5
Sixth Grade. Contrary to what was observed in grades four and five, the
average nonverbal reasoning abilities in grade six were very close to the
adjusted age norm in the CFT 20 calibration sample. The scores of the
Accelerated Math and control groups were almost identical to one another.
There was no significant difference in mathematics pre-test achievement
between Accelerated Math and control groups. To reach this conclusion, it
should be noted that data for Hauptschule and Realschule students were
weighted because the distribution of Accelerated Math and control classes
had changed.
Just as in the fourth and fifth grades, the sixth-grade questionnaire indi-
cated that a majority of students had educationally relevant materials and
resources at home, such as a room of their own (85 percent), a desk of their
own (91 percent), dictionaries or encyclopedias of their own (79 percent),
and a computer of their own (65 percent). About 20 percent of sixth-
graders came from immigrant families, with about half of those speaking
German regularly at home.
A C C E L E R A T E D M A T H E M A T I C S I N G R A D E S 4–6
1 6
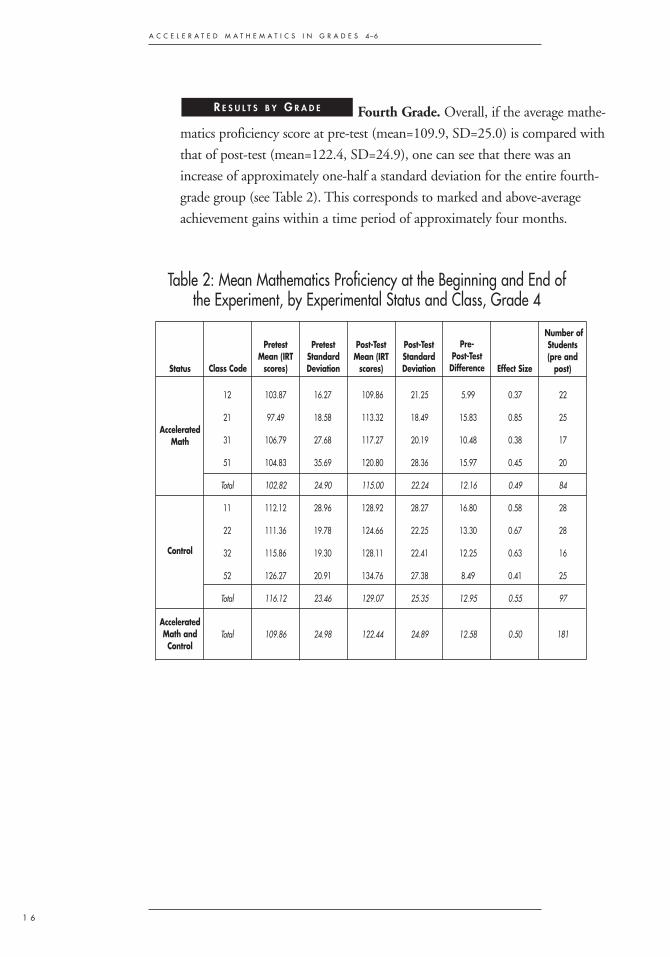
Fourth Grade. Overall, if the average mathe-
matics proficiency score at pre-test (mean=109.9, SD=25.0) is compared with
that of post-test (mean=122.4, SD=24.9), one can see that there was an
increase of approximately one-half a standard deviation for the entire fourth-
grade group (see Table 2). This corresponds to marked and above-average
achievement gains within a time period of approximately four months.
R E S U L T S B Y G R A D E
Status
AcceleratedMath
Control
AcceleratedMath andControl
12 103.87 16.27 109.86 21.25 5.99 0.37 22
21 97.49 18.58 113.32 18.49 15.83 0.85 25
31 106.79 27.68 117.27 20.19 10.48 0.38 17
51 104.83 35.69 120.80 28.36 15.97 0.45 20
Total 102.82 24.90 115.00 22.24 12.16 0.49 84
11 112.12 28.96 128.92 28.27 16.80 0.58 28
22 111.36 19.78 124.66 22.25 13.30 0.67 28
32 115.86 19.30 128.11 22.41 12.25 0.63 16
52 126.27 20.91 134.76 27.38 8.49 0.41 25
Total 116.12 23.46 129.07 25.35 12.95 0.55 97
Total 109.86 24.98 122.44 24.89 12.58 0.50 181
Class Code
PretestMean (IRT
scores)
PretestStandardDeviation
Post-TestStandardDeviation
Pre- Post-Test
Difference
Post-TestMean (IRT
scores) Effect Size
Number ofStudents(pre and
post)
Table 2: Mean Mathematics Proficiency at the Beginning and End of the Experiment, by Experimental Status and Class, Grade 4
A C C E L E R A T E D M A T H E M A T I C S I N G R A D E S 4–6
1 7
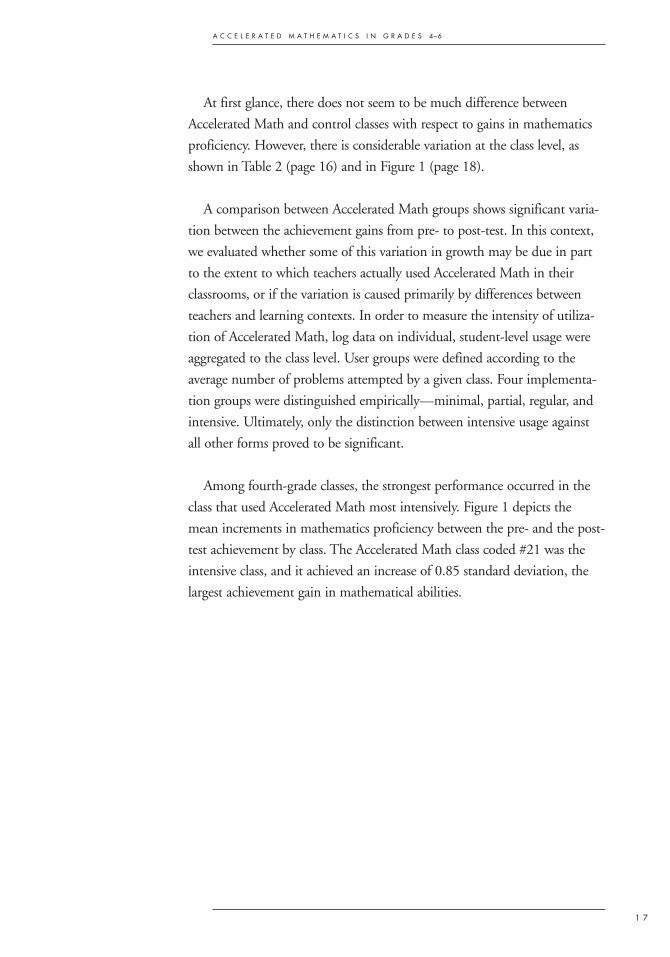
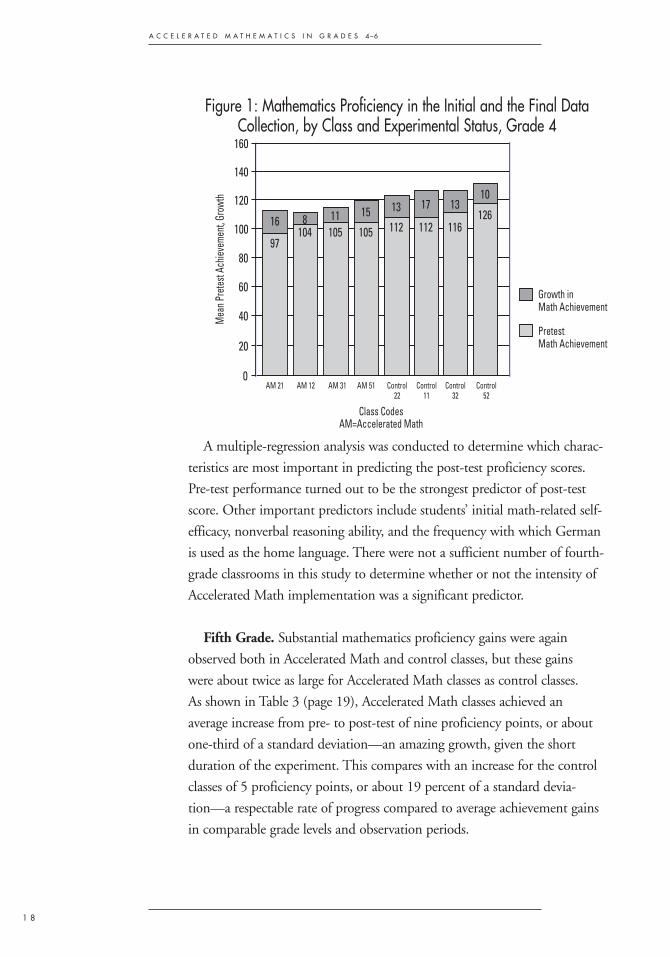
At first glance, there does not seem to be much difference between
Accelerated Math and control classes with respect to gains in mathematics
proficiency. However, there is considerable variation at the class level, as
shown in Table 2 (page 16) and in Figure 1 (page 18).
A comparison between Accelerated Math groups shows significant varia-
tion between the achievement gains from pre- to post-test. In this context,
we evaluated whether some of this variation in growth may be due in part
to the extent to which teachers actually used Accelerated Math in their
classrooms, or if the variation is caused primarily by differences between
teachers and learning contexts. In order to measure the intensity of utiliza-
tion of Accelerated Math, log data on individual, student-level usage were
aggregated to the class level. User groups were defined according to the
average number of problems attempted by a given class. Four implementa-
tion groups were distinguished empirically—minimal, partial, regular, and
intensive. Ultimately, only the distinction between intensive usage against
all other forms proved to be significant.
Among fourth-grade classes, the strongest performance occurred in the
class that used Accelerated Math most intensively. Figure 1 depicts the
mean increments in mathematics proficiency between the pre- and the post-
test achievement by class. The Accelerated Math class coded #21 was the
intensive class, and it achieved an increase of 0.85 standard deviation, the
largest achievement gain in mathematical abilities.
A C C E L E R A T E D M A T H E M A T I C S I N G R A D E S 4–6
1 8
A multiple-regression analysis was conducted to determine which charac-
teristics are most important in predicting the post-test proficiency scores.
Pre-test performance turned out to be the strongest predictor of post-test
score. Other important predictors include students’ initial math-related self-
efficacy, nonverbal reasoning ability, and the frequency with which German
is used as the home language. There were not a sufficient number of fourth-
grade classrooms in this study to determine whether or not the intensity of
Accelerated Math implementation was a significant predictor.
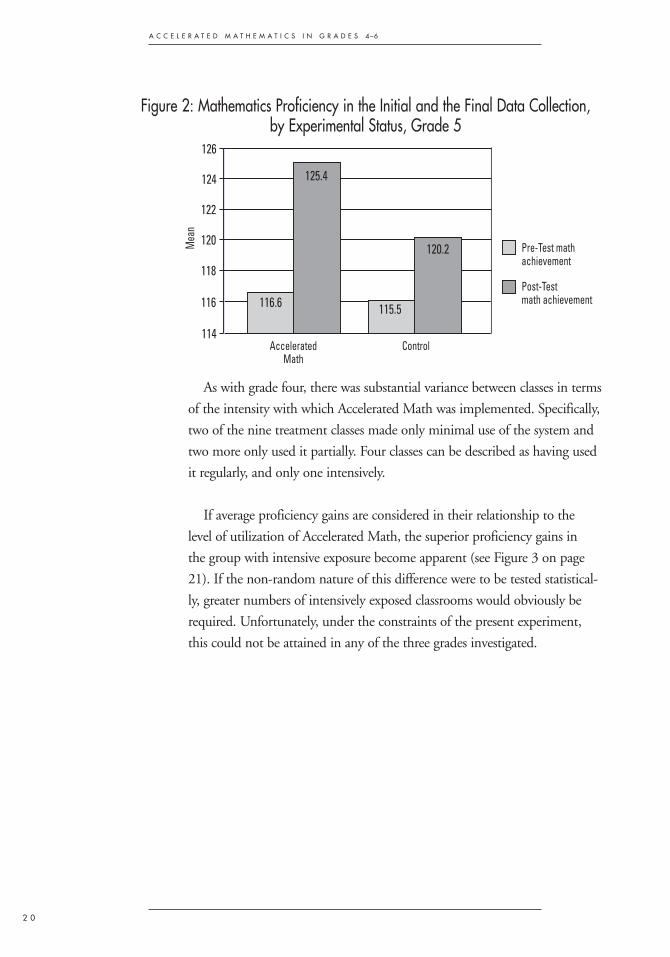
Fifth Grade. Substantial mathematics proficiency gains were again
observed both in Accelerated Math and control classes, but these gains
were about twice as large for Accelerated Math classes as control classes.
As shown in Table 3 (page 19), Accelerated Math classes achieved an
average increase from pre- to post-test of nine proficiency points, or about
one-third of a standard deviation—an amazing growth, given the short
duration of the experiment. This compares with an increase for the control
classes of 5 proficiency points, or about 19 percent of a standard devia-
tion—a respectable rate of progress compared to average achievement gains
in comparable grade levels and observation periods.
Figure 1: Mathematics Proficiency in the Initial and the Final DataCollection, by Class and Experimental Status, Grade 4
20
0
40
60
80
100
120
140
160
16 8 11105
15
105
13
112
17
112
13
116
10
126104
97
AM 21 AM 12 AM 31
Class CodesAM=Accelerated Math
Mea
n Pre
test
Achie
veme
nt, G
rowt
h
AM 51 Control22
Control11
Control32
Growth in Math Achievement
Pretest Math Achievement
Control52
A C C E L E R A T E D M A T H E M A T I C S I N G R A D E S 4–6
1 9
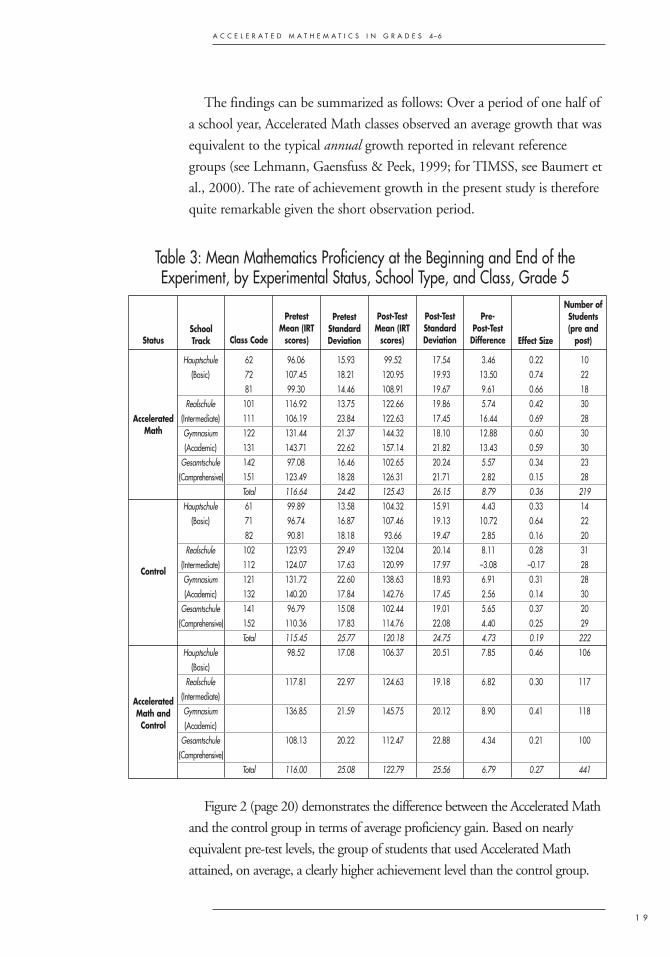
The findings can be summarized as follows: Over a period of one half of
a school year, Accelerated Math classes observed an average growth that was
equivalent to the typical annual growth reported in relevant reference
groups (see Lehmann, Gaensfuss & Peek, 1999; for TIMSS, see Baumert et
al., 2000). The rate of achievement growth in the present study is therefore
quite remarkable given the short observation period.
Figure 2 (page 20) demonstrates the difference between the Accelerated Math
and the control group in terms of average proficiency gain. Based on nearly
equivalent pre-test levels, the group of students that used Accelerated Math
attained, on average, a clearly higher achievement level than the control group.
Status
AcceleratedMath
Control
AcceleratedMath andControl
Hauptschule 62 96.06 15.93 99.52 17.54 3.46 0.22 10(Basic) 72 107.45 18.21 120.95 19.93 13.50 0.74 22
81 99.30 14.46 108.91 19.67 9.61 0.66 18Realschule 101 116.92 13.75 122.66 19.86 5.74 0.42 30
(Intermediate) 111 106.19 23.84 122.63 17.45 16.44 0.69 28Gymnasium 122 131.44 21.37 144.32 18.10 12.88 0.60 30(Academic) 131 143.71 22.62 157.14 21.82 13.43 0.59 30
Gesamtschule 142 97.08 16.46 102.65 20.24 5.57 0.34 23(Comprehensive) 151 123.49 18.28 126.31 21.71 2.82 0.15 28
Total 116.64 24.42 125.43 26.15 8.79 0.36 219Hauptschule 61 99.89 13.58 104.32 15.91 4.43 0.33 14
(Basic) 71 96.74 16.87 107.46 19.13 10.72 0.64 2282 90.81 18.18 93.66 19.47 2.85 0.16 20
Realschule 102 123.93 29.49 132.04 20.14 8.11 0.28 31(Intermediate) 112 124.07 17.63 120.99 17.97 –3.08 –0.17 28Gymnasium 121 131.72 22.60 138.63 18.93 6.91 0.31 28(Academic) 132 140.20 17.84 142.76 17.45 2.56 0.14 30
Gesamtschule 141 96.79 15.08 102.44 19.01 5.65 0.37 20(Comprehensive) 152 110.36 17.83 114.76 22.08 4.40 0.25 29
Total 115.45 25.77 120.18 24.75 4.73 0.19 222Hauptschule 98.52 17.08 106.37 20.51 7.85 0.46 106
(Basic)Realschule 117.81 22.97 124.63 19.18 6.82 0.30 117
(Intermediate)Gymnasium 136.85 21.59 145.75 20.12 8.90 0.41 118(Academic)
Gesamtschule 108.13 20.22 112.47 22.88 4.34 0.21 100(Comprehensive)
Total 116.00 25.08 122.79 25.56 6.79 0.27 441
School Track Class Code
PretestMean (IRT
scores)
Post-TestMean (IRT
scores)
PretestStandardDeviation
Number ofStudents(pre and
post)
Post-TestStandardDeviation
Pre-Post-Test
Difference Effect Size
Table 3: Mean Mathematics Proficiency at the Beginning and End of theExperiment, by Experimental Status, School Type, and Class, Grade 5
A C C E L E R A T E D M A T H E M A T I C S I N G R A D E S 4–6
2 0
As with grade four, there was substantial variance between classes in terms
of the intensity with which Accelerated Math was implemented. Specifically,
two of the nine treatment classes made only minimal use of the system and
two more only used it partially. Four classes can be described as having used
it regularly, and only one intensively.
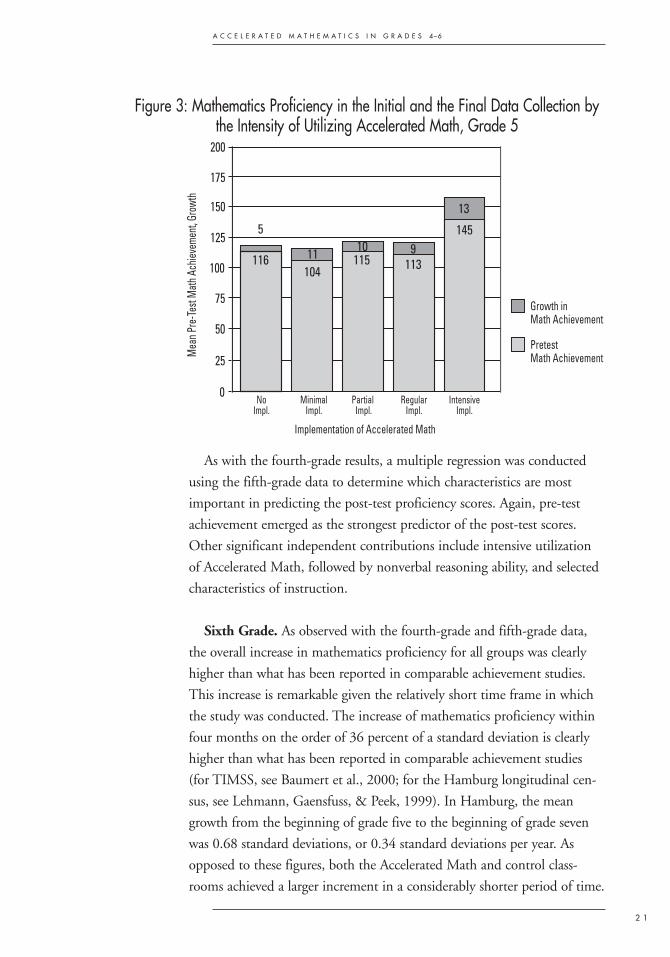
If average proficiency gains are considered in their relationship to the
level of utilization of Accelerated Math, the superior proficiency gains in
the group with intensive exposure become apparent (see Figure 3 on page
21). If the non-random nature of this difference were to be tested statistical-
ly, greater numbers of intensively exposed classrooms would obviously be
required. Unfortunately, under the constraints of the present experiment,
this could not be attained in any of the three grades investigated.
116
114
118
120
122
124
126
AcceleratedMath
Control
Mea
n
Pre-Test math achievement
Post-Testmath achievement116.6 115.5
120.2
125.4
Figure 2: Mathematics Proficiency in the Initial and the Final Data Collection, by Experimental Status, Grade 5
A C C E L E R A T E D M A T H E M A T I C S I N G R A D E S 4–6
2 1
As with the fourth-grade results, a multiple regression was conducted
using the fifth-grade data to determine which characteristics are most
important in predicting the post-test proficiency scores. Again, pre-test
achievement emerged as the strongest predictor of the post-test scores.
Other significant independent contributions include intensive utilization
of Accelerated Math, followed by nonverbal reasoning ability, and selected
characteristics of instruction.
Sixth Grade. As observed with the fourth-grade and fifth-grade data,
the overall increase in mathematics proficiency for all groups was clearly
higher than what has been reported in comparable achievement studies.
This increase is remarkable given the relatively short time frame in which
the study was conducted. The increase of mathematics proficiency within
four months on the order of 36 percent of a standard deviation is clearly
higher than what has been reported in comparable achievement studies
(for TIMSS, see Baumert et al., 2000; for the Hamburg longitudinal cen-
sus, see Lehmann, Gaensfuss, & Peek, 1999). In Hamburg, the mean
growth from the beginning of grade five to the beginning of grade seven
was 0.68 standard deviations, or 0.34 standard deviations per year. As
opposed to these figures, both the Accelerated Math and control class-
rooms achieved a larger increment in a considerably shorter period of time.
25
0
50
75
100
125
150
175
200
11 10115
104 1139
13
145
116
5
NoImpl.
MinimalImpl.
Partial Impl.
RegularImpl.
IntensiveImpl.
Implementation of Accelerated Math
Mea
n Pre
-Test
Mat
h Ach
ievem
ent, G
rowt
h
Growth in Math Achievement
Pretest Math Achievement
Figure 3: Mathematics Proficiency in the Initial and the Final Data Collection bythe Intensity of Utilizing Accelerated Math, Grade 5
A C C E L E R A T E D M A T H E M A T I C S I N G R A D E S 4–6
2 2
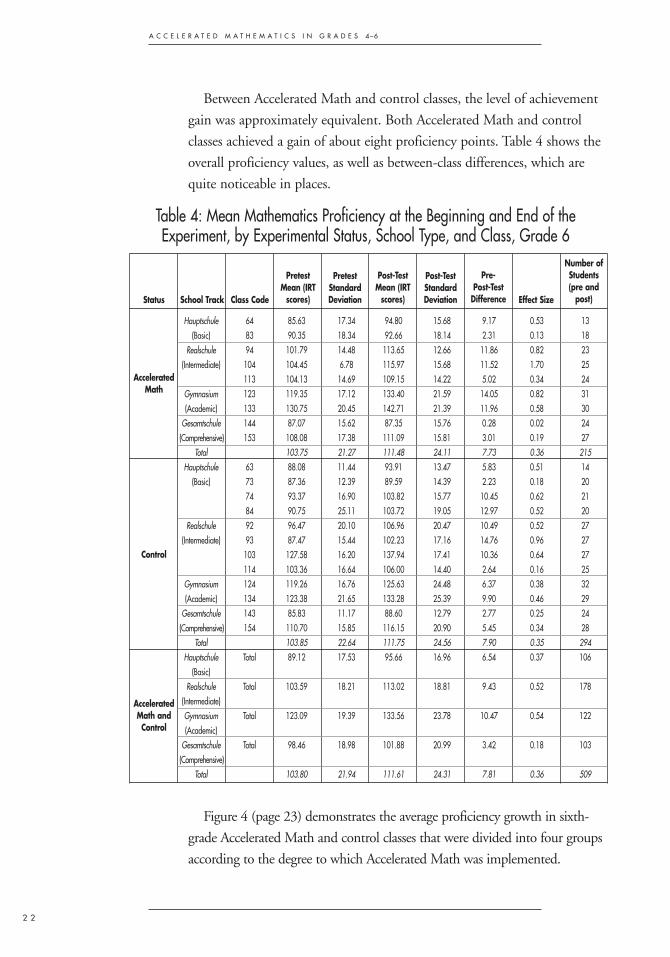
Between Accelerated Math and control classes, the level of achievement
gain was approximately equivalent. Both Accelerated Math and control
classes achieved a gain of about eight proficiency points. Table 4 shows the
overall proficiency values, as well as between-class differences, which are
quite noticeable in places.
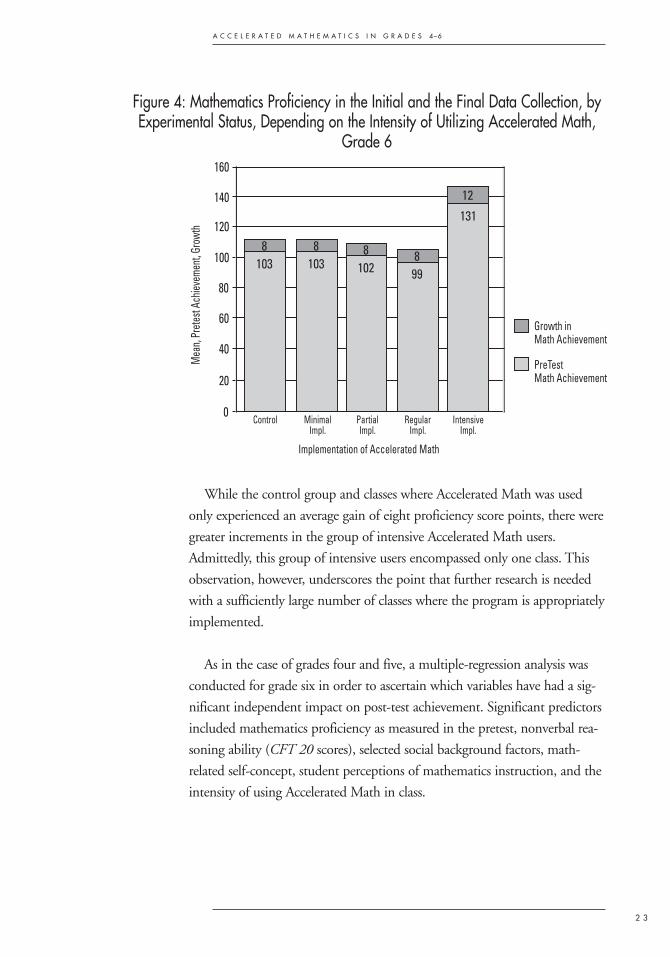
Figure 4 (page 23) demonstrates the average proficiency growth in sixth-
grade Accelerated Math and control classes that were divided into four groups
according to the degree to which Accelerated Math was implemented.
Status
AcceleratedMath
Control
AcceleratedMath andControl
Hauptschule 64 85.63 17.34 94.80 15.68 9.17 0.53 13(Basic) 83 90.35 18.34 92.66 18.14 2.31 0.13 18
Realschule 94 101.79 14.48 113.65 12.66 11.86 0.82 23(Intermediate) 104 104.45 6.78 115.97 15.68 11.52 1.70 25
113 104.13 14.69 109.15 14.22 5.02 0.34 24Gymnasium 123 119.35 17.12 133.40 21.59 14.05 0.82 31(Academic) 133 130.75 20.45 142.71 21.39 11.96 0.58 30
Gesamtschule 144 87.07 15.62 87.35 15.76 0.28 0.02 24(Comprehensive) 153 108.08 17.38 111.09 15.81 3.01 0.19 27
Total 103.75 21.27 111.48 24.11 7.73 0.36 215Hauptschule 63 88.08 11.44 93.91 13.47 5.83 0.51 14
(Basic) 73 87.36 12.39 89.59 14.39 2.23 0.18 2074 93.37 16.90 103.82 15.77 10.45 0.62 2184 90.75 25.11 103.72 19.05 12.97 0.52 20
Realschule 92 96.47 20.10 106.96 20.47 10.49 0.52 27(Intermediate) 93 87.47 15.44 102.23 17.16 14.76 0.96 27
103 127.58 16.20 137.94 17.41 10.36 0.64 27114 103.36 16.64 106.00 14.40 2.64 0.16 25
Gymnasium 124 119.26 16.76 125.63 24.48 6.37 0.38 32(Academic) 134 123.38 21.65 133.28 25.39 9.90 0.46 29
Gesamtschule 143 85.83 11.17 88.60 12.79 2.77 0.25 24(Comprehensive) 154 110.70 15.85 116.15 20.90 5.45 0.34 28
Total 103.85 22.64 111.75 24.56 7.90 0.35 294Hauptschule Total 89.12 17.53 95.66 16.96 6.54 0.37 106
(Basic)Realschule Total 103.59 18.21 113.02 18.81 9.43 0.52 178
(Intermediate)Gymnasium Total 123.09 19.39 133.56 23.78 10.47 0.54 122(Academic)
Gesamtschule Total 98.46 18.98 101.88 20.99 3.42 0.18 103(Comprehensive)
Total 103.80 21.94 111.61 24.31 7.81 0.36 509
Post-TestMean (IRT
scores)
PretestStandardDeviationSchool Track Class Code
PretestMean (IRT
scores)
Number ofStudents(pre and
post)
Post-TestStandardDeviation
Pre-Post-Test
Difference Effect Size
Table 4: Mean Mathematics Proficiency at the Beginning and End of theExperiment, by Experimental Status, School Type, and Class, Grade 6
A C C E L E R A T E D M A T H E M A T I C S I N G R A D E S 4–6
2 3
While the control group and classes where Accelerated Math was used
only experienced an average gain of eight proficiency score points, there were
greater increments in the group of intensive Accelerated Math users.
Admittedly, this group of intensive users encompassed only one class. This
observation, however, underscores the point that further research is needed
with a sufficiently large number of classes where the program is appropriately
implemented.
As in the case of grades four and five, a multiple-regression analysis was
conducted for grade six in order to ascertain which variables have had a sig-
nificant independent impact on post-test achievement. Significant predictors
included mathematics proficiency as measured in the pretest, nonverbal rea-
soning ability (CFT 20 scores), selected social background factors, math-
related self-concept, student perceptions of mathematics instruction, and the
intensity of using Accelerated Math in class.
20
0
40
60
80
100
120
140
160
998
12
131
1038
1038
1028
Control MinimalImpl.
PartialImpl.
RegularImpl.
IntensiveImpl.
Implementation of Accelerated Math
Mea
n, Pr
etes
t Ach
ievem
ent, G
rowt
h
Growth in Math Achievement
PreTestMath Achievement
Figure 4: Mathematics Proficiency in the Initial and the Final Data Collection, byExperimental Status, Depending on the Intensity of Utilizing Accelerated Math,
Grade 6
2 4
A C C E L E R A T E D M A T H E M A T I C S I N G R A D E S 4–6
A number of case studies show that cognitive gains are highly dependent
on the learning context and the learning opportunities as provided by the
individual teacher (e.g., Ditton, 1997). The original study design had called
for the same teachers teaching both in an Accelerated Math class and a con-
trol class in order to control for teacher personality and didactic style.
Although this could not be implemented in all schools, there were a total of
nine teachers who taught, in separate classrooms, both with Accelerated
Math and following their traditional modes of teaching. Four of these nine
teachers taught both groups at the same grade level (treatment and control
class either both grade five or both grade six). The remaining five have
taught one of the groups in grade five and the other in grade six.
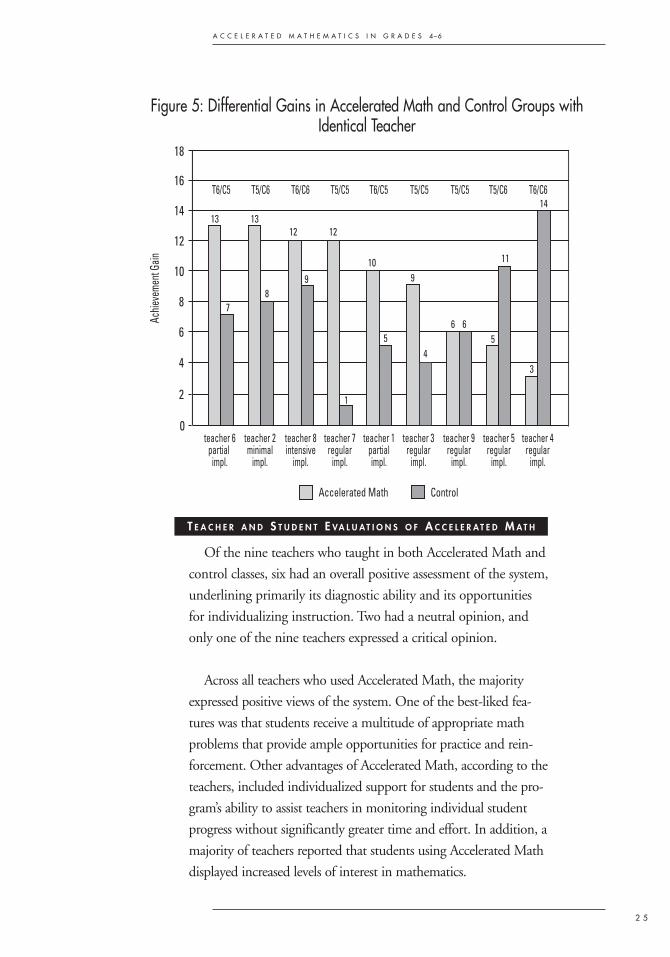
From the analysis we conclude that six of the nine teachers attained higher
gains in their Accelerated Math classes. In two cases, the control classes appear
to have been more successful, and in one case there was no difference
between Accelerated Math and the control group. Figure 5 (page 25)
demonstrates the proficiency gains in the Accelerated Math and control
classes that were taught by the same teacher.
S E L E C T E D C A S E S T U D E I S : T E A C H E R S W H O TA U G H T B O T H
A C C E L E R A T E D M A T H A N D C O N T R O L C L A S S E S
A C C E L E R A T E D M A T H E M A T I C S I N G R A D E S 4–6
2 5
2
0
4
6
8
10
12
14
16
13 1312 12
109
1
54
9
6 65
11
14
3
87
18
teacher 6partial
impl.
T6/C5 T5/C6 T6/C6 T5/C5 T6/C5 T5/C5 T5/C5 T5/C6 T6/C6
teacher 2minimal
impl.
teacher 8intensive
impl.
teacher 7regular
impl.
teacher 1partialimpl.
teacher 3regular
impl.
teacher 9regular
impl.
teacher 5regular
impl.
teacher 4regular
impl.
Accelerated Math
Achie
veme
nt G
ain
Control
Figure 5: Differential Gains in Accelerated Math and Control Groups withIdentical Teacher
Of the nine teachers who taught in both Accelerated Math and
control classes, six had an overall positive assessment of the system,
underlining primarily its diagnostic ability and its opportunities
for individualizing instruction. Two had a neutral opinion, and
only one of the nine teachers expressed a critical opinion.
Across all teachers who used Accelerated Math, the majority
expressed positive views of the system. One of the best-liked fea-
tures was that students receive a multitude of appropriate math
problems that provide ample opportunities for practice and rein-
forcement. Other advantages of Accelerated Math, according to the
teachers, included individualized support for students and the pro-
gram’s ability to assist teachers in monitoring individual student
progress without significantly greater time and effort. In addition, a
majority of teachers reported that students using Accelerated Math
displayed increased levels of interest in mathematics.
T E A C H E R A N D S T U D E N T E VA L U A T I O N S O F A C C E L E R A T E D M A T H
2 6
A C C E L E R A T E D M A T H E M A T I C S I N G R A D E S 4–6
When asked whether or not they would prefer to return to their old
teaching methods, most (65 percent) indicated that they preferred using
Accelerated Math while the rest (35 percent) preferred a return to their
conventional teaching techniques.
Teachers who used Accelerated Math completed a survey that asked
them to report their level of agreement or disagreement with several state-
ments regarding Accelerated Math. Both positive and negative statements
regarding Accelerated Math were included in the survey. The statements
having the strongest level of agreement were all positive. They are as follows,
in order of agreement:
• I liked the fact that students could practice that much;
• The new approach [Accelerated Math] motivated our students well;
• The new approach [Accelerated Math] enabled the students to deter-
mine their pace of learning;
• Individual instruction is possible with this new approach
[Accelerated Math]; and
• The students have a greater interest with this approach
[Accelerated Math].
Students in Accelerated Math classrooms were asked to complete a simi-
lar survey in which they were given a series of positive and negative state-
ments regarding the system. Similar to the teachers, students most strongly
agreed with positive statements regarding Accelerated Math. The statements
having the strongest level of agreement were as follows, in order of agreement:
• I enjoyed working with this new approach in math [Accelerated Math];
• I liked that I could practice a lot;
• With this new method [Accelerated Math] I can judge what goals
I achieved;
• I like the new method [Accelerated Math] better than the way the
lessons were before; and
• I like that I could decide how fast I would learn.
A C C E L E R A T E D M A T H E M A T I C S I N G R A D E S 4–6
2 7
Implementation of Accelerated Math on an experimental basis in grades
four, five, and six from 14 NRW schools had mixed effects overall. In grade
five, students using Accelerated Math demonstrated pre-post achievement
gains that were about double that of students in control classes using tradi-
tional methods. In grades four and six, however, there was little difference
in the gains produced by Accelerated Math and control students. Overall
though, both Accelerated Math and control students had unusually high
gains over a relatively short period of instruction (four months) when
compared with national and regional mathematics achievement data.
The extent to which teachers used Accelerated Math in their classrooms
was assessed, and across all grades, the classrooms in which the Accelerated
Math program was fully implemented (i.e., used intensively) produced the
largest gains in mathematics achievement. Classrooms in which Accelerated
Math was used to a lesser extent achieved about the same gains as control
classes. However, due to the relatively small number of classes that used the
system intensively, further analyses with a sufficient number of classes in
which the program was fully implemented would be needed.
The original study design called for the same teachers to teach both in an
Accelerated Math class and a control class to control for teacher characteris-
tics. While this design proved impractical in some schools, nine teachers did
teach both groups, allowing us to control for teacher characteristics. In six
out of these nine cases, achievement gains in the Accelerated Math classes
were higher than those in the control group.
When surveyed about their experiences using Accelerated Math,
teachers described it as an interesting new approach to teaching and learn-
ing mathematics. They rated highly its abilities to generate appropriate
work for students and to help them to systematically monitor individual
student progress. Most also indicated that levels of student motivation and
interest in mathematics increased after being exposed to Accelerated Math.
C O N C L U S I O N
2 8
A C C E L E R A T E D M A T H E M A T I C S I N G R A D E S 4–6
Baumert, J., Köller, O., Lehrke, M. & Brockmann, J. (2000). Anlage
und Druchführung der Dritten Internationalen Mathematik- und
Naturwissenschaftsstudie zur Sekundarstufe II (TIMSS/III) – Technische
Grundlagen. In Baumert, J., Bos, W. & Lehmann, R. H. (Hrsg.), Dritte
Internationalen Mathematik- und Naturwissenschaftsstudie.
Mathematische und naturwissenschaftliche Bildung am Ende der
Schullaufbahn. Opladen: Leske und Budrich, 31–84.
Bos, W. & Pietsch, M. (2004). Erste Ergebnisse aus KESS 4 – Kurzbericht.
http://www.erzwiss.uni-hanburg.de/Kess/kurzbericht.pdf.
Cattel, R. B. (1960). Culture Fair Intelligence Test, Scale 2 (Handbuch). 3.
Auflage, III., IPAT.
Fischer, G.H. & Molenaar, I. W. (1995). Rasch models – Foundations,
recent developments, and applications. New York: Springer.
Ditton, H. (1997). Wirkung und Wirksamkeit der Einzelschule – Analysen
der Bedeutsam-keit der verschiedenen Ebenen des Schulsystems. In
Lehmann, R. H., Venter, G., Buer, J. van, Seeber, S. & Peek, R. (Hrsg.),
Erweiterte Autonomie für Schule – Bildungscontrolling und Evaluation.
Studien zur Wirtschafts- und Erwachsenenpädagogik aus der Humboldt-
Universität zu Berlin. Band 13.2. Abschlussband zur gleichnamigen
Sommerakademie vom 31. August bis 6. September 1997 in Ungarn.
Ny_regyháza-Berlin.
Ditton, H. (2001). Skalendokumentationen zum DFG-Projekt
“Bildungsqualität von Schule und Unterricht.”
www.quassu.net/seite4.html.
Lehmann, R. H., Peek, R. & Gaensfuss, R. (1997). Aspekte der
Lernausgangslage von Schülerinnen und Schülern der fünften Klassen an
Hamburger Schulen. Behörde für Schule, Jugend und Berufsbildung,
Amt für Schule, Hamburg.
B I B L I O G R A P H Y O F F U L L R E P O R T
A C C E L E R A T E D M A T H E M A T I C S I N G R A D E S 4–6
2 9
Lehmann, R. H., Gaensfuss, R. & Peek, R. (1999). Aspekte der
Lernausgangslage und der Lernentwicklung. Ergebnisse der
Längsschnittstudie für die Klassenstufe 7. Behörde für Schule, Jugend
und Berufsbildung, Amt für Schule, Hamburg.
Lehmann, R. H., Peek, R., Gaensfuss, R. & Hussfeld, V. (2001). Aspekte
der Lernausgangs-lage und der Lernentwicklung. Ergebnisse der
Längsschnittstudie für die Klassenstufe 9. Behörde für Schule, Jugend
und Berufsbildung, Amt für Schule, Hamburg.
Lehmann, R. H., & Nikolova, R. (2004). Erhebung zum Lese- und
Mathematikverständnis, Entwicklungen in den Jahrgangsstufen 4 bis 6 in
Berlin. http://www. Senbjs.berlin.de/ bildung/qualitaetssicherung/
element_ersterbericht.pdf.
Weiss, R. H. (1998). Grundintelligenztest Skala 2, CFT 20.
Handanweisung. Göttingen: Hogrefe.
3 0
A C C E L E R A T E D M A T H E M A T I C S I N G R A D E S 4–6
Renaissance Learning is a world leader in learning
information system (LIS) technology and online computer assessments for K–12
schools. Founded in 1986, Renaissance Learning employs 1,000 people at five U.S.
locations and four international sites—the United Kingdom, India, Australia, and
Canada.
More than 67,000 schools, 500,000 teachers, and 15 million students use Renaissance
LISs daily. By providing instructional leaders with more and better information on stu-
dent progress and achievement, Renaissance LISs support and enhance virtually any
curriculum and instructional program. More than 150 Renaissance consultants provide
professional development and consulting services that show educators how to best use
computerized information systems to improve instructional decisions.
Renaissance technology includes such well-known Tier 1 LISs as Accelerated Reader,
Accelerated Math, and Accelerated Writer; Tier 2 LISs such as STAR Reading, STAR
Early Literacy, STAR Math, and StandardsMaster; and Renaissance Place, the web-
based results management system for instructional leaders.
R E N A I S S A N C E L E A R N I N G


P O B O X 8 0 3 6W I S C O N S I N R A P I D S , W I 5 4 4 9 5 - 8 0 3 6( 8 6 6 ) 8 4 6 - 7 3 2 3W W W. R E N L E A R N . C O M
L2178.0405.SW.1.5M


![Discovering Uniformly Accelerated Motion [11th-12th grades]](https://static.fdocuments.net/doc/165x107/61bea5814a30342b1a312ab8/discovering-uniformly-accelerated-motion-11th-12th-grades.jpg)

![Southbridge Accelerated Improvement Plan 2012 · Web view... HOTS 48% [Data – Monthly TeachPoint data of observed changes] Short-term Outcomes: 75% of students in grades K – 12](https://static.fdocuments.net/doc/165x107/5acf09407f8b9a4e7a8c18b8/southbridge-accelerated-improvement-plan-view-hots-48-data-monthly-teachpoint.jpg)

