Accelerated Artificial Corrosion Monitoring of … with Purpose Accelerated Artificial Corrosion...
29
Learning with Purpose Learning with Purpose Accelerated Artificial Corrosion Monitoring of Reinforced Concrete Slabs Using the Half- Cell Potential Method Justin Wilson a and Tzu-Yang Yu b a Master's Student b Assistant Professor, Ph.D. Department of Civil and Environmental Engineering University of Massachusetts Lowell SAGEEP 2013 March 19, 2013 Denver, CO Session 4: Applications of GPR: Civil Infrastructure
-
Upload
nguyenxuyen -
Category
Documents
-
view
224 -
download
1
Transcript of Accelerated Artificial Corrosion Monitoring of … with Purpose Accelerated Artificial Corrosion...
Learning with PurposeLearning with Purpose
Accelerated Artificial Corrosion Monitoring of Reinforced
Concrete Slabs Using the Half-Cell Potential MethodJustin Wilson a and Tzu-Yang Yu b
a Master's Studentb Assistant Professor, Ph.D.
Department of Civil and Environmental EngineeringUniversity of Massachusetts Lowell
SAGEEP 2013March 19, 2013
Denver, COSession 4: Applications of GPR: Civil Infrastructure
Learning with Purpose 2
Motivation and ObjectiveExperimental Approach• Accelerated corrosion test• Data collection
Results• Data modeling
ConclusionsAcknowledgementsReferences
OverviewOverview

Learning with Purpose 3
• Why Monitor Corrosion?– Corrosion affects the
service life of concrete structures
– Corrosion is inevitable
– Many structures were built with unprotected rebar
• Half-Cell Potential– Standardized test– Proven Reliability
Motivation and ObjectiveMotivation and ObjectiveMotivation and Objective
(Source: www.fhwa.dot.gov)
Learning with Purpose 4
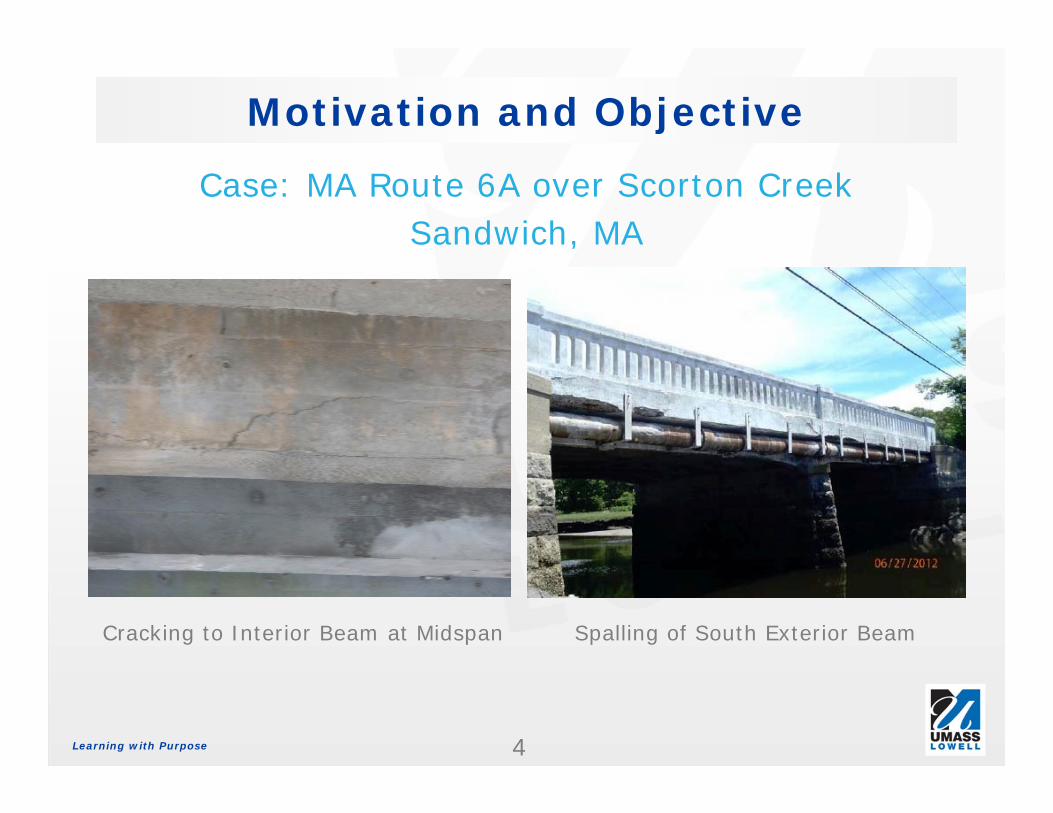
Motivation and ObjectiveMotivation and Objective
Case: MA Route 6A over Scorton CreekSandwich, MA
Spalling of South Exterior BeamCracking to Interior Beam at Midspan

Learning with Purpose 5
Determine how the spatial distribution of half-cell potential (HCP) measurements on Reinforced Concrete (RC) slabs change in timePerform a visual inspection to validate the resultsDevelop parameters for the distribution of HCP in the time domainCompare the HCP data at varying concrete covers to an non-ponded RC slab in the same environment
Motivation and ObjectiveMotivation and ObjectiveGoals

Learning with Purpose 6
Experimental ApproachExperimental Approach

Learning with Purpose 7
Experimental ApproachExperimental Approach
Concrete Laboratory, CEE, UMass Lowell

Learning with Purpose 8
Adapted version of the Modified Southern Exposure Test [2]
Controlled environment• Relative humidity kept to 50%• Temperature 73oF when ponding• Temperature 100oF when drying
Slabs ponded in weekly cycles for 52 weeks• 4 days of ponding• 3 days of drying
Slabs covered with a tarp to keep conditions constant
Experimental ApproachExperimental Approach
Learning with Purpose 9
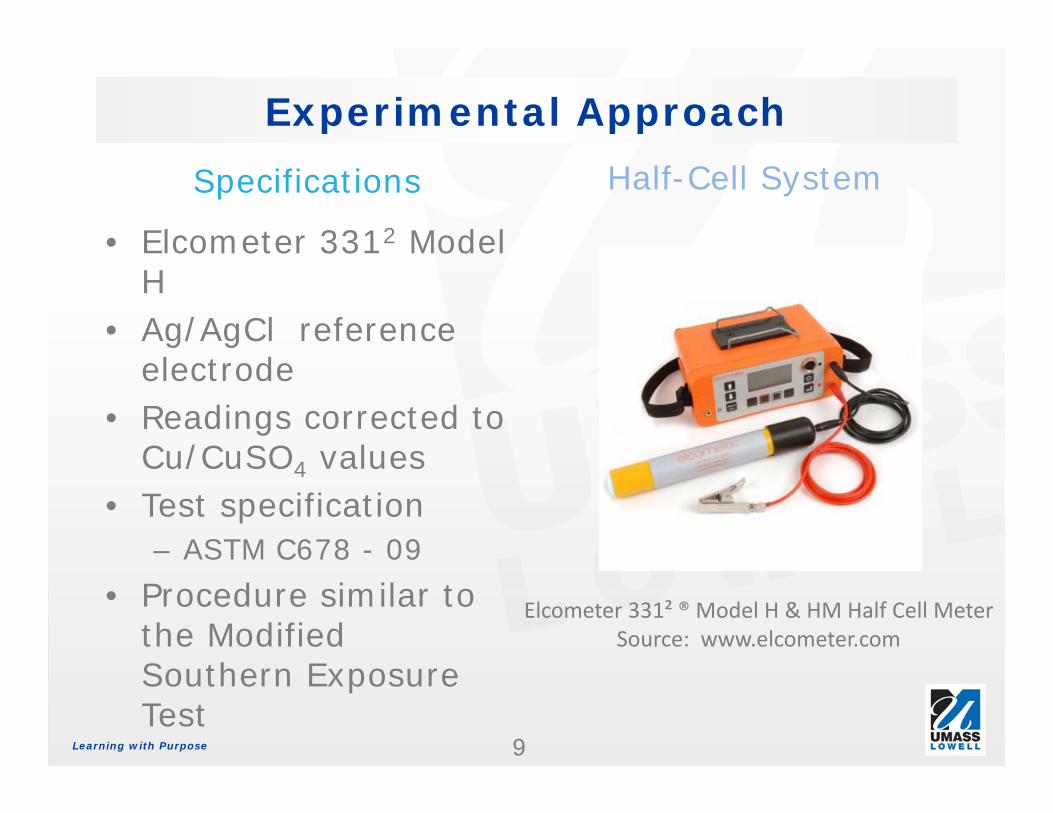
• Elcometer 3312 Model H
• Ag/AgCl reference electrode
• Readings corrected to Cu/CuSO4 values
• Test specification– ASTM C678 - 09
• Procedure similar to the Modified Southern Exposure Test
Experimental ApproachExperimental ApproachSpecifications Half-Cell System
Elcometer 331² ® Model H & HM Half Cell MeterSource: www.elcometer.com
Learning with Purpose 10
Concrete Cover• Influences the rate of corrosion
Location of Measurement• Least resistivity when measurements are taken
directly over the barsWater Content• Affects the resistivity of the concrete
Atmospheric Conditions• Affects the water content of the slab
Experimental ApproachExperimental ApproachFactors Affecting HCP Measurement
Learning with Purpose 11
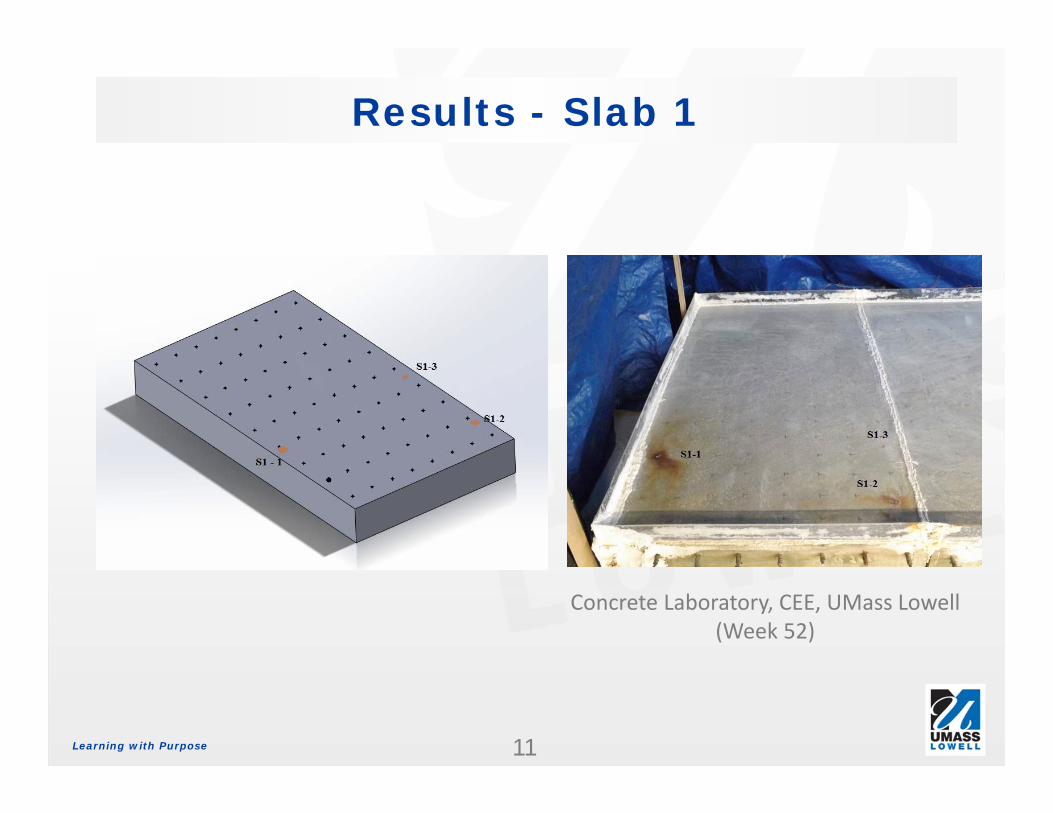
Results - Slab 1Results - Slab 1
Concrete Laboratory, CEE, UMass Lowell(Week 52)

Learning with Purpose 12
Results – Slab 1Results – Slab 1
S1-1
HCP = -530 mVConcrete Laboratory, CEE, UMass Lowell
(Week 52)
Learning with Purpose 13
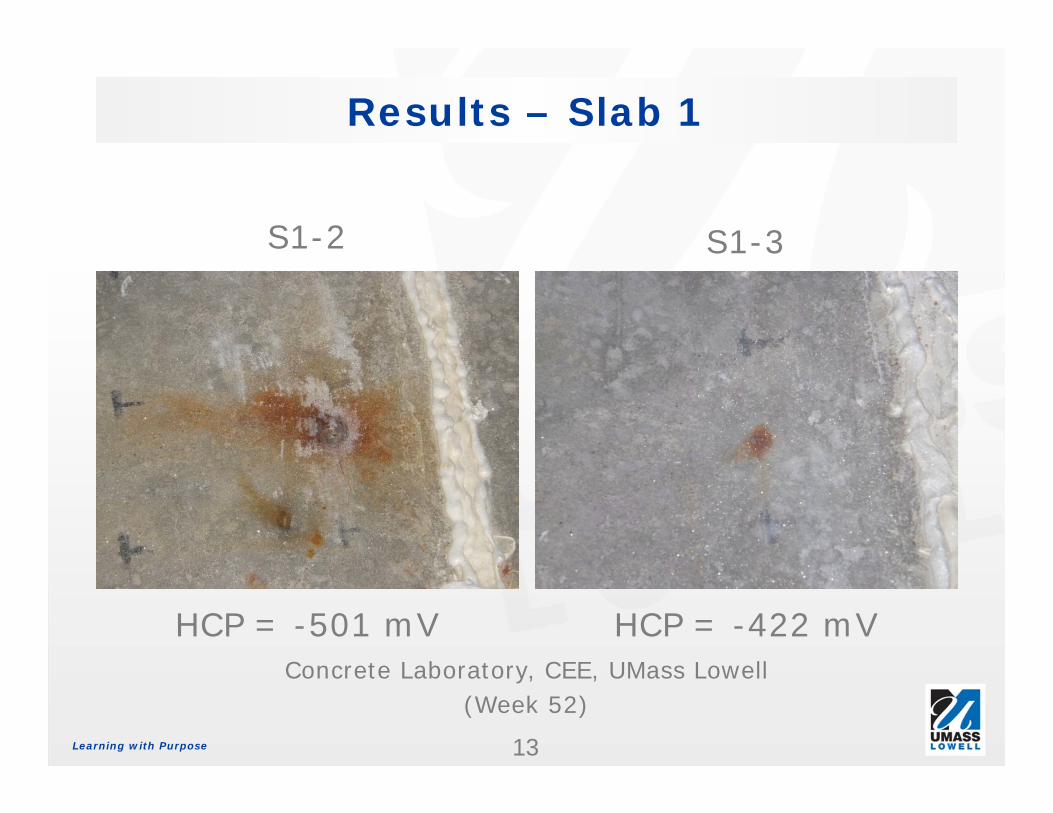
Results – Slab 1Results – Slab 1
S1-2 S1-3
HCP = -501 mV HCP = -422 mVConcrete Laboratory, CEE, UMass Lowell
(Week 52)
Learning with Purpose 14
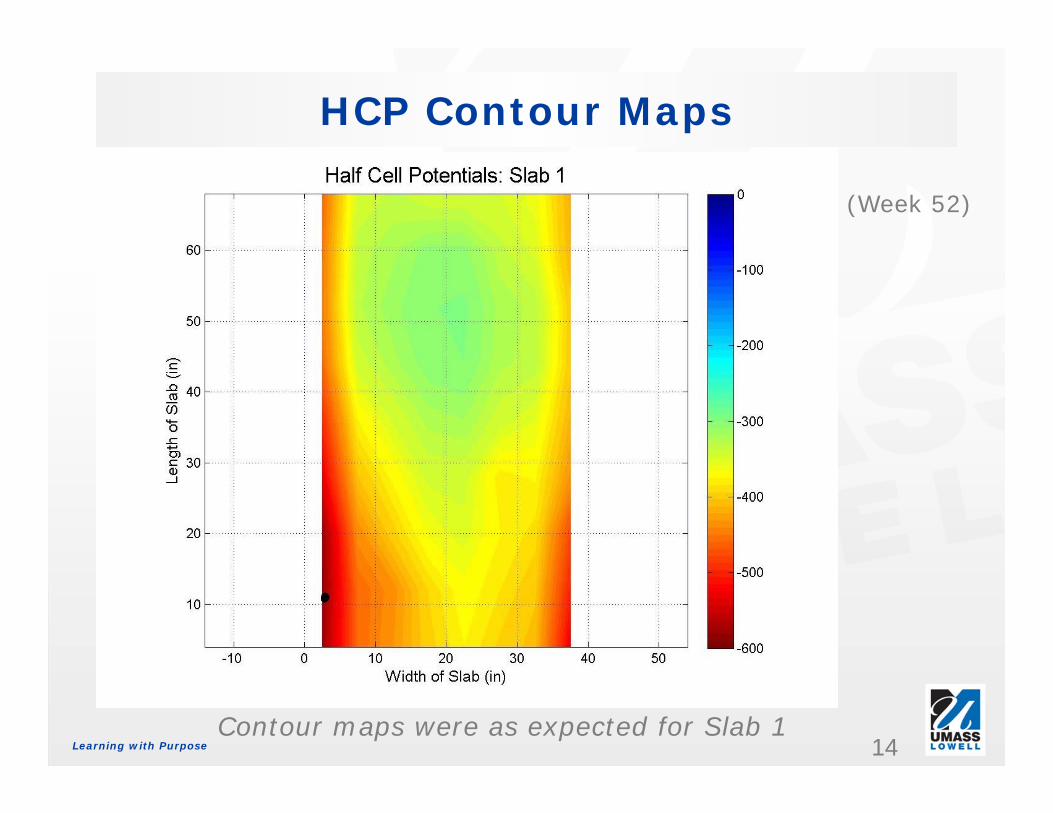
HCP Contour MapsHCP Contour Maps
Contour maps were as expected for Slab 1
(Week 52)
Learning with Purpose 15
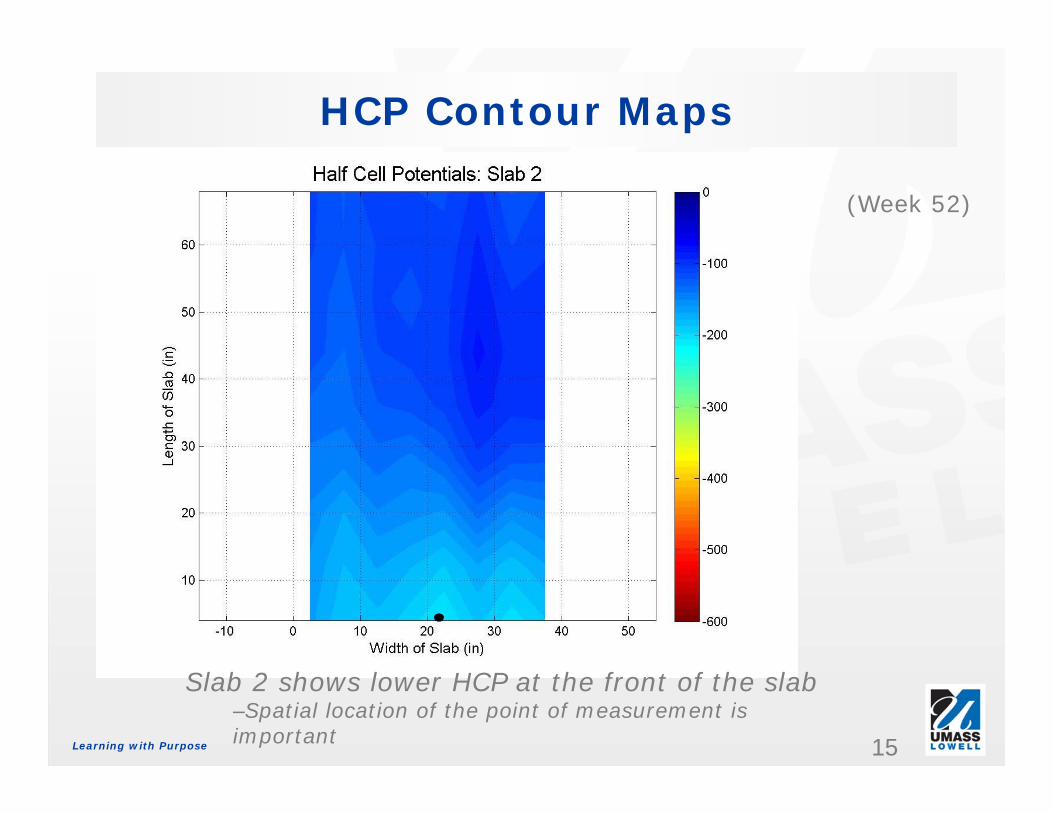
HCP Contour MapsHCP Contour Maps
(Week 52)
Slab 2 shows lower HCP at the front of the slab–Spatial location of the point of measurement is important

Learning with Purpose 16
HCP Contour MapsHCP Contour Maps
Slab 3 shows more corrosion with areas of less concrete cover
–Variations in concrete cover affect HCP
(Week 52)

Learning with Purpose 17
HCP Contour MapsHCP Contour Maps
The contour map for Slab 4 was as expected–It shows minor variations across the entire slab
(Week 52)

Learning with Purpose 18
Average HCP vs. TimeAverage HCP vs. TimeGraphical Representation

Learning with Purpose 19
All Slabs show an increase until Week 14• Residual pore water
Slab 2 stays fairly constant after Week 28• About (-140 mV)
Slab 3 shows more variability than Slab 2, but stays relatively constant after Week 24• About (-240 mV)
Slab 4 is more noisy than the minimum values
Average HCP vs. TimeAverage HCP vs. TimeObservations

Learning with Purpose 20
Parameter Slab 1 Slab 2 Slab 3 Slab 4
P1 3.399e‐4 ‐3.614e‐5 ‐4.226e‐5 ‐3.736e‐4
P2 ‐3.102e‐2 4.985e‐3 1.138e‐2 4.444e‐2
P3 0.6127 ‐0.2572 ‐0.8518 ‐1.725
P4 2.375 7.219 24.43 25.23
P5 ‐280.2 ‐247.3 ‐485.4 ‐263
R2 0.98 0.91 0.66 0.56
Average HCP vs. TimeAverage HCP vs. TimeModel Parameters
Learning with Purpose 21
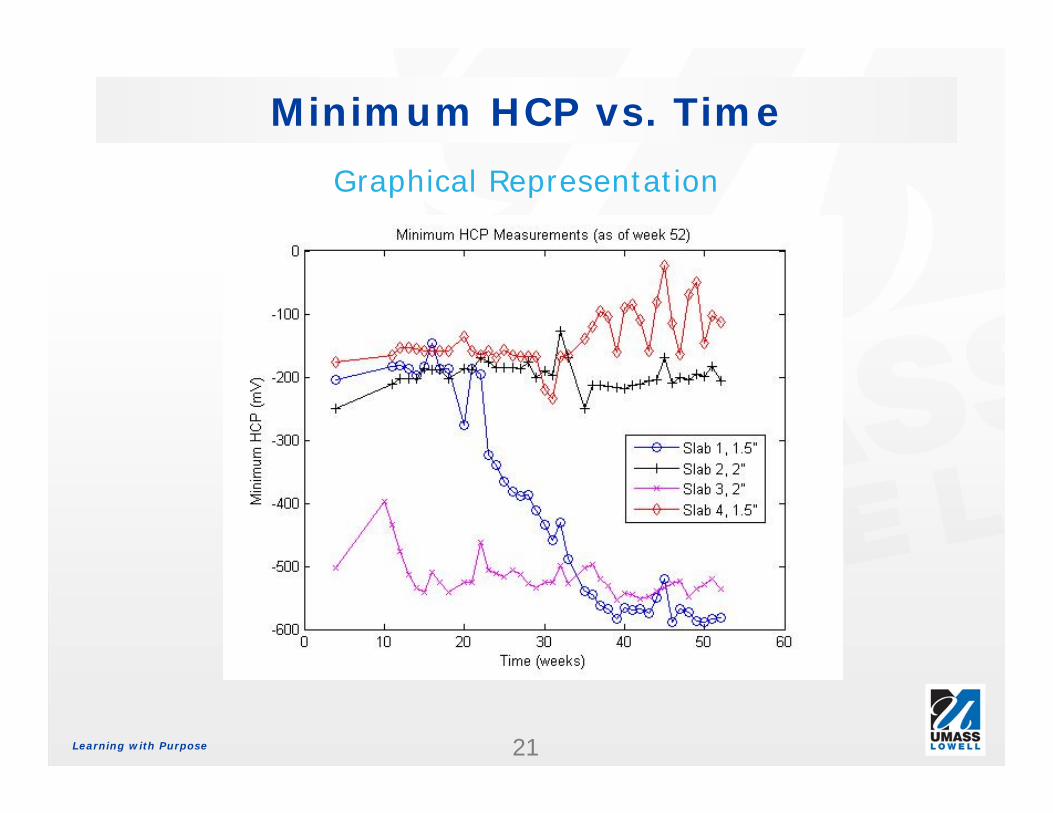
Minimum HCP vs. TimeMinimum HCP vs. TimeGraphical Representation

Learning with Purpose 22
Slab 1 shows an expected, decreasing trendSlab 2 stays fairly constant throughout the entire experiment (-180 mV)Slab 3 dips sharply at the start, but remains constant afterward (-550 mV)• Possible excess mix water trapped in slab
Slab 4 stays constant throughout the first 30 weeks, but rises afterwards (-120 mV)• Possible indicator of background noise
Minimum HCP vs. TimeMinimum HCP vs. TimeObservations

Learning with Purpose 23
Parameter Slab 1 Slab 2 Slab 3 Slab 4
P1 ‐3.722e‐4 1.575e‐5 1.860e‐5 ‐5.037e‐4
P2 6.16e‐2 9.032e‐4 ‐2.116e‐3 5.574e‐2
P3 ‐3.21 ‐0.1928 0.1145 ‐1.988
P4 49.05 6.771 ‐4.405 26.21
P5 ‐377.8 ‐234.4 ‐451.9 ‐261.5
R2 0.97 0.46 0.31 0.51
Minimum HCP vs. TimeMinimum HCP vs. TimeModel Parameters

Learning with Purpose 24
Effect of Concrete CoverEffect of Concrete Cover1.5” Concrete Cover
Slab 1 (Week 52) Slab 4 (Week 52)
47.1% Decrease in Average HCP 53.2% Increase in Average HCP

Learning with Purpose 25
Effect of Concrete CoverEffect of Concrete Cover2” Concrete Cover
Slab 2 (Week 52) Slab 4 (Week 52)
41.1% Increase in Average HCP 50.2% Increase in Average HCP

Learning with Purpose 26
Concrete cover is the most important factor determining the rate of corrosionVisual inspection validates the experimental results• Corrosion observed at the points of lowest HCPData collected on Slab 4 can be used to determine the level of noise in HCP measurements• Further analysis required to denoise the data
ConclusionsConclusions

Learning with Purpose 27
Financial Support from National Institute of Standards and Technology (NIST) Technology Innovation Program (TIP) and Prof. Ming Wang from Northeastern University through the Vehicle Onboard Traffic Embedded Roaming Sensors Project (VOTERS)The authors would also like to thank Carlos Jaquez, Hao Liu, and Ross Gladstone of UMass Lowell for their help in collecting HCP data
AcknowledgementsAcknowledgements

Learning with Purpose 28
1. Frolund, T., Klinghoffer, O., Sorensen, H.E. 2003 “Pro’s and Con’s of Half-cell Potentials and Corrosion Rate Measurements.” Structural Faults and Repair Conference, London, UK, July 1-3.2. Darwin, D., Balma, J., Locke, Jr., C.E., Nguyen, T.V. 2001 “Accelerated Testing for Concrete Reinforcing Bar Corrosion Protection Systems.” Long Term Durability of Structural Materials. 97-108.3. Gulikers, J.J.W. 2009. “Application of a Statistical Procedure ti Evaluate the Results from Potential Mapping on a Parking Garage.” Taylor & Francis Group. 267-273.4. Leelalerkeit, V., Kyung, J-W., Ohtsu, M,. Yokota, M. 2004. “Analysis of Half-Cell Potential Measurement for Corrosion of Reinforced Concrete.” Construction and Building Materials. Vol. 18. 155-162.5. Li, C.Q. July-August 2001, “Initiation of Chloride-induced Reinforcement Corrosion in Concrete Structural Members – Experimentation.” ACI Structural Journal. Vol. 98 #4. 502-510.6. Li, C.Q., Melchers R. September-October 2005. “Time-Dependent Risk Assessment of Structural Deterioration Caused by Reinforcement Corrosion.” ACI Structural Journal. Vol. 102 #5. 754-761.7. Otiento, M.B., Alexander, M.G., Beushausen, H.D. September-October 2010. “Suitability of Various Measurement Techniques for Assessing Corrosion in Cracked Concrete.” ACI Structural Journal. Vol. 107 #5. 481-489.8. Poupard, O., L’Hostis, V., Catinaud, S., Petre-Lazar, I. 2006. “Corrosion Diagnosis of a Reinforced Concrete Beam after 40 Years Natural Exposure in Marine Environment.” Cement and Concrete Research. Vol. 36. 504-520.9. Yuan, Y., Yongsheng, J., Shah, S.P. May-June 2007, “Comparison of Two Accelerated Corrosion Techniques for Concrete Structures.” ACI Structural Journal. Vol.104 #3. 344-347.
ReferencesReferences

Learning with PurposeLearning with Purpose
Thank You for your attention
Questions?