
Academic Presentation Skills - IEEE GCCE › 2015 › AcademicPresentationSkills_EN.pdfAcademic...
75
Academic Presentation Skills National Institute for Environmental Studies GOMI Kei IEEE GCCE 2015 Osaka, Japan 2015/Oct/28
Transcript of Academic Presentation Skills - IEEE GCCE › 2015 › AcademicPresentationSkills_EN.pdfAcademic...

Academic Presentation Skills
National Institute for Environmental StudiesGOMI Kei
IEEE GCCE 2015 Osaka, Japan
2015/Oct/28

/74
ContentsAbout
1. What presentation is, and what it is not
2. No message, no value
3. Three fundamental rules of slides
4. Rehearsal, rehearsal, and rehearsal!
Be Optimistic on the stage
2

/74
About “Academic” presentation
Basic principles of presentations Message and story Preparation of slides Speech
Primary target: Graduate and undergraduate students
3

/74
Japanese material in my blog..
「メッセージとストーリーのない発表はカスだ!
卒修論プレゼンテーションの心得」
五味研究室
Keigomi29.hatenablog.com/Twitter: @keigomi29
4
/74
ContentsAbout
1. What presentation is, and what it is not
2. No message, no value
3. Three fundamental rules of slides
4. Rehearsal, rehearsal, and rehearsal!
Be Optimistic on the stage
5
/74
An academic presentation is…
To show achievement of research
A short speech
Supported by projection of slides
6

/74
Who are your audience?
Academic conferenceReporting in seminar
Public presentation of thesisInvited speech in symposium
Speech for general publicSpeech for students
…etc
7

/74
Who are your audience?
Knowledge levelLanguage
Work experienceExpectation to your presentation
AgeGender
Nationality
8
/74
An academic presentation is not…
To tell how you struggled
A movie
A novel, nor a poem
Comedy
9
/74
ContentsAbout
1. What presentation is, and what it is not
2. No message, no value
3. Three fundamental rules of slides
4. Rehearsal, rehearsal, and rehearsal!
Be Optimistic on the stage
10

/74
2.No message, no value
What is your message?
Guide the audience by a good storyline
What you do not need is…
11

/74
What is your message?
“So what?”
1st Step: Write down your message!
(If the message itself is worthless…)
12

/74
Forms of messages
1. Finding fact
2. Finding problems and solutions
3. Developing new products
13

/74
I investigated A by Band found C
14
A) Object
B) Method
C) Fact
Finding fact

/74
2.Finding problems and solutions
I investigated A, found B, and propose C.
15
A) Object
B) Problem found
C) Proposed solution

/74
3.Developing new products
I improved A by B and solved C.
16
A) Object
B) Changes
C) New utility, solved problems

/74
Abstract up to 80 words
Longer version of the message
Criteria to judge your presentation
NEVER exceed 80 words (200 letters in Japanese)
17

/74
ExampleMessage:You can improve your presentation with only three basic principles.Abstract: The most important thing during preparation of academic presentation is to clarify the message and story. The next point is careful selection of information, large font size, color with defined roles, and appropriate graph type. For a good oral presentation? Rehearsal, rehearsal, and rehearsal! Then you can give a confident speech. (51 words)
18

/74
Guide the audience by a storyline
Select the contents
Logically correct storyline
Natural order for the audience
19

/74
Select the contents
Long research and short speech
“Selling point”
Do not hesitate to cut off branches
20
/74
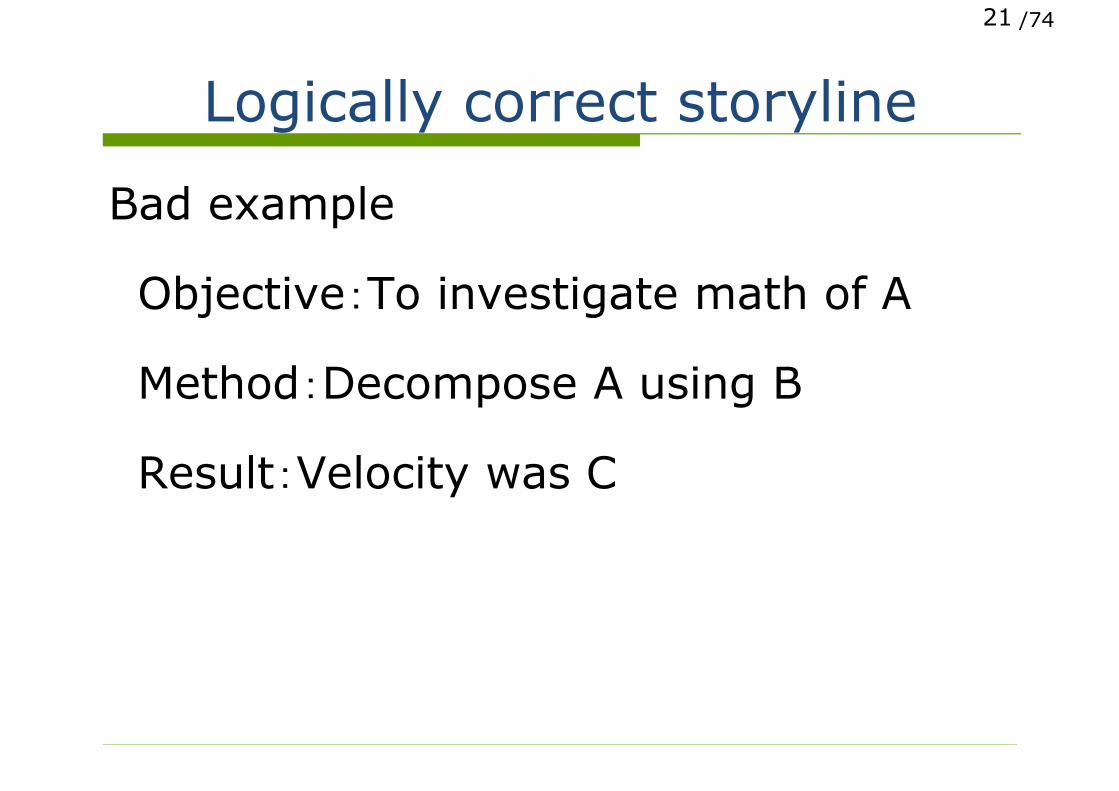
Logically correct storyline
Bad example
Objective:To investigate math of A
Method:Decompose A using B
Result:Velocity was C
21

/74
Natural order for the audience
Structuring: “Whole to detail”
Show the map
Easy to imagine the next contents
22

/74
Structuring whole to detailBad example
1. Prepare scale and flour2. Measure 200g of flour and add 1 cup
of water3. Prepare to whip cream4. Prepare cream and sugar5. Cook the dough with a pan6. Whip the cream7. Put whipped cream on cooked dough8. Pour chocolate on
23
/74
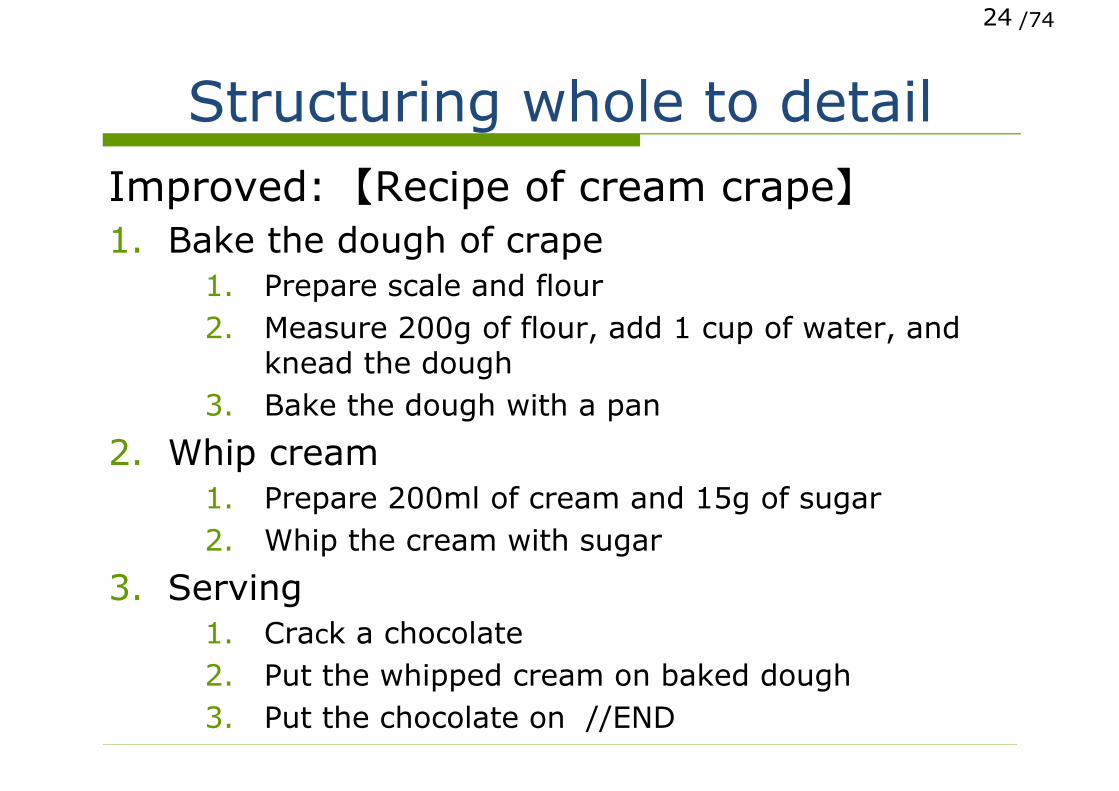
Structuring whole to detailImproved: 【Recipe of cream crape】
1. Bake the dough of crape1. Prepare scale and flour2. Measure 200g of flour, add 1 cup of water, and
knead the dough3. Bake the dough with a pan
2. Whip cream1. Prepare 200ml of cream and 15g of sugar2. Whip the cream with sugar
3. Serving1. Crack a chocolate2. Put the whipped cream on baked dough3. Put the chocolate on //END
24

/74
Tips of structuring
Include all
No duplication
Not too many in one level
25

/74
Easy to imagine the next contents
Expected contents comes next
End with ending contents
Say the hint, show the map
26

/74
What you do not need
Surprise the audience
Show detailed branches
Tell how hard your work was
27

/74
Message and story
Write your message Forms Abstract in 80 words
Story line Logic Whole to detail Expected next contents
28

/74
ContentsAbout
1. What presentation is, and what it is not
2. No message, no value
3. Three fundamental rules of slides
4. Rehearsal, rehearsal, and rehearsal!
Be Optimistic on the stage
29

/74
3.Three fundamental rules of slides
Every slide has one message
Best slide has least information
Larger fonts, clear colors
30

/74
Every slide has one message
Decide the role of the slide
Message title vs Topic title
How to show the message? Write, Draw, and Say
31

/74
How to decide the role?
Structuring: Whole to Detail
Decompose to one-slide level
Message of each slide is naturally decided
32

/74
Message title and Topic title
“Eye Catcher” : Shorter is better
Message title is direct and powerful
Topic tile must be short and simple
33
/74
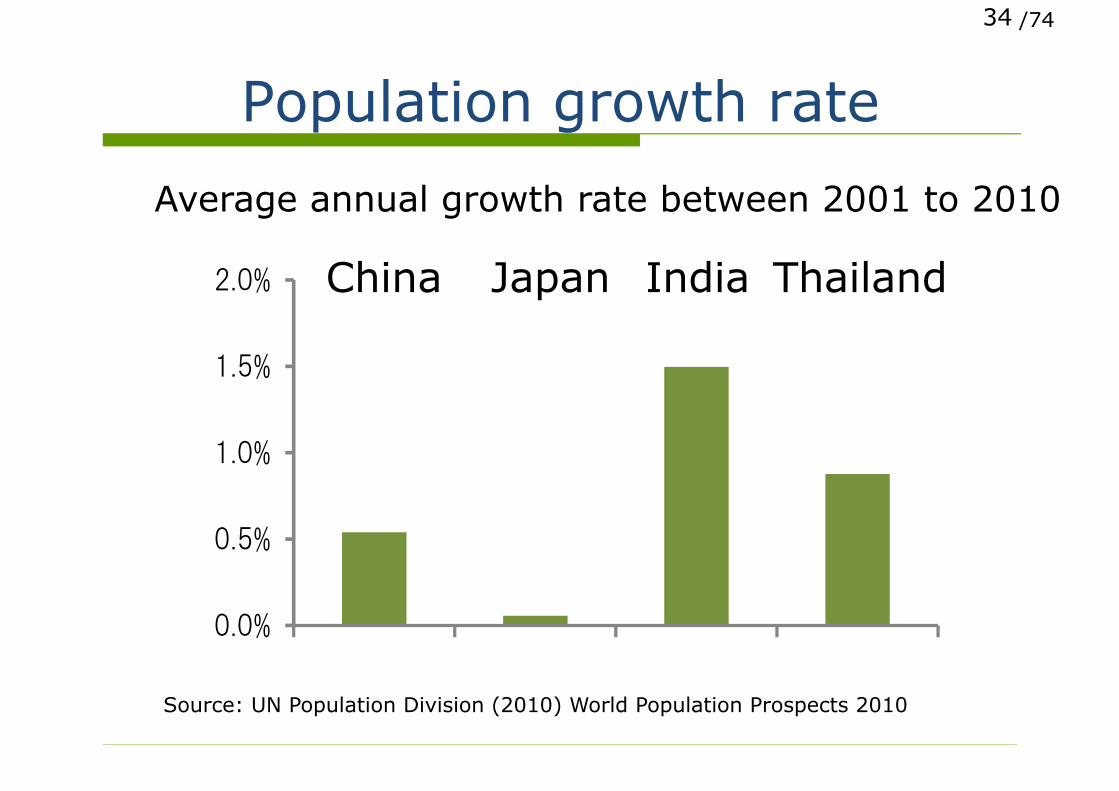
Population growth rate
34
0.0%
0.5%
1.0%
1.5%
2.0% 中国 日本 インド タイ
Average annual growth rate between 2001 to 2010
Source: UN Population Division (2010) World Population Prospects 2010
China Japan India Thailand
/74
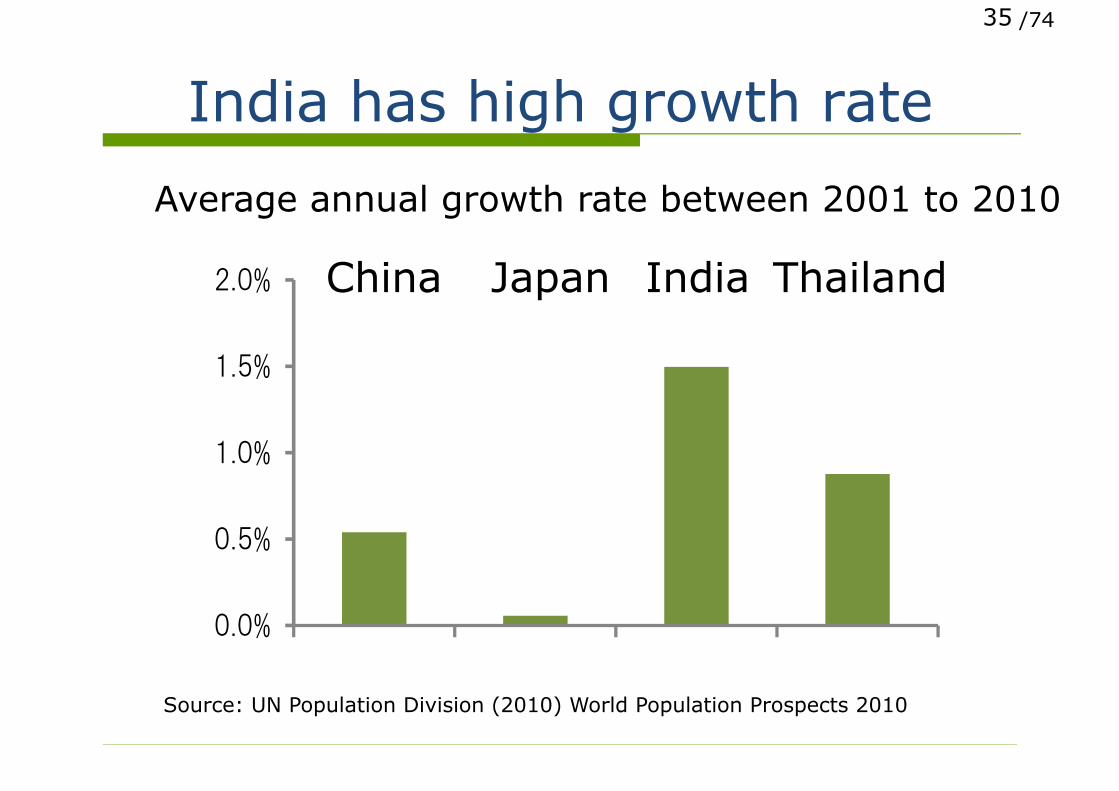
India has high growth rate
35
0.0%
0.5%
1.0%
1.5%
2.0% 中国 日本 インド タイ
Average annual growth rate between 2001 to 2010
Source: UN Population Division (2010) World Population Prospects 2010
China Japan India Thailand

/74
How to show the message?
Say
Writing is easier way
Technique of graphic
36
/74
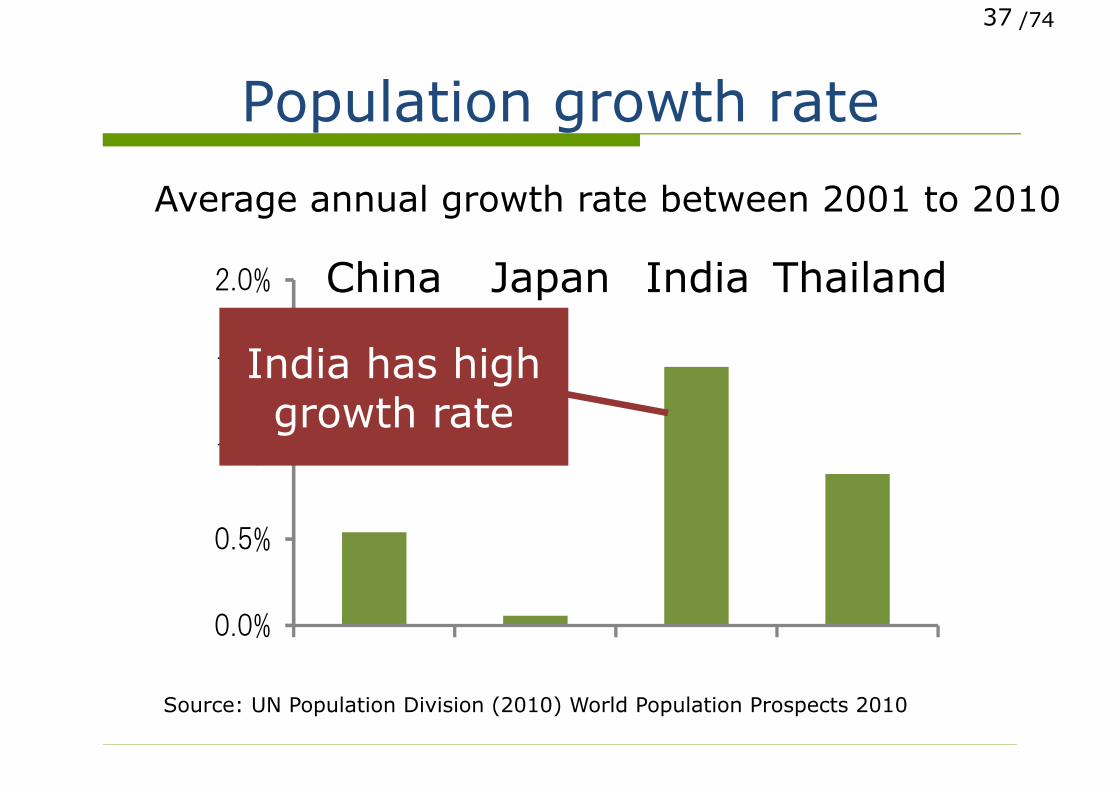
Population growth rate
37
0.0%
0.5%
1.0%
1.5%
2.0% 中国 日本 インド タイ
Average annual growth rate between 2001 to 2010
Source: UN Population Division (2010) World Population Prospects 2010
China Japan India Thailand
India has high growth rate

/74
0.0%
0.5%
1.0%
1.5%
2.0% 中国 日本 インド タイ
India has high growth rate
38
Average annual growth rate between 2001 to 2010
Source: UN Population Division (2010) World Population Prospects 2010
China Japan India Thailand
/74
0
20
40
60
80
100
120
ルクセンブルグ
ノルウェー
カタール
スイス
UAE デ
ンマーク
オーストラリア
スウェーデン
アメリカ
オランダ
カナダ
アイルランド
オーストリア
フィンランド
シンガポール
日本
ベルギー
フランス
ドイツ
アイスランド
クウェート
イギリス
イタリア
ニュージーランド
香港
ブルネイ
スペイン
イスラエル
キプロス
ギリシャ
千ド
ル
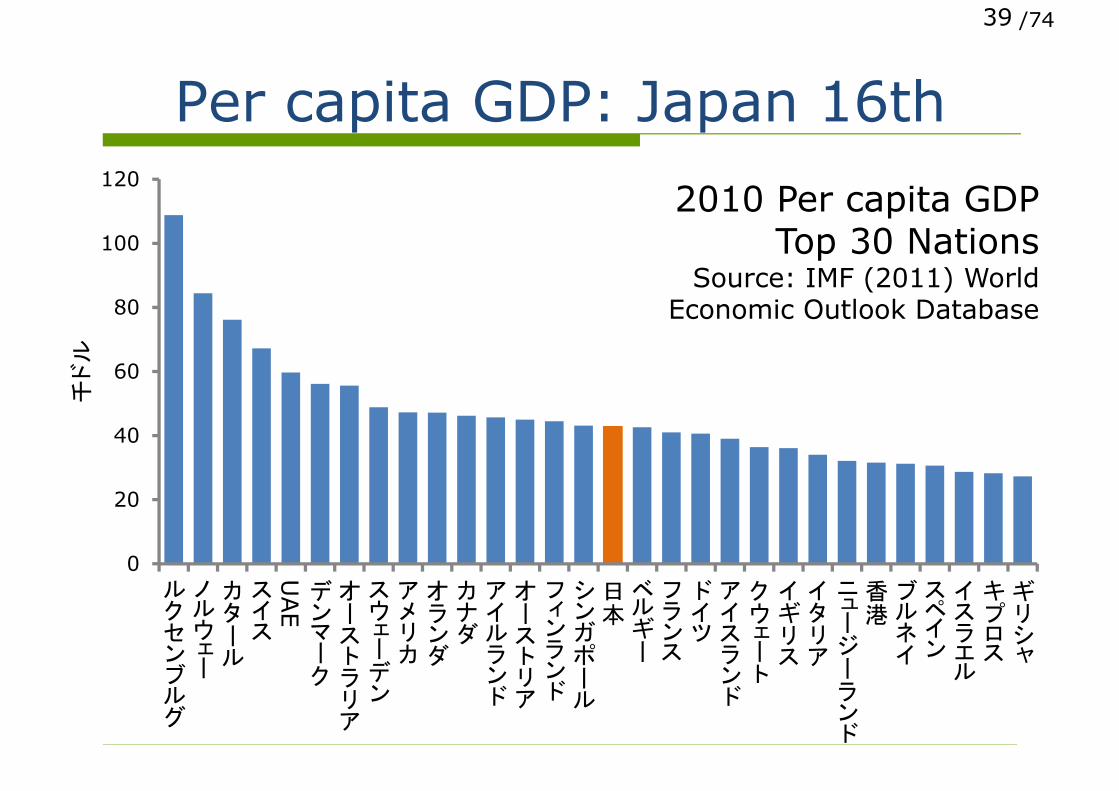
Per capita GDP: Japan 16th
39
2010 Per capita GDPTop 30 Nations
Source: IMF (2011) World Economic Outlook Database

/74
Graph type selection
40
アメリカ
23%
中国
10%
日本
9%
ドイツ
5%フランス
4%
その他
49%
0 5 10 15
アメリカ
中国
日本
ドイツ
フランス
0
2
4
6
8
10
12
14
16
1980
1982
1984
1986
1988
1990
1992
1994
1996
1998
2000
2002
2004
2006
2008
2010
アメリカ
中国
日本
ドイツ
フランス
0
10
20
30
40
50
60
70
80
1980
1982
1984
1986
1988
1990
1992
1994
1996
1998
2000
2002
2004
2006
2008
2010
アメリカ
中国
日本
ドイツ
フランス
その他
Pie: Composition
Bar:Comparison of elements
Line:Time series
Area:Time series
of sum

/74
30
40
50
60
70
80
90
0 10 20 30 40 50 60
Aver
age
long
evity
(ye
ars)
Per capita income (PPP1000$)
More income means longer life?
41
Under $10,000, income and longevity seem correlated.
/74
30
40
50
60
70
80
90
0 10 20 30 40 50 60
Aver
age
long
evity
(ye
ars)
Per capita income (PPP1000$)
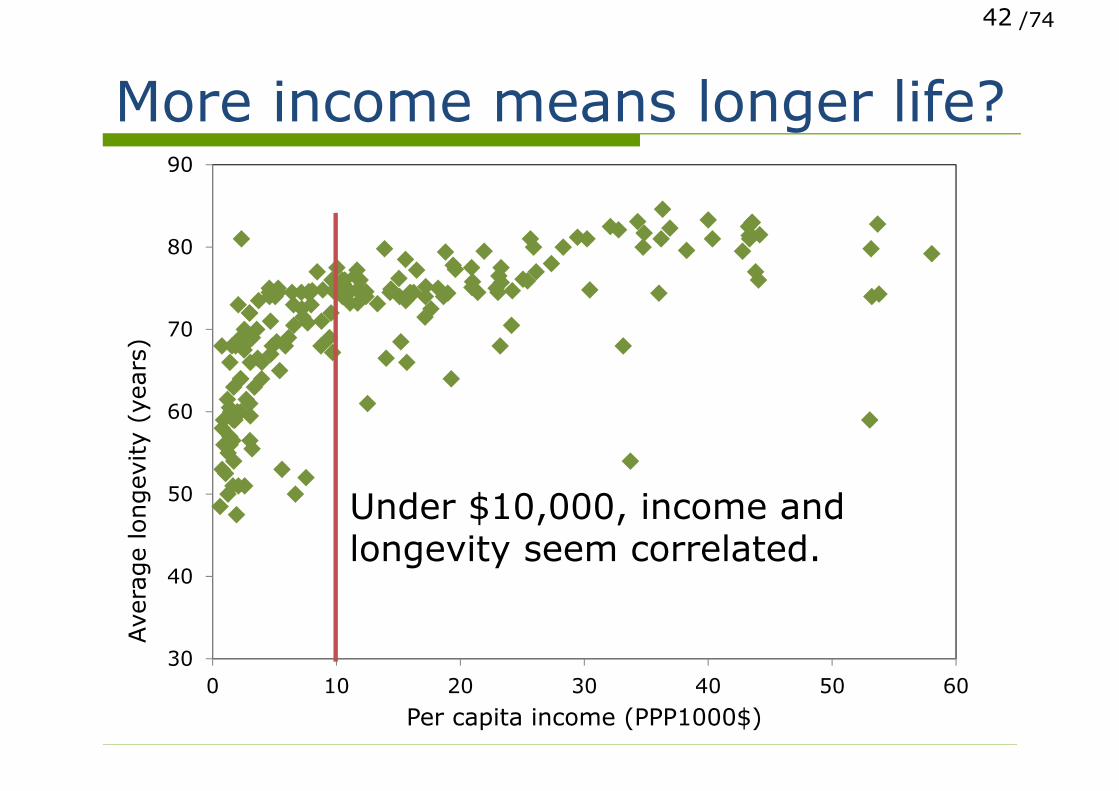
More income means longer life?
42
Under $10,000, income and longevity seem correlated.

/74
30
40
50
60
70
80
90
0 10 20 30 40 50 60
Aver
age
long
evity
(ye
ars)
Per capita income (PPP1000$)
More income means longer life?
43
JapanUSA
EquatrialGuinea

/74
Best slide has Least information
One moment, one thing
Add another slide if contents increased
Slide is not a book or hand-out
44

/74
One moment, one thing
Say one by one
Necessity to see multiple contents at the same time
Only one case when it is allowed…
45

/74
What can you see?
46
0
0.2
0.4
0.6
0.8
1
1.2
1.4
1980
1982
1984
1986
1988
1990
1992
1994
1996
1998
2000
2002
2004
2006
2008
2010
Australia
0
0.05
0.1
0.15
0.2
0.25
0.3
0.35
0.4
0.45
1980
1982
1984
1986
1988
1990
1992
1994
1996
1998
2000
2002
2004
2006
2008
2010
Austria
0
0.1
0.2
0.3
0.4
0.5
0.6
1980
1982
1984
1986
1988
1990
1992
1994
1996
1998
2000
2002
2004
2006
2008
2010
Belgium
0
0.5
1
1.5
2
2.5
1980
1982
1984
1986
1988
1990
1992
1994
1996
1998
2000
2002
2004
2006
2008
2010
Brazil
0
0.005
0.01
0.015
0.02
0.025
1980
1982
1984
1986
1988
1990
1992
1994
1996
1998
2000
2002
2004
2006
2008
2010
Cameroon
0
0.2
0.4
0.6
0.8
1
1.2
1.4
1.6
1.8
1980
1982
1984
1986
1988
1990
1992
1994
1996
1998
2000
2002
2004
2006
2008
2010
Canada
0
0.05
0.1
0.15
0.2
0.25
0.31980
1982
1984
1986
1988
1990
1992
1994
1996
1998
2000
2002
2004
2006
2008
2010
Finland
0
0.5
1
1.5
2
2.5
3
3.5
1980
1982
1984
1986
1988
1990
1992
1994
1996
1998
2000
2002
2004
2006
2008
2010
France
0
0.5
1
1.5
2
2.5
3
3.5
4
1980
1982
1984
1986
1988
1990
1992
1994
1996
1998
2000
2002
2004
2006
2008
2010
Germany
0
0.05
0.1
0.15
0.2
0.25
0.3
0.35
0.4
1980
1982
1984
1986
1988
1990
1992
1994
1996
1998
2000
2002
2004
2006
2008
2010
Greece
0
0.05
0.1
0.15
0.2
0.25
1980
1982
1984
1986
1988
1990
1992
1994
1996
1998
2000
2002
2004
2006
2008
2010
Hong Kong SAR
0
0.02
0.04
0.06
0.08
0.1
0.12
0.14
0.16
0.18
1980
1982
1984
1986
1988
1990
1992
1994
1996
1998
2000
2002
2004
2006
2008
2010
Hungary
0
0.005
0.01
0.015
0.02
0.025
1980
1982
1984
1986
1988
1990
1992
1994
1996
1998
2000
2002
2004
2006
2008
2010
Iceland
0
0.2
0.4
0.6
0.8
1
1.2
1.4
1.6
1.8
1980
1982
1984
1986
1988
1990
1992
1994
1996
1998
2000
2002
2004
2006
2008
2010
India
0
0.1
0.2
0.3
0.4
0.5
0.6
0.7
0.8
1980
1982
1984
1986
1988
1990
1992
1994
1996
1998
2000
2002
2004
2006
2008
2010
Indonesia
0
0.5
1
1.5
2
2.5
1980
1982
1984
1986
1988
1990
1992
1994
1996
1998
2000
2002
2004
2006
2008
2010
Italy
0
1
2
3
4
5
6
1980
1982
1984
1986
1988
1990
1992
1994
1996
1998
2000
2002
2004
2006
2008
2010
Japan
0
0.2
0.4
0.6
0.8
1
1.2
1980
1982
1984
1986
1988
1990
1992
1994
1996
1998
2000
2002
2004
2006
2008
2010
Korea
0
0.02
0.04
0.06
0.08
0.1
0.12
0.14
0.16
1980
1982
1984
1986
1988
1990
1992
1994
1996
1998
2000
2002
2004
2006
2008
2010
Kuwait
0
0.001
0.002
0.003
0.004
0.005
0.006
0.007
1980
1982
1984
1986
1988
1990
1992
1994
1996
1998
2000
2002
2004
2006
2008
2010
Mongolia
0
0.002
0.004
0.006
0.008
0.01
0.012
0.014
0.016
0.018
1980
1982
1984
1986
1988
1990
1992
1994
1996
1998
2000
2002
2004
2006
2008
2010
Nepal
0
0.05
0.1
0.15
0.2
0.25
1980
1982
1984
1986
1988
1990
1992
1994
1996
1998
2000
2002
2004
2006
2008
2010
Romania
0
0.2
0.4
0.6
0.8
1
1.2
1.4
1.6
1.8
1980
1982
1984
1986
1988
1990
1992
1994
1996
1998
2000
2002
2004
2006
2008
2010
Russia
0
0.05
0.1
0.15
0.2
0.25
0.3
0.35
0.4
1980
1982
1984
1986
1988
1990
1992
1994
1996
1998
2000
2002
2004
2006
2008
2010
South Africa
0
0.2
0.4
0.6
0.8
1
1.2
1.4
1.6
1.8
1980
1982
1984
1986
1988
1990
1992
1994
1996
1998
2000
2002
2004
2006
2008
2010
Spain
0
0.0005
0.001
0.0015
0.002
0.0025
0.003
0.0035
0.004
1980
1982
1984
1986
1988
1990
1992
1994
1996
1998
2000
2002
2004
2006
2008
2010
Swaziland
0
0.1
0.2
0.3
0.4
0.5
0.6
1980
1982
1984
1986
1988
1990
1992
1994
1996
1998
2000
2002
2004
2006
2008
2010
Sweden
0.00
2.00
4.00
6.00
8.00
10.00
12.00
14.00
16.00
1980
1982
1984
1986
1988
1990
1992
1994
1996
1998
2000
2002
2004
2006
2008
2010
USA

/74
Low-carbon measures More than 70
measures Energy-efficient
devices Renewable energy Building Modal shift Carbon sink Behavior change
47
Sector Low- carbon countermeasure Data SourceCategory
(*)Emissions reduction
(kt- CO2)Action
(**)
Air conditioner 50.1 3(***)
Highest energy efficiency air conditioner COP 6.60 2 E Diffusion ratio (cooling and heating) 50%High energy efficiency air conditioner COP 2.54 1 E Diffusion ratio (cooling and heating) 50%
High energy efficiency kerosene heating COP 0.88 1 E Diffusion ratio (heating: kerosene) 80% 12.9 3High energy efficiency gas heating COP 0.88 1 E Diffusion ratio (heating: gas) 80% 25.8 3High energy efficiency oil water heater COP 0.83 1 E Diffusion ratio (hot water: oil) 70% 6.1 3Gas water heater 55.0 3
Latent heat recovery- type water heater COP 0.83 1 E Diffusion ratio (hot water: gas) 50%High energy efficiency gas water heater COP 0.83 1 E Diffusion ratio (hot water: gas) 50%
Heat pump water heater COP 4.50 3 E Diffusion ratio (hot water: electricity) 70% 48.9 3High energy efficiency gas cooker Thermal efficiency (base year= 1) 0.55 1 E Diffusion ratio (cooking: gas) 70% 12.3 3High energy efficiency IH cooker Thermal efficiency (base year= 1) 0.86 1 E Diffusion ratio (cooking: electricity) 70% 8.0 3Fluorescent light
LED (substitute fluorescent light) Electricity consumption (conventional type= 1) 2.67 1 E Diffusion ratio 50% 24.1 3Hf inverter fluorescent light Electricity consumption (conventional type= 1) 1.33 1 E Diffusion ratio 50%
Incandescent light 51.5 3LED (substitute incandescent light) Electricity consumption (conventional type= 1) 8.70 1 E Diffusion ratio 50%Bulb- type fluorescent light Electricity consumption (conventional type= 1) 4.35 1 E Diffusion ratio 50%
Refrigerator 72.1 3Super high energy efficiency refrigerator Electricity consumption (conventional type= 1) 2.92 1 E Diffusion ratio 50%Highest energy efficiency refrigerator Electricity consumption (conventional type= 1) 2.33 1 E Diffusion ratio 50%
TV 31.9 3LCD TV Electricity consumption (conventional type= 1) 2.27 1 E Diffusion ratio 50%Highest energy efficiency TV Electricity consumption (conventional type= 1) 1.54 1 E Diffusion ratio 50%
House insulation 100.7 2Next generation level Thermal loss (base year= 1) 0.36 4 E Diffusion ratio 40%New standard Thermal loss (base year= 1) 0.43 4 E Diffusion ratio 40%
Energy- saving behavior Energy service demand reduction ratio 10% 5 B Diffusion ratio 25% 32.4 3Photovoltaic generation Potential(ktoe) 295 6 S Diffusion ratio 10% 26.9 5Solar water heating Potential(ktoe) 1037 6 S Diffusion ratio (hot water: all) 10% 38.8 5Other energy efficiency improvement E 0.2 3Other fuel shifting S 27.3 3Total 625.1Air conditioner (cooling only) 41.3 4
Super high energy efficiency air conditioner (cooling only) COP 5.00 2 E Diffusion ratio (cooling: electricity) 50%Highest energy efficiency air conditioner (cooling only) COP 4.07 1 E Diffusion ratio (cooling: electricity) 50%
Cooling (gas) 19.1 4High energy efficiency gas heat pump COP 1.60 8 E Diffusion ratio (cooling: gas) 40%High energy efficiency absorption tiller (gas) COP 1.35 7 E Diffusion ratio (cooling: gas) 40%
High energy efficiency absorption tiller(oil) COP 1.35 9 E Diffusion ratio (cooling: oil) 70% 3.2 4High energy efficiency boiler (oil) COP 0.88 1 E Diffusion ratio (heating: oil) 70% 25.1 4High energy efficiency boiler (gas) COP 0.88 1 E Diffusion ratio (heating: gas) 70% 75.4 4Air conditioner (heating only) 67.0 4
Super high energy efficiency air conditioner (heating only) COP 7.40 2 E Diffusion ratio (heating: electricity) 90%Highest energy efficiency air conditioner (heating only) COP 4.44 1 E Diffusion ratio (heating: electricity) 10%
High energy efficiency oil water heater COP 0.87 1 E Diffusion ratio (hot water: oil) 70% 16.0 4Gas water heater 64.2 4
High energy efficiency gas waterheater COP 0.87 1 E Diffusion ratio (hot water: gas) 50%Latent heat recovery- type water heater COP 0.85 1 E Diffusion ratio (hot water: gas) 50%
CO2 cooling medium water heater COP 3.00 1 E Diffusion ratio (hot water: electricity) 100% 64.2 4High energy efficiency gas cooker Thermal efficiency (base year= 1) 0.55 1 E Diffusion ratio (cooking: gas) 70% 27.0 4IH cooking heater Thermal efficiency (base year= 1) 0.86 1 E Diffusion ratio (cooking: electricity) 70% 11.6 4Incandescent light 131.6 4
Timer controlled LED (substitute fluorescent light) Electricity consumption (conventional type= 1) 3.95 1 E Diffusion ratio 50%Illumination controlled LED (substitute fluorescent light) Electricity consumption (conventional type= 1) 3.36 1 E Diffusion ratio 50%
Incandescent light 20.6 4LED (substitute incandescent light) Electricity consumption (conventional type= 1) 4.55 1 E Diffusion ratio 50%Bulb- type fluorescent light Electricity consumption (conventional type= 1) 4.55 1 E Diffusion ratio 50%
High- intensity evacuation light Electricity consumption (conventional type= 1) 4.18 1 E Diffusion ratio 70% 0.5 4Large scale computer (energy- saving type) Electricity consumption (conventional type= 1) 1.18 1 E Diffusion ratio 70% 3.1 4Personal computer (energy- saving type) Electricity consumption (conventional type= 1) 2.47 1 E Diffusion ratio 70% 3.3 4Copier (energy- saving type) Electricity consumption (conventional type= 1) 1.45 1 E Diffusion ratio 70% 0.9 4Fax machine (energy- saving type) Electricity consumption (conventional type= 1) 1.45 1 E Diffusion ratio 70% 0.6 4Printer (energy- saving type) Electricity consumption (conventional type= 1) 1.45 1 E Diffusion ratio 70% 1.2 4Elevator (energy- saving type) Electricity consumption (conventional type= 1) 4.01 1 E Diffusion ratio 70% 5.4 4Ventilation 50.1 4
with energy- saving fan Electricity consumption (conventional type= 1) 2.00 1 E Diffusion ratio 50%with low- pressure duct Electricity consumption (conventional type= 1) 1.82 1 E Diffusion ratio 50%
Vending machine (energy- saving type) Electricity consumption (conventional type= 1) 2.17 1 E Diffusion ratio 70% 11.5 4Traffic light (LED type) Electricity consumption (conventional type= 1) 3.75 1 E Diffusion ratio 70% 1.4 4High energy efficiency transformer Electricity consumption (conventional type= 1) 2.53 1 E Diffusion ratio 70% 13.3 4Other electric appliances 61.2 4
30% energy- saving type Electricity consumption (conventional type= 1) 1.43 1 E Diffusion ratio 50%10% energy- saving type Electricity consumption (conventional type= 1) 1.11 1 E Diffusion ratio 50%
Building insulation Thermal loss (base year= 1) 0.50 1 E Diffusion ratio 100% 231.1 2BEMS Energy demand reduction ratio 10% 10 E Diffusion ratio 25% 24.4 4Energy- saving behavior Energy service demand reduction ratio 10% 5 B Diffusion ratio 25% 40.3 4Photovoltaic generation Potential(ktoe) 295 6 S Diffusion ratio 10% 26.9 5Solar water heating Potential(ktoe) 1037 6 S Diffusion ratio (hot water: all) 5% 49.6 5Other fuel shifting S 70.8 4Total 1161.8Energy efficient equipments E 184.7 4
High energy efficiency boiler Thermal efficiency(base year= 1) 1.09 11 Diffusion ratio 80%High energy efficiency furnace Thermal efficiency(base year= 1) 1.67 12 Diffusion ratio 80%High energy efficiency morter Electricity consumption(base year= 1) 1.25 11 Diffusion ratio 80%Inverter control Electricity consumption(base year= 1) 1.05 11 Diffusion ratio 80%
Fuel shifting From oil to gas S Shifting ratio 60% 63.9 4Increase in the ratio of seasonal vegetable production Ratio of CO2 emissions against non- seasonal vegitable produc 0.7 17 E Ratio of selling seasonal vegitables 36.2% 0.3 4Increase in the ratio of wooden buildings Ratio of CO2 emissions against non- wooden buildings 0.6 17 E Diffusion ratio 30% 9.0 4Total 257.9Vehicle 270.7 1
Hybrid vehicle Fuel cost (conventional type= 1) 0.6 1 E Diffusion ratio 50%High energy efficiency vehicle Fuel cost (conventional type= 1) 0.8 1 E Diffusion ratio 50%
Modal shift From vehicle to; B 236.7 1Intra area trip walking and bicycle Shifting ratio 15%
train and bas Shifting ratio 30%Inter area trip bicycle Shifting ratio 10%
train and bas Shifting ratio 30%Trip to outside of the city train Shifting ratio 30%
Bio fuel From oil to bio fuel S Diffusion ratio 20% 231.7 5Eco- driving Fuel efficiency improvement ratio 24% 13 B Diffusion ratio 20% 37.8 1Total 776.9Vehicle 176.9 1
Hybrid vehicle Fuel cost (conventional type= 1) 0.6 1 E Diffusion ratio 50%High energy efficiency vehicle Fuel cost (conventional type= 1) 0.8 1 E Diffusion ratio 50%
Bio fuel From oil to bio fuel S Diffusion ratio 20% 156.2 5Total 333.1Bio- methanol power generation 17 production of electricity (ktoe) 18.8 53.8 5Reducing the amount of waste incineration 17 Rate of CO2 emissions reduction 40% 228.1 3, 4Improvement of CO2 intensity of power generation CO2 emission per generation (tC/toe) 0.78 873.9 (****)
Fuel shifting 14Generation efficiency improvement
Coal Generation efficiency 48% 15Gas Generation efficiency 55% 16
Total 4310.7
was
tein
cin
erat
ion
&p
ow
er s
up
ply
Identified implementation intencity
Ho
use
ho
ld s
ecto
rC
om
mer
cial
sev
tor
Ind
ust
rial
sec
tor
Pass
enge
r tr
ansp
ort
sec
tor
Frei
ght
tran
spo
rtse
cto
r

/74
Low-carbon measures
48

/74
Add another slide!
“You did a lot, anyway”
>3 contents Add another slide
Can not separate? Do structuring again.
49

/74
GHG emission in Shiga pref.
50
20052030 BaU
2030BaU/ 2005
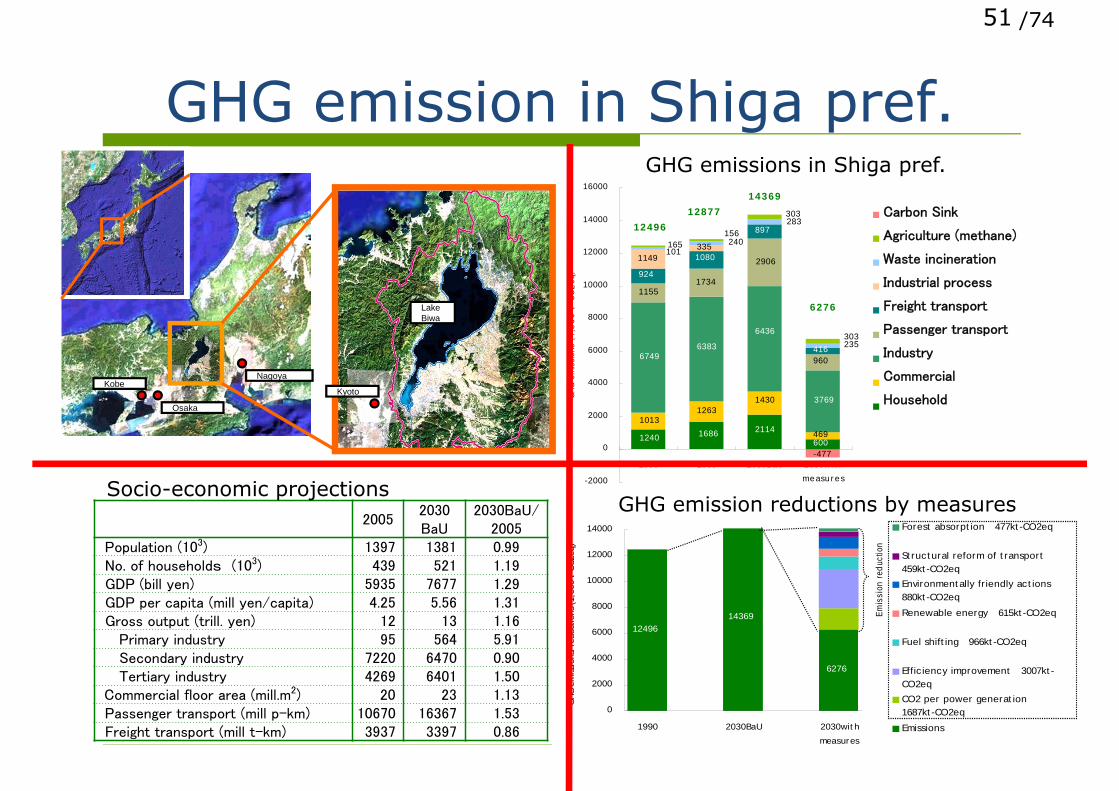
Population (103) 1397 1381 0.99No. of households (103) 439 521 1.19GDP (bill yen) 5935 7677 1.29GDP per capita (mill yen/capita) 4.25 5.56 1.31Gross output (trill. yen) 12 13 1.16
Primary industry 95 564 5.91Secondary industry 7220 6470 0.90Tertiary industry 4269 6401 1.50
Commercial floor area (mill.m2) 20 23 1.13Passenger transport (mill p-km) 10670 16367 1.53Freight transport (mill t-km) 3937 3397 0.86
Socio-economic projections
600469
960
924
897
416
335
1240 1686 2114
14301263
1013
67496383
6436
3769
1155
2906
1734
10801149
240101
283
235
156165
303
303
-477
-2000
0
2000
4000
6000
8000
10000
12000
14000
16000
1990 2000 2030BaU 2030with
measu re s
GHG e
missions
(1,0
00 t
-CO2eq)
Forestabsorption
Ag ricu ltu re(m ethane)
Wasteinc ineration
Industria lprocess
Freigh tTransport
PassengerTransport
Industry
Bus inessoprrations
Household
12496
12877
14369
6276
Carbon Sink
Agriculture (methane)
Waste incineration
Industrial process
Freight transport
Passenger transport
Industry
Commercial
Household
1249614369
6276
0
2000
4000
6000
8000
10000
12000
14000
1990 2030BaU 2030with
measures
GHG e
mission
s/re
duct
ions
(1,
000
t-CO2e
q)
Forest absorption 477kt-CO2eq
Structural reform of transport 459kt-CO2eq
Environmentally friendly actions 880kt-CO2eq
Renewable energy 615kt-CO2eq
Fuel shifting 966kt-CO2eq
Efficiency improvement 3007kt-CO2eq
CO2 per power generation 1687kt-CO2eq
Emissions
Emis
sion
redu
ctio
n
GHG emissions in Shiga pref.
GHG emission reductions by measures
Kyoto
Osaka
NagoyaKobe
Lake Biwa
/74
GHG emission in Shiga pref.
51
20052030 BaU
2030BaU/ 2005
Population (103) 1397 1381 0.99No. of households (103) 439 521 1.19GDP (bill yen) 5935 7677 1.29GDP per capita (mill yen/capita) 4.25 5.56 1.31Gross output (trill. yen) 12 13 1.16
Primary industry 95 564 5.91Secondary industry 7220 6470 0.90Tertiary industry 4269 6401 1.50
Commercial floor area (mill.m2) 20 23 1.13Passenger transport (mill p-km) 10670 16367 1.53Freight transport (mill t-km) 3937 3397 0.86
Socio-economic projections
600469
960
924
897
416
335
1240 1686 2114
14301263
1013
67496383
6436
3769
1155
2906
1734
10801149
240101
283
235
156165
303
303
-477
-2000
0
2000
4000
6000
8000
10000
12000
14000
16000
1990 2000 2030BaU 2030with
measu re s
GHG e
missions
(1,0
00 t
-CO2eq)
Forestabsorption
Ag ricu ltu re(m ethane)
Wasteinc ineration
Industria lprocess
Freigh tTransport
PassengerTransport
Industry
Bus inessoprrations
Household
12496
12877
14369
6276
Carbon Sink
Agriculture (methane)
Waste incineration
Industrial process
Freight transport
Passenger transport
Industry
Commercial
Household
1249614369
6276
0
2000
4000
6000
8000
10000
12000
14000
1990 2030BaU 2030with
measures
GHG e
mission
s/re
duct
ions
(1,
000
t-CO2e
q)
Forest absorption 477kt-CO2eq
Structural reform of transport 459kt-CO2eq
Environmentally friendly actions 880kt-CO2eq
Renewable energy 615kt-CO2eq
Fuel shifting 966kt-CO2eq
Efficiency improvement 3007kt-CO2eq
CO2 per power generation 1687kt-CO2eq
Emissions
Emis
sion
redu
ctio
n
GHG emissions in Shiga pref.
GHG emission reductions by measures
Kyoto
Osaka
NagoyaKobe
Lake Biwa

/7452
Shiga prefecture: Location
KyotoOsaka
NagoyaKobe
Lake Biwa
/74
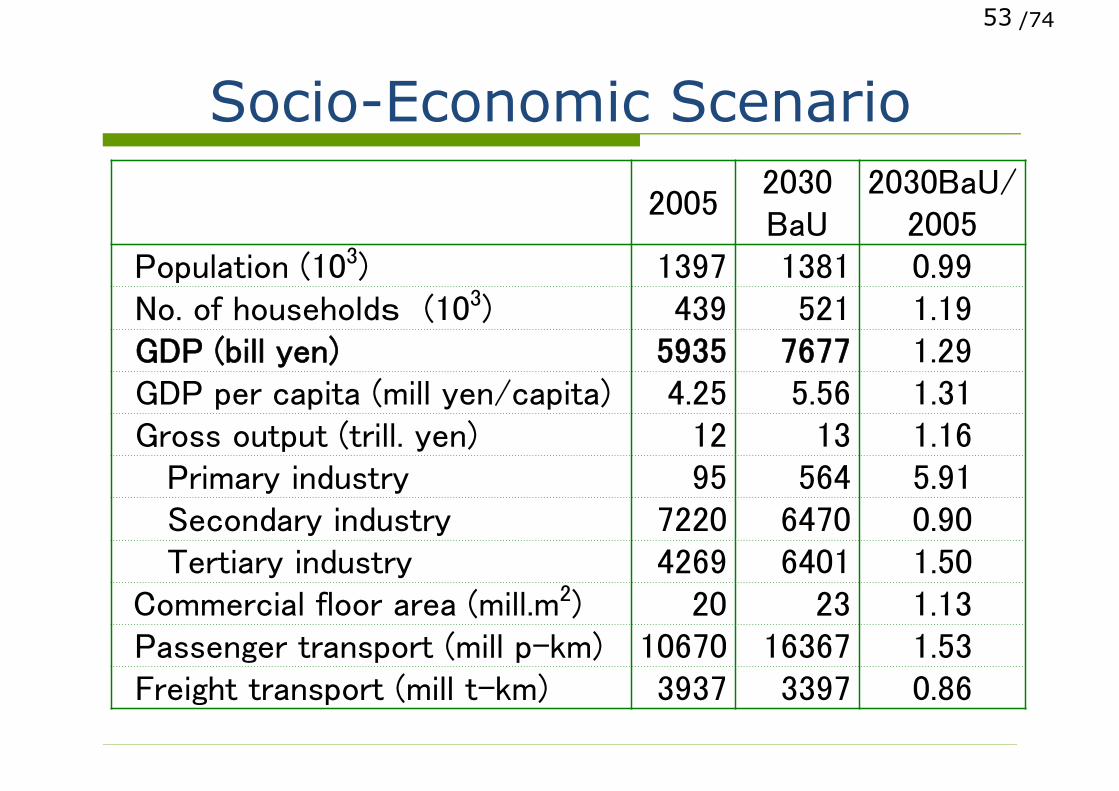
Socio-Economic Scenario
53
20052030 BaU
2030BaU/ 2005
Population (103) 1397 1381 0.99No. of households (103) 439 521 1.19GDP (bill yen) 5935 7677 1.29GDP per capita (mill yen/capita) 4.25 5.56 1.31Gross output (trill. yen) 12 13 1.16
Primary industry 95 564 5.91Secondary industry 7220 6470 0.90Tertiary industry 4269 6401 1.50
Commercial floor area (mill.m2) 20 23 1.13Passenger transport (mill p-km) 10670 16367 1.53Freight transport (mill t-km) 3937 3397 0.86
/7454
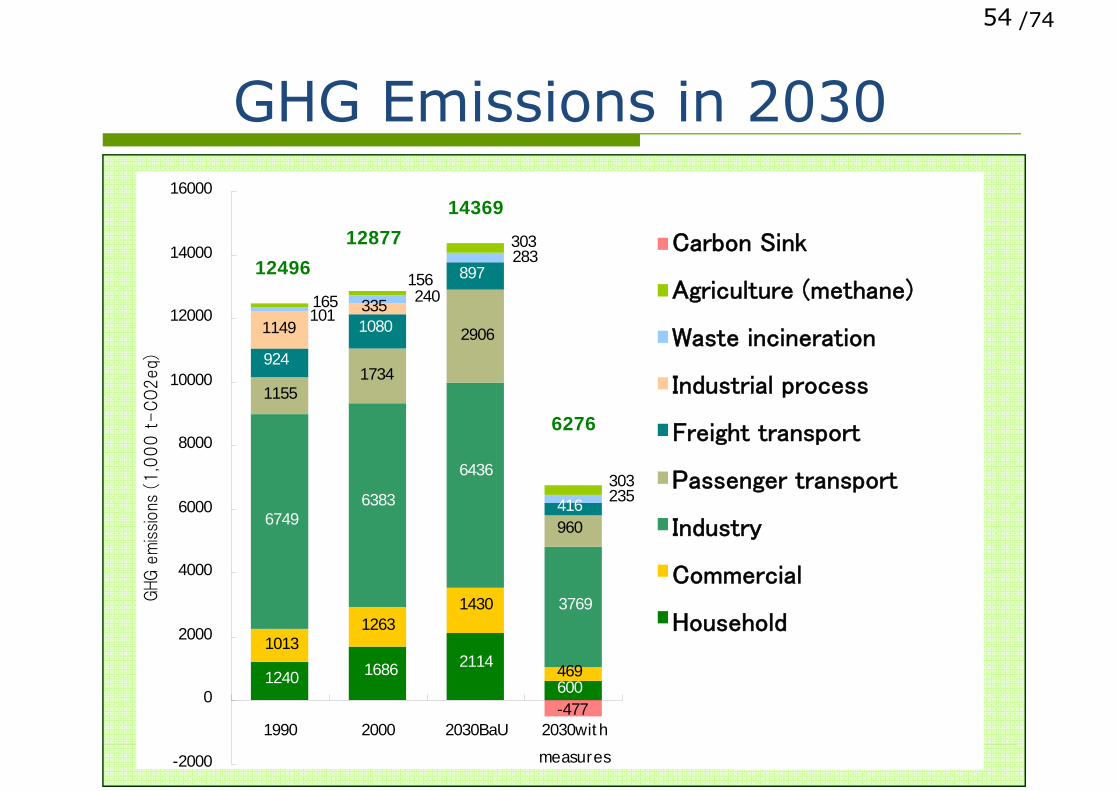
GHG Emissions in 2030
600469
960
924
897
416
335
1240 1686 2114
14301263
1013
67496383
6436
3769
1155
2906
1734
10801149
240101
283
235
156165
303
303
-477
-2000
0
2000
4000
6000
8000
10000
12000
14000
16000
1990 2000 2030BaU 2030with
measures
GHG e
missions
(1,0
00 t
-CO2eq)
Forestabsorption
Agriculture(methane)
Wasteincineration
Industrialprocess
FreightTransport
PassengerTransport
Industry
Businessoprrations
Household
12496
12877
14369
6276
Carbon Sink
Agriculture (methane)
Waste incineration
Industrial process
Freight transport
Passenger transport
Industry
Commercial
Household

/74
1249614369
6276
0
2000
4000
6000
8000
10000
12000
14000
1990 2030BaU 2030with
measures
GH
G e
mis
sion
s/re
duct
ions
(1,
000
t-C
O2e
q)
Forest absorption 477kt-CO2eq
Structural reform of transport 459kt-CO2eq
Environmentally friendly actions 880kt-CO2eq
Renewable energy 615kt-CO2eq
Fuel shifting 966kt-CO2eq
Efficiency improvement 3007kt-CO2eq
CO2 per power generation 1687kt-CO2eq
Emissions
Emis
sion
red
uctio
n
Emission reduction by measures55

/74
A slide is not a book
No time to understand complicated contents
No time to read long sentence
Do not show data irrelevant to the storyline
56

/74
Slide ≠ script! 非常に頻繁に見かけるスタイルですが、口頭で喋ることとほとんど同じ内容を文章でス
ライド中に書き込む発表者がいます。これは避けるべきです。書かれたことと同じことを話すのならばそもそも口頭発表を聞く必要がないからです。
新しいスライドが見せられたとき、聞き手はスライドに書かれたことを読み取ろうとします。そのような場合にこのように細かい字でびっしり書かれていると読むのに時間がかかるので全て理解しながら読むことが出来ません。そしてそればかりではなく、読むことに集中してしまって発表者の話を聞けなくなります。
スライドに長い文を書くことで生じるもう一つの問題は、必然的に文字が小さくなってしまうということです。すぐあとの項目で説明するように、文字は聞き手が苦労せずに読み取れる大きさでなければなりません。特に卒修論発表の会場に奥行きがあり、重要な聞き手である大学教員が会場後方に座っていた場合には小さな字でびっしりと書かれたスライドを読書するために非常に苦労するでしょう。
スライドに小さい字でびっしり文字を書くことがいかに困ったことであるかを示すために本資料のこのページは本来「ノート」欄に書くべきことをスライドに書き、ノート欄にスライドに書くであろう内容を書いています。このような口語調の文章であればまだよいのですが、アカデミック・プレゼンテーションでは漢字や専門用語を多用し常体で書かれた堅苦しい文章になるので読みづらさはなおさらです。
というデメリットが非常に大きいのでスライドに台本を書くことは絶対に避けましょう。当研究室の発表練習でそれをやった場合には百発百中私に文句を言われます。
57
/74
Slide ≠ script!
Silence is better
Audience will read, not hear
Fonts will be too small
58

/74
Large fonts, clear colors
Unreadable letters are worthless
Color is information, not decollation
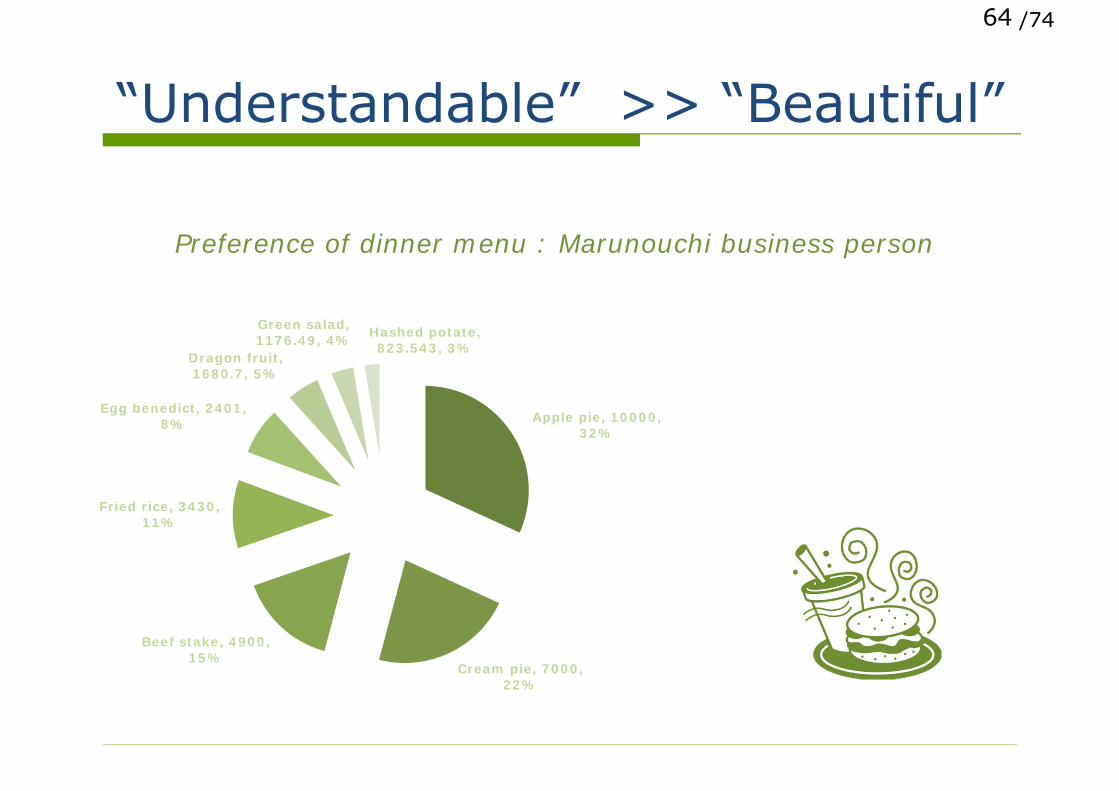
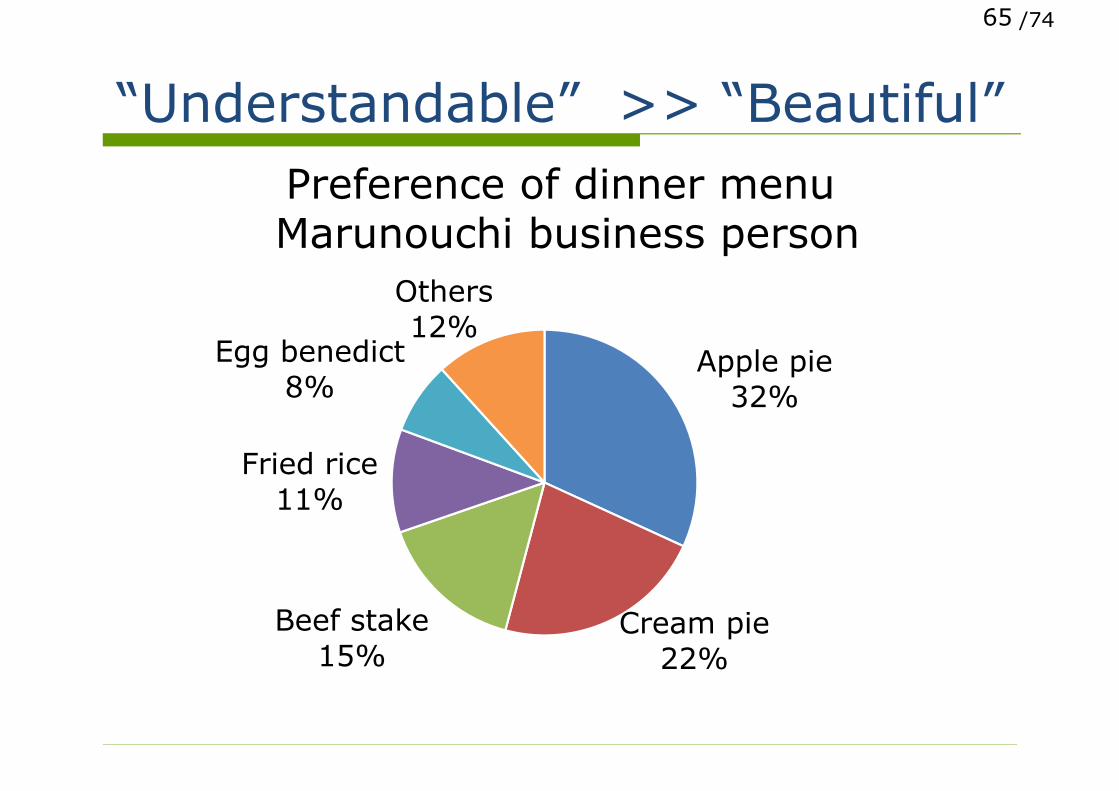
“Understandable” >> “Beautiful”
59

/74
Unreadable letters are worthless
They do not read fonts <24pt
Revise to decrease words and letters!
60

/74
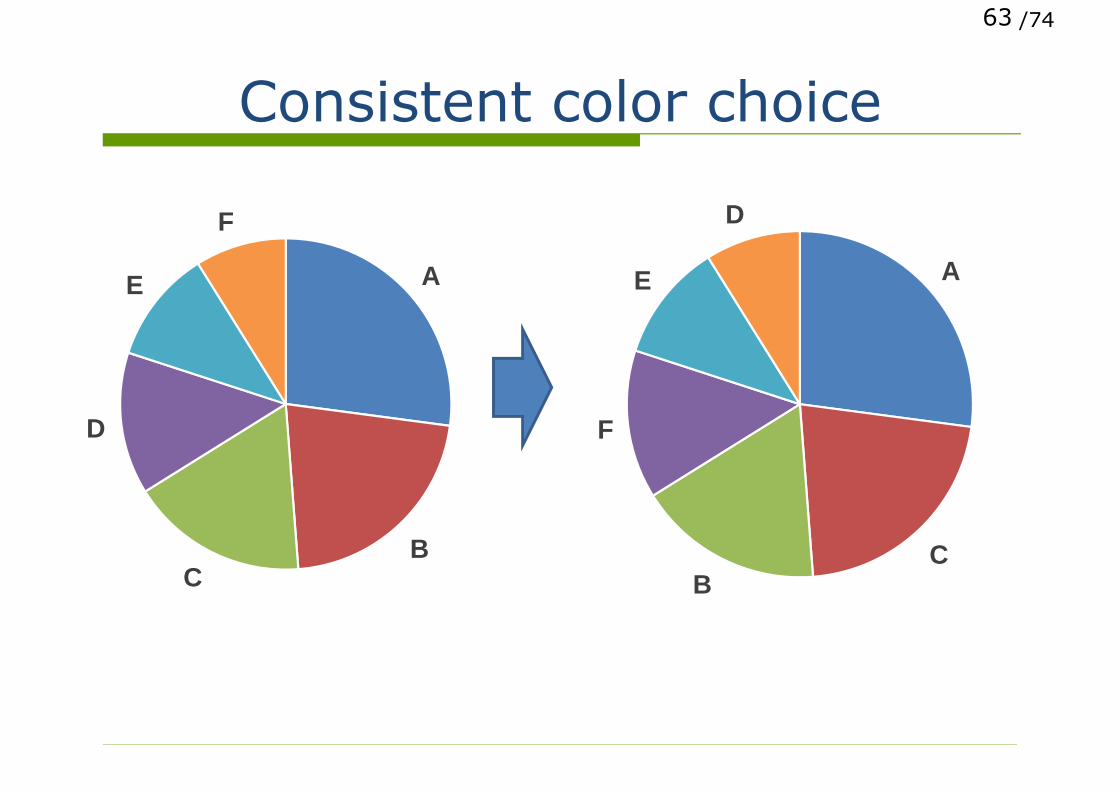
Color is information, not decollation.
Clear contrast Bad
Consistent color choice
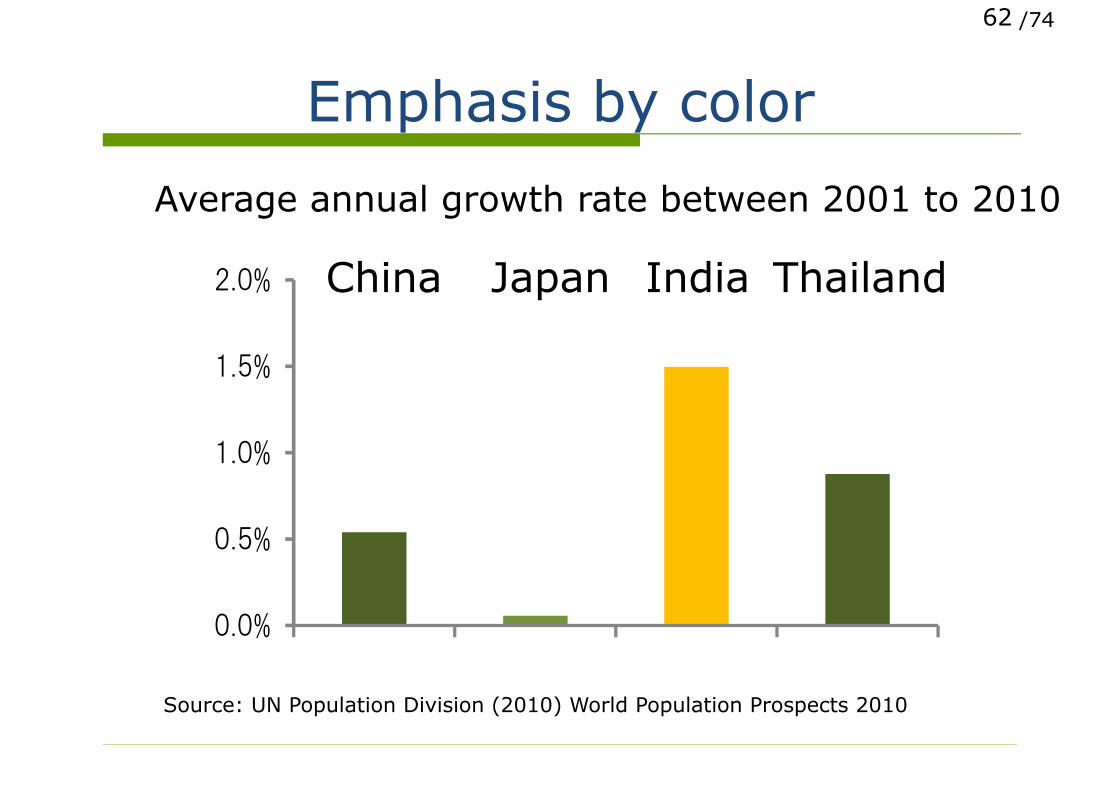
Emphasize by color
61
Good
/74
0.0%
0.5%
1.0%
1.5%
2.0% 中国 日本 インド タイ
Emphasis by color
62
Average annual growth rate between 2001 to 2010
Source: UN Population Division (2010) World Population Prospects 2010
China Japan India Thailand
/74
Consistent color choice
63
A
BC
D
E
F
A
CB
F
E
D
/74
“Understandable” >> “Beautiful”
64
Apple pie, 10000, 32%
Cream pie, 7000, 22%
Beef stake, 4900, 15%
Fried rice, 3430, 11%
Egg benedict, 2401, 8%
Dragon fruit, 1680.7, 5%
Green salad, 1176.49, 4% Hashed potate,
823.543, 3%
Preference of dinner menu : Marunouchi business person
/74
“Understandable” >> “Beautiful”
65
Preference of dinner menu Marunouchi business person
Apple pie32%
Cream pie22%
Beef stake15%
Fried rice11%
Egg benedict8%
Others12%

/74
Other points Especially for slide preparation…
Size of the venue Can they show whole screen? Page number, date Version of software “Thank you” slide is no thank you
General for academic reporting Spelling, Consistent terminology, Unit,
Source, Axis label , Appendix
66

/74
ContentsAbout
1. What presentation is, and what it is not
2. No message, no value
3. Three fundamental rules of slides
4. Rehearsal, rehearsal, and rehearsal!
Be Optimistic on the stage
67

/74
Rehearsal, rehearsal, and rehearsal!
Show your face!
Speak slowly
Practice as many times as possible
68

/74
Don’t watch the screen. Show your face!
Your body tells a lot.
Get feedback from the audience
Watch several guests
69

/74
Speak slowly
Exceeds the time? Revise your script!
As if the audience is XX years old
Emphasize: Slow down, Pause, (Strong)
70

/74
Practice as many times as possible
Keep the time at any costs
Remind all scripts
Recording: To be your audience
71

/74
Other techniques of speech
Attention Walking Black/white out the screen
Ice break
Be honest in Q&A
72

/74
Be honest in Q&A
Answer what you are asked
Answer shortly
Prepare FAQ
73

/74
ContentsAbout
1. What presentation is, and what it is not
2. No message, no value
3. Three fundamental rules of slides
4. Rehearsal, rehearsal, and rehearsal!
Be Optimistic on the stage
74

/74
Be optimistic on the stage
Good preparation gives you confidence
Practice hard, enjoy your stage
Enough sleep
It is no more than one presentation.
75


