Academic Benefits in High School of an Intensive Summer ...
60
A C T Research Report Series 98~4 Academic Benefits in High School of an Intensive Summer Program for Academically Talented Seventh Graders Jeff Schiel M2Y July 1998
Transcript of Academic Benefits in High School of an Intensive Summer ...

A C T R esearch R eport Series 9 8 ~ 4
Academic Benefits in High School of an Intensive Summer Program for Academically Talented Seventh Graders
Jeff Schiel
M2Y July 1998

For additional copies write:ACT Research Report Series PO Box 168Iowa City, Iowa 52243-0168
© 1998 by ACT, Inc. All rights reserved.
Academic Benefits in High School of an Intensive Summer Program for
Academically Talented Seventh Graders
Jeff Schiel

Table of Contents
A bstract.................................................................................................................................................. iii
Acknowledgem ent........................................................................................................................... iv
Data .................................................................................................................................................... 2File Development .............................................................................................................. 3
Current and former ACT Assessment scores ............................... 4SRP participation requirem ents........................................................... 5
M e th o d ................................................................................................................................................ 6Linear M o d e lin g ................................................................................................................. 6Logistic R eg ressio n ............................................................................................................ 7
Results ................................................................................................................................................ 8ACT Mathematics S co res................................................................................................. 8
SRP participants vs. nonparticipants............................................................. 8SRP mathematics course takers vs. other g ro u p s...................................... 11
ACT English S co re s ........................................................................................................... 13ACT Composite Scores .................................................................................................... 15High School Course T ak in g ............................................................................................ 17
SRP participants vs. nonparticipants—trigonom etry................................. 17SRP mathematics course takers vs. other groups—trigonometry . . . . 17SRP participants vs. nonparticipants—calculus ......................................... 18SRP mathematics course takers vs. other groups—calculus .................. 18
High School Grade Averages ....................................................................................... 19College C re d it...................................................................................................................... 20Awards for Scientific Work or Creative Writing ................................................... 20Other Academic Outcome Variables .......................................................................... 21
D iscu ssion .......................................................................................................................................... 21
R eferen ces.......................................................................................................................................... 24
Appendix A. Cumulative Percentage Distributions ............................................. 25
Appendix B. Cumulative Percentage D istributions.............................................. 26

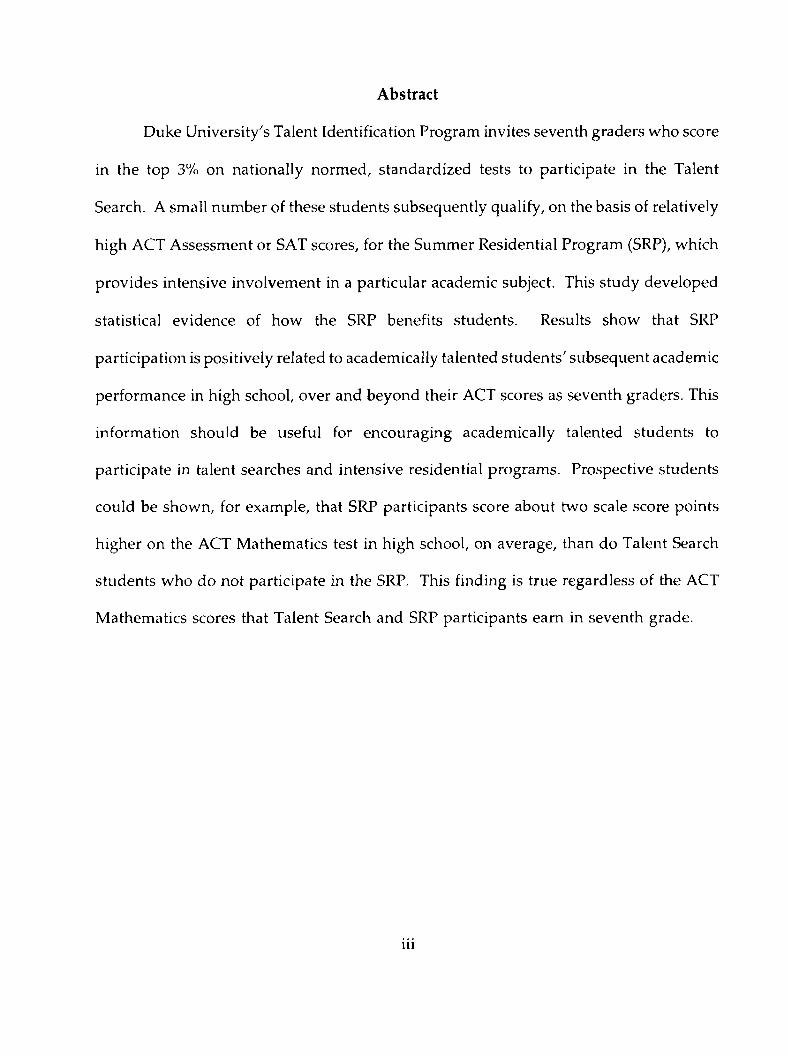
Abstract
Duke University's Talent Identification Program invites seventh graders who score
in the top 3% on nationally normed, standardized tests to participate in the Talent
Search. A small number of these students subsequently qualify, on the basis of relatively
high ACT Assessment or SAT scores, for the Summer Residential Program (SRP), which
provides intensive involvement in a particular academic subject. This study developed
statistical evidence of how the SRP benefits students. Results show that SRP
participation is positively related to academically talented students' subsequent academic
performance in high school, over and beyond their ACT scores as seventh graders. This
information should be useful for encouraging academically talented students to
participate in talent searches and intensive residential programs. Prospective students
could be shown, for example, that SRP participants score about two scale score points
higher on the ACT Mathematics test in high school, on average, than do Talent Search
students who do not participate in the SRP. This finding is true regardless of the ACT
Mathematics scores that Talent Search and SRP participants earn in seventh grade.

Acknowledgement
The assistance of Vicki Stocking of Duke University's Talent Identification
Program, who provided data on Talent Search students' participation in the Summer
Residential Program, is greatly appreciated.
This Research Report was published with permission of the Talent Identification
Program.
iv

Academic Benefits in High School of an Intensive Summer Program for Academically Talented Seventh Graders
Duke University's Talent Identification Program (TIP) invites seventh graders who
score in the top 3% on nationally normed, standardized tests to participate in the Talent
Search. The purpose of the Talent Search is to identify and assist exceptionally able
students whose academic needs are often not met in the traditional educational system.
Students are provided various services through the Talent Search, including counseling
and educational materials, recognition ceremonies, and a program that allows students
to learn on their own.
Seventh graders who qualify for the Talent Search are invited to take either the
ACT Assessment or the SAT, which are college admissions tests typically taken by high
school juniors and seniors. This out-of-level testing experience offers an opportunity for
Talent Search participants to demonstrate their academic skills and knowledge. In
addition, the test scores are used to determine whether participants will qualify for
recognition ceremonies and for the prestigious Summer Residential Program (SRP). A
small percentage (about 6%) of Talent Search participants qualify, on the basis of
relatively high ACT Assessment or SAT scores, for the SRP.
The hallmark of the SRP is intensive college-level instruction in a particular
academic subject. Students choose several courses from an extensive list of offerings in
history, language, mathematics, science, and social science, and TIP staff then assign
students to courses on a first-come, first-served basis. Because SRP participants live and
study for several weeks on the main campus of Duke University or on another
associated campus, the SRP provides social interaction with similarly talented peers.
SRP participants report experiencing both social and academic benefits as a result of
their involvement (Stocking, Cho, & Godfrey, 1996). Additional information about the
Talent Search and the SRP may be found in Goldstein and Wagner (1993).
Given the intensive academic nature of the SRP, it seems plausible that
participation in this program would be positively related to subsequent academic
performance in high school. For example, SRP participants might be more likely to take
advanced high school course work and to earn higher college admissions test scores,
relative to Talent Search students who did not participate in the SRP. However, as
Stocking et al. (1996) note, there has been little empirical research on the academic
benefits of intensive summer programs for academically talented students. The purpose
of this study, therefore, was to develop statistical evidence of how the SRP benefits
Talent Search students. This was done by examining differences between SRP
participants and nonparticipants in their subsequent academic performance in high
school, as measured by ACT Assessment scores, high school grade averages, and
advanced course work.
Data
The sample consisted of students who participated in TIP's Talent Search as 7th
graders between 1986 and 1992. Each student record included 7th-grade ACT
Assessment scores, corresponding 11th- or 12th-grade ACT Assessment scores, and
information on 30 different high school courses, which students report when registering
to take the ACT Assessment. Course information from the SRP was also available for
students who participated in that program. The final file contained 35,317 records of
Talent Search participants, 151 of which were from SRP participants.
2
It has been determined that ACT-tested students accurately report courses taken
about 87% of the time, and that the rate of agreement between reported grades and
those recorded on transcripts is about 71% (Sawyer, Laing, & Houston, 1988). These
levels of accuracy, to the extent that they are generalizable to Talent Search participants,
are likely sufficient for estimating group differences within the context of this study. It
is conceivable, however, that Talent Search participants may differ from the overall
population of ACT-tested high school students with respect to accuracy of course and
grade reporting.
The SRP course information indicated that 40 students had taken a mathematics
course of some type while participating in the SRP. This subgroup was considered
sufficiently large that relationships between SRP mathematics course taking and other
variables (e.g., high school ACT Mathematics score, high school mathematics grade
average) could be analyzed. Too few students took SRP English, science, history, or
social science courses for similar analyses to be performed for these courses.
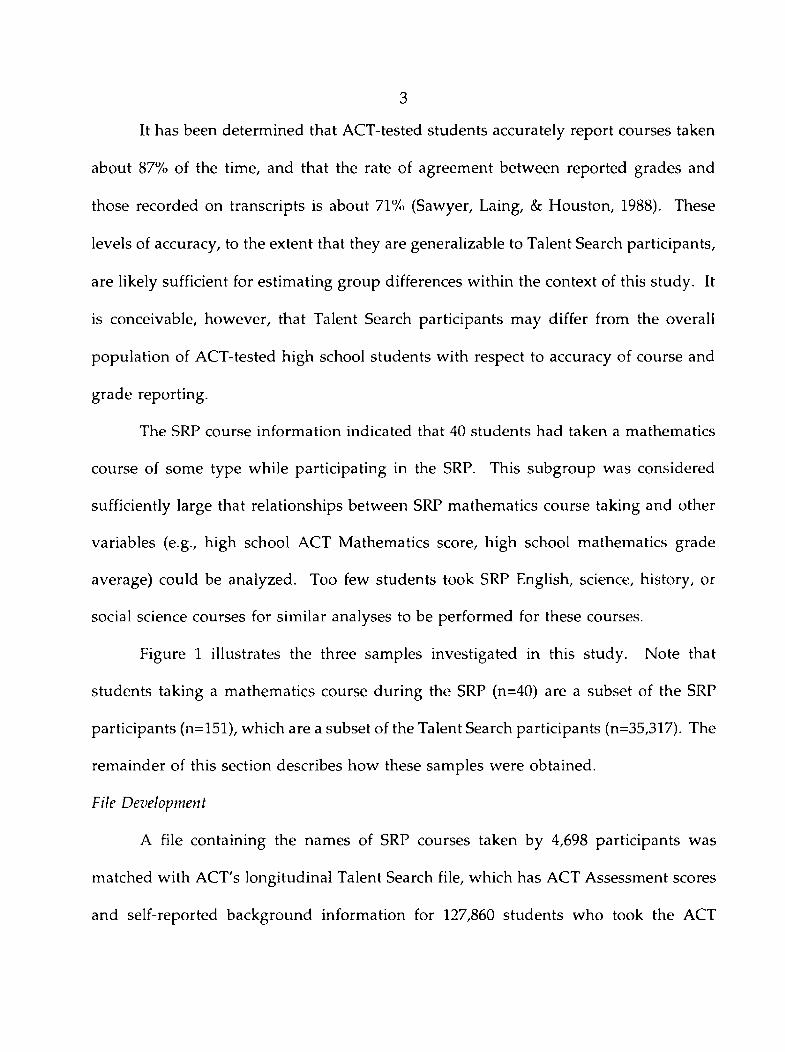
Figure 1 illustrates the three samples investigated in this study. Note that
students taking a mathematics course during the SRP (n=40) are a subset of the SRP
participants (n=151), which are a subset of the Talent Search participants (n=35,317). The
remainder of this section describes how these samples were obtained.
File Development
A file containing the names of SRP courses taken by 4,698 participants was
matched with ACT's longitudinal Talent Search file, which has ACT Assessment scores
and self-reported background information for 127,860 students who took the ACT

Assessment one or more times during the academic years 1986-87 through 1995-96 and
sent their scores to TIP. This match yielded a total of 151 student records with 7th-grade
ACT Assessment data, SRP course-taking information, and 11th- or 12th-grade ACT
Assessment data. The majority of unmatched records belonged to Talent Search
participants who elected to take the SAT, rather than the ACT Assessment. Note that
the size of the longitudinal Talent Search file decreased considerably, to 35,317 records,
because the records of all Talent Search students whose last ACT Assessment testing
occurred prior to llth-grade, or who had missing data for one or more of the variables
examined, were excluded.
One potential limitation of this study is that no information was collected on any
academic activities that might have occurred outside the SRP. For example, it is not
known whether students engaged in reading and studying on their own, over and
beyond their participation in the SRP. Such activities could, of course, be positively
related to subsequent academic performance in high school.
Current and former ACT Assessment scores. In October 1989, a revised version of
the ACT Assessment was introduced. The ACT Assessment is a curriculum-based test
of educational development that is used for college admissions and placement. Scale
scores on the ACT Assessment range from 1 to 36 for each of the four subject-area tests
(English, Mathematics, Reading, and Science Reasoning) and for the Composite score,
which is calculated by averaging the subject-area test scale scores.
The ACT English, Mathematics, and Composite scores of Talent Search students
who took the pre-1989 version of the ACT Assessment were converted, using the
4
concordance tables for these tests (ACT, 1989), to estimated English, Mathematics, and
Composite scores on the current (post-1989) ACT Assessment. Because the current
Reading and Science Reasoning tests differ substantially in content from the former
Social Studies Reading and Natural Sciences Reading tests, concordances between these
tests were not developed. Including in the sample only those students who took the
current ACT Assessment would have enabled some analyses to be performed on
Reading and Science Reasoning scores, but would have resulted in a significant decrease
in the number of SRP participants, which was already fairly small. This restriction was
therefore not imposed in order to maximize the sample size. As a result, no analyses
were performed on Reading and Science Reasoning scores.
SRP participation requirements. The minimum ACT Assessment and SAT scores
required for participation in the SRP vary somewhat from year to year and, in addition,
can differ depending on the difficulty of the particular course a student wishes to take.
For example, the current ACT Assessment scores required for participation in relatively
less difficult SRP courses are either a Mathematics score of 20 or higher, or an English
score of 27 or higher. Alternatively, a student may participate if he or she has a
Mathematics score of 19 or higher and an English score of 25 or higher. As a result of
these requirements, it is possible for students with low scores on either the Mathematics
or English test to participate in the SRP, provided that they earn the minimum score
required on the other test.
Occasionally, students who are not participating in the Talent Search will apply
directly to the SRP for admission. The educational experiences of these students likely

differ from those of students who participated in both the Talent Search and the SRP.
The records of direct applicants (n=2) were therefore not included.
Method
Linear Modeling
One way to examine relationships between SRP participation and academic
performance in high school is with linear modeling, in which seventh-grade academic
skills and knowledge (as measured by ACT Assessment scores) are statistically
controlled. Controlling for seventh-grade academic skills and knowledge is important-
otherwise, it cannot be determined conclusively whether the relatively high academic
performance of SRP participants in high school is related to attending the SRP, or
whether it instead reflects participants' relatively high academic skills and knowledge
prior to beginning this program.
Using linear modeling, comparisons were made between the academic
performance of Talent Search students who participated in the SRP and that of Talent
Search students who did not participate in this program. In addition, the performance
of Talent Search students who took an SRP mathematics course, Talent Search students
who took an SRP course other than mathematics, and Talent Search students who did
not participate in the SRP was compared. Academic outcome variables included 11th-
or 12th-grade ACT Assessment scores, high school grade average of 30 courses, subject-
area grade averages, and number of high school courses taken in certain subject areas.
A linear model for comparing the high school ACT Assessment performance of
SRP participants and nonparticipants, for example, may be expressed as
6
7
Y.. = u + t . + y ( X . - X) + £ ,y r / 1 v i j 7 i]
where Ytj = high school ACT Assessment score of the /th student in treatment j,
p = overall mean high school ACT score,
tj = treatment effect (participated in Talent Search and SRP; participated
in Talent Search, but not SRP),
y = regression effect of the covariate (seventh-grade ACT score), and
Xq = seventh-grade ACT score of the ith student in treatment j.
This model yields estimated adjusted treatment means that reflect the effect of the
covariate. Pairwise comparison tests were performed to determine whether differences
between the adjusted treatment means were statistically significant. In addition, effect
sizes were calculated to determine whether differences between these means were
substantive; i.e., significant in a practical sense.
An important assumption in the linear model above is that the slopes of the two
treatment regression lines are the same. If this assumption was not met, then the model
was not used; separate within-treatment regression functions were compared instead.
Logistic Regression
Some of the academic outcome variables were dichotomous (e.g., whether or not
a student took calculus in high school). One way to model such variables as a function
of seventh-grade ACT Assessment score X is with a logistic regression function

n = (1 + e"a"p*)_1 ,
where a and (3 are the parameters. If a dichotomous outcome variable is represented
by a 0 ,1 indicator variable, then the logistic regression function yields a probability. For
example, if calculus course-taking (1 = took calculus, 0 = did not take) is modeled as a
function of seventh-grade ACT Mathematics score, then ft is the estimated conditional
probability of taking calculus, given seventh-grade Mathematics score.
Separate (within-treatment) logistic regression models were developed and then
compared for the two combinations of groups described previously: 1) SRP participants
and nonparticipants, and 2) participants who took an SRP mathematics course,
participants who took a course other than mathematics, and nonparticipants.
Results
When interpreting the results of this study, it is important to remember that
students who did not participate in the SRP did participate in the Talent Search. These
students, referred to as "nonparticipants," resemble SRP participants in that they are also
very talented academically, relative to the general population of seventh-grade students.
This is reflected in the high ACT Assessment scores and course grades earned by SRP
participants and nonparticipants alike.
ACT Mathematics Scores
SRP participants vs. nonparticipants. Figure 2 shows (unadjusted) mean ACT
Mathematics scores for SRP participants and nonparticipants. As expected, SRP
participants had higher 7th-grade ACT Mathematics scores, on average, than did
nonparticipants (X=19.3 vs. 15.4, respectively). This was also true of ACT Mathematics
8

scores earned in grade 11 or 12 (x=29.7 vs. 24.6, respectively). It is interesting to note,
for comparative purposes, that the 1996 mean Mathematics score of ACT-tested high
school students nationwide (20.2) was considerably lower than those of both SRP
participants and nonparticipants when they were high school students.
In Figure 3, the regression of high school Mathematics score on 7th-grade
Mathematics score is illustrated for SRP participants (represented by the solid line) and
nonparticipants (represented by the dashed line). Each regression line has 95%
confidence bands around it. Note that the plot points in this figure may represent more
than one observation. For example, there were 72 nonparticipants who earned a 7 th-
grade ACT Mathematics score of 8 and a high school Mathematics score of 18.
The confidence bands around the regression lines in Figure 3 overlap for 7th-
grade ACT Mathematics scores of about 25 or higher. The results shown in this figure
indicate that SRP participants consistently outperformed nonparticipants on the ACT
Mathematics test in high school, provided that students' 7th-grade Mathematics scores
were lower than 25.
Nearly all Talent Search students in this study earned 7th-grade Mathematics
scores lower than 25; the percentages of SRP participants and nonparticipants earning
7th-grade ACT Mathematics scores in this interval were 95% and nearly 100%,
respectively. (See Appendix A, which contains distributions of 7th-grade ACT score
cumulative percentages, rounded to the nearest integer, for SRP participants and
nonparticipants.)
The regression lines in Figure 3 appear reasonably parallel, and a statistical test
did not contradict this assumption. A linear model was therefore developed in which
the treatment effect of SRP participation, adjusted for seventh-grade Mathematics score,
was found to be statistically significant (pc.0001).
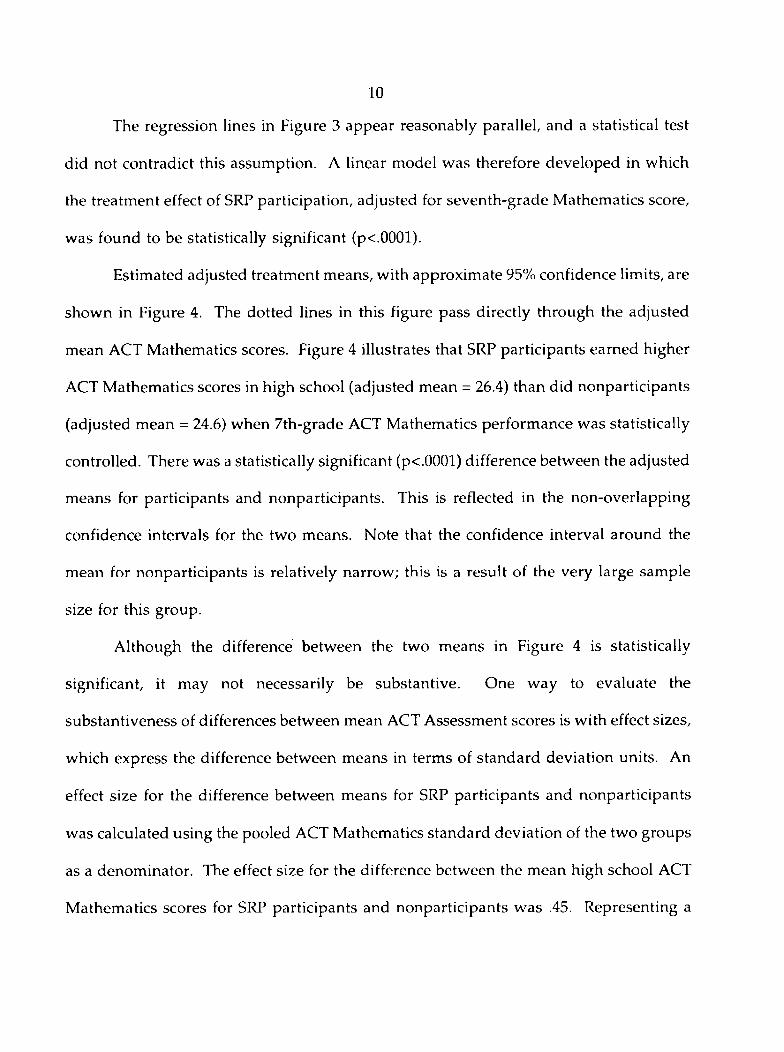
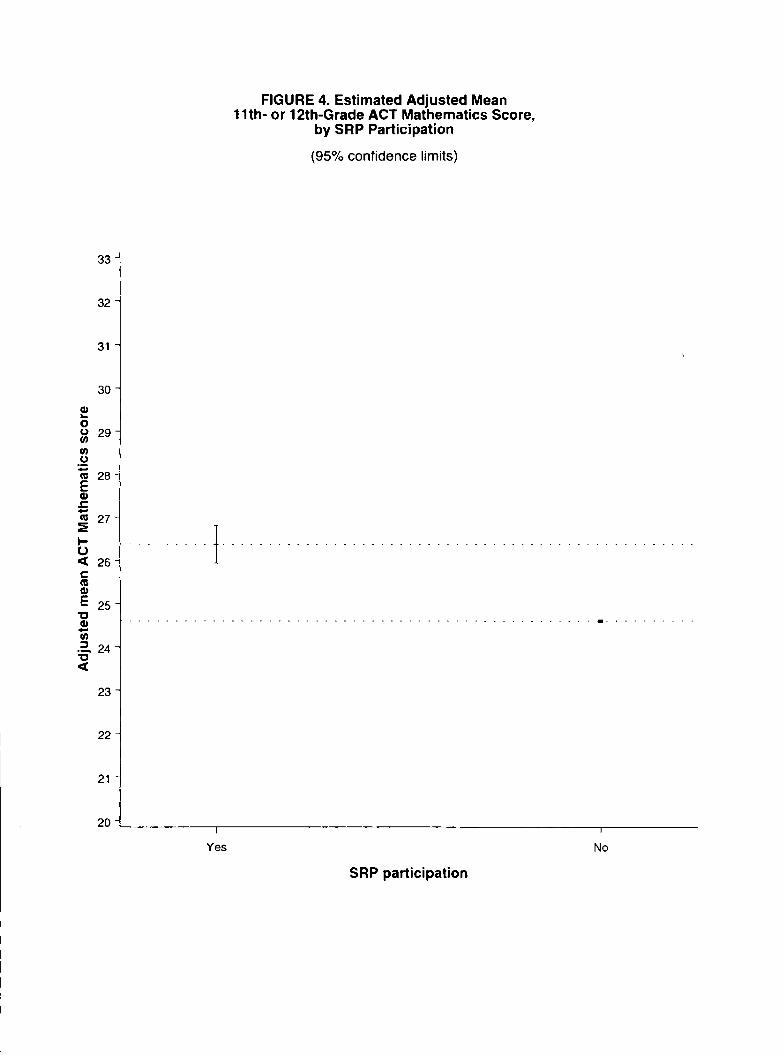
Estimated adjusted treatment means, with approximate 95% confidence limits, are
shown in Figure 4. The dotted lines in this figure pass directly through the adjusted
mean ACT Mathematics scores. Figure 4 illustrates that SRP participants earned higher
ACT Mathematics scores in high school (adjusted mean = 26.4) than did nonparticipants
(adjusted mean = 24.6) when 7th-grade ACT Mathematics performance was statistically
controlled. There was a statistically significant (pc.0001) difference between the adjusted
means for participants and nonparticipants. This is reflected in the non-overlapping
confidence intervals for the two means. Note that the confidence interval around the
mean for nonparticipants is relatively narrow; this is a result of the very large sample
size for this group.
Although the difference between the two means in Figure 4 is statistically
significant, it may not necessarily be substantive. One way to evaluate the
substantiveness of differences between mean ACT Assessment scores is with effect sizes,
which express the difference between means in terms of standard deviation units. An
effect size for the difference between means for SRP participants and nonparticipants
was calculated using the pooled ACT Mathematics standard deviation of the two groups
as a denominator. The effect size for the difference between the mean high school ACT
Mathematics scores for SRP participants and nonparticipants was .45. Representing a
10
difference between means of nearly one-half of an ACT standard deviation unit, the size
of this effect is readily noticeable, and suggests that the average ACT Mathematics
performance of SRP participants was meaningfully higher than that of nonparticipants.
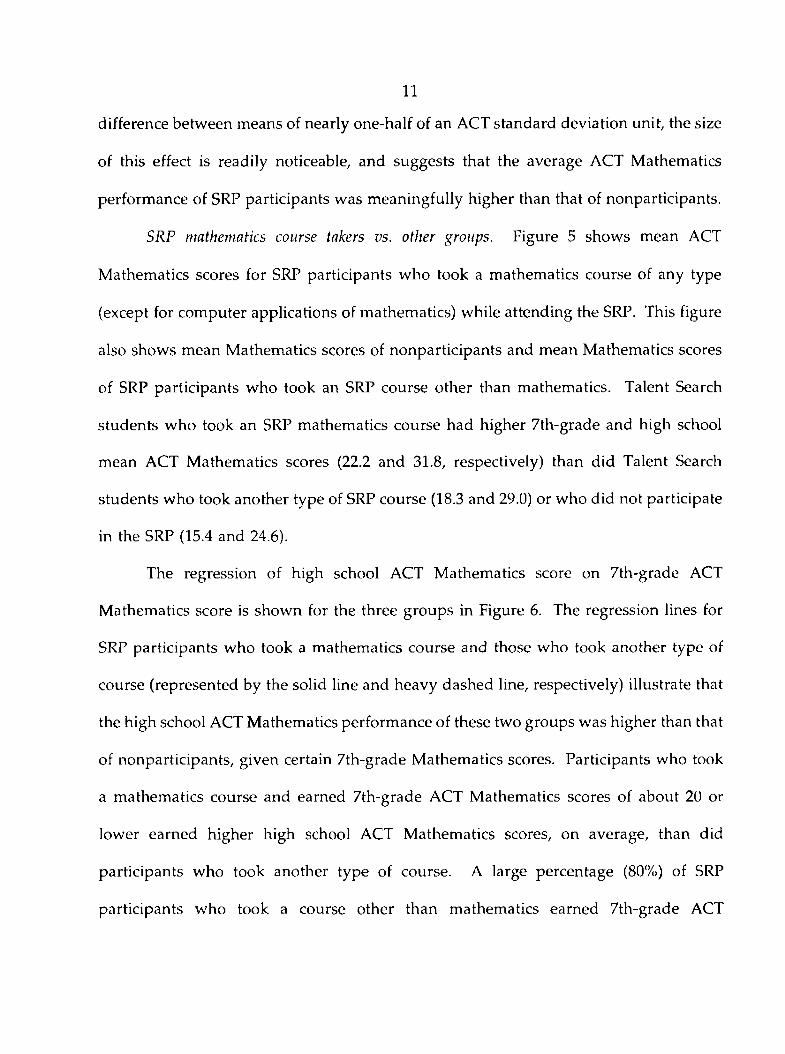
SRP mathematics course takers vs. other groups. Figure 5 shows mean ACT
Mathematics scores for SRP participants who took a mathematics course of any type
(except for computer applications of mathematics) while attending the SRP. This figure
also shows mean Mathematics scores of nonparticipants and mean Mathematics scores
of SRP participants who took an SRP course other than mathematics. Talent Search
students who took an SRP mathematics course had higher 7th-grade and high school
mean ACT Mathematics scores (22.2 and 31.8, respectively) than did Talent Search
students who took another type of SRP course (18.3 and 29.0) or who did not participate
in the SRP (15.4 and 24.6).
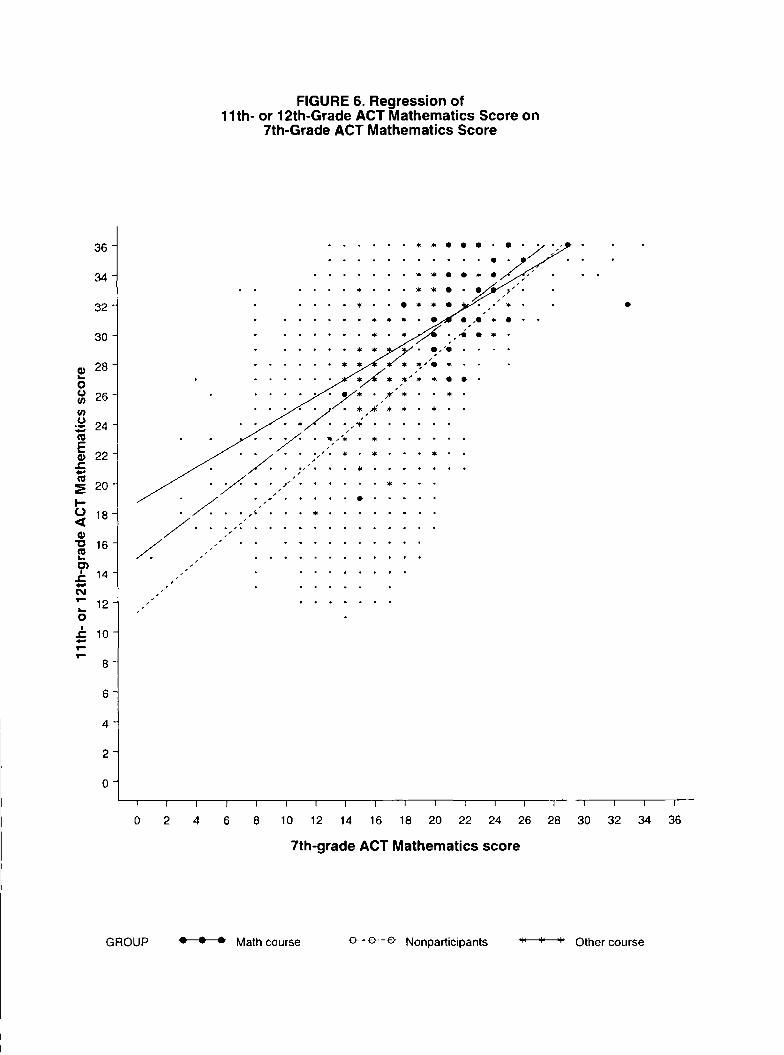
The regression of high school ACT Mathematics score on 7th-grade ACT
Mathematics score is shown for the three groups in Figure 6. The regression lines for
SRP participants who took a mathematics course and those who took another type of
course (represented by the solid line and heavy dashed line, respectively) illustrate that
the high school ACT Mathematics performance of these two groups was higher than that
of nonparticipants, given certain 7th-grade Mathematics scores. Participants who took
a mathematics course and earned 7th-grade ACT Mathematics scores of about 20 or
lower earned higher high school ACT Mathematics scores, on average, than did
participants who took another type of course. A large percentage (80%) of SRP
participants who took a course other than mathematics earned 7th-grade ACT
11
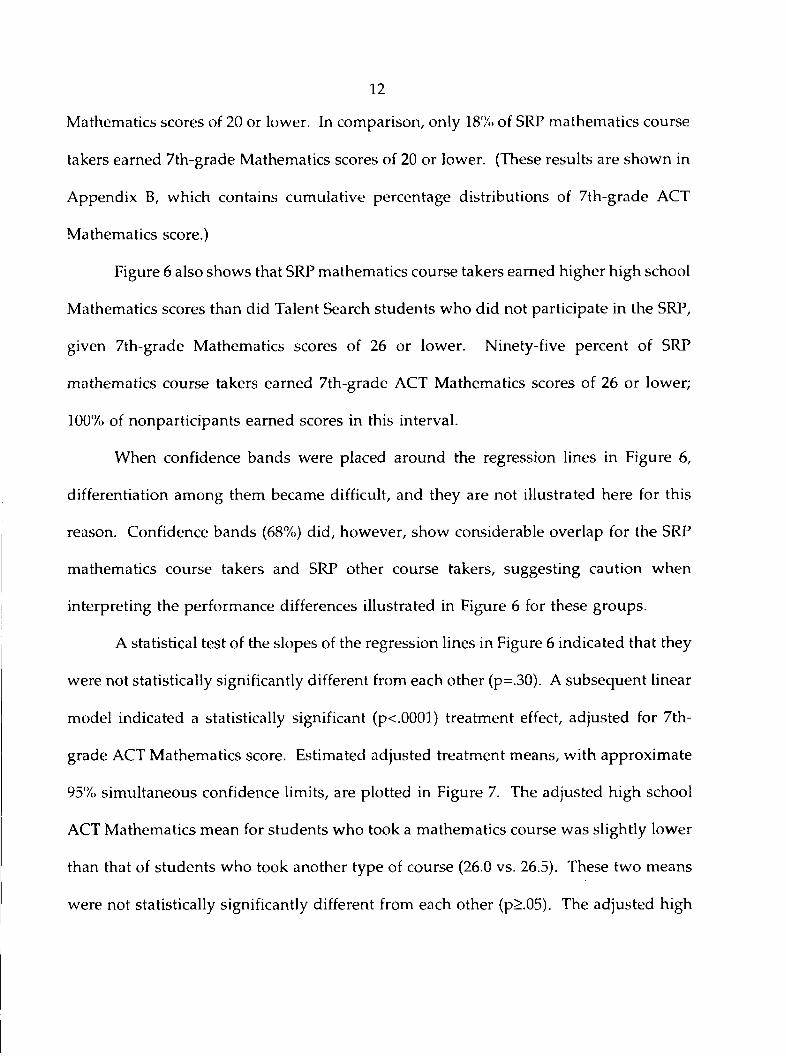
Mathematics scores of 20 or lower. In comparison, only 18% of SRP mathematics course
takers earned 7th-grade Mathematics scores of 20 or lower. (These results are shown in
Appendix B, which contains cumulative percentage distributions of 7th-grade ACT
Mathematics score.)
Figure 6 also shows that SRP mathematics course takers earned higher high school
Mathematics scores than did Talent Search students who did not participate in the SRP,
given 7th-grade Mathematics scores of 26 or lower. Ninety-five percent of SRP
mathematics course takers earned 7th-grade ACT Mathematics scores of 26 or lower;
100% of nonparticipants earned scores in this interval.
When confidence bands were placed around the regression lines in Figure 6,
differentiation among them became difficult, and they are not illustrated here for this
reason. Confidence bands (68%) did, however, show considerable overlap for the SRP
mathematics course takers and SRP other course takers, suggesting caution when
interpreting the performance differences illustrated in Figure 6 for these groups.
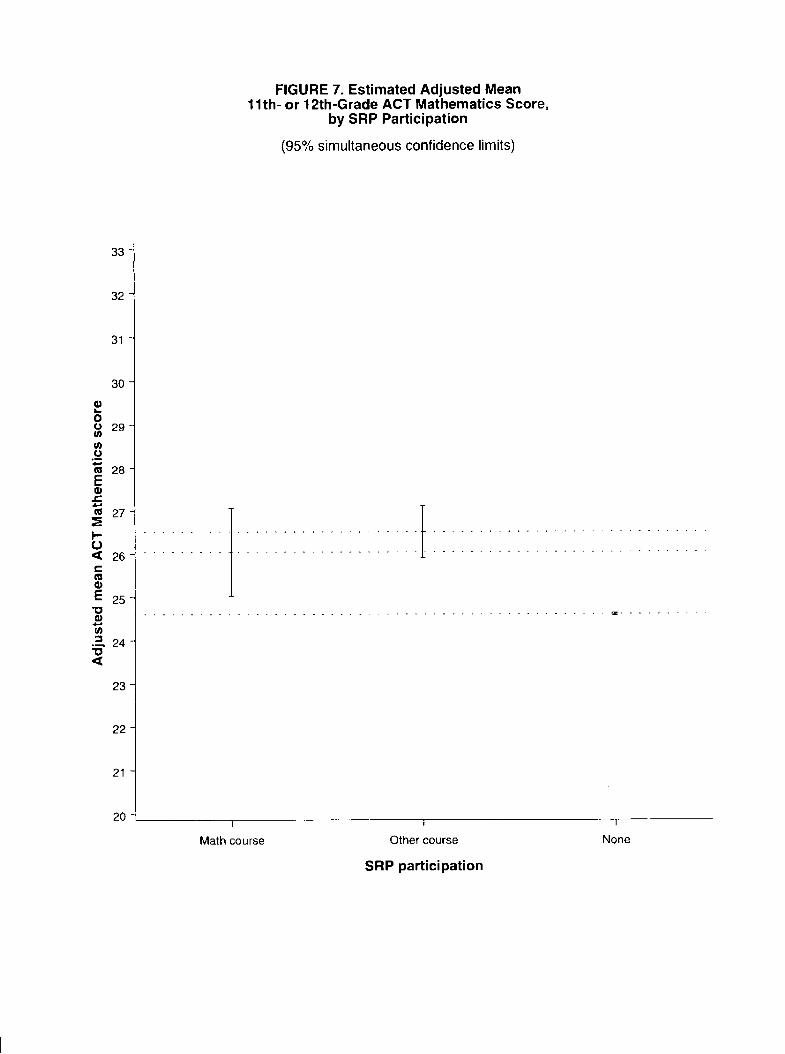
A statistical test of the slopes of the regression lines in Figure 6 indicated that they
were not statistically significantly different from each other (p=.30). A subsequent linear
model indicated a statistically significant (pc.0001) treatment effect, adjusted for 7th-
grade ACT Mathematics score. Estimated adjusted treatment means, with approximate
95% simultaneous confidence limits, are plotted in Figure 7. The adjusted high school
ACT Mathematics mean for students who took a mathematics course was slightly lower
than that of students who took another type of course (26.0 vs. 26.5). These two means
were not statistically significantly different from each other (p>.05). The adjusted high
12
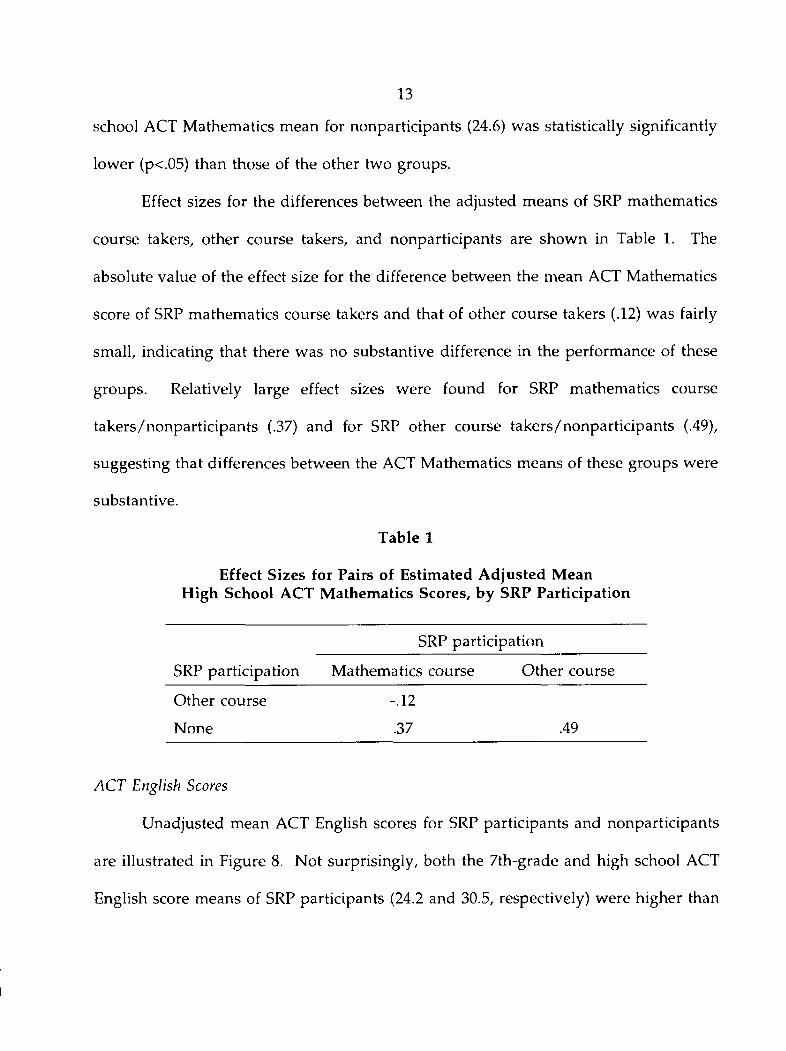
school ACT Mathematics mean for nonparticipants (24.6) was statistically significantly
lower (p<.05) than those of the other two groups.
Effect sizes for the differences between the adjusted means of SRP mathematics
course takers, other course takers, and nonparticipants are shown in Table 1. The
absolute value of the effect size for the difference between the mean ACT Mathematics
score of SRP mathematics course takers and that of other course takers (.12) was fairly
small, indicating that there was no substantive difference in the performance of these
groups. Relatively large effect sizes were found for SRP mathematics course
takers/nonparticipants (.37) and for SRP other course takers/nonparticipants (.49),
suggesting that differences between the ACT Mathematics means of these groups were
substantive.
Table 1
13
Effect Sizes for Pairs of Estimated Adjusted Mean High School ACT Mathematics Scores, by SRP Participation
SRP participation
SRP participation Mathematics course Other course
Other course -.12
None .37 .49
ACT English Scores
Unadjusted mean ACT English scores for SRP participants and nonparticipants
are illustrated in Figure 8. Not surprisingly, both the 7th-grade and high school ACT
English score means of SRP participants (24.2 and 30.5, respectively) were higher than
those of nonparticipants (17.7 and 26.1, respectively). In comparison, the 1996 mean
English score for ACT-tested high school students nationwide was 20.3.
The regression of high school ACT English score on 7th-grade ACT English score
is plotted in Figure 9 for SRP participants and nonparticipants. This figure illustrates
that SRP participants with 7th-grade ACT English scores of about 22 or lower earned
higher English scores in high school, on average, than did nonparticipants with
equivalent 7th-grade English scores.
A statistical test indicated that the slopes of the regression lines in Figure 9
differed significantly for SRP participants and nonparticipants. A linear model
containing a term representing the effect of SRP participation was therefore not
considered appropriate for analyzing these data.
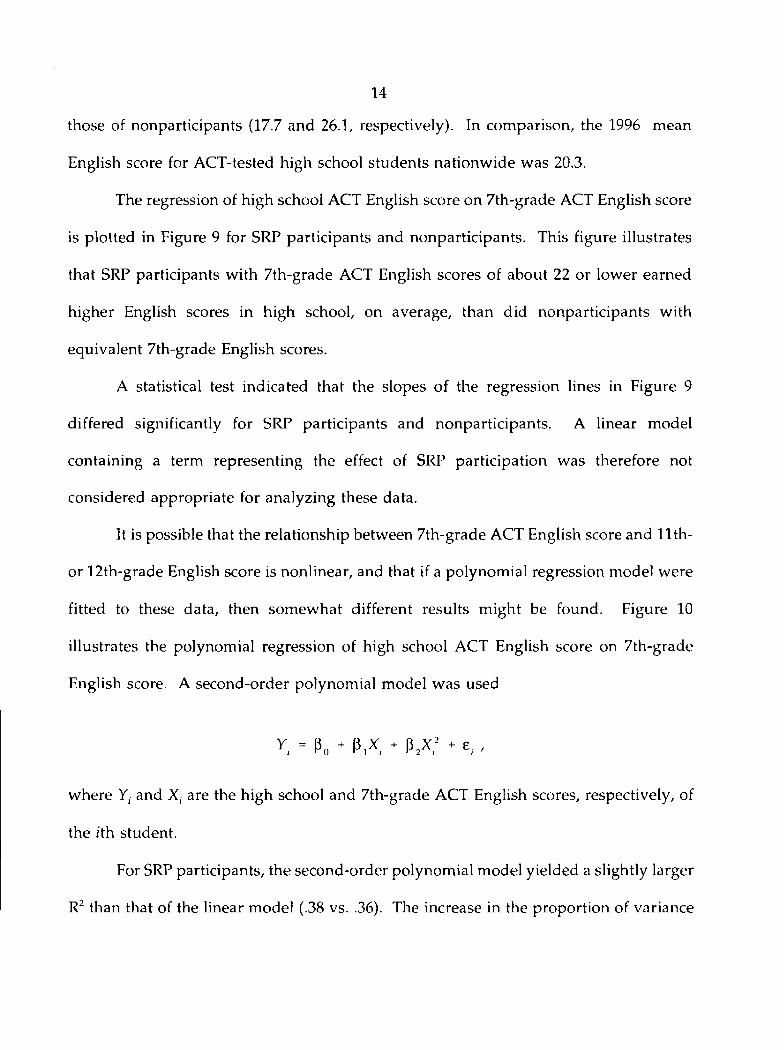
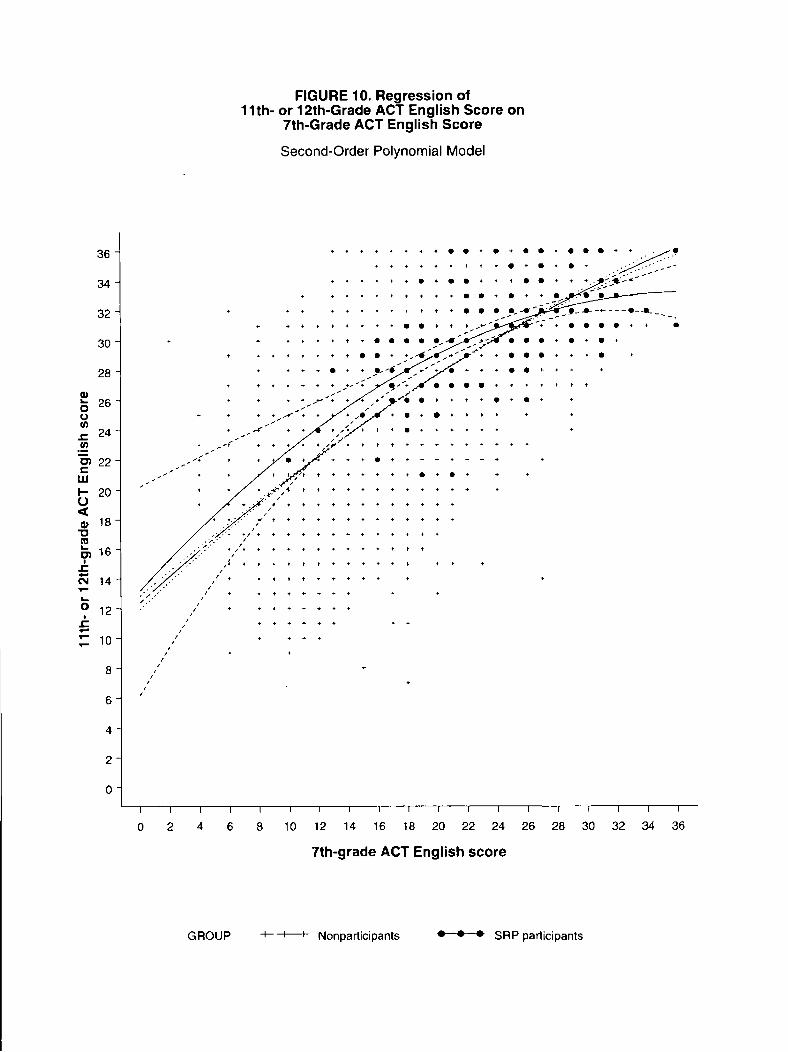
It is possible that the relationship between 7th-grade ACT English score and 11th-
or 12th-grade English score is nonlinear, and that if a polynomial regression model were
fitted to these data, then somewhat different results might be found. Figure 10
illustrates the polynomial regression of high school ACT English score on 7th-grade
English score. A second-order polynomial model was used
y, = p0 + p.X, * P2X,2 - e. ,
where Y, and are the high school and 7th-grade ACT English scores, respectively, of
the z’th student.
For SRP participants, the second-order polynomial model yielded a slightly larger
R2 than that of the linear model (.38 vs. .36). The increase in the proportion of variance
14
accounted for by the second-order polynomial model was statistically significant (p<.05).
For nonparticipants, the second-order model similarly yielded a statistically significant
(pc.001) increase in proportion of variance accounted for, although R2 remained nearly
identical to that of the linear model (.433 vs. .431).
Figure 10 shows that SRP participants outperformed nonparticipants on the ACT
English test in high school, provided that students' 7th-grade English scores were
between 12 and 24. Given that very few students earned 7th-grade English scores below
12, these results do not differ greatly from those of the linear models (Figure 9).
Third-order polynomial models were also developed for SRP participants and
nonparticipants. However, for SRP participants, the regression coefficient corresponding
to the cubic term in the model was not statistically significant (p=.93).
ACT Composite Scores
Figure 11 illustrates (unadjusted) mean ACT Composite scores for SRP
participants and nonparticipants. It can be seen in this figure that the 7th-grade and
high school Composite score means of SRP participants (22.2 and 30.6, respectively)
were, as expected, higher than those of nonparticipants (17.1 and 25.9, respectively). The
1996 mean Composite score of ACT-tested high school students nationwide (20.9) was
considerably lower than those of SRP participants and nonparticipants when they were
high school students.
In Figure 12, the regression of high school Composite score on 7th-grade
Composite score is illustrated for SRP participants and nonparticipants. This figure
shows that SRP participants with 7th-grade Composite scores of 20 or lower earned, on
15

average, higher Composite scores in high school than did nonparticipants with
equivalent 7th-grade Composite scores. Results of second-order polynomial models
were similar to those of the linear models.
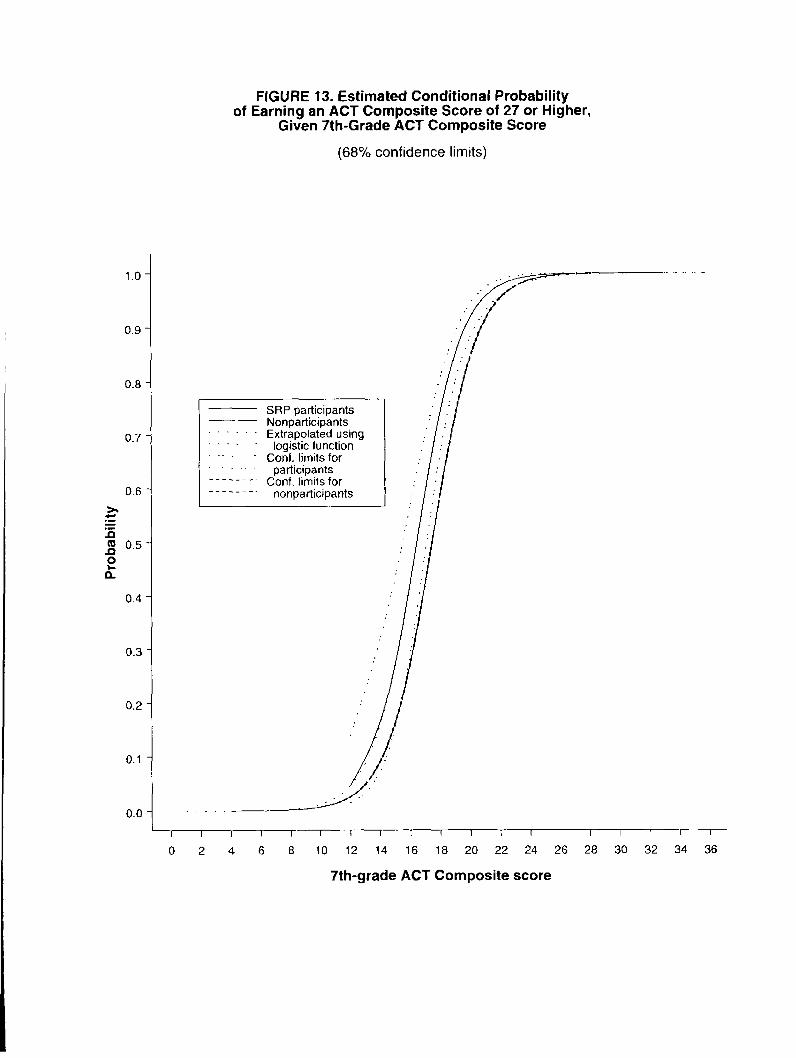
An ACT Composite score of 27 is a fairly high score; nationwide, only 10% of
ACT-tested high school students earn Composite scores higher than this. Figure 13
illustrates estimated conditional probabilities of earning an ACT Composite score of 27
or higher in high school, given 7th-grade Composite score. The dotted lines at the ends
of the logistic regression curves in this figure illustrate that the curves were extrapolated
to 7th-grade ACT Composite scores beyond the range of observed scores by using the
respective logistic regression functions. Sixty-eight percent confidence bands are shown
around each logistic curve.
The logistic regression curves in Figure 13 illustrate that SRP participants had a
greater estimated conditional probability of earning a Composite score of 27 or higher
in high school than did nonparticipants, given a 7th-grade ACT Composite score
between 16 and 21. For example, SRP participants who earned a Composite score of 18
in 7th grade had a 74% chance of earning a 27 or higher in high school.
Nonparticipants, in comparison, had a 59% chance of earning this score, given the same
7th-grade Composite score.
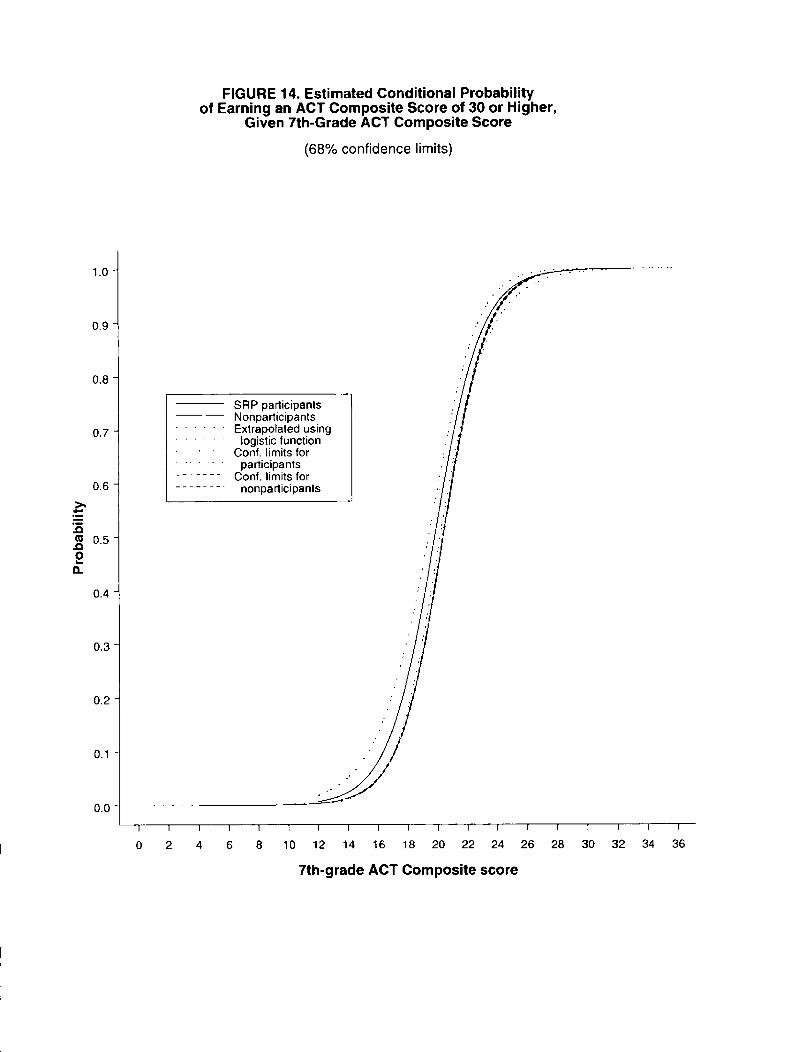
Figure 14 shows estimated conditional probabilities of earning a high school ACT
Composite score of 30 or higher, given 7th-grade ACT Composite score. These
probabilities were higher for SRP participants than for nonparticipants, given a 7th-grade
Composite score between 18 and 21. The probability of earning high school ACT
16

Composite scores of 31 or higher, 32 or higher, etc. could not be estimated effectively
because too few nonparticipants had scores in these intervals.
High School Course Taking
SRP participants vs. nonparticipants—trigonometry. The percentage of SRP
participants who reported taking trigonometry in high school (41%) was larger than that
of nonparticipants (24%). The estimated conditional probability of taking trigonometry,
given 7th-grade ACT Mathematics score, is plotted in Figure 15 for participants and
nonparticipants. The results in this figure illustrate that SRP participants had a greater
estimated conditional probability of taking trigonometry in high school than did
nonparticipants, given 7th-grade ACT Mathematics scores between about 15 and 26. For
example, at a 7th-grade Mathematics score of 22, the probability of an SRP participant
taking trigonometry was about .49. In comparison, the probability of a nonparticipant
with this same score taking trigonometry was about .38.
SRP mathematics course takers vs. other groups—trigonometry. A relatively high
percentage (59%) of SRP participants who took a mathematics course while participating
in the SRP reported taking trigonometry in high school. Fewer SRP participants who
took another course in the SRP (35%) or who did not participate (24%) reported taking
trigonometry in high school. Given 7th-grade ACT Mathematics scores of about 16 or
higher, SRP mathematics course takers had a greater likelihood of taking trigonometry
than did other course takers or nonparticipants (see Figure 16). Figure 16 also shows
that for SRP participants who took other courses and earned Mathematics scores of
17

about 24 or higher, the probability of taking trigonometry was lower than that of
nonparticipants.
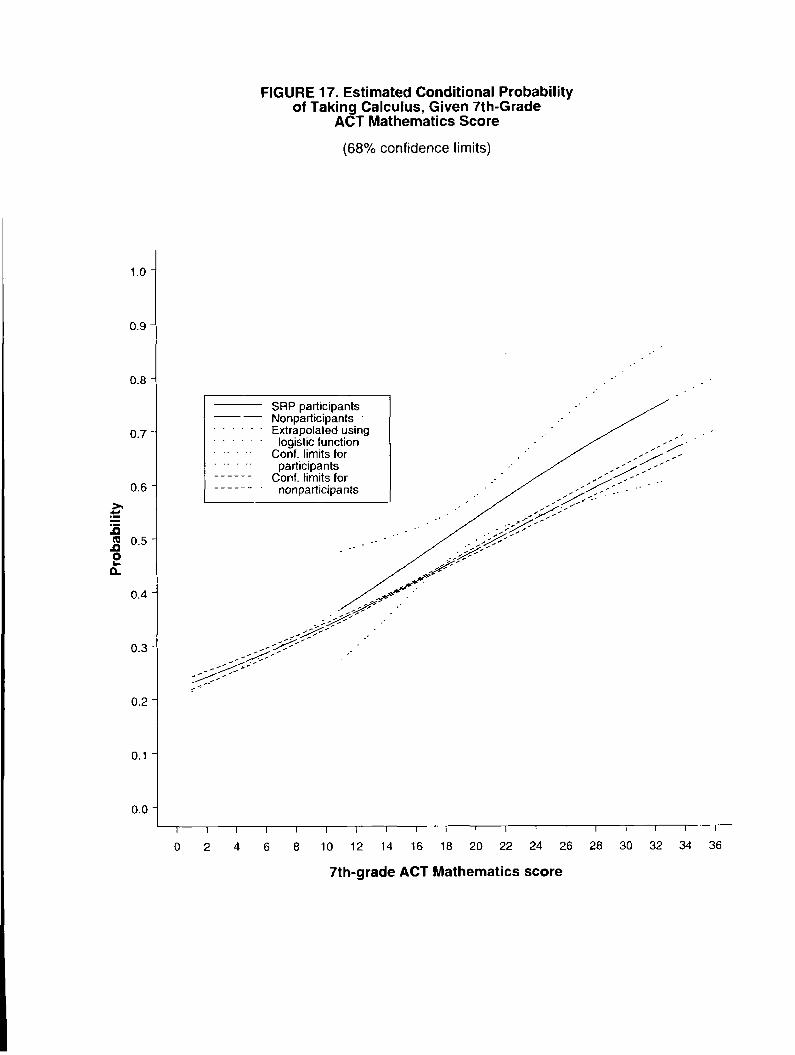
SRP participants vs. nonparticipants—calculus. The percentage of SRP participants
who reported taking calculus in high school (53%) was larger than that of
nonparticipants (44%). Figure 17 illustrates that, given 7th-grade ACT Mathematics
scores between about 19 and 23, SRP participants were more likely than nonparticipants
to take calculus in high school.
SRP mathematics course takers vs. other groups—calculus. A relatively high
percentage (60%) of SRP mathematics course takers reported taking calculus in high
school. Relatively few SRP participants who took another SRP course (51%) or who did
not participate (44%) reported taking calculus in high school.
Figure 18 shows probability curves associated with taking calculus in high school.
The results shown in this figure suggest that SRP participants who earned 7th-grade
ACT Mathematics scores of 19 or higher and took an SRP mathematics course had a
higher estimated probability of taking calculus in high school than did other SRP
participants and nonparticipants with equivalent 7th-grade Mathematics scores.
Other courses, such as chemistry and physics, were investigated as potential
academic outcome variables. Problems were encountered in developing logistic
regression models for these courses, however, due to small sample sizes. For example,
a model that used Science Reasoning score as a predictor of science course taking could
not be developed because some SRP participants took the former version of the ACT
Assessment and therefore did not have Science Reasoning scores.
18

High School Grade Averages
Figures 19 and 20 show distributions of self-reported high school grade average
and mathematics grade average, respectively, for SRP participants and nonparticipants.
Most SRP participants (70%) had cumulative overall high school grade averages between
3.75 and 4.00. In comparison, most nonparticipants (59%) had grade averages between
3.50 and 4.00. The situation was similar for high school mathematics grade averages;
most SRP participants (78%) had mathematics grade averages between 3.75 and 4.00,
whereas most nonparticipants (62%) had mathematics grade averages between 3.50 and
4.00.
Too few SRP participants (n=4) had cumulative overall high school grade averages
below B (3.00) to effectively estimate the probability of earning a grade average of B or
higher, given seventh-grade ACT Assessment score. The probability of earning a
cumulative overall grade average of A (4.00) similarly could not be estimated because
relatively few students had this grade average.
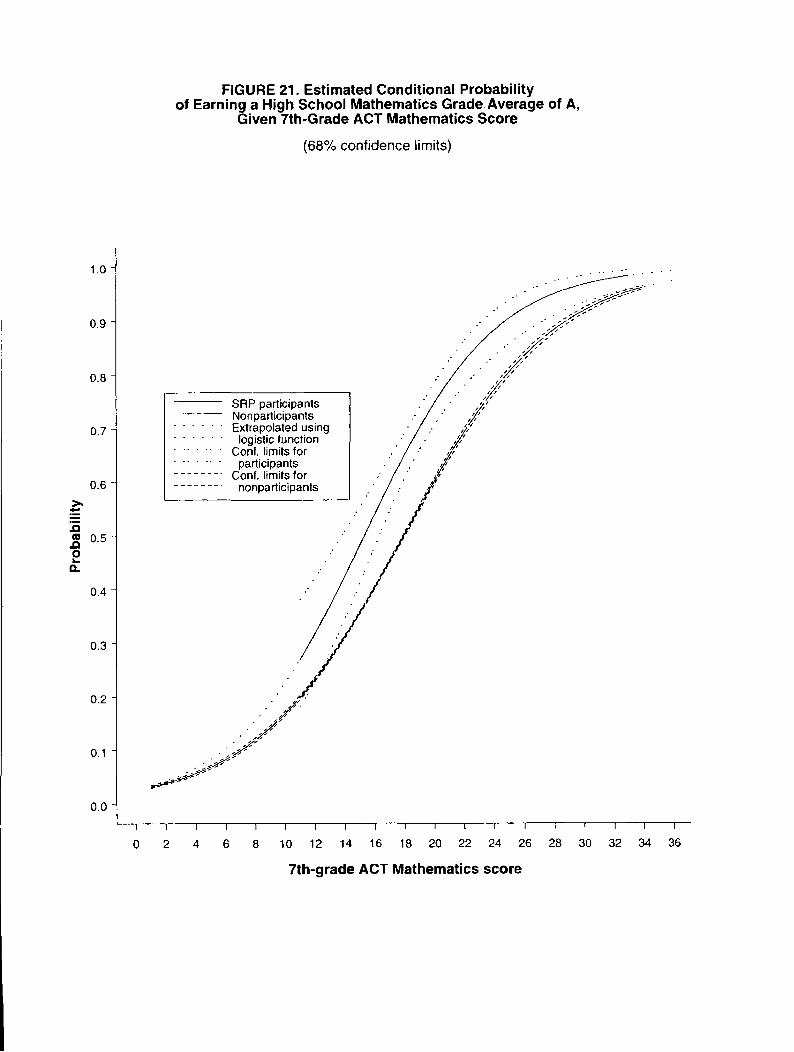
The situation for mathematics grade average was somewhat different, however.
The probability of earning a mathematics grade average of A (4.00), given 7th-grade
ACT Mathematics score, could be estimated because a relatively large number of SRP
participants (n=105) had a mathematics grade average of A. Figure 21 shows the
resulting probability curves, with 68% confidence limits, for SRP participants and
nonparticipants. This figure shows that given a 7th-grade ACT Mathematics score
between approximately 14 and 31, SRP participants had a higher estimated probability
than nonparticipants of earning a high school mathematics grade average of A.
19
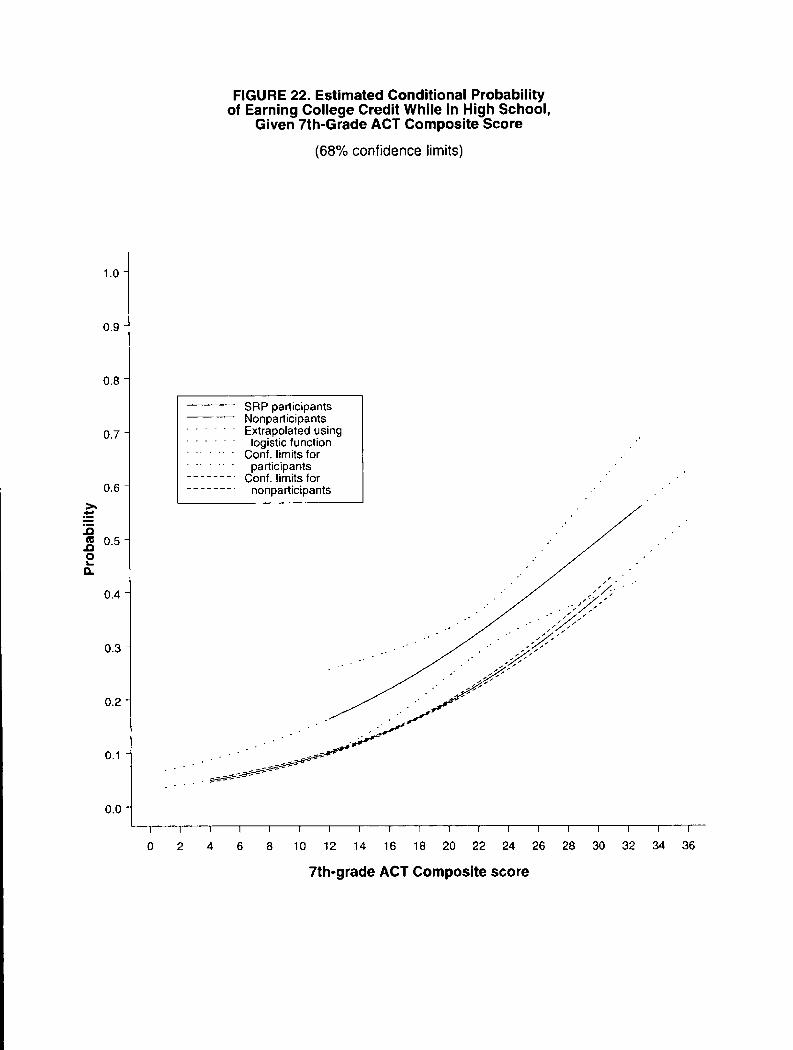
College Credit
At the time of their high school ACT Assessment testing, 33% of SRP participants
reported that they had previously earned college credit while in high school. In
comparison, only about 16% of nonparticipants reported that they had previously earned
college credit.
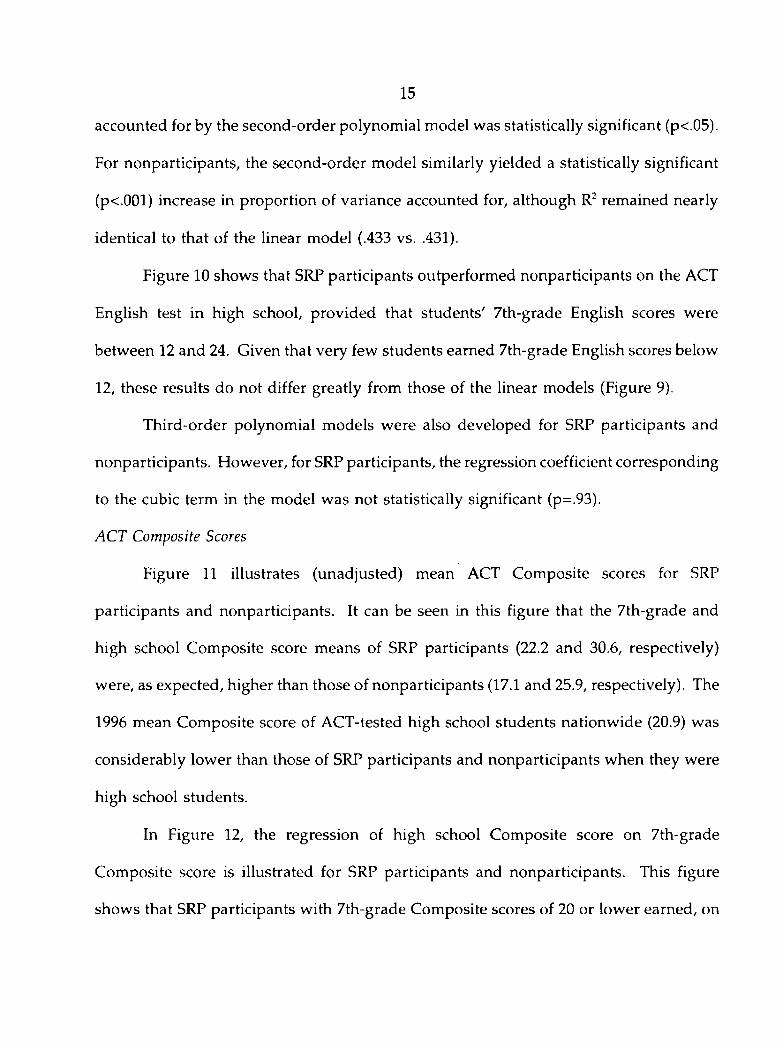
The estimated conditional probability of earning college credit while in high
school, given 7th-grade ACT Composite score, is shown in Figure 22. This figure
illustrates that SRP participants had a higher estimated probability than nonparticipants
of earning college credit, given a 7th-grade Composite score between 14 and 28.
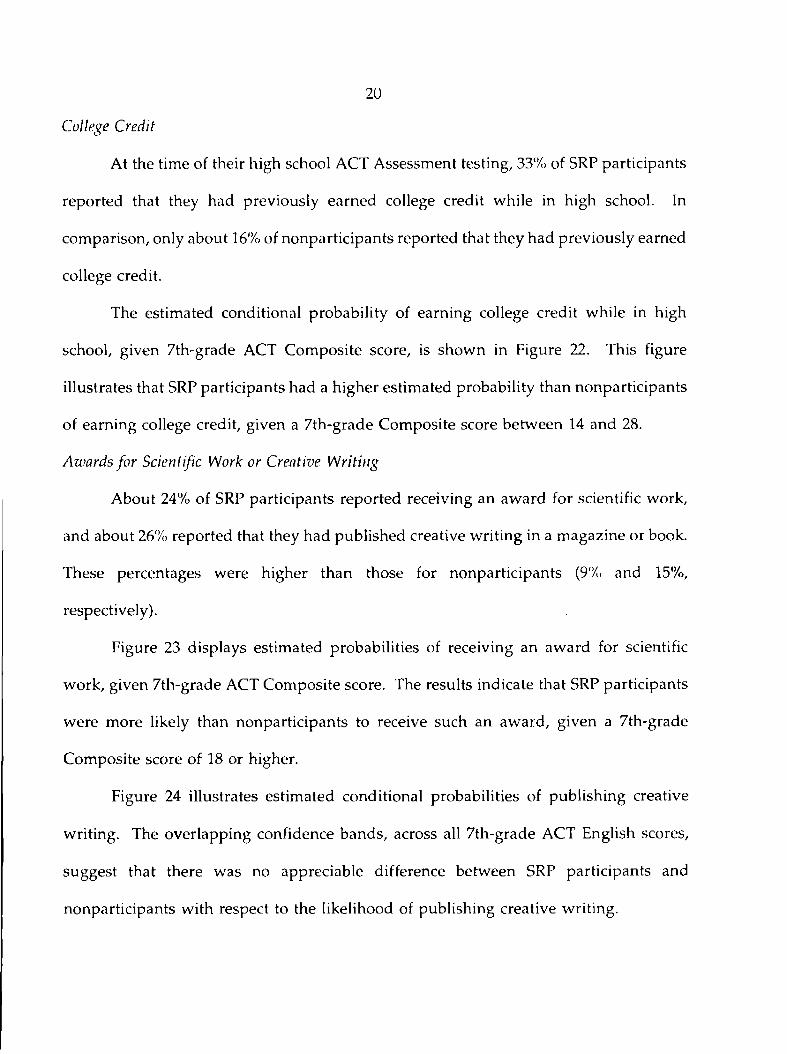
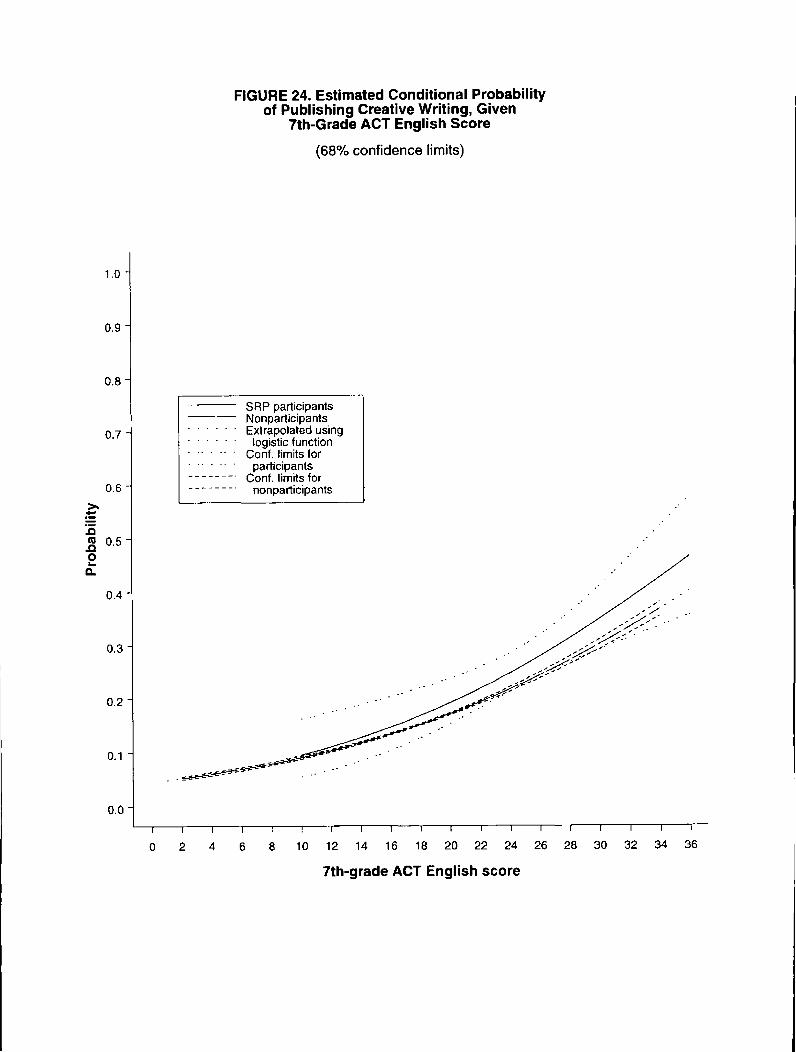
Awards for Scientific Work or Creative Writing
About 24% of SRP participants reported receiving an award for scientific work,
and about 26% reported that they had published creative writing in a magazine or book.
These percentages were higher than those for nonparticipants (9% and 15%,
respectively).
Figure 23 displays estimated probabilities of receiving an award for scientific
work, given 7th-grade ACT Composite score. The results indicate that SRP participants
were more likely than nonparticipants to receive such an award, given a 7th-grade
Composite score of 18 or higher.
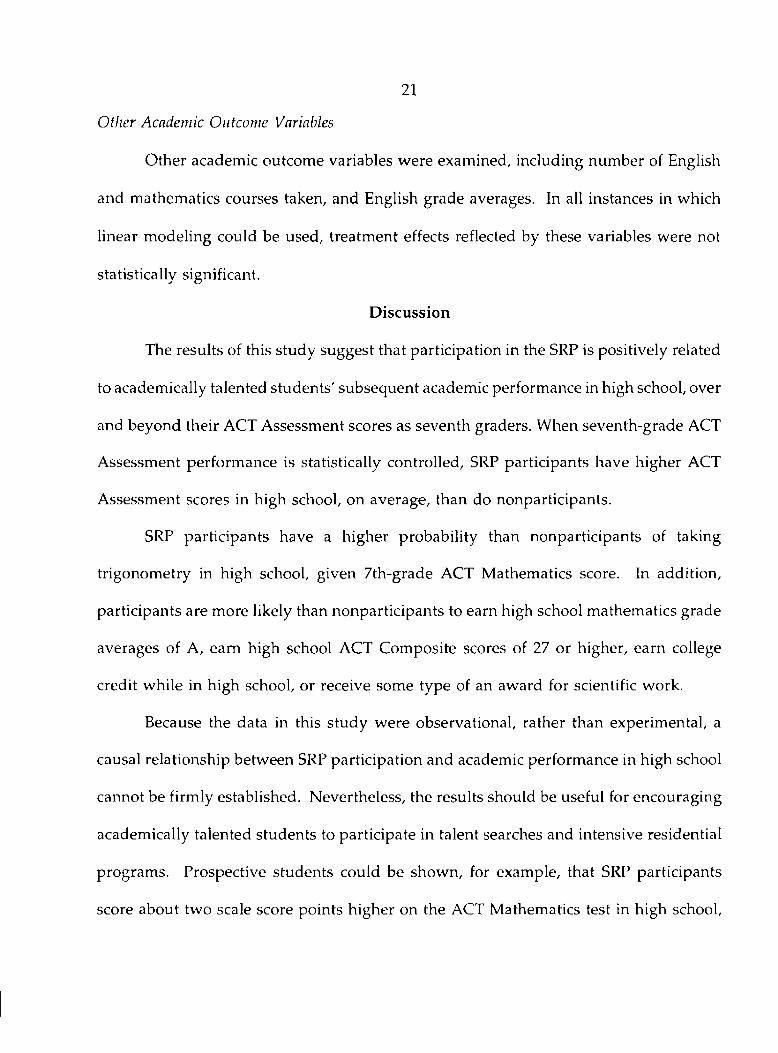
Figure 24 illustrates estimated conditional probabilities of publishing creative
writing. The overlapping confidence bands, across all 7th-grade ACT English scores,
suggest that there was no appreciable difference between SRP participants and
nonparticipants with respect to the likelihood of publishing creative writing.
20
Other Academic Outcome Variables
Other academic outcome variables were examined, including number of English
and mathematics courses taken, and English grade averages. In all instances in which
linear modeling could be used, treatment effects reflected by these variables were not
statistically significant.
Discussion
The results of this study suggest that participation in the SRP is positively related
to academically talented students' subsequent academic performance in high school, over
and beyond their ACT Assessment scores as seventh graders. When seventh-grade ACT
Assessment performance is statistically controlled, SRP participants have higher ACT
Assessment scores in high school, on average, than do nonparticipants.
SRP participants have a higher probability than nonparticipants of taking
trigonometry in high school, given 7th-grade ACT Mathematics score. In addition,
participants are more likely than nonparticipants to earn high school mathematics grade
averages of A, earn high school ACT Composite scores of 27 or higher, earn college
credit while in high school, or receive some type of an award for scientific work.
Because the data in this study were observational, rather than experimental, a
causal relationship between SRP participation and academic performance in high school
cannot be firmly established. Nevertheless, the results should be useful for encouraging
academically talented students to participate in talent searches and intensive residential
programs. Prospective students could be shown, for example, that SRP participants
score about two scale score points higher on the ACT Mathematics test in high school,
21
on average, than do Talent Search students who do not participate in the SRP. This
finding is true regardless of the ACT Mathematics scores that Talent Search and SRP
participants earn in seventh grade.
For talent search program participants who are considering postsecondary
institutions with competitive admission requirements, the results of this study may be
used to illustrate the estimated probability of earning a fairly high ACT Composite score
(e.g., a score of 27 or higher) in high school, given 7th-grade Composite score. These
students' interest in participating in an intensive residential program may increase when
they discover that SRP participants' estimated probability of earning fairly high ACT
Composite scores in high school is typically greater than that of nonparticipants.
The results of this study, because they are based on data from a single summer
residential program, are generalizable to other talent search residential programs only
to the extent that such programs are similar to TIP's SRP. In addition, it is conceivable
that residential programs with criteria for participation that differ from those of the SRP
(e.g., lower or higher cutoff scores) might demonstrate academic performance differences
between program participants and nonparticipants that differ from those reported here.
Among the nonparticipants, there is a subgroup of students whose academic
performance is of interest. This subgroup consists of qualifying nonparticipants, those
Talent Search students who earned high ACT Assessment or SAT scores and qualified
for, but chose not to attend, the SRP. It is possible that linear modeling of high school
academic outcomes could yield different results for qualifying nonparticipants and SRP
22

participants. Unfortunately, there were too few qualifying nonparticipants for such
modeling to be performed.
The sample sizes for SRP participants (n=151) and the subgroup of these students
who took some type of mathematics course in the SRP (n=40) are not particularly large.
Augmenting these data with data collected from both future SRP participants and
qualifying nonparticipants might provide further insight into relationships between SRP
participation and subsequent academic performance in high school.
23
24
References
ACT (1989). The Enhanced ACT Assessment: Using Concordance Tables. Iowa City, Iowa: Author.
Goldstein, D., & Wagner, H. (1993). After school programs, competitions, school Olympics, and summer programs. In K. A. Heller, F. J. Monks, & A. H. Passow (Eds.), International Handbook o f Research and Development o f Giftedness and Talent (pp. 593-604). New York: Pergamon.
Sawyer, R., Laing, J., & Houston, M. (1988). Accuracy o f self reported high school courses and grades o f college-bound students (Research Report No. 88-1). Iowa City, Iowa: ACT.
Stocking, V. B., Cho, P. T., & Godfrey, J. J. (1996, September). Academically talented adolescents' experience in an intensive summer program: Comparison with regular schools and reasons for attendance. Paper presented at the Sixth Annual Esther Kate Rosen Symposium for the Psychological Development of Gifted Children, Lawrence, KS.

36353433323130292K27262524232221
2019181716151413121110987654321
25
Appendix A. Cumulative Percentage Distributions of 7th-Grade ACT Assessment Score, by SRP Participation
English M athem atics Com posite
Participants N onparticipants Participants
100 100 10098 100 10098 1(H) 10097 1(H) 10096 100 9994 100 9988 100 9984 100 9976 99 9975 99 9969 98 9957 96 9850 95 9541 90 8938 88 8531 82 7525 75 6421 68 4916 59 4410 50 307 40 213 32 152 23 52 15 21 9 11 6 11 3 00 1 00 1 00 0 00 0 00 0 00 0 00 0 00 0 00 0 0
N onparticipants Participants N onparticipants
100 100 100100 100 100100 100 1001(H) 100 100100 99 100100 99 100100 98 100100 98 100100 98 100100 95 100100 89 100100 83 100too 74 99100 64 9899 56 9699 42 9398 34 8996 23 8291 11 7183 7 5970 3 4655 3 2932 1 1816 1 99 1 45 0 22 0 02 0 02 0 00 0 00 0 00 0 00 0 00 0 00 0 00 0 0

26
Appendix B. Cumulative Percentage Distributions of 7th-Grade ACT Mathematics Score for SRP Mathematics Course Takers,
Other Course Takers, and Nonparticipants
SR P
A CT score M athem atics O ther course N onparticipants
36 100 100 10035 100 100 10034 100 100 10033 100 100 10032 98 100 10031 98 100 10030 98 100 10029 98 100 10028 95 100 10027 95 100 10026 95 100 10025 93 100 10024 88 97 10023 73 95 10022 60 94 9921 45 86 9920 18 80 9819 8 64 9618 8 57 9117 5 39 8316 5 27 7015 5 18 5514 3 6 3213 0 3 1612 0 2 911 0 1 510 0 0 29 0 0 28 0 0 27 0 0 06 0 0 05 0 0 04 0 0 03 0 0 02 0 0 01 0 0 0

FIGURE 1. Samples

FIGURE 2. Mean ACT Mathematics Score, by Summer Residential Program Status
Mean ACT Mathematics
score
36
31
26
21
16
11 -J-
29.7
M 7th grade
□ 11th or 12th grade
24.6
Participated (n=151)
Did not participate (n=35,166)
Summer Residential Program status

11th
- or
12th
-gra
de
ACT
Mat
hem
atic
s sc
ore
(95% confidence limits)
FIGURE 3. Regression of11th- or 12th-Grade ACT Mathematics Score on
7th-Grade ACT Mathematics Score
7th-grade ACT Mathematics score
GROUP H— 1— h Nonparticipants • •- SRP participants
Adju
sted
me
an
ACT
Mat
hem
atic
s sc
ore
FIGURE 4. Estimated Adjusted Mean 11th- or 12th-Grade ACT Mathematics Score,
by SRP Participation
(95% confidence limits)
3 3 -
32 -
31 -
3 0 -
2 9 -
28 -
2 7 '
2 6 "
25 -
24 -
2 3 -
22 -
21 -
--------------------------------------------------------- (_No
SRP participation
Yes

FIGURE 5. Mean ACT Mathematics Score, by Summer Residential Program Status
31
26
21Mean ACT
Mathematics score
16
11
6
31.8
M 7th grade
O 11th or 12th grade
22.2
24.6
Took mathematics
course (n=40)
Took other course (n=111)
Did not participate (n=35,166)
Summer Residential Program status
11th
- or
12th
-gra
de
ACT
Mat
hem
atic
s sc
ore
FIGURE 6. Regression of11th- or 12th-Grade ACT Mathematics Score on
7th-Grade ACT Mathematics Score
7th-grade ACT Mathematics score
GROUP * —• —* Math course o --©--©■ Nonparticipants — *♦*—**“ Other course
Adju
sted
me
an
ACT
Mat
hem
atic
s sc
ore
FIGURE 7. Estimated Adjusted Mean 11th- or 12th-Grade ACT Mathematics Score,
by SRP Participation
(95% simultaneous confidence limits)
3 3 -
32 -
31 -
30 -
2 9 “
2 8 -
27 -
2 6 -
2 5 -
24 '
2 3 -
22 “
21 -
------ !------Math course Other course
SRP participation
None
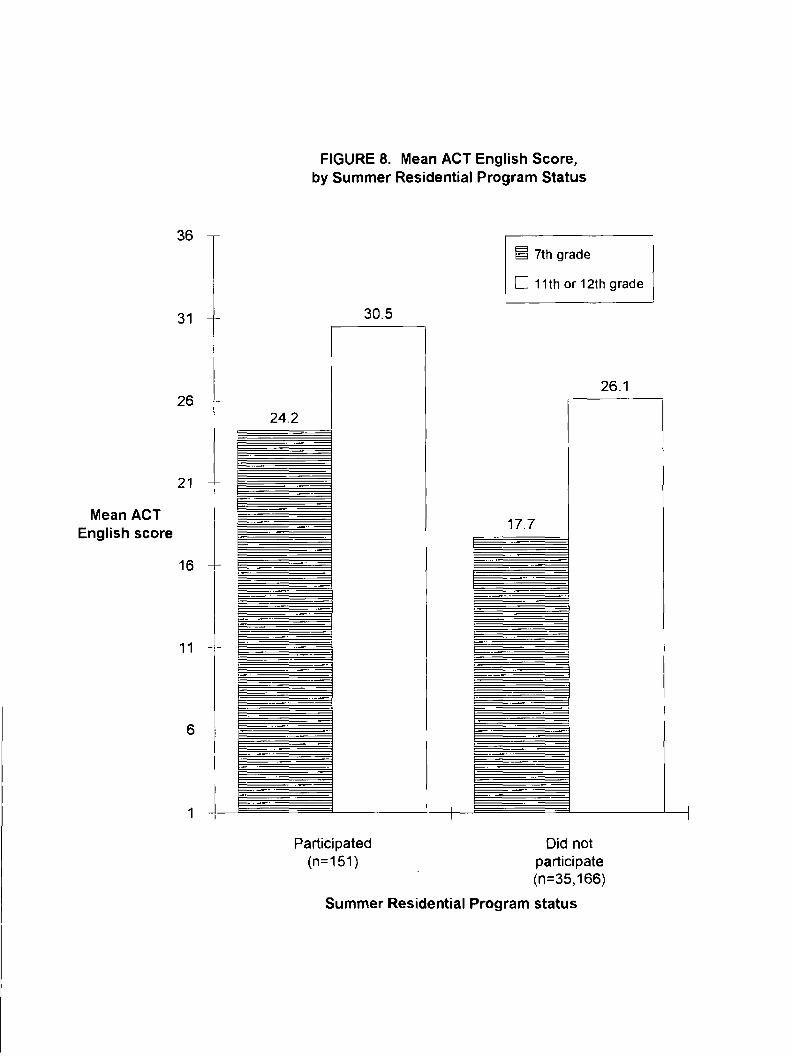
FIGURE 8. Mean ACT English Score,by Summer Residential Program Status
36
31
26
21
Mean ACT English score
16
11
6
1
M, 7th grade
□ 11th or 12th grade
30.5
26.1
24.2
Participated Did not(n=151) participate
(n=35,166)
Summer Residential Program status

11th
- or
12th
-gra
de
ACT
Engl
ish
scor
eFIGURE 9. Regression of
11th- or 12th-Grade ACT English Score on7th-Grade ACT English Score
7th-grade ACT English score
GROUP H — 1— h Nonparticipants * —• —* SRP participants
11th
- or
12th
-gra
de
ACT
Engl
ish
scor
e
Second-Order Polynomial Model
FIGURE 10. Regression of11th- or 12th-Grade ACT English Score on
7th-Grade ACT English Score
7th-grade ACT English score
GROUP H-1— h Nonparticipants SRP participants
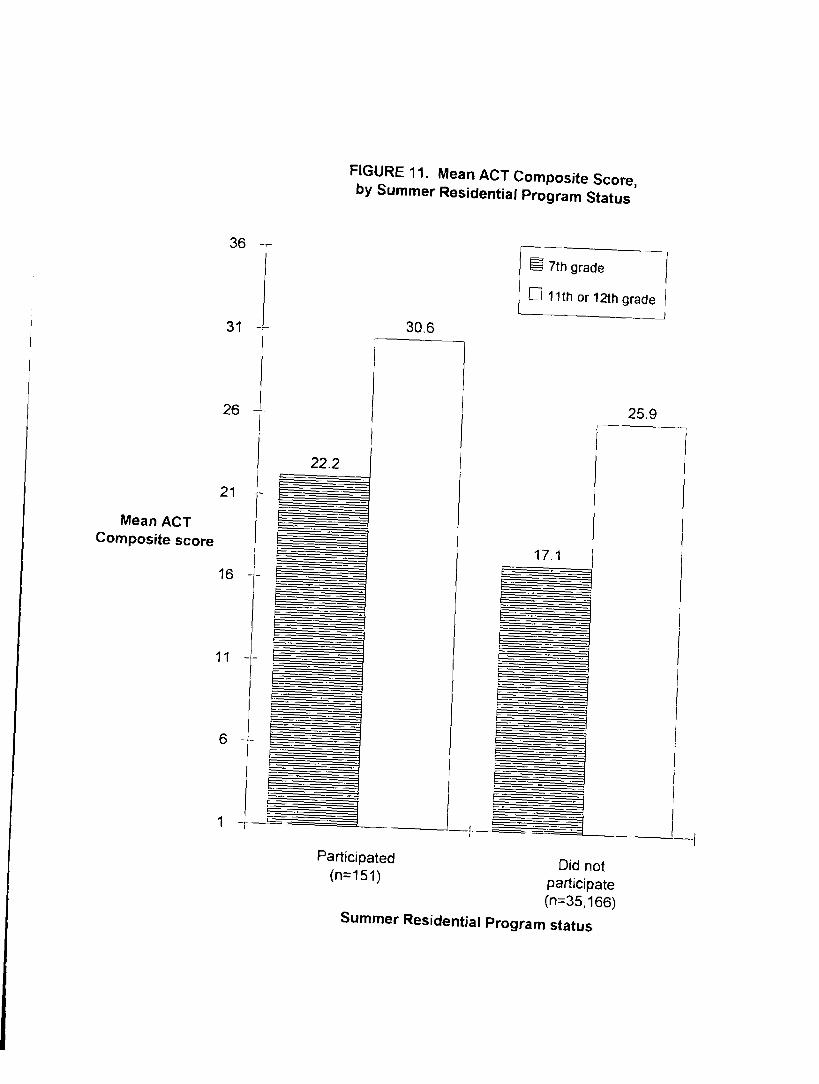
FIGURE 11. Mean ACT Composite Score,by Summer Residential Program Status
36
31
26
21
Mean ACT Composite score
16
11 -
6 -
1 -
T
30.6
22.2
s 7th grade
C 11th or 12th grade
25.9
Participated Did not(n=151) participate
(n=35,166) Summer Residential Program status

11th
- or
12th
-gra
de
ACT
Com
posi
te
scor
e
(95% confidence limits)
FIGURE 12. Regression of11th- or 12th-Grade ACT Composite Score on
7th-Grade ACT Composite Score
7th-grade ACT Composite score
GROUP Nonparticipants * —• — SRP participants
Prob
abili
ty
(68% confidence limits)
FIGURE 13. Estimated Conditional Probabilityof Earning an ACT Composite Score of 27 or Higher,
Given 7th-Grade ACT Composite Score
7th-grade ACT Composite score
Prob
abili
ty
(68% confidence limits)
FIGURE 14. Estimated Conditional Probabilityof Earning an ACT Composite Score of 30 or Higher,
Given 7th-Grade ACT Composite Score
1.0 -
0 .9
0.8
0 .7 -
0.6
0 .5
0 .4
0 .3
0.2
0.1
0.0
SRP participants Nonparticipants Extrapolated using
logistic function Conf. limits for
participants Conf. limits for
nonparticipants
i -10
i12
I14 16
I18
~~r~
20
__r—22 2 4
r2 6
I2 8 30
7th-grade ACT Composite score
n---i---r3 2 34 36

(68% confidence limits)
FIGURE 15. Estimated Conditional Probabilityof Taking Trigonometry, Given 7th-Grade
ACT Mathematics Score
7th-grade ACT Mathematics score

Prob
abili
tyFIGURE 16. Estimated Conditional Probability
of Taking Trigonometry, Given 7th-GradeACT Mathematics Score
7th-grade ACT Mathematics score
Prob
abili
ty
(68% confidence limits)
FIGURE 17. Estimated Conditional Probabilityof Taking Calculus, Given 7th-Grade
ACT Mathematics Score
7th-grade ACT Mathematics score

Prob
abili
tyFIGURE 18. Estimated Conditional Probability
of Taking Calculus, Given 7th-GradeACT Mathematics Score
7th-grade ACT Mathematics score
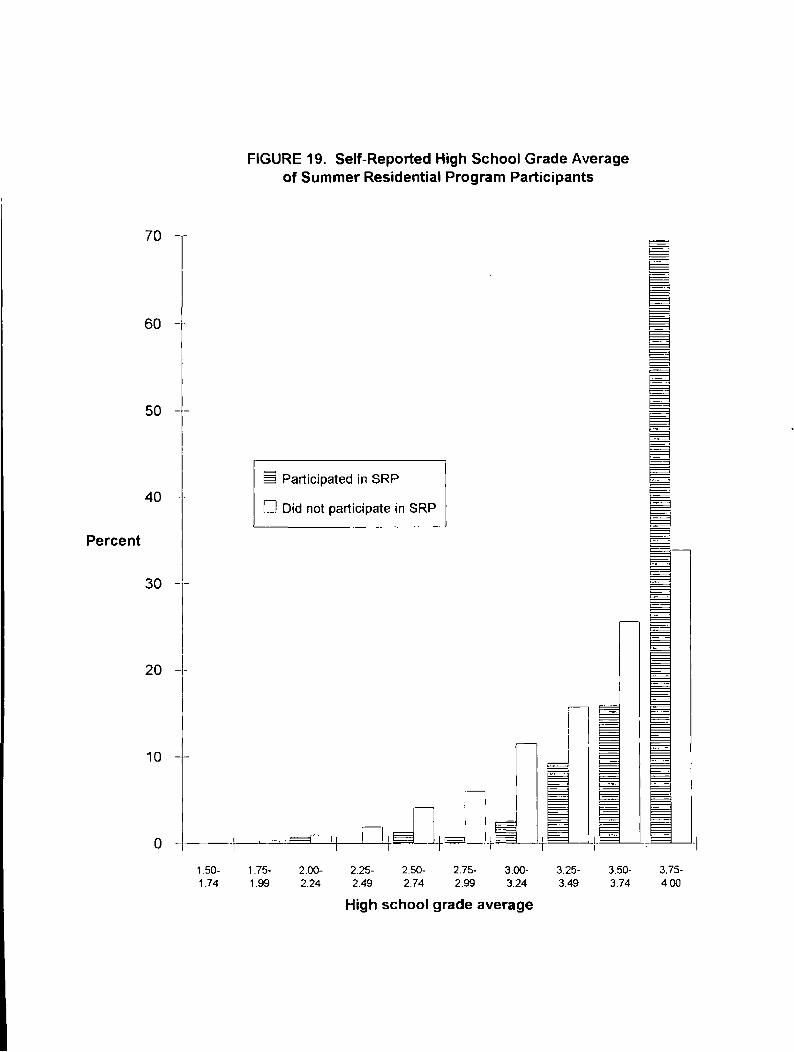
FIGURE 19. Self-Reported High School Grade Averageof Summer Residential Program Participants
Percent
70
60
50 -
40
30 -
20 —
10 —
1 .50 -
1.74 1.99 2.24 2.49 2.74 2.99 3.24 3.49 3.74 4.00
High school grade average

FIGURE 20. Self-Reported Mathematics Grade Averageof Summer Residential Program Participants
80
70 -
60 -
50
Percent 40
M Participated in SRP
D Did not participate in SRP
30 -
20 —
10
1.50-1.74
1.75-1.99
2 .00-
2.242 .25-
2.492.50-2.74
2.75-2.99
3.00-3.24
3.25-3.49
3.50-3.74
3.75-4.00
Mathematics grade average
(68% confidence limits)
FIGURE 21. Estimated Conditional Probabilityof Earning a High School Mathematics Grade Average of A,
Given 7th-Grade ACT Mathematics Score
7th-grade ACT Mathematics score
Prob
abili
ty
(68% confidence limits)
FIGURE 22. Estimated Conditional Probabilityof Earning College Credit While in High School,
Given 7th-Grade ACT Composite Score
7th-grade ACT Composite score

Prob
abili
ty
1.0
0 .9
0.8
0 .7
0.6
0 .5
0 .4
0 .3
0.2
0.1
0.0 “
(68% confidence limits)
FIGURE 23. Estimated Conditional Probabilityof Receiving an Award for Scientific Work,
Given 7th-Grade ACT Composite Score
n ------- 1------1------1 ~ i i i i i i i i i i r t
2 4 6 8 10 12 14 16 18 2 0 22 2 4 2 6 28 3 0 32
7th-grade ACT Composite score
“I T" 34 36
Prob
abili
ty
(68% confidence limits)
FIGURE 24. Estimated Conditional Probabilityof Publishing Creative Writing, Given
7th-Grade ACT English Score
7th-grade ACT English score