Ac matlab programs
26
1. AM MODULATION AND DEMODULATION AIM: To simulate am modulation with different modulation index using MATLAB SOFTWARE EQUIPMENT REQUIRED: 1. MATLAB SOFTWARE 2. PC PROGRAM: fc=50000; fs=1000000; f=1000; m=0.5; a=1/m; opt=-a; t=0:1/fs:((2/f)-(1/fs)); x=cos(2*pi*f*t); y=modulate(x,fc,fs,'amdsb-tc',opt); subplot(221);plot(x);grid;title('modulating signal'); subplot(222);plot(y);grid;title('am signal with m=0.5'); % am with m=0.5 m=1.0;opt=-1/m;y=modulate(x,fc,fs,'amdsb-tc',opt);%am with m=1.0 subplot(223);plot(y);grid;title('am with m=1.0'); m=1.2;opt=-1/m;y=modulate(x,fc,fs,'amdsb-tc',opt);%am with m=1.2 subplot(224);plot(y);grid;title('am with m=1.2'); z=demod(y,fc,fs,'amdsb-tc');figure(2);plot(z); title('demodulated output');grid;
Transcript of Ac matlab programs

1. AM MODULATION AND DEMODULATION
AIM: To simulate am modulation with different modulation index using MATLAB SOFTWARE
EQUIPMENT REQUIRED:1. MATLAB SOFTWARE2. PC
PROGRAM:fc=50000;fs=1000000;f=1000;m=0.5;a=1/m;opt=-a;t=0:1/fs:((2/f)-(1/fs));x=cos(2*pi*f*t);y=modulate(x,fc,fs,'amdsb-tc',opt);subplot(221);plot(x);grid;title('modulating signal');subplot(222);plot(y);grid;title('am signal with m=0.5'); % am with m=0.5m=1.0;opt=-1/m;y=modulate(x,fc,fs,'amdsb-tc',opt);%am with m=1.0subplot(223);plot(y);grid;title('am with m=1.0');m=1.2;opt=-1/m;y=modulate(x,fc,fs,'amdsb-tc',opt);%am with m=1.2subplot(224);plot(y);grid;title('am with m=1.2');z=demod(y,fc,fs,'amdsb-tc');figure(2);plot(z);title('demodulated output');grid;

0 500 1000 1500 2000-1
-0.5
0
0.5
1modulating signal
0 500 1000 1500 2000-4
-2
0
2
4am signal with m=0.5
0 500 1000 1500 2000-2
-1
0
1
2am with m=1.0
0 500 1000 1500 2000-2
-1
0
1
2am with m=1.2
0 200 400 600 800 1000 1200 1400 1600 1800 2000-0.5
0
0.5
1
1.5
2demodulated output

Result : The AM modulation and demodulation is executed using MATLAB software.

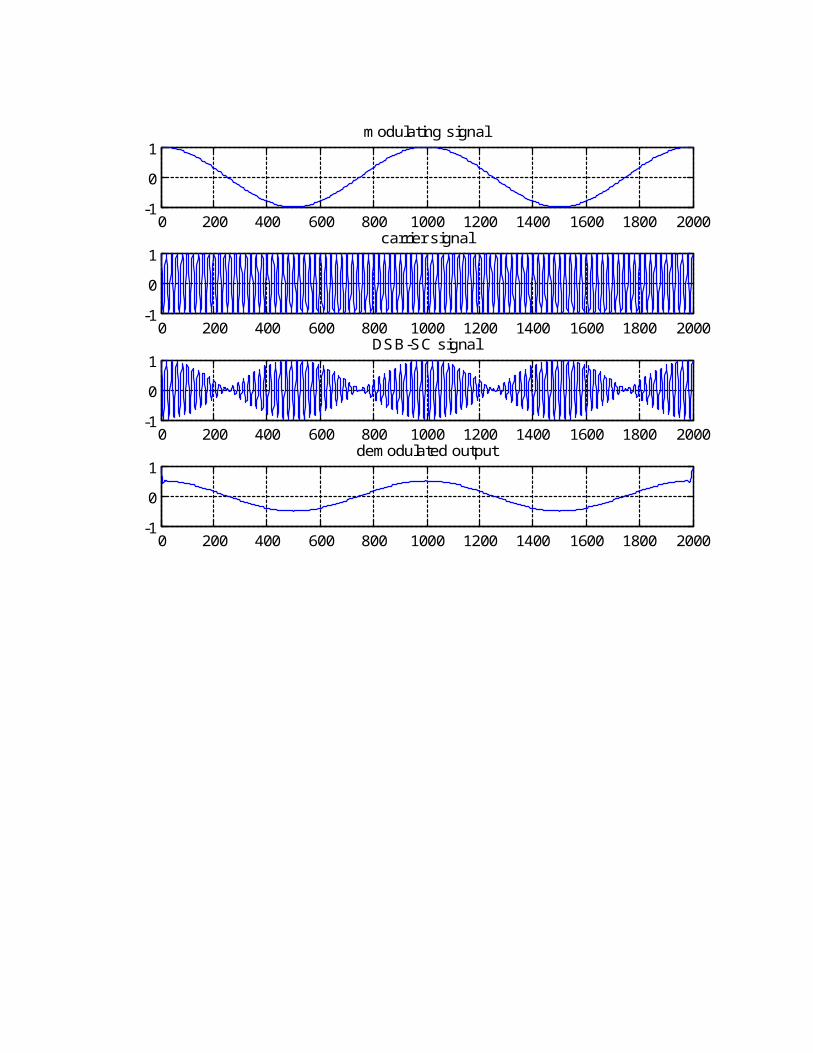
2. DSBSC MODULATION AND DEMODULATION
AIM: To simulate dsbsc modulation and demodulation using MATLAB SOFTWARE.
EQUIPMENT REQUIRED:1. MATLAB SOFTWARE2. PC
PROGRAM:fc=50000;fs=1000000;f=1000;m=0.5;a=1/m;opt=-a;t=0:1/fs:((2/f)-(1/fs));x=cos(2*pi*f*t);s=cos(2*pi*fc*t);%carrier signaly=modulate(x,fc,fs,'amdsb-sc',opt);subplot(411);plot(x);grid;title('modulating signal');subplot(412);plot(s);grid;title('carrier signal');subplot(413);plot(y);grid;title('DSB-SC signal'); z=demod(y,fc,fs,'amdsb-sc');subplot(414);plot(z);title('demodulated output');grid;

Result : The DSB-SC modulation and demodulation is executed using MATLAB software.

0 200 400 600 800 1000 1200 1400 1600 1800 2000-1
0
1modulating signal
0 200 400 600 800 1000 1200 1400 1600 1800 2000-1
0
1carrier signal
0 200 400 600 800 1000 1200 1400 1600 1800 2000-1
0
1DSB-SC signal
0 200 400 600 800 1000 1200 1400 1600 1800 2000-1
0
1demodulated output
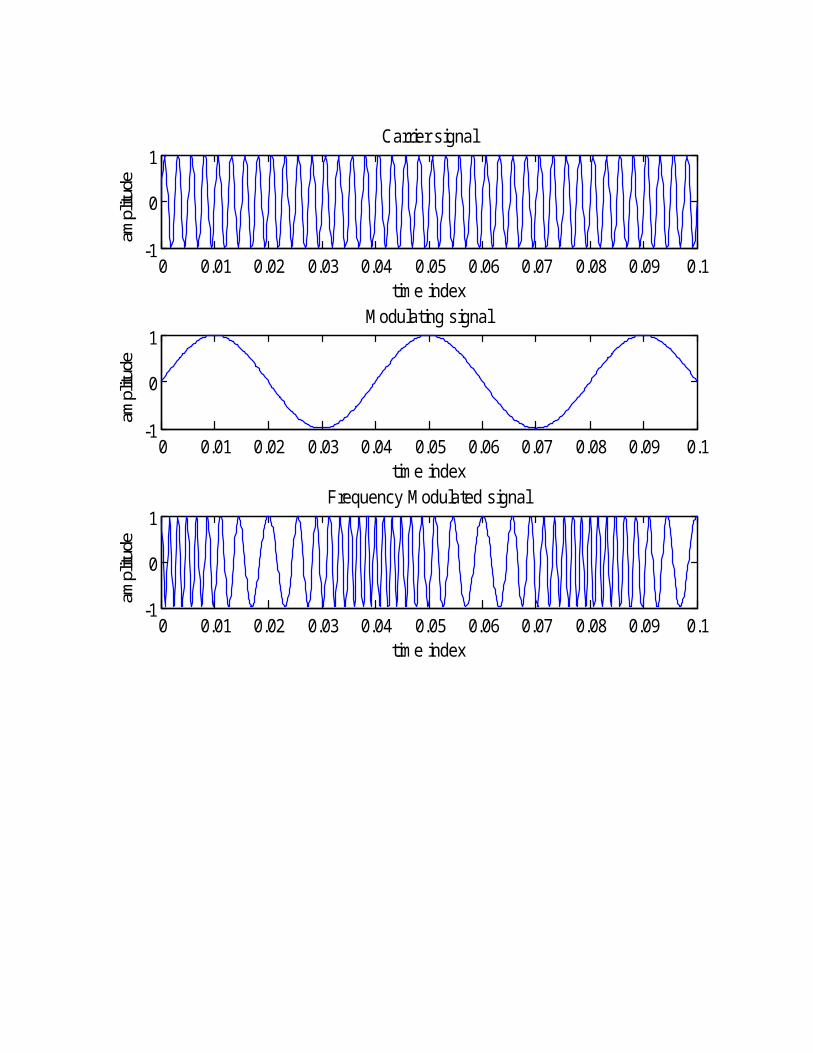
3. FM MODULATION AND DEMODULATION
AIM: To simulate FM modulation and demodulation using MATLAB SOFTWARE.
EQUIPMENT REQUIRED:1. MATLAB SOFTWARE2. PC
PROGRAM:%FM generationclose all;fc=input('Enter the carrier signal freq in hz,fc=');fm=input('Enter the modulating signal freq in hz,fm =');m=input('Modulation index,m= ');t=0:0.0001:0.1;c=sin(2*pi*fc*t);%carrier signalM=sin(2*pi*fm*t);% modulating signalsubplot(3,1,1);plot(t,c);ylabel('amplitude');xlabel('time index');title('Carrier signal');subplot(3,1,2);plot(t,M);ylabel('amplitude');xlabel('time index');title('Modulating signal');y=cos(2*pi*fc*t+(m.*sin(2*pi*fm*t)));subplot(3,1,3);plot(t,y);ylabel('amplitude');xlabel('time index');title('Frequency Modulated signal');

Result : The FM modulation and demodulation is executed using MATLAB software.
0 0.01 0.02 0.03 0.04 0.05 0.06 0.07 0.08 0.09 0.1-1
0
1
ampl
itude
time index
Carrier signal
0 0.01 0.02 0.03 0.04 0.05 0.06 0.07 0.08 0.09 0.1-1
0
1
ampl
itude
time index
Modulating signal
0 0.01 0.02 0.03 0.04 0.05 0.06 0.07 0.08 0.09 0.1-1
0
1
ampl
itude
time index
Frequency Modulated signal
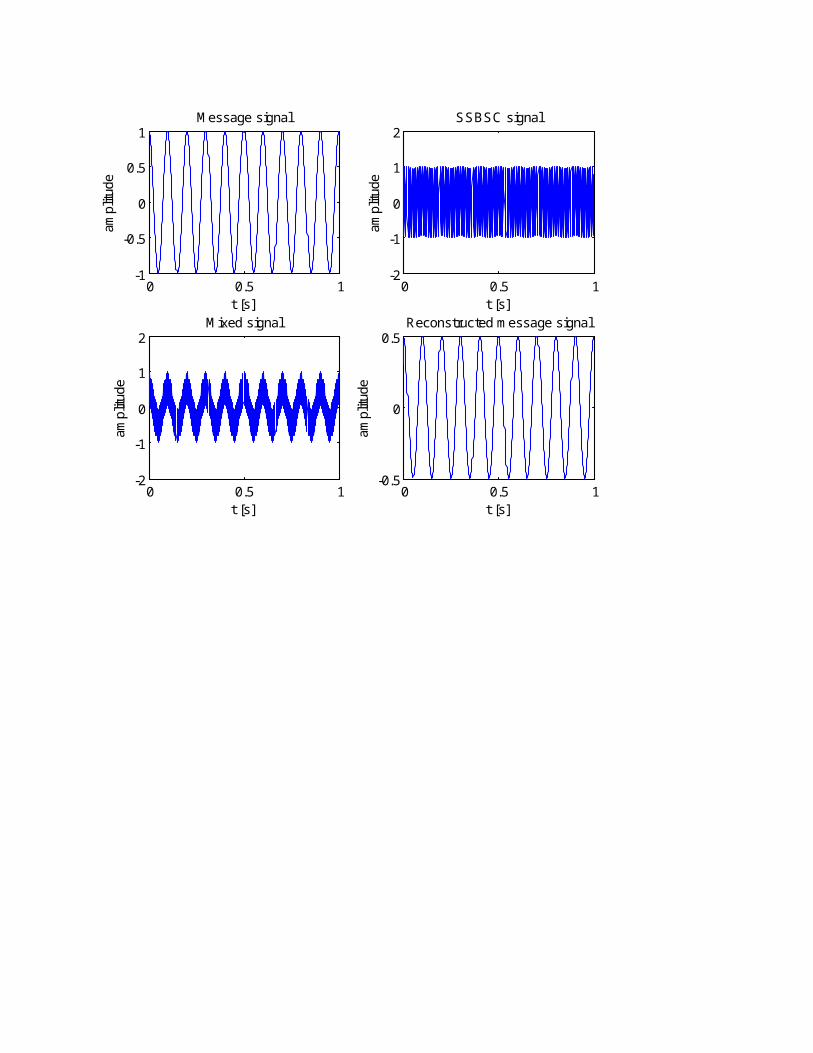
4. SSB MODULATION AND DEMODULATION
AIM: To simulate SSB modulation and demodulation using MATLAB SOFTWARE.
EQUIPMENT REQUIRED:1. MATLAB SOFTWARE2. PC
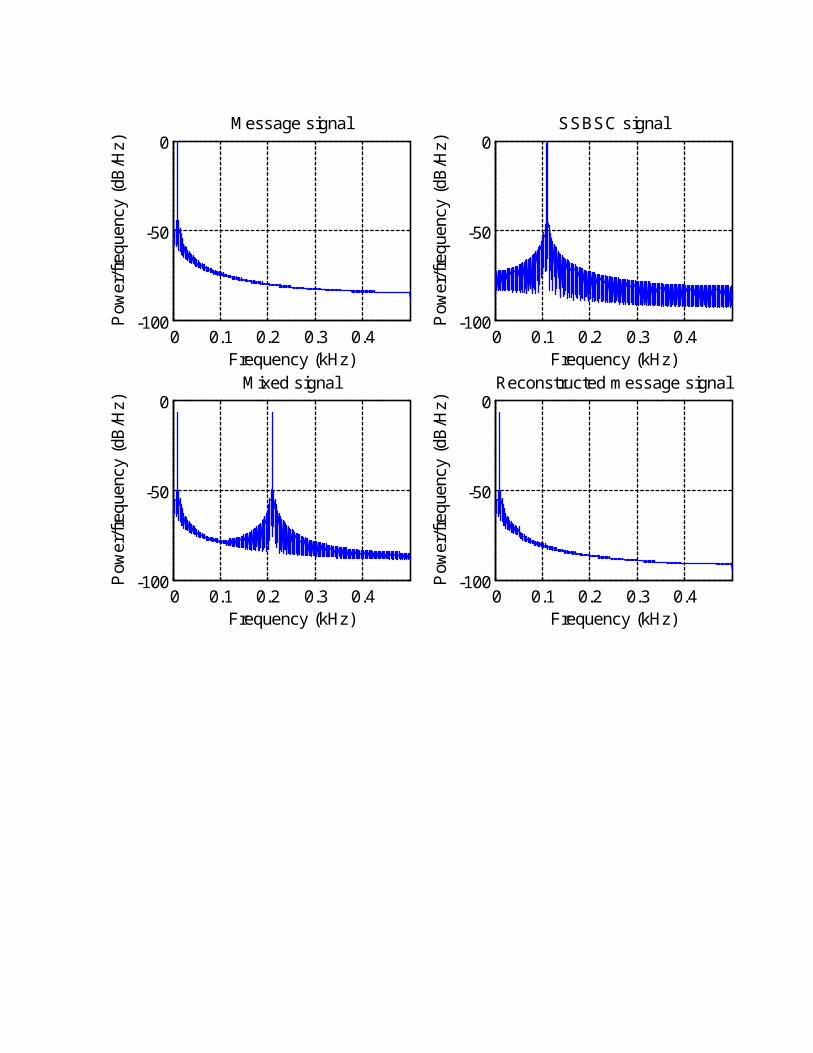
PROGRAM:plot_frequency = 1000;t = 0:1/plot_frequency:10;% Choose a maximum frequency for our signal in Hertzf_max = 10;% Use a sinusoidal signalA = 1;phi = 0;v = cos(2*pi*f_max*t);% Choose a modulation sensitivityk_am = 1;% Choose a carrier frequency in Hertzf_c = 100;% Perform SSBSC modulationu = k_am*v.*cos(2*pi*f_c*t) - k_am*imag(hilbert(v)).*sin(2*pi*f_c*t);% Choose a noise powerN_0 = 0;% Add some noise to our signalu_received = u + sqrt(N_0)*randn(size(u));% Perform coherent demodulationu_mixed = u_received.*cos(2*pi*f_c*t);% Choose a cutoff frequency in Hertzf_cutoff = f_c/2;% Low pass filter the signalv_reconstructed = func_low_pass_filter(t, u_mixed, f_cutoff);% Plot the resultsfigure(1)subplot(2,2,1,'box','on');holdonplot(t(1:1000),v(1:1000));xlabel('t [s]');ylabel('amplitude');title('Message signal');subplot(2,2,2,'box','on','YLim',[-ceil(max(abs(u(1:1000)))),ceil(max(abs(u(1:1000))))]);holdonplot(t(1:1000),u(1:1000));xlabel('t [s]');ylabel('amplitude');title('SSBSC signal');subplot(2,2,3,'box','on','YLim',[-ceil(max(abs(u(1:1000)))),ceil(max(abs(u(1:1000))))]);holdonplot(t(1:1000),u_mixed(1:1000));xlabel('t [s]');ylabel('amplitude');title('Mixed signal');subplot(2,2,4,'box','on');holdonplot(t(1:1000),v_reconstructed(1:1000));

xlabel('t [s]');ylabel('amplitude');title('Reconstructed message signal');figure(2)subplot(2,2,1,'box','on');pwelch(v,[],[],[],plot_frequency);title('Message signal');subplot(2,2,2,'box','on');pwelch(u,[],[],[],plot_frequency);title('SSBSC signal');subplot(2,2,3,'box','on');pwelch(u_mixed,[],[],[],plot_frequency);title('Mixed signal');subplot(2,2,4,'box','on');pwelch(v_reconstructed,[],[],[],plot_frequency);title('Reconstructed message signal');figure(1)

Result : The SSB-SC modulation and demodulation is executed using MATLAB software.
0 0.5 1-1
-0.5
0
0.5
1
t [s]
ampl
itude
Message signal
0 0.5 1-2
-1
0
1
2
t [s]am
plitu
de
SSBSC signal
0 0.5 1-2
-1
0
1
2
t [s]
ampl
itude
Mixed signal
0 0.5 1-0.5
0
0.5
t [s]
ampl
itude
Reconstructed message signal

0 0.1 0.2 0.3 0.4-100
-50
0
Frequency (kHz)
Pow
er/f
requ
ency
(dB
/Hz)
Message signal
0 0.1 0.2 0.3 0.4-100
-50
0
Frequency (kHz)
Pow
er/f
requ
ency
(dB
/Hz)
SSBSC signal
0 0.1 0.2 0.3 0.4-100
-50
0
Frequency (kHz)
Pow
er/f
requ
ency
(dB
/Hz)
Mixed signal
0 0.1 0.2 0.3 0.4-100
-50
0
Frequency (kHz)
Pow
er/f
requ
ency
(dB
/Hz)
Reconstructed message signal
5. PWM MODULATION AND DEMODULATION
AIM: To simulate PWM modulation and Demodulation using MATLAB SOFTWARE.
EQUIPMENT REQUIRED:1. MATLAB SOFTWARE2. PC
PROGRAM:%PWM wave generationt=0:0.001:1;s=sawtooth(2*pi*10*t+pi);m=0.75*sin(2*pi*1*t);n=length(s);for i=1:nif (m(i)>=s(i))pwm(i)=1;elseif (m(i)<=s(i))pwm(i)=0;endendplot(t,pwm,'-r',t,m,'--k',t,s,'--b');grid;title('PWM wave');axis([0 1 -1.5 1.5]);
Result : The PWM modulation and demodulation is executed using MATLAB software.

0 0.1 0.2 0.3 0.4 0.5 0.6 0.7 0.8 0.9 1-1.5
-1
-0.5
0
0.5
1
1.5PWM wave

6. ANALOG SIGNAL SAMPLING AND RECONSTRUCTION
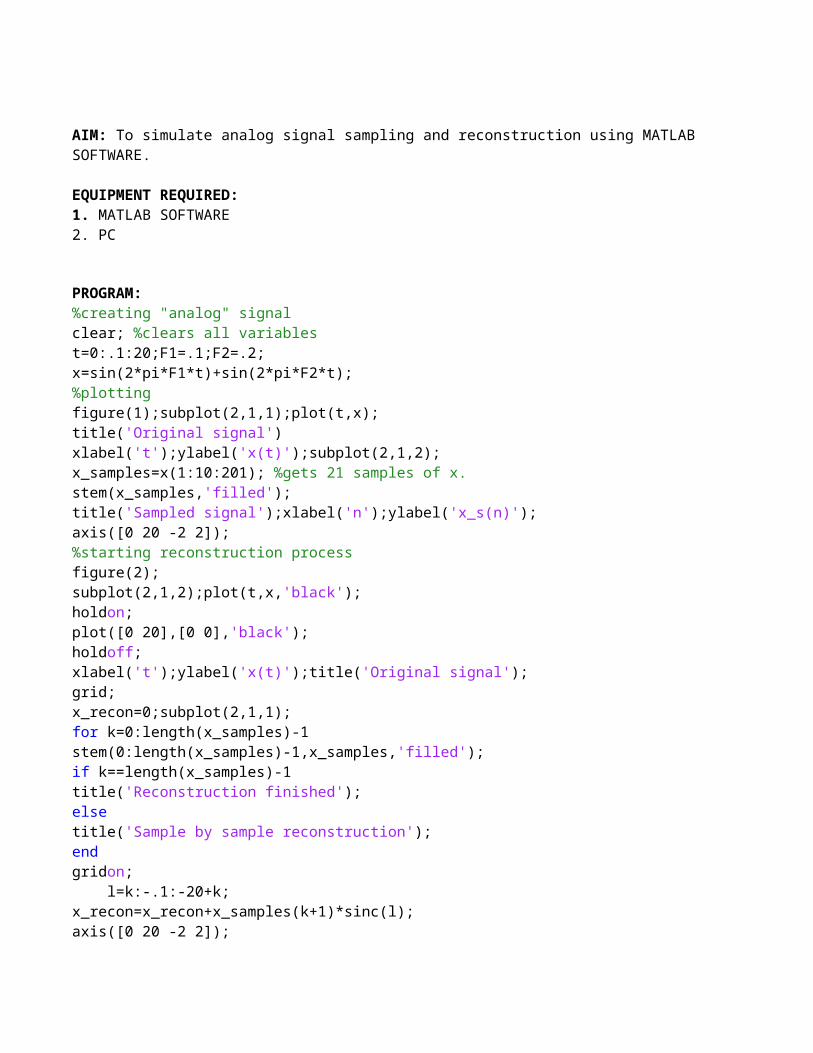
AIM: To simulate analog signal sampling and reconstruction using MATLAB SOFTWARE.
EQUIPMENT REQUIRED:1. MATLAB SOFTWARE2. PC
PROGRAM:%creating "analog" signalclear; %clears all variablest=0:.1:20;F1=.1;F2=.2;x=sin(2*pi*F1*t)+sin(2*pi*F2*t);%plottingfigure(1);subplot(2,1,1);plot(t,x);title('Original signal')xlabel('t');ylabel('x(t)');subplot(2,1,2);x_samples=x(1:10:201); %gets 21 samples of x.stem(x_samples,'filled');title('Sampled signal');xlabel('n');ylabel('x_s(n)');axis([0 20 -2 2]);%starting reconstruction processfigure(2);subplot(2,1,2);plot(t,x,'black');holdon;plot([0 20],[0 0],'black');holdoff;xlabel('t');ylabel('x(t)');title('Original signal');grid;x_recon=0;subplot(2,1,1);for k=0:length(x_samples)-1stem(0:length(x_samples)-1,x_samples,'filled');if k==length(x_samples)-1title('Reconstruction finished'); elsetitle('Sample by sample reconstruction'); endgridon; l=k:-.1:-20+k;x_recon=x_recon+x_samples(k+1)*sinc(l);axis([0 20 -2 2]);hold;plot(t,x_samples(k+1)*sinc(l),'r')plot(t,x_recon);holdoff;waitforbuttonpress; end

Result : The Analog signal sampling and reconstruction is executed using MATLAB software.

0 2 4 6 8 10 12 14 16 18 20-2
-1
0
1
2Original signal
t
x(t)
0 2 4 6 8 10 12 14 16 18 20-2
-1
0
1
2Sample by sample reconstruction
0 2 4 6 8 10 12 14 16 18 20-2
-1
0
1
2
t
x(t)
Original signal
0 2 4 6 8 10 12 14 16 18 20-2
-1
0
1
2Reconstruction finished
7. PPM MODULATION AND DEMODULATION
AIM: To simulate PPM modulation and demodulation using MATLAB SOFTWARE.
EQUIPMENT REQUIRED:1. MATLAB SOFTWARE2. PC
PROGRAM:fc=50;fs=1000;f1=200;f2=300;t=0:1/fs:((2/f1)-(1/fs));x1=0.4*cos(2*pi*f1*t)+0.5;subplot(311);plot(x1);title('message signal');GRID;subplot(312);y=modulate(x1,fc,fs,'ppm');plot(y);title('PPM MODULATION');GRID;z=demod(y,fc,fs,'ppm');subplot(313);plot(z);title('demodulated o/p');grid;
Result : The Pulse Position modulation and demodulation is executed using MATLAB software.

1 2 3 4 5 6 7 8 9 100
0.5
1message signal
0 20 40 60 80 100 120 140 160 180 2000
0.5
1PPM MODULATION
1 2 3 4 5 6 7 8 9 100
0.5
1demodulated o/p