Abu Dhabi Travel Patterns Highlights of the 2009 Survey
35
Abu Dhabi Travel Patterns Highlights of the 2009 Survey Results
Transcript of Abu Dhabi Travel Patterns Highlights of the 2009 Survey

Abu Dhabi Travel PatternsHighlights of the 2009 Survey Results

Department of TransportP.O.Box 20, Abu Dhabi, UAE, Tel: +971 2 656 6666, Fax: +971 2 635 [email protected] www.dot.abudhabi.aeReleased 2012

This booklet provides a synthesis of information on how people travel in Abu Dhabi Emirate. The data and results are sourced from travel pattern surveys that were carried out primarily in May 2009. Some key findings and statistics from the 2009 travel pattern surveys are presented here to show the travel behaviour in Abu Dhabi Emirate.
The travel pattern survey was part of a larger project to develop a new transportation model for Abu Dhabi Emirate, the Strategic Transportation Evaluation and Assessment Model (STEAM).
It is anticipated that Abu Dhabi will undergo significant changes between now and 2030, the planning horizon year. STEAM is used as a planning tool to evaluate options and provide guidance on how to provide the best transportation networks to accommodate forecast increases in population, employment, demographic shifts, and ongoing changes in how people travel to, from and within the Emirate.
It was necessary, as part of development of STEAM, to conduct travel pattern surveys to provide a comprehensive baseline of current travel behaviour.
The surveys that were undertaken included:- Household Residents Travel Diaries- Workplace Travel Surveys- Labour Camp Residents Travel Diaries- Shopping Mall Visitors Travel Surveys- Air Passenger and Accompanying Non Passenger
Travel Surveys- Hotel Visitors Travel Surveys- Hotel Guests Travel Diaries- Roadside Interview Travel Surveys- Traffic Counts- Local Bus Passengers Travel Surveys- Inter-Urban Bus Passengers Travel Surveys
This booklet provides highlights of the survey results.
Overview

Contents
Travel Patterns Key Findings 1
Emirate of Abu Dhabi Locations Map 2
Daily Weekday Person Trips Within Abu Dhabi Emirate 3
Daily Person Trips by Trip Purpose 4
Daily Person Trips by Travel Model 5
Weekday Person Trips by Travel Mode and Travel Purpose 6
Weekday Person Trips by Gender and Travel Mode 7
Weekday Person Trips by Gender and Trip Purpose 8
Average Weekday Trips Per Person by Age and Gender 9
Daily Number of Weekday Trips per Person by Mode and Hour of Departure 10
Daily Number of Weekday Trips per Person by Purposeand Hour of Departure 11
Mean Daily Time Spent Travelling by Age and Gender 12
Car Trip Journey Time Distribution 13
Average Car Travel Speeds by Region 14
Car Availability by Household Size 15
Urban Cordons Location Map 16
Daily Traffic Profile of Vehicles Crossing Urban Cordons 17
Inter-Regional Cordons Location Map 18
Daily Traffic Profile of Vehicles Crossing Inter-Regional Cordons 19
Walk Trip Length Distribution by Gender 20
Freight Carried by Heavy Goods Vehicles 21
Number of Goods Vehicles Crossing Key Cordons 22
Modes of Travel to Airport by Departing Air Passangers 23
Hotel Arrivals by Category of User 24
Hotel Guests Travel Modes in Abu Dhabi 25
Arrival Travel Mode by Time of Day to Shopping Malls 26
Car Driving Licence Ownership by Age and Gender 27
The Trip Purposes of Local Bus Users 28
Summary 29

Symbols Legend
Car
Taxi
Bus
LGV
HGV
Motorcycle
Bicycle
Walking (Male & Female)
Male
Female
TAXI


11
The travel pattern surveys were undertaken in May 2009. The study area included surveys across the Emirate of Abu Dhabi including the greater Abu Dhabi metropolitan area, Al Ain and Al Gharbia.
Some key findings about how people travel in the Emirate of Abu Dhabi that were found through undertaking these travel pattern surveys are: - Across Abu Dhabi Emirate residents make 2.8 trips
per weekday on average, where a trip refers to a single direction trip, e.g. the trip from home to work. Travel from home to work, then to a shopping mall and home again is defined as 3 trips,
- The majority of trips are below 10km in length (60%), whereas the overall average trip length is 12.4km,
- The average length of time that a person spends travelling is approximately 50 minutes per day,
- Personal vehicles are the preferred mode of travel, accounting for more than half of all trips,
- Car ownership data indicates that 12% of single person households, 69% of two person households, and 87% of three plus households in Abu Dhabi Emirate have access to a car,
- Across all car trips, the average time to find a parking space ranges from 10.6 minutes in Abu Dhabi Central Business District to 2.2 minutes in Al Ain,
- There are very few trips made by bicycle (0.2%) or motorcycle (0.1%),
- 39% of all trips are to usual place of work with a further 21% associated with education
Travel Patterns Key Findings

2
Emirate of Abu Dhabi Locations Map
Madinat Zayed
Al Mirfa
Liwa
UNITED ARAB EMIRATES
Rest of Emirate
OMAN
Sir Bani Yas Island
Dubai
Bab
Mirfa
Rumaitha
Shanay
Rumaitha South Arjan
Sahil
Asab
SalabikhRuwais Deep
Bu Hasa
Huwaila
Uwaisa
Bida Al Qemzen
Liwa
Outer Abu Dhabi
Al Ain
Abu Dhabi
Madinat Zayed
Al Mirfa
Liwa
UNITED ARAB EMIRATES
Rest of Emirate
OMAN
Sir Bani Yas Island
Dubai
Bab
Mirfa
Rumaitha
Shanay
Rumaitha South Arjan
Sahil
Asab
SalabikhRuwais Deep
Bu Hasa
Huwaila
Uwaisa
Bida Al Qemzen
Liwa
Outer Abu Dhabi
Al Ain
Abu Dhabi
Emirate of Abu Dhabi Map
Map is not to scale

Note: locations in the table correlate to the locations in the map on page 2.Source: 2009 Abu Dhabi Emirate Household Interview Survey
Outer Abu Dhabi to/from
Location LocationAll Trips
Abu Dhabi to/from Rest of Emirate
Rest of Emirate to/from
Dai
ly T
rips
Outer Abu Dhabi to/from
Abu Dhabi to/from
Al Ain
Rest of Emirate
Abu Dhabi to/from
Al Ain
Al Ain
52,500
64,300
116,800
192,700
198,600
364,600 Outer Abu Dhabi
3
Daily Weekday Person Trips Within Abu Dhabi Emirate
The table to the right shows the number of daily trips made by household residents between different locations of Abu Dhabi metropolitan area, Al Ain and the rest of the Emirate. It shows the location-to-location trips but does not include trips made within the geographic locations. The highest number of trips are between Abu Dhabi and Outer Abu Dhabi.
Abu Dhabi
Outer Abu Dhabi
Rest of Emirate
Al Ain
Note: A Person Trip refers to a single direction trip for one person

Source: 2009 Abu Dhabi Emirate Household Interview Survey
4
Daily Person Trips by Trip Purpose
Usual Workplace
Education
Shopping
Leisure/Recreation
Other Work Related
Personal Business
Other
There are more than 4 million trips made on a daily basis within Abu Dhabi Emirate by Emirate residents. The highest number of trips are to and from the Usual Workplace with Education having the second highest number of trips. The remainder of the trips are split in reducing numbers into the remaining categories; Shopping, Leisure/Recreation, Other Work Related and Personal Business, and Other.
To Usual workplace
Other Work Related
Leisure/ Recreation
Shopping
Personal Business
Education
Other
1,638,000
378,000
882,000
630,000
420,000
126,000
126,000
Car
Walk
Bicycle
School Bus
Company Bus
Public Bus
Taxi
Motorcycle
Other
5
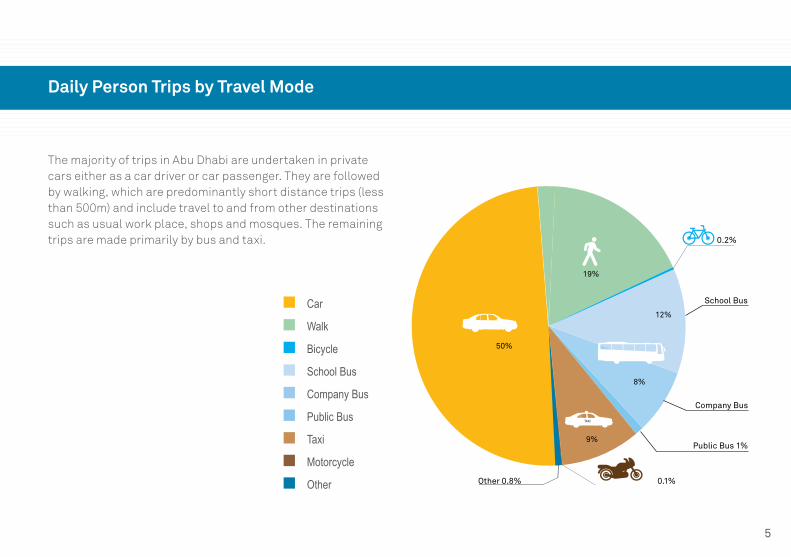
Daily Person Trips by Travel Mode
The majority of trips in Abu Dhabi are undertaken in private cars either as a car driver or car passenger. They are followed by walking, which are predominantly short distance trips (less than 500m) and include travel to and from other destinations such as usual work place, shops and mosques. The remaining trips are made primarily by bus and taxi.
12%
8%
9%
19%
0.2%
School Bus
Company Bus
Public Bus 1%
Other 0.8%
50%
0.1%

Source: 2009 Abu Dhabi Emirate Household Interview Survey
Car
Taxi
Bus
Bicycle
Walk
Other
6
Table 5 Mode Share of Weekday Trips by Purpose
0% 10% 20% 30% 40% 50% 60% 70% 80% 90% 100%
Usual Workplace
Other Work Related
Leisure/ Recreation
Shopping
Personal Business
Education
Other
Car
Walk
Bicycle
Bus
Taxi
Motorcycle
Other
Weekday Person Trips by Travel Mode and Trip Purpose
For all trip purposes except education, car is the most frequently used mode. For Usual Workplace and Education trip purposes, company bus and school bus have a high proportion of mode share (20% and 50% respectively) signifying their importance. For shopping trips, just under half are made by car with 23% by taxi and 26% walk.

7
Weekday Person Trips by Gender and Travel Mode
Nearly 50% of men and 56% of women use a car as their main mode of travel. As a percentage of trips, men (22%) walk nearly three times as much as women (8%). The reverse is true for school bus as a travel mode with 8% and 24% use respectively for men and women.
8%
24%
3%
56%
8%
Other 0.7%
School Bus
Company Bus
Public Bus 1%
49%
22%
8%
9%
8%
0.1%
Other 0.8%
0.3%
School Bus
Company Bus
Public Bus 1%
TAXI
24%

Note: The other trip purpose category includes all purposes that cannot be classified into the categories listed, such as walk trips to mosques.
8
Weekday Person Trips by Gender and Trip Purpose
47%37%
19%
17%
14%
9%1%
3%
9%
16%
14%
8%
2%
4%
Men make more work related trips than any other trip purpose. The highest percentage of trips by purpose for women are education trips. Shopping trips are a major trip purpose for both genders and comprises 14-19% of all trips.
Usual Workplace
Other Work Related
Leisure/Recreation
Shopping
Personal Business
Education
Other

9
Average Weekday Trips Per Person by Age and Gender
The 2009 survey data indicates that men and women travel approximately the same amount when they are 18 years old and under. However, for men, the number of trips increases with age, while decreasing for women. Men between the ages of 26 and 65 travel the most due
to the predominant number of work trips. Whereas for women, the 18 and under age group makes the highest number of trips due to dominance of education as a trip purpose.
18 or under
19-25
26-45
46-65
65+
18 or under
19-25
26-45
46-65
65+
0.5 1.0 1.5 2.0 2.5 3.0 3.5
Daily Trips

Other
Walk
Bus
Taxi
Motorcycle
Car
10
There are three travel peaks each day. The most pronounced peak occurs in the hours starting 6:00 - 8:00 in the morning. The other peaks occur in the afternoon and evening. The afternoon peak occurs in the hours of 13:00 - 14:00 and the evening peak 19:00 - 20:00.
Daily Number of Weekday Trips per Person by Mode and Hour of DepartureN
umbe
r of t
rips
Hour Starting
0
100,000
200,000
300,000
400,000
500,000
600,000
0:00
1:00
2:00
3:00
4:00
5:00
6:00
7:00
8:00
9:00
10:0
0
11:0
0
12:0
0
13:0
0
14:0
0
15:0
0
16:0
0
17:0
0
18:0
0
19:0
0
20:0
0
21:0
0
22:0
0
23:0
0
Car
Walk Bicycle
Bus Taxi Motorcycle
Other
Hour Starting
Num
ber o
f Trip
s
Source: 2009 Abu Dhabi Emirate Household Interview Survey
Note: graph includes some under reporting of mid morning trips due in part to school exams & H1N1 pandemic

11
Daily Number of Weekday Trips per Person by Purpose and Hour of Departure
The survey results confirm that the morning and afternoon peaks are primarily work and education related trips, whereas the evening peak has a higher proportion of shopping and leisure trips.
Other
Education
Personal Business
Shopping
Leisure/Recreation
Other Work Related
Usual Workplace
Trips Purpose
0
100,000
200,000
300,000
400,000
500,000
600,000
0:00
1:00
2:00
3:00
4:00
5:00
6:00
7:00
8:00
9:00
10:0
0
11:0
0
12:0
0
13:0
0
14:0
0
15:0
0
16:0
0
17:0
0
18:0
0
19:0
0
20:0
0
21:0
0
22:0
0
23:0
0
Num
ber o
f trip
s
Hour Starting
Usual Workplace
Education
Shopping
Leisure/Recreation
Other Work Related
Personal Business
Other
Hour Starting
Num
ber o
f Trip
s
Source: 2009 Abu Dhabi Emirate Household Interview Survey
Note: graph includes some under reporting of mid morning trips due in part to school exams & H1N1 pandemic

Note: The daily time spent travelling comprises all trips made during a day.
12
Mean Daily Time Spent Travelling by Age and Gender
Men between the ages of 46 to 65 years spend on average almost 90 minutes travelling each day.
Women under the age of 18 years spend on average 75 minutes each day travelling. The same age group among men spends a similar amount of time travelling.
18 or under
19-25
26-45
46-65
65+
18 or under
19-25
26-45
46-65
65+
30 4010 20 50
Minutes
60 70 80 90 100
Average Daily Travel Time - Minutes

Jour
ney
time
(min
s)
Daily Number of trips
0-5
5-10
10-15
15-20
20-25
25-30
30-35
35-40
40-45
45-50
50-55
55-60
60-65
65-70
70-75
75-80
80-85
85-90
0 50,000 100,000 150,000 200,000 250,000 300,000
The vast majority of car trips are from 0-30 minutes in length, with more trips taking 10-15 minutes than any other trip duration.
These trip journey times are for single one-way trips. The mean daily time spent travelling is higher as it comprises all trips made during a day.
13
Car Trip Journey Time Distribution
Jour
ney
Tim
e (m
ins)
Daily Number of Trips

Aver
age
Spe
ed (k
ph)
Time of Day
14
Average Car Travel Speeds by Region
The average car travel speed in Central Abu Dhabi is low throughout the day at around 20kph. Al Ain has higher average speeds at around 28kph throughout the day. The highest average speeds are in Outer Abu Dhabi of up to 35kph.
0
5
10
15
20
25
30
35
40
07:00 - 12:00 12:00 - 18:00 18:00 - 23:00 23:00 - 07:00
Outer Abu Dhabi
Al Ain
Central Abu Dhabi

10%0% 20% 30% 40% 50% 60% 70% 80% 90% 100%
Hou
seho
ld S
ize
Share of households 0% 10% 20% 30% 40% 50% 60% 70% 80% 90% 100%
1 Person
2 People
3-4 People
5-6 People
7-8 People
9+People
Car availability 1
Car availability 2
Car availability 3
Car availability 4
Car availability 5+
Car availability 0
Share of Households Car Availiability
Hou
seho
ld S
ize
15
Car Availability by Household Size
The table below shows household size and percentage car availability. The data indicates that 12% of single person households, 69% of two person households, and 87% of households with three or more persons in Abu Dhabi Emirate have access to a car.
Car availability 0
Car availability 1
Car availability 2
Car availability 3
Car availability 4
Car availability 5+

16
Urban Cordons Location Map
Madinat Zayed
Al Mirfa
Liwa
UNITED ARAB EMIRATES
OMAN
Sir Bani Yas Island
Dubai
Bab
Mirfa
Rumaitha
Shanay
Rumaitha South Arjan
Sahil
Asab
SalabikhRuwais Deep
Bu Hasa
Huwaila
Uwaisa
Bida Al Qemzen
Liwa
Madinat Zayed
Al Mirfa
Liwa
UNITED ARAB EMIRATES
OMAN
Sir Bani Yas Island
Dubai
Bab
Mirfa
Rumaitha
Shanay
Rumaitha South Arjan
Sahil
Asab
SalabikhRuwais Deep
Bu Hasa
Huwaila
Uwaisa
Bida Al Qemzen
Liwa
Abu Dhabi Cordons Locations
Al Ain Cordon Location
Abu Dhabi City
Mussafah Industrial Area
Mohammed Bin Zayed City
Madinat Khalifa AAl Ain
Central Abu Dhabi Cordon
Mid Abu Dhabi Cordon
Outer Abu Dhabi Cordon
Mussafah Cordon
Map is not to scale

5000
0
10000
15000
20000
25000
30000
35000
22:0021:0020:0019:0018:0017:0016:0015:0014:0013:0012:0011:0010:009:008:007:006:00
Time of Day
Num
ber o
f Trip
s
17
Daily Traffic Profile of Vehicles Crossing Urban Cordons
The highest number of trips are on the Central and Mid Abu Dhabi cordons, with more vehicles crossing the Mid Abu Dhabi cordon in the morning peak and approximately equal vehicles crossing the Mid and Central Abu Dhabi cordons in the afternoon and evening hours.
Mid Abu Dhabi Cordon
Central Abu Dhabi Cordon
Outer Abu Dhabi Cordon
Mussafah Cordon
Al Ain Cordon

18
Liwa
OMAN
Inter-Regional Cordons Location Map
Highway E11 - Abu Dhabi to Dubai
Highway E22 - Abu Dhabi to Al Ain
Highway E11 - Abu Dhabi to Western Region
Highway E66 - Al Ain to Dubai
Abu Dhabi
Dubai
Map is not to scale

0
1000
2000
3000
4000
5000
6000
7000
8000
22:0021:0020:0019:0018:0017:0016:0015:0014:0013:0012:0011:0010:009:008:007:006:00
Time of Day
Num
ber o
f Trip
s
19
Daily Traffic Profile of Vehicles Crossing Inter-Regional Cordons
The highest number of regional trips occur between Abu Dhabi-Dubai. A similar number of trips occur between Al Ain-Abu Dhabi and between Al Ain-Dubai. Fewer trips occur between Abu Dhabi-Western Region.
Highway E11 Abu Dhabi to Dubai
Highway E22 Abu Dhabi to Al Ain
Highway E66 Al Ain to Dubai
Highway E11 Abu Dhabi to Western Region

10%
12%
0%
0 1000 2000 3000 4000 5000
2%
4%
6%
8%
Trip Length (m)
Wal
k Tr
ip F
requ
ency
Most walking trips are less than 1000m in length, with a higher percentage of walk trips less than 1000m for women than for men. For women 69% of walking trips are less than 1km, whereas for men 54% are less than 1km.
20
Walk Trip Length Distribution by Gender

21
Freight Carried by Heavy Goods Vehicles
The largest commodity group carried by heavy goods vehicles as freight is construction materials which accounts for 33% of loads. The second largest commodity group, Other Goods, includes manufactured goods, machinery, domestic and industrial waste, general foodstuffs (shop deliveries), and non-food goods for delivery. The Bulk Non-Oil category includes fertilizers, water tankers, metal ores, chemicals and solid mineral fuels. The remainder of the freight is split between Container, Oil Based Products, and Produce (Fresh Vegetables, Live Stock, and Meat). 9% of vehicle loads were empty.
Empty
Oil Based Products
Container
Bulk Non-Oil
Construction Material
Fresh Vegetables
Live Stock
Meat
Other
Figure 69 Heavy Goods Vehicle Commodity Share (Road Freight Movements in Abu Dhabi Emirate)
5% Container
2% Fresh Vegetable1% Live Stock1% Meat
29% Other Goods
2% Oil Based Products
33% Construction Material
17% Bulk Non-Oil
9% Empty

Central Abu Dhabi
Morning Hour07:00 - 08:00
Cordon Location
Outer Abu Dhabi
Mussafah
Al Ain
4,300
4,900
5,700
1,800
Inter-peak PeriodAverage Hour
3,300
3,300
4,700
1,800
Afternoon Hour18:00 - 19:00
3,300
3,200
5,800
1,700
24 Hours
55,600
57,800
83,600
29,800
Aver
age
two
way
LG
V/H
GV
tri
ps c
ross
ing
cord
on
22
Number of Goods Vehicles Crossing Key Cordons
Freight movements are classified by the vehicle type LGV (Light Goods Vehicles) and HGV (Heavy Goods Vehicles). LGV comprise goods vehicles with two axles, whereas HGV are all goods vehicles with three or more axles. The highest number of freight movement trips occur across the Mussafah cordon. There are a similar number of freight movement trips across Central and Outer Abu Dhabi cordons whilst the Al Ain cordon has the lowest number of trips.
Note: Cordon locations are shown on location map on page 16.

Dai
ly P
asse
nger
s
Mode Share
TAXI
100%
90%
80%
70%
60%
50%
40%
30%
20%
10%
0%
National Resident
Expatriate Resident
Business travellers
Tourists staying with friends or
relatives
Tourists staying In hotel
% o
f Dai
ly P
asse
nger
s
23
Modes of Travel to Airport by Departing Air Passengers
The majority of residents and business travellers go to the airport by personal car either as a driver or passenger, whereas the majority of tourists take a taxi to the airport. The only category of departing air passengers that arrived at the airport by bus were expatriate residents.
Bus
Taxi
Car

Person Type and Proportion of Arrivals
Gue
sts/
Visi
tors
4%
National living in
Abu Dhabi Emirate
43%
Expatriate resident in Abu Dhabi
Emirate
2%
Visiting Relatives /
Friends
3%
Business traveller
2%
Tourist
54%
ALL
All Residents living in Abu Dhabi Emirate
12%12%
ALL
Wor
kers
All persons arriving for business, that are not hotel employees, such as seminar or
conference attendeesALL
Empl
oyer
s Bu
sine
ss
34% 34%
24
Hotel Arrivals by Category of User
Guests/Visitors make up the largest share of people making trips to hotels at 54%, and the highest proportion of the arrivals are expatriate residents at 43% of all arrivals. A further 34% are people on employers business, while only 2% of trips to hotels were by tourists.

25
Hotel Guests Travel Modes in Abu Dhabi
The main mode of travel for hotel guests while in Abu Dhabi is by car. Hotel guests that are visiting friends and relatives have a much higher share of trips by car. Car is also the dominant mode of travel for business guests and tourists but they have a more equally distributed share of the other modes with taxi and bus combined making up approximately 50% of their mode of travel.
Pur
pose
of V
isit
to
Abu
Dha
bi
Table 35 Mode of Hotel Guest Arrival in Abu Dhabi Emirate by Visit Purpose
TAXI
0% 20% 40% 60% 80% 100%
Tourism
VisitingFriends &Relatives
Business
Car
Taxi
Bus
Walk
Mode Share Percent

Tota
l Arr
ival
s
Time of Day - Hour Starting26
Arrival Travel Mode by Time of Day to Shopping Malls
There are two definitive peaks in the time of day when people arrived at shopping malls. The two hours starting at 11:00 in the morning, and then the hour starting at 18:00 in the late afternoon, with a lesser peak also occurring at 20:00 in the evening. Over 10,000 shoppers were surveyed making trips to the 5 shopping malls in each of these peak periods. Car as a mode followed by taxi are the main modes of travel to the shopping malls.
Table 41 Mode Share of Arrivals at Shopping Malls and Commercial Area in Abu Dhabi
TAXI
14,000
12,000
10,000
8,000
6,000
4,000
2,000
09:0
0
10:0
0
11:0
0
12:0
0
13:0
0
14:0
0
15:0
0
16:0
0
17:0
0
18:0
0
19:0
0
20:0
0
21:0
0
0
Time of Day - Hour Starting
Tota
l Arr
ival
s
Car
Walk
Bicycle
Bus
Taxi
Motorcycle
Other
Walk
Bus
Taxi
Car

27
Car Driving Licence Ownership by Age and Gender
The proportion of the population with a car driving licence is higher amongst males than females in all the age bands. For males the percentage also increases with age and the majority of males over 26 have licenses.
Figure 51 Car Driving Licence Ownership by Age and Gender
No Car Driving Licence
With Car Driving Licence
18 or under
19-25
26-45
46-65
65+
18 or under
19-25
26-45
46-65
65+
0% 10% 20% 30% 40% 50% 60% 70% 80% 90% 100%
Males with Driving Licence
Females with Driving Licence
No Driving Licence (Male & Female)

28
The Trip Purposes of Local Bus Users
Just over half of trips made by local bus users are work related with the majority of these being people travelling to their usual workplace. The next highest shares are going for shopping and on personal business.
32% Usual Workplace
1% Education
19% Shopping
Leisure/Recreation
Other
21% Other Work Related
Personal Business
8%
13%
6%
Figure 62 Trip Purpose of Local Bus Users

29
Summary
The travel surveys provided a useful insight into travel patterns in the Emirate of Abu Dhabi. The information from the travel surveys has been instrumental in the development of the Department of Transport’s long range strategic transportation planning model, STEAM. This model is a valuable tool used for the assessment and evaluation of transport proposals and long range planning to accommodate future growth of the Abu Dhabi Emirate.