Abu Dhabi Commercial Bank PJSC · 2017-03-20 · This presentation has been prepared by Abu Dhabi...
39
Abu Dhabi Commercial Bank PJSC Q4/FY’16 Investor presentation February 2017
Transcript of Abu Dhabi Commercial Bank PJSC · 2017-03-20 · This presentation has been prepared by Abu Dhabi...

Abu Dhabi Commercial Bank PJSCQ4/FY’16 Investor presentation
February 2017
THIS PRESENTATION IS NOT AN OFFER OR SOLICITATION OF AN OFFER TO BUY OR SELL SECURITIES. IT IS SOLELY FOR USE AS AN INVESTOR PRESENTATION AND ISPROVIDED AS INFORMATION ONLY. THIS PRESENTATION DOES NOT CONTAIN ALL OF THE INFORMATION THAT IS MATERIAL TO AN INVESTOR. BY READING THEPRESENTATION SLIDES YOU AGREE TO BE BOUND AS FOLLOWS:
This presentation has been prepared by Abu Dhabi Commercial Bank PJSC (“ADCB”), is furnished on a confidential basis and only for discussion purposes, may be amended andsupplemented and may not be relied upon for the purposes of entering into any transaction. The information contained herein has been obtained from sources believed to bereliable but ADCB does not represent or warrant that it is accurate and complete. The views reflected herein are those of ADCB and are subject to change without notice. Allprojections, valuations and statistical analyses are provided to assist the recipient in the evaluation of the matters described herein. They may be based on subjectiveassessments and assumptions and may use one among alternative methodologies that produce different results and to the extent that they are based on historical information,they should not be relied upon as an accurate prediction of future performance.
No action has been taken or will be taken that would permit a public offering of any securities in any jurisdiction in which action for that purpose is required. No offers, sales,resales or delivery of any securities or distribution of any offering material relating to any such securities may be made in or from any jurisdiction except in circumstances whichwill result in compliance with any applicable laws and regulations.
This presentation does not constitute an offer or an agreement, or a solicitation of an offer or an agreement, to enter into any transaction (including for the provision of any services).No assurance is given that any such transaction can or will be arranged or agreed. Before entering into any transaction, you should consider the suitability of the transaction to yourparticular circumstances and independently review (with your professional advisers as necessary) the specific financial risks as well as the legal, regulatory, credit, tax and accountingconsequences.
This presentation may include forward-looking statements that reflect ADCB's intentions, beliefs or current expectations. Forward-looking statements involve all matters that arenot historical by using the words "may", "will", "would", "should", "expect", "intend", "estimate", "anticipate", "believe" and similar expressions or their negatives. Such statementsare made on the basis of assumptions and expectations that ADCB currently believes are reasonable, but could prove to be wrong.
This presentation is for the recipient’s use only. This presentation is not for distribution to retail clients. In particular, neither this presentation nor any copy hereof may be sent ortaken or distributed in the United States, Australia, Canada or Japan or to any U.S. person (as such term is defined in Regulation S under the U.S. Securities Act 1933, as amended(the “Securities Act”)), except pursuant to an exemption from the registration requirements of the Securities Act. If this presentation has been received in error it must bereturned immediately to ADCB. Accordingly, this presentation is being provided only to persons that are (i) "qualified institutional buyers" within the meaning of Rule 144Aunder the Securities Act or (ii) not "U.S. persons" within the meaning of Regulation S under the Securities Act. By accepting the delivery of this presentation, the recipientwarrants and acknowledges that it falls within the category of persons under clause (i) or (ii). No representation can be made as to the availability of the exemption provided byRule 144 for re-sales of any securities offered by or guaranteed by ADCB. No securities offered by or guaranteed by ADCB have been recommended by, or approved by, theUnited States Securities and Exchange Commission (the “SEC") or any other United States federal or state securities commission or regulatory authority, nor has any suchcommission or regulatory authority passed upon the accuracy or adequacy of this presentation.
This document does not disclose all the risks and other significant issues related to an investment in any securities/transaction. Prior to transacting, potential investors shouldensure that they fully understand the terms of any securities/transaction and any applicable risks. This document is not a prospectus for any securities. Investors should onlysubscribe for any securities on the basis of information in the relevant prospectus and term sheet, and not on the basis of any information provided herein.
This presentation is being communicated only to (i) persons who are outside the United Kingdom, (ii) persons who have professional experience in matters relating to investmentsfalling within Article 19(5) of The Financial Services and Markets Act 2000 (Financial Promotion) Order 2005, or (iii) those persons to whom it may otherwise lawfully be distributed (allsuch persons together being referred to as “relevant persons”). This presentation is communicated only to relevant persons and must not be acted on or relied on by persons whoare not relevant persons. Any investment or investment activity to which this presentation relates is available only to relevant persons and will be engaged in only with relevantpersons.
By accepting this document you will be taken to have represented, warranted and undertaken that (i) you are a relevant person (as defined above); (ii) you have read and agreeto comply with the contents of this notice; and (iii) you will treat and safeguard as strictly private and confidential all such information and take all reasonable steps to preservesuch confidentiality.
Disclaimer
2 | Q4/FY’16 Investor presentation

Financial highlights
Business overview
Appendix
Our journey

2,000
2,200
2,400
2,600
2,800
3,000
3,200
Jan-
14Fe
b-14
Mar
-14
Apr
-14
May
-14
Jun-
14Ju
l-14
Aug
-14
Sep
-14
Oct
-14
Nov
-14
Dec
-14
Jan-
15Fe
b-15
Mar
-15
Apr
-15
May
-15
Jun-
15Ju
l-15
Aug
-15
Sep
-15
Oct
-15
Nov
-15
Dec
-15
Jan-
16Fe
b-16
Mar
-16
Apr
-16
May
-16
Jun-
16Ju
l-16
Aug
-16
Sep
-16
Oct
-16
Nov
-16
Dec
-16
UAE Oil Production
Annual Average
45
50
55
60
65
70
Jan-
14Fe
b-14
Mar
-14
Apr
-14
May
-14
Jun-
14Ju
l-14
Aug
-14
Sep
-14
Oct
-14
Nov
-14
Dec
-14
Jan-
15Fe
b-15
Mar
-15
Apr
-15
May
-15
Jun-
15Ju
l-15
Aug
-15
Sep
-15
Oct
-15
Nov
-15
Dec
-15
Jan-
16Fe
b-16
Mar
-16
Apr
-16
May
-16
Jun-
16Ju
l-16
Aug
-16
Sep
-16
Oct
-16
Nov
-16
Dec
-16
PMINew Export Orders IndexNew Orders/Incoming New Business IndexOutput/Business Activity Index
0
2
4
6
8
10
12
14
16
18
1Q20
14
2Q20
14
3Q20
14
4Q20
14
1Q20
15
2Q20
15
3Q20
15
4Q20
15
1Q20
16
2Q20
16
3Q20
16
4Q20
16
Chemical Construction Gas
Industrial Oil Power
Transport Water
-6
-4
-2
0
2
4
6
8
10
12
2006
2007
2008
2009
2010
2011
2012
2013
2014
2015
e
2016
f
2017
f
Oil Sector Non-oil Sector Headline Growth
UAE economic overview : High oil price supportive but challenges remain
4 | Q4/FY’16 Investor presentation
USD billion
Positive contribution to headline GDP growth from non-oil sectors, though pace of expansion moderating
Total UAE project awards are trending lower, but progress continues with core projects
Oil production has strengthened since mid-2016, oil sector to make a small positive contribution to 2016 GDP growth
Source: Market Economics PMI: Purchasing Managers IndexSource: MEED Projects, ADCB
PMI data reflects the softening in non-oil activity, though remaining expansionary, some improvement in 2Q
Source: Bloomberg
%
Source: UAE National Bureau of Statistics, ADCB estimates
‘000 bpd Index; reading above 50 indicates an expansion
UAE’s non-oil economy is forecast to see a moderate pickup in growth in 2017. However, economic challenges remain, include ongoing softening real estate prices, weak global and regional demand, the strong USD and monetary tighteningWe expect headline real GDP growth to moderate in 2017 as the UAE reduces oil output in 1H2017, in line with the OPEC agreement. However, oil revenue will increase with a higher average oil priceReal non-oil GDP growth is expected to strengthen to decelerate to 2.9% in 2017, from 2.3% in 2016We expect the focus to remain in fiscal consolidation in Abu Dhabi and do not expect to see an increase in government spending. Reforms include further reduction in utility subsidies (Jan 2017)Dubai announced an expansionary budget for 2017, with a focus on investment spending. Dubai saw an 11.6% rise in project awards in 2016 and investment activity around Expo 2020 to increase Key service sectors (tourism, transportation, logistics, etc.) are continuing to see growth, albeit softening. PMI data reflects the weakening in external demand backdrop, albeit seeing some improvement in 4Q2016 UAE introduces visa on arrival from China and Russia to support tourism and related sectorsUAE annual average inflation to tick up moderate in 2017 with higher fuel prices in 2016, before seeing an acceleration in 2018 with the GCC-wide introduction of VATDiverse economic base and strong FX reserves support the economic outlook; UAE is one of the best placed amongst the global oil exporters to with stand the lower oil price

0.6
0.8
1.0
1.2
1.4
1.6
1.8
2.0
5-Ju
l-15
5-Aug
-15
5-Sep
-15
5-O
ct-1
5
5-N
ov-1
5
5-D
ec-1
5
5-Ja
n-16
5-Fe
b-16
5-M
ar-1
6
5-Apr
-16
5-M
ay-1
6
5-Ju
n-16
5-Ju
l-16
5-Aug
-16
5-Sep
-16
5-O
ct-1
6
5-N
ov-1
6
5-D
ec-1
6
5-Ja
n-17
EIBOR 3M EIBOR 6M
-40
-20
0
20
40
60
80
100
1Q20
14
2Q20
14
3Q20
14
4Q20
14
1Q20
15
2Q20
15
3Q20
15
4Q20
15
1Q20
16
2Q20
16
3Q20
16
4Q20
16
GRE Net DepositsGovernment Net DepositsTotal Net Deposits
0
2
4
6
8
10
12
Dec
-15
Jan-
16
Feb-
16
Mar
-16
Apr
-16
May
-16
Jun-
16
Jul-
16
Aug
-16
Sep
-16
Oct
-16
Nov
-16
Dec
-16
Total Private Sector
Business & Industrial Sector
Individuals
0
2
4
6
8
10
12
14
88
90
92
94
96
98
100
102
104
106
Mar
-14
Apr
-14
May
-14
Jun-
14Ju
l-14
Aug
-14
Sep
-14
Oct
-14
Nov
-14
Dec
-14
Jan-
15Fe
b-15
Mar
-15
Apr
-15
May
-15
Jun-
15Ju
l-15
Aug
-15
Sep
-15
Oct
-15
Nov
-15
Dec
-15
Jan-
16Fe
b-16
Mar
-16
Apr
-16
May
-16
Jun-
16Ju
l-16
Aug
-16
Sep
-16
Oct
-16
Nov
-16
Dec
-16
Loan-to-Deposit Ratio (LHA) Credit Growth, y-o-y (RHA) Deposit Growth, y-o-y (RHA)
UAE banks overview : Strong deposit growth, improved liquidity conditions
5 | Q4/FY’16 Investor presentation
Private sector credit growth decelerates in 2016 with retail growth moderating, corporate has been more steady
GRE and government both net creditors from the banking sector in 3Q2016
UAE Interbank rates continue to rise with tighter banking sector liquidity
Banking sector liquidity tightening as credit growth outstrips deposit growth, albeit by a smaller margin
Source: BloombergSource: Central Bank of UAESource: Central Bank of UAE
L-to-D ratio (LHA); % change y-o-y (RHA)
Source: Central Bank of UAE
AED billion% change y-o-y %
UAE Banking sector is ranked largest in the GCC in terms of assets, comprises of 23 national banks and 35 foreign banksInterbank lending rates continued to rise in 2016 as banking sector liquidity tightened and with the 25 bps rate hike December. However, greater funding from the debt capital markets (sovereign and corporate) helped to limited the upside pressureGross credit growth outstripped deposit growth in 2016, expect for December which saw a sharp rise in deposits (of 6.2% YoY vs. credit growth of 6%) Government and GRE combined are net creditors from the banking sector in 2016, with particularly a pickup in GRE borrowing and lower deposits. Government returned to being a net depositor to the banking sector in December 2016Private sector credit growth stood at 5.6% YoY in December 2016, down from 8.5% YoY in December 2015. The decelerating retail credit growth in 2016 in YoY terms has been particularly notable, from 10.3% YoY in December 2015 to 5.3% YoY in December 2016, with greater job uncertainties and losses in certain sectorsBanking sector is strongly capitalised, with a CAR of 19.0% and Tier I of 17.3% as at 31 December 2016
Financial highlights
Appendix
Macro overview
Our journey

ADCB franchise 2016 2015
Market cap (AED billion) 36 34
Branch network (UAE)¹ 48 49
Overseas branches² 3 3
Market share of loans, net (%) 10.8 10.6
Market share of deposits (%) 9.9 9.8
ADCB overview
Ownership structure
¹ Excludes pay offices ² Two branches in India and one branch in Jersey
Ratings
S&P A/A-1/Stable
FitchA+/F1/Stable
RAMAAA/P1/Stable
7 | Q4/FY’16 Investor presentation
62.52% owned
byADIC
Free float- Foreign investors 14.20%
Abu Dhabi Investment Council (ADIC)* 62.52%
Free float - Domestic23.28%
* Following our buyback program concluded in January 2015, the Bank has cancelled 397,366,172 treasury shares. The new issued share capital is AED 5,198,231,209 (Effective 8 January 2017)
ADCB Head Office Branch
uBank Digital Centre, Yas Mall

Situated to benefit from UAE economic growth
Remain positive on UAE’s medium term outlook, despite the lower oil price and softening economic activity
Government remains focused on driving economic diversification. New attractions and theme parks important to drive tourism growth
Supportive principal shareholders
The Government (Abu Dhabi Investment Council) owns 62.52% of the issued share capital
Long-standing government related corporate client base
Robustcapital ratios, stable liquidity & funding profile,healthy asset quality
Total CAR of 18.92%, Tier I capital ratio of 15.66% as at 31 December 2016
Despite tightening liquidity, total customer deposits grew 8% year on year and CASA deposits comprised 42% of total deposits
Net lender of AED 22 billion in the interbank markets
Strong risk management culture, maintaining a rigorous control framework, NPL ratio of 2.7% and provision coverage ratio of 129.9%
Strong domestic franchise with a well known and trusted brand
Broad portfolio of innovative consumer and wholesale products, customised cash management and trade finance solutions; key enablers for CASA growth
Tailor made financing and risk management solutions that facilitate access to capital markets, investment solutions and structured products that meet clients’ needs
Strategic partnerships with Bank of America Merrill Lynch
Measured growth,sustainable profitability
Continue to grow our balance sheet in a granular and prudent manner in our core geography and core businesses
Total assets increased 13% and net loans increased 8% year on year
Delivered ROAE of 15.7% for 2016
In July 2016, S&P raised ADCB’s stand-alone (SACP) credit profile to ‘bbb+’ from ‘bbb’ on account of strengthening business position and improving returns, coupled with more balanced earnings generation across different business segments
Core strengths (As at 31 December 2016)
Management team has wealth of experience in international and regional institutions
Regional leader in corporate governance, maintaining high standards with clear framework and policies emphasising transparency, integrity, accountability and fairness
Experienced management team and strong corporate governance culture
8 | Q4/FY’16 Investor presentation

Consumer banking47%
Wholesale banking30%
Treasury & investments19%
Property management4%
2016
Total operating income = AED 8,495 million
Percentage contribution to operating income
Consumer Banking
Wholesale Banking
Treasury and Investments
Property Management
Covers retail, wealth management and Islamic operationsGrowth in consumer banking underpinned by an increased product offering, expansion of sales and distribution infrastructure and effective cross-sellingCo-branded Visa Cards with Etihad AirwaysTouchpoints – Unique market leading rewards programme for customers
Serves SMEs, mid-corporates, large corporations, financial institutions, public enterprises and government institutionsResponsible for ADCB’s 2 Indian branches, Jersey branch and representative offices in London and SingaporeAward winning world class cash management services and solutions, delivering CASA balances for ADCBStrong digital online transaction banking platformStrategic relationship with Bank of America Merrill Lynch to allow clients who require services in the region to access capabilities provided by ADCB
Treasury business and investment portfolio provides interest rate, commodities and foreign exchange services Covers money market, FX, interest rates, currency, commodity derivatives and asset & liability management
Includes real estate and property management activitiesComprises real estate, property management and engineering services through subsidiaries Abu Dhabi Commercial Proprieties and Abu Dhabi Commercial Engineering ServicesManagement of investment properties and ADCB rental income
Our business segments provide a diversified revenue stream
Operating profit and impairment allowances by business segment (AED million)
Consumer Banking Wholesale Banking Treasury & Investments Property Management
2016 2015 2016 2015 2016 2015 2016 2015
9 | Q4/FY’16 Investor presentation
2,171 2,018 1,878 1,730 1,403 1,477
247 208
(943)(684) (597)
172 19 11
Operating profit Impairment (allowances)/recoveries

1 2 3 4 5
years
Our five strategic pillars
Leading through: Ambition + DisciplineOur strategy remains steady and consistent – sharp focus on serving the UAE
Growth through a UAE-centric approach
with controlled internationalisation
Stability through
liability growth
Maintain a culture of service excellence
and efficiency
Manage our risk in line with pre-defined
risk strategy
Success through
staff
UAE centric Sustainable growth Customer centric Risk - aware Talent driven
10 | Q4/FY’16 Investor presentation¹ Source: 2016 survey conducted by independent third party research agencies for ADCB customers
achieved the #1 position among our peers across our Wholesale, Mid Corporate, Treasury, SME, Institutional
Clients Group, Private accounts and ADCB Securities
segments¹
CASA deposits/totaldeposits
Cost of risk Averagetime span of Executive
management
gross loans within the UAE
94% 42% 0.83% 91#

Recognised as a regional leader in corporate governance
Corporate governance structure
Board committees
Audit & Compliance Committee
Corporate Governance Committee
Nomination, Compensation & HR Committee
Risk & Credit Committee
Management Committees
Management Executive Committee (MEC)
Management Human Resource Committee
(MHRC)
Liabilities and Initiatives Committee
(LICO)
Senior Management Committee (SMC)
Assets & Liabilities Committee (ALCO)
Management Risk & Credit Committee
(MRCC)
Management Recoveries
Committee (MRC)
Capital Expenditure Committee (CEC)
Financial Performance Management
Committee (FPMC)
International Operations & Alliances
Committee (IO&AC)
Board
Structure and composition
Highlights
Board of Directors
Government Relations
Group
Human Resources
Group
Wholesale Banking Group
Consumer Banking Group
Treasury & Investments
Group
Group Business Services
Group Finance
Risk Group
Group Chief Internal Auditor
Group Chief Executive Officer Group General
Counsel and Board Secretary
BACC BRCC
11 | Q4/FY’16 Investor presentation
The Bank’s governance structure is headed by the Board which has overall responsibility for guiding the BankThe Bank has a number of Board committees and management committees which oversee and monitor day to day activities of the BankOur reporting lines are an important part of our governance structure:- Group Chief Risk Officer is independent and reports to the Board Risk & Credit Committee (BRCC)- Group Chief Internal Auditor is independent and reports to the Board Audit & Compliance Committee- Group General Counsel and Board Secretary is independent and has a dual reporting line to the Board and the CEOThe Bank appointed Sir Gerry Grimstone as an independent Adviser to its Board of Directors – Chairman of Standard Life and Deputy Chairman ofBarclays PLC, to bring a third party perspective on the Bank’s governance, and his deep experience, and to help the Bank with a continual process ofimprovementDuring 2013, Aysha Al Hallami was appointed as Director, first woman to be appointed to the Bank’s Board of Directors, In line with international trendsand the Bank's efforts to promote greater diversity at Board level, Aysha Al Hallami was appointed in 2013 as the Bank's first female Director. The Board’sNomination, Compensation & HR Committee is aware of the need to structure the Board to ensure that it obtains an appropriate balance of skills,experience and knowledge as well as independence.

Effective risk management is fundamental to our core strategy
Business units Risk management Independent assurance
Highlights
Our risk appetite is approved by the BoardContinue to upgrade our risk management capabilities and strict enforcement of discipline is applied on the business side using measures such as RAROC(Risk adjusted Return on Capital)
As a result of this continuing discipline our portfolio achieved the following results:- Top 20 largest customer exposure reduced to 35.38% of gross loans in 2016 compared to 37.01% in 2015, concentration reduction by name and sector- Provision coverage of 129.9% remains strong
- Average portfolio quality has improved one notch, notwithstanding a negative trend in credit conditions- LCR of 129% is well above the UAE Central Bank requirement of 70%
Our capital adequacy ratio remains above UAE Central Bank hurdle rate and amongst the strongest in the country. Continued work on enhancing our riskmanagement capabilities will help us to prepare for Basel III requirements
Principal risks
Credit Risk Managing concentrations, growth of granular businesses and improvement in average portfolio quality. Effective pricing tools to price risk appropriately
Market Risk Implements valuation and risk policies for all Level 1 and Level 2 financial instruments in the trading book through measures like VaR, SVaR, Expected Shortfall
Liquidity & Funding Risk Diversified funding through retail and wholesale operations. Strive to maintain sticky deposits. Treasury Department ensures access to diverse sources of funding
Capital Risk Manage via techniques based on guidelines developed by the Basel Committee and CB of the UAE. Prepare ICAAP document annually (capital planning)
Operational Risk Using top risk analysis and risk and control assessment (RCA) process to monitor and manage operational risk
Regulatory Risk Member of UAE Banks Federation and actively try to influence regulations. Regulatory compliance is closely monitored by the Riskand Audit areas
Information Security Risk Information –risk heat map against cyber threats is continually updated. Regular security testing and effective security controls
Reputational Risk Set policy and provide guidance to avoid reputational risk relating to business engagements and lending clients in sensitive industry sectors
12 | Q4/FY’16 Investor presentation

114,000 customers spoken to for feedbackIn 2016, 16.4 million payments were processed with a value of (AED 1.7 trillion), an increase of 19% year on year, with 93% straightthrough processing (STP) for electronic paymentsContinue to invest in technology to better serve our customers
‒ Opened first digital banking centre “uBank” in Yas Mall, Abu Dhabi‒ Adoption and usage of the internet and mobile banking platforms continued to grow in 2016, with the percentage of active users
reaching 51% for internet banking and 65% for mobile banking‒ VoicePass, multi-lingual voice authentication system, has over 64,000 registered users, with 30% active users every month and over
1,100 authentications every dayOver 90% of retail financial transactions done electronicallyADCB was the #1 “Most googled” local brand in 2015ADCB brand recognised as one of the “Top 10 Brands” in the UAE according to Brand Intimacy 2015 Report by international brandagency MBLM, ADCB was the only local brand in the Top 10 alongside global names
Q1'14 Q2'14 Q3'14 Q4'14 Q1'15 Q2'15 Q3'15 Q4'15 Q1'16 Q2'16 Q3'16 Q4'16
Servicing my relationship - Consumer Banking Servicing my relationship - Wholesale bankingHelping me finance my ambition - Consumer Banking Helping me finance my ambition - Wholesale Banking
Leading through customer centricity
¹ NPS is based on customers' likelihood to recommend ADCB to a friend or colleague. NPS is calculated as the percentage of customers who are promoters, rating the company 9 or 10 on a 0 to 10 point scale, minus the percentage who are detractors, rating it 6 or lower 13 | Q4/FY’16 Investor presentation
Net Promoter Scores (NPS)¹ continued to rise throughout 2016

Towards service excellence
14 | Q4/FY’16 Investor presentation
Live fast feedback loops
46 Service quality forums and customer experience working groups
24 Mystery shopping surveys
5,177
Service recoveries following feedback from a fast feedback loop
2,426Staff trained on service standards and Our Promise
2,444
Staff provided feedback on internal service providers
22,100Customers spoken to for feedback
114,000
Processes fully re-engineered
8
Studies undertaken on the voice of the customer
236
We achieved the #1 position among our peers across our Wholesale, Mid Corporate, Treasury, SME, Institutional Clients Group, Private accounts and ADCB Securities segments
# 1
Customer focus groups undertaken
24

Financial highlights
Business overview
Appendix
Macro overview

1.20%
0.90%
0.48%
0.29%
0.83%
2012
2013
2014
2015
2016
2012 2013 2014 2015 2016
2012 2013 2014 2015 2016
Book value per share (AED) Total shareholder return (%) Basic earnings per share (AED)
0.45 0.59 0.74 0.93 0.77
0.30 0.40 0.45 0.400.25
Cost of risk (%) Dividend per share (AED)
3.63 3.88 4.31 4.76 5.07
2012 2013 2014 2015 2016
ADCB ADX ADBF
1 Year 18% 11% 7%
5 Year 214% 137% 134%
Source: Bloomberg: ADCB, ADX: Abu Dhabi Exchange, ADBF: Banking IndexAs at 31 December 2016
Return on average equity (%)
2012 2013 2014 2015 2016
13.0% 15.5% 18.1% 20.3 % 15.7%
16 | Q4/FY’16 Investor presentation
Our journey: Strong financial performance, delivering long term value for shareholders

123 127 132 146 158
6.595 7.320 7.529
8.260 8.495
2012 2013 2014 2015 2016
181 183 204228
258
2012 2013 2014 2015 2016
Total assets (AED billion) Net loans and advances* (AED billion)
4.526 4.961 4.966 5.434 5.700
Operating income (AED billion) Operating profit (AED billion)
*In June 2016, loans and advances to banks have been reclassified to “Deposits and balances due from banks, net” to better reflect the underlying nature of thebusiness of the borrowers. Accordingly, net loans in 2015 were reclassified to conform to current period’s presentation
17 | Q4/FY’16 Investor presentation
Our journey: Building on a proven strategy, delivering measured and profitable growth
2012 2013 2014 2015 2016
2012 2013 2014 2015 2016

Our journey: Strong deposit gathering franchise, focus on growing CASA deposits
1.710 1.334 0.762 0.502 1.520
2012 2013 2014 2015 2016
109 115 126 144 155
65
63
56
44
36
2016
2015
2014
2013
2012
Customer deposits (AED billion) CASA deposits (AED billion)
CASA as % of total customer deposits
33%
39%
45%
44%
42%
Net profit (AED billion)Impairment allowance charge (AED billion)
18 | Q4/FY’16 Investor presentation
2012 2013 2014 2015 2016
2.810
3.6204.201
4.927
4.157
2012 2013 2014 2015 2016

31.4% 32.2%34.0% 34.2% 32.9%
2012 2013 2014 2015 2016
1.37%
1.72%2.00%
2.22%
1.65%
2012 2013 2014 2015 201618.92%
19.76%
21.03%
21.21%
23.05%
2016
2015
2014
2013
2012
Cost to income ratio (%)Capital generation (AED million)
Capital adequacy ratio (%)
12%
Minimum CAR requirement stipulated by UAE Central Bank
Return on average assets (%)
19 | Q4/FY’16 Investor presentation
Our journey: Robust capital position, disciplined cost management
2,736 3,365 4,050 4,924 4,149
(240) (240) (186) (129) (138)(1,398) (1,561)
(2,079) (2,339)(31)
(1,797)(12)
(17)
2012 2013 2014 2015 2016
Share buy backDividends paidCapital notes coupon paidNet profit attributable to equity holders of the Bank
1,347(70)
2,2912,699
1,671

Business overview
Appendix
Macro overview
Our journey

Cost of risk
2015
2016 0.83%
0.29%
Cost of funds (CoF)
2015
2016 1.33%
0.92%
8.260 8.495
5.434 5.700
2015 2016
146
158
2015 2016
2015 2016
34.2% 32.9%144
155
2015 2016
2016 Financial Highlights
Higher CoF and cost of risk resulted in lower profitability
AEDbn
AEDbn
Net loans Deposits
AEDbn
Cost to income ratio
129%
Liquidity coverage ratio
18.92%Capital adequacy ratio
+8%+8% +3%
+5%
Robust capital structure and strong liquidity ratios
Operating income Operating profit before impairment allowances
In a tight liquidity environment, loans and deposits +8% YoY Strong underlying performance and efficiently managed cost base
Improvement of 130 bps
4.927
4.157
2015 2016
Net profit
AEDbn
-16%
21 | Q4/FY’16 Investor presentation

Total assets grew 13% year on year to AED 258billion. Net loans and advances to customersincreased 8% year on year to AED 158 billion,compared to system wide growth of 6%
Deposits from customers also increased 8% yearon year to AED 155 billion, compared to systemwide growth of 6%. Low cost current and savingsaccount (CASA) deposits comprised 42% of totalcustomers deposits
Loan to deposit ratio from customers wasunchanged at 101.9%
Investment securities increased 58% year on yearto AED 33 billion, mainly driven by an increase inUAE government bonds
Capital adequacy and tier I ratios were 18.92%and 15.66% respectively. The decline in CAR wasmainly on account of balance sheet growth andchange in asset mix
Total equity strengthened by AED 1.6 billion yearon year to AED 30 billion as at 31 December 2016
On 8 January 2017, the Bank cancelled its treasuryshares and total equity reflects this cancellation
Highlights (31 December 2016)
Balance sheet highlights
Figures may not add up due to rounding differences
Change%
Balance sheet highlights (AED million) Dec’16 Sep’16 Dec’15 QoQ YoY
Loans and advances to customers, net¹ 158,458 161,562 146,250 (2) 8
Investment securities 33,059 25,750 20,864 28 58
Total assets 258,289 254,679 228,267 1 13
Deposits from customers 155,442 153,353 143,526 1 8
Borrowings 38,015 35,635 33,472 7 14
Total equity* 30,351 29,602 28,728 3 6
Ratios (%) Dec’16 Sep’16 Dec’15 bps bps
CAR (Capital adequacy ratio) 18.92 17.98 19.76 94 (84)
Tier I ratio 15.66 14.72 16.29 94 (63)
Loan to deposit ratio 101.9 105.4 101.9 (350) -
¹ In Q2’16, loans and advances to banks were reclassified to “Deposits and balances due from banks, net” to better reflect the underlying nature of the business of the borrowers. Accordingly, comparative amounts pertaining to previous years were reclassified to conform to current period’s presentation.
* Attributable to equity holders of the Bank
22 | Q4/FY’16 Investor presentation

Income statement highlights
2016 Key indicators
Return on average equity(ROAE %)*
Return on average assets (ROAA %)*
Earnings per share(EPS – AED)
*For ROAE/ROA calculations, net profit attributable to equity shareholders is considered, i.e., net profit after deducting minority interest and coupon on Tier 1 capital notes
0.77 15.7 1.65
Year on year trend Quarterly trend
Change % Q4’16 Change %
Income statement highlights (AED mn) 2016 2015 YoY Q4'16 Q3'16 Q4'15 QoQ YoY
Total net interest and Islamic financing income 6,201 6,206 0 1,573 1,528 1,476 3 7
Non - interest income 2,294 2,055 12 598 541 539 10 11
Operating income 8,495 8,260 3 2,171 2,070 2,016 5 8
Operating expenses (2,796) (2,827) (1) (729) (663) (715) 10 2
Operating profit before impairment allowances 5,700 5,434 5 1,443 1,406 1,301 3 11
Impairment allowances (1,521) (502) 203 (437) (380) (110) 15 296
Share in profit of associate 8 1 NM 2 2 1 NM NM
Profit before taxation 4,187 4,933 (15) 1,008 1,028 1,191 (2) (15)
Overseas income tax expense (30) (6) NM (4) (22) (1) NM NM
Net profit for the period 4,157 4,927 (16) 1,004 1,006 1,191 0 (16)
Net profit attributable to equity shareholders 4,149 4,924 (16) 1,004 999 1,190 1 (16)
Figures may not add up due to rounding differences
Highlights (2016 vs. 2015)
Operating income of AED 8,495 million was up3% year on year, whilst operating profit beforeimpairment allowances of AED 5,700 million wasup 5% over 2015. This was achieved in theabsence of significant recoveries and interest insuspense reversals recorded in 2015, which werenot repeated in 2016
Total net interest income of AED 6,201 millionwas stable year on year, impacted by higherfunding costs. This was partially offset by non-interest income of AED 2,294 million, up 12%over 2015
Operating expenses of AED 2,796 million were1% lower, driven by the Bank’s disciplined coststrategy
Impairment allowances charged for the year wereAED 1,521 million compared to AED 502 millionin 2015, reflecting our prudent approach tochallenging market conditions
Net profit of AED 4,157 million was 16% loweryear on year, impacted by higher cost of fundsand higher impairment allowances
Whilst profitability declined year on year, theBank maintained a robust ROAE of 15.7% andROAA of 1.65% for 2016
23 | Q4/FY’16 Investor presentation

1,992 1,922 1,934 1,950 2,098 2,130 2,195 2,328
Q1'15 Q2'15 Q3'15 Q4'15 Q1'16 Q2'16 Q3'16 Q4'16
351 379 389 473 525 604 667 754
Q1'15 Q2'15 Q3'15 Q4'15 Q1'16 Q2'16 Q3'16 Q4'16
Highlights
Gross interest and Islamic financing income of AED 8,751 millionwas up 12% year on year, driven by a 10% increase in averageinterest earning assets over 2015
While asset yields remained strong, higher cost of funds resultedin a flat total net interest and Islamic financing income of AED6,201 million and a lower net interest margin of 2.97% in 2016
Interest expense of AED 2,550 million was 60% higher over 2015,reflective of the tighter liquidity environment
Time deposits increased 13% year on year, providing stabilitywith longer tenor deposits. The higher premium paid on timedeposits and higher Eibor drove cost of funds higher to 1.33%from 0.92% in 2015
63.365.0
80.290.5
2015 2016 2015 2016
Increase in cost of funds reflective of the tighter liquidity environment
Evolution of yields (%)
AED 7,797 mnAED 8,751 mn
CASA deposits
4.37% 4.16% 3.98% 3.94%4.29% 4.19% 4.10% 4.21%
0.85% 0.89% 0.88% 1.04% 1.17% 1.28% 1.34% 1.49%
3.60% 3.34% 3.18% 2.98%3.22% 3.00% 2.85% 2.85%
Q1'15 Q2'15 Q3'15 Q4'15 Q1'16 Q2'16 Q3'16 Q4'16
Yield on interest earning assets(%) Yield on interest bearing liabilities(%)Net interest margin(%)
2016
4.20%
2.97%
1.33%
2015
4.11%
3.27%
0.92%
YoY: +12%
Time deposits
AEDbn
AEDbn
Gross interest and Islamic financing income
Interest expense
+3%+13%
AEDmn
AEDmn
24 | Q4/FY’16 Investor presentation

375 343 335 385
12370 68
9154
86 6363*
Net fees and commission income Net trading income Other operating income
358 376 359 380
122180
81140
5861
10263*
75% 76% 77% 73%
25% 24% 23% 27%
Non interest income (%) Net interest income (%)
56%
31%
13%
Retail Banking fees Corporate Banking fees Others¹
74% 71% 74% 72%
26% 29% 26% 28%
617
498 466539 539551
2,041 2,011 2,016 2,143 2,1122,192
Non-interest income of AED 2,294 million was up 12% over theprevious year and accounted for 27% of operating income in 2016compared to 25% in 2015
Increase in non-interest income was mainly on account of highertrading income and higher fee & commission income. Net tradingincome of AED 522 million was up 48% year on year, mainly due tohigher FX and derivative income
Net fee and commission income of AED 1,472 million was up 2%over 2015 primarily on account of higher retail banking fees
Gross retail banking fees of AED 1,116 million (excludingbrokerage) were up 10% year on year, driven by higher loanvolumes and credit card spend. Gross corporate banking fees ofAED 560 million were flat year on year
Continued focus on diversifying revenues, non-interest income +12% year on year
Operating income (AED million)
Non-interest income (AED million)Highlights
2015
¹ Others include brokerage, fees from trust and other fiduciary activities and other fees
AED1,808
million
Gross fee income breakdown (AED million)
2,171
AED 8,260 mn AED 8,495 mn
AED 2,294 mnAED 2,055 mn
598
YoY: +3%
YoY: +12%
2,070
2015Q1 Q2 Q4Q3
2016Q1 Q2 Q4Q3
2015Q1 Q2 Q4Q3
2016Q1 Q2 Q4Q3
* Other income includes revaluation of investment properties in Q4’15 and Q4’16
541
59%
30%
11%
AED1,895
million
2016
25 | Q4/FY’16 Investor presentation

443 371 451 424
219 261
248 25738 39
40 34
468 374 406 408
235255 221 282
34 36 36
38
2015Q1 Q2 Q4Q3
Improved cost to income ratio of 32.9%, whilst continuing to grow revenues
Operating expenses (AED million)
666672 740 738715
Highlights
Operating expenses of AED 2,796 million were 1% lower year on year
The ongoing bankwide cost management initiatives and higher revenues resulted in an improved cost to income ratio of 32.9% compared to 34.2% in 2015
This improvement was achieved whilst we continued to make prudent investments in our businesses, systems and infrastructure, including an upgrade of our core banking system and a set of digital initiatives to enhance our offerings and customer service
Depreciation & amortisation Staff costs General administration expenses
AED 2,827 mnAED 2,796 mn
700 663
YoY: -1%
2016Q1 Q2 Q4Q3
729
Cost to income ratio (%)
31.4%
2016
32.9%32.2%
2014
34.0%
2015
34.2%
26 | Q4/FY’16 Investor presentation

Net loans to customers increased 8% year on year to AED 158,458million, comprising 61% of total assets (2015: 64%)
Consumer Banking loans increased 5%, while Wholesale Bankingloans increased 11% year on year. Loans to banks decreased 52%year on year to AED 3.6 billion
Consumer Banking loans comprised 45% and Wholesale Bankingloans comprised 55% of total loans
94% of loans were within the UAE in line with the Bank’s UAE centricstrategy
57% of loans (gross) were in Abu Dhabi, 30% were in Dubai and 7%in other Emirates as at 31 December 2016
Personal loans comprised 25% of gross loans (2015: 26%)
Islamic Banking continued to be a key driver of growth, with netIslamic financing assets up 30% year on year at AED 18,499 million asat 31 December 2016
Net loans to customers+8%, Islamic financing assets +30% YoY
Net loans and advances
61%
Investment securities 13%
Other assets¹ 9% Cash and balances with CB 7%
Deposits and balances due from banks 10%
Highlights 2015Gross loans = AED 152,426 million
¹ Others include agriculture, energy, transport, manufacturing and services
Contribution to net loans and advance to customers by business segment (AED million)
Gross loans by economic sector
Consumer banking includes retail and high net worth individuals and their businesses
Personal25%
Others1 7%
Real estate investment & hospitality 35%
Financial institutions 8%
Government & PSE 22%
Trading 3%
2016Gross loans = AED 164,400 million
2016Net loans = AED 158,458 million
Wholesale Banking
20162015
45%46%
71,446 67,802
20162015
55%54%
Consumer Banking
2016Total assets = AED 258,289 million
Composition of assets
¹ Other assets include derivative financial instruments, investments in associate, investment properties, property and equipment (net), intangible assets and reverse repo placements
Personal26%
Others1 5%
Real estate investment & hospitality 36%
Financial institutions 8%
Government & PSE 22%
Trading 3%
27 | Q4/FY’16 Investor presentation
87,01178,448

109.2 115.4 126.0143.5 155.4
2012 2013 2014 2015 2016
Contribution to total deposits by business segment (AED million)
Customer deposits
68%
Euro commercial paper 4%
Due to banks 2%Other liabilities 7% Derivative financial instruments 2%
Borrowings 17%
Customer deposits +8% YoY, total Islamic deposits +17% YoY
¹ Time deposits include long-term government and Murabaha deposits
CASA42%
Time deposits¹
58%
* Consumer banking includes retail and high net worth individuals and their businesses
20162015
32%29%
50,006 42,326
20162015
43%41%
66,218 59,310
Highlights Composition of liabilities Customer deposit breakdown2016Total liabilities = AED 227,938 million
2016Customer deposits = AED 155,442 million
Consumer Banking* Wholesale Banking Treasury
20162015
25%29%
39,218 41,890
Customer deposits (AED billion)
Customer deposits increased 8% year on year to AED155,442 million, comprised 68% of total liabilities(2015:72%)CASA deposits comprised 42% of total customer deposits
As at 31 December 2016, CASA balances were AED 64,975million, up 3%, while time deposits of AED 90,467 millionwere up 13% year on yearConsumer Banking deposits were up 18%, whileWholesale Banking deposits were up 12% year on yearConsumer Banking deposits comprised 32%, WholesaleBanking deposits comprised 43% and Treasury comprised25% of total customer deposits
Total Islamic deposits increased 17% year on year to AED11,987 million as at 31 December 2016
CAGR: +9.2%
28 | Q4/FY’16 Investor presentation

30.7 29.7
36.7 39.2
46.7
2012 2013 2014 2015 2016
8,729
3,103
1,836
2,019
1,286
735
732 2,187
4,067
4,874
2,740
6,182 6,726
1,327
202
2017 2018 2019 2021 and beyond
Repo MTN/GMTNSub debt Syndicate loansBilateral loans CDECP
Wholesale funding and maturity profileDiversified sources of funding by markets, tenors, currencies and productsMaturity profile
As at 31 December 2016 (AED million)
Wholesale funding including Euro Commercial Paper accounted for 21% of total liabilities, providing a stable, long-term and reliable source of funding
10,20610,995
4,757
20,785
Wholesale funding including Euro commercial paper (AED billion)
Net lender of
in the interbank markets (As at 31 December 2016)
* Includes AED 5 billion of certificate of deposits with central banks
Source of funds AED million
GMTN/EMTN 20,521
Subordinated debt 4,067
Euro Commercial paper 8,729
Borrowings through repurchase agreements 1,529
Bilateral loans 3,304
Syndication loan 3,654
Certificate of Deposits 4,939
Total 46,743
Wholesale funding split as at 31 December 2016 Wholesale funding as a % of total liabilities
CAGR: +11%
20% 19% 21% 20% 21%
29 | Q4/FY’16 Investor presentation
AED 22 bn*

14.01% 13.57%
2.28% 2.09%
2015 2016
157169
6
813
14
2015 2016
As at 31 December 2016, the Bank’s capital adequacy ratio(Basel II) and Tier I ratios were 18.92% and 15.66% respectively,while core Tier I ratio was 13.57%, and total risk weightedassets were at AED 191 billion
Decline in CAR was mainly on account of balance sheet growthand change in asset mix. The capital adequacy ratio minimumrequirement stipulated by the UAE Central Bank is 12% andTier I minimum requirement is 8%
In a tight liquidity environment, the Bank was able to maintainits loan to deposit ratio of 101.9%, and improved its liquidityratio to 29.2% from 25.8% in 2015
Liquidity coverage ratio (LCR) at the end of 2016 stood at129%, compared to a minimum ratio of 70% prescribed by UAECentral Bank. ADCB was amongst the first banks approved bythe Central Bank to publish the LCR ratio
19.76% 18.92%
2015 2016
70%
129%
2016UAE CB requirement
Robust capital ratios and high liquidity levels maintained, CAR of 18.92% and LCR of 129%
20,864
33,059
2015 2016
101.9% 101.9%
2015 2016
25.8%
29.2%
2015 2016
Capital adequacy ratio
*Liquid assets include cash and balances with Central Banks, deposits and balances due from banks, reverse repo placements, trading securities, and liquid investments
Liquidity ratio: liquid assets/total assets
16.29%
Highlights
191
176
Tier I and core tier I ratios Risk weighted assets
15.66 %
Liquidity ratio*Loan to deposit ratiofrom customers
Liquidity coverage ratio Investment securities
Core tier I ratioAdditional tier I capital ratio
AEDbn
AEDmn
Credit risk Operational risk
Market risk
30 | Q4/FY’16 Investor presentation

AAA to AA-21%
A+ to A- 19%
BBB+ to BBB- 21%
BB+ to B- 8%
Unrated 1%
UAE Sovereign¹30%
2017 2018 2019 2020 2021 2022 2023 2024 2025 2026 2029 2030
Investment securities increased to AED 33,059 million as at 31 December2016, mainly attributable to increase in UAE government bonds.
99% of the total portfolio was invested in bonds issued by government,public sector, banks, financial institutions and corporate
Average life of the investment securities portfolio is 3.3 years
76% invested in the UAE and other GCC countries
Portfolio summary:
53% of the portfolio is invested in Government securities
Non Government Bond Portfolio – 47% of total portfolio
– Rated A- or better: 58%
– Rated Investment grade (i.e. BBB+ to BBB-): 34%
– Rated below IG (BB+ and below including unrated): 8%
Other GCCCountries11%Europe
5%
Rest of theworld 4%
Asia14%
Domestic65%
USA1%
Investment securities, 99% of total portfolio invested in bonds
By issuer
* Include corporate bonds, equity instruments and mutual funds
Highlights By region
Investments
Total bond portfolio = AED 32,564 millionCredit ratings as at 31 December 2016(Standard & Poor's, or equivalent of Fitch or Moody’s)
Maturity profile of investment securities portfolio (AED million)*
99%Invested in bonds
Government securities52%
Others*4%
BondsPublic sector22%
Bonds Banks and FI22%
76% Invested in the UAE and GCC
5,850 2,7695,595 4,420 1,9639,567 145894 1,107 39195 20
* Excluding investments in equity and funds
¹ UAE Sovereign internal rating range between grade 2-3 and map to external rating between AA to A
31 | Q4/FY’16 Investor presentation

3,376 *
2,851 *2,969
3,194
2015 2016
4,834 4,599
2015 2016
128.5%129.9%
2015 2016
3.0%2.7%
2015 2016
Dec'15 March'16 June'16 Sep'16 Dec'16
Cost of risk
Healthy asset quality metrics
Impairment allowances (Includes impairment allowances to banks)
Non-performing loan ratio
Non-performing loans (NPL) and provision coverage ratios were 2.7%and 129.9% respectively, compared to 3.0% and 128.5% as at 31December 2015Non-performing loans were AED 4,600 million compared to AED 4,834million as at 31 December 2015. Cost of risk was 0.83% compared to0.29% in 2015, reflective of our prudent approach to challenging marketconditions
Total loan impairment charges, net of recoveries amounted to AED1,552 million for 2016, which included collective impairment charges ofAED 226 millionCollective impairment allowance balance was AED 3,194 million and1.89% of credit risk weighted assets, above the minimum 1.5%stipulated by the UAE Central Bank. Individual impairment allowancebalances were AED 2,851 million as at 31 December 2016
Individual impairment Collective impairment
Highlights
Provision coverage ratio¹
¹ Excludes Dubai World exposure and related provision as the client is performing since 2011 in accordance with the new restructured terms
Non-performing loans
* Includes provision for Dubai World exposure
0.29% 0.80% 0.79% 0.80% 0.83%
AEDmn
AEDmn
32 | Q4/FY’16 Investor presentation

Summary
Operating income of AED 8.495 billion was up 3% and operating profit before impairment allowances of AED 5.700billion was up 5% over 2015
Gross interest and Islamic financing income was up 12% over 2015 at AED 8.751 billion, while asset yields remainedstrong at 4.20%.
Net interest income remained stable year on year, impacted by higher cost of funds
Non-interest income of AED 2.294 billion was up 12% year on year and comprised 27% of operating income comparedto 25% in 2015
Cost to income ratio improved to 32.9% from 34.2% in 2015
Net profit of AED 4.157 billion was 16% lower year on year due to higher cost of funds and higher cost of risk, while theBank maintained a strong ROAE of 15.7% and ROAA of 1.65% in 2016
Net loans and customer deposits grew 8% year on year, Consumer Banking loans were up 5% while Wholesale Bankingloans were up 11%*
CASA deposits comprised 42% of total customer deposits and increased 3% over 2015 to AED 65 billion
Capital ratios remained robust, with a CAR of 18.92% and Tier I of 15.66%
Healthy asset quality indicators, NPL and provision coverage ratios of 2.7% and 129.9% respectively
*Excludes loans to banks33 | Q4/FY’16 Investor presentation

Three year journey
Business overview
Macro overview
Our journey

Rating agency views
Extracts from latest reports issued by Standard & Poor’s (18 July 2016) and Fitch Ratings (4 August 2016) on ADCBNote: These quotes are excerpts from Standard & Poor’s and Fitch reports, and are qualified by the full reports which investors should refer to. Credit ratings may not reflect all risks and are subject to change at any time
“Capital ratios have improved significantly since 2010 due to a series of capital strengthening measures, including higher retained earnings.”
“The VR reflects the bank’s solid commercial franchise and improving financial metrics over the past three years, including reducing impaired loans, easing impairment changes, stable capitalization and reasonable funding and liquidity.”
“Abu Dhabi Commercial Bank (ADCB)'s business position hasstrengthened in recent years, and we have reassessed itsstand-alone credit profile (SACP) to 'bbb+' from 'bbb’.”
“Over recent years, the bank has demonstrated a track recordof improving returns, coupled with more balanced earningsgeneration across different business segments. In our view,the management team's execution capabilities are wellreflected in the bank's key financial and business metrics,which have improved substantially.”
“The stable outlook on ADCB reflects our expectation that thebank's business and financial profiles will remain largelyunchanged over the next two years, despite our expectation ofa gradual weakening of operating conditions in the United ArabEmirates.”
35 | Q4/FY’16 Investor presentation

2016 Awards
36 | Q4/FY’16 Investor presentation
“Best Brand Initiative of the Year” across Asia, Middle East and Africa
Asian Banker
“Best Property Management Team– UAE” for ADCP
Capital Finance International (CFI)
“Best Bank for Liquidity Management in the Middle East”
Global Finance
“Islamic Bank of the Year” –Sharia Compliant Window
The Banker Magazine
“Best Managed Bank in the UAE”
Asian Banker
"Best Transaction Service Bank in the Middle East"
Euromoney
“Best Retail Bank In the UAE”
Asian Banker
“Islamic Banker of the Year”
The Asset Financial Magazine
“Best Bank for Cash management in the UAE”
Global Finance
“Best Cash Manager in the UAE”
Euromoney Cash Management Survey
“SME Bank of The Year” & “UAE Domestic Technology & Operations Bank of the Year”
Asian Banking and Finance
“The Asian Banker CEO Leadership Achievement Award for the UAE”
Asian Banker
the “Best Investor Relations Website in the Middle East”
Middle East Investor Relations Association(MEIRA)
“Best Annual Report in the Middle East and South Asia” & “Best Non-
Traditional Annual Report”
ARC Awards International
“Retail Innovation of the Year” for its introduction of the Voice
Biometrics initiative “ADCB VoicePass”
Asian Banking and Finance
“Five Star Cash Manager”
Euromoney
“Best Islamic Retail Bank in UAE”
The Asset Financial Magazine

AED million 2016 2015 Change %
Cash and balances with central banks 19,262 20,180 (5)
Deposits and balances due from banks, net# 24,664 22,382 10
Reverse-repo placements 1,525 4,256 (64)
Investment securities 33,478 20,926 60
Loans and advances to customers, net 158,458 146,250 8
Other assets* 20,903 14,272 46
Total assets 258,289 228,267 13
Due to banks 3,843 1,692 127
Deposits from customers 155,442 143,526 8
Euro commercial paper 8,729 5,700 53
Borrowings 38,015 33,472 14
Other liabilities** 21,910 15,144 45
Total liabilities 227,938 199,534 14
Total shareholders’ equity 30,351 28,728 6
Non -controlling interests 0 5 NM
Total liabilities and shareholders’ equity 258,289 228,267 13
Balance sheet
Note: #Deposits and balances due from banks include AED 3.6 bn as at December 31, 2016 (AED 7.4 bn as at December 31, 2015) of loans to banks that were earlier reported under loans and advances to customers, net.
*Other assets include derivative financial instruments, investment in associate, investment properties, property and equipment (net), intangible assets.**Other liabilities include derivative financial instruments.
37 | Q4/FY’16 Investor presentation
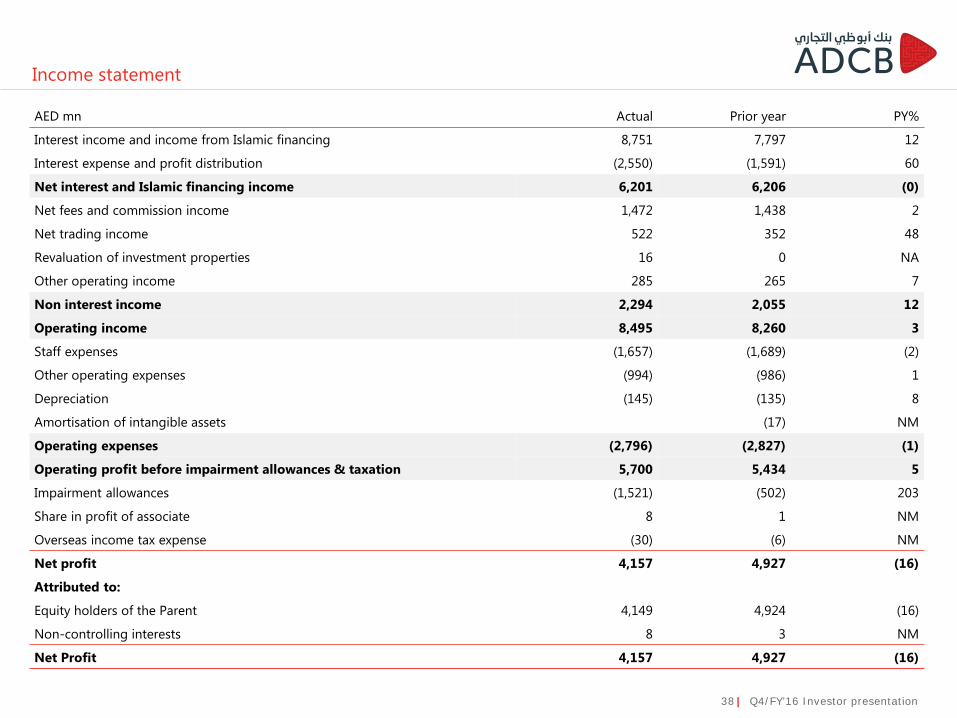
Income statement
AED mn Actual Prior year PY%
Interest income and income from Islamic financing 8,751 7,797 12
Interest expense and profit distribution (2,550) (1,591) 60
Net interest and Islamic financing income 6,201 6,206 (0)
Net fees and commission income 1,472 1,438 2
Net trading income 522 352 48
Revaluation of investment properties 16 0 NA
Other operating income 285 265 7
Non interest income 2,294 2,055 12
Operating income 8,495 8,260 3
Staff expenses (1,657) (1,689) (2)
Other operating expenses (994) (986) 1
Depreciation (145) (135) 8
Amortisation of intangible assets (17) NM
Operating expenses (2,796) (2,827) (1)
Operating profit before impairment allowances & taxation 5,700 5,434 5
Impairment allowances (1,521) (502) 203
Share in profit of associate 8 1 NM
Overseas income tax expense (30) (6) NM
Net profit 4,157 4,927 (16)
Attributed to:
Equity holders of the Parent 4,149 4,924 (16)
Non-controlling interests 8 3 NM
Net Profit 4,157 4,927 (16)
38 | Q4/FY’16 Investor presentation
ADCB Investor RelationsSheikh Zayed StreetP. O. Box: 939, Abu DhabiEmail: [email protected]: +971 2 696 2084Fax: +971 2 610 9845Internet: http://adcb.com/about/investorrelations/investor-relations.aspx