Abstract - WECC - Western Electricity Coordinating Council
56
November 25, 2020 1 Climate Influences on Capacity Expansion Planning with Application to the Western U.S. Vince Tidwell (SNL) Stuart Cohen, Ana Dyreson, Ariel Miara and Jordan Macknick (NREL) Nathalie Voisin and Sean Turner (PNNL) Abstract Electric power system planners utilize a variety of planning tools to inform decisions concerning generation and transmission additions to the electric grid, the need for operational changes, and to evaluate potential stressors on the system. Numerous factors contribute to the planning process including projected fuel and technology costs, policy and load profiles. There is also a growing recognition of the interdependency of the electric grid with other natural and engineered systems. Here we explore how future climate change and hydropower operability might influence decisions related to electricity capacity expansion planning and operations. To do so we assemble a multi-model framework. Specifically, water resource modeling is used to simulate climate impacts on future water supply for thermoelectric and hydropower generation. Separately, temperature impacts on electricity load are evaluated. Together, these climate factors spatially constrain a capacity expansion model that projects generation and transmission additions to the grid. The projected new capacity-builds are then evaluated on their operations and cost under average and extreme climate conditions using production cost modeling. This coupled framework is demonstrated on the electric grid in the Western U.S., supporting capacity expansion planning by WECC, the North American Electric Reliability Corporation (NERC) regional entity responsible for reliability assurance of the Western Interconnection. This region was selected in part because the West has high potential for renewable penetrations and is experiencing large retirements/displacements of baseload resources, primarily coal, leading to possible operational challenges in terms of changing resource mix and the need for resource flexibility. Toward this challenge, planning scenarios explored encompass a range of alternative energy, climate and drought futures. In this context we explore answers to two strategic questions: 1) How does changing climate impact least-cost electricity investment pathways (generation and transmission) and future operations, including type and capacity of new builds, system reliability, cost and environmental impacts? 2) How does the representation of hydropower in the modeling framework influence the evaluation of bulk power system operations? Results indicate that climate has a measurable influence on the amount, type, and location of new generation and transmission capacity deployed under the various climate scenarios, with up to 17 GW additional capacity needed by 2038 to meet peak loads (approximately a 6.6% increase over capacity-builds with constant historical climate conditions). The extent of additional infrastructure needs is strongly influenced by future water availability for hydropower and the potential deployment of demand response technologies. Systems designed for future climate conditions were robust under a range of electricity and water availability scenarios (including significant drought), with minimal system curtailments. Additional capacity needs due to higher load tend to increase cumulative 20-year investment and operating costs by $5–$17 billion and generation costs increase by 9 to 19%. Finally, changing the representation of hydropower flexibility has a relatively small influence on capacity expansion in the Western Interconnection through 2038, but hydropower flexibility impacts generation costs to a similar extent as climate.
Transcript of Abstract - WECC - Western Electricity Coordinating Council

November 25, 2020
1
Climate Influences on Capacity Expansion Planning with Application to the
Western U.S.
Vince Tidwell (SNL)
Stuart Cohen, Ana Dyreson, Ariel Miara and Jordan Macknick (NREL)
Nathalie Voisin and Sean Turner (PNNL)
Abstract
Electric power system planners utilize a variety of planning tools to inform decisions concerning
generation and transmission additions to the electric grid, the need for operational changes, and to
evaluate potential stressors on the system. Numerous factors contribute to the planning process
including projected fuel and technology costs, policy and load profiles. There is also a growing
recognition of the interdependency of the electric grid with other natural and engineered systems. Here
we explore how future climate change and hydropower operability might influence decisions related to
electricity capacity expansion planning and operations. To do so we assemble a multi-model framework.
Specifically, water resource modeling is used to simulate climate impacts on future water supply for
thermoelectric and hydropower generation. Separately, temperature impacts on electricity load are
evaluated. Together, these climate factors spatially constrain a capacity expansion model that projects
generation and transmission additions to the grid. The projected new capacity-builds are then evaluated
on their operations and cost under average and extreme climate conditions using production cost
modeling. This coupled framework is demonstrated on the electric grid in the Western U.S., supporting
capacity expansion planning by WECC, the North American Electric Reliability Corporation (NERC)
regional entity responsible for reliability assurance of the Western Interconnection. This region was
selected in part because the West has high potential for renewable penetrations and is experiencing
large retirements/displacements of baseload resources, primarily coal, leading to possible operational
challenges in terms of changing resource mix and the need for resource flexibility. Toward this
challenge, planning scenarios explored encompass a range of alternative energy, climate and drought
futures. In this context we explore answers to two strategic questions: 1) How does changing climate
impact least-cost electricity investment pathways (generation and transmission) and future operations,
including type and capacity of new builds, system reliability, cost and environmental impacts? 2) How
does the representation of hydropower in the modeling framework influence the evaluation of bulk
power system operations? Results indicate that climate has a measurable influence on the amount,
type, and location of new generation and transmission capacity deployed under the various climate
scenarios, with up to 17 GW additional capacity needed by 2038 to meet peak loads (approximately a
6.6% increase over capacity-builds with constant historical climate conditions). The extent of additional
infrastructure needs is strongly influenced by future water availability for hydropower and the potential
deployment of demand response technologies. Systems designed for future climate conditions were
robust under a range of electricity and water availability scenarios (including significant drought), with
minimal system curtailments. Additional capacity needs due to higher load tend to increase cumulative
20-year investment and operating costs by $5–$17 billion and generation costs increase by 9 to 19%.
Finally, changing the representation of hydropower flexibility has a relatively small influence on capacity
expansion in the Western Interconnection through 2038, but hydropower flexibility impacts generation
costs to a similar extent as climate.

November 25, 2020
2
Contents
1. Introduction .......................................................................................................................................... 3
2. Methods ................................................................................................................................................ 4
2.1. Study Scope ................................................................................................................................... 4
2.2. Scenario Description ..................................................................................................................... 6
2.3. Multi-Modeling Platform .............................................................................................................. 7
2.3.1. Hydrologic modeling for long term trends and drought ....................................................... 8
2.3.2. Capacity expansion modeling ............................................................................................... 9
2.3.3. Grid operation modeling under climate warming and significant drought ........................ 10
3. Results ................................................................................................................................................. 11
3.1. Simulated Climate Impacts ......................................................................................................... 11
3.1.1. How does climate influence electricity demands? ............................................................. 11
3.1.2. How does climate influence the water supply constraint for capacity expansion planning?
13
3.1.3. How do drought events limit water supply for grid operations? ....................................... 14
3.2. Electricity sector results .............................................................................................................. 16
3.2.1. How does climate impact projected capacity expansion and transmission expansion
planning (total capacity change, mix, location)? ................................................................................ 16
3.2.2. How does climate impact projected operations of the electric grid? ................................ 21
3.2.3. How does climate impact projected system wide costs? ................................................... 30
3.2.4. How does climate impact projected electricity-related emissions and water demand? ... 36
3.3. How Does the Representation of Hydropower in the Modeling Framework Influence Electricity
Expansion Planning and Dispatch Optimization Results? ....................................................................... 37
3.3.1. Projected impacts on capacity/transmission expansion..................................................... 37
3.3.2. Projected impacts on operation ......................................................................................... 41
4. Summary ............................................................................................................................................. 43
5. References .......................................................................................................................................... 46
1. Calibration and validation of plant-level flow to generation model ................................................... 51
2. Seasonal trends in water availability for hydro generation ................................................................ 51
3. Baseline Results without Consideration of Climate ................................................................................ 52
1.1. Demands ..................................................................................................................................... 52
1.2. Flows, disruptions to hydropower and thermoelectric power generation ................................ 52
1.3. Capacity expansion ..................................................................................................................... 52
2. Additional Results from Hydropower Flexibility Sensitivity ................................................................ 55

November 25, 2020
3
1. Introduction Changing climate will influence many drivers of electric grid investment and operation. Increasing temperatures will influence loads, increasing summer peak demand while likely decreasing winter loads (Dirks et al 2015; Sathaye et al. 2013; Allen et al. 2016; Auffhammer et al. 2017). Increasing temperatures will also reduce the capacity of transmission lines (Bartos et al 2016; Sathaye et al. 2013), transformers and substations (Sathaye et al. 2013) while also reducing the efficiency of power conversion and steam cycle cooling (Chuang and Sue 2005; Durmayaz and Sogut 2006; Ibrahim et al. 2014). Changes in precipitation patterns will affect river flows causing alterations in operations at thermoelectric plants due to limited water supply or elevated river temperatures (Bartos and Chester 2015; Van Vliet et al. 2012; Miara et al 2017; Miara et al. 2018; Henry and Pratson 2016; Henry and Pratson 2019). Changes in snowpack extent and timing of spring melt will influence when hydropower production is available and overall generation capacity (Zhou et al. 2018; Turner et al. 2017a; Van Vliet et al. 2016; Kao et al. 2015; Hamududu and Killingtveit 2012; Vicuna et al. 2011). Hydrological changes will also impact the availability of water for new development and thus challenge the siting of new thermoelectric generation (Roy et al. 2012; Sovacool and Sovacool 2009). Traditional electricity system planning uses a range of analytical and modeling tools to balance technology, market, policy, social, cultural, and environmental considerations in decision making. One approach used by the analysis community is capacity expansion modeling, where electricity system structures are represented as a set of costs and constraints in tools that seek a least-cost or most-benefit solution. Capacity expansion solutions can help direct investment and operating decisions, and they are often coupled with other assessments to consider system reliability, which includes system adequacy, stability, flexibility, resilience and others. Informed planning is critical as capital expenditures for new electricity generation and transmission infrastructure have multi-decadal life expectancies (e.g., EIA 2018a), consistent with the timeframe over which climate effects are projected to intensify (IPCC 2014; Schaeffer et al. 2012). This convergence provides a clear need for including climate change impacts into long-term capacity expansion planning. Although the potential importance of climate and water considerations has been recognized (Buras 1979) they are still not necessarily part of planning practice (NAERC 2015). Recent studies have begun to consider climate related stressors in electricity systems planning across multiple domains, using a variety of approaches. Climate related impacts on the demand of Macedonia’s energy system were explored utilizing capacity expansion modeling configured to evaluate both damages and benefits of adaptation (Taseska et al. 2012). Similarly, national energy system adaptation pathways for Brazil were assessed while climate change impacts on the availability and efficiencies of hydropower and thermoelectric power were addressed through adjusted capacity factors (de Lucena et al. 2010). Multi-model studies of capacity-builds in Brazil (Lucena et al, 2018) and Columbia (Arango-Aramburo, 2019) demonstrate the sensitivity of simulated capacity expansion decisions to both climate change and model structure and assumptions. Webster and others (2013) explored climate impacts on capacity expansion decisions for the Electric Reliability Council of Texas, where restrictions were established through arbitrary limits on water withdrawals and CO2 emissions at thermal power plants. They found that simultaneous restriction of CO2 emissions and water withdrawals required a different mix of energy technologies and higher costs than one would plan to reduce either CO2 or water alone. The Global Change Assessment Model (GCAM), a technologically-detailed integrated model of the economy, energy, agriculture, water, and climate, has been used to assess global power capacity-builds

November 25, 2020
4
under climate-influenced hydropower scenarios (Turner et al., 2017b) and has also been extended to model the electricity-water nexus at the state level in the U.S. (Liu et al. 2015). Linked hydrology-electricity system expansion modeling has also been used to explore climate impacts on the U.S. electric sector in Steinberg et al. (2020) and Miara et al. (2020), which find temperature-load impacts to be particularly influential, with complex regional tradeoffs involving water and energy resource availability. This analysis was extended by including climate related physical water constraints which projected increased cost of electricity generation, early retirement of water-intensive technologies and increased investment in low-water use technologies (Liu et al. 2019). Parkinson and Djilali (2015) demonstrated a robust optimization approach to capacity planning under climate change for the electricity system in British Columbia (BC), Canada. The coupled electricity-hydroclimate framework co-optimized system operations and capacity additions for a system consisting of eight major hydropower stations, which service more than 90 % of BC’s annual electricity demand, and other ancillary services. Sridharan et al. (2019) evaluated capacity expansion plans in Eastern Africa where considering the impact of climate change on hydropower would impact regional prices and operations with adjacent countries. Here we build upon and extend this past body of work by introducing climate-informed production cost modeling as a means of examining the operations and generation cost of projected capacity expansion plans. A multi-model framework is constructed that borrows key elements from the work of Miara et al. (2019) that integrates climate-driven hydrological, thermal power plant, and capacity expansion modeling. These tools are loosely coupled and accommodate detailed spatial representation over a large geographic extent. In this study, we expand this framework to include representation of hydropower, in both the hydrologic and capacity expansion models, and for the first time include production cost simulations to evaluate short-term operations of the capacity expansion plans under significant drought conditions. We focus on the Western Interconnection, which currently relies on hydropower to provide 25% of its
generation, albeit with significant sub-regional diversity. Simulated grid operations using a current
infrastructure have shown sensitivity to long-term changes in water availability and extreme drought
(Voisin et al. 2018) although alleviated with sub-regional diversity and power flows (Voisin et al. 2020).
In this context we explore answers to two strategic questions: 1) How does changing climate influence
electricity expansion planning (generation and transmission) and future operations, including type and
capacity of new builds, system reliability, cost and environmental impacts? 2) How does the
representation of hydropower in the modeling framework influence the evaluation of bulk power
system operations? While results are specific to the Western Interconnection, they still provide general
insight into the integration of water and climate into capacity expansion planning and their potential to
influence capital investment decisions.
2. Methods
2.1. Study Scope
Grounding the modeling framework in a real-world context is crucial for the developed product to
address problems important to industry. Here we teamed with the Western Electricity Coordinating
Council (WECC) which promotes bulk power system reliability and security in the Western
Interconnection. WECC’s footprint extends from Canada to Mexico and includes the provinces of
Alberta and British Columbia, the northern portion of Baja California, Mexico, and all or portions of the
November 25, 2020
5
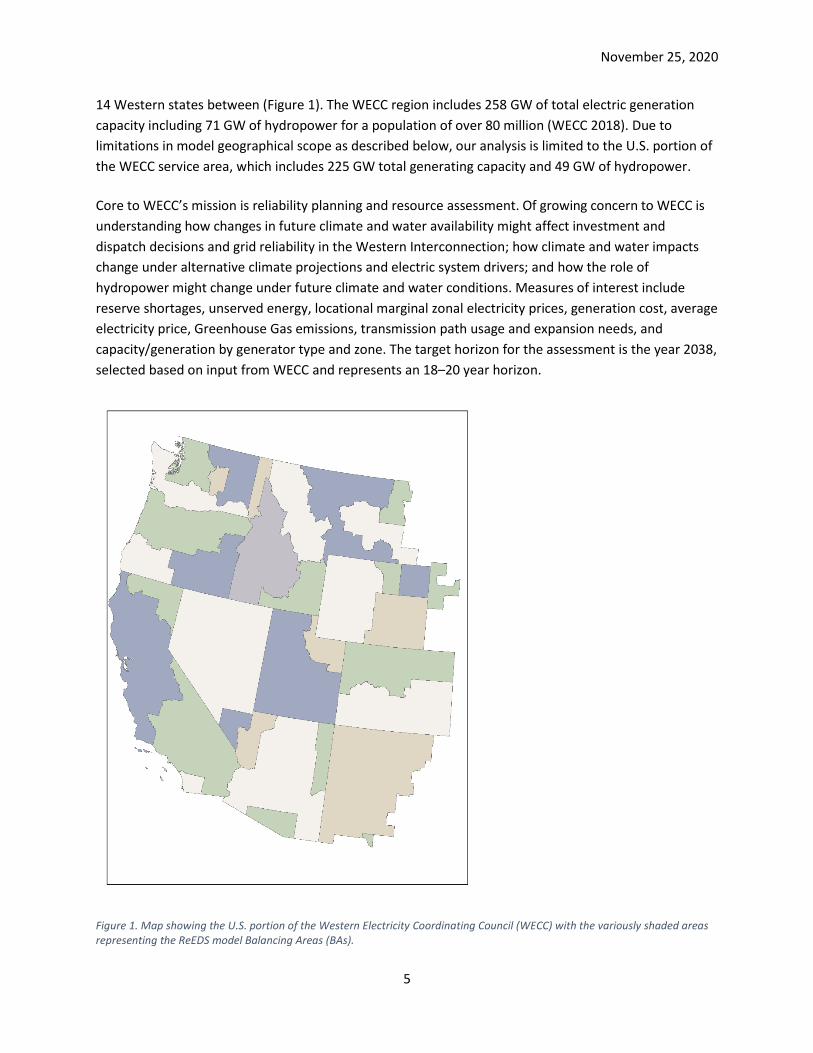
14 Western states between (Figure 1). The WECC region includes 258 GW of total electric generation
capacity including 71 GW of hydropower for a population of over 80 million (WECC 2018). Due to
limitations in model geographical scope as described below, our analysis is limited to the U.S. portion of
the WECC service area, which includes 225 GW total generating capacity and 49 GW of hydropower.
Core to WECC’s mission is reliability planning and resource assessment. Of growing concern to WECC is
understanding how changes in future climate and water availability might affect investment and
dispatch decisions and grid reliability in the Western Interconnection; how climate and water impacts
change under alternative climate projections and electric system drivers; and how the role of
hydropower might change under future climate and water conditions. Measures of interest include
reserve shortages, unserved energy, locational marginal zonal electricity prices, generation cost, average
electricity price, Greenhouse Gas emissions, transmission path usage and expansion needs, and
capacity/generation by generator type and zone. The target horizon for the assessment is the year 2038,
selected based on input from WECC and represents an 18–20 year horizon.
Figure 1. Map showing the U.S. portion of the Western Electricity Coordinating Council (WECC) with the variously shaded areas representing the ReEDS model Balancing Areas (BAs).

November 25, 2020
6
2.2. Scenario Description WECC planning is comprised of different areas of focus: near-term (0-5 years), planned (5-10 years), and
long-term (10-20 years). The focus of this study pertains to long-term. The ultimate goal of WECC long-
term planning is to inform strategic choices for planners and other stakeholders in a 20-year planning
horizon (i.e. 2038). To address uncertainties in climate, resource demands, policy, technology and other
electricity system drivers, a scenario planning approach is used. Four electricity expansion scenarios and
four alternative future climate projections were adopted, with additional scenarios to explore the range
of possible hydropower dispatch in greater detail. The four electricity scenarios are intended to span a
range of alternative infrastructure development pathways, including:
• Reference-case (REF) using demand and fuel prices from the 2018 U.S. Energy Administration
(EIA) Annual Energy Outlook (AEO) (EIA 2018b) and technology costs from the 2018 National
Renewable Energy Laboratory (NREL) Annual Technology Baseline (ATB) Mid-Cost Case (NREL
2018);
• Low variable-generation (renewables) cost case (LOW.VG.COST) that adjusts wind and solar
technology cost projections to use the 2018 ATB Low-Cost Case (NREL 2018);
• High variable-generation (renewables) cost case (HIGH.VG.COST) that adjusts wind and solar
technology cost projections to use the 2018 ATB High-Cost Case (NREL 2018); and
• High-electrification scenario (ELEC) with higher electricity demand based on transportation and
building electrification aligned with the NREL Electrification Futures Study (EFS) (NREL 2020, Sun
et al. 2020) High Technology Adoption, Moderate Technology Advancement case with moderate
demand flexibility.
Four alternative climate futures are used to assess potential impacts of changes in temperature and
water supply on electricity demand, thermoelectric power plant operations, and hydroelectric
generation. Impacts are taken relative to a fixed future for each electricity scenario where the climate is
implicitly assumed to remain constant at historical conditions. The four climate projections were
selected to capture a broad range of future temperature and precipitation trends in the Western U.S.
This was achieved with two climate scenarios for each of the moderate (RCP4.5) and extreme (RCP8.5)
emissions pathways. For RCP4.5, we use IPSL-CM5A-LR and GFDL-ESM2M climate model data, and for
RCP8.5 we use IPSL-CM5A-LR and MIROC-ESM-CHEM data. Throughout, these scenarios are referred to
as IPSL45, GFLD45, IPSL85, and MIROC85.
From these four climate scenarios three representative “drought” year conditions were selected to test
each capacity mix in 2038 with hourly production cost modeling. These include a year with significant
drought, a historic drought year and an average climate year (see Section 3.1.3). These are
complimented by three projected future load conditions, high, medium and baseline.
Finally, two additional scenarios allow an expanded assessment of hydropower dispatch outcomes by
adjusting the flexibility of dispatchable (not run-of-river) hydropower, which comprises approximately
75% of hydropower capacity in the WECC (Voisin et al. 2020). These scenarios, HIFLEX and LOFLEX, are
selected to bookend the likely range of hydropower flexibility within the existing non-pumped storage
hydropower fleet. HIFLEX allows power output at dispatchable facilities to span the full range from zero
to the maximum generating capacity and ramp from zero to maximum output within 1 hour, while

November 25, 2020
7
LOFLEX requires fixed output across monthly or seasonal durations and halves default ramp rates. Due
to differences in temporal resolution of grid operations and planning models described in Section 2.3.3,
LOFLEX is implemented such that output is constant across each month in hourly operations modeling
and each season in planning modeling.
2.3. Multi-Modeling Platform
Here we describe a multi-model framework that explicitly incorporates climate related factors into long-
term capacity expansion planning and grid operations. The framework integrates three elements:
hydrologic modeling, capacity expansion modeling, and production cost modeling (Figure 2). Analyses
begin by establishing model drivers and assumptions corresponding to each electricity and climate
scenario (e.g., Section 2.2). Hydrologic modeling (VIC-MOSART/WM) then determines for each climate
and hydrology scenario the monthly availability of hydropower across the Western Interconnection as
well as estimated changes to cooling water availability for thermal generators. Given estimated water
availability, temperature-sensitive loads, and generation technology costs, capacity expansion modeling
using the Regional Energy Deployment System (ReEDS) determines the least-cost future power sector
capacity-build that meets WECC system reliability and other requirements. Projected capacity-builds for
the year 2038 at the balancing area spatial level are then downscaled into a future generator database
for the Western Interconnection implemented into the PLEXOS electricity production cost model, which
determines the least-cost hourly operation of the system under load and reserve requirements as well
as detailed generator operating constraints. Together, this modeling platform explores climate impacts
on infrastructure planning and operation at high spatial, temporal, and process resolution. Below we
describe each model framework component.
Figure 2. Schematic of the multi-model simulation framework.
ReEDS
20 Scenarios
Climate Scenarios
Capacity Expansion
Modeling
PLEXOS
20 Scenarios
Select
Builds
Production Cost
Modeling
VIC-MOSART/WM
Drought Scenarios Hydrologic
Modeling
Load Load Climate
Projections

November 25, 2020
8
2.3.1. Hydrologic modeling for long term trends and drought Hydrological modeling is performed at two separate junctures of this study. First, it is used to support
the capacity expansion modeling in ReEDS (see Section 2.3.2) where hydrological simulations are used to
generate long-term seasonal projections of hydropower availability and thermal cooling water
availability commensurate with the four climate scenarios selected. Second, the hydrological modeling is
used to force the production-cost modeling performed in PLEXOS under significant drought and average
year conditions (see Section 2.3.3). In this study, all hydrological simulations are conducted using VIC-
MOSART-WM. The Variable Infiltration Capacity model (VIC) (Liang et al. 1994) provides spatially
distributed runoff at one eighth degree grids and at a daily temporal resolution (Brekke et al. 2013).
Runoff are routed to streamflow using the Model for Scale Adaptive River Transport with Water
Management (MOSART-WM) (Voisin et al., 2013). The WM (Water Management) component of this
model enhances the MOSART river routing ( Li et al. 2011) with human water demands and regulation
by reservoirs.
Input to ReEDS: Projections of long-term change in hydropower and thermal cooling water availability
for ReEDS are created by first driving MOSART-WM with VIC runoff derived from downscaled, bias-
corrected climate projections (Reclamation, 2013) for each of the selected GCMs (Section 2.2). We then
extract simulated, regulated river flows for grid cells associated with power plant locations. These are
aggregated to annual flows and standardized by expressing as a ratio to long-term average flow
conditions. The ReEDS model develops incremental infrastructure expansion at the scale of Balancing
Authorities (Bas), which is an intermediate scale smaller than the entire system (Figure 1). Within each
BA load must be balanced at all times, providing the desired scale for resources adequacy and reliability
studies. For each BA, standardized stream flow time series are combined as a weighted average, with
weighting based on total nameplate capacity of plants occupying each grid cell. The resulting time series
for each BA is referred to as the Water Scarcity Grid Impact Factor (WSGIF) (Voisin et al., 2016). In this
work, the WSGIF is computed separately for hydropower and thermal facilities, and the time series of
WSGIFs are smoothed with a Loess spline and rebased to the a 30-year time slice centered on 2018,
resulting in trends (% difference from baseline) in hydropower generation and thermal plant capacity
projected to 2038. These annual time series of generation constraints inform the capacity expansion
modeling.
Input to PLEXOS: To provide drought scenarios for electricity production cost modeling, monthly
estimates of energy availability are required for all non-fixed hydropower plants included in PLEXOS. To
convert monthly simulated flow to hydropower availability, a statistical approach is adopted. Using
monthly, plant-level generation data (EIA 2018a) as the training data set, a linear flow-power model is
trained for each plant and calendar month. This approach provides flexibility in the conversion of flow to
power by month, and therefore it accommodates seasonal changes in reservoir storage levels (affecting
hydraulic head) and spilled (non-powered) releases for compliance with environmental regulations.
These linear models provide adequate, flow-driven seasonal power projections at both plant and
regional scales. A year with significant drought and an average year are selected from the 800 years
simulated in the hydrological model for future use. These years are selected using a measure of WSGIF
which typically ranges from 0.3 to above 4 in highly variable regions, with the typical median value
around 1.9. We use the WSGIF to select an average year as well as a number of drought years that are
not only the most extreme overall across the West, but are also significant within each of the major
reserve regions the Western Interconnection.

November 25, 2020
9
2.3.2. Capacity expansion modeling ReEDS is an electric sector capacity expansion model for the contiguous U.S. that minimizes the cost of
investment and operation for electricity generation, transmission, and storage through a future year up
to 2050 (Cohen et al. 2018). Since its inception in 2003 it has been used in a multitude of analyses
exploring future renewable energy deployment, policies, and climate-water impacts (Miara et al. 2019;
Cole et al. 2018; DOE 2016; DOE 2019; Cole et al. 2019; Frazier et al 2019; Mai et al 2019).
ReEDS is formulated as a deterministic linear program optimization, and the 2018 version employed for
this analysis executes in 2-year solution time steps through a 2038 end year, chosen to align with
current WECC system planning studies (Cohen et al. 2018). The model is executed for the contiguous
U.S. to preserve any cross-interconnect electricity relationships, but this analysis focuses specifically on
results within the Western Interconnection. The WECC region is resolved into 35 BAs for which load and
generation resources are resolved, and these BAs are connected by an aggregated transmission system
with capacity and flow constraints. The generating fleet composition is initialized using the ABB Velocity
Suite (2017) database, which also includes data for known construction and retirements. As demand and
corresponding capacity and reserves needs rise over time, the model represents economic competition
between a suite of generation and storage technologies and can expand transmission capacity to
accommodate system needs. While this analysis uses PLEXOS for detailed study of electricity system
operation, ReEDS employs a reduced-form dispatch within each model year to better represent
electricity cost and value streams. This dispatch formulation balances supply and demand in four
chronological time slices in each season (morning, afternoon, evening, night) along with a time slice for
the average of the 40 highest summer demand hours, which allows ReEDS to better capture capacity
needs at peak demand. This chronological intra-annual time resolution incorporates consistent load and
renewable generation profiles, opportunities for diurnal energy arbitrage, and curtailment reduction by
storage systems. Variability of wind and solar resources is assessed by capacity credit calculations using
8760-hourly data, statistical estimations of curtailments, and published relationships between variable
renewable deployment and operating reserve requirements due to forecast error. This structure
updates variable generator characteristics to align with the time-varying generation portfolio, allowing
for a detailed regional look at electric sector investment decisions under a broad range of scenarios.
Climate change impacts are endogenously represented in ReEDS in several ways. For temperature
impacts, the model uses heating and cooling degree data, following the approach detailed in Miara et al.
2019, to represent temperature impacts on electricity load and power system performance. Electricity
load impacts use regressed sensitivities of load to temperature based on Sullivan and others (2015) and
McFarland and others (2015), accounting for differences in temperature sensitivity across regions and
time-of-day. Transmission capacity and power generation capacity and efficiency are also reduced for
thermal generators during summer afternoon time slices using relationships developed by ICF (1995)
and Jaglom and others (2014) ), though previous work finds these relationships to have little effect on
capacity expansion results (Steinberg et al. 2020).
Changes to water availability for thermal cooling and hydropower in the Western Interconnection utilize
VIC-MOSART-WM model output (Section 2.3.1), with results aggregated to ReEDS spatial and temporal
resolution. Thermal cooling water availability impacts are applied as constraints on surface water
availability that limit the quantity of water withdrawn across the thermal generating fleet for each
season and BA (Miara et al. 2019). Availability and cost of alternative sources of water (e.g.,
groundwater, wastewater) are provided by Tidwell and others (2014). These constraints then limit

November 25, 2020
10
electricity generation potential according to reduced water availability. Similarly, seasonal energy
availability for hydropower is adjusted over time with the changes to hydropower water availability
assessed by VIC-MOSART-WM.
Climate change impacts on future wind and solar resource availability are not represented in ReEDS.
These effects are subject to ongoing research and could potentially be implemented in the model for
future scenario analysis (Craig et al. 2018, Stengel et al. 2010).
Hydropower flexibility sensitivity scenarios are implemented in ReEDS using the existing hydropower
modeling formulation that differentiates between dispatchable and non-dispatchable hydropower using
data from the TEPPC 2024 Common Case (WECC 2013). For the HIFLEX scenarios, minimum fractional
output for dispatchable hydropower is set to zero, along with full flexibility within the seasonal energy
limits across time-slices in each season. For LOFLEX scenarios, minimum fractional output for
dispatchable hydropower is set to one, requiring fixed output across all time slices in a season at the
maximum allowable value within seasonal energy limits.
ReEDS is used to project infrastructure in the Western Interconnection through 2038 for all
combinations of electricity and climate scenarios (see Section 2.2), along with a set of baseline
simulations assuming historic climate conditions for each electricity scenario. Climate impacts are
applied after 2020 to maintain consistent historic climate conditions. The resulting 20 simulations that
serve as the basis of the generation capacity and transmission results are discussed in Sections 3.1.1 and
3.2.1. ReEDS also projects capacity expansion for HIFLEX and LOFLEX variations on each electricity
scenario with historic climate, as discussed in Section 3.3.1. A subset of these projections is then used in
detailed grid operations modeling as discussed below.
2.3.3. Grid operation modeling under climate warming and significant drought Production cost modeling simulates optimal operations of a power system by minimizing generation
cost, including energy and reserve provision. We use PLEXOS software to simulate hourly operation of
the alternative electric-system capacity-builds determined by ReEDS for the year 2038. The simulation
includes the Texas and Eastern Interconnections, but we focus our analysis on the Western
Interconnection (interaction among the interconnections is limited). We downscale the ReEDS-
determined 2038 aggregated capacity mix to facilitate plant-level unit commitment decisions in hourly
operations modeling of each BA. One exception to this procedure is the existing hydropower fleet,
which is not taken from ReEDS but is instead taken from plant-level models used in O’Connell and others
(2019) so that the plant-level capacities and baseline monthly flows are consistent with the drought
scenarios. We use a direct current-optimal power flow in the production cost model transmission
solution with transmission aggregated to 35 balancing authorities (BA) in the Western Interconnection
registered with WECC. We simulate 2038 operations in 6-month partitions, where the second 6-month
partition repeats simulations of the last two days from the first partition as a look-back to capture unit
commitment decisions that depend on the previous days. The model first solves a monthly solution,
which is approximated by a load duration curve using 40 load steps. This monthly timestep allows the
monthly hydropower generation “budget” determined by hydrology models (Section 2.3.1) to be
optimized over the course of the month, accounting for variations in load and other resources. In this
way, the monthly optimization determines daily hydropower budgets for use in the daily simulations.
Daily simulations are chronological, hourly simulations with 24 hours of look-ahead into the next day.
The look-ahead period is solved at four-hour resolution.

November 25, 2020
11
We use PLEXOS to simulate the operation of four 2038 ReEDS capacity-builds (HIGH.VG.COST,
HIGH.VG.COST.IPSL85, LOW.VG.COST, and LOW.VG.COST.GFDL45, described later). For each ReEDS
capacity-build, we simulate three load scenarios: baseline, medium, and high load. The baseline load is
the same as the ReEDS historic climate load for the year 2038. The medium and high loads are based on
projections from the IPSL85 climate scenario, which was the warmest of the four climate scenarios,
using the same air temperature drivers as in ReEDS. For a medium load, we adjust the load according to
the change in BA-level, seasonal cooling degree days for the climate year 2038. For the high load, we
calculate the same for the 2050 climate year. While the load is adjusted using the load-temperature
sensitivities used in ReEDS, the ReEDS timeslice sensitivities are smoothed over a 7-hour window to
obtain hourly temperature sensitivities.
In PLEXOS, hydropower flexibility scenarios are implemented by adjusting the more dispatchable
hydropower generation that uses monthly energy budgets (supplied by hydrology modeling) in the
HIGH.VG.COST and LOW.VG.COST electricity scenarios with historic climate. To create an inflexible fleet
(LOFLEX), we adjust the minimum stable level of each unit for each month to be equal to the monthly
energy budget divided by the number of hours per month. Therefore, each unit will run at a constant
output (minimum stable). To create a highly flexible fleet (HIFLEX), we adjust the minimum stable level
to 0 MW so that generators can turn all the way down and we adjust the ramp rate to 100% of capacity
in one hour. Therefore, each unit can ramp from 0 to maximum capacity at any time, while still limited
by the monthly energy budgets. These two bounds are likely physically unrealistic for most generators
but allow us to study the value and impact of hydropower flexibility.
3. Results
3.1. Simulated Climate Impacts
3.1.1. How does climate influence electricity demands? A general increase in temperatures, with a resulting increase in electricity load, is projected across the
West for all four climate scenarios albeit with some important variations (Error! Reference source not
found.). All models show considerable variability across regions. The greatest increases in temperature
are seen in the case of IPSL85 and MIROC85 with an increase of approximately 3.2 and 3.4 C°
respectively by mid-century relative to long-term historical conditions. Scenarios for the more moderate
Representative Concentration Pathway, IPSL45 and GFDL45, register a smaller increase at 2.2 and 2.3 C°
respectively.

November 25, 2020
12
Projected increasing temperatures impact electricity demand. Figure 4 shows the change in cooling
degree days on a summer day for each year from one of the warmer models, IPSL85, after smoothing
the annual variations, demonstrating that each of the 35 WECC balancing areas (BAs) have a unique
warming pattern. Figure 5 shows the resulting annual and summer load values aggregated from BAs to
approximate regional transmission operators (rto). Overall, average load growths range from 1 to 10%.
A majority of the load growth due to climate occurs in the rto3 (AZNM) and rto4 (CAISO) regions in the
IPSL85 model. Further, the most significant differences are between the 2010 climate and the 2038
climate; the 2050 climate load increase from 2038 is smaller.
Figure 3 Change in load across WECC for each climate impacts scenario, along with an average.
Figure 4. Change in cooling degree days for a summer day across different BAs in the WECC (IPSL85).

November 25, 2020
13
Figure 5. Projected annual (left) and summer (right) load growths for different rto areas within the WECC using the IPSL85 climate projection.
3.1.2. How does climate influence the water supply constraint for capacity
expansion planning? Impacts of climate change on water availability and annual hydropower are displayed in Figure 6
Projected changes (%) by balancing area in average streamflow at hydropower plant locations (weighted
by plant capacity) between 2018 and 2038 across the Western U.S., highlighting significant divergence in
the streamflow trends across the four GCMs selected (results compare 2038 against 2018 after
smoothing is applied). RCP4.5 scenarios are associated with relatively moderate impacts, while RCP8.5
scenarios manifest deep reductions in hydropower availability in the Southwest (IPSL85), and in Nevada
and California (MIROC85). Wetter conditions in the Pacific Northwest under this scenario mean the net
impact on hydropower availability is marginal. Seasonal results for summer and winter (see
Supplemental Information) show that hydro availability is generally trending down in summer and up in
winter—reflecting the models’ tendency to generate drier summer and wetter winter conditions.
Summer hydropower availability is reduced across nearly all regions in three out of four scenarios
(GFDL45 projects modestly increased summer hydro availability). Summer conditions in the Pacific
Northwest under MIROC85 are also drier, although wetter conditions in winter mean the net annual
impact is a modest increase in hydro.

November 25, 2020
14
Figure 6 Projected changes (%) by balancing area in average streamflow at hydropower plant locations (weighted by plant capacity) between 2018 and 2038 across the Western U.S.
3.1.3. How do drought events limit water supply for grid operations? Production cost modeling (PLEXOS) is employed to evaluate operations of the ReEDS projected capacity-
builds under alternative climate futures. To do this WSGIF time series were used to select years of
average and significant drought conditions (Figure 7). The year 2053 from the IPSL85 climate simulation
is the overall driest of the 800 water years drawn from ten GCM projections. The year 2090 from the
IPSL85 climate scenario (average year) represents the 45th percentile of all years for the Western
Interconnection as a whole. It also exhibits approximately median water conditions within each of the
major river basins. To complement the significant drought and average year, the 1977 drought was
selected for comparison so as to provide perspective of the driest historical year as measured by the
WSGIF calculated across the Western Interconnection. These three years form the basis of the average
conditions and drought scenarios used in later phases of analysis (Section 3.2.2).

November 25, 2020
15
Figure 7. Water Scarcity Grid Impact Factor (WSGIF) calculated for different subregions, years and climate models to identify extreme and average years for further analysis.
Impacts on hydropower generation associated with each selected year are shown in Figure 8,
aggregated to the county scale. The spatial distribution of impacts on hydropower are similar for the
historical drought (1977) and the projected drought (2053 IPSL85). The IPSL85 model drought is
marginally more severe, leading to sharper losses in hydropower in the Columbia River Basin
(northwest) and in the Colorado River Basin where Nevada meets Arizona. These droughts reduce total
annual hydropower in the Western Interconnection by approximately 5 – 10%.

November 25, 2020
16
Figure 8. Drought years and average year hydropower generation relative to long-term historical average (aggregated to US counties)
3.2. Electricity sector results
3.2.1. How does climate impact projected capacity expansion and transmission
expansion planning (total capacity change, mix, location)? In the West, climate-impacts on both temperature and precipitation have long-term impacts on electric
sector outcomes (Figure 9). Higher average air temperatures reduce heating loads in some subregions,
but system-wide, the associated electricity demand reduction is offest by higher cooling loads. The
resulting increase in electricity demand drives greater generating capacity needs in many scenarios due
to climate effects, up to nearly 17 GW system-wide in 2038 for the IPSL85 climate and HIGH.VG.COST
electricity scenario (~6.6% increase over historic climate case). Additional capacity needs from climate
impacts largely consist of photovoltaic (PV) and natural gas-based technologies, and both Gas-
Combustion Turbine (CT) and Gas-Combined Cycle (CC), despite substantial differences in generation
technology costs and assumptions about electrification. This consistent result arises because
temperature impacts on load are higher in peak demand periods in the summer, and the increased peak
demand relative to other time periods drives PV and gas-based technologies that provide energy and
capacity at peak. Solar resources coincide well with these higher demands, while Gas-CC provides
dispatchable energy and capacity when PV is unavailable. Gas-CT is deployed primarily for resource
adequacy purposes. Battery technology costs assumptions do not result in utility-scale battery
deployment in these scenarios, but batteries could supply similar services as Gas-CT if cost-competitive.

November 25, 2020
17
A different trend is evident with the GFDL45 scenarios as they do not consistently deploy more PV and
gas-based resources because GFDL45 precipitation levels indicates greater water availability for
hydropower generation (Figure 6 Projected changes (%) by balancing area in average streamflow at
hydropower plant locations (weighted by plant capacity) between 2018 and 2038 across the Western
U.S.). Given hydropower’s large contribution to electricity mix in the Western Interconnection,
additional hydropower availability in this scenario is able to meet temperature-induced increases in
electricity demand, largely offsetting the need for additional generating capacity. Though hydropower
capacity is constant, an additional 27–28 TWh electricity from hydropower reduces the net climate
effect on capacity to 1.4 GW (~1% increase over historic climate case) or less in these scenarios, with
ELEC.GFDL45 having a net reduction in capacity. However, the technology-specific impact of additional
hydropower is inconsisent across scenarios, with additional PV still economic in the
LOW.VG.COST.GFDL45 scenario but gas-based capacity being slightly greater in other GFDL45 scenarios.
Hydropower could play an important role in responding to future climate impacts on the Western
Interconnection, but its relationship to other technology impacts is uncertain due to the inherent
uncertainty in future water availability.
Climate impacts are also lower in the ELEC cases relative to the other electricity scenarios, with the net
change in capacity being -8.5–5.0 GW (-6 to 3% change over historic climate). A key reason is the
assumption that some fraction of electrified demand (largely transportation demand) is flexible and
controllable in response to electricity system needs. While the magnitude of and mechanisms behind
flexible electrified load is highly uncertain, this result demonstrates that flexible load could help mitigate
climate impacts on the Western Interconnection, allowing system planners to avoid new investments to
meet increased load. In some modeled scenarios, system capacity for the Western Interconnection in
2038 is actually lower with flexible electrified load. In higher-temperature scenarios where more
generation capacity is required, PV investment is preferred over gas-based capacity, with some
additional investment in storage to provide flexibility.
Figure 9. Climate impacts on Western Interconnection capacity for each climate scenario relative to the corresponding electricity
scenario without climate change impacts. Circles on plot represent net effect.

November 25, 2020
18
While system-wide changes in capacity expansion illuminate relationships between climate change,
supply-side competition, and demand effects, subregion specific changes in generating capacity are
more nuanced. These effects are discussed for a subset of electricity and climate scenarios in Figure 10
and Figure 11, which show climate effects on capacity for several technology-region-electricity-climate
combinations at the NERC subregion level. The GFDL45 and IPSL85 climate scenarios are discussed
primarily in this section because these bound climate impacts on capacity in the Western
Interconnection for all but the ELEC scenario.
Climate Effect on Gas-CC (GW) Climate Effect on Utility PV (GW)
Figure 10. Climate impacts on 2038 Gas-CC and Utility PV capacity by NERC subregion within WECC for the GFDL45 and IPSL85 climate scenarios relative to the REF, LOW.VG.COST, and HIGH.VG.COST scenarios without climate change impacts.
Figure 10 shows climate effects on Gas-CC (left panels) and PV (right panels) for all but the ELEC scenario under GFDL45 and IPSL85. For either technology, a system-wide increase (or decrease) does not necessarily mean an increase (or decrease) is observed across all regions, and there are often regions where the direction of change is opposite between the two technologies. For instance, the system-wide result in REF.GFDL45 of less PV and more Gas-CC is driven largely by results in the Desert Southwest and Southern California, with other regions such as the Pacific Northwest and Great Basin having additional

November 25, 2020
19
PV and less Gas-CC. Throughout, any climate-induced increase in PV tends to occur in the Pacific Northwest or Great Basin regions with climate effects often reducing PV capacity in areas with better PV resource, suggesting these regions must prioritize flexibility in response to climate induced load.
These results begin to highlight the complex interplay involved in regional climate impacts on the electric sector. Water availability, fuel and technology costs, transmission constraints, and even local policy can interact with regional differences in climate to generate variability in how climate change could influence regional electric sector outcomes.
Consistent with system-wide outcomes, the ELEC scenario has relatively small sub-regional climate
impacts on Gas-CC deployment, but sub-regional PV effects are highly variable (Figure 11). While
GFDL45 has less PV overall, there are small increases in the Pacific Northwest and Desert Southwest
regions. In contrast with other electricity scenarios under most climate futures, PV capacity is greater in
the Desert Southwest in all ELEC climate variations. This result suggests that flexible demand able to
respond to system needs facilitates additional PV adoption and mitigates the competition between PV
and Gas-CC observed in other scenarios. Conversely, PV in the Great Basin is often lower, and other
subregions have inconsistent effects across climate scenarios. Sub-regional variability in PV outcomes
for the ELEC scenario demonstrates the increased uncertainty introduced by demand flexibility and how
it could both mitigate and confound expected climate effects on electricity planning.
Climate Effect on Utility PV (GW)
Figure 11. Climate impacts on 2038 Utility PV capacity by NERC subregion within WECC for each climate scenario relative to
the ELEC scenario without climate change impacts.
With no direct climate impacts on wind resource potential, climate effects on regional wind deployment
are small for most electricity-climate scenario combinations, with Figure 12 demonstrating low-
magnitude impacts in REF alongside the LOW.VG.COST scenario, the only electricity scenario with
consistently large climate impacts on wind deployment. While the LOW.VG.COST scenario has
the greatest wind deployment before applying climate impacts, climate effects create a load shape with
a greater peak-to-base load difference, which deviates from typical wind profile shapes in the central
plains where wind is typically stronger in off-peak times. Climate effects sometimes result in increased in
wind capacity in the Desert Southwest and California with LOW.VG.COST, but only the IPSL45 scenario
(see SI) has an increase in wind capacity elsewhere.
Climate Effect on Wind (GW)

November 25, 2020
20
Figure 12. Climate impacts on 2038 wind capacity by NERC subregion within WECC for the GFDL45 and IPSL85 scenarios relative to the REF and LOW.VG.COST scenarios without climate change impacts.
The bulk electricity transmission system can also respond to climate impacts and the resulting generating capacity outcomes. Figure 13 shows total bulk transmission system capacity in the Western Interconnection in 2038 for all scenarios. Climate impacts on transmission capacity are relatively small throughout, with a maximum change of approximate 3 GW (1.6%). The direction of change is inconsistent, even for a given electricity scenario. The LOW.VG.COST scenario typically builds additional transmission with climate impacts, as does REF aside from the GFDL45 climate future. HIGH.VG.COST has higher transmission investment with climate impacts, though the magnitude never exceeds 0.8 GW. Outcomes are mixed in ELEC, consistent with the range of generating capacity outcomes. Transmission impacts are often related to variable renewable penetration, with scenarios having greater PV with climate change often having larger increases in transmission builds. The GFDL45 scenario often has reduced transmission needs as an indirect consequence of increased hydropower availability.
Transmission impacts at the NERC subregional level (Figure 14) are typically 1–2 GW or less, and impacts are highly variable across scenarios. For instance, climate impacts on transmission in the great basin are very sensitive to electricity scenario, with notable transmission increases in LOW.VG.COST and REF but reductions in HIGH.VG.COST and ELEC. This result is consistent with variability in great basin PV and wind deployment, and it also reflects observed changes in power flows from the great basin region to the desert southwest, particularly the BA containing Las Vegas in summer time periods. The direction of climate impact on transmission capacity is also variable for the Pacific Northwest. However, for a given electricity scenario, the direction of climate impacts is most often the same across the four climate scenarios. Some regions also have minimal climate impacts on transmission in these scenarios, namely the Rocky Mountain and Northern California regions.
Climate impacts on transmission are variable both system-wide and within individual regions, with the important result that this uncertainty can be considered in long-term transmission planning to have a better understanding of the range of possible grid outcomes.

November 25, 2020
21
Figure 13. Transmission capacity in the Western Interconnection in 2038 for climate and reference scenarios.
REF LOW.VG.COST HIGH.VG.COST ELEC
Figure 14. Differences in NERC regional transmission expansion by WECC region where the transmission capacity begins, for each climate scenario relative to the corresponding scenario without climate impacts. [nr1=northwest, nr2=great basin, nr3=rocky mtn, nr4=norcal, nr5=socal, nr7=desert southwest.
3.2.2. How does climate impact projected operations of the electric grid? PLEXOS simulations were performed to explore climate impacts on system operations in the Western
Interconnection. We explore operational changes from two angles. To understand the sensitivity of a
given infrastructure to climate conditions, we explore how different capacity-builds from ReEDS perform
under drought and heat compared to their performance under ‘normal’ water conditions and without
adjusting electricity loads for climate. This highlights how different power systems adapt to climate. We
refer the baseline condition for PLEXOS as IPSL 2090 water conditions and 2038 load unadjusted for
warming. To understand the importance of climate foresight in the infrastructures, we also compare
the performance of climate-informed ReEDS build outs to build outs that are not climate informed.
Because of the large number of scenarios only a subset of cases were simulated and analyzed. To select
bounds on possible future infrastructure and climate impacts, we chose the HIGH.VG.COST.IPSL85 and
LOW.VG.COST.GFDL45 scenarios, all in the 2038 year, along with the HIGH.VG.COST and LOW.VG.COST
infrastructures under historic climate. These cases exhibit some of the greatest and most diverse

November 25, 2020
22
differences in capacity-builds between climate and historical climate driver (Figure 9). The installed
capacity and total generation of each of the four capacity builds for the baseline condition (average
water year and baseline load) are shown in Figure 15 and Figure 16.
First, we explore how consideration of climate (climate foresight) in the four capacity-builds impacts the
response of grid operations to drought and heat. We found that the HIGH.VG.COST scenarios
compensated for drought and increased load almost entirely with Gas-CCs (Figure 17; upper left). This
result is consistent with studies that examine drought for historical infrastructures dominated by
thermal generation (Gleick 2016; O’Connell et al. 2019). The LOW.VG.COST scenarios, with higher
renewable penetration, compensated for drought and heat with Gas-CCs and also curtailed less wind
and solar and had more Gas-CT, and Coal generation in 2038 operations (Figure 17; lower left). The
HIGH.VG.COST.IPSL85 capacity-build from ReEDS has similar drought- and heat-forced generation
changes to the HIGH.VG.COST scenario except that even in the baseline conditions (average water and
baseline load), the additional solar capacity compared to no climate foresight means that there is more
solar generation (and some wind and Gas-CT) and less Gas-CC generation (Figure 17; upper right). The
LOW.VG.COST.GFDL45 capacity-build from ReEDS behaves similar to the LOW.VG.COST capacity-build
but the LOW.VG.COST.GFDL45 capacity-build has less wind and more solar, so compared to the
LOW.VG.COST baseline condition, its generation mix reflects the same in all conditions (less wind, more
solar, Figure 17; lower right).We focus further analysis on the differences in generation between historic
climate and the drought- and heat-forced operation for the HIGH.VG.COST and LOW.VG.COST scenarios
without climate foresight.
Figure 15 The installed capacity for the HIGH.VG and LOW.VG scenarios (with and without climate foresight) after translation of the ReEDS zone level capacities into individual power plant capacities for PLEXOS.

November 25, 2020
23
Figure 16 The generation for the HIGH.VG and LOW.VG scenarios (with and without climate foresight in ReEDS) using baseline load and IPSL85 2090 water (“average”) conditions for PLEXOS operations.
Figure 17: The change in generation relative to the no-foresight build out under baseline hydrology and load are shown under five different drought and heat conditions for each of the four infrastructures modeled in PLEXOS. The top two rows are relative to HIGH.VG.COST without climate foresight and the bottom two rows are relative to LOW.VG.COST without climate foresight.
Changes by generation type can be further delineated at the regional level, presented here by Regional
Transmission Operator (RTO) region (Figure 18). Change in hydropower availability are mostly within
Bonneville Power Administration (BPA) (rto1) and the California Independent System Operator (CAISO)
(rto4). Changes in load are largely in Arizona-New Mexico (AZNM) (rto3) and CAISO. Compensation for
these changes occurs in all regions, though minimally in the Rocky Mountain Power Pool (RMPP) (rto5).
In the HIGH.VG.COST system, loss of hydropower in BPA (rto1) is directly offset by increased Gas-CC
output in BPA. Gas-CC usage increases in AZNM and CAISO as well to compensate the loss of
hydropower availability and increased load. In the LOW.VG.COST system, the same drought and load
stressors are compensated for by a larger mix of generation types and in a more spatially distributed
way.
November 25, 2020
24
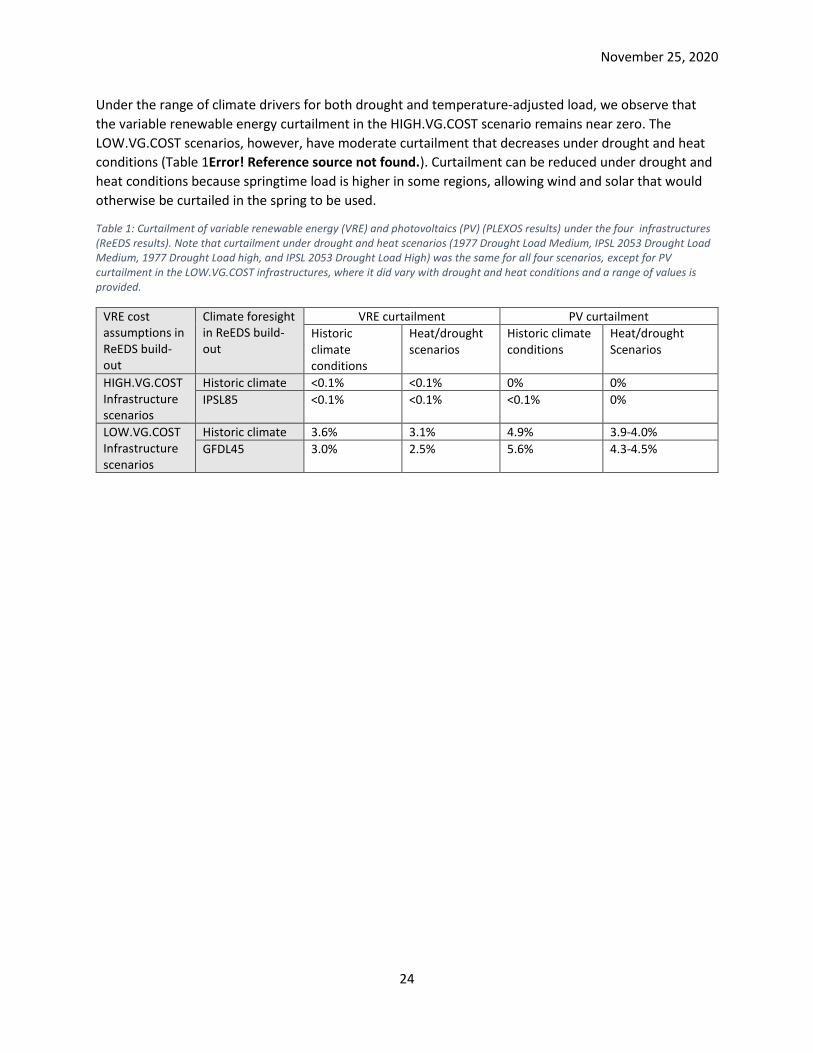
Under the range of climate drivers for both drought and temperature-adjusted load, we observe that
the variable renewable energy curtailment in the HIGH.VG.COST scenario remains near zero. The
LOW.VG.COST scenarios, however, have moderate curtailment that decreases under drought and heat
conditions (Table 1Error! Reference source not found.). Curtailment can be reduced under drought and
heat conditions because springtime load is higher in some regions, allowing wind and solar that would
otherwise be curtailed in the spring to be used.
Table 1: Curtailment of variable renewable energy (VRE) and photovoltaics (PV) (PLEXOS results) under the four infrastructures (ReEDS results). Note that curtailment under drought and heat scenarios (1977 Drought Load Medium, IPSL 2053 Drought Load Medium, 1977 Drought Load high, and IPSL 2053 Drought Load High) was the same for all four scenarios, except for PV curtailment in the LOW.VG.COST infrastructures, where it did vary with drought and heat conditions and a range of values is provided.
VRE cost assumptions in ReEDS build-out
Climate foresight in ReEDS build-out
VRE curtailment PV curtailment
Historic climate conditions
Heat/drought scenarios
Historic climate conditions
Heat/drought Scenarios
HIGH.VG.COST Infrastructure scenarios
Historic climate <0.1% <0.1% 0% 0%
IPSL85 <0.1% <0.1% <0.1% 0%
LOW.VG.COST Infrastructure scenarios
Historic climate 3.6% 3.1% 4.9% 3.9-4.0%
GFDL45 3.0% 2.5% 5.6% 4.3-4.5%

November 25, 2020
25
Figure 18: The change in generation under drought and heat drivers compared to average climate (IPSL85 2090) conditions for HIGH.VG.COST (left column) and LOW.VG.COST (right column) scenarios by region (rto).

November 25, 2020
26
Next, we explore how climate impacts hourly grid operations under increased load and drought
conditions. Impacts on different components of the generation fleet can be observed in duration curves
of fleet-level capacity factor. We define fleet-level capacity factor here as generation divided by
available capacity for all generators of four generator types (Coal, Gas-CT, Gas-CC, Hydro). Duration
curves show the hourly capacity factors sorted from highest to lowest, allowing us to examine the hourly
operation at a high level. Among fossil-fueled generator types in the HIGH.VG.COST scenarios, only the
Gas-CC fleet capacity factor is impacted by drought and temperature-adjusted load in most hours; coal
capacity factor is relatively high already in the baseline scenario (2090 ‘average’ hydro availability and
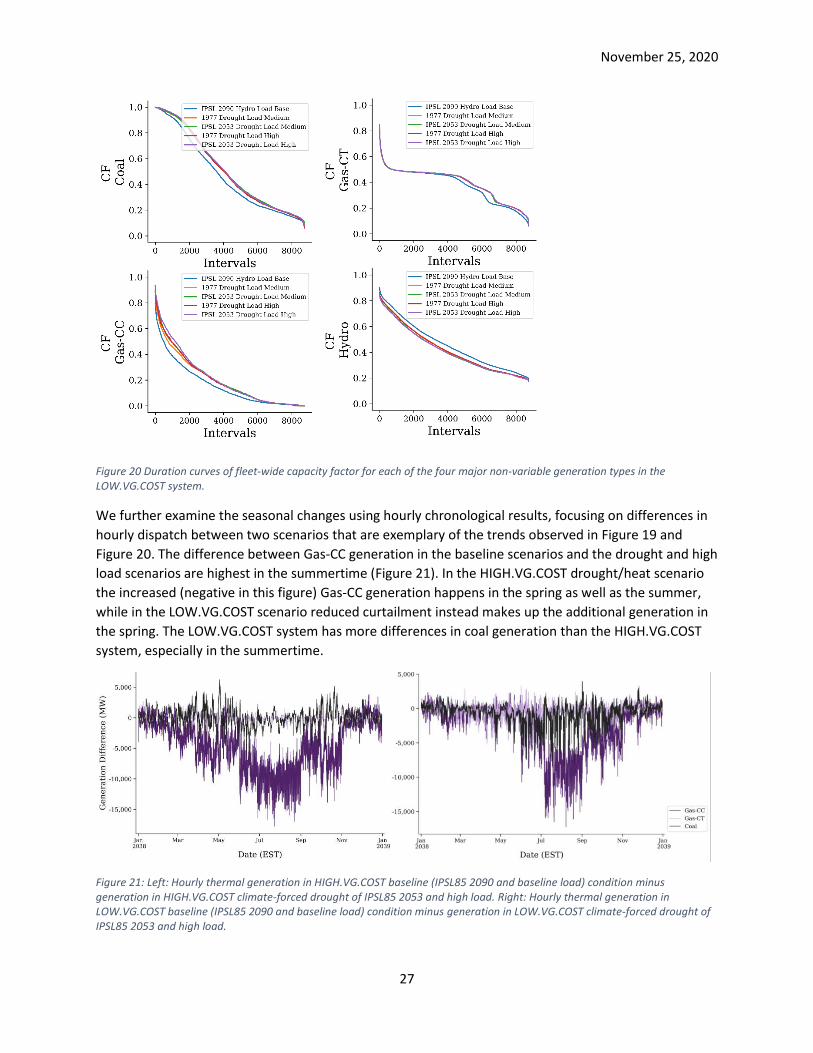
baseline load) and does not change under these scenarios (Figure 19). In the LOW.VG.COST scenarios,
the Coal and Gas-CT fleet are impacted by drought and load as well (Figure 20). Coal and Gas-CC impacts
occur in most hours of the year, while Gas-CT’s are affected only during times of lower fleet-wide
capacity factor.
Figure 19: Duration curves of fleet-wide capacity factor for each of the four major non-variable generation types in the HIGH.VG.COST system.
November 25, 2020
27
Figure 20 Duration curves of fleet-wide capacity factor for each of the four major non-variable generation types in the LOW.VG.COST system.
We further examine the seasonal changes using hourly chronological results, focusing on differences in
hourly dispatch between two scenarios that are exemplary of the trends observed in Figure 19 and
Figure 20. The difference between Gas-CC generation in the baseline scenarios and the drought and high
load scenarios are highest in the summertime (Figure 21). In the HIGH.VG.COST drought/heat scenario
the increased (negative in this figure) Gas-CC generation happens in the spring as well as the summer,
while in the LOW.VG.COST scenario reduced curtailment instead makes up the additional generation in
the spring. The LOW.VG.COST system has more differences in coal generation than the HIGH.VG.COST
system, especially in the summertime.
Figure 21: Left: Hourly thermal generation in HIGH.VG.COST baseline (IPSL85 2090 and baseline load) condition minus generation in HIGH.VG.COST climate-forced drought of IPSL85 2053 and high load. Right: Hourly thermal generation in LOW.VG.COST baseline (IPSL85 2090 and baseline load) condition minus generation in LOW.VG.COST climate-forced drought of IPSL85 2053 and high load.

November 25, 2020
28
There is a small decrease in storage (mostly pumped hydropower) used in CAISO for all drought/heat
scenarios compared to the historic climate scenario (see Figure 18). The change is persistent through
climate scenarios, so it is interesting to investigate though small. In the HIGH.VG.COST scenario, storage
usage is variable between the two scenarios (baseline IPSL 2090 water and baseline load versus climate
forcing IPSL85 water and high load), but is generally higher in the historic climate scenario (positive in
Figure 22). In the LOW.VG.COST scenario storage is relatively equal between the historic and climate-
forced scenarios in all seasons except the summer, when generation from storage is reduced in the
drought and high load scenarios. One reason for this seasonal change is that the increase in thermal
generation online requires less storage to handle hourly changes in load and VRE.
Figure 22 Left: Hourly storage discharge in HIGH.VG.COST baseline (IPSL85 2090 and baseline load) condition minus discharge in HIGH.VG.COST climate-forced drought of IPSL85 2053 and high load. Right: Hourly storage discharge in LOW.VG.COST baseline (IPSL85 2090 and baseline load) condition minus discharge in LOW.VG.COST climate-forced drought of IPSL85 2053 and high load.
Hourly dispatch stacks provide insight into exactly how the system is operating during the times when
climate causes the largest differences in generation. The period of July 11-17 (Figure 23) is an example
of consistently higher Gas-CC generation.
Figure 23: Example dispatch stack for LOW.VG.COST baseline scenario and climate-forced drought and heat scenario.

November 25, 2020
29
. We did not perform a full reliability assessment in this study, which would include probabilistic
assessments of unserved energy and AC powerflow representations. We can however comment on the
robustness of system under the specific conditions we simulated. Over 99.999% of load is met in the 20
PLEXOS simulations of the Western Interconnection. There are small amounts of unserved load in two
modeled scenarios; this unserved load occurs during two hours in late July. This unserved load is an
artifact of the model, in reality, grid operations would respond to meet load. Over 99.96% of reserves
are met in the PLEXOS simulations. These metrics indicate that, under the assumptions of the production
cost model, climate drivers and drought scenarios do not result in dropped load in the future conditions
we simulated. Note that this production cost model assumes that operation is optimized throughout the
entire Western Interconnection and that the system has perfect foresight into the load, wind, and solar
generation one day ahead. Transmission is aggregated to the zonal level. This is also an hourly
production cost model, and additional insight in short term operation could be obtained from subhourly
market simulations, but we do not expect subhourly simulations to significantly change the impact of
the relatively longer term drivers of drought and warming temperatures under climate.
We can also assess system robustness through the available thermal capacity after generation needs are
met. We consider this one measure of the ability of the system to respond to further stressors. Figure 24
shows the available capacity after outages are accounted for and generation needs are met by thermal
generator type for each of the four infrastructures in one of the more severe operational scenarios: IPSL
2053 Hydro and High Load. The Gas-CC availability is most variable and depends on climate foresight.
The duration curve shows that during all hours the Gas-CC capacity available is higher in the
HIGH.VG.COST IPSL85 build-out which incorporates IPSL85 climate foresight compared to the build-out
with no foresight. This additional buffer persists during the more constrained hours. In the
LOW.VG.COST scenarios, Gas-CC availability varies less between GFDL45 and no climate foresight
scenarios, but we did not simulate the LOW.VG.COST scenario under the IPSL85 driver, which was
warmer and wetter than GFDL45 and drove a higher capacity build out (Figure 9).
Figure 24: Duration curves of available capacity (after meeting generation needs) of major thermal generation types in the operational scenario which has a drought from IPSL 2053 and the high load case.
Like available thermal capacity, curtailed PV and wind can also be a source of flexibility. In the
HIGH.VG.COST scenarios curtailment was negligible, but in the LOW.VG.COST scenarios there were
2,000 to 3,000 hours with some curtailment (Figure 25).

November 25, 2020
30
Figure 25: Curtailment duration curves for each infrastructure in the operational scenario which has IPSL 2053 drought and high load case. Note that HIGH.VG.COST curtailment is negligible.
3.2.3. How does climate impact projected system wide costs? The system-wide economic impact of these climate scenarios over the period of 2018 to 2038 is shown
by Figure 26, which uses the ReEDS capacity-builds to calculate a present value of all investment and
operating costs for the Western Interconnection . The left panel shows total costs for the historic
climate scenarios, while the right panel then shows climate impacts on costs across climate-forced
scenarios relative to the corresponding historic climate electricity scenario.
Total costs are similar across REF and the VG.COST scenarios, while higher electricity demand in ELEC
leads to higher baseline costs. Climate impacts on system costs reflect the combined influence of
temperature, water availability, and demand flexibility. Costs are slightly lower in the ELEC scenario for
all climate futures relative to ELEC.HISTORIC, demonstrating the value of demand flexibility even when
in opposition to temperature-induced load growth. Climate effects reduce system costs under the
GFDL45 case for all electricity scenarios due to the increased availability of low-cost hydropower
reducing both fuel costs and capital costs for new capacity to meet higher electricity demand. For all
other electricity-climate scenarios, temperature-induced generation capacity needs drive costs higher by
up to $5–$17 billion. Ultimate climate impacts on total long-term system costs are thus uncertain, with
the outcome dependent on technology innovation in addition to climate trends.
-20
-15
-10
-5
0
5
10
15
20
ELE
C
HIG
H.V
G.C
OS
T
LO
W.V
G.C
OS
T
RE
F
Syste
m C
ost (B
illio
n 2
01
8$)
GFDL45
IPSL45
IPSL85
MIROC85

November 25, 2020
31
Figure 26. Present value of all 2018–2038 Western Interconnection costs without climate impacts, along with the change in cost results with climate impacts.
Figure 27 presents a marginal cost of energy metric over time from 2020 to 2038 for all twenty ReEDS
simulations. This result is an indicator of competitive wholesale electricity prices, though it does not
capture all price components in a true electricity market. Marginal cost of energy trends are driven
primarily by the electricity scenario, with relatively little variation across climate scenarios for a given
electricity future. Marginal costs are typically determined by the variable operating cost of the marginal
generating technology, typically natural gas, so these trends largely follow natural gas prices in each
scenario. Across all years and scenarios, climate effects range from -2.9–3.3 2018$/MWh.
Figure 27. Change over time of the ReEDS marginal cost of electrical energy metric, as a load-weighted average across BAs.
Operating costs from hourly 2038 simulations in PLEXOS also reveal economic impacts of future climate
and drought conditions. PLEXOS production costs include only the generation costs such as fuel costs,
variable O&M, and start-up costs. Figure 28 shows the production costs by generator type for each
infrastructure under the baseline conditions (water availability according to IPSL 2090 and baseline load
unadjusted for heat). The HIGH.VG.COST scenario with climate foresight using IPSL85 is about 2% less
expensive to operate than that without climate foresight mostly because of the increase in wind and
solar capacity and generation. The LOW.VG.COST scenario with climate foresight using GFDL45 is about
4% more expensive to operate mostly because of the decrease in wind capacity and associated net
decrease in VRE generation (though solar generation increases). In production cost modeling
simulations, drought and heat increase production cost predictably by increasing thermal generation
(Figure 29). In the lower renewable (HIGH.VG.COST; Figure 29 upper left) scenarios, fuel costs for natural
Gas-CC make up the majority of the cost increase. In the high renewable (LOW.VG.COST; Figure 29 lower
left) systems, Gas-CC and Coal comprise the fuel cost increase. The magnitude of the cost increase in
LOW.VG.COST is smaller than in the HIGH.VG.COST infrastructure because the natural gas prices are
lower due to price response to reduced electric sector demand, and because much of the system
responds to load and drought stress by decreasing wind and PV curtailment. The right panels of Figure
29 follow the trends described in the right panels of Figure 17 based on the differences in the build-outs
with climate foresight. Table 2 shows the generation costs for each scenario. The generation cost
implications of climate foresight in the build-out, holding operational conditions static, are -2 to +4%
(Table 3). The generation cost increase from drought and heat, holding the infrastructure static, ranges
0
10
20
30
40
50
60
2020
2024
2028
2032
2036
Ma
rgin
al C
ost of E
nerg
y (
2018$/M
Wh)
ELEC.GFDL45
ELEC.IPSL45
ELEC.IPSL85
ELEC.MIROC85
ELEC.HISTORIC
HIGH.VG.COST.GLDL45
HIGH.VG.COST.IPSL45
HIGH.VG.COST.IPSL85
HIGH.VG.COST.MIROC85
HIGH.VG.COST.HISTORIC
LOW.VG.COST.GFDL45
LOW.VG.COST.IPSL45
LOW.VG.COST.IPSL85
LOW.VG.COST.MIROC85
LOW.VG.COST.HISTORIC
REF.GFDL45
REF.IPSL45
REF.IPSL85
REF.MIROC85
REF.HISTORIC

November 25, 2020
32
from 9–19%; the highest cost increases as a percent of historic-climate costs are in the LOW.VG.COST
scenarios, while the highest cost increases in absolute terms are in the HIGH.VG.COST scenarios. Table 4
provides the generation cost changes due to operational conditions (drought and heat) for each ReEDS
capacity-build simulated in PLEXOS.
Figure 28: Total generation cost by generator type under baseline condition (which is IPSL85 2090 climate hydro and baseline load) operation.

November 25, 2020
33
Figure 29 The change in generation cost relative to the no-foresight build out under baseline hydrology and load are shown under five different drought and load conditions for each of the four infrastructures modeled in PLEXOS. The top two rows are relative to HIGH.VG.COST without climate forcing and the bottom two rows are relative to LOW.VG.COST without climate forcing.
Table 2: The generation cost for each PLEXOS simulation including all combinations of four infrastructures and five drought/heat conditions.
Infrastructure Operational condition for drought and heat
IPSL 2090 Hydro, Base Load
1977 Hydro, Load Medium
IPSL 2053 Hydro, Load Medium
1977 Hydro, Load High
IPSL 2053 Hydro, Load High
HIGH.VG.COST 9,674 10,593
10,720
10,663
10,790
HIGH.VG.COST IPSL85
9,437
10,356
10,486
10,428
10,554
LOW.VG.COST 3,319
3,773
3,872
3,836
3,939
LOW.VG.COST GFDL45
3,463
3,923
4,025
3,978
4,082
Table 3: Generation cost changes from PLEXOS operational model. Generation cost changes are relative to the operation modeled in PLEXOS under the same conditions compared to a build-out that did not have climate foresight.
VRE cost assumptions in ReEDS build-out
Climate foresight Absolute change in PLEXOS generation cost due to climate foresight in ReEDS build-out (Million $)
Relative change in PLEXOS generation cost due to climate foresight in ReEDS build-out (%)
HIGH.VG.COST Historic climate versus IPSL85
-234 to -236 -2.2 to -2.4%
LOW.VG.COST Historical climate versus GFDL45
142 to 154 3.6 to 4.3%
Table 4: Generation cost changes due to drought and heat conditions from PLEXOS operational model. Generation cost changes are relative to the operation of the same infrastructure under baseline conditions for PLEXOS (i.e. IPSL 2090 water availability and 2038 baseline load without climate warming).
VRE cost assumptions in ReEDS build-out
Climate foresight in ReEDS build-out
Absolute change in generation cost due to drought/heat from PLEXOS (Million $)
Relative change in generation cost due to drought/heat from PLEXOS (%)
HIGH.VG.COST
historic climate 919-1,116 9-12%
IPSL85 919-1,117 10-12%
LOW.VG.COST
Historic climate 453-620 14-19%
GFDL45 460-618 13-18%
We explore the generation cost changes further by regional transmission operator (RTO, or “rto” in
figure labels) for the HIGH.VG.COST and LOW.VG.COST capacity-builds (Figure 30). Note that the related
climate-forced capacity-builds are similar (not shown). Regional cost changes in Figure 30 reflect

November 25, 2020
34
generation changes in Figure 18, except highlighting that cost changes mostly reflect natural gas prices
through Gas -CC usage and incorporating differences in natural gas prices from the LOW.VG.COST and
HIGH.VG.COST scenarios.

November 25, 2020
35
Figure 30 The change in generation cost under climate drivers compared to average climate and baseline load conditions for HIGH.VG.COST (left column) and LOW.VG.COST (right column) scenarios by region (rto).

November 25, 2020
36
3.2.4. How does climate impact projected electricity-related emissions and
water demand? While not as resolved as PLEXOS, the reduced-form dispatch in ReEDS demonstrates long-term trends in
other environmental outcomes such as CO2 emissions and water use. Figure 31 shows system-wide CO2
emissions per year throughout 2020–2038 for all electricity-climate scenarios. In this time frame, the
climate scenarios have relatively little impact on CO2 emissions, with only the LOW.VG.COST scenario
having climate scenarios deviating more than 6% from the historic climate case in a given year. While
higher temperatures increase demand, CO2 emissions are often lower due to some combination of (1)
additional hydropower generation in wetter climate conditions, or (2) displacement of coal generation
by additional Gas-CC and PV built to supply growing peak demands. This result is significant for the
Western Interconnection and can be partially attributed to its relatively low emissions intensity today,
as other systems might instead see higher CO2 emissions due to increased electricity demand under
climate change.
Figure 31. Change over time of CO2 emissions in the Western Interconnection using the ReEDS operating solution.
ReEDS also endogenously accounts for power sector water withdrawal and consumption, which is
reported for this study in Figure 32. Water withdrawals fall abruptly in the near-term (~74%) due to
announced nuclear plant retirements, with a further reduction in LOW.VG.COST scenarios because these
scenarios result in additional coal retirements from low utilization. Water consumption trends are
determined by future deployment and use of Gas-CC, which uses recirculating cooling in the model1.
HIGH.VG.COST and ELEC have higher water consumption than REF scenarios beyond 2030 due to greater
Gas-CC usage, and LOW.VG.COST has lower consumption (~40% decrease) due to limited Gas-CC growth
and additional coal retirements.
As with CO2 emissions, climate impacts do not have substantial effects on aggregate water system
outcomes. Additional hydropower and displaced coal generation can reduce water use, but water
consumption can increase in scenarios with additional Gas-CC capacity. Assuming once-through cooling
is not installed with new capacity, power sector water withdrawals in the Western Interconnection
1 New capacity may use dry cooling as well, but the least-cost optimization rarely if ever chooses this option due to higher costs and reduced plant efficiency.
0
50
100
150
200
250
300
2020
2024
2028
2032
2036
CO
2E
mis
sio
ns
(mill
ion m
etr
ic tons)
ELEC.GFDL45
ELEC.IPSL45
ELEC.IPSL85
ELEC.MIROC85
ELEC.HISTORIC
HIGH.VG.COST.GLDL45
HIGH.VG.COST.IPSL45
HIGH.VG.COST.IPSL85
HIGH.VG.COST.MIROC85
HIGH.VG.COST.HISTORIC
LOW.VG.COST.GFDL45
LOW.VG.COST.IPSL45
LOW.VG.COST.IPSL85
LOW.VG.COST.MIROC85
LOW.VG.COST.HISTORIC
REF.GFDL45
REF.IPSL45
REF.IPSL85
REF.MIROC85
REF.HISTORIC

November 25, 2020
37
should fall as large once-through cooled plants retire, while water consumption outcomes could depend
on the relative competitiveness of Gas-CC with wind and PV technologies.
Figure 32. Change over time of water withdrawal and consumption in the Western Interconnection from the ReEDS operating solution.
3.3. How Does the Representation of Hydropower in the Modeling Framework
Influence Electricity Expansion Planning and Dispatch Optimization Results?
3.3.1. Projected impacts on capacity/transmission expansion We assess the effect that varying hydropower flexibility as described in Section 2.3.2 has on electric
sector investment decisions for each of the four electricity scenarios under historic climate conditions.
Cross-sensitivity scenarios combining flexibility and climate variations is outside the scope of this work
but could be considered for future work to understand relationships between hydropower operability
and climate variations when making planning decisions.
The effect of varying hydropower flexibility depends on the electricity scenario as shown in Figure 33,
which is plotted on a similar scale as Figure 9 for comparison. In 2038, net impacts on capacity are small
for all flexibility scenarios, but technology-specific effects in LOW.VG.COST and ELEC have a similar order
of magnitude as climate effects. Changing hydropower flexibility has relatively limited impact on the
generating capacity in the REF and HIGH.VG.COST scenarios, except for a reduction in PV and overall
capacity in the REF.LOFLEX scenario. ELEC.LOFLEX also has less PV deployment, suggesting that
hydropower flexibility is helpful for PV integration in the Western Interconnection. PV deployment is
greater in ELEC.HIFLEX than the reference ELEC scenario, further supporting this inference. However, the
LOW.VG.COST scenario includes additional PV and less wind and natural gas regardless of the direction
of varying hydropower flexibility. Inspection of capacity differences for LOW.VG.COST across all years
shows that the direction of impacts on both technology-specific and net capacity deployment is highly
variable across years, so the results for LOW.VG.COST in Figure 33 are not representative of typical
behavior over time. This observation implies that the effect of hydropower flexibility on future
investments in the Western Interconnection could be less certain in a future with very high renewable
penetration. As variable renewable penetration grows, inflexible hydropower that cannot respond to
0
200
400
600
800
1000
1200
1400
1600
18002020
2024
2028
2032
2036
Wate
r W
ithdra
wals
(blli
on g
allo
ns)
ELEC.GFDL45
ELEC.IPSL45
ELEC.IPSL85
ELEC.MIROC85
ELEC.STATIC
HIGH.VG.COST.GLDL45
HIGH.VG.COST.IPSL45
HIGH.VG.COST.IPSL85
HIGH.VG.COST.MIROC85
HIGH.VG.COST.STATIC
LOW.VG.COST.GFDL45
LOW.VG.COST.IPSL45
LOW.VG.COST.IPSL85
LOW.VG.COST.MIROC85
LOW.VG.COST.STATIC
REF.GFDL45
REF.IPSL45
REF.IPSL85
REF.MIROC85
REF.STATIC
0
20
40
60
80
100
120
140
160
180
200
2020
2024
2028
2032
2036
Wate
r C
onsum
ption
(bill
ion g
allo
ns)
ELEC.GFDL45
ELEC.IPSL45
ELEC.IPSL85
ELEC.MIROC85
ELEC.HISTORIC
HIGH.VG.COST.GLDL45
HIGH.VG.COST.IPSL45
HIGH.VG.COST.IPSL85
HIGH.VG.COST.MIROC85
HIGH.VG.COST.HISTORIC
LOW.VG.COST.GFDL45
LOW.VG.COST.IPSL45
LOW.VG.COST.IPSL85
LOW.VG.COST.MIROC85
LOW.VG.COST.HISTORIC
REF.GFDL45
REF.IPSL45
REF.IPSL85
REF.MIROC85
REF.HISTORIC

November 25, 2020
38
variations in electricity demand can actually displace much or all of the remaining Gas-CC generation
supplying base and intermediate load in lower demand periods, which could indirectly create
opportunities for more PV generation to meet higher daytime loads.
Figure 33. Impacts of varying hydropower flexibility on 2038 capacity in the Western Interconnection for each flexibility scenario
relative to the corresponding electricity scenario with reference flexibility. Circles on plot represent net effect.
As with climate impacts, changes to the capacity mix are not necessarily consistent across all NERC
subregions within WECC. Figure 34 shows sub-regional changes in utility PV capacity in 2038 for all
flexibility sensitivity scenarios relative to the corresponding electricity scenario with default flexibility,
and Figure 35 includes the same results for 2038 Gas-CC and wind capacity but only for the
LOW.VG.COST and ELEC scenarios.
In the REF electricity scenarios, changing hydropower flexibility in either direction corresponds to less PV
deployment in the Desert Southwest, which is an unexpected indirect result demonstrating the
complexity of inter-regional interactions. With high hydropower flexibility, system-wide PV capacity is
similar to REF with default flexibility because flexible hydropower helps facilitate PV deployment in
other regions. PV impacts are also regionally disparate in the ELEC scenario, with the PV increase in
HIFLEX primarily in the Rocky Mountain and Southwest regions and the decrease in LOFLEX largely in the
Great Basin. Large quantities of assumed flexible demand in the ELEC scenario adds another dimension
of complexity around the effect of hydropower flexibility on PV construction. Additional PV in both
LOW.VG.COST flexibility scenarios is located throughout the Pacific Northwest, Great Basin, and Rocky
Mountain regions, demonstrating broad regional effects relative to other electricity scenarios. PV
impacts with HIGH.VG.COST are small in all regions for HIFLEX, but there are some variations in PV
deployment in the southern regions despite limited system-wide impacts.
Gas-CC and wind deployment is not impacted greatly by varying hydropower flexibility in the REF and
HIGH.VG.COST scenarios, and impacts are typically smaller than those on PV in ELEC and LOW.VG.COST.
REF and HIGH.VG.COST have a relatively large fraction of Gas-CC capacity relative to load, so Gas-CC is
able to adjust dispatch in response to changes in hydropower flexibility with smaller impacts on the

November 25, 2020
39
overall capacity expansion. Additional Gas-CC in ELEC.LOFLEX is spread throughout the northern NERC
subregions, while reductions in other scenarios are often concentrated in Southern California.
Reductions in wind capacity often occur in the Great Basin region, but these impacts remain less than 2
GW per region except for in the LOW.VG.COST.HIFLEX scenario.
Utility PV Capacity Difference (GW)
Figure 34. Hydropower flexibility scenario impacts on 2038 Utility PV capacity by NERC subregion within the Western Interconnection relative to corresponding scenarios reference flexibility.

November 25, 2020
40
Gas-CC Capacity Difference (GW)
Wind Capacity Difference (GW)
Figure 35. Hydropower flexibility scenario impacts on 2038 Gas-CC and Wind capacity by NERC subregion within the Western Interconnection for the LOW.VG.COST and ELEC scenarios relative to corresponding scenarios reference flexibility.
Varying hydropower flexibility has little impact on transmission capacity expansion in most scenarios
(Figure 36 and Figure 37), with the key exceptions being those with changes to system-wide or regional
PV deployment. For example, 2038 WECC transmission capacity is about 1 GW lower in REF.HIFLEX, and
this change is centered in the southern regions where PV deployment is lower. An approximately 2 GW
increase in transmission capacity in LOW.VG.COST.LOFLEX relative to LOW.VG.COST.HISTORIC
corresponds to higher PV capacity in that region, but this effect is not seen with LOW.VG.COST.HIFLEX.
In ELEC scenarios, high hydropower flexibility corresponds to more PV and transmission, and vice versa,
making this relationship somewhat robust but still subject to other interregional grid relationships.

November 25, 2020
41
Figure 36. 2038 transmission capacity in the Western Interconnection for flexibility and reference scenarios.
REF LOW.VG.COST HIGH.VG.COST ELEC
Figure 37. Differences in NERC regional transmission expansion by WECC subregion where the transmission capacity begins, for each flexibility scenario relative to the corresponding scenario with reference flexibility. [nr1=northwest, nr2=great basin, nr3=rocky mtn, nr4=norcal, nr5=socal, nr7=desert southwest.
3.3.2. Projected impacts on operation We compare the 2038 generation in the LOFLEX and HIFLEX hydropower fleets to reference flexibility
conditions for the HIGH.VG.COST and LOW.VG.COST scenarios using PLEXOS simulations. These
scenarios all assume average hydrologic conditions (i.e., IPSL85 year 2090) and reference load to isolate
the impacts of varying hydropower flexibility. Figure 38 shows hourly net load (here calculated from
total generation minus wind and PV generation each hour) and hydro dispatch during one week in July

November 25, 2020
42
for the LOW.VG.COST scenario to demonstrate hourly operation under different hydropower
flexibilities.
Figure 38: Net load and hydro for LOW.VG.COST showing impact of hydropower flexibility on hourly dispatch. Left: LOFLEX hydro. Right: HIFLEX hydro.
The impact of changing hydropower flexibility on the LOW.VG.COST fleet is that an inflexible
hydropower fleet significantly increases curtailment and Gas-CC generation (Figure 39 and Figure 40).
The high flexibility case has the opposite effect but to a much lesser extent because the baseline
hydropower fleet is already highly flexible. In the HIGH.VG.COST case, the increase in Gas-CC generation
under low flexibility assumptions is about the same quantity as the Gas-CC generation change in the
LOW.VG.COST case, but more storage is utilized and less coal is utilized as well. The associated
generation cost changes in the LOW.VG.COST scenarios are +17% for low flexibility and –2% for high
flexibility (Figure 41 and Figure 42). In the HIGH.VG.COST scenarios the change in generation cost are
+4% for low flexibility and there is a less than 1% difference for high flexibility, demonstrating the
increased importance of flexibility with higher VRE penetration. The LOW.VG.COST scenario has a
higher relative change in cost as a percentage because the generation costs are lower in a high-
renewable system, but the magnitude of the cost changes are similar.
Figure 39: Generation by type for HIGH.VG.COST (left) and LOW.VG.COST (right) IPSL85 2090 Hydro, Baseline load, under varying hydropower flexibility.

November 25, 2020
43
Figure 40: Change in generation relative to baseline hydropower flexibility assumptions for HIGH.VG.COST (left) and LOW.VG.COST (right) system.
Figure 41: Generation cost by type for HIGH.VG.COST (left) and LOW.VG.COST (right) IPSL 2090 hydro, baseline load, under varying hydropower flexibility.
Figure 42: Change in generation cost for HIGH.VG.COST (left) and LOW.VG.COST (right) system relative to baseline hydropower flexibility cost assumptions.
4. Summary Climate change has the potential to impact decisions associated with electricity capacity expansion
planning and operations. Here we support long-term planning of the Western Electricity Coordinating
Council. To do so we develop a multi-model framework consisting of hydrologic, capacity expansion and
production cost modeling. The framework is used to simulate and analyze a range of future scenarios
that differ according to assumptions concerning evolving power sector technology, climate and flexibility
in hydropower dispatch. Below, we review results in the context of our two guiding questions: 1) How
does changing climate influence electricity expansion planning (generation and transmission) and future

November 25, 2020
44
operations including type and capacity of new builds, system reliability, cost and environmental
impacts?, and 2) How does the representation of hydropower in the modeling framework influence the
evaluation of operations and reliability studies?
To inform the analysis, four different climate scenarios were utilized that encompass a range of possible
futures in terms of temperature and precipitation change in the Western Interconnection. The average
temperature over the Western U.S. increases by approximately 2 to 3 °C by mid-century under these
projections depending on the emissions pathway. These changes drive an increase in cooling degree
days and a reduction in heating degree days. Considerable variability exists between different regions in
the West, but these effects lead to an overall increase in annual electricity load of 3–15 TWh across the
four climate scenarios studied herein. Trends in precipitation vary substantially across the four climate
scenarios. The RCP45 emissions pathway leads to a uniformly wetter future across the Western
Interconnection under GFDL (11% increase in precipitation by mid-century) and uniformly drier future
under IPSL (5% decrease in precipitation). Although the system-wide precipitation changes are less
intense under RCP85, this emissions pathway leads to intense drying trends, in particular across
locations in the West over the next two decades—namely California/Nevada under MICO85, where
decreasing precipitation leads to an approximate 25-30% reduction in flows, and the Southwest under
IPSL85, where flows are reduced by approximately 20%. In the most undesirable case, projected
changes to water supply threaten to reduce total hydropower production in the Western
Interconnection by roughly 5-10%.
These changes in climate can impact capital investment in generation and transmission projects. Across
modeled climate futures, higher electricity demand due to higher temperatures drives up to 17 GW of
additional generating capacity in Western Interconnection through 2038 (~6.6% increase over
corresponding historical capacity-build). Capacity needs are driven by rapidly growing peak load
requirements, which typically favor flexible technologies or those available during higher-load daytime
periods, such as PV and gas-based generation. This response could be mitigated by increased water
availability for hydropower; however, there is considerable uncertain ty how future water availability
will evolve. While the magnitude of and mechanisms behind flexible electrified load is also highly
uncertain, this analysis motivates further investigation on how additional demand-side flexibility could
mitigate climate impacts on capacity requirements. Transmission capacity expansion also tends to
increase by 1–2 GW when accounting for future climate changes, 1% or less change across the Western
Interconnect. There is also variation across regions in climate impacts on generating and transmission
capacity expansion, with local resource availability, fuel and technology costs, transmission constraints,
and policy interacting with climate change to influence regional electric sector outcomes.
Climate change can impact system operations. At a regional level, our drought scenarios are
characterized by variability in hydropower generation primarily in the Pacific Northwest while increased
load due to climate occurred in the Southwest. These dynamics required load balancing across regions,
which was achieved in the hourly production cost modeling simulations. Importantly, resource
expansions that are high in thermal and low in renewable generation respond to changes in climate
mostly through usage of Gas-CC across the Western Interconnection, while resource expansions that are
high in renewables have a more diverse set of responses both in type of generation and in regional mix
of generation types. Though all systems simulated have nearly zero unserved energy and reserve
shortage, those high in renewables may be more resilient in uncertain futures due to their diversity.

November 25, 2020
45
Only high renewable capacity-builds have significant curtailment (up to 5.5% of PV), and curtailment
decreases slightly under climate scenarios because increased load can utilize otherwise surplus variable
generation in the springtime (up to 1% decrease in PV curtailment).
Under the conditions evaluated, including the drought scenarios, over 99.999% of load was met in the
PLEXOS simulations of the Western Interconnection. This assessment of the ability of the system to
meet load is limited to the assumptions of the production cost model and to the number of scenarios
analyzed (20), and was not a formal evaluation of reliability. When climate foresight was used in ReEDS
in a highly thermal fleet (HIGH.VG.COST IPSL85), the operational model (PLEXOS) showed that there was
more spare thermal capacity available after meeting load. When climate foresight was used in ReEDS in
a highly renewable fleet (LOW.VG.COST GFDL45), the change in thermal capacity was smaller but we
noted that significant curtailment existed as a source of flexibility for parts of the year.
Climate was seen to impact long-term system investment and operating costs reflecting the combined
influence of temperature, water availability, and demand flexibility. Additional capacity needs due to
higher load tend to increase costs, but increased water availability for hydropower and flexible demand
can reduce system costs and actually lead to a net cost reduction in Western Interconnection under
climate change. Absent these benefits, climate effects increase system costs by $5–$17 billion.
Production cost modeling shows that generation costs increase under the climate scenarios analyzed by
9 to 19%. The magnitude of the cost changes are highest in the high thermal (HIGH.VG.COST) scenarios
but as a percentage changes are higher in the high renewable fleet (LOW.VG.COST) relative the lower
generation costs of a high renewable fleet (up to 19%). The impact of climate foresight on the
operational costs was smaller: -2 to +4% change in operation costs relative to the same conditions in an
infrastructure without climate foresight.
Long-term projections of CO2 emissions, and water use are driven primarily by the future electricity
scenario, with relatively little variation across climate scenarios for a given electricity future. A key
exception is a high variable renewable penetration scenario, where climate effects tend to slightly
reduce CO2, and water use by the mid-2030s because climate-induced capacity tends to displace
additional fossil-fueled.
Changing the representation of hydropower flexibility has a relatively small influence on net capacity
expansion in the Western Interconnection through 2038. However, higher hydropower flexibility
corresponds to additional PV deployment in some future electricity scenarios, while lower hydropower
flexibility corresponds to reduced PV deployment in other scenarios. An increase in PV sometimes
corresponds to additional transmission needs as well. In production cost modeling, hydropower
flexibility has a significant impact on production costs, as hourly simulations show that increased need
for flexibility in the system is met by increased deployments of Gas-CC generation in all systems and by
additionally curtailing wind and PV in high renewable systems. The change in generation cost is -2 to
+17% in the high renewable system (LOW.VG.COST), and up to 4% increase in the high thermal system
(HIGH.VG.COST).
Finally, two important limitations are noted. First, analyses here do not endogenously represent climate
impacts and planning and operational decisions within Canada and Mexico. Thus we do not consider any
changes to Mexican or Canadian load, hydropower, or other electricity supply and demand conditions in
response to the scenarios in this analysis, which in reality could affect cross-border electricity flows and
system needs within the United States. Integration of these regions is a priority for future efforts.

November 25, 2020
46
Second, climate change impacts are expected to accelerate at/after mid-century; that is, beyond the
2038 time horizon of this study (Brekke et al. 2014). This is important as what is built in 2038 will be
affected by climate post 2050. In fact, different decisions might be made if a multi-decadal legacy of
infrastructure is considered.
5. References ABB Velocity Suite; 2017. http://new.abb.com/enterprise-software/energy-portfolio-
management/market-intelligence-services/velocity-suite
Allen, M. R., Fernandez, S. J., Fu, J. S., & Olama, M. M. (2016). Impacts of climate change on sub-regional electricity demand and distribution in the southern United States. Nature Energy, 1(8), 1-9.
Arango-Aramburo, S., Turner, S. W., Daenzer, K., Ríos-Ocampo, J. P., Hejazi, M. I., Kober, T., ... & van der Zwaan, B. (2019). Climate impacts on hydropower in Colombia: A multi-model assessment of power sector adaptation pathways. Energy Policy, 128, 179-188.
Auffhammer, M., Baylis, P., & Hausman, C. H. (2017). Climate change is projected to have severe impacts on the frequency and intensity of peak electricity demand across the United States. Proceedings of the National Academy of Sciences, 114(8), 1886-1891.
Bartos, M. D., & Chester, M. V. (2015). Impacts of climate change on electric power supply in the Western United States. Nature Climate Change, 5(8), 748-752.
Bartos, M., Chester, M., Johnson, N., Gorman, B., Eisenberg, D., Linkov, I., & Bates, M. (2016). Impacts of
rising air temperatures on electric transmission ampacity and peak electricity load in the United
States. Environmental Research Letters, 11(11), 114008.
Brekke L, Wood AW, Pruitt T. Downscaled CMIP3 and CMIP5 Hydrology Predictions: Release of Hydrology Projections, Comparison with Preceding Information and Summary of User Needs. 2014 3 July. Report No.: https://gdo-dcp.ucllnl.org/downscaled_cmip_projections/techmemo/BCSD5HydrologyMemo.pdf.
Buras, N. (1979). Determining the feasibility of incorporating water resource constraints into energy models. STIN, 80, 20908.
Chuang C-C, Sue D-C (2005) Performance effects of combined cycle power plant with variable condenser pressure and loading. Energy 30(10):1793–1801
Cohen, S. M., Becker, J., Bielen, D. A., Brown, M., Cole, W. J., Eurek, K. P., ... & Jadun, P. (2019). Regional
Energy Deployment System (ReEDS) Model Documentation: Version 2018 (No. NREL/TP-6A20-
72023). National Renewable Energy Lab.(NREL), Golden, CO (United States).
https://doi.org/10.2172/1505935.
Cole, W. J., & Vincent, N. M. (2019). Historical Comparison of Capacity Build Decisions from the Regional
Energy Deployment System (ReEDS) Model (No. NREL/TP-6A20-71916). National Renewable Energy
Lab.(NREL), Golden, CO (United States). https://doi.org/10.2172/1505552.
Cole, W. J., Frazier, A., Donohoo-Vallett, P., Mai, T. T., & Das, P. (2018). 2018 Standard Scenarios Report:
A US Electricity Sector Outlook (No. NREL/TP-6A20-71913). National Renewable Energy Lab.(NREL),
Golden, CO (United States). https://doi.org/10.2172/1481848.
Craig, M. T., Cohen, S., Macknick, J., Draxl, C., Guerra, O. J., Sengupta, M., Haupt, S. E., Hodge, B.-M., Brancucci, C. (2018). A Review of the Potential Impacts of Climate Change on Bulk Power System

November 25, 2020
47
Planning and Operations in the United States. Renewable and Sustainable Energy Reviews, 98, 255–267. https://doi.org/10.1016/j.rser.2018.09.022.
de Lucena, A. F. P., Schaeffer, R., & Szklo, A. S. (2010). Least-cost adaptation options for global climate change impacts on the Brazilian electric power system. Global Environmental Change, 20(2), 342-350.
Dirks, J. A., Gorrissen, W. J., Hathaway, J. H., Skorski, D. C., Scott, M. J., Pulsipher, T. C., ... & Rice, J. S.
(2015). Impacts of climate change on energy consumption and peak demand in buildings: A detailed
regional approach. Energy, 79, 20-32.
DOE, (2019). GeoVision: Harnessing the Heat Beneath Our Feet; U.S. Department of Energy: Washington, D.C., 2019.
DOE, (2016). Hydropower Vision: A New Chapter for America’s 1st Renewable Electricity Source; Technical Report DOE/GO-102016-4869; U. S. Department of Energy: Washington, D.C., 2016.
Durmayaz, A., & Sogut, O. S. (2006). Influence of cooling water temperature on the efficiency of a
pressurized‐water reactor nuclear‐power plant. International Journal of Energy Research, 30(10),
799-810.
EIA, (2018a). 860: Annual Electric Generator Report. Energy Information Administration, 2018.
EIA, (2018b). Annual Energy Outlook 2018 with Projections to 2050; U.S. Energy Information Administration Office of Energy Analysis, U.S. Department of Energy, 2018.
Frazier, A. W., Marcy, C., & Cole, W. (2019). Wind and solar PV deployment after tax credits expire: A
view from the standard scenarios and the annual energy outlook. The Electricity Journal, 32(8),
106637. https://doi.org/10.1016/j.tej.2019.106637.
Gleick PH. Impacts of California’s ongoing drought: hydroelectricity generation. Oakland, Calif.: Pacific Institute. Retrieved January. 2015;21:2016.
Hamududu, B., & Killingtveit, A. (2012). Assessing climate change impacts on global hydropower. Energies, 5(2), 305-322.
Henry, C. L., & Pratson, L. F. (2019). Differentiating the Effects of Climate Change-Induced Temperature and Streamflow Changes on the Vulnerability of Once-Through Thermoelectric Power Plants. Environmental science & technology, 53(7), 3969-3976.
Henry, C. L., & Pratson, L. F. (2016). Effects of environmental temperature change on the efficiency of coal-and natural gas-fired power plants. Environmental science & technology, 50(17), 9764-9772.
Ibrahim, S., Ibrahim, M., & Attia, S. (2014). The impact of climate changes on the thermal performance
of a proposed pressurized water reactor: nuclear-power plant. International Journal of Nuclear
Energy, 2014. ICF. Potential Effects of Climate Change on Electric Utilities; EPRI TR-105005; 1995.
IPCC (2014) Summary for Policy-makers. In: Climate Change 2014: Impacts, Adaptation, and Vulnerability. Part A: Global and Sectoral Aspects. Contribution of Working Group II to
Fifth Assessment Report of the Intergovernmental Panel on Climate Change. Cambridge University Press, pp 1–31
Jaglom, W. S., McFarland, J. R., Colley, M. F., Mack, C. B., Venkatesh, B., Miller, R. L., ... & Martinich, J. A.
(2014). Assessment of projected temperature impacts from climate change on the US electric power

November 25, 2020
48
sector using the Integrated Planning Model®. Energy Policy, 73, 524-539.
https://doi.org/10.1016/j.enpol.2014.04.032.
Kao S-C, Sale MJ, Ashfaq M, Uria Martinez R, Kaiser DP, Wei Y, et al. Projecting changes in annual hydropower generation using regional runoff data: An assessment of the United States federal hydropower plants. Energy. 2015;80:239-50.
Li, H., Wigmosta, M. S., Wu, H., Huang, M., Ke, Y., Coleman, A. M., & Leung, L. R. (2013). A Physically Based Runoff Routing Model for Land Surface and Earth System Models. Journal of Hydrometeorology, 14(3), 808-828. doi:10.1175/jhm-d-12-015.1
Liang, X., Lettenmaier, D. P., Wood, E. F., & Burges, S. J. (1994). A simple hydrologically based model of land surface water and energy fluxes for general circulation models. Journal of Geophysical Research: Atmospheres, 99(D7), 14415-14428.
Liu, L., Hejazi, M., Iyer, G., & Forman, B. A. (2019). Implications of water constraints on electricity capacity expansion in the United States. Nature Sustainability, 2(3), 206-213.
Liu, L., Hejazi, M., Patel, P., Kyle, P., Davies, E., Zhou, Y., ... & Edmonds, J. (2015). Water demands for electricity generation in the US: Modeling different scenarios for the water–energy nexus. Technological Forecasting and Social Change, 94, 318-334.
Lucena, A. F., Hejazi, M., Vasquez-Arroyo, E., Turner, S., Köberle, A. C., Daenzer, K., ... & Gernaat, D. (2018). Interactions between climate change mitigation and adaptation: The case of hydropower in Brazil. Energy, 164, 1161-1177.
Mai, T., Cole, W., & Reimers, A. (2019). Setting cost targets for zero-emission electricity generation
technologies. Applied Energy, 250, 582-592.https://doi.org/10.1016/j.apenergy.2019.05.001.
McFarland, J., Zhou, Y., Clarke, L., Sullivan, P., Colman, J., Jaglom, W. S., ... & Kyle, G. P. (2015). Impacts
of rising air temperatures and emissions mitigation on electricity demand and supply in the United
States: a multi-model comparison. Climatic Change, 131(1), 111-125.
https://doi.org/10.1007/s10584-015-1380-8.
Miara, A., Macknick, J. E., Vörösmarty, C. J., Tidwell, V. C., Newmark, R., & Fekete, B. (2017). Climate and water resource change impacts and adaptation potential for US power supply. Nature Climate Change, 7(11), 793. doi.org/10.1038/NCLIMATE3417.
Miara, A., Vörösmarty, C. J., Macknick, J. E., Tidwell, V. C., Fekete, B., Corsi, F., & Newmark, R. (2018). Thermal pollution impacts on rivers and power supply in the Mississippi River watershed. Environmental Research Letters, 13(3), 034033. doi.org/10.1088/1748-9326/aaac85
Miara, A., Cohen, S. M., Macknick, J., Vorosmarty, C. J., Corsi, F., Sun, Y., ... & Fekete, B. M. (2019). Climate-Water Adaptation for Future US Electricity Infrastructure. Environmental Science & Technology, 53(23), 14029-14040. https://doi.org/10.1021/acs.est.9b03037.
North American Electric Reliability Corporation (NAERC), 2015. 2015 Long-Term Reliability Assessment (http://nerc.com/pa/RAPA/ra/Reliability%20Assessments%20DL/2015LTRA%20-%20Final%20Report.pdf) (Accessed: September 2016) [climate not currently treated]
NREL, 2020. Electrification Futures Study, at https://data.nrel.gov/submissions/126
NREL. 2018 Annual Technology Baseline; National Renewable Energy Laboratory: Golden, CO, 2018.
O’Connell, M., Voisin, N., Macknick. J., Fu, T., Sensitivity of Western U.S. power system to dynamics in droughts compounded with fuel price variability, August 2019, Applied Energy

November 25, 2020
49
Parkinson, S. C., & Djilali, N. (2015). Robust response to hydro-climatic change in electricity generation planning. Climatic Change, 130(4), 475-489. 10.1007/s10584-015-1395-5
Reclamation 2013 Downscaled CMIP3 and CMIP5 Climate and Hydrology Projections: Release of Downscaled CMIP5 Climate Projections, Comparison with preceding Information, and Summary of User Needs p. 47pp, prepared by the U.S. Department of the Interior, Bureau of Reclamation, Technical Services Center, Denver, Colorado.
Roy, S. B., Chen, L., Girvetz, E. H., Maurer, E. P., Mills, W. B., & Grieb, T. M. (2012). Projecting water
withdrawal and supply for future decades in the US under climate change scenarios.
Environnemental Science & Technology, 46(5), 2545-2556. DOI: 10.1021/es2030774
Sathaye, J. A., Dale, L. L., Larsen, P. H., Fitts, G. A., Koy, K., Lewis, S. M., & de Lucena, A. F. P. (2013).
Estimating impacts of warming temperatures on California's electricity system. Global
Environmental Change, 23(2), 499-511. 10.1016/j.gloenvcha.2012.12.005
Schaeffer, R., Szklo, A. S., de Lucena, A. F. P., Borba, B. S. M. C., Nogueira, L. P. P., Fleming, F. P., ... & Boulahya, M. S. (2012). Energy sector vulnerability to climate change: a review. Energy, 38(1), 1-12.
Sridharan, V., Broad, O., Shivakumar, A., Howells, M., Boehlert, B., Groves, D. G., ... & Lempert, R. (2019). Resilience of the Eastern African electricity sector to climate driven changes in hydropower generation. Nature communications, 10(1), 1-9.
Sovacool, B. K., & Sovacool, K. E. (2009). Identifying future electricity–water tradeoffs in the United
States. Energy Policy, 37(7), 2763-2773.
Steinberg, D.C., Mignone, B.K., Macknick, J. et al. Decomposing supply-side and demand-side impacts of climate change on the US electricity system through 2050. Climatic Change 158, 125–139 (2020). https://doi.org/10.1007/s10584-019-02506-6
Stengel, K., Glaws, A., Hettinger, D., King, R. N. (2020). Adversarial Super-Resolution of Climatological Wind and Solar Data. PNAS, 117 (29), 16805–16815. https://doi.org/10.1073/pnas.1918964117.
Sullivan, P., Colman, J., & Kalendra, E. (2015). Predicting the response of electricity load to climate change (No. NREL/TP-6A20-64297). National Renewable Energy Lab.(NREL), Golden, CO (United States).
Sun, Y., Jadun, P., Nelsun, B., Muratori, M., Murphy, C., Logan, J., & Mai, T. (2020). Electrification Futures Study: Methodological Approaches for Assessing Long-Term Power System Impacts of End-Use Electrification. Golden, CO: National Renewable Energy Laboratory: NREL/TP-6A20-73336. https://www.nrel.gov/docs/fy20osti/73336.pdf.
Taseska, V., Markovska, N., & Callaway, J. M. (2012). Evaluation of climate change impacts on energy demand. Energy, 48(1), 88-95.
Tidwell, V.C, Moreland, B.D., Zemlick, K.M., Roberts, B.L., Passell, H.D., Jensen, D., Forsgren, C., Sehlke,
G., Cook, M.A., King, C.W. & Larsen, S. (2014). Mapping water availability, projected use and cost in
the Western United States, Environmental Research Letters, 9(6), doi:10.1088/1748-
9326/9/6/064009.
Turner, S. W., Ng, J. Y., & Galelli, S. (2017). Examining global electricity supply vulnerability to climate
change using a high-fidelity hydropower dam model. Science of the Total Environment, 590, 663-
675.

November 25, 2020
50
Turner, S. W., Hejazi, M., Kim, S. H., Clarke, L., & Edmonds, J. (2017). Climate impacts on hydropower and consequences for global electricity supply investment needs. Energy, 141, 2081-2090.
Van Vliet, M. T., Yearsley, J. R., Ludwig, F., Vögele, S., Lettenmaier, D. P., & Kabat, P. (2012). Vulnerability
of US and European electricity supply to climate change. Nature Climate Change, 2(9), 676-681.
Van Vliet, M. T., Wiberg, D., Leduc, S., & Riahi, K. (2016). Power-generation system vulnerability and adaptation to changes in climate and water resources. Nature Climate Change, 6(4), 375-380.
Vicuña, S., Dracup, J. A., & Dale, L. (2011). Climate change impacts on two high-elevation hydropower systems in California. Climatic Change, 109(1), 151-169.
Voisin N, Dyreson A, Fu T, O'Connell M, Turner SWD, Zhou T, et al. Impact of climate change on water availability and its propagation through the Western U.S. power grid. Applied Energy. 2020;276:115467.
Voisin, N., Kintner-Meyer, M., Wu, D., Skaggs, R., Fu, T., Zhou, T., ... & Kraucunas, I. (2018). Opportunities for joint water–energy management: sensitivity of the 2010 Western US Electricity Grid Operations to Climate Oscillations. Bulletin of the American Meteorological Society, 99(2), 299-312.
Voisin, N., Li, H., Ward, D., Huang, M., Wigmosta, M., & Leung, L. R. (2013). On an improved sub-regional water resources management representation for integration into earth system models. Hydrology & Earth System Sciences, 17(9). https://doi.org/10.5194/hess-17-3605-2013, 2013.
Webster, M., Donohoo, P., & Palmintier, B. (2013). Water–CO 2 trade-offs in electricity generation planning. Nature Climate Change, 3(12), 1029-1032.
Western Electricity Coordinating Council (WECC), 2018. State of the Interconnection. At
https://www.wecc.org/epubs/StateOfTheInterconnection/Pages/Resource-Portfolio.aspx
Western Electricity Coordinating Council (WECC), 2013. TEPPC 2024 Common Case Hydropower Data Set.
Zhou T, Voisin N, Fu T. Non-stationary hydropower generation projections constrained by environmental and electricity grid operations over the western United States. Environmental Research Letters. 2018;13(7):074035.

November 25, 2020
51
Supplemental Information
1. Calibration and validation of plant-level flow to generation model
Note: calibration performed on years 2001 – 2006 monthly generation (validation on 2007 – 2010).
2. Seasonal trends in water availability for hydro generation

November 25, 2020
52
3. Baseline Results without Consideration of Climate
1.1. Demands
1.2. Flows, disruptions to hydropower and thermoelectric power generation
1.3. Capacity expansion
Figure 43. Capacity expansion in the Western Interconnection through 2038 for each of the electricity system scenarios without climate change impacts.
PV (AC) GW
Wind GW
Gas-CC GW
Figure 44. 2038 capacity of utility PV, Wind, and Gas-CC by NERC subregion within WECC for each of the electricity system scenarios without climate change impacts.

November 25, 2020
53
GW
Figure 45. Climate impacts on 2038 Gas-CC capacity by NERC subregion within WECC for each climate scenario relative to the corresponding electricity scenario without climate change impacts.
GW
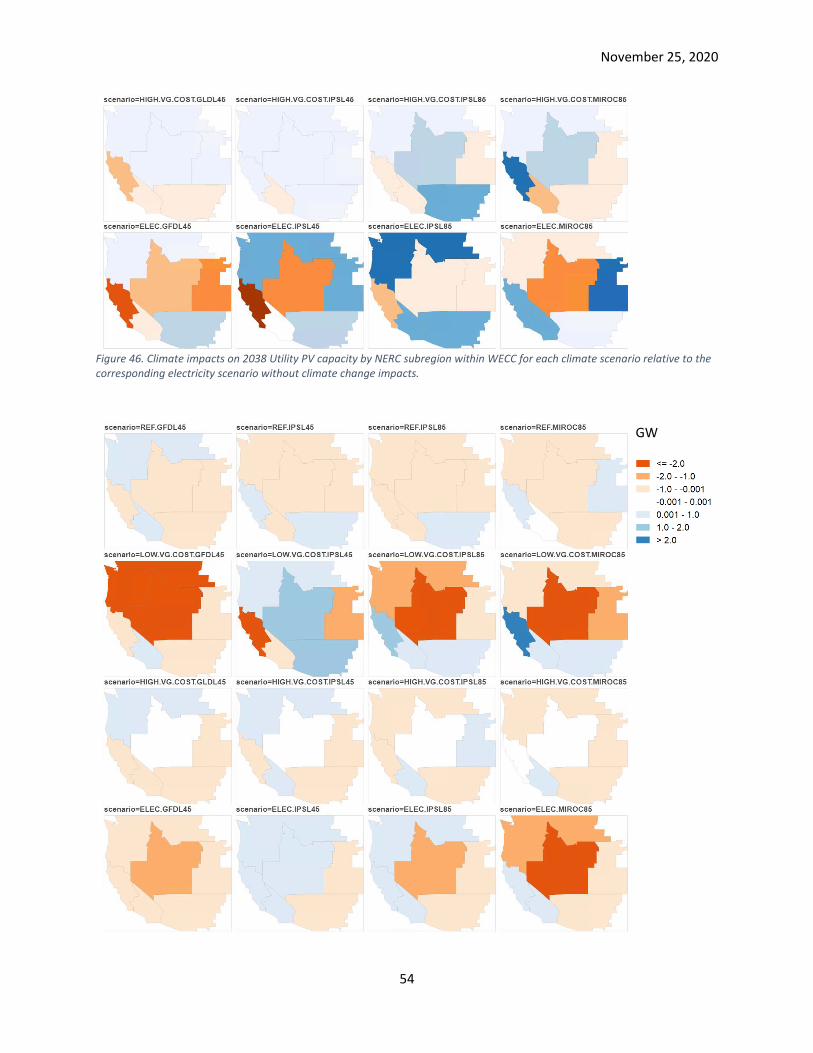
November 25, 2020
54
Figure 46. Climate impacts on 2038 Utility PV capacity by NERC subregion within WECC for each climate scenario relative to the corresponding electricity scenario without climate change impacts.
GW

November 25, 2020
55
Figure 47. Climate impacts on 2038 Wind capacity by NERC subregion within WECC for each climate scenario relative to the corresponding electricity scenario without climate change impacts.
Transmission capacity and location
Transmission Expansion without Climate Impacts
Figure 48. NERC regional transmission capacity by WECC subregion in 2038 under historic climate conditions, separated by alternating current (AC) and direct current (DC) capacity. [nr1=northwest, nr2=great basin, nr3=rocky mtn, nr4=norcal, nr5=socal, nr7=desert southwest.
2. Additional Results from Hydropower Flexibility Sensitivity
Gas-CC Capacity Difference (GW)

November 25, 2020
56
Figure 49. Flexibility scenario impacts on 2038 Gas-CC capacity by NERC subregion within WECC relative to corresponding scenarios reference flexibility.
Wind Capacity Difference (GW)
Figure 50. Flexibility scenario impacts on 2038 Wind capacity by NERC subregion within WECC relative to corresponding scenarios reference flexibility.