ABSTRACT POSTURAL CONTROL · 2019-07-11 · Postural control is a complex system in which the...
49
ABSTRACT VALIDATION OF A WEARABLE SENSOR INSOLE DEVICE FOR ANALYSIS OF POSTURAL CONTROL by Frank Theodore Price Postural control is a complex system in which the nervous system regulates information from various sensory systems, leading to corrective movement via the musculoskeletal system to maintain upright stance. When one or more of these systems is impaired, a person’s balance can be negatively affected. To determine the root cause of balance complications, a person may undergo clinician-supervised qualitative tests, which can be subjective in nature and may not detect small changes over time which contribute to balance issues. A new technology, the OpenGo SCIENCE (Moticon GmbH, Germany), is a pair of sensor insoles which applies wearable technology to evaluate motion. 20 subjects, aged 20-25, conducted 10 bipedal stance trials (5 eyes-open, 5 eyes-closed) wearing the OpenGo in-shoe and on a research-grade force plate simultaneously. A selection of linear, nonlinear, and frequency-domain measures of postural control were compared between the two devices to assess the validity of the OpenGo for analysis of quiet stance. It was found that COP range and RMS (AP-direction), 95% confidence ellipse area, approximate and sample entropy (ML-direction), median frequency, and low-frequency power ratio are considered valid to use for balance assessment using the sensor insole device, but special care must be taken during data post-processing.
Transcript of ABSTRACT POSTURAL CONTROL · 2019-07-11 · Postural control is a complex system in which the...

ABSTRACT
VALIDATION OF A WEARABLE SENSOR INSOLE DEVICE FOR ANALYSIS OF
POSTURAL CONTROL
by Frank Theodore Price
Postural control is a complex system in which the nervous system regulates information
from various sensory systems, leading to corrective movement via the musculoskeletal
system to maintain upright stance. When one or more of these systems is impaired, a
person’s balance can be negatively affected. To determine the root cause of balance
complications, a person may undergo clinician-supervised qualitative tests, which can be
subjective in nature and may not detect small changes over time which contribute to
balance issues. A new technology, the OpenGo SCIENCE (Moticon GmbH, Germany), is
a pair of sensor insoles which applies wearable technology to evaluate motion. 20
subjects, aged 20-25, conducted 10 bipedal stance trials (5 eyes-open, 5 eyes-closed)
wearing the OpenGo in-shoe and on a research-grade force plate simultaneously. A
selection of linear, nonlinear, and frequency-domain measures of postural control were
compared between the two devices to assess the validity of the OpenGo for analysis of
quiet stance. It was found that COP range and RMS (AP-direction), 95% confidence
ellipse area, approximate and sample entropy (ML-direction), median frequency, and
low-frequency power ratio are considered valid to use for balance assessment using the
sensor insole device, but special care must be taken during data post-processing.

VALIDATION OF A WEARABLE SENSOR INSOLE DEVICE FOR ANALYSIS OF
POSTURAL CONTROL
A Thesis
Submitted to the
Faculty of Miami University
in partial fulfillment of
the requirements for the degree of
Master of Science
by
Frank Theodore Price
Miami University
Oxford, Ohio
2018
Advisor: Dr. James Chagdes
Reader: Dr. Amit Shukla
Reader: Dr. Mark Walsh
©2018 Frank Theodore Price

This Thesis titled
VALIDATION OF A WEARABLE SENSOR INSOLE DEVICE FOR ANALYSIS OF
POSTURAL CONTROL
by
Frank Theodore Price
has been approved for publication by
The College of Engineering and Computing
and
Department of Mechanical and Manufacturing Engineering
____________________________________________________
Dr. James Chagdes
______________________________________________________
Dr. Amit Shukla
_______________________________________________________
Dr. Mark Walsh

iii
Table of Contents
Table of Contents ............................................................................................................... iii
List of Tables ...................................................................................................................... v
List of Figures .................................................................................................................... vi
Nomenclature .................................................................................................................... vii
Dedication ........................................................................................................................ viii
Acknowledgements ............................................................................................................ ix
Chapter 1. Literature Review .............................................................................................. 1
1.1 Introduction .......................................................................................................... 1
1.2 Background .......................................................................................................... 3
1.2.1 Basis of analysis – describing movement ..................................................... 3
1.2.2 Basis of analysis – postural control .............................................................. 4
1.2.3 Current balance evaluation tools ................................................................... 5
1.3 Wearable technology use in balance analysis ...................................................... 6
1.3.1 Inertial sensors .............................................................................................. 6
1.3.2 Newest technology ........................................................................................ 7
1.4 Previous OpenGo validation studies .................................................................... 8
1.5 Validation of OpenGo for quiet standing ............................................................. 9
Chapter 2. Research Methodology .................................................................................... 11
2.1 Subject Population.............................................................................................. 11
2.2 Instruments ......................................................................................................... 11
2.3 Experimental protocol ........................................................................................ 11
2.3.1 Zeroing process ........................................................................................... 12
2.3.2 Testing schedule.......................................................................................... 12
2.4 Post-testing data processing and statistical analysis .......................................... 12
2.5 Computation of postural control measures......................................................... 13
2.5.1 Linear time-domain measures ..................................................................... 13
2.5.2 Nonlinear measures ..................................................................................... 17
2.5.3 Frequency-based measures ......................................................................... 18
Chapter 3. Results & Discussion ...................................................................................... 19
3.1 Results of statistical analysis .............................................................................. 19
3.2 Discussion of OpenGo validity .......................................................................... 25
3.2.1 Linear measures .......................................................................................... 25

iv
3.2.2 Nonlinear and frequency-based measures .................................................. 30
Chapter 4. Conclusions and Future Work ......................................................................... 33
Chapter 5. References ....................................................................................................... 37

v
List of Tables
Table 1. Subject population and characteristics (mean ± standard deviation) .................. 11
Table 2. Measures of postural control to be calculated for study ..................................... 14
Table 3. P-values from paired t-tests on linear measures of postural control between force
plate and OpenGo insoles, eyes-open (EO) trials (shaded cells indicate significant
difference in measurement, p < .05) ................................................................................. 19
Table 4. P-values from paired t-tests on linear measures of postural control between force
plate and OpenGo insoles, eyes-closed (EC) trials ........................................................... 20
Table 5. P-values from paired t-test on nonlinear measures of postural control between
force plate and OpenGo insoles, eyes-open (EO) trials .................................................... 21
Table 6. P-values from paired t-test on nonlinear measures of postural control between
force plate and OpenGo insoles, eyes-closed (EC) trials .................................................. 22
Table 7. P-values from paired t-test on frequency measures of postural control between
force plate and OpenGo insoles, eyes-open (EO) trials .................................................... 23
Table 8. P-values from paired t-test on frequency measures of postural control between
force plate and OpenGo insoles, eyes-closed (EC) trials .................................................. 24
Table 9. Force comparisons (in N) between force plate (FP) and OpenGo insoles (OG)
for 5 shoes-on EO trials and 5 shoes-off EO trials, for 2 separate insole pairs (same
subject) .............................................................................................................................. 29
Table 10. Percentage of subjects with significantly different measurements and validity
result after low-pass filter cutoff frequency changed to 5 Hz for both devices (yellow
cells indicate a change in validity from original analysis) ................................................ 36

vi
List of Figures
Figure 1. The anatomical position and the directions of interest for this study .................. 3
Figure 2. Feedback cycle for postural control in human standing ...................................... 4
Figure 3. Comparison of force plate and OpenGo COP time-series, AP-direction, EO... 26
Figure 4. Comparison of force plate and OpenGo COP time-series, ML-direction, EO .. 26
Figure 5. Force vs. time for a standing trial of a 55.6 kg subject ..................................... 27
Figure 6. Force vs. time for a standing trial of a 69.4 kg subject ..................................... 28
Figure 7. Force vs. time for a standing trial of an 83.9 kg subject ................................... 28
Figure 8. Fast Fourier transform of force plate and OpenGo COP, eyes-open ................ 31
Figure 9. Fast Fourier transform of force plate and OpenGo COP, eyes-closed .............. 32
Figure 10. Layout of pressure sensors and battery on OpenGo insoles ............................ 34

vii
Nomenclature
a 95% confidence ellipse major radii
AP anterior-posterior (direction of motion)
ApEn approximate entropy
areaCE 95% confidence ellipse area
b 95% confidence ellipse minor radii
BW 99% bandwidth
CE confidence ellipse
COP center of pressure
COPAP center of pressure data point in anterior-posterior direction
COPML center of pressure data point in medial-lateral direction
D variable used in calculating 95% confidence ellipse
EC eyes closed
EO eyes open
F force
F* F statistic
GRF ground reaction force
HPR high-frequency power ratio
LA largest amplitude
LPR low-frequency power ratio
m pattern length (for calculating entropy)
MDF median power frequency
ML medial-lateral (direction of motion)
MPF mean power frequency
MPR medium-frequency power ratio
N number of subjects
n number of samples in dataset
r error tolerance (for calculating entropy)
range range of center of pressure dataset
RMS root mean square
sAP standard deviation in anterior-posterior direction
sML standard deviation in medial-lateral direction
sAP ML covariance
SampEn sample entropy
t time
TOTEX total excursions
v center of pressure velocity
λmax largest Lyapunov exponent

viii
Dedication
To all my friends, family, professors, and mentors who have supported me throughout my
academic career. Stay tuned.
ix
Acknowledgements
I would like to thank Dr. Jim Chagdes and Dr. Amit Shukla for their guidance and advice
on this project and throughout my graduate studies. Additionally, I would like to thank
Dr. Mark Walsh for being on the thesis committee and providing useful feedback to this
work from a biomechanics perspective, as well as for allowing us to use his laboratory for
preliminary testing. I would also like to thank all the participants who volunteered to take
part in this study. Thank you to all my professors and peers who challenged me and made
my time at Miami enjoyable. Lastly, a special thanks to my parents and family for their
continued support.

1
Chapter 1. Literature Review
1.1 Introduction
The human body is a complex system capable of extraordinary movement. Steady
balance and movement requires the use of multiple organ and sensory systems which combine to
create the body’s postural control [1]. The postural control process makes adjustments to
maintain an upright position and prevent falls and injury. When one piece of the postural control
system is hindered, a person’s balance can be negatively affected. In order to determine the root
cause of balance complications, the person may undergo postural stability testing.
Balance analysis is the study of human dynamics, which can involve the measurement
and assessment of quantities that characterize postural control. Balance analysis is most utilized
in medical specialties such as neurology, orthopedics, and sports medicine. For example,
dynamic analysis of gait can be used in evaluating patients with cerebral palsy [2]. More
recently, researchers have suggested that objective balance and gait metrics can provide useful
biomarkers for patients with Parkinson’s disease [3]. With advanced technology, these simple
tests can provide a wealth of information and insight into how the body responds to neurological
or physical impairments.
In the current clinical environment, postural control assessment is performed via brief,
qualitative tests. The most readily accessible means of data collections is through visual
observation, although patient self-reporting is also used in determining the state of the patient’s
balance or gait [4,5]. These are quite subjective and oversimplified measures which may work
for severe disorders but may not necessarily detect small changes over time, which are
contributing to balance issues.
For these cases, there are specialized laboratories that use vision-based technology and
force plates to track motion. Vision-based technology uses camera systems to track human
movement and can accurately estimate the position of certain points on the body via markers that
are placed on the subject before testing [6]. Force plates are used to measure ground reaction
forces (GRFs) and when paired with the kinematic data from vision-based technology, can
provide dynamic measurement based on inverse dynamics [5].
While these technologies are very accurate, they are restricted to laboratory settings and
short testing procedures, which may not result in the most accurate representation of a person’s
2
balance [6,7]. The type of tests that are administered are also limited due to the size of the room
or number of force plates available. In addition, subjects are watched closely by a professional
and usually have to wear a set of markers for the camera systems; this can be slightly awkward
for the subject and thus affect their normal movement. Lastly, motion capture and force plate
technology is very expensive to implement and requires specialized staff to operate the
equipment [7]. There is a need for a more economical, easy-to-use, and long-term monitoring
solution that can be used outside of a laboratory or hospital setting.
Recent advances in wearable sensor technology have shown potential to be applied as an
alternative to current balance analysis techniques. These types of sensors include inertial body
sensors (accelerometers and gyroscopes, specifically), and insole pressure sensors [5]. The
sensors are low cost, portable, and allow for longer-term continuous monitoring as compared to
current gait analysis equipment.
A new technology in the form of thin wireless sensor insoles, the Moticon OpenGo
SCIENCE, combines capacitive pressure sensors and accelerometers to record force/pressure,
center of pressure (COP), and acceleration for each foot during use. These insoles seem like a
great candidate for posture and gait analysis application due to their wireless capabilities, thin
and unobtrusive profile, and ability to record data over long time spans (5:48-48:00 hours) [8].
Since the force, COP, and acceleration data is stored directly on the insoles via flash memory,
the OpenGo can be used by a subject in day-to-day activity without restriction to location.
In order for the OpenGo to be a feasible alternative to current postural analysis technology, the
accuracy of the device needs to be evaluated. There have been recent studies that evaluated the
OpenGo for stance, gait, and jumping motions [9–11]. These studies compare temporospatial
(time- and space-based measures) and kinetic measurements from the OpenGo to the current gait
analysis equipment such as force plates, instrumented treadmills, or wired sensor insole systems.
In all of the studies, the OpenGo and ‘gold standard’ measuring device are compared
based on only linear, time-based measures. Recent research suggests the use of nonlinear and
frequency-based measures [12–14] which help quantify the dynamical structure of the body’s
center of pressure (COP). This study will compare OpenGo and force plate measurements of a
selection of linear, nonlinear, and frequency-based measures in order to determine the OpenGo’s
validity for postural control analysis.
3
1.2 Background
In order to understand postural control analysis, a background of the mechanisms and
processes of stance must be given. In this section, some anatomical and biomechanical concepts
will be introduced. These topics are important not only to understanding balance but are also
useful for developing quantitative measures that can be utilized for assessment purposes. A
background on current balance analysis techniques and equipment is also discussed.
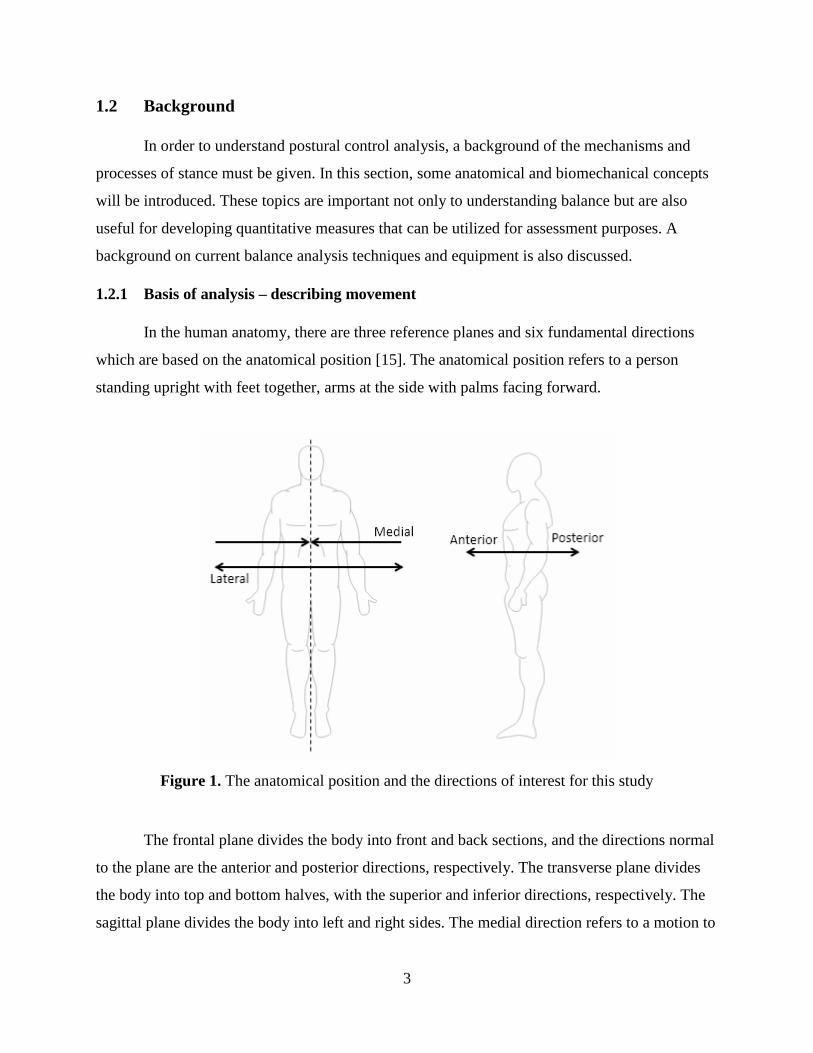
1.2.1 Basis of analysis – describing movement
In the human anatomy, there are three reference planes and six fundamental directions
which are based on the anatomical position [15]. The anatomical position refers to a person
standing upright with feet together, arms at the side with palms facing forward.
Figure 1. The anatomical position and the directions of interest for this study
The frontal plane divides the body into front and back sections, and the directions normal
to the plane are the anterior and posterior directions, respectively. The transverse plane divides
the body into top and bottom halves, with the superior and inferior directions, respectively. The
sagittal plane divides the body into left and right sides. The medial direction refers to a motion to
4
the inside of the body’s centerline, and the lateral direction refers to outward motion. Most joints
are only able to move in one or two planes [15]. For this study, the focus is on the anterior-
posterior (AP) and medio-lateral (ML) directions (Figure 1).
1.2.2 Basis of analysis – postural control
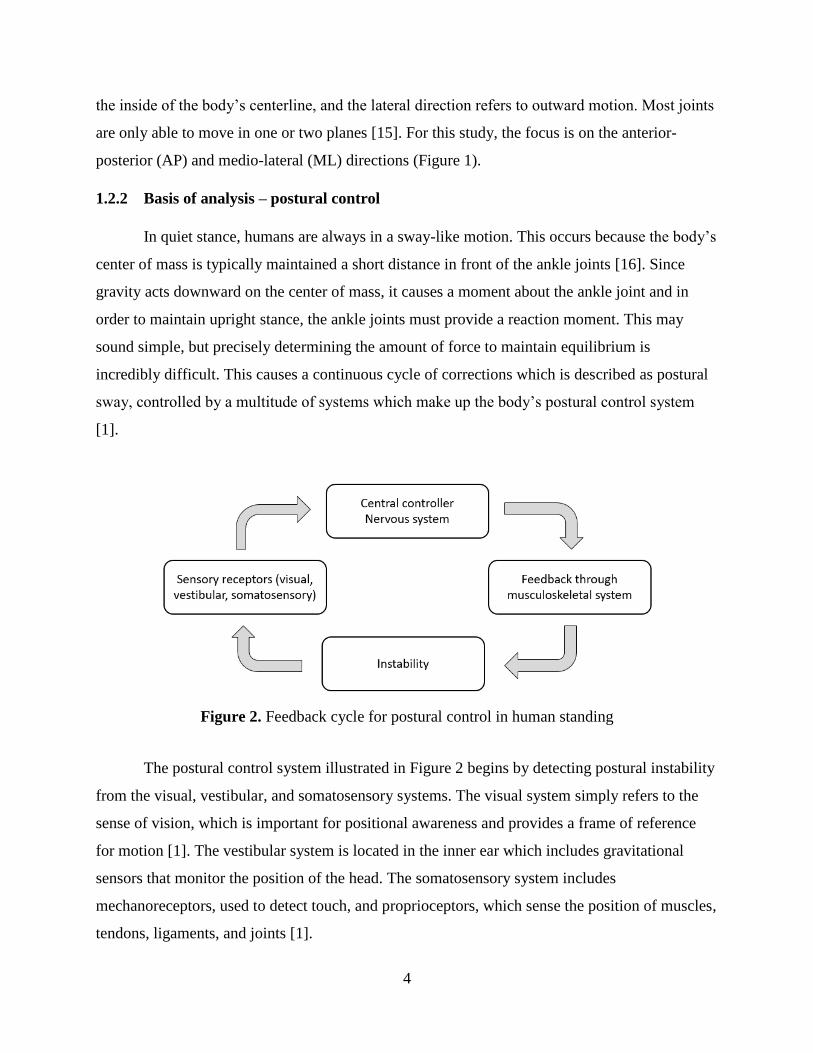
In quiet stance, humans are always in a sway-like motion. This occurs because the body’s
center of mass is typically maintained a short distance in front of the ankle joints [16]. Since
gravity acts downward on the center of mass, it causes a moment about the ankle joint and in
order to maintain upright stance, the ankle joints must provide a reaction moment. This may
sound simple, but precisely determining the amount of force to maintain equilibrium is
incredibly difficult. This causes a continuous cycle of corrections which is described as postural
sway, controlled by a multitude of systems which make up the body’s postural control system
[1].
The postural control system illustrated in Figure 2 begins by detecting postural instability
from the visual, vestibular, and somatosensory systems. The visual system simply refers to the
sense of vision, which is important for positional awareness and provides a frame of reference
for motion [1]. The vestibular system is located in the inner ear which includes gravitational
sensors that monitor the position of the head. The somatosensory system includes
mechanoreceptors, used to detect touch, and proprioceptors, which sense the position of muscles,
tendons, ligaments, and joints [1].
Figure 2. Feedback cycle for postural control in human standing

5
After the sensory receptors detect postural sway, the information is integrated by parts of
the brain. The cerebellum receives information from the spinal cord, which gives feedback about
motion (from the sensory system), and cerebral cortex, which provides information on movement
plans [17]. From here, the brainstem and spinal cord send signals to the musculoskeletal system,
which performs the correction(s) to the postural sway. The cycle then restarts at the next onset of
postural instability.
When any one part of the postural control cycle is not functioning correctly, balance
issues can ensue. In order to first determine there is a balance problem, a clinician may
administer a basic test, such as a single-leg test, where the clinician will time the amount of
stable stance on one leg [18]. When a basic test is not enough for proper evaluation, more
specialized lab tools can be used, in the form of motion capture and force plates.
1.2.3 Current balance evaluation tools
Current balance evaluation techniques utilize different branches of mechanics along with
modern video technology to quantify how people move and compare these quantifiable measures
to some reference that is known to be associated with typical healthy movement. The five
predominant elements of analysis are video examination, measurement of general gait
parameters (such as cadence, stride length, and gait speed), kinematic analysis, kinetic
measurement, and electromyography (EMG) [19].
Almost all clinical gait laboratories use a television-based system, where cameras record
a videotape of an exercise or the cameras are connected directly to a computer which will
perform kinematic measurements [19]. These kinematic measurements are taken from reflective
markers which are placed throughout the test subject’s lower limbs. The cameras then use a
source of light near the lens which creates an image such that only the reflective markers are
visible. The purpose of the reflective markers (and their locations placed throughout the body)
are to measure limb segments and joint angles. The primary kinetic measurements are the three-
dimensional ground reaction forces (GRF), recorded from high-quality force plates. Inverse
dynamics can then be used to solve for joint moments and power from both the kinematic and
GRF measurements [19].
Although current gait analysis is very detailed and accurate, there are multiple limitations
to the applicability of the technology. Current gait analysis is time and cost intensive, required to

6
be operated by experts, and is restricted in terms of the types of exercise that can be analyzed [7].
The cost to implement motion capture systems, force plates, treadmills, and any other gait
analysis equipment is on average about $300,000, not including facility costs. In addition to
equipment purchases, there are maintenance contracts for the equipment which cost about $30-
50,000 annually. There must also be specialized lab personnel including bioengineers, physical
therapists, and/or a receptionist, who must also be compensated [7].
Since all of the testing equipment is in one room, tests must also be performed in the
same room. Having the tests performed in one room limits what type of tests can be done
(walking/jogging a short distance, jumping, stance). The subject needs to dress so that the
majority of their lower limbs are exposed in order for reflective markers to be attached [7]. The
subjects are also monitored very closely throughout the testing period. Under these testing
conditions, the subjects may feel uncomfortable, therefore affecting their gait.
Clinical test setups can take hours at a time, but that the actual balance tests alone only
take about 5-30 minutes depending on what is being examined [7]. While current balance
analysis tools used are highly accurate and the tests have been scientifically proven to assist in
detecting balance abnormalities, it may be more advantageous to examine balance over long-
term tests or day-to-day activity.
1.3 Wearable technology use in balance analysis
The emergence of wearable sensor technology has shown to be a promising alternative to
current balance evaluation tools. Wireless inertial sensors such as accelerometers and
gyroscopes, as well as pressure sensors, have been used in research studies to extract quantitative
metrics used in assessing balance. This section will discuss the different types of sensors being
used for analyzing static and dynamic balance.
1.3.1 Inertial sensors
An accelerometer is a type of sensor which measures acceleration through a system
comprised of a known mass and spring, which move based on the forces experienced. The
acceleration is measured electrically using the change in mass displacement and Newton’s
Second Law [20]. There are three main types of accelerometers; piezoresistive, piezoelectric, and
capacitive [21]. A piezoresistive accelerometer changes its electrical resistance based on an
applied force. A piezoelectric accelerometer uses a piezoelectric material which generates a

7
voltage when a compressive force is applied [21]. A capacitive accelerometer changes
capacitance when the device mass closes the capacitor plates due to an applied force. Of all of
these accelerometer types, the most applicable to stance and gait analysis are the piezoresistive
and capacitive, due to their high stability and the ability to record dual acceleration components
[20]. These sensors are typically applied to the foot or leg in gait analysis application.
A gyroscope can be used in conjunction with an accelerometer to determine angular
quantities, which can then give insight into measures such as joint angles or velocities.
Gyroscopes use vibrating elements to sense rotation and are based on energy transfer between
two vibration modes due to Coriolis acceleration [22].
1.3.2 Newest technology
The OpenGo SCIENCE (developed by Moticon GmbH) are a pair of thin insoles which
record plantar pressure distribution, contact forces, and dynamics of the human foot [8]. The
OpenGo is designed to fit into a person’s shoe in place of the original shoe insole. Each OpenGo
insole is equipped with 13 capacitive pressure sensors, a 3-dimensional accelerometer, flash
memory for data acquisition, a power supply, and ANT radio, which is used to wirelessly
transfer data from the insole to a PC for analysis. Data can be sampled up to 50 Hz, or up to 100
Hz for any combination of 8 pressure sensor values.
The main benefit of the OpenGo is its ability to wirelessly record stance or gait data. The
power supply (powered by rechargeable 3.7W coin cells) and 16 MB flash memory system allow
for an operating time between 5:48 and 48:00 hours. Since the data is stored directly on the
OpenGo, the insoles are not restricted to one room or building. This allows researchers to
analyze a person’s regular day-to-day activity; something that isn’t always represented in a
clinical lab test. [11]
The ease of operation of the OpenGo is also a great benefit. The insoles are first inserted
into the subject’s shoes (after removing the original shoe insoles). The OpenGo can be “zeroed”
before use to ensure accurate force readings by connecting to the provided Moticon PC software
(via an ANT USB stick). While connected wirelessly to the Moticon software, the OpenGo data
acquisition can be remotely started. From here, the OpenGo will store all pressure, force, and
acceleration data on the insoles themselves, and the subject is free to resume normal activity. The
OpenGo must then be reconnected to the Moticon PC software to stop data recording or end a

8
test. After the recording is ended, the data can be transferred wirelessly to the PC and exported as
a text file for further analysis.
1.4 Previous OpenGo validation studies
In order for this new insole technology to be a feasible replacement to current
technology, the accuracy of the system must be examined. There have been multiple studies done
on the validity of the Moticon OpenGo insoles. These studies observe how recorded force, COP,
and temporal gait parameters differ between the insoles and a current “gold standard” balance
analysis tool such as a force plate, instrumented treadmill, or alternative instrumented insole
system.
Braun et al. [10] were the first to investigate the validity of the OpenGo, and concluded
that the insoles could be used in clinical trials that require step-by-step and group analysis of gait
over long time periods. Gait data from 12 healthy subjects aged 18-37 was recorded in 2
different test phases. Phase I involved 3-minute walks on a standard treadmill at 2 different
speeds while subjects wore the OpenGo. In Phase II, the participants performed 30 steps with
their dominant leg at normal walking speed on an FDM-S pressure plate, walking at normal
pace. The trials were recorded on the OpenGo and pressure plate simultaneously.
Stoggl & Martiner [11] compared the performance of the OpenGo to an AMTI force plate
and the PedarX sensor insoles, considered to be the “gold standard” among sensor insole
systems. Data were recorded from 16 healthy subjects aged 21-41 from four experimental
phases: (1) slow and fast walking, running at self-selected speed; (2) stance, counter movement
jumps, drop jumps; (3) three different cross-country skiing imitation drills (to produce distinct
shear forces) and (4) two balance tests (single leg balance and Y-balance dynamic balance test).
It was concluded that with awareness of the system’s limitations, the OpenGo can be applied to
clinical and research for evaluating temporal and force parameters, but COP data in the medio-
lateral (side-to-side) direction should be considered with care when analyzing. In terms of the
system limitations, they found that force impulses recorded by the OpenGo for all tests were
approximately 13-36% lower when compared with the AMTI force plate, and 12-26% when
compared to the PedarX system. They also found that very short ground contact times with force
impacts cannot be determined accurately with the OpenGo, possibly due to latency in the
OpenGo. The COP time series revealed comparable shapes between the three systems, but the

9
deviations in the medio-lateral (side-to-side) direction were about 58-75% lower from the
OpenGo to the AMTI, and about 28-48% lower from the OpenGo to the PedarX. This could be
due to the difference in sampling rate between the systems (50 Hz vs. 1000 Hz as seen in the
force plate) [11].
Oerbekke et al. [9] investigated the OpenGo as compared to an AMTI force plate for
stance and COP measurements, and a ForceLink instrumented treadmill for temporal gait
parameters. Data were collected from 20 healthy subjects, aged 22-34. The subjects performed
one unilateral stance trial for each leg under eyes-open and eyes-closed conditions, and then
performed two 90-second walking trials on the treadmill for a pre-calculated comfortable
walking speed. For the stance trials, the OpenGo was worn on the force plate without shoes but
between a pair of the participants’ own socks and an extra pair of thin socks. For the treadmill
walking trials, the insoles were worn in the participants’ own shoes.
It was concluded that the OpenGo generally underestimated COP parameters with
increased underestimation in the medio-lateral direction. Bland-Altman plots [23], which assess
agreement between two measurement devices based on the averages and differences of
measurements, were generated for both the COP and temporal gait parameters. For COP
measures, Oerbekke et al. found that the OpenGo is not interchangeable with a force plate since
the measures are generally underestimated and that the limits of agreement in the Bland-Altman
plot are considered too wide when expecting the performance of a force plate from the OpenGo.
The limits of agreement for temporal gait parameters are considered acceptable, and excellent
reliability was found for measuring temporal metrics using the OpenGo [9].
1.5 Validation of OpenGo for quiet standing
In this study, the validation of the OpenGo is being assessed based on the measurement
of linear, nonlinear, and frequency-based parameters commonly used in the analysis of postural
control. These measures will be compared between the OpenGo insoles and a research-grade
force plate manufactured by AMTI, Inc. Participants will conduct ten 1-minute bipedal stance
tests under two different visual conditions, eyes open and eyes closed. Conducting tests in eyes-
open and eyes-closed conditions eliminates a portion of the postural control system (visual), and
research has shown that measures of postural control can be affected by visual impairment [24].

10
The next chapter will discuss the experimental protocol and postural control measures of interest
in assessing the validity of the OpenGo insoles to a force plate.

11
Chapter 2. Research Methodology
2.1 Subject Population
Participants were recruited via flyers posted throughout campus. A total of 20
individuals, 12 men and 8 women, participated in the study. The participants were adults aged
20-25 with a mean height of 172.9 cm and mean weight of 70.1 kg (Table 1).
Table 1. Subject population and characteristics (mean ± standard deviation)
Subjects
Age
(years)
Height
(cm)
Weight
(kg)
Female 8 21.3 ± 0.7 167.6 ± 3.6 62.6 ± 6.4
Male 12 22.8 ± 1.7 176.4 ± 4.1 75.0 ± 5.9
Total 20 22.2 ± 1.5 172.9 ± 5.9 70.1 ± 8.6
The study was approved by the Miami Institutional Review Board and the individuals
were informed of the testing procedures and risks of the study prior to signing an informed
consent to participate.
2.2 Instruments
In addition to the Moticon OpenGo SCIENCE insoles, whose features have been
discussed in Chapter 1, the subjects stood on an AMTI Optima force plate, with dimensions 46 x
51 cm and recording at a frequency of 1000 Hz. The force plate contains strain gage load
transducers that can measure force in the x, y, and z components as well as the moments about
each axis. The data is recorded using AMTI’s software and exported as a .txt file for post-
processing.
2.3 Experimental protocol
For any given subject, testing began with recording height (cm) and weight (kg). After
deciding on which of the three insole sizes available (ranging from US 6.5-10.5 men’s sizes) fit
best, the insoles were then inserted into the subject’s own shoes in place of the original shoe
insoles. A 2-3 minute acclimation period, during which the subject had their shoes on, was
performed to “warm up” the insole sensors to the subject’s foot temperature. This was
implemented to eliminate sensor drift due to temperature change during data acquisition.

12
2.3.1 Zeroing process
After the acclimation period, the subject stepped out of the shoes, the insoles were
zeroed, and the data acquisition was started. The subject then placed the shoes back on and
stepped on the force plate, lining their feet up with the tape placed on the force plate (for
standardizing stance width). The purpose of this zeroing process is to eliminate any residual
weights. This process takes no more than 10 seconds, limiting the chance of the insoles cooling
down. Zeroing was completed before every one-minute stance trial.
2.3.2 Testing schedule
Each subject underwent 10 1-minute bipedal stance trials, 5 with eyes-open and 5 with
eyes-closed in alternating fashion. With their feet at the standardized width on the force plate, the
subjects began each trial with a right foot heel stomp. This heel stomp aids in synchronizing the
force plate and OpenGo for data analysis by locating the force peaks for each dataset and setting
this point as t = 0 s. Each trial concluded after one minute elapsed, and after the end of each trial,
the insole data acquisition would be stopped, the subject would slip out of the shoes and the
insoles would be re-zeroed and data acquisition would begin for the next trial. Testing for a
given subject was complete after finishing the 5 eyes-open and 5 eyes-closed stance trials.
2.4 Post-testing data processing and statistical analysis
After the OpenGo and force plate data were downloaded as .txt files, they were imported
into MATLAB for the computation of the measures of postural control. For a given test, the two
datasets were synchronized from finding the point of peak force (from the initial heel stomp).
From there, the first 15 seconds of data were discarded and the following 30 seconds were used
as the test data for both devices. Some modification to the OpenGo data is necessary since the
OpenGo calculates a COP for each foot, whereas the force plate calculates one COP point. To
maintain consistency, a weighted average function is used for the OpenGo data so that there is
only one value (Eq. 1).
𝐶𝑂𝑃𝐴𝑃 = (
𝐹𝑙𝑒𝑓𝑡
𝐹𝑙𝑒𝑓𝑡 + 𝐹𝑟𝑖𝑔ℎ𝑡) 𝐶𝑂𝑃𝐴𝑃𝑙𝑒𝑓𝑡
+ (𝐹𝑟𝑖𝑔ℎ𝑡
𝐹𝑙𝑒𝑓𝑡 + 𝐹𝑟𝑖𝑔ℎ𝑡) 𝐶𝑂𝑃𝐴𝑃𝑟𝑖𝑔ℎ𝑡
(1)

13
The COP in the ML direction (Eq. 2) must be calculated slightly differently to take into
account the stance width, d (in mm).
𝐶𝑂𝑃𝑀𝐿 = (
𝐹𝑙𝑒𝑓𝑡
𝐹𝑙𝑒𝑓𝑡 + 𝐹𝑟𝑖𝑔ℎ𝑡) (𝐶𝑂𝑃𝑀𝐿𝑙𝑒𝑓𝑡
−𝑑
2) + (
𝐹𝑟𝑖𝑔ℎ𝑡
𝐹𝑙𝑒𝑓𝑡 + 𝐹𝑟𝑖𝑔ℎ𝑡) (𝐶𝑂𝑃𝑀𝐿𝑟𝑖𝑔ℎ𝑡
+𝑑
2) (2)
COP data in both coordinates were then centered about zero by taking the arithmetic
mean of each component and subtracting from the raw data values. This was performed for both
force plate and OpenGo data.
Due to the sensitivity of sampling rate on the calculation of frequency-based measures,
the force plate data were downsampled to 50 Hz. The OpenGo COP data was filtered with a 12th-
order Butterworth with an 8 Hz cutoff frequency for analysis, and the force plate data was
filtered with a 6th-order Butterworth low pass filter with a cutoff frequency of 12 Hz [9]. For
assessing the validity of the OpenGo insoles, a two-tailed paired t-test (α = 0.05) was used on the
means for each measure to detect any significance in the difference of measurement between the
two devices. The criteria for determining whether a measure is valid for balance assessment with
the OpenGo is if more than 4 of the 20 subjects (20%) display a significant difference in
measurement between the force plate and OpenGo.
2.5 Computation of postural control measures
In this section, there will be a discussion of a selection of various measures used to assess
postural control and how to compute them from information collected from balance analysis
tools. These measures will be broken up into three categories: time-based measures (linear and
nonlinear), and frequency-based measures.
Table 2 gives an overview of the measures that will be calculated in determining the
validity of the OpenGo insoles. Since the COP is a two-dimensional variable, defined by the AP
and ML coordinates, there are two values for most measures.
2.5.1 Linear time-domain measures
Time-domain measures are the most commonly used of all of the measures being
presented. They are relatively easy to calculate and give insight into how the COP trajectory is
moving over time. COP range (range) is defined as the difference between the largest and

14
Table 2. Measures of postural control to be calculated for study
Measure Symbol Significance Ref.
Linear
COP range range Difference between largest and smallest value in COP time series
[9,13] COP root mean square RMS Larger RMS generally associated with decreased postural control
COP velocity v Increased COP velocity generally associated with decreased postural control
Largest amplitudes LA It has been shown to be useful for characterizing stance types (i.e. single leg vs. bipedal stance)
and possibly impairment conditions [12]
95% confidence ellipse area areaCE Larger ellipse area generally associated with decreased postural control [13]
Average force force Preliminary study revealed discrepancy between OpenGo and force plate force measurement -
Nonlinear
Approximate entropy ApEn Shown to increase in dual-task, represents randomness in COP trajectory [25]
Sample Entropy SampEn Negatively related with the regularity of COP trajectory [26]
Largest Lyapunov exponent λmax Quantifies chaos in a system, negatively related with the local stability of COP trajectory
Frequency-
based
Mean power frequency MPF MPF of the COP signal has been observed to increase when eyes closed [12,24]
Median frequency MDF Frequency value which separates the power spectrum into two equal energy areas
[12]
99% Bandwidth BW Width of the frequency band in which 99% of the total power of the COP signal is located
Low-frequency range power
ratio LPR
Parameterized values of power distribution between low-, medium-, and high frequency bands,
which based on past work [27], are linked with visual control, vestibular/somatosensory, and
proprioceptive control, respectively
Medium-frequency range
power ratio MPR
High-frequency range power
ratio HPR

15
smallest values for each of the two directions in the COP trajectory. The COP range is used to
assess the amount of displacement in the subject’s COP during stance, and an increase in
magnitude may suggest a decreased ability to maintain balance [14].
The root mean square (RMS) of the COP displacement amplitude was also calculated.
Equation 3 is written for calculating RMS in the AP-direction, but it is the same equation for
both directions.
In this equation, COPAP is one data point in the COP time series for the AP-direction, and
N is the number of data points in the time series. The significance of this measure is that a larger
RMS value could be indicative of decreased postural control. [14]
COP velocity (v) has been used by numerous researchers to assess changes in postural
control [9,13,14]. This measure can be calculated based on the total excursions (TOTEX) of the
COP time series, defined as the total length of the COP path (Eq. 4).
𝑇𝑂𝑇𝐸𝑋 = ∑ [(𝐴𝑃[𝑛 + 1] − 𝐴𝑃[𝑛])2 + (𝑀𝐿[𝑛 + 1] − 𝑀𝐿[𝑛])2]1/2 𝑁−1𝑛=1 (4)
To find the COP velocity, the total excursions value is divided by the time duration of the
COP time series, which for this study will always be 30 seconds (Eq. 5).
𝑣 =
𝑇𝑂𝑇𝐸𝑋
30
(5)
An increase in the COP velocity is thought to represent decreased postural control, and a
decrease is thought to represent increased control [14]. In order to more accurately calculate
measures such as total excursions and COP velocity, the COP data may need to be filtered. This
is because signal noise may inadvertently increase the length of the COP path, directly affecting
the COP velocity measure [13].
The largest amplitudes (LA) measure is calculated in both the AP- and ML-directions
and corresponds to the largest valley-peak or peak-valley transition between two data points in
𝑅𝑀𝑆𝐴𝑃 = √∑ 𝐶𝑂𝑃𝐴𝑃
2
𝑁 (3)

16
the COP time series [12]. The largest amplitude is found by finding the maximum amplitude
between two consecutive data points in the time series. This measure is not too useful for
evaluating postural control since it only focuses on two data points over the entire time series.
However, it has been shown to be useful for characterizing stance types (i.e. single leg vs.
bipedal stance) and possibly impairment conditions [12].
The 95% confidence ellipse is used to assess postural control and encloses approximately
95% of the points on the COP path. The ellipse’s major radii, a, and minor radii, b, are
𝑎 = [𝐹∗.05[2,𝑛−2](𝑠𝐴𝑃
2 + 𝑠𝑀𝐿2 + 𝐷)]
1/2 (6)
𝑏 = [𝐹∗.05[2,𝑛−2](𝑠𝐴𝑃
2 + 𝑠𝑀𝐿2 − 𝐷)]
1/2 (7)
where F* is the F statistic at the 95% confidence level for a bivariate distribution with n
data points. This value can be found in an F-table, and for a large sample size (n > 120), F = 3.00
[13]. sAP and sML are the standard deviations for the AP- and ML-directions, and D is defined as
𝐷 = [(𝑠𝐴𝑃2 + 𝑠𝑀𝐿
2 ) − 4(𝑠𝐴𝑃2 𝑠𝑀𝐿
2 − 𝑠𝐴𝑃 𝑀𝐿2 )]1/2 (8)
where sAP ML is the covariance (Eq. 9).
𝑠𝐴𝑃 𝑀𝐿 =1
𝑁∑ 𝐴𝑃[𝑛]𝑀𝐿[𝑛] (9)
Then, the area of the 95% confidence ellipse is found by Eq. 10.
𝑎𝑟𝑒𝑎𝐶𝐸 = 𝜋𝑎𝑏 (10)
The significance of the 95% confidence ellipse is that a larger area is generally associated
with decreased postural control. There have also been studies which indicated improvements in
the 95% confidence ellipse after a balance-training intervention for patients with ankle sprains
[28,29].
Lastly, the average force measure (force) was added after a preliminary study revealed a
large discrepancy in force between the two devices. This measure is calculated simply by taking
the mean of each force value recorded in the 30-second time-series.

17
2.5.2 Nonlinear measures
Nonlinear analysis of the COP focuses more on quantifying the dynamical structure of
COP fluctuations, which can aid in understanding the complexity of the postural control system
[26]. These measures are still relatively new in this application, but past work has revealed their
ability to recognize small changes in postural control that may not be found in a temporal
analysis of the COP.
Approximate entropy (ApEn) is used to assess the ‘regularity’ of COP fluctuations. ApEn
quantifies randomness in a time-series signal by determining the extent to which short sequences
of data points are repeated. In order to calculate ApEn, it is needed to know m, a pattern length,
and r, an error tolerance. From knowing these values, the algorithm calculates the logarithmic
probability that runs of patterns that are within r for m observations remain close on subsequent
incremental comparisons [25]. The value calculated ranges from 0 to 2, where 0 indicates a
perfectly repeatable time-series and a value of 2 indicates a completely random time-series
where any repeating sequences occur only by chance. This can also be interpreted as more
‘regular’ COP fluctuation (low ApEn) versus more ‘irregular’ COP fluctuations (high ApEn).
For calculating ApEn, a pattern length m of 2 data points was chosen, and the error
tolerance was chosen to be 0.2 * s (standard deviation in AP/ML direction for given dataset).
These values were selected based on previous work [25]. ApEn was calculated using an ApEn
algorithm developed for MATLAB found on the Mathworks® File Exchange [30].
Sample entropy (SampEn) is a modified version of the ApEn, with two main differences:
(1) SampEn does not include a self-match for each sequence of a pattern, which may lead to bias
in ApEn [31], and (2) SampEn does not use a template-wise approach for calculating conditional
probabilities [32]. The same inputs used in ApEn apply to SampEn, and the generated value will
also be a real number between 0 and 2. It is suggested that an increased irregularity in the COP
could imply greater “automaticity” of postural control [26].
The maximum Lyapunov exponent (λmax) is used to estimate the local dynamic stability of
the system and are a way to quantify chaos. Mathematically, this quantity characterizes the
average rate of the exponential divergence of infinitesimally close trajectories in state space,
depicting how the system responds to a very small perturbation [33]. A positive λmax indicates
that the close trajectories will diverge over time (i.e. system is chaotic), and a negative λmax

18
indicates stable behavior. λmax will be estimated using Rosenstein’s method of determining the
largest Lyapunov exponent from a time series [34,35].
2.5.3 Frequency-based measures
Frequency-based analysis on the COP is one of the newer methods of analyses. While
time-based measures quantify the path and extensions of the COP trajectory, frequency-based
parameters analyze the frequency content of the measurement using power spectral density
(PSD) [12].
Mean power frequency (MPF) is a weighted average frequency where frequency
components are weighted by their power. For this study, MPF was calculated using the
MATLAB built-in meanfreq function, which requires input of the time-domain signal and
sampling rate to estimate the MPF. MPF has been used in assessing postural control in previous
studies [12,13] and in one study, MPF was shown to increase when eyes are closed [24].
Median frequency (MDF) is the frequency value which separates the power spectrum into
two, equal energy areas. For this study, MDF was calculated using the MATLAB medfreq
function, which similarly to meanfreq, requires input of the time-domain signal and sampling
rate.
99% Bandwidth (BW) is the width of the frequency band (Hz) in which 99% of the total
power is contained. For this study, BW was calculated using the MATLAB obw function, which
also requires input of the time-domain signal and sampling rate. BW may be useful to compare
between the force plate and OpenGo insoles to observe the power distribution and any possible
differences.
Frequency range power ratios, denoted as low-medium (LMR) and medium-high (MHR)
frequency range power ratios, are a newer frequency-based measure that can be used in assessing
postural control. They are parameterized values of power distribution between low- (0-0.3 Hz),
medium- (0.3-1 Hz), and high (1-5 Hz) frequency bands, which based on past work [27], are
linked with visual control, vestibular/somatosensory, and proprioceptive control, respectively.
These measures will be calculated by finding the percentage of total power in each frequency
interval, using MATLAB’s bandpower function.

19
Chapter 3. Results & Discussion
In this section, the validity of the OpenGo insoles will be discussed through the results of
the statistical analysis performed between the measures of postural control calculated from both
the force plate and OpenGo. For this study, measures of postural control seen in trials which are
found to be significantly different in measurement between the force plate and OpenGo would
suggest that the OpenGo is not valid in these cases.
3.1 Results of statistical analysis
Table 3. P-values from paired t-tests on linear measures of postural control between force plate
and OpenGo insoles, eyes-open (EO) trials (shaded cells indicate significant difference in
measurement, p < .05)
Linear Measures
rangeAP rangeML RMSAP RMSML v LAAP LAML areaCE force
Subje
ct
1 0.306 0.677 0.110 0.835 < .001 0.024 0.034 0.497 < .001
2 0.877 0.013 0.962 0.035 < .001 0.002 < .001 0.165 0.014
3 0.145 0.030 0.153 0.084 < .001 0.002 < .001 0.484 < .001
4 0.883 0.011 0.568 0.012 < .001 < .001 < .001 0.010 < .001
5 0.786 0.040 0.431 0.036 < .001 0.001 0.007 0.097 0.422
6 0.363 0.016 0.338 0.017 < .001 < .001 < .001 0.014 < .001
7 0.348 0.053 0.739 0.078 < .001 < .001 < .001 0.129 < .001
8 0.444 0.588 0.445 0.407 < .001 < .001 0.018 0.600 < .001
9 0.939 0.353 0.859 0.249 < .001 < .001 0.057 0.612 0.015
10 0.416 0.004 0.136 0.020 < .001 < .001 < .001 0.022 0.191
11 0.952 0.213 0.901 0.370 < .001 0.301 < .001 0.621 0.130
12 0.045 0.208 0.007 0.032 < .001 0.011 0.017 0.564 0.585
13 0.992 0.041 0.902 0.013 < .001 < .001 < .001 0.305 < .001
14 0.950 0.045 0.789 0.012 < .001 < .001 0.008 0.366 0.418
15 0.639 0.060 0.809 0.134 < .001 0.028 0.004 0.582 < .001
16 < .001 0.305 0.003 0.336 < .001 0.827 < .001 0.636 < .001
17 0.001 0.319 < .001 0.760 < .001 0.042 < .001 0.102 < .001
18 0.348 0.142 0.184 0.258 < .001 0.262 0.011 0.076 0.371
19 0.848 0.003 0.957 0.005 < .001 0.014 < .001 0.247 < .001
20 0.268 0.007 0.405 0.016 < .001 0.135 < .001 0.083 < .001
Looking at the linear measures from eyes-open (EO) trials in Table 3, for COP range in
the AP-direction, significant difference in measurement between the force plate and OpenGo
insoles was observed in 3 of the 20 subjects (15%). Significant difference was seen in 10 of the

20
20 subjects (50%) for the COP range in the ML-direction. For RMS in the AP-direction,
significant difference in measurement was seen in 3 of the 20 subjects (15%), whereas
significant difference was seen in 10 of the 20 subjects (50%) for the RMS in the ML-direction.
Significant difference was seen in the measurement of the mean total COP velocity measure in
all of the subjects (100%). For the largest amplitudes (LA) measures, significant difference in
measurement was seen in 16 of the 20 subjects (80%) in the AP-direction, and 19 of the 20
subjects (95%) in the ML-direction. For the 95% confidence ellipse area, significant difference
in measurement was seen in 3 of the 20 subjects (15%). Lastly, for the average force measure,
significant difference in measurement was seen in 14 of the 20 subjects (70%).
Table 4. P-values from paired t-tests on linear measures of postural control between force plate
and OpenGo insoles, eyes-closed (EC) trials
Linear Measures
rangeAP rangeML RMSAP RMSML v LAAP LAML areaCE force
Subje
ct
1 0.205 0.391 0.111 0.372 0.005 0.023 0.249 0.538 < .001
2 0.880 < .001 0.794 0.016 < .001 0.372 < .001 0.177 < .001
3 0.014 0.004 0.049 0.010 < .001 0.023 < .001 0.398 < .001
4 0.785 0.013 0.538 0.045 < .001 0.033 0.004 0.081 < .001
5 0.277 0.110 0.190 0.026 < .001 < .001 < .001 0.054 0.002
6 0.617 0.024 0.485 0.073 < .001 0.002 < .001 0.023 0.009
7 0.372 < .001 0.417 < .001 < .001 < .001 < .001 0.014 0.003
8 0.604 0.018 0.665 0.089 < .001 0.078 < .001 0.484 < .001
9 0.640 0.068 0.793 0.041 < .001 0.058 0.003 0.282 < .001
10 0.859 0.022 0.513 0.028 < .001 0.154 < .001 0.144 0.844
11 0.746 < .001 0.619 0.008 < .001 0.924 < .001 0.185 0.138
12 0.243 0.016 0.121 0.053 < .001 0.191 < .001 0.130 0.077
13 0.329 0.031 0.613 0.037 < .001 0.048 0.026 0.918 < .001
14 0.127 0.005 0.042 0.019 < .001 < .001 < .001 0.001 0.001
15 0.165 0.174 0.374 0.222 < .001 0.387 0.096 0.960 < .001
16 0.002 0.212 0.017 0.075 < .001 0.170 0.002 0.802 < .001
17 0.137 0.018 0.346 0.009 < .001 0.401 0.014 0.722 < .001
18 0.493 0.014 0.540 0.047 < .001 0.024 < .001 0.122 0.469
19 0.145 0.031 0.296 0.044 < .001 0.947 0.719 0.136 0.001
20 0.975 0.048 0.653 0.045 < .001 0.215 0.002 0.257 < .001
Looking at the linear measures from the eyes-closed trials in Table 4, for COP range in
the AP-direction, significant difference in measurement between the force plate and OpenGo

21
insoles was observed in 2 of the 20 subjects (10%). Significant difference was seen in 15 of the
20 subjects (75%) for the COP range in the ML-direction. For RMS in the AP-direction,
significant difference in measurement was seen in 3 of the 20 subjects (15%), whereas
significant difference was seen in 14 of the 20 subjects (70%) for the RMS in the ML-direction.
Significant difference was seen in the measurement of the mean total COP velocity measure in
all of the subjects (100%). For the largest amplitudes (LA) measures, significant difference in
measurement was seen in 9 of the 20 subjects (45%) in the AP-direction, and 17 of the 20
subjects (85%) in the ML-direction. For the 95% confidence ellipse area, significant difference
in measurement was seen in 3 of the 20 subjects (15%). Lastly, for the average force measure,
significant difference in measurement was seen in 16 of the 20 subjects (80%).
Table 5. P-values from paired t-test on nonlinear measures of postural control between force
plate and OpenGo insoles, eyes-open (EO) trials
Nonlinear Measures
ApEnAP ApEnML SampEnAP SampEnML λmax-AP λmax-ML
Subje
ct
1 0.013 0.009 0.014 0.008 0.181 0.012
2 0.214 0.603 0.196 0.476 0.240 0.139
3 0.027 0.864 0.025 0.946 0.006 0.320
4 0.093 0.992 0.081 0.813 0.214 0.592
5 0.172 0.568 0.157 0.363 0.007 0.286
6 0.100 0.195 0.098 0.210 0.017 0.082
7 0.005 0.887 0.005 0.593 0.018 0.029
8 0.075 0.130 0.067 0.138 0.004 0.018
9 0.021 0.150 0.026 0.119 0.006 0.174
10 0.363 0.620 0.308 0.537 0.017 0.035
11 0.223 0.332 0.222 0.282 0.289 0.049
12 < .001 0.296 0.001 0.197 0.024 0.295
13 0.036 0.747 0.040 0.872 0.038 0.235
14 0.131 0.961 0.116 0.718 0.464 0.950
15 0.140 0.995 0.142 0.937 0.183 0.585
16 0.003 0.055 0.003 0.041 0.436 0.013
17 0.022 0.136 0.015 0.126 0.105 0.005
18 0.967 0.244 0.847 0.182 0.967 0.003
19 0.047 0.554 0.054 0.787 0.106 0.901
20 0.468 0.975 0.498 0.962 0.632 0.053

22
Looking at the nonlinear measures from the EO trials in Table 5, for ApEn in the AP-
direction, significant difference in measurement between the force plate and OpenGo insoles in 9
of the 20 subjects (45%). Significant difference was seen in 1 of the 20 subjects (5%) for ApEn
in the ML-direction. For SampEn in the AP-direction, significant difference in measurement was
seen in 8 of the 20 subjects (40%), whereas significant difference was seen in 2 of the 20
subjects (10%) for SampEn in the ML-direction. Significant difference was seen in the
measurement of the largest Lyapunov exponent in the AP-direction in 9 of the 20 subjects (45%),
whereas significant difference was seen in 8 of the 20 subjects (40%) in the measurement of the
largest Lyapunov exponent in the ML-direction.
Table 6. P-values from paired t-test on nonlinear measures of postural control between force
plate and OpenGo insoles, eyes-closed (EC) trials
Nonlinear Measures
ApEnAP ApEnML SampEnAP SampEnML λmax-AP λmax-ML
Subje
ct
1 0.033 0.047 0.031 0.038 0.748 0.293
2 0.365 0.437 0.366 0.328 0.914 0.234
3 0.056 0.050 0.052 0.051 0.117 0.036
4 0.641 0.615 0.613 0.599 0.879 0.580
5 0.316 0.602 0.316 0.388 0.101 0.362
6 0.293 0.960 0.274 0.926 0.517 0.562
7 0.105 0.474 0.088 0.597 0.009 0.085
8 0.404 0.432 0.409 0.404 0.004 0.128
9 0.334 0.386 0.350 0.556 0.488 0.669
10 0.361 0.942 0.351 0.837 0.880 0.934
11 0.736 0.287 0.723 0.250 0.947 0.116
12 0.043 0.708 0.046 0.752 0.793 0.100
13 0.259 0.987 0.219 0.762 0.012 0.342
14 0.625 0.071 0.672 0.024 0.852 0.037
15 0.326 0.897 0.287 0.781 0.540 0.417
16 0.027 0.290 0.018 0.224 0.157 0.006
17 0.138 0.089 0.129 0.066 0.886 0.092
18 0.776 0.540 0.758 0.658 0.359 0.817
19 0.039 0.623 0.037 0.528 0.562 0.846
20 0.593 0.488 0.592 0.539 0.251 0.348
Looking at the nonlinear measures from the EC trials in Table 6, for ApEn in the AP-
direction, significant difference in measurement between the force plate and OpenGo insoles in 4

23
of the 20 subjects (20%). Significant difference was seen in 1 of the 20 subjects (5%) for ApEn
in the ML-direction. For SampEn in the AP-direction, significant difference in measurement was
seen in 4 of the 20 subjects (20%), whereas significant difference was seen in 2 of the 20
subjects (10%) for SampEn in the ML-direction. Significant difference was seen in the
measurement of the largest Lyapunov exponent in the AP-direction in 3 of the 20 subjects (15%),
and in 3 of the 20 subjects (15%) in the measurement of the largest Lyapunov exponent in the
ML-direction.
Table 7. P-values from paired t-test on frequency measures of postural control between force
plate and OpenGo insoles, eyes-open (EO) trials
Frequency Measures
MPFAP MPFML MDFAP MDFML BWAP BWML LPRAP LPRML MPRAP MPRML HPRAP HPRML
Su
bje
ct
1 0.014 0.007 0.902 0.010 < .001 < .001 0.999 0.103 0.467 0.913 0.276 0.003
2 0.359 0.180 0.578 0.370 < .001 0.079 0.746 0.101 0.205 < .001 0.814 0.139
3 0.084 0.596 0.805 0.293 0.010 0.020 0.891 0.320 0.229 0.112 0.009 0.774
4 0.229 0.292 0.827 0.010 < .001 < .001 0.508 0.010 0.371 0.003 0.342 0.382
5 0.248 0.104 0.289 0.766 < .001 < .001 0.562 0.067 0.143 < .001 0.197 0.460
6 0.072 0.267 0.757 0.039 < .001 0.229 0.987 0.416 0.403 0.015 0.251 0.117
7 0.017 0.391 0.413 0.357 < .001 < .001 0.765 0.098 0.492 0.021 < .001 0.067
8 0.041 0.025 0.626 0.857 < .001 < .001 0.495 0.220 0.295 0.304 0.039 0.012
9 0.003 0.238 0.999 0.569 < .001 0.311 0.356 0.325 0.314 0.147 0.011 0.026
10 0.415 0.039 0.579 0.846 < .001 < .001 0.044 0.277 0.020 0.043 0.231 0.014
11 0.485 0.089 0.769 0.840 0.033 < .001 0.530 0.448 0.262 0.029 0.702 0.006
12 < .001 0.029 0.754 0.815 < .001 < .001 0.742 0.067 0.010 0.221 0.036 0.005
13 0.015 0.200 0.741 0.432 < .001 0.365 0.145 0.023 0.366 < .001 0.009 0.932
14 0.115 0.037 0.606 0.072 < .001 < .001 0.953 0.002 0.457 0.001 0.825 0.980
15 0.340 0.708 0.861 0.356 0.027 0.020 0.540 0.058 0.418 0.039 0.660 0.322
16 0.014 0.017 0.898 0.860 < .001 < .001 0.861 0.907 0.557 0.070 0.615 0.004
17 0.186 0.091 0.683 0.380 < .001 < .001 0.806 0.658 0.121 0.287 0.043 0.018
18 0.585 0.152 0.621 0.622 0.094 < .001 0.076 0.693 0.084 0.193 0.166 0.154
19 0.208 0.694 0.003 0.618 < .001 < .001 0.310 0.083 0.092 0.056 0.834 0.333
20 0.307 0.022 0.991 0.781 0.259 0.310 0.813 0.851 0.599 0.096 0.617 0.014
Looking at the frequency-based measures from the EO trials in Table 7, for MPF in the
AP-direction, significant difference in measurement is seen in 7 of the 20 subjects (35%).
Significant difference is seen in 7 of the 20 subjects (35%) for MPF in the ML-direction. For
MDF in the AP-direction, significant difference is seen in 1 of the 20 subjects (5%), whereas

24
significant difference was seen in 3 of the 20 subjects (15%) for MDF in the ML-direction. For
bandwidth in the AP-direction, significant difference is seen in 18 of the 20 subjects (90%),
whereas significant difference is seen in 15 of the 20 subjects (75%) for bandwidth in the ML-
direction. For the low-power ratio measure in the AP-direction, significant difference is seen in 1
of the 20 subjects (5%), whereas significant difference is seen in 3 of the 20 subjects (15%) in
the low-power ratio measure in the ML-direction. For the medium-power ratio measure in the
AP-direction, significant difference is seen in 2 of the 20 subjects (10%), whereas significant
difference is seen in 10 of the 20 subjects (50%) in the medium-power ratio measure in the ML-
direction. For the high-power ratio measure in the AP-direction, significant difference is seen in
7 of the 20 subjects (35%), whereas significant difference is seen in 9 of the 20 subjects (45%) in
the high-power ratio measure in the ML-direction.
Table 8. P-values from paired t-test on frequency measures of postural control between force
plate and OpenGo insoles, eyes-closed (EC) trials
Frequency Measures
MPFAP MPFML MDFAP MDFML BWAP BWML LPRAP LPRML MPRAP MPRML HPRAP HPRML
Su
bje
ct
1 0.548 0.005 0.181 0.279 < .001 < .001 0.588 0.056 0.552 0.927 0.588 0.004
2 0.833 0.106 0.779 0.905 0.050 < .001 0.732 0.513 0.566 0.178 0.894 0.102
3 0.243 0.118 0.559 0.003 < .001 0.013 0.962 < .001 0.209 < .001 0.106 0.003
4 0.652 0.374 0.180 0.780 0.089 0.252 0.448 0.540 0.453 0.085 0.517 0.144
5 0.277 0.194 0.565 0.029 < .001 < .001 0.701 0.031 0.558 < .001 0.424 0.616
6 0.680 0.110 0.727 0.708 0.003 0.014 0.767 0.600 0.645 0.052 0.981 0.123
7 0.194 0.335 0.572 0.251 0.002 0.002 0.804 0.257 0.228 0.020 0.096 0.060
8 0.405 0.119 0.820 0.468 0.006 < .001 0.897 0.947 0.370 0.041 0.345 0.087
9 0.584 0.925 0.852 0.287 0.004 0.016 0.959 0.283 0.679 0.236 0.313 0.849
10 0.793 0.190 0.562 0.777 < .001 < .001 0.294 0.490 0.516 0.011 0.366 0.217
11 0.727 0.205 0.764 0.155 0.423 < .001 0.160 0.308 0.184 0.029 0.291 0.084
12 0.309 0.163 0.597 0.916 < .001 0.329 0.327 0.391 0.310 0.075 0.294 0.105
13 0.845 0.590 0.635 0.012 0.015 < .001 0.687 0.014 0.619 0.032 0.874 0.660
14 0.908 0.002 0.089 0.955 0.094 < .001 0.287 0.326 0.151 0.002 0.295 0.031
15 0.757 0.415 0.536 0.538 0.064 0.142 0.252 0.385 0.202 0.133 0.202 0.910
16 0.124 0.054 0.028 0.141 < .001 0.008 0.005 0.532 0.085 0.130 0.029 0.007
17 0.754 0.013 0.368 0.311 0.074 0.001 0.173 0.225 0.088 0.039 0.201 0.020
18 0.725 0.572 0.665 0.301 0.216 0.151 0.711 0.316 0.648 0.113 0.387 0.229
19 0.653 0.224 0.041 0.862 < .001 0.002 0.506 0.205 0.371 0.140 0.916 0.671
20 0.842 0.689 0.830 0.249 0.090 0.539 0.555 0.308 0.519 0.110 0.468 0.335

25
Looking at the frequency-based measures from the EC trials in Table 8, no significant
difference in measurement was found for MPF in the AP-direction. Significant difference is seen
in 3 of the 20 subjects (15%) for MPF in the ML-direction. For MDF in the AP-direction,
significant difference is seen in 2 of the 20 subjects (10%), whereas significant difference was
seen in 3 of the 20 subjects (15%) for MDF in the ML-direction. For bandwidth in the AP-
direction, significant difference is seen in 13 of the 20 subjects (65%), whereas significant
difference is seen in 15 of the 20 subjects (75%) for bandwidth in the ML-direction. For the low-
power ratio measure in the AP-direction, significant difference is seen in 1 of the 20 subjects
(5%), whereas significant difference is seen in 3 of the 20 subjects (15%) in the low-power ratio
measure in the ML-direction. For the medium-power ratio measure in the AP-direction, no
significant difference was found, whereas significant difference is seen in 9 of the 20 subjects
(45%) in the medium-power ratio measure in the ML-direction. For the high-power ratio
measure in the AP-direction, significant difference is seen in 1 of the 20 subjects (5%), whereas
significant difference is seen in 5 of the 20 subjects (25%) in the high-power ratio measure in the
ML-direction.
3.2 Discussion of OpenGo validity
3.2.1 Linear measures
Starting with the discussion of the linear measures of postural control, it is observed that
for both visual conditions, significant difference in measurement between the two devices is
more prevalent in the measures calculated based on the ML-COP data as compared to the AP-
COP data. This can be understood when viewing an example COP time-series for each direction.
The OpenGo COP time-series in the AP-direction in Figure 3 displays many of the same
shapes and peaks as the force plate data. As a result, it is found that for most trials, the linear
measures in the AP-direction (specifically COP range and RMS) calculated via the OpenGo are
found to be valid (i.e. not significantly different from the measures calculated by the force plate).
The OpenGo COP time-series in the ML-direction in Figure 4 shows some similar shapes
to the force plate data, but the magnitudes are not very similar. Because of these inaccurate
magnitudes, there is an increased number of significantly different measurements between the
force plate and OpenGo for linear measures of postural control in the ML-direction.
Additionally, there is a noticeable increase in the fluctuation of the COP, which leads to

26
increased COP path length, and subsequently, an increased COP velocity. The mean COP
velocity measure, in addition to the COP range and RMS in the ML-direction, should not be used
in balance assessment using the OpenGo.
Figure 3. Comparison of force plate and OpenGo COP time-series, AP-direction, EO
Figure 4. Comparison of force plate and OpenGo COP time-series, ML-direction, EO
In addition to the ML-direction parameters and mean total velocity measure, the largest
amplitudes measurements do not agree for the majority of the trials. The largest amplitude
measures are calculated based on finding the largest peak-valley or valley-peak transition

27
between two consecutive data points in the COP time-series. In both the AP- and ML-direction
time-series above, it can be observed that the force plate data is smoother and does not display as
many rapid fluctuations like the OpenGo data displays. As a result, the OpenGo generally
displays a much larger LA measure, which may not be representative of the actual COP
movement. The LA measure should not be used in balance assessment with the OpenGo.
The 95% confidence ellipse area measure was found to be valid for the OpenGo for the
majority of trials for both visual conditions. This is interesting to note since the ellipse area is
calculated as a function of the COP data in both directions as well as their standard deviations.
So, although the linear ML-direction measures for the majority of the trials were considered
invalid, the 95% confidence ellipse area measurement is comparable between the OpenGo and
force plate.
Lastly, the average force measured by the OpenGo was found to be significantly different
from that of the force plate for the majority of trials in both visual conditions.
Figure 5. Force vs. time for a standing trial of a 55.6 kg subject

28
Figure 6. Force vs. time for a standing trial of a 69.4 kg subject
Figure 7. Force vs. time for a standing trial of an 83.9 kg subject

29
Figure 5, Figure 6, and Figure 7 display the force as a function of time for a trial from
one of the lightest-weighing subjects, a subject close to the average weight of the subject
population, and one of the heaviest subjects, respectively. As part of preliminary work, it was
found that the insole sensors were quite sensitive to temperature change as the force
measurement of the OpenGo would increase over the span of the test. After introducing a 2-3
minute acclimation period before every test run in this study, the drift issue seems to have been
resolved. However, based on the figures presented, the OpenGo underestimates the forces
exerted by the heavier subjects. One suggestion for why this is the case might be that the
subjects’ shoes are providing a cushion or dampening between the insoles and force plate,
lowering the force value on the insoles. It is interesting to note that in Figure 5, the force is
overestimated by the OpenGo.
A post-study test was performed in an attempt to understand why there are such
inaccuracies in force measurement. There were 10 one-minute EO trials performed by one
subject, 5 with insoles inside of shoes (shoes-on) and 5 with insoles on the force plate (shoes-
off). Two different insole pairs were tested by the same subject. The insoles were zeroed before
every trial, same as the protocol of the original study. A t-test was performed between the mean
force measurements of the “shoes-on” trials and “shoes-off” trials (Table 9).
Table 9. Force comparisons (in N) between force plate (FP) and OpenGo insoles (OG) for 5
shoes-on EO trials and 5 shoes-off EO trials, for 2 separate insole pairs (same subject)
#5 insole (US 7.5/8.5) #6 insole (US 8.5/9.5)
FP OG FP OG
Sh
oes
on
EO-1 638.7 1057.6
Sh
oes
on
EO-1 635.3 800.3
EO-2 638.7 992.9 EO-2 635.3 763.6
EO-3 638.7 950.4 EO-3 635.7 761.7
EO-4 638.5 959.8 EO-4 635.7 752.8
EO-5 638.7 892.9 EO-5 635.6 803.7
FP OG FP OG
Sho
es o
ff EO-1 633.1 893.8
Sho
es o
ff EO-1 635.3 700.9
EO-2 632.8 926.1 EO-2 635.3 686.8
EO-3 632.8 965.1 EO-3 635.7 738.9
EO-4 632.8 1079.1 EO-4 635.7 769.7
EO-5 633.2 931.8 EO-5 635.6 732.1

30
No significant difference was found between the mean force measured by the OpenGo
insoles with shoes-on versus shoes-off for the #5 insole (p = 0.7901) and the #6 insole (p = 0.07).
From this result, it can be said that the protocol is not the reason for inaccurate measurement.
There must be an underlying limitation, possibly related to insole hardware, which leads to
inaccurate force measurement. Future work is needed to definitively confirm the cause of such
force inaccuracies. Based on the results of this study, it is concluded that the OpenGo should not
be used for force/weight measurement.
3.2.2 Nonlinear and frequency-based measures
For ApEn in the AP-direction, there are five more EO trials considered invalid OpenGo
measurements as compared to the EC trials. Similarly, in SampEn in the AP-direction, there are
four more EO trials considered invalid compared to the EC trials. Going back to the literature,
these entropy measures quantify randomness in a signal. Because of the increased number of
significantly different measurements in the eyes-open trials for ApEnAP and SampEnAP, they
cannot be recommended for use with the OpenGo. One reason for the difference in measurement
could be due to the experimental nature of this study. Signal noise can have a large impact on the
calculation of these entropy measures. While best efforts have been made to filter out all of the
noise in both force plate and OpenGo COP signals, there may be some residual noise in one or
both of the signals not captured in the filter that can cause a difference in measurement between
the two devices. Along those lines, another reason for inaccurate entropy measures could be
related to the bandwidth (BW) measures. In both visual conditions and directions, BW is
overestimated by the OpenGo. Since there is a wider range of frequencies captured by the
OpenGo compared to the force plate, its signal may be seen as more random. This thought-
process stems from the fact that a signal of one frequency (e.g. a sine wave) is perfectly
repeatable, and would have an entropy value of 0. ApEnML and SampEnML can be considered
valid to use in balance assessment using the OpenGo, but special care must be taken in filtering
noise out of the COP signal.
The largest Lyapunov exponent measure, similarly to the entropy measures, shows an
increase in invalid OpenGo measurements in EO trials as compared to EC trials. For this reason,
the largest Lyapunov exponent measure should not be used in balance assessment with the
OpenGo. There are also no common trends between the two devices in the calculation of the

31
largest Lyapunov exponent (i.e. OpenGo is not consistently above or consistently below the
force plate measures for either visual condition). The difference in frequency bandwidth between
the two devices may also play a role in the difference in measurement.
For the mean power frequency (MPF) in both directions, significant difference in
measurement between the two devices is more prevalent in the measures calculated when eyes
are open versus when eyes are closed. Research has shown that MPF increases when the visual
system is impaired [26]. This could suggest that the OpenGo sometimes has difficulty capturing
very low-frequency content. In the eyes-closed trials, there is a better agreement between the two
devices. As shown in Figure 8 and Figure 9, when eyes are closed, there is a small shift in the
frequency content to higher frequency; perhaps to a range at which the OpenGo can better
capture the frequency content. Because of the increase in significantly different measurements in
the EO trials, the MPF measure is not considered valid for use with the OpenGo. The median
frequency (MDF) is considered valid for use with the OpenGo, showing good agreement in
measurement not only for both visual conditions but also both directions of measurement.
Figure 8. Fast Fourier transform of force plate and OpenGo COP, eyes-open
Figure 8 and Figure 9 represent the frequency distribution of the force plate and OpenGo
COP signals (performed via the fft function in MATLAB) for both an eyes-open and eyes-closed
trial from the same subject. In the force plate plots, it can be visually observed that most of the
frequency content is between 0 Hz and roughly 3 Hz. However, in the OpenGo plots, the
frequency content is distributed over a wider range. As a result, the bandwidth calculations for

32
the OpenGo are always larger than the force plate (and subsequently found to be invalid). The
OpenGo COP signal is low-pass filtered at a cutoff frequency of 8 Hz, which is generally a high
enough frequency at which human balance is not captured. However, the inflated bandwidth
values could be due to some unfiltered noise in lower frequencies. Based on this study, it can be
concluded that the bandwidth measure is not valid to use for balance assessment with the
OpenGo.
Figure 9. Fast Fourier transform of force plate and OpenGo COP, eyes-closed
The last set of measures, the low (LPR), medium (MPR), and high (MPR) frequency
power ratios show some variability in validity for use in balance assessment with the OpenGo.
As a reminder, the LPR measure refers to the percentage of total power of the signal in the
frequency band 0-0.3 Hz, MPR is the ratio of total power in the frequency band 0.3-1 Hz, and
HPR is the ratio of total power in the frequency band 1-5 Hz. LPR (both directions) and MPR
(AP-direction) were shown to have good agreement between devices. MPR (ML-direction) and
HPR (both directions) showed a higher level of inconsistency in agreement than LPR, and would
not be recommended for use with the OpenGo. Most of the power contained in both the force
plate and OpenGo frequency spectrums is found in the very low-frequency band (0-0.3 Hz) for
both EO and EC trials. However, looking back to the larger bandwidth measurements for the
OpenGo, the higher frequency content that is found in the OpenGo causes a discrepancy between
two devices for the MPR and HPR measures.

33
Chapter 4. Conclusions and Future Work
Postural control is a complex system in which the central nervous system regulates
information from various sensory systems, leading to corrective movement via the
musculoskeletal system to maintain upright stance. When one or more of these systems is
impaired, a person’s balance can be negatively affected. In order to determine the root cause of
balance complications, a person may undergo clinician-supervised qualitative tests, which are
subjective in nature and may not detect small changes over time which contribute to balance
issues. Force plates and motion capture systems used in specialized laboratories are highly
accurate for assessing small changes in balance, but are costly and require expert operation.
A validation study was performed in order to assess the validity of a new wearable
technology in the form of wireless sensor insoles, the OpenGo SCIENCE, for quiet stance. These
insoles are designed to take balance and gait analysis outside of laboratory settings via a
portable, wireless, and long-term monitoring device. In order for the device to be a feasible
alternative to other balance assessment tools such as a force plate, the accuracy of the device
needed to be evaluated. A selection of linear, nonlinear, and frequency-based parameters used in
biomechanics and human balance research were calculated and compared from bipedal stance
trials recorded by both the OpenGo insoles and a research-grade force plate manufactured by
AMTI, Inc.
In this study, it was found that for linear COP measures, COP range and RMS in the AP-
direction, in addition to the 95% confidence ellipse area, are considered valid measures to
calculate from COP data acquired by the OpenGo. For nonlinear COP measures, ApEn and
SampEn in the ML-direction are considered valid measures to calculate from OpenGo data. For
frequency-based measures, the MDF and LPR measures in both directions of motion, as well as
MPR in the AP-direction, are considered valid for assessing balance with the OpenGo.
The results of this study are in agreement with past validation studies [9,11] in that the
linear OpenGo COP measures in the ML-direction should not be used for analysis. There was a
noticeable increase in COP fluctuation as compared to the corresponding force plate time-series
in the ML-direction. This difference lead to invalid measurements in the COP range and RMS in
the ML-direction as well as the mean total velocity measure. Average force calculations for each

34
measure were also found to be inconsistent, and it was recommended that the OpenGo force
measurement should not be used for analysis.
The increase in inaccurate measurement for the OpenGo linear COP measures in the ML-
direction may be because of how the 13 capacitive pressure sensors are laid out. Figure 10
represents the layout of the pressure sensors as well as the battery pack.
Figure 10. Layout of pressure sensors and battery on OpenGo insoles
In the ML-direction, there are not as many sensors ‘stacked’ side-by-side as there are
‘stacked’ in the AP-direction. When a subject, for example, rolls their foot so that their weight is
only on the edge sensors, a spike in pressure can occur because the weight is not distributed over
as many sensors. This, in turn, causes the COP in the ML-direction to also spike or drop quickly
depending on the direction of the COP motion.
A post-study test found that there was no significant difference in measurement between
OpenGo data from trials where insoles were inside of the subjects’ shoes versus when insoles
were placed on the force plate (shoes-off). From this result, it could be said that the test protocol
was not the cause of inaccurate force readings. The sensor layout may also be a factor in the
inaccurate force measurement. Figure 10 shows that there are certain areas of the insoles
(specifically in the area of the battery pack as well as the top outer region of the feet) that do not
have pressure sensors. Thus, part of the distributed force applied by the feet may not be captured

35
by the pressure sensors and this could affect the force output of the insoles. As part of future
work, it may be advantageous to perform an experiment that observes force measurement when
‘known’ (calibration) weights are placed at different areas of the insoles.
Additionally, as part of future work, it may be beneficial to make a “force correction” and
calculate COP based on the corrected force and observe any difference in measurement between
the insoles and force plate. The OpenGo insoles calculate COP based on the location of each of
the 13 pressure sensors’ centroids and the corresponding pressure values. A force correction
could be done if the subject’s weight was already known, or if it was verified with another
device. From here, a correction could be made to each data point in the OpenGo force dataset to
“shift” the data so that the average force over the time-series is the correct force. Using the
coordinates of the sensors, the area of each sensor (both of which have been provided by
Moticon), and the relationship between pressure and force, a new COP could be calculated and
compared to the force plate. Another area to explore as to why force measurement is inaccurate
may be the “zeroing” process. The zeroing process subtracts the original weight value (at the
time the zeroing is initiated) from every subsequent weight reading.
It was found that for nonlinear analysis, ApEn and SampEn in the ML-direction are valid
to calculate from the OpenGo COP data. Additionally, for frequency-based analysis, MDF and
LPR (in both directions of motion) were found to be valid to calculate from the OpenGo COP
data. It was observed that the OpenGo tends to have higher amplitudes in the higher frequency
ranges (between 1-8 Hz), which leads to a larger bandwidth measurement and therefore, higher
values for measures such as MPF, MPR, and HPR. Additionally, these larger bandwidth
measures can contribute to the COP signal being “more random” and thus increasing the entropy
(ApEn and SampEn) measures.
A limitation of this study is that the OpenGo data were low-pass filtered at a frequency of
about 8 Hz, which is generally considered a high enough frequency at which human balance is
not captured. However, there may be additional noise at lower frequencies that were not filtered
out. The data was re-analyzed at a cutoff frequency of 5 Hz (for both devices). Table 10 shows
the change in results (highlighted in yellow) as a result of lowering the cutoff frequency. The
main changes are that the largest amplitudes measure in the AP-direction was found to be valid,
and the sway area was found not to be valid for use with the OpenGo. There were more changes
found in the nonlinear measures, where ApEn and SampEn in the AP-direction were considered

36
valid, and the ML-direction entropy measures were found not to be valid for use with the
OpenGo. Lastly, for the frequency-based measures, it was found that with the lower cutoff
frequency, MPF (AP-direction) was found to be valid, and that MDF (in the ML-direction) was
found not to be valid. Additionally, MPR (AP-direction) was found not to be valid for use with
the OpenGo insoles.
Table 10. Percentage of subjects with significantly different measurements and validity result
after low-pass filter cutoff frequency changed to 5 Hz for both devices (yellow cells indicate a
change in validity from original analysis)
By lowering the cutoff frequency of the low-pass filter, it was found that while there is an
increase in agreement between the force plate and OpenGo for some measures (such as LAAP,
AP-direction entropy values, and MPFAP), it is also shown that other measures that were
originally said to be valid, are considered not valid for use with the OpenGo as a result. It can be
said that nonlinear and frequency-based measures, as well as measures that rely on COP data in
the ML-direction (such as the 95% confidence ellipse area), are very sensitive to the low-pass
filter cutoff frequency.
% of subjects with significantly
different measurements
% of subjects with
significantly different
measurements
% of subjects with
significantly different
measurements
Measure EO EC Result Measure EO EC Result Measure EO EC Result
rangeAP 15% (3/20) 10% (2/20) Valid ApEnAP 5% (1/20) 5% (1/20) Valid MPFAP 5% (1/20) 5% (1/20) Valid
rangeML 95% (19/20) 100% (20/20) Not valid ApEnML 25% (5/20) 30% (6/20) Not valid MPFML 30% (6/20) 35% (7/20) Not valid
RMSAP 15% (3/20) 10% (2/20) Valid SampEnAP 5% (1/20) 5% (1/20) Valid MDFAP 5% (1/20) 5% (1/20) Valid
RMSML 100% (20/20) 95% (19/20) Not valid SampEnML 25% (5/20) 30% (6/20) Not valid MDFML 10% (2/20) 30% (6/20) Not valid
v 45% (9/20) 55% (11/20) Not valid λmax-AP 30% (6/20) 10% (2/20) Not valid BWAP 75% (15/20) 40% (8/20) Not valid
LAAP 0% (0/20) 20% (4/20) Valid λmax-ML 20% (4/20) 35% (7/20) Not valid BWML 80% (16/20) 75% (15/20) Not valid
LAML 90% (18/20) 90% (18/20) Not valid LPRAP 5% (1/20) 5% (1/20) Valid
areaCE 85% (17/20) 90% (18/20) Not valid LPRML 10% (2/20) 0% (0/20) Valid
force 70% (14/20) 80% (16/20) Not valid MPRAP 25% (5/20) 5% (1/20) Not valid
MPRML 30% (6/20) 60% (12/20) Not valid
HPRAP 70% (14/20) 75% (15/20) Not valid
HPRML 45% (9/20) 35% (7/20) Not valid

37
Chapter 5. References
[1] Patel, M., 2009, “Postural Control and Adaptation to Threats to Balance Stability,” Lund
University.
[2] Sutherland, D. H., 1978, “Gait Analysis in Cerebral Palsy.,” Dev. Med. Child Neurol.,
20(6), pp. 807–813.
[3] Horak, F. B., and Mancini, M., 2013, “Objective Biomarkers of Balance and Gait for
Parkinson’s Disease Using Body-Worn Sensors.,” Mov. Disord., 28(11), pp. 1544–1551.
[4] Barker, S., Craik, R., Freedman, W., Herrmann, N., and Hillstrom, H., 2006, “Accuracy,
Reliability, and Validity of a Spatiotemporal Gait Analysis System,” Med. Eng. Phys.,
28(5), pp. 460–467.
[5] Chen, S., Lach, J., Lo, B., and Yang, G.-Z., 2016, “Toward Pervasive Gait Analysis With
Wearable Sensors: A Systematic Review,” IEEE J. Biomed. Heal. Informatics, 20(6), pp.
1521–1537.
[6] Ali, A., Sundaraj, K., Ahmad, B., Ahamed, N., and Islam, A., 2012, “Gait Disorder
Rehabilitation Using Vision and Non-Vision Based Sensors: A Systematic Review,”
Bosn. J. Basic Med. Sci., 12(3), pp. 193–202.
[7] Simon, S. R., 2004, “Quantification of Human Motion: Gait Analysis—benefits and
Limitations to Its Application to Clinical Problems,” J. Biomech., 37(12), pp. 1869–1880.
[8] Moticon GmbH, 2016, “Moticon SCIENCE Product Booklet” [Online]. Available:
http://www.moticon.de/wp-content/uploads/2017/05/Moticon-
SCIENCE_booklet_en_print_01.01.01.pdf.
[9] Oerbekke, M. S., Stukstette, M. J., Schutte, K., de Bie, R. A., Pisters, M. F., and
Vanwanseele, B., 2017, “Concurrent Validity and Reliability of Wireless Instrumented
Insoles Measuring Postural Balance and Temporal Gait Parameters,” Gait Posture, 51, pp.
116–124.
[10] Braun, B. J., Veith, N. T., Hell, R., Dobele, S., Roland, M., Rollmann, M., Holstein, J.,
and Pohlemann, T., 2015, “Validation and Reliability Testing of a New, Fully Integrated
Gait Analysis Insole,” J. Foot Ankle Res., 8.
[11] Stoggl, T., and Martiner, A., 2017, “Validation of Moticon’s OpenGo Sensor Insoles
during Gait, Jumps, Balance and Cross-Country Skiing Specific Imitation Movements,” J

38
Sport. Sci, 35(2), pp. 196–206.
[12] Nagymáté, G., and Kiss, R. M., 2016, “Parameter Reduction in the Frequency Analysis of
Center of Pressure in Stabilometry,” Period. Polytech. Mech. Eng. Vol 60 No 4.
[13] Prieto, T. E., Myklebust, J. B., Hoffmann, R. G., Lovett, E. G., and Myklebust, B. M.,
1996, “Measures of Postural Steadiness: Differences between Healthy Young and Elderly
Adults,” IEEE Trans. Biomed. Eng., 43(9), pp. 956–966.
[14] Palmieri, R. M., Ingersoll, C. D., Stone, M. B., and Krause, B. A., 2002, “Center-of-
Pressure Parameters Used in the Assessment of Postural Control,” J. Sport Rehabil., 11(1),
pp. 51–66.
[15] Whittle, M. W., 2014, Gait Analysis: An Introduction, Butterworth-Heinemann.
[16] Loram, I. D., Maganaris, C. N., and Lakie, M., 2004, “Paradoxical Muscle Movement in
Human Standing,” J. Physiol., 556(Pt 3), pp. 683–689.
[17] Shumway-Cook, A., and Woollacott, M. H., 1995, Motor Control: Theory and Practical
Applications, Williams & Wilkins.
[18] Mancini, M., and Horak, F. B., 2010, “The Relevance of Clinical Balance Assessment
Tools to Differentiate Balance Deficits,” Eur. J. Phys. Rehabil. Med., 46(2), pp. 239–248.
[19] Whittle, M. W., 1996, “Clinical Gait Analysis: A Review,” Hum. Mov. Sci., 15(3), pp.
369–387.
[20] Tao, W., Liu, T., Zheng, R., and Feng, H., 2012, “Gait Analysis Using Wearable Sensors,”
Sensors , 12(2).
[21] Westbrook, M. H., and Turner, J. D., 1994, “Accelerometers,” Automot. Sensors, pp.
150–174.
[22] Yazdi, N., Ayazi, F., and Najafi, K., 1998, “Micromachined Inertial Sensors,” Proc. IEEE,
86(8), pp. 1640–1659.
[23] Bland, J. M., and Altman, D. G., 1999, “Measuring Agreement in Method Comparison
Studies,” Stat. Methods Med. Res., 8(2), pp. 135–160.
[24] Davis, J. R., Campbell, A. D., Adkin, A. L., and Carpenter, M. G., 2009, “The
Relationship between Fear of Falling and Human Postural Control,” Gait Posture, 29(2),
pp. 275–279.
[25] Cavanaugh, J. T., Mercer, V. S., and Stergiou, N., 2007, “Approximate Entropy Detects
the Effect of a Secondary Cognitive Task on Postural Control in Healthy Young Adults: A

39
Methodological Report,” J. Neuroeng. Rehabil., 4(1), p. 42.
[26] Donker, S. F., Roerdink, M., Greven, A. J., and Beek, P. J., 2007, “Regularity of Center-
of-Pressure Trajectories Depends on the Amount of Attention Invested in Postural
Control,” Exp. Brain Res., 181(1), pp. 1–11.
[27] Nagy, E., Toth, K., Janositz, G., Kovacs, G., Feher-Kiss, A., Angyan, L., and Horvath, G.,
2004, “Postural Control in Athletes Participating in an Ironman Triathlon,” Eur. J. Appl.
Physiol., 92(4), pp. 407–413.
[28] Linens, S. W., Ross, S. E., Arnold, B. L., Gayle, R., and Pidcoe, P., 2014, “Postural-
Stability Tests That Identify Individuals With Chronic Ankle Instability,” J. Athl. Train.,
49(1), pp. 15–23.
[29] McKeon, P. O., and Hertel, J., 2008, “Systematic Review of Postural Control and Lateral
Ankle Instability, Part II: Is Balance Training Clinically Effective,” J. Athl. Train., 43(3),
pp. 305–315.
[30] Monge-Alvarez, J., 2015, “A Set of Entropy Measures for Temporal Series (1D Signals).”
[31] Pham, T. D., 2011, “Possibilistic Entropy: A New Method for Nonlinear Dynamical
Analysis of Biosignals BT - Knowledge-Based and Intelligent Information and
Engineering Systems,” A. König, A. Dengel, K. Hinkelmann, K. Kise, R.J. Howlett, and
L.C. Jain, eds., Springer Berlin Heidelberg, Berlin, Heidelberg, pp. 466–473.
[32] Swe, E. M. M., and Pwint, M., 2008, “An Efficient Approach for Classification of Speech
and Music BT - Advances in Multimedia Information Processing - PCM 2008,” Y.-M.R.
Huang, C. Xu, K.-S. Cheng, J.-F.K. Yang, M.N.S. Swamy, S. Li, and J.-W. Ding, eds.,
Springer Berlin Heidelberg, Berlin, Heidelberg, pp. 50–60.
[33] Ghofrani, M., Olyaei, G., Talebian, S., Bagheri, H., and Malmir, K., 2017, “Test-Retest
Reliability of Linear and Nonlinear Measures of Postural Stability during Visual
Deprivation in Healthy Subjects,” J. Phys. Ther. Sci., 29(10), pp. 1766–1771.
[34] Rosenstein, M. T., Collins, J. J., and De Luca, C. J., 1993, “A Practical Method for
Calculating Largest Lyapunov Exponents from Small Data Sets,” Phys. D Nonlinear
Phenom., 65(1), pp. 117–134.
[35] mirwais, 2013, “Largest Lyapunov Exponent with Rosenstein’s Algorithm.”