
Abstract of Papers:- - Malaysian Gas...
37
Transcript of Abstract of Papers:- - Malaysian Gas...


Abstract of Papers:-
Managing the integrity of a pipeline system aims to improve the health, safety and
environment (HSE) of pipeline systems and to allocate operator resources effectively to
provide a structural, easily communicated means for selecting and implementing risk
reduction activities.
This paper gives a general introduction of recently research in pipeline integrity
management around the world, and will address subjects such as QRA, ECA, EFFS and QRBI.
• QRA based RBI is a quantitative analysis both in PoF and CoF for different pipeline
sections.
• Engineering Criticality Assessment (ECA) based on fracture mechanics can be used to
determine the flaw acceptance and inspection criteria in fatigue and fracture design of
risers and flowlines.

Abstract of Papers (cont’d) :-
• The extended-fitness-for-services (EFFS) assessment may be applied to evaluate the
integrity of an in-service pipeline section containing damages.
• A QRBI is mainly used to do a quantitative assessment in infant mortality phase for a
new pipeline, based on which to determine the major degradation mechanisms, high
risk locations and establish optimized inspection schedule to ensure pipeline don’t fail in
the burn-in phase.
Then integrity management software based on the aforementioned theories will be
introduced briefly.
Key words: Integrity Management, QRA, ECA, EFFS, QRBI
Dr. Yong Bai
Mohd Ashri
Vincent Hui Shao
OFFSHORE PIPELINES & RISERS
Enhanced

Regular Pipeline Integrity Management Defect Assessment (Remaining Strength)
Free-Span Assessment
On-bottom Stability
Corrosion Rate
Risk-Based Inspection (RBI)
Fitness For Service (FFS)
Structural Reliability Analysis (SRA)
Enhancement of PIM OFFSHORE PIPELINES & RISERS
Enhanced Pipeline Integrity Assessment
Specific PARLOC Data Base
QRA Based RBI
Extended Fitness For Service (QRA/SRA based FFS)
Engineering Critical Assessment (ECA)

1. Specific PARLOC Data Base
OFFSHORE PIPELINES & RISERS

Pipeline Database
Contents of Database
Sources of Data
Data Collection
Data Collation and Verification
Incident & Defect Database
Contents of Database
Sources of Data
Data Collection
Data Collation and Verification
Loss of Containment Incidents
Causes and Consequences of Incidents
Analysis of Loss of Containment Incidents
Factors affecting Leak Frequencies
Incidents to Safety Valves
Incidents to Umbilical, Jumpers and Hoses
Assessment of Incidents to Pipelines
Causes of Incidents
Tabulation of the Frequency of Loss of Containment
Pipeline Failure Database PARLOC OFFSHORE PIPELINES & RISERS
To develop and update databases that collect all of the failure incidents occurred to and some selected corrosion defects in the offshore pipelines and static steel risers owned or operated by a certain area:

Sources of Data:
Specific Pipeline Information, e.g.:
• Pipeline No. 1 (12in, X60, 2Km)
• PL No. 2 (10 in, X50, 9km, etc.)
PARLOC 90
PARLOC 96
Journal articles, published papers etc.
Pipeline Operators
UK Health and Safety Executive
(HSE) pipeline database, 1992
Other database
Pipeline Failure Database PARLOC OFFSHORE PIPELINES & RISERS
Incidents Database

Pipeline Failure Database PARLOC OFFSHORE PIPELINES & RISERS
Analysis of Loss of Containment Incidents
• The specific databases will collect information and data for the pipelines and risers owned/operated by a
certain area, e.g. Asia.
• The UK PARLOC databases have shown us how useful these databases are in risk assessment and
management. We may however, compare our specific PARLOC databases with the UK PARLOC databases.
• Once the specific PARLOC databases are established, they may be used effectively for the extended
assessment of FFS and RBI of pipelines and risers.

OFFSHORE PIPELINES & RISERSPipeline Failure Database PARLOC

2. QRA Based RBI
OFFSHORE PIPELINES & RISERS
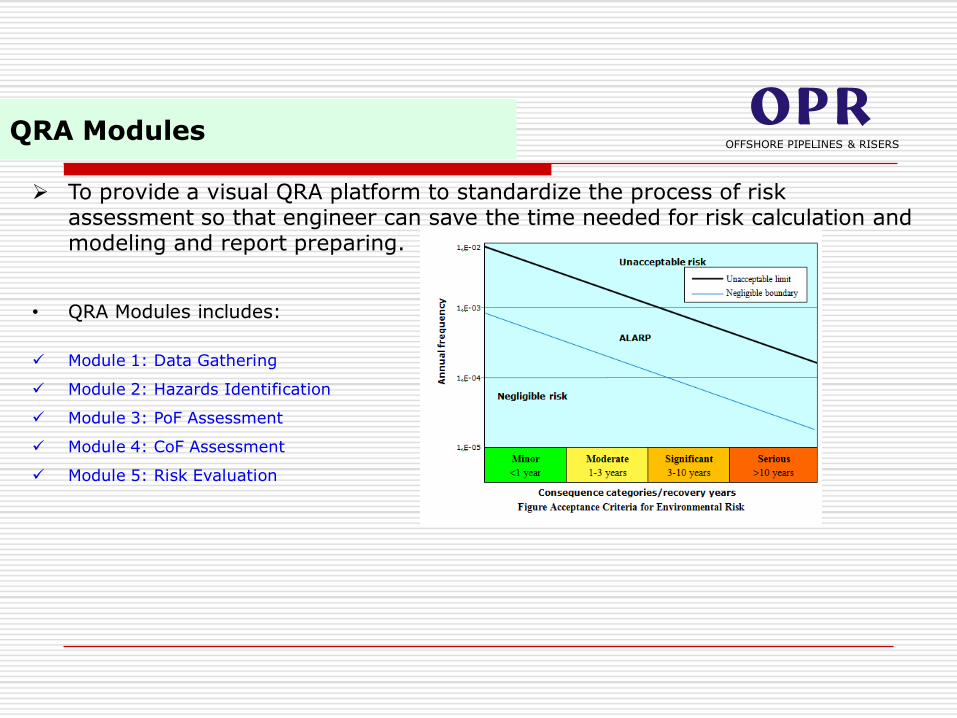
To provide a visual QRA platform to standardize the process of risk assessment so that engineer can save the time needed for risk calculation and modeling and report preparing.
• QRA Modules includes:
Module 1: Data Gathering
Module 2: Hazards Identification
Module 3: PoF Assessment
Module 4: CoF Assessment
Module 5: Risk Evaluation
QRA ModulesOFFSHORE PIPELINES & RISERS

Module 1: Data gathering
Pipeline design data
Pipeline operating data
Pipeline inspection data if any
Environmental data
Geographical data
Emergency response mechanism
Inspection and monitoring scheme
Marine traffic statistics
Module 3: PoF assessment
Internal corrosion
External corrosion
Erosion
Welding & materials
On bottom stability
Free-span
External impact
Module 5: Risk evaluation
Risk Modification / Evaluation
Module 2: Hazards identification
Trawling
Anchoring
Wreck
Dropping objects
Marine growth
Wave, wind and current
Internal corrosion
External corrosion
Erosion
Welding & materials
On bottom stability
Module 4: CoF assessment
Emergency response assessment
Source emission simulation
Oil dispersion simulation
Gas dispersion simulation
Fire simulation
Explosion simulation
Consequence calculation
QRA ModulesOFFSHORE PIPELINES & RISERS

Pipeline failure usually takes the form of leakage, which is the initiate event resulting to serious consequences.
Probability of Failure (Pof) is estimated as failure frequencies of different types of degradation mechanisms operating in the pipeline component.
The failure frequency is calculated based on different damage causes. The main damage causes identified for subsea pipelines are listed below:
Internal Corrosion
External Corrosion
Erosion
External Impact
Free-span
On-bottom Stability
The specific PARLOC database is proposed to be used for pipeline Pof assessment.
Probability of Failure PofOFFSHORE PIPELINES & RISERS

Consequence of failure can be expressed as number of people affected (injuredor killed), property damage, amount of a spill, area affected, outage time,mission delay, money lost or any other measure of negative impact for thequantification of risk.
It is usually divided into three categories of Safety, Economic andEnvironmental consequence to be analyzed respectively by qualitatively orquantitatively way.
The consequence analysis is an extensive effort covering a series of stepsincluding:
Accident scenario analysis of possible event sequences (Event Tree Analysis for instance)
Analysis of accidental loads, related to fire, explosion, impact
Analysis of the response of systems and equipment to accidental loads
Analysis of final consequences to personnel, environment, and assets
Each of these steps may include extensive studies and modeling.
Consequence of Failure CofOFFSHORE PIPELINES & RISERS
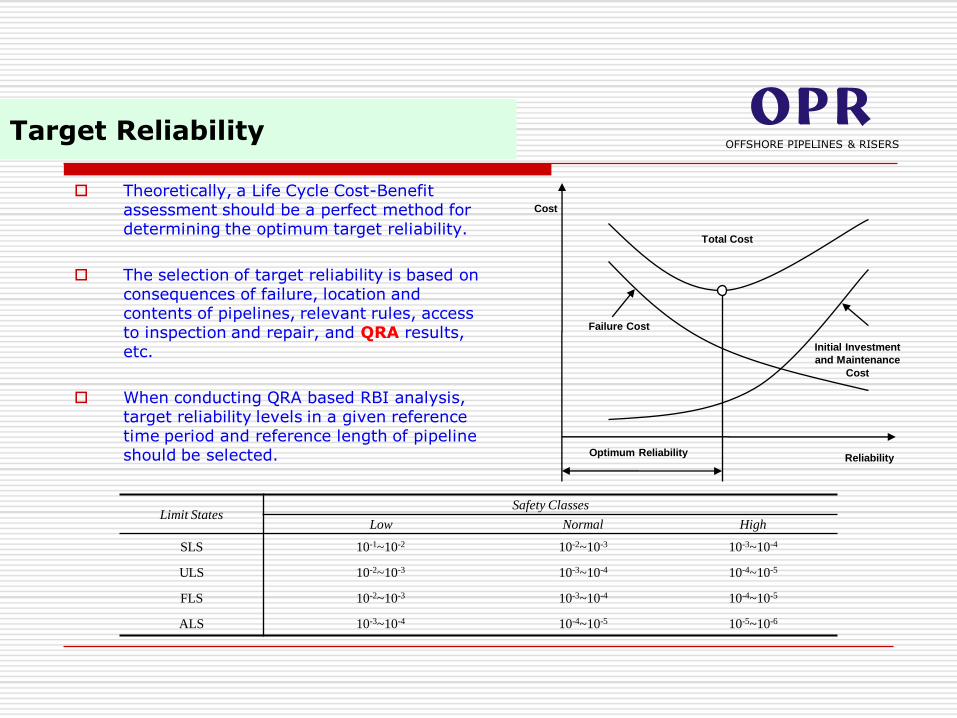
Theoretically, a Life Cycle Cost-Benefit assessment should be a perfect method for determining the optimum target reliability.
The selection of target reliability is based on consequences of failure, location and contents of pipelines, relevant rules, access to inspection and repair, and QRA results, etc.
When conducting QRA based RBI analysis, target reliability levels in a given reference time period and reference length of pipeline should be selected. Reliability
Cost
Optimum Reliability
Failure Cost
Initial Investment
and Maintenance
Cost
Total Cost
Target ReliabilityOFFSHORE PIPELINES & RISERS
Limit StatesSafety Classes
Low Normal High
SLS 10-1~10-2 10-2~10-3 10-3~10-4
ULS 10-2~10-3 10-3~10-4 10-4~10-5
FLS 10-2~10-3 10-3~10-4 10-4~10-5
ALS 10-3~10-4 10-4~10-5 10-5~10-6

1. 5x5 Risk Matrix in Initial Assessment
2. Risk level at analysis year
3. Next Inspection year
OFFSHORE PIPELINES & RISERS
( , , )CoF f manned condition ouside diamter product analysis year analysis yearRisk PoF CoF
( )next inspection analysis step high analysisY Y Y PoF PoF ( ) ( ) ( ) ( ) ( )CoF A or B or C or D or E
Q-RBI: Initial Assessment
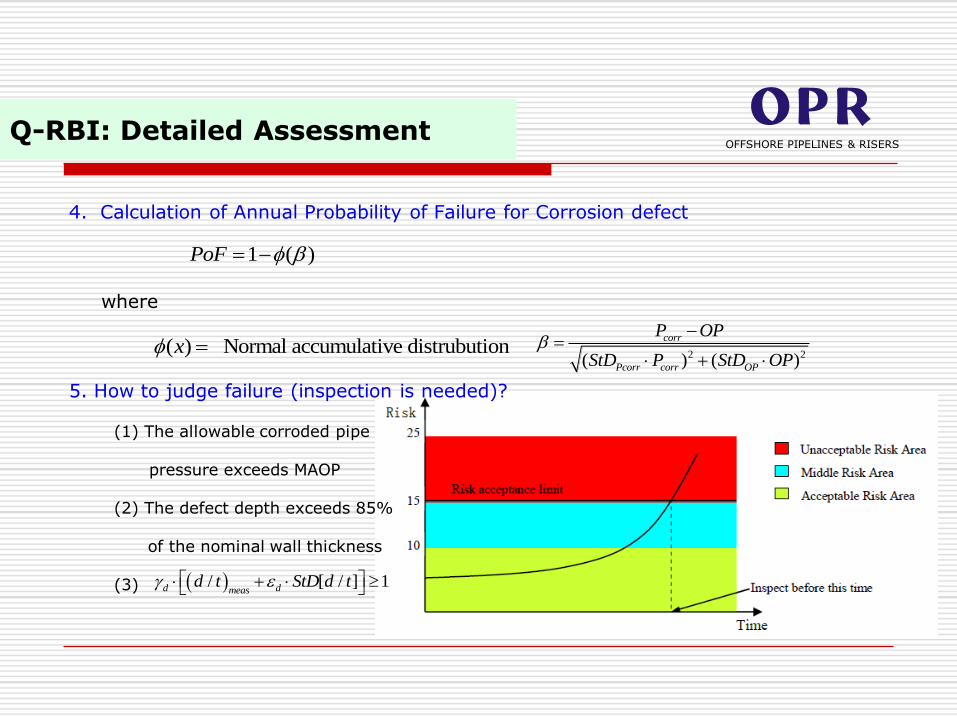
4. Calculation of Annual Probability of Failure for Corrosion defect
where
5. How to judge failure (inspection is needed)?
(1) The allowable corroded pipe
pressure exceeds MAOP
(2) The defect depth exceeds 85%
of the nominal wall thickness
(3)
1 ( )PoF
OFFSHORE PIPELINES & RISERS
( ) Normal accumulative distrubution x 2 2( ) ( )
corr
Pcorr corr OP
P OP
StD P StD OP
Q-RBI: Detailed Assessment
/ [ / ] 1d dmeasd t StD d t

3. Extended Fitness For Service (QRA/SRA Based FFS)
OFFSHORE PIPELINES & RISERS

The risk and reliability based fitness-for-services (FFS) assessment addressed in this paper isa Quantitative Risk Assessment (QRA) based FFS study on subsea oil or gas pipelines.
The main purpose of SRA is to determine the target reliabilities for different pipeline segments.
Structure Reliability Analysis (SRA) method is used to calculate the maximum safe operatingpressure, which indicates the pipeline retaining pressure capacity.
QRA and SRA results will be used to conduct traditional FFS, which indicates whether thepipeline is fit for service or not by a comparison of pipeline retaining pressure capacity withgiven MAOP.
EFFS To portray pipeline present risk
picture and define the target reliability
of every pipeline segment;
EFFS: IntroductionOFFSHORE PIPELINES & RISERS

This risk and reliability based FFS studyprocess will focus on pipeline corrosiondefect.
Initially, QRA will be performed to derive thepipeline target reliability.
Using target reliability and SRA method, thepipeline retaining pressure capacity Psafe willbe obtained as the preparation of FFS.
Finally, traditional FFS will be conducted toindicate whether the pipeline is fit for serviceor not by a comparison of pipeline retainingpressure capacity with given MAOP.
Operating data
Develop defects to
remaining design life
Psafe > MAOP?
Yes
Inspection data Design data
QRA
Corrosion rate Target reliability
Pipeline
Segmentation
Defect assessment one
by one based on SRA
method
No
Psafe >MAOP?
Calculate remaining
design life capacity
Remaining life to
current MAOP
Yes
No
Calculate de-
rated capacity
EFFS: MethodologyOFFSHORE PIPELINES & RISERS

This section intends to perform quantitative risk assessment (QRA) to establish the pipeline structure target reliability taking into account pipeline safety, environmental, and economic consequences.
The Quantitative Risk Assessment process will bring benefits to the following directions:
Pipeline Segmentation - Much more precise pipeline segmentation
Probability of Failure (Pf) - Much more precise pipeline failure consequences calculation
Consequences of Failure (Cof) - Much more detailed calculation of corrosion rates
Target Reliability - Much more beneficial choice of pipeline target reliabilities
EFFS: QRA and Target ReliabilityOFFSHORE PIPELINES & RISERS
Limit StatesSafety Classes
Low Normal High
SLS 10-1~10-2 10-2~10-3 10-3~10-4
ULS 10-2~10-3 10-3~10-4 10-4~10-5
FLS 10-2~10-3 10-3~10-4 10-4~10-5
ALS 10-3~10-4 10-4~10-5 10-5~10-6

g(Z)<0 represents a failure state where loads S exceeds the strength R.
g(Z)>0 represents a safe state since strength R is larger than loads S.
g(Z)=0 represent the limit state line (or surface).
OFFSHORE PIPELINES & RISERS
SR)Z(g
EFFS: SRA Limit State

The structural failure probability Pf can be calculated as
And the reliability R is
The safety index β (API 2A-LRFD) is the most popular measure of reliability in industry. The safety index is related to the corresponding failure rate by formula:
Where, (.) is the standard normal distribution function.
OFFSHORE PIPELINES & RISERS
0zg
Zfdzzf0)Z(gPP
0)Z(gPP1Rf
1fP
EFFS: SRA Failure Probability

The uncertainties are measured in terms of standard deviation and variance from mean values and combine to give an uncertainty in the predicted pipeline safe operating pressure.
An example of the mean bias (B) and COV (Coefficient of Variation) of the burst prediction model is (Bai et al 1997) in Table 2:
A bias factor X is introduced to reflect the confidence in the criterion in prediction of burst strength.
Normalized random variables in the design equation can be expressed as in Table 3:
OFFSHORE PIPELINES & RISERSEFFS: SRA Uncertainties

OFFSHORE PIPELINES & RISERS
For normalized defect length , the normalized mean Rm (Pburst) is given by:
FM
ALL
A
XX
XAXLXL
XA
fm BBBXBXBX
BX
D
tR
5.02 ))(003375.06275.01(1
12
For normalized defect length , the normalized mean Rm (Pburst) is given by:
FM
AL
A
XX
XAXL
XA
fm BBBXBX
BX
D
tR
1)3.3032.0(1
12
Psafe is the operating pressure that gives an acceptable/desirable safety index (β) i.e. probability of burst for the individual defect considered
Pburst = r * Psafe
The mean load Sm is given by:
m safe XfS P B
502
Dt
LX L
502
Dt
LX L
EFFS: SRA Longitudinal Corrosion

OFFSHORE PIPELINES & RISERS
The safety index is calculated as:
RSmm SR ln/)/ln(
))1()1ln(( 22
ln SmRmRS VV
Where:
2 2 2 2 0.5( )Rm A L F MV V V V V
The CoV for the load (Sm), VSm is taken from Bai’99 as 0.02.
The variance of the mean resistance is estimated from the variances of XA, XL , Xf,
XM.
The safety index β is related to the corresponding failure rate (Target Reliability) by formula:
1fP
EFFS: SRA Longitudinal Corrosion

Following item will be considered when doing assessment:
• Zone 1 and zone 2 (different safety class value)
• Internal and external (different corrosion rate)
• Submerged and atmospheric (different corrosion rate)
• Defect type
• Defect Dimension (d/t vs L)
• Defect Orientation (Clock position vs KP)
SRA Based Remaining Strength
• Reliability based corrosion capacity (SRA Approach)
OFFSHORE PIPELINES & RISERSEFFS: Corrosion Capacity & Remaining Life
Corrosion Rate
• de Waard Model
• Norsok Model
SRA Based Future Corrosion Capacity
QRA Based Target Reliability Level
SRA based Remaining Life Calculation
• DNV RP F101 Part A Criteira
• ASME B31G Criteria
Degradation Tendency

EFFS: Examples
4. Engineering Critical Assessment (ECA)
OFFSHORE PIPELINES & RISERS

To supplement the traditional S-N approach and determine the flaw acceptance and inspection criteria in fatigue and fracture design of risers and flowlines.
Assessment is generally made by means of a failure assessment diagram (FAD) based on the principles of fracture mechanics.
• ECA includes:
Data Gathering and Preparing
FAD Determination
Stress Assessment
Factor Calculation (e.g. Stress Intensity Factor)
Fracture Ratio and Load Ratio Determination
Fatigue Assessment
Remaining Strength
ECAOFFSHORE PIPELINES & RISERS

Level 1, a preliminary FAD based on the CTOD design-curve method, is the basis of the elastic–plastic fracture assessment procedure in BS7910.
ref
r
Y
L
ref
r
flow
S
ECA – The FAD MethodOFFSHORE PIPELINES & RISERS
Level 2 is an alternative FAD based on the lower bound of many curves obtained from experimental data on general austenitic steel.

Level 3 requires the value of reference strain, εref , of the target region including the flaws. Since εref is defined as a corresponding true strain obtained from the tensile curve at a true stress, the tensile curve of the target region must be determined before.
I refK Y a 2
2
1
YIC
EK
ECA – The FAD MethodOFFSHORE PIPELINES & RISERS
Here,
ζY and E are the yield stress and elastic modulus ,
Lr and Kr are the load ratio and the fracture ratio,
ζref , KI and KIC are applied stress, stress intensity factor, and fracture toughness, respectively.
Additionally, δ is the calculated CTOD value.

API X65-graded natural gas pipeline of diameter 762mm and thickness 17.5mm
ECA – APL X65 Pipeline testOFFSHORE PIPELINES & RISERS

Locations of tensile specimen sampling in: (a) weld metal and (b) HAZ
ECA – APL X65 Pipeline testOFFSHORE PIPELINES & RISERS

Schematic diagrams of (a) CTOD specimen geometry; notch
locations of (b) weld metal specimen and (c) HAZ specimen
ECA – APL X65 Pipeline testOFFSHORE PIPELINES & RISERS

OFFSHORE PIPELINES & RISERS


