ABSTRACT KEY WORDS - stuba.sk
8
9 E. VAN ASWEGEN, W. J. VDM. STEYN STATISTICAL MODELLING OF THE RESILIENT BEHAVIOUR OF UNBOUND GRANULAR MATERIAL 1. INTRODUCTION The resilient modulus (M R ) is commonly used to characterize the behaviour of unsaturated, unbound granular material under re- peatedly applied traffic loading. However, M R is not constant, and parameters such as stress level, density, moisture content and the number of load repetitions, to name a few, all influence the resilient behaviour of unbound granular material (Lekarp et al, 2000; Cary and Zapata, 2010). Numerous models have been developed to approximate the be- haviour of unsaturated, unbound granular material, mainly based on constitutive laws and correlations with other properties (Lekarp et al, 2000; George, 2004; Kim 2007). The Mechanistic-Empirical Pavement Design Guide (MEPDG) recognizes the influence of ma- terial and environmental factors on M R through the incorporation of the Enhanced Integrated Climate Model (EICM) to model environ- mental effects on pavement layers. EICM calculations are used in MEPDG at input Levels 2 and 3, in the form of a composite environ- mental adjustment factor, adjusting M R accordingly for the govern- ing environmental and material factors (NCHRP, 2004). MEPDG adopted a hierarchical approach to designing the in- puts, which aims to give the designer more flexibility in obtaining design inputs for a project based on the criticality of the project and available resources. The hierarchical approach is applied to traffic, materials and environmental inputs. In general, Level 1 inputs pro- Elsabe VAN ASWEGEN Email: [email protected] Research field: Pavement design and mate- rials. Wynand JvdM STEYN Email: [email protected] Research field: Vehicle-pavement interaction, accelerated pavement testing and pavement materials and instrumentation. Address: Department of Civil Engineering University of Pretoria Lynnwood Road, Hatfield, South Africa, 0002 ABSTRACT The resilient behaviour of an unsaturated, unbound granular material is a primary in- put used in the mechanistic analysis of pavements incorporating such layers. Various models exist for the determination of the resilient behaviour, mainly based on the output of tri-axial laboratory testing. This paper describes an investigation where basic en- gineering properties such as grading, laboratory compaction characteristics and opti- mum moisture content are incorporated into the resilient behaviour model to quantify the effect of basic material properties on the resilient response of unsaturated, unbound granular materials. Such a resilient behaviour model will enable practitioners to esti- mate the behaviour of specific material, which might enable the use of available quality material that was discarded in the past. Data from tri-axial laboratory tests on materials originating from the Long Term Pavement Performance test sections are combined with basic engineering parameters of typical unbound granular material through a statistical modelling process to develop a model for predicting resilient behaviour, which can be used as a practical predictor of the expected behaviour during a Level 2 and/or Level 3 Mechanistic Empirical Pavement Design analysis. The work illustrates the process and the potential to develop a general resilient behaviour model for unbound granular mate- rials incorporating saturation effects. KEY WORDS • Resilient modulus, • unbound granular material, • unsaturated material. 2013 SLOVAK UNIVERSITY OF TECHNOLOGY Vol. XXI, 2013, No. 1, 9 – 16, DOI: 10.2478/sjce-2013-0002
Transcript of ABSTRACT KEY WORDS - stuba.sk

9S L O V A K U N I V E R S I T Y O F T E C H N O L O G Y I N B R A T I S L A V AF A C U L T Y O F C I V I L E N G I N E E R I N GA N N U A L R E P O R T 2 0 1 2
E. VAN ASWEGEN, W. J. VDM. STEYN
STATISTICAL MODELLING OF THE RESILIENT BEHAVIOUR OF UNBOUND GRANULAR MATERIAL
1. INTRODUCTION
The resilient modulus (MR) is commonly used to characterize the behaviour of unsaturated, unbound granular material under re-peatedly applied traffic loading. However, MR is not constant, and parameters such as stress level, density, moisture content and the number of load repetitions, to name a few, all influence the resilient behaviour of unbound granular material (Lekarp et al, 2000; Cary and Zapata, 2010).
Numerous models have been developed to approximate the be-haviour of unsaturated, unbound granular material, mainly based on constitutive laws and correlations with other properties (Lekarp
et al, 2000; George, 2004; Kim 2007). The Mechanistic-Empirical Pavement Design Guide (MEPDG) recognizes the influence of ma-terial and environmental factors on MR through the incorporation of the Enhanced Integrated Climate Model (EICM) to model environ-mental effects on pavement layers. EICM calculations are used in MEPDG at input Levels 2 and 3, in the form of a composite environ-mental adjustment factor, adjusting MR accordingly for the govern-ing environmental and material factors (NCHRP, 2004).
MEPDG adopted a hierarchical approach to designing the in-puts, which aims to give the designer more flexibility in obtaining design inputs for a project based on the criticality of the project and available resources. The hierarchical approach is applied to traffic, materials and environmental inputs. In general, Level 1 inputs pro-
Elsabe VAN ASWEGENEmail: [email protected]
Research field: Pavement design and mate-rials.
Wynand JvdM STEYNEmail: [email protected]
Research field: Vehicle-pavement interaction, accelerated pavement testing and pavement materials and instrumentation.
Address: Department of Civil EngineeringUniversity of PretoriaLynnwood Road, Hatfield, South Africa, 0002
ABSTRACT
The resilient behaviour of an unsaturated, unbound granular material is a primary in-put used in the mechanistic analysis of pavements incorporating such layers. Various models exist for the determination of the resilient behaviour, mainly based on the output of tri-axial laboratory testing. This paper describes an investigation where basic en-gineering properties such as grading, laboratory compaction characteristics and opti-mum moisture content are incorporated into the resilient behaviour model to quantify the effect of basic material properties on the resilient response of unsaturated, unbound granular materials. Such a resilient behaviour model will enable practitioners to esti-mate the behaviour of specific material, which might enable the use of available quality material that was discarded in the past. Data from tri-axial laboratory tests on materials originating from the Long Term Pavement Performance test sections are combined with basic engineering parameters of typical unbound granular material through a statistical modelling process to develop a model for predicting resilient behaviour, which can be used as a practical predictor of the expected behaviour during a Level 2 and/or Level 3 Mechanistic Empirical Pavement Design analysis. The work illustrates the process and the potential to develop a general resilient behaviour model for unbound granular mate-rials incorporating saturation effects.
KEY WORDS
• Resilient modulus, • unbound granular material, • unsaturated material.
2013 SLOVAK UNIVERSITY OF TECHNOLOGY
Vol. XXI, 2013, No. 1, 9 – 16, DOI: 10.2478/sjce-2013-0002

STATISTICAL MOdELLING OF THE RESILIENT BEHAVIOUR OF...10 S L O V A K U N I V E R S I T Y O F T E C H N O L O G Y I N B R A T I S L A V AF A C U L T Y O F C I V I L E N G I N E E R I N GA N N U A L R E P O R T 2 0 1 2
vide for the highest level of accuracy and thus would have the lowest level of uncertainty or error. Level 2 inputs provide an intermediate level of accuracy and would be closest to the typical procedures used with earlier editions of the American Association of State Highway and Transportation Officials (AASHTO) Guide. This level could be used when resources or testing equipment are not available for the tests required for Level 1. Level 2 inputs typically would be user-se-lected, possibly from a database, could be derived from a limited testing program, or could be estimated through correlations. Level 3 inputs provide the lowest level of accuracy. This level might be used for designs where there are minimal consequences from early failure (e.g., lower volume roads). Inputs typically would be user-selected values or typical averages for the region (NCHRP, 2004).
For MR calculations at Level 1, MEPDG refers the designer to a constitutive equation that relates MR to bulk stress, octahedral shear stress, and atmospheric pressure at any given location within the pavement. Input Levels 2 and 3 do not consider stress sensitivity. At Level 2, the designer estimates MR at a reference moisture condition which is determined near at or near the optimum moisture content and maximum dry density. For input Level 3, an estimate of the MR is sufficient (NCHRP, 2004).
To contextualize the MEPDG’s hierarchical approach and the incorporation of environmental and material factors for South Afri-ca, an initial investigation was done to develop Level 2 and/or Level 3 MR correlations through statistical distributions.
2. INITIAL STUDY INTO STATISTICAL DISTRIBUTIONS
An initial study, which was a precursor to a more in-depth in-vestigation, was conducted to predict the resilient behaviour based on the basic engineering properties of the material. The process is based on a statistical evaluation of the measured resilient behaviour and measured basic engineering properties of a range of materials.
2.1 Available data
The measured MR tri-axial test data and basic engineering prop-erties from the Long Term Pavement Performance (LTPP) project da-tabase were evaluated (LTPP, 2011). Data were sorted by layer type to only include subgrade ‘SS’, granular subbase ‘GS’ and granular base ‘GB’ data from State 1, 6, 10, 12, 19, 20, 21, 22, 23 and 24. Sorting the data by layer was only done to ensure that only unbound granular material data was included in the data set and not to enable linkage of the data to specific layers in the pavement structure. In situ- , specific layer and pavement structure MR values will be evalu-ated in a more in-depth study. A total of 2099 MR tri-axial data points were selected. Two data sets of the MR tri-axial test data (63 data points) and basic engineering properties of the South African (SA) material were also included (Theyse, 2008).These samples were test-ed over a wider range of density level and moisture content than the LTPP data, which resulted in a wider range of measured MR values.
LTPP MR tri-axial testing was done according to Protocol P46, and SA MR tri-axial testing was done according to a protocol devel-oped by the Centre for Scientific and Industrial Research (CSIR), based on Protocol P46 (Theyse, 2008; FHWA, 1996). The data on the basic engineering properties included sieve analysis, Modified AASHTO compaction characteristics and classification of the mate-rial based on the AASHTO classification system (AASHTO, 1929) and the TRH14 classification system (TRH14, 1985).
2.2 Selected statistical distributions
The measured resilient behaviour was evaluated to determine which statistical distribution best fits the resilient behaviour. The best-fit distribution is defined as the distribution with the best Kolm-ogorov-Smirnov (K-S) value (Steyn, 2011). The K-S test quantifies the distance between the empirical distribution function of the sam-ple and the cumulative distribution function selected as the reference distribution (in this case the Weibull and Log-normal).
The Weibull and Log-normal distributions were selected be-cause these distributions only allow non-negative outputs, as would be expected for the resilient behaviour of an unbound granular ma-terial (Steyn, 2011).
Table 1 summarize the best-fit, Weibull and Log-normal Kolm-ogorov-Smirnov (K-S) statistics and ranking. The statistics and rankings are shown as the minimum, average and maximum rank-ing achieved by each of the Weibull and Log-normal distributions out of a possible 65 distributions. The K-S statistics are generally higher than the required values for a statistically acceptable distri-bution for each data set, but an evaluation of the actual data histo-grams and that of the Weibull and Log-normal distributions indicate that, from an initial study point of view, these distributions simulate the measured resilient behaviour sufficiently (Figure 1). In Figure 1, samples AA and BB have a wider range of MR values due to the experimental design, which differs from that of the LTPP data, as mentioned before.
Tab. 1 Best-fit, Weibull and Log-normal statistics for data set.
Minimum Average Maximum
Best-fit K-S 0.0251 0.0578 0.1135
Weibull K-S 0.0350 0.1228 0.3014
Weibull ranking 8 27 44
Weibull (3P) K-S 0.0332 0.1016 0.1995
Weibull (3P) ranking 6 21 36
Log-normal K-S 0.0306 0.1105 0.2687
Log-normal ranking 7 24 40
Log-normal (3P) K-S 0.0307 0.0801 0.1486
Log-normal (3P) ranking 5 12 19
Vol. XXI, 2013, No. 1, 9 – 16

11S L O V A K U N I V E R S I T Y O F T E C H N O L O G Y I N B R A T I S L A V AF A C U L T Y O F C I V I L E N G I N E E R I N GA N N U A L R E P O R T 2 0 1 2
STATISTICAL MOdELLING OF THE RESILIENT BEHAVIOUR OF...
Vol. XXI, 2013, No. 1, 9 – 16
2.3 Analysis of the Parameters to develop Statistical Parameter Equations
The parameters of the statistical distributions were analysed to develop equations that can be used to generate the statistical param-eters for the Weibull and Log-normal distributions by using the basic engineering properties of a material as input. The parameters of the statistical distributions were analysed and the minimum, average and maximum values are summarized in Table 2.
Tab. 2 Values for parameters for Weibull and Log-normal distributions for data set.
Statistical parameters Minimum Average Maximum
Weibullα 3.2641 3.9945 5.1292
β 45.5620 118.1263 332.0400
Weibull (3P)
α 1.1376 2.1816 3.2254
β 24.5480 72.8511 186.1100
γ 1.0092 44.1357 153.3700
Log-normalϭ 0.2186 0.3018 0.3853
μ 3.6984 4.4597 5.7128
Log-normal (3P)
ϭ 0.0584 0.2723 0.7053
μ 3.2721 4.7750 6.0835
γ -362.0100 -77.8078 63.9890
The minimum, maximum and average values for the statistical parameters, as well as the measured MR values were used to cal-culate the behaviour, per sample, as a function of the Weibull and
Log-normal distributions, which is depicted in Figures 2 and 3. The Weibull equation is given in Equation 1.
(1)
Where: α = Shape parameter β = Scale parameter x = Variable data point
An example of the calculation for one Weibull data point is as follows:
f (51) = 0,0218
When the minimum values of the parameters of the statistical distributions were used to express the measured resilient behaviour as a function of the Weibull and Log-normal distributions, samples S23 and S10 were approximated well by the distributions, but not by the remainder of the samples. When the maximum values of the parameters of the statistical distributions were used, only sample BB was approximated well by the distributions. The average values of the parameters of the statistical distributions were therefore used to express the measured resilient behaviour as a function of the Weibull and Log-normal distributions (Figures 2 and 3). The statistical dis-tributions approximate the majority of the data well; however, the approximation for material with a similar material classification is not the same. Samples S12 and BB have a similar classification (A-2-4, A-2-5), but the MR values are not similar; therefore, the approx-imation of the MR of the material is not good.
Closer inspection of the basic engineering properties shows that samples BS03 and BB both have a Grading Modulus (GM) of 2 and approximately 30 per cent passing the 0.425 mm sieve, which might explain the wider spread of the Weibull distribution of the MR measured. Sample BS** and BSX07 have GM values of less than 0.4 and greater than 80 per cent passing the 0.425 mm sieve, which might explain the Log-normal distribution of the MR mea-sured showing a similar spread. This indicates that the material clas-sification alone cannot be used as a guide to indicate the expected resilient behaviour of the material.
In order to determine which basic engineering properties of the material to incorporate as parameters in the equations to generate the statistical parameters, the correlation between the properties was analysed (Table 3). A good correlation exists between variables if the correlation coefficient is close to or inclusive of one, whether positive or negative (Van As, 2003). All the values reported in Table 3 were satisfactory, except for Pmax, which indicated a poor correla-tion. However, it was decided to incorporate all of the properties as parameters in the equations for this preliminary investigation.
Fig. 1 Selected statistical distributions and measured resilient data histograms.

STATISTICAL MOdELLING OF THE RESILIENT BEHAVIOUR OF...12 S L O V A K U N I V E R S I T Y O F T E C H N O L O G Y I N B R A T I S L A V AF A C U L T Y O F C I V I L E N G I N E E R I N GA N N U A L R E P O R T 2 0 1 2
Vol. XXI, 2013, No. 1, 9 – 16
Tab. 3 Correlation analyses output for all data.
GM Pmax P0,425 mm MDD MC/OMC
GM 1
Pmax 0.37 1
P-0,425 mm -0.95 0.40 1
MDD 0.77 0.30 -0.74 1
MC/OMC 0.79 0.20 -0.75 0.97 1
GM = Grading modulus (ratio)Pmax = Maximum particle size (mm)P0.425mm = Percentage passing the 0.425 mm sieve (%)MDD = Maximum dry density (kg/m3)MC/OMC = Moisture content (%) to optimum moisture content
(%) ratio
The general format for the equations to be developed is given in Equation 2.
Statistical parameter = A1 + A2∙GM + A3∙Pmax +A4∙P0.425mm + + A5∙MDD + A6∙MC/OMC (2)
Linear regression analysis was used to derive the equations for the statistical parameters of the Weibull and Log-normal distribu-tions, using the basic engineering properties as determined in Table 3. Table 4 gives the equations for the statistical parameters of the Weibull and Log-normal distributions, as well as the standard error and R2 for each of the parameters. Relatively large standard errors for the Weibull Beta parameter were recorded, which is the param-eter which gives an indication of the scale of the distribution, as well as for the Weibull and Log-normal Gamma parameter, which gives an indication of the location of the distribution. The R2 values
recorded for all the parameters are low, the minimum being 24 per cent and the maximum 60 per cent. Ideally the error must be as small as possible and the R2 as close to 100 per cent as possible, but for a preliminary investigation into a Level 2 and/or Level 3 estimation, the current values are deemed sufficient.
2.4 Verification of Equations to Estimate the Statistical Parameters for distributions
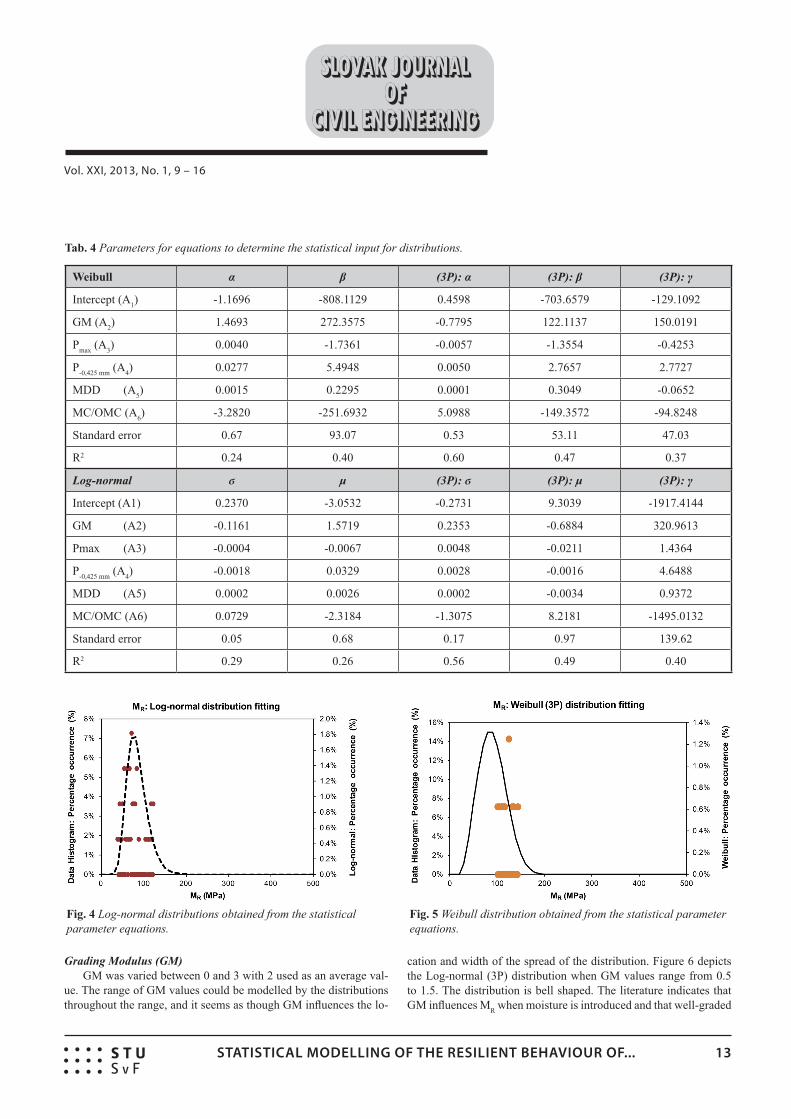
To test the equations developed in the previous section, the mea-sured resilient behaviour and basic engineering properties from the two materials also obtained from the LTPP database (but excluded from the development database) were evaluated. The Weibull and Log-normal distributions obtained from the input equations mod-elled the trend in the measured resilient behaviour of the two ma-terials. The modelled distributions are depicted in Figures 4 and 5 along with the measured resilient behaviour. Figure 4 depicts the data obtained from sample BS** from State 30, which corresponds with an A-6 material classification modelled by a Log-normal dis-tribution. Figure 5 depicts the data obtained from sample BS06 from State 26, which corresponds with an A-4 material classifica-tion modelled by a Weibull distribution. The better modelling of data from sample BS** to sample BS06 may have contributed to the number of data points which could be modelled. For sample BS** 55 data points were available versus the 14 data points avail-able for sample BS06.
A parametric study was also conducted to determine how the various basic engineering properties affect the resilient behaviour. In this study, for example, GM was varied through reasonable values, while Pmax, P0.425, MDD and MC/OMC were given average values. This was repeated for each of the properties used in the equations which estimated the statistic parameters. The variables A1 to A6 were the same as derived through the regression analysis.
Fig. 2 Measured resilient behaviour expressed as a function of the Weibull distribution.
Fig. 3 Measured resilient behaviour expressed as a function of the Log-normal distribution.
13S L O V A K U N I V E R S I T Y O F T E C H N O L O G Y I N B R A T I S L A V AF A C U L T Y O F C I V I L E N G I N E E R I N GA N N U A L R E P O R T 2 0 1 2
STATISTICAL MOdELLING OF THE RESILIENT BEHAVIOUR OF...
Vol. XXI, 2013, No. 1, 9 – 16
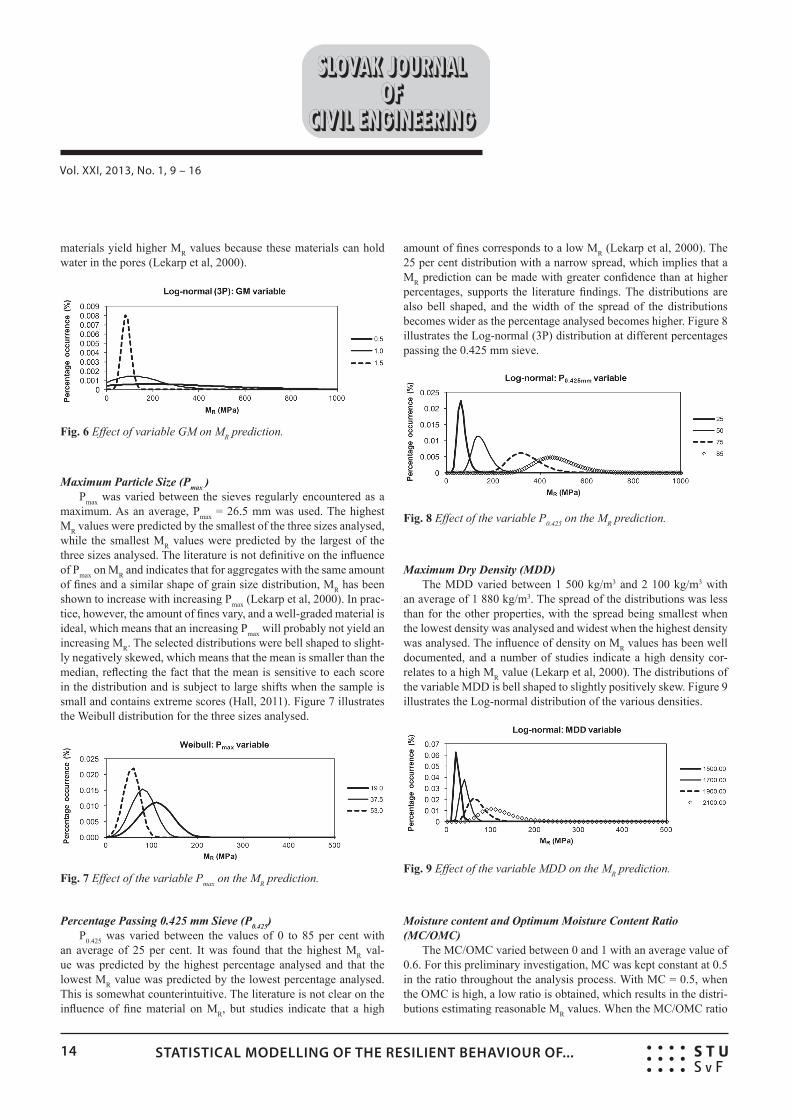
Grading Modulus (GM)GM was varied between 0 and 3 with 2 used as an average val-
ue. The range of GM values could be modelled by the distributions throughout the range, and it seems as though GM influences the lo-
cation and width of the spread of the distribution. Figure 6 depicts the Log-normal (3P) distribution when GM values range from 0.5 to 1.5. The distribution is bell shaped. The literature indicates that GM influences MR when moisture is introduced and that well-graded
Tab. 4 Parameters for equations to determine the statistical input for distributions.
Weibull α β (3P): α (3P): β (3P): γ
Intercept (A1) -1.1696 -808.1129 0.4598 -703.6579 -129.1092
GM (A2) 1.4693 272.3575 -0.7795 122.1137 150.0191
Pmax (A3) 0.0040 -1.7361 -0.0057 -1.3554 -0.4253
P-0,425 mm (A4) 0.0277 5.4948 0.0050 2.7657 2.7727
MDD (A5) 0.0015 0.2295 0.0001 0.3049 -0.0652
MC/OMC (A6) -3.2820 -251.6932 5.0988 -149.3572 -94.8248
Standard error 0.67 93.07 0.53 53.11 47.03
R2 0.24 0.40 0.60 0.47 0.37
Log-normal ϭ μ (3P): ϭ (3P): μ (3P): γ
Intercept (A1) 0.2370 -3.0532 -0.2731 9.3039 -1917.4144
GM (A2) -0.1161 1.5719 0.2353 -0.6884 320.9613
Pmax (A3) -0.0004 -0.0067 0.0048 -0.0211 1.4364
P-0,425 mm (A4) -0.0018 0.0329 0.0028 -0.0016 4.6488
MDD (A5) 0.0002 0.0026 0.0002 -0.0034 0.9372
MC/OMC (A6) 0.0729 -2.3184 -1.3075 8.2181 -1495.0132
Standard error 0.05 0.68 0.17 0.97 139.62
R2 0.29 0.26 0.56 0.49 0.40
Fig. 4 Log-normal distributions obtained from the statistical parameter equations.
Fig. 5 Weibull distribution obtained from the statistical parameter equations.
STATISTICAL MOdELLING OF THE RESILIENT BEHAVIOUR OF...14 S L O V A K U N I V E R S I T Y O F T E C H N O L O G Y I N B R A T I S L A V AF A C U L T Y O F C I V I L E N G I N E E R I N GA N N U A L R E P O R T 2 0 1 2
Vol. XXI, 2013, No. 1, 9 – 16
materials yield higher MR values because these materials can hold water in the pores (Lekarp et al, 2000).
Maximum Particle Size (Pmax )Pmax was varied between the sieves regularly encountered as a
maximum. As an average, Pmax = 26.5 mm was used. The highest MR values were predicted by the smallest of the three sizes analysed, while the smallest MR values were predicted by the largest of the three sizes analysed. The literature is not definitive on the influence of Pmax on MR and indicates that for aggregates with the same amount of fines and a similar shape of grain size distribution, MR has been shown to increase with increasing Pmax (Lekarp et al, 2000). In prac-tice, however, the amount of fines vary, and a well-graded material is ideal, which means that an increasing Pmax will probably not yield an increasing MR. The selected distributions were bell shaped to slight-ly negatively skewed, which means that the mean is smaller than the median, reflecting the fact that the mean is sensitive to each score in the distribution and is subject to large shifts when the sample is small and contains extreme scores (Hall, 2011). Figure 7 illustrates the Weibull distribution for the three sizes analysed.
Percentage Passing 0.425 mm Sieve (P0.425)P0.425 was varied between the values of 0 to 85 per cent with
an average of 25 per cent. It was found that the highest MR val-ue was predicted by the highest percentage analysed and that the lowest MR value was predicted by the lowest percentage analysed. This is somewhat counterintuitive. The literature is not clear on the influence of fine material on MR, but studies indicate that a high
amount of fines corresponds to a low MR (Lekarp et al, 2000). The 25 per cent distribution with a narrow spread, which implies that a MR prediction can be made with greater confidence than at higher percentages, supports the literature findings. The distributions are also bell shaped, and the width of the spread of the distributions becomes wider as the percentage analysed becomes higher. Figure 8 illustrates the Log-normal (3P) distribution at different percentages passing the 0.425 mm sieve.
Maximum Dry Density (MDD)The MDD varied between 1 500 kg/m3 and 2 100 kg/m3 with
an average of 1 880 kg/m3. The spread of the distributions was less than for the other properties, with the spread being smallest when the lowest density was analysed and widest when the highest density was analysed. The influence of density on MR values has been well documented, and a number of studies indicate a high density cor-relates to a high MR value (Lekarp et al, 2000). The distributions of the variable MDD is bell shaped to slightly positively skew. Figure 9 illustrates the Log-normal distribution of the various densities.
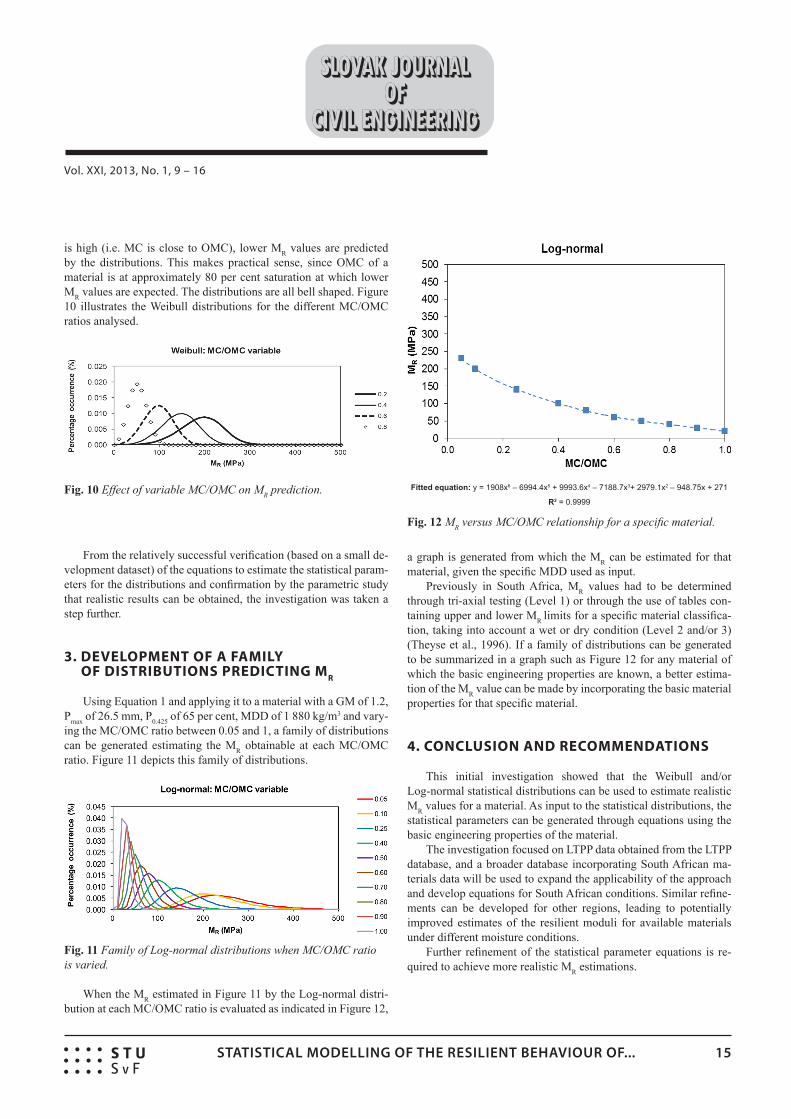
Moisture content and Optimum Moisture Content Ratio (MC/OMC)
The MC/OMC varied between 0 and 1 with an average value of 0.6. For this preliminary investigation, MC was kept constant at 0.5 in the ratio throughout the analysis process. With MC = 0.5, when the OMC is high, a low ratio is obtained, which results in the distri-butions estimating reasonable MR values. When the MC/OMC ratio
Fig. 6 Effect of variable GM on MR prediction.
Fig. 8 Effect of the variable P0.425 on the MR prediction.
Fig. 9 Effect of the variable MDD on the MR prediction.Fig. 7 Effect of the variable Pmax on the MR prediction.
15S L O V A K U N I V E R S I T Y O F T E C H N O L O G Y I N B R A T I S L A V AF A C U L T Y O F C I V I L E N G I N E E R I N GA N N U A L R E P O R T 2 0 1 2
STATISTICAL MOdELLING OF THE RESILIENT BEHAVIOUR OF...
Vol. XXI, 2013, No. 1, 9 – 16
is high (i.e. MC is close to OMC), lower MR values are predicted by the distributions. This makes practical sense, since OMC of a material is at approximately 80 per cent saturation at which lower MR values are expected. The distributions are all bell shaped. Figure 10 illustrates the Weibull distributions for the different MC/OMC ratios analysed.
From the relatively successful verification (based on a small de-velopment dataset) of the equations to estimate the statistical param-eters for the distributions and confirmation by the parametric study that realistic results can be obtained, the investigation was taken a step further.
3. DEVELOPMENT OF A FAMILY OF DISTRIBUTIONS PREDICTING MR
Using Equation 1 and applying it to a material with a GM of 1.2, Pmax of 26.5 mm, P0.425 of 65 per cent, MDD of 1 880 kg/m3 and vary-ing the MC/OMC ratio between 0.05 and 1, a family of distributions can be generated estimating the MR obtainable at each MC/OMC ratio. Figure 11 depicts this family of distributions.
When the MR estimated in Figure 11 by the Log-normal distri-bution at each MC/OMC ratio is evaluated as indicated in Figure 12,
a graph is generated from which the MR can be estimated for that material, given the specific MDD used as input.
Previously in South Africa, MR values had to be determined through tri-axial testing (Level 1) or through the use of tables con-taining upper and lower MR limits for a specific material classifica-tion, taking into account a wet or dry condition (Level 2 and/or 3) (Theyse et al., 1996). If a family of distributions can be generated to be summarized in a graph such as Figure 12 for any material of which the basic engineering properties are known, a better estima-tion of the MR value can be made by incorporating the basic material properties for that specific material.
4. CONCLUSION AND RECOMMENDATIONS
This initial investigation showed that the Weibull and/or Log-normal statistical distributions can be used to estimate realistic MR values for a material. As input to the statistical distributions, the statistical parameters can be generated through equations using the basic engineering properties of the material.
The investigation focused on LTPP data obtained from the LTPP database, and a broader database incorporating South African ma-terials data will be used to expand the applicability of the approach and develop equations for South African conditions. Similar refine-ments can be developed for other regions, leading to potentially improved estimates of the resilient moduli for available materials under different moisture conditions.
Further refinement of the statistical parameter equations is re-quired to achieve more realistic MR estimations.
Fig. 10 Effect of variable MC/OMC on MR prediction.
Fig. 12 MR versus MC/OMC relationship for a specific material.
Fitted equation: y = 1908x6 – 6994.4x5 + 9993.6x4 – 7188.7x3+ 2979.1x2 – 948.75x + 271
R2 = 0.9999
Fig. 11 Family of Log-normal distributions when MC/OMC ratio is varied.

STATISTICAL MOdELLING OF THE RESILIENT BEHAVIOUR OF...16 S L O V A K U N I V E R S I T Y O F T E C H N O L O G Y I N B R A T I S L A V AF A C U L T Y O F C I V I L E N G I N E E R I N GA N N U A L R E P O R T 2 0 1 2
Vol. XXI, 2013, No. 1, 9 – 16
AASHTO M 145 or ASTM D3282 (1929)
Cary, C.E. and Zapata, C.E. (2010). ‘Resilient modulus testing for unsaturated unbound materials’, CD-ROM. Transportation Research Board of the National Academies, Washington, D.C., USA 2010, pp. 10-1810.
Federal Highway Administration (FHWA) (1996). ‘Protocol P46: Resilient modulus of unbound granular base/subbase materials and subgrade soils’, Turner-Fairbank Highway Research Cen-ter, McLean, Virginia, USA.
George, K.P. (2004). ‘Prediction of resilient modulus from soil index properties’, Final Report, Mississippi Department of Transpor-tation, Research Division, Jackson, Mississippi, USA.
Hall, R.J., ‘FiniteMath: Module 8’, http://bobhall.tamu.edu/Fi-niteMath/Module8/Introduction.html. Accessed 9 May 2011.
Kim, M. (2007). ‘Three-dimensional finite element analysis of flexi-ble pavements considering nonlinear pavement foundation be-haviour’, PhD Thesis, University of Illinois, Urbana, Illinois, USA.
Lekarp, F., Isacsson, U. & Dawson, A. (2000). ‘State of the art I: Resilient response of unbound aggregates’, Journal of Transpor-tation Engineering, Volume 126, No. 1, January/February, 2000, pp 66-75.
LTPP DataPave Online, ‘Release 23’ January 2009. http://www.ltpp-products.com/DataPave/index.asp. Accessed 19 July 2011.
NCHRP (2004). ‘Project 1-37A: Guide for Mechanistic-Empirical Design of New and Rehabilitated Pavement Structures’, Nation-al Cooperative Highway Research Program, Transportation Re-search Board, of the National Research Council, USA.
Steyn, W.J.vdM. (2011). ‘Vehicle Dynamics – Development of sta-tistical distributions for selected Rigid vehicle case studies’, Report No. SANRAL/SAPDM/A-4/2011-01, University of Pre-toria, Pretoria, RSA.
Theyse, H.L, De Beer, M. and Rust, F.C. (1996). ‘Overview of the South African Mechanistic Pavement Design Analysis Method’, In Transportation Research Record: Journal of the Transporta-tion Research Board, No 1539, Transportation Research Board of the National Academies, Washington, D.C., USA 2003, pp 6-17.
Theyse, H.L. (2008). ‘A mechanistic-empirical design model for un-bound granular pavement layers’, PhD dissertation, University of Johannesburg, Johannesburg, South Africa.
TRH 14 (1985). ‘TRH 14: Guidelines for road construction materi-als’, Department of Transport, Pretoria, South Africa.
Van As, S.C. (2003). ‘Applied statistics for Civil Engineers’, B.Eng. Honours course material, University of Pretoria, Pretoria, South Africa.
REFERENCES