ABSTRACT Document: Development of a mN level meso-scale ...
255
ABSTRACT Title of Document: Development of a mN level meso-scale thruster Vivek Shirsat, 2012 Directed By: Dr. Ashwani Gupta, Distinguished Professor, Department of Mechanical Engineering This dissertation focuses on the practical application of heat recirculating combustors as thrust chambers for micro-spacecraft systems, including: design, development, stability and operational characteristics of the thruster in both the steady state and pulsed configurations. Stable combustion was realized with partially premixed methanol/steam/oxygen, non-premixed methanol/steam/oxygen, and non- premixed kerosene/steam/oxygen. The steam oxygen mixture is a surrogate for the decomposition products of hydrogen peroxide. The effect of channel geometry on the stability and thermal performance has also been conducted in addition to qualitative and quantitative comparisons of fuel/oxidizer injection configurations. In general it was found that non-premixed combustion is favorable in terms of both thermal performance and flame stability due to the predictable extinction characteristics at low flow rates and the absence of lean blow off at high flow rates. A quantitative extinction criterion was developed to predict extinction at the rich extinction limit. Additionally, nozzle discharge characteristics at low Reynolds number were studied
Transcript of ABSTRACT Document: Development of a mN level meso-scale ...

ABSTRACT
Title of Document: Development of a mN level meso-scale thruster
Vivek Shirsat, 2012 Directed By: Dr. Ashwani Gupta, Distinguished Professor,
Department of Mechanical Engineering This dissertation focuses on the practical application of heat recirculating
combustors as thrust chambers for micro-spacecraft systems, including: design,
development, stability and operational characteristics of the thruster in both the steady
state and pulsed configurations. Stable combustion was realized with partially
premixed methanol/steam/oxygen, non-premixed methanol/steam/oxygen, and non-
premixed kerosene/steam/oxygen. The steam oxygen mixture is a surrogate for the
decomposition products of hydrogen peroxide. The effect of channel geometry on the
stability and thermal performance has also been conducted in addition to qualitative
and quantitative comparisons of fuel/oxidizer injection configurations. In general it
was found that non-premixed combustion is favorable in terms of both thermal
performance and flame stability due to the predictable extinction characteristics at
low flow rates and the absence of lean blow off at high flow rates. A quantitative
extinction criterion was developed to predict extinction at the rich extinction limit.
Additionally, nozzle discharge characteristics at low Reynolds number were studied
and a correlation developed to predict the discharge coefficient from the Reynolds
number for both cold and hot flow scenarios. It was found the discharge coefficient
decays more rapidly for high temperature flows than low temperature flows due to the
effects of temperature and viscosity on the boundary layer displacement thickness.
Additionally, a milli-Newton level thrust stand was developed to indirectly measure
the thrust level without allowing the thruster to translate, the thrust stand resolution
was found to be <1mN. Using this device a study of the thrust characteristics was
carried out in both the steady state and pulsed modes. Measurements of the specific
impulse efficiency indicate that the conversion efficiency is high and any loss in
thermal efficiency from the adiabatic scenario is due to wall heat losses and not
incomplete combustion. Experiments conducted with hydrogen peroxide decomposed
in the inlet channel of the combustor were used to validate the results taken with the
steam/oxygen as the oxidizer and demonstrated that heat recirculation from the
products to the exhaust is sufficient to promote efficient decomposition of the
hydrogen peroxide.

DEVELOPMENT OF A mN LEVEL MESO-SCALE THRUSTER
By
Vivek Kiran Shirsat
Dissertation submitted to the Faculty of the Graduate School of the University of Maryland, College Park, in partial fulfillment
of the requirements for the degree of Doctor of Philosophy
2012 Advisory Committee: Professor Ashwani K. Gupta, Advisor/Chair Professor Ahsan Choudhuri Professor Jungho Kim Professor Bao Yang Professor Kenneth Yu, Dean’s Representative

© Copyright by Vivek Kiran Shirsat
2012

ii
Dedication
This dissertation is dedicated to my family, without their support and encouragement
none of this would be possible.

iii
Acknowledgements
I would like to begin by thanking my advisor, Dr. Ashwani Gupta, for his
guidance, encouragement, and support throughout the graduate process and for
emphasizing the value of hard work and perseverance.
Additionally, I would like to thank my committee, Dr. Sunderland, Dr, Yu,
Dr. Yang, and Dr. Choudhuri for their support. In particular, I cannot emphasize
enough the guidance Dr. Choudhuri has provided, beginning with the pursuit of my
Masters under his at the University of Texas at El Paso through the completion on my
PhD his unflinching support has helped to remove many barriers along the road to
success and make possible the completion of this work.
The role my family has played in supporting and encouraging me throughout
my life is without question the motivating force that gives me both the confidence and
the strength to continue pursuing those things which are important to me.
Without question the members of the combustion lab, from the summer of
2008 until now, have contributed greatly to the quality and direction of the work
performed during my graduate studies, in particular I would like to acknowledge Dr.
Vineeth Vijayan who’s fundamental studies laid the groundwork for my research.
Most importantly the camaraderie and the friendships developed in the lab over the
past four years I will keep with me for the rest of my life.
Finally, I would like to thank the support of our sponsors, Missile Defense
Agency for supporting this research through to its completion; thanks in particular are
due to Mr. Richard Schwartz for his help, support, and many useful suggestions.

iv

v
Table of Contents
Dedication ..................................................................................................................... ii
Acknowledgements ...................................................................................................... iii
Table of Contents .......................................................................................................... v
List of Tables ............................................................................................................. viii
List of Figures .............................................................................................................. ix
Chapter 1: Introduction ................................................................................................. 1
Section 1 Practical Relevance ................................................................................... 1 Green Propulsion .................................................................................................. 1 Micro-Spacecraft ................................................................................................... 2
Section 2 Historical Perspective ............................................................................... 3 Section 3 Fundamentals of Meso-Scale Hydrogen Peroxide Propulsion ................. 6
Introduction ........................................................................................................... 6 Homogenous and Heterogeneous Catalysis of Hydrogen Peroxide ..................... 9 Meso-Scale Combustion ..................................................................................... 15
Section 5 Research Goals ........................................................................................ 21 Section 6 References ............................................................................................... 22
Chapter 2: Literature Review ...................................................................................... 25
Section 1 Thermal Performance, Flame Extinction, and Flame Dynamics ............ 27 Section 2 Geometry and Scale Effects .................................................................... 30 Section 3 The Effect of Catalyst ............................................................................. 43 Section 4 The Effect of Material Thermal Conductivity ........................................ 46 Section 5 Flame Dynamics and Instability ............................................................. 50 Section 6 Summary of Fundamental Research ....................................................... 51 Section 7 Micro-Power Generation ........................................................................ 52
Micro Propulsion ................................................................................................ 53 Electricity Generation ......................................................................................... 59
Section 8. References .............................................................................................. 68
Chapter 3: Experimental Facilities and Procedures .................................................... 75
Section 1 Combustors ............................................................................................. 75

vi
Combustor Geometries ....................................................................................... 75 Ignition ................................................................................................................ 83 Fabrication .......................................................................................................... 84
Section 2 Flow Control ........................................................................................... 86 Steady State Measurement of Extinction and Thermal Performance ................. 86 Pulsing................................................................................................................. 88
Section 3 Optical Diagnostics ................................................................................. 93 High Speed Video ............................................................................................... 93
Section 4 Thrust Measurement ............................................................................... 94 Impulse Balance Thrust Stand ............................................................................ 94
Section 5 Procedures ............................................................................................. 110 Section 6 References ............................................................................................. 110
Chapter 4: Results ..................................................................................................... 111
Section 1 Organization of the experimental results .............................................. 111 Section 2 Extinction Behavior .............................................................................. 111
Partially Premixed Combustion ........................................................................ 111 Non-Premixed Combustion .............................................................................. 132
Section 3 Thermal Performance ............................................................................ 146 Partially-Premixed Combustion ........................................................................ 147
Section 4 Discharge Through low Reynolds Number Nozzles ........................... 162 Section 5 Thrust Measurement ............................................................................ 168
Steady State ....................................................................................................... 168 Pulsed Performance .......................................................................................... 174
Section 6: Experiments with Hydrogen Peroxide ................................................. 187 Catalyst Placement ............................................................................................ 188
Section 6 References ............................................................................................. 196
Chapter 5: Contributions and Recommendations for Future Work ......................... 200
Section 1 Mixing ................................................................................................... 200 Partially-premixed combustion ......................................................................... 200 Non-Premixed Combustion .............................................................................. 202 Thermal Performance ........................................................................................ 203 Other Notable Characteristics ........................................................................... 204
Section 3 Nozzle Discharge Characteristics ......................................................... 205 Section 4 Thrust Measurement ............................................................................. 205 Section 5 Thruster Performance ............................................................................ 205 Section 6 Recommendations for Future Work...................................................... 206
Upstream and Cold Flow and Nozzle Discharge Analysis ............................... 206 Fuel Injection .................................................................................................... 208 Multi-Material Combustor ................................................................................ 208 Integration of the Combustor with a Hydrogen Peroxide Catalyst Bed ........... 211

vii
Investigation into Alternative Oxidizers and Propellant Handling Systems .... 212
Appendix A: .............................................................................................................. 214
Appendix B: Publications ......................................................................................... 217
Bibliography ............................................................................................................. 218

viii
List of Tables Table 1.1 Current Meso and Microscale Thruster Programs ........................................ 3
Table 1.2. Mono-Propellant .......................................................................................... 5
Table 1.3. Gas Generator Applications ......................................................................... 6
Table 1.4. Bi-Propellant Applications .......................................................................... 6
Table 3.1 Ignition Circuit Element Values ................................................................. 84
Table 3.2. Single Pulse Generation Circuit ................................................................. 90
Table 4.1: Summary of the Test Condition Covered in Figure 4.39 ......................... 166

ix
List of Figures
Figure 1.1Adiabatic decomposition temperature of hydrogen peroxide solution versus
weight percent of hydrogen peroxide ........................................................................... 9
Figure 1.2.Five regions of decomposition, note that the length of the regions is for
illustrative purposes only and not indicative of realistic behavior 9 ........................... 10
Figure 1.3.Potential catalyst bed arrangements: a) multiple stage rectangular channel.
b) Circular post. c) Diamond post. d)monolithic cellular ceramic 12 .......................... 15
Figure 2.1. Extinction regime for premixed propane/air in a zirconium phosphate
meso-combustor .......................................................................................................... 27
Figure 2.2..Exhaust and preheat temperatures for heat recirculating “Swiss-roll”
combustors burning propane/air. 10 ........................................................................... 29
Figure 2.3. Normalized output power (thermal efficiency) vs. equivalence ratio at
various heat loads (with propane fuel) 10 .................................................................... 30
Figure 2.4. Full-scale and half-scale “Swiss-roll” combustors the numbers 1-7
represent thermocouple locations within the combustor ............................................ 31
Figure 2.5.Extinction regimes for gas phase and catalytic combustion of propane and
air for both the full and half scale combustors, note that the full-scale combustor has a
wall thickness of .5mm while the half-scale combustor has a wall thickness of
.25mm.12 ...................................................................................................................... 32
Figure 2.6. Maximum temperatures at the lean extinction limit for both gas phase and
catalytic combustion for both the half scale and full scale reactors. 10 ....................... 33
Figure 2.7. Extinction regimes for reactors with varying wall thickness12 ................. 35
Figure 2.8.Configuration parameters and a direct photo of the baseline combustor13 36

x
Figure 2.9.Effect of wall thickness on flame stabilization in the combustion space13 37
Figure 2.10.Schematics of the cold flow field at a mean temperature of 900
K:‘BSw15u11d11’: (a) Vm ¼ 100 cm/s, (b) Vm ¼ 300 cm/s, ‘BSw05u16d16’: (c)
Vm ¼ 100 cm/s, (d) Vm ¼ 300 cm/s.13 ...................................................................... 38
Figure 2.11.Combustor geometries investigated for (a) Combustor A, (b) Combustor
B, and (c) Combustor C15 ........................................................................................... 39
Figure 2.12. Flammability map of the combustors for (a) Combustor A, (b)
Combustor B, and (c) Combustor C. Here the Reynolds number is calculated at the
inlet using inlet hydraulic diameter15 .......................................................................... 40
Figure 2.13.Normalized output power (thermal efficiency) vs. equivalence ratio at
various heat loads (propane flow rates) for (a) Combustor A, (b) Combustor B, and
(c) Combustor C15 ....................................................................................................... 42
Figure 2.14. Schematic of the Swiss roll burner, Platinum catalysts are placed as
shown 19 ...................................................................................................................... 44
Figure 2.15. Extinction limit map for catalytic and gas phase combustion in the
inconel Swiss-roll 19 .................................................................................................... 45
Figure 2.16. Effect of thermal conductivity on heat transfer rates for a heat load of
29W (HL_cc = rate of heat loss in the combustion chamber, HL_tot = rate of total
heat loss from the combustor, HR_CW = rate of heat recirculation to the reactants
throug h the channel walls, HR_OW = rate of heat recirculation to the reactants
through the outer walls and HR_tot = total rate of heat recirculation to the
reactants).21 ................................................................................................................. 48
xi
Figure 2.17.Extinction regimes for the Macor and Zirconium Phosphate combustors.
Left: Macor combustor Right : Zirconium Phosphate combustor.21 ........................... 49
Figure 2.18.Flow diagram of a generic micro-power generation system23 ................. 52
Figure 2.19.MIT micro-turbine schematic and SEM Image.26 ................................... 54
Figure 2.20.Digital micro-thruster schematic and photograph28 ................................ 55
Figure 2.21.Catalytic SiC micro-combustor29 ............................................................ 56
Figure 2.22.Two halves of a micro-rocket thrust chamber, the die size is 18mm x
13.5mm x 3mm.30 ....................................................................................................... 57
Figure 2.23.Asymmetric whirl combustor configuration with flow streaklines.31 ..... 58
Figure 2.24.Valveless pulse jet assembly32 ................................................................. 58
Figure 2.25.Valveless pulsejet cycle32 ........................................................................ 59
Figure 2.26.Rotary engine prototypes under development33 ...................................... 61
Figure 2.27.Schematic and photograph of the HCCI free piston micro-engine.35 ...... 62
Figure 2.28.Typical meso-combustor thermoelectric generator lay up.26 .................. 63
Figure 2.29.Schematic view of the micro combustor and thermoelectric device36 .... 64
Figure 2.30.Toroidal microcombustor and combustion based thermoelectric
microgenerator.37 ........................................................................................................ 65
Figure 2.31.Conceptual design of a Micro-TPV system.40 ......................................... 67
Figure 3.1. 2.5 Turn zirconium Phosphate Heat Recirculating Combustor ................ 76
Figure 3.2. Single Turn Combustor. The non-premixed configuration is shown, two
mixing strategies were examined. ............................................................................... 77
Figure 3.3. Combustor/Steam Generator .................................................................... 79
Figure 3.4. Non-premixed combustor ......................................................................... 80

xii
Figure 3.5. Combustor with Nozzle ............................................................................ 81
Figure 3.6.Combustor with heating element and thermocouple fabricated into the heat
recuperator .................................................................................................................. 82
Figure 3.7. Ignition circuit the values used for the circuit elements are shown in the
accompanying table .................................................................................................... 84
Figure 3.8. Combustor with Kanthal wire igniters ..................................................... 85
Figure 3.9. Silicon carbide ignition electrodes ........................................................... 85
Figure 3.10. Combustor with silicon carbide igniters ................................................. 86
Figure 3.11. Schematic of the experimental facility ................................................... 88
Figure 3.12.Pulsing facility including valves, valve electronics, and thruster ........... 89
Figure 3.13. Valve control circuit ............................................................................... 90
Figure 3.14. Relative locations of the mass flow controllers, pressure transducers, and
thrust stand used in pulsing experiments .................................................................... 91
Figure 3.15. Calibration curve for methanol in terms of total mass flow rate versus
pressure ratio (upstream/chamber) .............................................................................. 92
Figure 3.16. Oxygen flow rate versus pressure drop across the injector .................... 92
Figure 3.17. Fuel injector ............................................................................................ 93
Figure 3.19. Control volume for indirect thrust measurement [adapted from Wu et al.,
Ref. 2] ......................................................................................................................... 95
Figure 3.20. Thrust stand with calibration jet indicating the locations of the impulse
plate, calibration system, and non-contact displacement sensor ................................. 96

xiii
Figure 3.21. Potential sources of error due to the use of a cantilevered beam; the
schematic on the right shows the ideal impulse plate force balance, whereas the
schematic on the right shows the cantilevered force balance ..................................... 97
Figure 3.22. Calibration jet (#55), position indicating potentiometer, and thrust stand
..................................................................................................................................... 98
Figure 3.23. Thrust versus distance at 6.40SCFH oxygen flow rate. The green line
represents the displacement whereas the black line represents a moving average of the
thrust taken in 100 sample increments (at the sampling frequency). The red markers
are the raw data, the spread in the raw data is due to zero mean random noise which
has been shown, via FFT, to have no discrete frequency components. ...................... 99
Figure 3.24. Thrust versus distance at 8.12SCFH oxygen flow rate. The green line
represents the displacement whereas the black line represents a moving average of the
thrust taken in 100 sample increments (at the sampling frequency). The red markers
are the raw data, the spread in the raw data is due to zero mean random noise which
has been shown, via FFT, to have no discrete frequency components. .................... 100
Figure 3.25. Thrust versus distance at 8.12SCFH oxygen flow rate. The green line
represents the displacement whereas the black line represents a moving average of the
thrust taken in 100 sample increments (at the sampling frequency). The red markers
are the raw data, the spread in the raw data is due to zero mean random noise which
has been shown, via FFT, to have no discrete frequency components. .................... 100
Figure 3.26. Four measurements of beam deflection by a pre load to a specific angle.
The lines used to calculate the angular deflection and the deflection angles are shown
in the figure. .............................................................................................................. 102

xiv
Figure 3.27. Deflection angle versus measured thrust for a 9.81SCFM calibration jet;
note that the measured thrust decays rapidly with any increase in deflection angle, and
tends to level off at large (~7 Deg.) deflection angles. ............................................. 103
Figure 3.28. Variation in thrust calculated at the exit plane of the thruster versus the
measured thrust along with the ratio of the measured thrust to the calibration thrust
................................................................................................................................... 104
Figure 3.29. Composite calibration curves for the cantilever beam versus both voltage
and displacement ....................................................................................................... 105
Figure 3.30. Calibration curve extended to 366mN, note that above 100mN the
calibration is non-linear. The quadratic curve fit to the calibration data is shown as
well ............................................................................................................................ 106
Figure 3.31. Sensitivity and precision error measurement ....................................... 107
Figure 3.32. Temperature stability over time, representative error is shown by the
error bar on the right ................................................................................................. 108
Figure 3.33. Thrust force exerted by a circular jet on the thrust stand versus the
theoretical result ........................................................................................................ 108
Figure 3.34. Time history in displacement (in volts) for the thrust stand in free
vibration .................................................................................................................... 109
Figure 4.1. Single turn partially-premixed combustor .............................................. 112
Figure 4.2. Extinction limits for the partially-premixed combustor burning methanol-
steam-oxygen ............................................................................................................ 114
Figure 4.3. Laminar flame speeds for methanol/superheated steam/oxygen and
methanol/air as compared to literature values .......................................................... 116

xv
Figure 4.4. Adiabatic flame temperatures for methanol/superheated steam/oxygen and
methanol/air .............................................................................................................. 117
Figure 4.5. Laminar flame in a slot formed by two parallel walls21 ......................... 118
Figure 4.6. Simulation results of the quenching distances for methanol/air and
methanol/steam/oxygen ............................................................................................ 118
Figure 4.7. Extinction regimes for the partially-premixed combustors with three
different aspect ratios ................................................................................................ 120
Figure 4.8.Channel Velocity, Equivalence Ratio, and Flashback Propensity on the
cutting plane .............................................................................................................. 122
Figure 4.9. First Law Model of the Combustor ........................................................ 124
Figure 4.10. Enthalpy flow rate at locations one and two for a methanol flow rate of
.3mL/min ................................................................................................................... 127
Figure 4.11. Enthalpy flow rate for locations two and three for a methanol flow rate
of .3mL/min .............................................................................................................. 127
Figure 4.12. Enthalpy flow rate for locations three and four for a methanol flow rate
of .3mL/min .............................................................................................................. 127
Figure 13.Enthalpy flow rate for locations four and five for a methanol flow rate of
.3mL/min ................................................................................................................... 128
Figure 4.14. Enthalpy flow rate for locations five and six for a methanol flow rate of
.3mL/min ................................................................................................................... 128
Figure 4.15. Heat transferred to the Reactants, both net and as a fraction of the heat
input for a Methanol flow rate of .30mL/min ........................................................... 131
Figure 4.16. Extinction limits for non-premixed combustion of methanol .............. 132

xvi
Figure 4.17. Inlet, preheat, product gas, and exhaust temperatures for non-premixed
methanol combustion ................................................................................................ 133
Figure 4.18. Enthalpy flow rates at the inlet, preheat, product gas, and exhaust
locations versus equivalence ratio at a methanol flow rate of .45mL/min ............... 134
Figure 4.19. Inlet and preheat enthalpy flow rates before and after combustion ...... 135
Figure 4.20. High speed images of an FREI event. From left to right: Stable flame,
extinct flame, onset of re-ignition ............................................................................. 136
Figure 4.21. Time trace showing the extinction and re-ignition process .................. 136
Figure 4.22. FREI mechanism for the heat recirculating combustor ........................ 137
Figure 4.23. Extinction regime for kerosene combustion ......................................... 139
Figure 4.24. Development of the kerosene global flame structure ........................... 140
Figure 4.25. Global Flame Stability Regime ............................................................ 142
Figure 4.26.Exhaust and Preheat Temperatures for both the confined and unconfined
combustors for a fuel flow rate of 0.45mL/min ........................................................ 143
Figure 4.27. Preheat temperatures for the confined and unconfined combustors for a
fuel flow rate of 0.45mL/min .................................................................................... 144
Figure 4.28. Extinction criteria versus equivalence ratio for five methanol fuel flow
rates for both the confined and unconfined combustor, the points where rich
extinction occurs are marked with bold filled symbols. ........................................... 145
Figure 4.29. Generic extinction regime for a non-premixed, non-sooting combustor.
The red arrow is the progress of the experiment from the ignition condition to the rich
extinction limit. ......................................................................................................... 146

xvii
Figure 4.30.Variation of exhaust temperature with equivalence ratio for three
methanol flow rates ................................................................................................... 148
Figure 4.31.Variation in combined heat loss rate and heat capacity rate from the
exhaust channel for a methanol flow rate of .3mL/min ............................................ 148
Figure 4.32.Temperature drop across the exhaust channel ....................................... 149
Figure 4.33. Heat output for three different flow rates versus equivalence ratio ..... 150
Figure 4.34.Overall heat loss for three different flow rates versus equivalence ratio
................................................................................................................................... 150
Figure 4.35. Heat loss/Heat input, and overall heat loss from the combustor for three
different fuel flow rates ............................................................................................. 151
Figure 4.36.Overall heat loss and the fraction of heat input associated with the
oxidizer for a fuel flow rate of .3mL/min. Note that the inflection in the heat loss
occurs because of a change in the flow controller .................................................... 151
Figure 4.37. Heat output/Heat input for three fuel flow rates ................................... 152
Figure 4.38.Thermal performance of the heat recirculating combustor. Top: C* and
Isp efficiencies, Bottom: exhaust temperature. ......................................................... 154
Figure 4.39.Thermal efficiencies of partially premixed and non-premixed combustor
................................................................................................................................... 155
Figure 4.40. Flame images of the partially-premixed and non-premixed combustor.
The bottom right-most image shows a partially-premixed propane air flame that
appears to be stabilized on the upstream ignition wire. ............................................ 157
Figure 4.41. Flame images with SiC igniters ............................................................ 158

xviii
Figure 4.42. Exhaust temperatures and thermal efficiencies for the non-premixed
combustor with Kanthal wire igniters and SiC igniters at a methanol flow rate of
0.45mL/min. .............................................................................................................. 159
Figure 4.43.Thermal performance of kerosene combustor with methanol for
comparison ................................................................................................................ 160
Figure 4.44. Top: Specific energy and Bottom: Density impulse for methanol
(.45mL/min) and kerosene (0.20mL/min) ................................................................ 161
Figure 4.45. Discharge Coefficients versus Reynolds number for: oxygen,
oxygen/methanol, and steam/oxygen/methanol. Note that the Re is on a logarithmic
scale........................................................................................................................... 165
Figure 4.46. Discharge coefficient versus Reynolds number. Note that the x-axis is on
a log scale. ................................................................................................................. 166
Figure 4.47.Cold flow thrust measurements and theoretical prediction. .................. 168
Figure 4.48. Time history of the thrust produced at a methanol flow rate of
.85mL/min and an equivalence ratio of 1.28. ........................................................... 169
Figure 4.49. Fluctuating thrust/Mean thrust for a methanol flow rate of .85mL/min
and equivalence ratios of 2.81,2.01,1.76, at mean thrust levels of 9.24mN, 9.45mN
and 13.40mN respectively. ....................................................................................... 170
Figure 4.50. From left to right: FFT of thrust, chamber pressure, and fuel delivery
pressure. The inset on the left most figure is a magnification or the thrust spectrum.
The results suggest that fluctuations in the measurements of the chamber pressure and
fuel delivery pressure are due to random signal noise and are not physical in nature.
................................................................................................................................... 171

xix
Figure 4.51. Thrust force versus equivalence ratio for methanol/steam/oxygen with a
methanol flow rate of 0.85mL/min ........................................................................... 172
Figure 4.52. Specific impulse efficiency based on both delivered thrust and chamber
thermodynamics ........................................................................................................ 173
Figure 4.53.Trigger pulse used for the fuel and oxidizer solenoid valves. ............... 175
Figure 4.54. Characteristic methanol and oxygen thrust pulse, the difference between
the rising edge of the pulse and the tign (the black line in the figure) is the ignition
delay time .................................................................................................................. 176
Figure 4.55. Time series of image intensities at various locations inside the
combustor. Location 1 is the high speed video synchronization lamp, location 2 is the
fuel injection head, location 3 is the exit to the combustion volume, location 4 is the
entrance to the exhaust channel, location 5 is the middle of the exhaust channel, and
location 6 is the entrance to the nozzle. .................................................................... 177
Figure 4.56. FFT of the thrust force issued from the thruster at a mean chamber
pressure of 70psia and a mean thrust force of 320mN .............................................. 178
Figure 4.58. Ignition sequence taken at 1000HZ the ignition kernel originates at the
heat recuperator and ignites the accumulated mixture downstream of the combustion
chamber ..................................................................................................................... 181
Figure 4.59. Mean and max thrust versus pressure ratio for the three tested conditions
................................................................................................................................... 182
Figure 4.60. Specific impulse, specific impulse efficiency, and thrust coefficient for
methanol/oxygen at varying pressure ratio. .............................................................. 183

xx
Figure 4.61. Characteristic images of the methanol/oxygen flame taken with high
speed cinematography (100Hz) at three pressure ratios ........................................... 184
Additional measurements were taken at lower heat loads by diluting the methanol fuel
with water. Thrust data for methanol water mixtures of 90% methanol/10% water and
80% methanol/20% water were taken at varying pressure ratio. The methanol-water
mixtures were used to approximate the global stoichiometry of superheated
steam/oxygen/methanol since a high pressure on-demand steam oxygen generator
was not available. Additionally, the dilution of the fuel with water results in a
mixture that is less volatile, and consequently more difficult to vaporize. ............... 185
Figure 4.62. Measured thrust levels versus chamber pressure for the three tested
fuel/water blends. ...................................................................................................... 185
Figure 4.63. High speed (100Hz) flame images at Methanol volume fractions of
1.0,0.9,and 0.8. Note the presence of liquid in the exhaust jet (highlighted by the red
square, and the presence of the exhaust plume shock structure. In the image the
percentages are Methanol/Water vol/vol. ................................................................. 186
Figure 5.1. Traditional Swiss-Roll combustor .......................................................... 209
Figure 5.2. Mixed material combustor ...................................................................... 210
Figure 5.3. Integrated hydrogen peroxide catalyst bed Swiss Roll combustor concept.
The catalyst bed is integrated into the inlet channel of the combustor. Note that the
top dimensions are in inches. .................................................................................... 212

1
Chapter 1: Introduction
Section 1 Practical Relevance
Green Propulsion
The history of rocket propulsion and the development of propellants have been
driven largely by the need to achieve the maximum amount of impulse while expending
the minimum amount of mass. Many launch boosters have essentially evolved from the
German V2 rocket, utilizing liquid oxygen and kerosene as propellants. Over time some
systems have replaced the kerosene with liquid hydrogen, delivering a specific impulse
so high that the complicated cryogenic storage systems and safety issues present
themselves as a marginal tradeoff. During the cold war, the development of “storable”
liquid oxidizers became a major concern for intercontinental ballistic missiles (ICBM)
that could potentially sit in missile silos for indefinite periods of time. Requiring room-
temperature liquid oxidizers some utilized highly toxic propellants or hypergolic
combinations such as nitrogen tetra oxide and hydrazine. Some, namely the Titan class of
launch vehicle, have evolved into heavily utilized civilian satellite launch systems. For
space propulsion, the success of hydrazine as a mono-propellant and hypergolic bi-
propellant have led to its almost exclusive use in high performance upper stages and RCS
engines. However, recent trends toward environmentally conscious propulsion system
design have been sparked by lowering the cost of spacecraft through simple miniature
systems. Recognizing the need for miniature green propulsion systems, hydrogen

2
peroxide, having environmentally benign decomposition products, presents a viable
solution to the problems surrounding toxic space propellants.
Micro-Spacecraft
In general, the trend for satellite design is towards smaller less expensive vehicles
with overall mission functionality distributed over a number of spacecraft1. The
cornerstone of these low-cost and design-to-cost missions is the use of small-satellites to
mitigate, among other things, the burdensome cost of launch (i.e launching small
satellites as secondary payloads and maneuvering into the final orbit). With this in mind,
mission designers have expressed interest in using distributed micro-spacecraft
architectures (constellations and clusters) to meet requirements that are currently satisfied
by single, expensive, multi-role satellites2. In order for these spacecraft to be effective,
they will require propulsion systems for launcher injection error, drag compensation,
constellation phasing, and proximity maneuvering and rendezvous3. Owing to their low
inertia, these maneuvers will require extremely low thrust (mN and μN) and low impulse
bit. Contemporary satellites requiring low thrust for primary propulsion and vernier
control can have a number of different propulsion options, including: cold gas, chemical
monopropellant, chemical bi-propellant, vaporizing liquid, solid propellant, and a number
of electric propulsion schemes. In general, experimental research in meso and micro
scale propulsion has involved the scaling down of these devices. Table 12 below outlines
the current developments in micro-propulsion including thruster type, thrust level,
specific impulse and developing agency.

3
Table 1.1 Current Meso and Microscale Thruster Programs2
Thruster Type Specific
Impulse[s] Thrust[μN] Developing Agency
H2O2-Monopropellant 160 1-1000 NASA GSFC Cold Gas 40-80 500-50000 MIT,NASA JPL
Digital Solid 200 10-100000 NASA
GRC,TRW,CNES Vaporizing Liquid 75-125 1-100 NASA JPL
Ion Engine 1400-2000 .1-10 NASA JPL FEEP* 17000 10-200 University of Pisa
*Field Emission Electric Propulsion (FEEP)
With these future missions in mind, the rapid miniaturization of electronics and
the emergence of MEMS manufacturing technology has allowed for the
conceptualization of batch manufactured low-cost miniature spacecraft with the potential
to drive down mission costs without substantially compromising on performance.
Section 2 Historical Perspective
The use of Hydrogen Peroxide for propulsion and power is not new, it was
heavily utilized in the infancy of rocket research. The pioneering work was performed by
Dr. Helmut Walter while at the Germania shipbuilding yard in Kiel, Germany in the early
1930’s. There he recognized the unique problem to submarine propulsion, namely that
the air supply had to be compromised between propulsion and breathable air for the
crew.4 Furthermore, the underwater cruising speeds of submarines could potentially be
increased by the use of gas turbines; however the extravagant air requirements made
them impractical. To overcome this issue research was initiated into the use of liquid
oxidizers for gas turbine based submarines. Weighing the complexity of liquid oxygen
storage against the toxicity of nitric acid Walter concentrated on the use of hydrogen
peroxide decomposition products as a potential oxidizer source. He recognized that the
tremendous increase in volume upon decomposition and high temperatures could be

4
utilized to drive steam turbines in both the “cold” (monopropellant) mode and the “hot”
(bi-propellant) mode. The “hot” engine utilizes combustion of fuel with the hot oxygen
in the decomposition products to further raise the temperature of the superheated steam.
In autumn of 1940 the experimental submarine V80 reached an underwater speed of 28
knots, compared to 8 knots for its diesel-electric counterparts.
With the onset of World War II the German Army Ordinance Department
expressed interest in the development of liquid fueled rockets and rocket propelled
aircraft. The first monopropellant hydrogen peroxide rocket was tested in 1936. The
thrust chamber was lined with a permanganate paste catalysts into which the concentrated
hydrogen peroxide was injected. These tests evolved into the development of RATO
units that were deployed on the Henkel 176 fed by 80% hydrogen peroxide. 1941 saw
the most famous application of hydrogen peroxide with the maiden flight of the
Messerschmidt 163 rocket powered aircraft. The aircraft would eventually reach speeds
of up to 1000km/hr, 300km/hr more than its jet powered counterparts. The aircraft
engine was fed with hydrogen peroxide, and a blend of hydrazine, methanol, water, and
calcium permanganate as a catalyst for the peroxide. The two liquids (the peroxide and
the mixture) were injected simultaneously in a bi-propellant derivative.
The use of peroxide in a launch vehicle as a main engine propellant has seen only
one application. Between 1958-1965 the UK Black Knight and Black Arrow research
rockets completed 22 successful sub-orbital flights with a flight to LEO in 1971. The
“Gamma” series engines relied on hydrogen peroxide and kerosene as propellants, with
the peroxide decomposed over silver screen catalyst packs immediately upstream of the
combustion chamber.

5
With the onset of the cold war the design trade space shifted to favor performance
over safety, reliability, and cost. This combined with the development of the UHP
hydrazine and the Shell 405 catalyst led to the almost absolute displacement of hydrogen
peroxide by hydrazine in monopropellant RCS systems, and by hydrazine/NTO in bi
propellant systems. The only current application of hydrogen peroxide is in the RCS
thrusters of the Russian Soyuz.
As mentioned above the use of HTP is making a comeback, largely due to the end
of the cold war and the paradigm shift towards low cost environmentally benign design.
The various historical applications of hydrogen peroxide are shown in Tables 1.2, 1.3,
and 1.4, below.
Table 1.2. Mono-Propellant

6
Table 1.3. Gas Generator Applications
Table 1.4. Bi-Propellant Applications
Section 3 Fundamentals of Meso-Scale Hydrogen Peroxide Propulsion
Introduction
The following section will outline the fundamental principles behind hydrogen
peroxide propulsion, and the challenges associated with its operation at the meso-scale.
Generally, the basic operation of an H2O2 based engine has not changed since the
inception of the first Walter steam turbines in the 1930’s. Hydrogen Peroxide is pressure
fed (either by pump or pressurant) across a fuel injector which distributes the peroxide

7
over a catalyst bed.4 The resultant oxygen rich superheated steam mixture is fed either
through a nozzle, in a monopropellant configuration, or into a combustion chamber to
react with fuel, in a bi-propellant configuration. In the early phases of hydrogen peroxide
rocket development both the solid catalyst salt solution and hydrogen peroxide were
injected under pressure into the combustion chamber. This was the principle behind the
RI203 and RI209 Rocket Assisted Takeoff (RATO) units deployed by the Germans in
WWII. 4 A later evolution of the RATO units would include mixing the catalyst with fuel
doped with hydrazine hydrate. This combination is hypergolic with hydrogen peroxide
and would yield much higher specific impulse than hydrogen peroxide alone. This
research would lead to the development of the Me163 rocket interceptor, the only piloted
aircraft powered by hydrogen peroxide. Although successful, the long term stability of
fuels blended with catalysts is questionable and such systems have not been widely used.5
Another methodology is injecting the hydrogen peroxide and fuel directly into the
combustion chamber and initiating combustion using a pilot flame.6 However, in such
systems it is difficult to ensure ignition and stable combustion. 5 The above techniques
can be summarized in the following way:
Mono-Propellant
o Injection of hydrogen peroxide over a catalyst bed (heterogeneous catalysis).
This configuration is more complex than direct injection of catalyst into the
combustion chamber, and comes with generally larger pressure drops. However,
the decomposition products are clean since there is no solid material flowing with
the superheated steam and oxygen. This configuration was utilized in the Walter
steam turbine driven submarines.

8
o Simultaneous injection of hydrogen peroxide and catalyst (homogenous
catalysis). `This configuration was widely used by the Germans in WWII for
rocket propulsion and catapult work due to its simplicity. However, the catalyst
salt precipitates out of solution during the catalytic reaction. The solid material
flowing with the decomposition product could potentially clog small orifices and
injectors leading to failure. 5
Bi-Propellant
o Decomposition over a catalyst pack with subsequent combustion with fuel
(heterogeneous catalysis). Such a configuration has been successfully utilized in
the black knight and black arrow research rockets however have not been utilized
in a launch system since.
o Catalytic/Hypergolic reaction between hydrogen peroxide and fuel (homogenous
catalysis). This involves blending the fuel with hydrogen peroxide
catalysts/hypergolics. Although successfully deployed, the long term stability of
the fuel blends is not well understood, and the use of hypergolics (inorganic
amines such as hydrazine) does not eliminate the reliance on toxic propellants.
The selection of the appropriate decomposition technique requires consideration
of the unique requirements of meso-scale thrusters. Meso propulsion systems must be
simple in design and operation since complicated systems only increase cost. A system
that involves the injection of a liquid catalyst increases the overall system mass but
circumvents the catalyst degradation problems associated with heterogeneous catalysis.
Inevitably this leads to decomposition efficiencies that are constant over the system
lifespan. 5 On the other hand, the catalyst salt precipitates out of solution potentially
clogging small flow pathways and injectors.5 For micro satellite systems with limited
mission duration the development of catalytic micro-reactors in series with mono and bi-
9
propellant thrust chambers presents the most practical option for a hydrogen peroxide
based micro propulsion system. The following sections will focus on the challenges
associated with heterogeneous catalysis of hydrogen peroxide, and those associated with
a complementary meso-scale thruster.
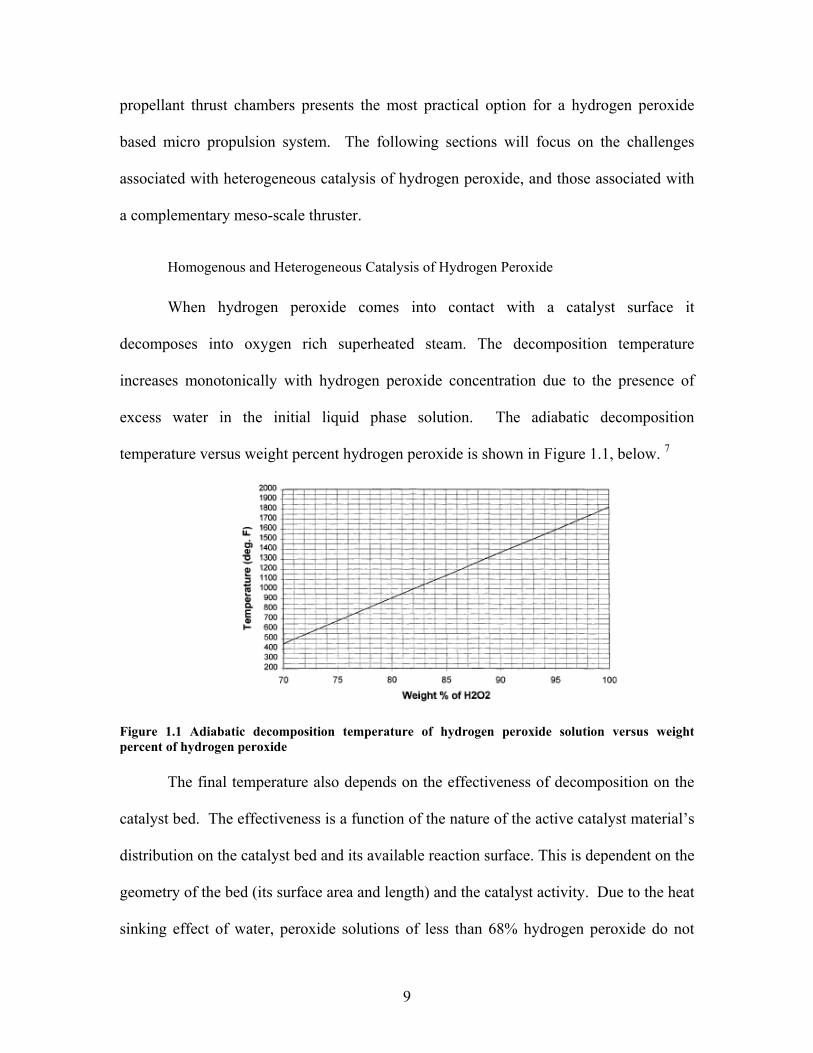
Homogenous and Heterogeneous Catalysis of Hydrogen Peroxide
When hydrogen peroxide comes into contact with a catalyst surface it
decomposes into oxygen rich superheated steam. The decomposition temperature
increases monotonically with hydrogen peroxide concentration due to the presence of
excess water in the initial liquid phase solution. The adiabatic decomposition
temperature versus weight percent hydrogen peroxide is shown in Figure 1.1, below. 7
Figure 1.1 Adiabatic decomposition temperature of hydrogen peroxide solution versus weight percent of hydrogen peroxide
The final temperature also depends on the effectiveness of decomposition on the
catalyst bed. The effectiveness is a function of the nature of the active catalyst material’s
distribution on the catalyst bed and its available reaction surface. This is dependent on the
geometry of the bed (its surface area and length) and the catalyst activity. Due to the heat
sinking effect of water, peroxide solutions of less than 68% hydrogen peroxide do not

10
possess the chemical energy necessary to vaporize all of the water in solution and thus
will not yield steam.8 For pure hydrogen peroxide the global decomposition can be
represented by the following net reaction 8:
mol
kJHRgOgOHlOH
96)()(2)(2 2222 Eq.1.1
In order to determine the nature of decomposition numerical studies performed in
a single channel have allowed the segregation of the catalyst bed into five distinct
regions. 9 The five regions are shown in Figure 1.2, below.
I. The heat of reaction raises the mixture temperature to the boiling point of
water in the initial solution
II. Isothermal boiling of water
III. The solution temperature is increased up to the hydrogen peroxide boiling
point
IV. Isothermal boiling of hydrogen peroxide
V. Vapor phase/Thermal decomposition of hydrogen peroxide up to the final
gas temperature
Figure 1.2. Five regions of decomposition, note that the length of the regions is for illustrative purposes only and not indicative of realistic behavior 9

11
The first four regions involve the liquid phase decomposition of hydrogen
peroxide with catalyst, the critical length of which is determined by the time required to
boil off the liquid constituents in the initial solution. The decomposition mechanism in
the liquid phase is not entirely understood, and formulating the reaction kinetics in an
Arrhenius form requires consideration of variables which are largely unpredictable, such
as the impurities in the initial solution and both catalysis and inhibition of catalysis by the
experimental apparatus (fuel lines, fuel injector, etc.) these amount to irreproducibility in
the system. 10 However, the general scheme involves the disassociation hydrogen
peroxide at the surface of the catalyst; the products of disassociation (two OH radicals)
are held at the surface and react with the molecules impinging from the surrounding fluid,
allowing the reaction to propagate. 10 The propagation is considered to be homogenous. It
is important to note that this net initial step is common to most hydrogen peroxide
disassociation mechanisms because between the two bond types present in hydrogen
peroxide (O-O and O-H) rupturing the O-O bond requires less energy and is more
probable. Numerical results indicate that the critical length for decomposition, that is the
length required to reach the product gas temperature, is dominated by Regions I-IV due
to the latent heat of vaporization of both the water and hydrogen peroxide.10 This length
can be minimized by increasing the catalyst activity in these regions, increasing the
surface area, and decreasing the heat loss. The first two directly relate to the rate of
disassociation at the catalyst surface and the availability of active sites for disassociation,
and the latter to the rate of temperature increase in the reactor.

12
Region V represents decomposition in the vapor phase; the decomposition
mechanism is presented below. As in the liquid phase the reaction is initiated by
disassociation of peroxide into its constituent hydroxyl radicals. 10
22222
2222
22
OOHOHOHHO
OHHOOHOH
OHOHOH
(1.2, 1.3, 1.4)
The reactions are terminated by one of the following mechanisms:
MOOHMHOOH
MOOHMHO
MOHOH
222
2222
22
2
2
(1.5)
There are three important factors concerning the vapor phase decomposition
mechanism. The first is that chain branching reactions are not thermodynamically
favorable, so the overall reaction rate is dictated by the chain initiation step, Reaction 1.2.
10 The above mechanism applies to both homogenous and heterogeneous vapor phase
decomposition; when the vapor is passed over a catalyst it provides a reaction pathway
with lower activation energy, allowing the reaction to proceed at lower temperature. 10
However, at above roughly 425°C 10 the heat of reaction is sufficient to disassociate
hydrogen peroxide into its constituent OH radicals; the result is a change from a
heterogeneous to homogenous reaction that is thermal in nature. The practical result is
that after the initial liquid is vaporized the decrease in total heat capacity results in an
abrupt temperature increase, leading to homogenous decomposition. Additionally, in the
vapor phase the reaction rate is higher than the diffusion rate of hydrogen peroxide to the
catalyst surface, meaning that the choice of catalyst for Region V is independent of the
catalyst activity; this is unlike the behavior in Regions I-IV where catalysis of high

13
activity inevitably lead to shorter bed lengths. These factors lead to the following
conclusions for catalyst design, the major goal being to maximize the bed load while
minimizing the total reactor volume (reducing the mass). The bed load is defined as the
ratio of the reactant mass flow rate to the nominal cross sectional area of the catalyst bed:
High catalyst activity in the Regions I-IV where liquid phase reaction occurs
Minimal heat loss from the reactor or preheating of the reactor. This will lead to
higher evaporation rates in Regions I-IV and quicker progression to homogenous
reaction in Region V reducing the reactors critical length.9 Approximating
adiabatic conditions will also lead to higher product gas temperatures and
heightened performance
High surface area to promote catalyst activity
The above considerations apply to any miniature hydrogen peroxide steam generator
while some mechanical considerations are particular to propulsion systems:
High resistance to thermal and mechanical shock
Low catalyst degradation
High resistance to fouling by hydrogen peroxide stabilizing agents: The use of
stabilizers will promote the long term stability of fuel stored for extended periods
Minimal weight and pressure drop across the bed: minimizing the pressure drop
will reduce the ancillary equipment necessary to deliver the required upstream
pressure for a desired chamber pressure
Hydrogen peroxide is unique in that it can be catalyzed by a number of inorganic
materials. Of historical interest is the use of manganese in the form of permanganate 4,
this was heavily used in the developmental phase of hydrogen peroxide propulsion. The

14
manganese was present in the form of calcium permanganate, which readily dissolves in
water. Calcium permanganate (as opposed to other permanganate salts such as potassium
permanganate) was chosen because of its higher solubility in water at low temperature.
This requirement was borne out of the necessity for storable propellants to survive the
harsh German winters during World War II. Modern catalysts arrangements focus on the
use of either silver, platinum/platinum black, or permanganate solutions in any one of
basically four configurations: liquid-liquid, pellet bed, packed screen beds, and
monoliths. All four configurations have their benefits and setbacks. As stated earlier,
liquid-liquid homogenous decomposition requires both storage and pressurization, either
by pressurant or pump, of both hydrogen peroxide and liquid catalyst. These extra
requirements increase the overall system mass; however, liquid-liquid systems do not
suffer from catalyst fouling and deliver consistent performance over the lifespan of the
system. Pellet beds have the benefit of having a high surface area to volume ratio,
however packed pellet beds suffer from large pressure requirements and damage from
thermal shock. Metallic screens have similar benefits and limitations as pellet beds
however do not suffer from attrition due to pellet motion, since the screens are kept
stationary. 5 Silver based metallic screens also tend towards low structural stability, since
the silver melting temperature is close to the decomposition temperature of highly
concentrated hydrogen peroxide; platinum screens could be used to increase the working
temperature but at prohibitive cost.5 For miniature systems, monolithic beds are attractive
due to their low pressure drops (two to three orders of magnitude less than packed beds ),
controllable surface area, simple flow geometries, and high structural stability.5
Monolithic catalyst beds can be divided into three distinct regions: the support material

15
that defines the monolith geometry, a wash-coat that increases the surface area, and the
active catalyst metal. 5 It is beneficial to fabricate the support material from a porous
refractory ceramic in order to maximize surface area and thermal resistance. Some
potential monolithic catalyst arrangements are shown in Figure 1.3.
Figure 1.3. Potential catalyst bed arrangements: a) multiple stage rectangular channel. b) Circular post. c) Diamond post. d)monolithic cellular ceramic
The next section will discuss the nature or combustion as the meso-scale, the
problems associated with combustor scaling and the basic requirements for a successful
combustor/thrust chamber.
Meso-Scale Combustion
Meso- and micro scale combustors are those who’s limiting dimension is between
1.0 cm. and 1.0 mm and less than 1 mm., respectively. Although this size definition does
not characterize the size of the combustor or combustion system as a whole, the limiting
dimension creates a thermo-physical environment that is different from combustors at the
macro-scale. This section will discuss in detail the differences between meso- and micro-
scale combustion and their macro-scale counterparts. It is important to note that the
whole combustor or combustion system may be of the macro scale.
In an early review of small scale combustion research Fernandez-Pello 11
provided a detailed analysis of the problems and challenges associated with combustion
at the meso- and micro-scale. The following is adapted from that reference to reflect the

16
concepts that are relevant to results presented in this report. In order to stabilize a flame
in a finite volume (in a combustor) a number of basic conditions must be satisfied, these
conditions are listed below:
At a minimum the rate of heat generated by the flame must balance the
rate of heat lost through the walls of the combustor
The residence time of the mixture in the combustion chamber must be
equal to or greater than the time required for the fuel and oxidizer to react
For non-premixed reactants the characteristic mixing time must be larger
than the residence time for complete mixing to occur, for liquid fuels this
includes the time required to evaporate the fuel (or oxidizer)
As stated above with regards to heat loss the heat liberated by chemical reaction must
approximately balance the heat lost through the walls of the combustor in order to
stabilize the flame. As the length scale of a combustor is reduced the surface area
available for heat loss becomes large relative to the volume available for the reaction to
take place. When the combustor is made sufficiently small the rate of heat loss will
increase to the point where the reaction will quench. The “quenching distance” is
defined as the diameter of a tube (a cold tube) through which a flame cannot propagate
due to the adverse effects of heat lost through the walls. This effect is commonly used as
a safety measure to ensure that premixed flames do not back up into the fuel/air supply
lines. In order to understand the requirements for stabilization of a flame in an
environment of adverse heat loss an analogue can be drawn to the requirements for
ignition of a steadily propagating spherical flame.12 Considering a large (infinite) volume
of premixed fuel and air in which a spark is initiated, provided the spark has enough

17
energy a spherical flame will originate from the spark location. When the flame is small
its surface area to volume ratio is huge and the rate of heat loss from the flame will be
much larger than the rate of heat liberated by the chemical reaction of the small volume
of gas on the periphery of the flame where the reaction takes place. In order for the flame
to propagate the enthalpy of the burned gas contained within the sphere must be large
enough to provide the heat required to promote the reaction and balance the heat lost
from the flame surface. Eventually, the flame radius will grow large enough to where the
volume of gas contained within has enough energy to support the reaction; this is known
as the critical flame radius, or the radius below which a self-propagating flame cannot
exist. However, in order for a flame to get to reach the critical radius the spark must raise
the enthalpy of the gas so high that the added energy allows the burned gas temperature
to remain above the adiabatic flame temperature as the subcritical flame cools and grows
to the diameter of a steadily propagating spherical flame. This excess enthalpy is a
component of the required ignition energy. When the flame is confined in a sub-critical
volume this excess enthalpy requirement is never relaxed and with the exception of an
adiabatic wall heat in excess of the minimum required to ignite the mixture must be
provided to the reactants in order to stabilize the flame.
In this regard, different small scale-combustion schemes are often characterized
by the technique employed to overcome thermal quenching. Wu et al. 12 utilized
asymmetric ‘‘whirl’’ whereby recirculating flow act as a source of enthalpy and radical
species to stabilize flames in geometries close to the quenching distance. Developed as a
precursor to a mesoscale thruster the H2/air ‘‘whirl’’ combustor demonstrates relatively
high characteristic velocity (C*) efficiency ratios, which is defined as the ratio of hot

18
flow C* efficiency to cold flow C* efficiency, indicating high combustion efficiency.
Characteristic velocity represents the exhaust velocity of a converging nozzle with a
thrust coefficient of one, and is hence related to the enthalpy of the exhaust gas.
Additionally, the lack of heat exchangers for heat transfer between products and reactants
makes for small overall geometries; however, the combustor characteristic length is
larger than the quenching distance at standard conditions. Ahn et al. 13 used Pt catalysts to
provide a reaction pathway with decreased activation energy, which increased the amount
of heat loss the system could tolerate prior to thermal quenching. The use of catalysts is
shown to broaden the extinction regime in the low Reynolds number (low heat load)
direction and with low chamber temperatures. Sher et al. 14 computationally explored the
limits of Homogenous Charge Compression Ignition (HCCI) as a means to miniaturize
micro-internal combustion engines. HCCI involves the homogenous reaction of a charge
when it is compressed and is not subject to the limitations of normal flame propagation.
In these devices the limitations are imposed by frictional losses, charge leakage through
the piston cylinder gap, and timing problems. Several researchers have used structural
conduction as a means to preheat the incoming reactants without dilution, thus enabling
combustion in ‘‘sub-quenching’’ dimensions.13,15,16 Sub-quenching is defined as any
space where the smallest dimension is less than the quenching distance with the reactants
and wall held at ambient conditions. The predominant example is the heat recirculating or
‘‘swiss-roll’’ combustor, which utilizes a spiral countercurrent heat exchanger to preheat
the incoming reactants; the spiral is situated such that the reactants are always outside the
products. The concept is a meso-scale adaptation of the large-scale heat recirculating
combustors studied by Jones et al. 19 who used this device to burn fuels of low energy

19
content and extend the lean flammability limits of conventional fuels. The cause for this
extension of the extinction regime is discussed below.
As stated above, with regards to critical times scales within the combustion
chamber the time required for chemical reaction must be equal to or greater than the
amount of time the mixture stays in the combustion chamber. If the residence time is
smaller than the chemical time the flame will get pushed out of the combustion chamber,
if the residence time is larger than the reaction time the flame may propagate upstream of
the combustion chamber and quench in the inlet region. In the case of small scale
combustors, low velocity extinction limit is often due to the onset of thermal quenching
of the reaction, or blow off of the flame when heat loss from the reaction zone cools the
reactor to the point where the characteristic reaction time to fall below the residence time.
Due to the small combustor dimensions the Reynolds number will be low (laminar to
transitional) and the residence times small and hence the flame will not benefit from the
added reaction rate gained from turbulent combustion. High reaction rates (low chemical
times) can be achieved by ensuring high combustion temperatures, reducing heat loss
from the combustion chamber, preventing radical depletion at the wall, increasing the
reactant temperature, using near stoichiometry mixtures, and using highly energetic fuels.
11
Since the Reynolds numbers are low mixing of non-premixed reactants will be
largely via molecular diffusion, and although the small dimensions of meso- and micro-
combustors aids in reducing the mixing time the low residence times may be insufficient
for complete mixing. For example, a gaseous fuel air mixture flowing through a .5mm
channel will have a diffusion time will be on the order of 0.2 sec. Whereas if the flow

20
velocity is on the order of 1m/s, 25mm of channel is required to ensure complete mixing.
11 Enhanced mixing may be achieved through dynamic approaches such as flow
instabilities, ultrasound, etc. although fabrication complexities make these options
difficult. If the fuel is a liquid there is an additional requirement that the fuel be
vaporized in addition to mixed with the oxidizer. The time required for mixing may be
large compared to residence time, especially if spray atomization is used; this complexity
is in addition to the small droplet sizes required to ensure vaporization as per the d2
relationship for droplet vaporization. Alternatives to spray combustion include both pre
vaporization using porous media and liquid film combustion. In the former, the liquid
fuel is passed through a porous heat recuperator which receives heat either directly from
the flame or through structural conduction with the combustor. In the latter, a liquid fuel
film is formed on the combustor walls, this aids in two ways. First the wall temperature
does not exceed the volatilization temperature of the fuel, since any energy added to the
wall goes into vaporizing more fuel. Second, since the fuel vaporizes from the wall
surface there is a substantial standoff distance between the flame and the wall, since the
fuel must vaporize and mix prior to burning. This inhibits the reaction quenching effects
of the wall via both active species loss and heat.

21
Section 5 Research Goals
The following lists the research goals providing the foundation for the material
presented in this thesis: based on the motivation, background, and practical needs
presented above:
Develop a mesoscale thrust chamber capable of producing mN levels of thrust
at moderate Isp (~150s), assembly volume should be on the order of a few
cm3
Utilize the heat recirculating “Swiss-Roll” geometry as the basis for the thrust
chamber
Adapt the geometry for use with Hydrogen peroxide decomposition products
as an oxidizer source (Steam +oxygen) where the fuel and oxidizer are
injected separately
Integrate the thrust chamber with a catalytic hydrogen peroxide driven gas
generator for bi-propellant operation

22
Section 6 References
1Wertz, J. Reducing Space Mission Cost. Boston: Kluwer Academic Publishers, 1996.
2Bonafacio, S. “Analysis and Design of a Multi-phase Catalytic Reactor for the
Decomposition of Hydrogen Peroxide in Space Propulsive Systems”. PhD
Dissertation, Universita degli Studi di Napoli “Federico II”..Web. 2006
3Baker, A., Curiel, A., Schaffner, J., and Sweeting, M.""You can get there from here”:
Advanced Low Cost Propulsion Concepts for Small Satellites beyond LEO." ACTA
ASTRONAUTICA. 57. (2005): 288-301.
4Stokes, P.R. "Hydrogen Peroxide for Propulsion and Power." Science Museum of
London. London, Jan 14, 1998. Address.
5. Scharlemann. C., Schiebel., M, Marhold, K., Tajmar, M., Miotti, P., Kappenstain, C.,
Batonneau, Y., Brahmi, R., “Development and Test of a Miniature Hydrogen Peroxide
Monopropellant Thruster”. 42 AIAA/ASME/ASEE Joint Propulsion Conference and
Exhibit. Sacramento California. July 2006.
6. Musker, A. Roberts, G., Ford, S., Reakes, E., Westbury, T. “Auto-Ignition of Fuels
Using Highly Stabilized Hydrogen Peroxide.” AIAA Paper 2005-4454, 19 Oct. 2007.

23
7. Ventura, M.C. “Advancements in High Concentration Hydrogen Peroxide Catalyst
Beds.” AIAA Paper 01-3250, July 2001
8. An, S., Lim, H. and Kwon, S., “Hydrogen Peroxide Thruster Module for
Microsatellites with Platinum Supported by Alumina as Catalyst”.
9. Zhou, X. Hitt, D.L. “One Dimensional Modeling of Catalyzed H2O2 Decomposition
in Micro-Channel Flows”.
10. Schumb, Walter. “Hydrogen Peroxide”Reinhold Publishing Company New York,
New York. 1955
11. Fernandez-Pello, A.C, “Micro-Power Generation using Combustion: issues and
approaches” 29th Int. Symposium on Combustion, The Combustion Institute,
Pittsburgh, PA, 2002, pp. 1–45
12 Wu, M., Wang, Y., Yang, V., and Yetter, R.A., “Combustion in Meso-Scale Vortex
Chambers,” Proceedings of the Combustion Institute, Vol. 31, Issue 2, Jan. 2007,
pp.3235-3242.
13 Ahn, J., Eastwood, C., Sitzki, L., and Ronney, P.D., “Gas Phase and Catalytic
Combustion in Heat Recirculating Burners,” Proceedings of the Combustion Institute,
Vol. 29, Issue 7, 2002, pp.957-963.

24
14 Sher, I., Levinson-Sher, D., and Sher, E., “Miniaturization Limitations of HCCI
Internal Combustion Engines,” Applied Thermal Engineering, Vol. 29, Issues 2-3,
Feb. 2009, pp. 400-411.
15 Vijayan, V. and Gupta, A.K., "Combustion and Heat Transfer at Meso Scale with
Thermal Energy Recirculation," 47 AIAA Aerospace Sciences Meeting, January 5-8,
2009.
16 Kim, N., Aizumi, S., Yokomari, T., Kato., S., Fujimori, T. and Maruta, K.,
“Development and Scale Effects of Small Swiss Roll Combustors,” Proceedings of
the Combustion Institute, Vol. 31, 2007, pp. 3243-3250.
17 Jones, A.R., Lloyd, S.A., and Weinberg, F.J., “Combustion in Heat Exchangers,”
Proceedings of the Royal Society of London. Series A, Mathematical and Physical
Sciences, Vol. 60, 1978, pp.97-115.

25
Chapter 2: Literature Review
Micro and mesoscale combustion has gained much interest largely because of the
rapid development of MEMS technology and the need to provide power to microscale
systems.1 This is further compounded with the desire to replace batteries with
hydrocarbon based fuels due to their higher energy density and to provide portable
power. Even at 10% energy conversion efficiency hydrocarbon fuels can provide 10
times the energy density of the most advanced batteries.2 Note that this argument is made
by considering only the specific energy of the fuel consumed as opposed to the mass of
the entire combustion system (i.e., tankage, lines, flow control, combustor). Power
systems in development include the miniaturization of Brayton and Rankine cycle
engines and the development of both thermoelectric and thermophotovoltaic generators
utilizing gas phase and catalytic combustion as a heat source. The promise lies in overall
power densities that are substantially larger than their marcoscale counterparts.1 Potential
applications include: future electronics, remote sensors, aerial vehicles, portable
battlefield power, and Divert and Attitude Control Systems (DACS) for small satellites.
With regards to scale, combustion length scales can generally be broken into three
categories macro, meso, and micro-scale. Macro-scale covers systems where the
characteristic geometry is larger than 1.0 cm., meso-scale covers systems where the
characteristic dimensions are between 1.0cm. and 1.0mm., and micro-scale covers
systems where the characteristic dimension is less than 1.0mm. It is important to note
that the association of a particular scale to a system depends on the minimum length scale
that substantially affects the dynamics of the flame and not the overall size of the device.

26
As will be seen later a meso-scale combustion system is typically larger than meso-scale
in overall size.
Regardless of the application, developing a combustor capable of burning
fuels/propellant at the meso-scale requires careful attention to scaling problems
associated with combustion. The principle challenge is overcoming the adverse effects of
heat loss due to large surface area to volume ratios (heat loss to heat generation). When
the latter is approximately one or greater the combustion reaction cannot propagate. In
this regard, different small scale-combustion schemes are characterized by the technique
employed to overcome thermal quenching. Some successful schemes include the
recirculation of active species and heat through asymmetric whirl3, reduction of the
activation energy through the use of catalysts4, Homogenous Charge Compression
Ignition (HCCI)5, and heat recirculation6. The use of heat recirculation for sub-quenching
flames is a meso-scale adaptation of the large-scale heat recirculating combustors studied
by Jones, Lloyd, and Weinberg6 . The focus of their studies was to burn fuels with low
energy content and extend the lean flammability limits of conventional fuels. This
enhancement in flammability limits provide heat recirculating combustors with the
flexibility to be used as either for power generation or thrust production depending on the
conditions of operation and geometry. This review is primarily focused on experimental
work that has been conducted on heat-recirculating “Swiss-Roll” combustors as well as
the impact of geometry, materials, catalysts, and scale on the thermal performance,
extinction criteria/regimes, and flame dynamics. Additionally, an overview of meso-
scale power systems is provided covering both propulsion and electric power generation.

27
Section 1 Thermal Performance, Flame Extinction, and Flame Dynamics
Experiments carried out to determine the thermal performance and extinction criteria
of meso-scale heat recirculating combustors have largely been focused on the effects of
the following combustor characteristics: the effect of scale both in terms of heat
exchanger geometry (channel width, number of turns, and the wall thickness) and
combustion volume, the effect of catalyst on the heat loss induced extinction criteria, and
the effect of material and its contribution to overall wall conductance. The following
sections will discuss some experimental efforts to qualify and quantify these effects;
however, they will be preceded by a general discussion of extinction phenomenon and
global thermal performance characteristic of heat recirculating meso-combustors.
Extinction regimes for heat recirculating combustors typically exhibit dual branched
characteristics with extinction occurring at both high and low Reynolds numbers for a
given fuel flow rate. Extinction regimes for “Swiss-roll” type meso-combustors are
shown below, in Figure 2.1, as reported by both Vijayan and Gupta7, similar results have
been presented by Oh, Huh, Ahn, and Ronney8 for a similar geometrical configuration.
Figure 2.1. Extinction regime for premixed propane/air in a zirconium phosphate meso-combustor

28
The high Reynolds number (Re), high mass flow rate, limit is a flame “blow off”
limit where the velocity of the incoming reactants is larger than the flame propagation
velocity and the flame is pushed out of the combustion volume. This is a characteristic of
premixed combustion systems and is not unique to the meso-scale. The influence of
flame propagation at the meso-scale becomes more apparent at the low Reynolds number
extinction limit where small rates of heat release are coupled with high heat losses to
induce extinction. The heat loss driven limit may occur as a consequence of thermal
quenching, whereby the rate of heat lost from the combustion volume approximately
balances the rate of heat liberation by chemical reaction9, alternately a second “blow-off”
limit is possible at low Re whereby the combustion volume cools to the point where the
flame velocity is lower than the incoming flow velocity. The second mode of low Re
extinction is especially important for premixed meso-combustors where the small
geometries render high flow velocities even at low Re and hot combustor walls inhibit
thermal quenching. It is important to note that the heat lost from the combustion chamber
is only weakly dependent on Re, since heat losses are driven by temperature gradients,
however it is highly dependent on equivalence ratio. Conversely, the rate of heat release
is dependent on both Re and equivalence ratio, since it is proportional to the mass of fuel
consumed. For this reason if the low Re extinction mode is by thermal quenching than
the extinction limit should be dependent on both Re and equivalence ratio (ratio of heat
liberated to heat lost), however if the extinction is a result of low Re blow off then the
extinction limit should be roughly independent of Re and dependent on equivalence ratio.
It is important to note that in some cases the combination of high preheat temperatures
and premixed reactants lead to the flame flashing-back to the burner inlet.8

29
Vijayan and Gupta10,11 conducted several studies on the global thermal performance
of ceramic heat recirculating burners burning both propane/air and methanol/air by a
semi-empirical method by using thermocouples to measure the exhaust temperature and
equilibrium exhaust gas properties to determine the global ratios of heat output/heat
input, heat output/heat load, heat loss/heat input and heat loss/heat load. Figure 2.2 shows
exhaust and pre-heat temperatures for several fuel flow rates (heat loads).10 Note that the
heat load is calculated based on complete consumption of the limiting reactant.
Figure 2.2..Exhaust and preheat temperatures for heat recirculating “Swiss-roll” combustors
burning propane/air. 10
Figure 2.2 (left) shows the variation in preheat temperature with equivalence ratio at
constant fuel flow rate (heat load). The preheat temperature increases with decrease in
equivalence ratio since the amount of fuel consumed and hence the heat released
increases with decrease in equivalence ratio. As the mixture is made fuel lean the preheat
temperatures decreases since the fixed heat release is made to heat up a larger amount of
air. Exhaust temperatures (right) increase monotonically with decrease in equivalence
ratio. This is contrary to the flame temperature which decreases on both sides of
stoichiometric condition. If the objective is to utilize the enthalpy of the exhaust to do

30
work than the global effect of this behavior is to provide the highest efficiency close to
the lean stability limit. However, if the objective is to utilize the heat lost through the
reactor walls than the most efficient mode of operation is close to the rich stability limit.
Figure 2.3, shows both the enthalpy of the exhaust/heat load for varying heat loads.10
Figure 2.3. Normalized output power (thermal efficiency) vs. equivalence ratio at various heat loads
(with propane fuel) 10
Section 2 Geometry and Scale Effects
Geometry and scale effects on the performance of both “Swiss-Roll” and “Flat-type”
countercurrent combustor geometries have been studied by Oh, Huh, Ahn, and Ronney12,
Lee, Cho, Choi, and Kim13, and Lee and Kim14 , Vijayan and Gupta15, and Kim, Kato,
kataoka, Yokomiru, Maruyama, Fujimori, and Maruta16. Ronney et. al12 studied the effect
of scale on both the gas phase and catalytic combustion of propane/air in combustors of
the “Swiss-roll” configuration having 3.5 turns and fabricated from titanium-811 alloy
sheets wrapped into a rectangular spiral. Three combustors with the same channel width
and constant varying wall thickness (0.25mm, 0.5mm, and 1.0mm) were fabricated to
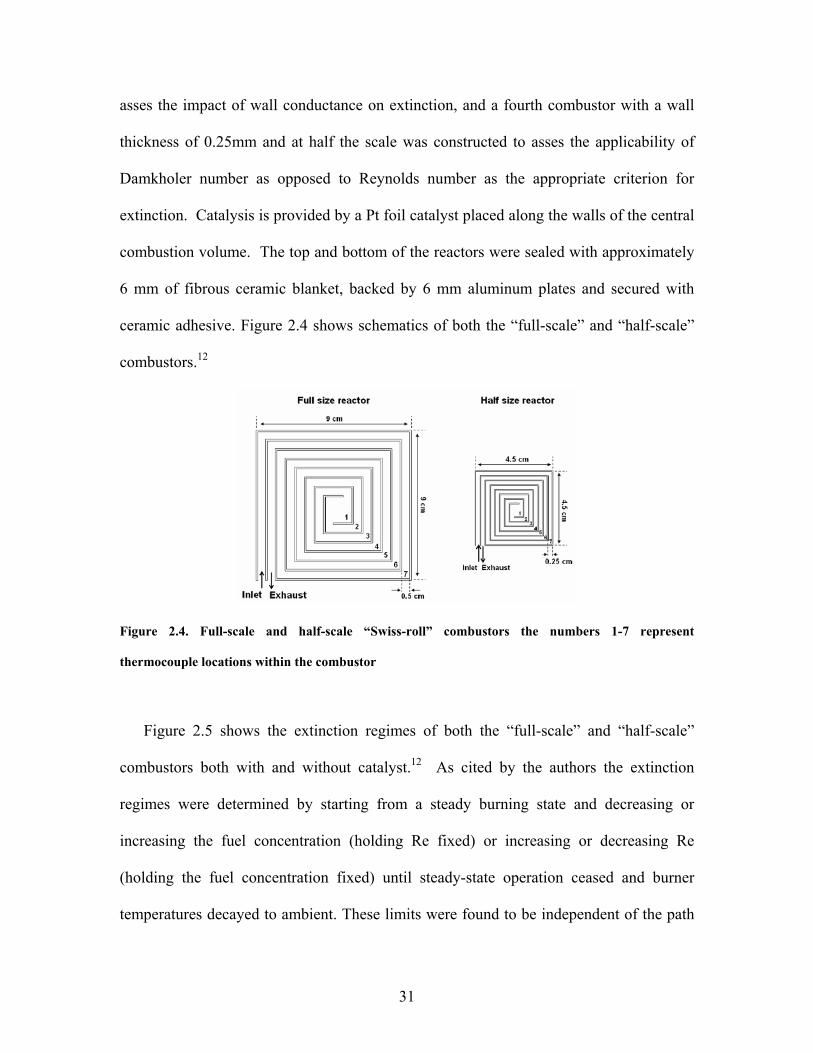
31
asses the impact of wall conductance on extinction, and a fourth combustor with a wall
thickness of 0.25mm and at half the scale was constructed to asses the applicability of
Damkholer number as opposed to Reynolds number as the appropriate criterion for
extinction. Catalysis is provided by a Pt foil catalyst placed along the walls of the central
combustion volume. The top and bottom of the reactors were sealed with approximately
6 mm of fibrous ceramic blanket, backed by 6 mm aluminum plates and secured with
ceramic adhesive. Figure 2.4 shows schematics of both the “full-scale” and “half-scale”
combustors.12
Figure 2.4. Full-scale and half-scale “Swiss-roll” combustors the numbers 1-7 represent
thermocouple locations within the combustor
Figure 2.5 shows the extinction regimes of both the “full-scale” and “half-scale”
combustors both with and without catalyst.12 As cited by the authors the extinction
regimes were determined by starting from a steady burning state and decreasing or
increasing the fuel concentration (holding Re fixed) or increasing or decreasing Re
(holding the fuel concentration fixed) until steady-state operation ceased and burner
temperatures decayed to ambient. These limits were found to be independent of the path

32
in mixture – Reynolds number space used to reach the limit, thus no hysteresis was
found.
Figure 2.5.Extinction regimes for gas phase and catalytic combustion of propane and air for both the
full and half scale combustors, note that the full-scale combustor has a wall thickness of .5mm while
the half-scale combustor has a wall thickness of .25mm.12
Analysis of scale effects was carried out by considering the minimum Reynolds
number that could support combustion, both in the gas phase and with catalysis. The
minimum Re that could support combustion in the full-scale reactor with and without
catalysis was 0.9 and 36 respectively. Likewise for the half scale reactor the minimum Re
to support combustion were 3.5 and 25 for catalytic and gas phase combustion,
respectively. For combustion with catalysis the extinction regime for the half-scale
reactor shifted towards higher Reynolds numbers as mentioned above, however for gas
phase combustion the smaller reactor was able to support a flame at lower Re than its
larger counterpart, due to its smaller size. The authors note that the difference between
the minimum stable Re for catalytic and gas phase combustion decreases as the reactor
size decreases indicating that at sufficiently small size the marginal benefit of catalysis

33
may become negligible. Although not related to scale effects it is notable that that the
reaction does not always occur inside the combustion space, this is labeled as “out of
center reaction zone” in the figure, since the mixture is pre-mixed flame propagation
upstream of the reaction zone is possible given the appropriate conditions.
Differences in the thermal performance of the half scale and full scale reactors were
also addressed by measuring the maximum temperature measured inside the combustion
chamber using thermocouple. Figure 2.6 shows the maximum temperatures at the lean
extinction limit for both gas phase and catalytic combustion for both the half scale and
full scale reactors.12
Figure 2.6. Maximum temperatures at the lean extinction limit for both gas phase and catalytic
combustion for both the half scale and full scale reactors. 10
Although not related to a discussion of scale the authors note that the minimum
temperature measured in the reactor was 55°C at a Re of 0.9 for the full-scale reactor.
Overall gas phase combustion yielded substantially higher temperatures than
heterogeneous catalytic combustion. With both geometries at higher Reynolds numbers

34
the half-scale reactor demonstrated higher temperatures for both catalytic and gas phase
combustion while the opposite trend was observed at lower Re.
As mentioned previously the effect of wall thickness was also addressed in three full
scale reactors with varying wall thickness. Figure 2.7 shows the effect of wall thickness
on the extinction regimes for both gas phase and catalytic combustion.12 The results
show that reducing the wall thickness allows for the combustion of weaker mixtures (for
catalytic combustion); this is in agreement with theoretical analysis which showed that
reducing the wall thermal conductance should increase the performance at low Re.17 It
should also be noted that for gas phase combustion varying the wall thickness has no
appreciable effect on the minimum Re, however it does have an effect on the equivalence
ratio at the minimum Re. This can be explained by considering that the reaction rate and
hence Damkohler number (Da) are effected by the maximum temperature achieved in the
chamber which is only weakly dependent on Re. Hence the heat loss from the
combustion zone is not strongly dependent on Re, however it is dependent on both
geometry and equivalence ratio (temperature). This is why the extinction criteria for gas
phase combustion is independent of Re but dependent on equivalence ratio.

35
Figure 2.7. Extinction regimes for reactors with varying wall thickness12
Kim et. al.13 studied the effects of wall thickness combustion space size and scale on
heat recirculating combustors of the countercurrent type burning methane/air. However
they avoided the use of spirals because they are difficult to fabricate and difficult to treat
analytically. Alternately, a “flat-type” or “one-dimensional” heat recirculating combustor
was designed to study the effects of design parameters on flame stabilization, and the
effects of scale down on stabilization and performance through measurements of the
surface temperatures and exhaust gas composition. A schematic of the combustor along
with a photo showing the relevant dimensions is shown in Figure 2.813. In Figure 2.8, u is
the upstream channel gap, d is the downstream channel gap, w is the wall thickness and h
is the combustion space height.

36
Figure 2.8.Configuration parameters and a direct photo of the baseline combustor13
This combustor demonstrated a number of flame modes, some of which involve
flame propagation in both the upstream and downstream channels. In order to determine
the effect of wall thickness the up steam and downstream channel widths were
maintained at 1.1mm., which is less than half of the ordinary quenching distance for
methane and air. Figure 2.913 shows the stability margins for four combustors, the
naming conventions for the combustors are as follows: ‘BSw05u11d11’ is a base scale
stainless steel combustor with a wall thickness of 0.5mm an upstream channel width of
1.1mm and a downstream channel width of 1.1mm.

37
Figure 2.9.Effect of wall thickness on flame stabilization in the combustion space13
Considering the cases of ‘BSw05u11d11’, ‘BSw10u11d11’, and ‘BSw15u11d11’
reducing the wall thickness from 1.5-0.05mm resulted in narrowing of the flame stability
margins. This is counterintuitive since heat transfer between two channels with a finite
temperature difference is inversely proportional to the thickness of the middle wall. An
explanation for this behavior is provided by the flame dynamics of the ‘BSw10u11d11’,
and ‘BSw15u11d11’ combustors, that is, the combustors with larger wall thickness. It
was observed that the middle wall glows due to heat feedback from the flame, this
radiation helped to heat the incoming reactants thereby increasing the net heat
recirculation. It is important to note that the flame anchoring characteristics that allow
the flame to sit close to the wall, thereby heating it, come from both the thermal and
hydrodynamic characteristics of the combustor. CFD results obtained using FLUENT for
non-reacting flow were used to qualitatively asses the impact of wall thickness on flame
stabilization. Results showed that as the wall thickness was increased a recirculation

38
zone formed at the tip of the wall which may contribute to flame holding at this location.
The CFD results are shown in Figure 2.1013.
Figure 2.10.Schematics of the cold flow field at a mean temperature of 900 K:‘BSw15u11d11’: (a)
Vm ¼ 100 cm/s, (b) Vm ¼ 300 cm/s, ‘BSw05u16d16’: (c) Vm ¼ 100 cm/s, (d) Vm ¼ 300 cm/s.13
Vijayan and Gupta15 examined the effects of scale on the heat exchanger
geometry of “Swiss-Roll” combustors burning propane/air and having heat exchangers of
different lengths. Three combustors were fabricated from zirconium phosphate my means
of standard machine tools on a CNC vertical mill. Zirconium phosphate (having thermal
conductivity of 0.8 W/m-K) was chosen in order to minimize back plane (normal) heat
losses. The combustor geometries considered are shown in Figure 2.11 along with the
heat exchanger lengths normalized by the channel width.15

39
Figure 2.11.Combustor geometries investigated for (a) Combustor A, (b) Combustor B, and (c)
Combustor C15
It is important to note that the width of the spiral channels was smaller than the
quenching distance for a propane/air premixed flame at normal state conditions. A quartz
window was used to provide optical access to the combustor. Figure 2.12 shows the
flammability regimes for combustors A, B and C, respectively.15

40
Figure 2.12. Flammability map of the combustors for (a) Combustor A, (b) Combustor B, and (c)
Combustor C. Here the Reynolds number is calculated at the inlet using inlet hydraulic diameter15
The effect on channel length on the flammability limits of the combustor is apparent
in both the lean and rich flammability limits. Combustor A (shortest channel length) was
not able to support combustion at lean equivalence ratios (and hence the lean limit is rich
of stoichiometric condition), this is because the amount of preheating is not sufficient to
overcome heat losses at the lean conditions. This was not the case with combustors B
and C which were able to support fuel lean combustion, due to the higher degrees of
preheating. Additionally, decrease in the channel length allowed for the combustion to
occur at lower inlet Reynolds numbers (which were calculated based on the inlet
hydraulic diameter). This is because the lower amounts of preheating renders lower inlet
temperatures to the combustion volume and supports flames with lower burning velocity.

41
For this reason combustors A and B were able to support flames at much lower inlet
velocity than combustor C (0.66m/s and 0.68m/s as compared to 1.78m/s, respectively).
Additionally, it was observed that the flammability regime for combustor C narrows
dramatically at low Reynolds numbers while that for combustors A, and B the
flammability regimes at low Reynolds numbers are relatively broad.
The thermal performance was evaluated by determining the exhaust enthalpy flow
rate and normalizing based on the heat load. The former is based on the measured exhaust
temperature and isobaric equilibrium combustion products and the latter is based on the
Lower Heating Value (LHV) of the fuel assuming complete consumption of the limiting
reactant. Figure 2.13 shows the enthalpy at the exit/heat load for the three combustors.15

42
Figure 2.13.Normalized output power (thermal efficiency) vs. equivalence ratio at various heat loads
(propane flow rates) for (a) Combustor A, (b) Combustor B, and (c) Combustor C15
Figure 2.13 shows that the thermal efficiencies were higher for higher heat loads at a
given equivalence ratio and in general varied between 15% and 50%.15 Considering only
the range of equivalence ratios that could support stable combustion in combustor A,
combustor A demonstrated the highest efficiencies. This is because the exhaust
temperatures are higher for combustors with shorter inlet channels since they have the
lowest outer wall surface area for available for heat loss. However, since combustor C
could support fuel lean flames the thermal efficiency is higher than that of combustors A

43
and B in the lean regime. This is because the exhaust temperature increases
monotonically in the fuel lean direction.
It is also notable that the high preheat temperatures measured in combustor C lead to
flame instabilities that do not present themselves in combustors A and B. High preheat
temperatures (>1000K) lead to pre-ignition of the mixture upstream of the combustion
volume leading to oscillation of the flame between the combustion chamber and upstream
location and significant acoustic emission.18 No such instabilities are observed in
combustors A and B due to the lower preheat temperatures (<800K and <900K,
respectively).
Maruta et. al16 studied the performance variations of Swiss-Roll combustors of
various sizes and found that the mean velocities and flammable limits of the combustor
varied based on the size and shape. However, the mean temperatures in the combustors
were similar and were dependent largely on equivalence ratio alone. Exhaust gas
analysis also showed that NOx emissions decreased with combustor size, however CO
emissions increased. The emissions of CO were mitigated by the use of catalysts as the
exhaust mixture was allowed to pass through a channel filled with ceramic balls coated
with Pt catalyst.
Section 3 The Effect of Catalyst
The large surface area to volume ratios of meso-combustors coupled with the high
heat losses lend itself to catalytic combustion, which is an area rather than volume limited
process. Additionally, the use of catalytic combustion enables the combustion of fuel at
very low temperatures (~55 oC observed minimum temperature12) and this allows for
very low level power production without waste. For example at the observed minimum

44
presented above, Ronney et. al.12 demonstrated 3W of thermal energy release with near
complete consumption of the fuel (propane), such a low heat release flame would be
difficult to achieve with gas phase combustion. Furthermore, low temperatures allow for
the use of plastics and other polymers as combustor materials from which arbitrarily
complicated geometries can be manufactured from a large variety of techniques (eg. rapid
prototyping, injection molding, and CNC machining to name a few). The effects of
catalysis on the extinction criteria of heat recirculating burners have been reported by
Ahn, Eastwood, Stizki, and Ronney19, and Lee and Kim14. Ronney et. al 19 . They all
studied the extinction criteria, temperature distributions, and exhaust gas characteristics
of a 3.5 turn square spiral counter-flow “Swiss-roll” combustor burning propane/air. The
burner was constructed by bending sheets of 0.5mm thick inconel-718 alloy into a 7cm
by 7cm by 5cm tall burner, with each inlet and exhaust channel being 3.5mm wide. For
catalysis, strips of bare Pt foil were placed along the wall of the central section of the
burner and a Kanthal wire was used as a glow plug for ignition source. Figure 2.14
shows the burner configuration with thermocouple locations 1-7 with ‘i’ and ‘e’
representing inlet and exhaust, respectively.19
Figure 2.14. Schematic of the Swiss roll burner, Platinum catalysts are placed as shown 19

45
The extinction regimes in terms of inlet Re, calculated based on the channel width
and ambient conditions, are shown in Figure 2.15 along with a comparison with gas
phase combustion of propane/air in the same combustor.19
Figure 2.15. Extinction limit map for catalytic and gas phase combustion in the inconel Swiss-roll 19
Figure 2.15 shows that both the gas phase and catalytic combustion exhibit the dual
branched behavior discussed previously, however the influence of catalysis is to increase
the fuel rich extinction limit dramatically and the fuel lean extinction limit only slightly.
Additionally, the black symbols represent catalyst that has been treated by burning the
propane/air mixture with 5% of the propane replaced by ammonia, as a reducing agent,
which is beneficial at conditions with low residence time and high heat losses (low Re).
At high Re (lean combustion) the extinction regimes for gas phase and catalytic
combustion converge, the explanation for this is that since laminar flow prevails
throughout the combustor, mass transfer to the catalyst is largely by diffusion and does
not increase with Re, so that at high Re only a small fraction of the fuel can be burned
catalytically. Thermal performance results show that at the lean extinction limit the
maximum temperatures achieved in the burner are slightly lower for catalytic combustion

46
as opposed to gas phase combustion for the same inlet conditions, indicating that the use
of catalysis is only applicable for conditions where gas phase combustion cannot be
achieved, or conditions where extremely low power output is desirable. Kim et. al.14
present work with methane and air regarding the effect of Pt wire catalysts on the
extinction limits of flat-type countercurrent combustors and arrive at largely the same
conclusions, with the application of catalyst affecting the rich extinction regime
dramatically and the lean regime only slightly. Additionally, it was found that the use of
Pt catalysts placed in an upstream channel had no effect on the extinction limits from the
viewpoint of catalysis. However, the wires did contribute positively to the net heat
recirculated to the reactants. This was verified by experiments conducted with Iron and
Copper wires placed at the same location with the same inlet conditions and yielding the
same results as Pt. It is possible however that the use of catalytic wires upstream of the
combustion volume could have a beneficial effect if the gas temperature were high
enough to achieve thermal pyrolysis of the fuel (>530 oC for methane). Although this
temperature was never achieved in the configuration presented by the authors, other
configurations readily achieve this preheat temperature, see Figure 2, and could benefit
from the placement of catalyst upstream.10
Section 4 The Effect of Material Thermal Conductivity
Since heat losses play a dominant role in the performance of meso-scale combustors
the material thermal conductivity is of critical importance in combustor design. Vijayan
and Gupta20,21 performed simulations to highlight the importance of material thermal
conductivity and determined the range of thermal conductivities over which combustion
could be supported. The results showed that heat loss from the combustion chamber was
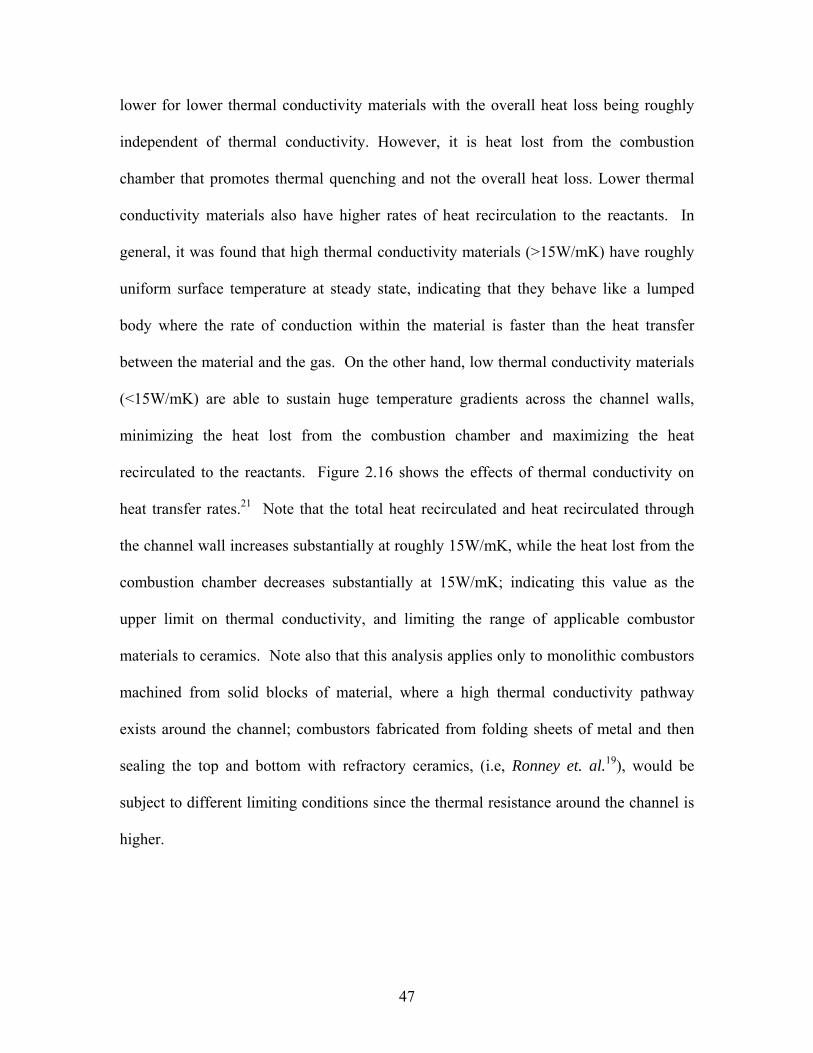
47
lower for lower thermal conductivity materials with the overall heat loss being roughly
independent of thermal conductivity. However, it is heat lost from the combustion
chamber that promotes thermal quenching and not the overall heat loss. Lower thermal
conductivity materials also have higher rates of heat recirculation to the reactants. In
general, it was found that high thermal conductivity materials (>15W/mK) have roughly
uniform surface temperature at steady state, indicating that they behave like a lumped
body where the rate of conduction within the material is faster than the heat transfer
between the material and the gas. On the other hand, low thermal conductivity materials
(<15W/mK) are able to sustain huge temperature gradients across the channel walls,
minimizing the heat lost from the combustion chamber and maximizing the heat
recirculated to the reactants. Figure 2.16 shows the effects of thermal conductivity on
heat transfer rates.21 Note that the total heat recirculated and heat recirculated through
the channel wall increases substantially at roughly 15W/mK, while the heat lost from the
combustion chamber decreases substantially at 15W/mK; indicating this value as the
upper limit on thermal conductivity, and limiting the range of applicable combustor
materials to ceramics. Note also that this analysis applies only to monolithic combustors
machined from solid blocks of material, where a high thermal conductivity pathway
exists around the channel; combustors fabricated from folding sheets of metal and then
sealing the top and bottom with refractory ceramics, (i.e, Ronney et. al.19), would be
subject to different limiting conditions since the thermal resistance around the channel is
higher.

48
Figure 2.16. Effect of thermal conductivity on heat transfer rates for a heat load of 29W (HL_cc =
rate of heat loss in the combustion chamber, HL_tot = rate of total heat loss from the combustor,
HR_CW = rate of heat recirculation to the reactants throug h the channel walls, HR_OW = rate of heat
recirculation to the reactants through the outer walls and HR_tot = total rate of heat recirculation to the
reactants).21
In order to experimentally determine the effects of thermal conductivity, Vijayan and
Gupta fabricated two combustor.21 One from Macor glass ceramic (thermal conductivity
of 1.46W/mK) and one from zirconium phosphate (thermal conductivity of 0.8W/mK).
Extinction regimes showed that the Macor combustor was able to support flames at lower
inlet Reynolds numbers, i.e, lower total mass flow rate and lower velocity, than the
Zirconium Phosphate combustor. As mentioned previously decreasing the thermal
conductivity increased the amount of reactant preheating, and higher preheat
temperatures translated into higher flame velocities in the chamber. Since the lower
thermal conductivity material delivers mixtures with higher flame velocity it was not
possible to support flames at low channel velocities. Figure 2.17 shows the extinction
regimes for the Macor and Zirconium phosphate combustors for propane and air.21

49
Figure 2.17.Extinction regimes for the Macor and Zirconium Phosphate combustors. Left: Macor
combustor Right : Zirconium Phosphate combustor.21
Kim et. al.13 experimentally tested flat-type countercurrent combustors with different
materials to examine the effects on both extinction limits and flame dynamics. When
comparing combustors fabricated from stainless steel and quartz it was found that the
quartz combustor could support flames at slightly lower chamber velocities because the
low thermal conductivity enables the temperature near the flame to remain high. The
difference in low Re behavior between the flat type and spiral combustor could be
attributed to differences in pre-heat temperature. Preheat temperatures in the spiral
combustor were between 775-1075K whereas the preheat temperatures in the flat-type
combustor were in the range of ~523-773K, which limited the effects of flame speed
enhancement on extinction.
Maruta et. al.16 studied the performance of different Swiss Roll combustor
designs under various heat transfer conditions created by applying various degrees of
insulation to a stainless-steel combustor (insulating all sides versus all but the top side)
and changing the material that seals the combustor top surface (stainless steel or quartz).
It was found that as the heat loss increased the flammable region became narrower, and
higher mean velocities were required to stabilize the flame. Higher mean velocities tend

50
to imply higher heat release rates, which would reduce the ratio of heat loss to heat
generation, although this is not explicitly stated by the authors.
Section 5 Flame Dynamics and Instability
Vijayan and Gupta22 examined the flame dynamics and instabilities in premixed
propane/air countercurrent burners through an array of diagnostic methods including
temperature, high-speed imaging, chemiluminecence, and acoustic measurements. Since
the combustion occurred in a confined space and was aerodynamically held by flow
recirculation the flames were accompanied by significant acoustic emission.
Measurements of the sound frequency distribution indicated that the natural frequencies
of the reactant and product gasses in the channel were excited by fluctuations in the heat
release, since only unsteady heat addition can excite standing waves. The correlation
between acoustic signature and combustor geometry was made by assuming the
combustor to be a square channel open on both ends with homogenous mixture
composition. The composition was assumed to be of the equilibrium combustion products
of propane/air, and a length weighted average temperature was used based on the inlet,
preheat, chamber, and exhaust temperatures and the length of channel between those
locations. These were compared to measured values of the noise accompanying the
flame with reasonable agreement. It is important to note that the transient phenomenon
in the combustion chamber were those exhibiting limit cycle behavior in the sense that
they were self sustaining once initiated and did not lead to extinction. However, they did
often lead to mechanical failure of the combustor through resonance with the combustor
material. Additionally, unstable behavior was observed at conditions where the preheat

51
temperatures were high (>1000K), the high temperature leads to repetitive pre-ignition
and quenching of the mixture in an upstream channel, leading to a pulsating flame mode.
Section 6 Summary of Fundamental Research
Experimental work in thermal performance, extinction behavior, and flame dynamics
can be summarized as follows:
Reduction in the wall thickness and in total wall conductance allows for the
combustion of weaker mixtures. However, this effect can be mediated or even
reversed through appropriate hydrodynamic stabilization. This means that the
extinction behavior is highly dependent on both the thermal and aerodynamic
characteristics of the combustion chamber
Increase in the heat exchanger length allows for the combustion of leaner
mixtures because of higher preheat temperatures but results in higher overall heat
losses, since more material is in contact with the gas. Shorter heat exchanger
lengths have higher exhaust temperatures and support combustion at lower Re,
however, could only support combustion in rich regimes
Catalysis extends the rich (low Re heat-loss-driven) extinction limit dramatically
and the lean extinction limit only slightly. Due to the lower thermal performance
of catalytic combustors compared to gas phase combustion in the same geometry
they are only applicable when gas phase combustion cannot be achieved, or when
low temperatures are required (for example when using thermoelectric elements
or polymer combustors)
Simulations showed that for monolithic Swiss-Roll combustors the maximum
thermal conductivity that can support combustion without dramatic degradation

52
of thermal performance was 15W/mK. This is due to the higher rates of reactant
preheating below 15W/mK and the lower rates of heat loss from the combustion
chamber. This limits the applicable materials to ceramics. Note that this only
applies to monolithic combustors having a high thermal conductivity pathway
around the channel
A combination of geometry and pre-heat effects lead to significant flame
acoustics and flame dynamics under the right conditions, however do not lead to
extinction. When the acoustic emissions from such flames resonate with the
natural frequency of the combustor catastrophic mechanical failure (cracking)
does occur.
Section 7 Micro-Power Generation
In order for micro and meso-scale combustion systems to become viable it is
necessary to convert the thermal output from the combustor into to useful electrical or
kinetic energy. This undoubtedly requires some downstream energy conversion scheme.
A schematic layout of the various elements of a generalized micro combustor package is
shown in Figure 2.1823.
Figure 2.18.Flow diagram of a generic micro-power generation system23

53
In the following overview devices pertaining to the use of a micro-combustor for
power or thrust generation will be discussed categorically in terms of those pertaining to
propulsion and those pertaining to electricity generation.
Micro Propulsion
Currently, micro-air and space vehicles rely largely on battery power for providing
propulsive force. However, a number of patents have recently been awarded for
propulsion devices utilizing micro-combustors. Epstein, Senturia, Waitz, Lang,
Jacobson, Ehrich, Schmidt, Ananthasuresh, Spearing, Breuer and Nagle24 patented an
invention relating to the generation of combined electrical and shaft power from a micro-
turbine and micro-combustor in a Brayton cycle type arrangement. A schematic diagram
along with a photograph of the micro-machined turbine and stator blades is shown in
Figure 2.19. The centrifugal compressor and radial turbine rotor had diameters of 8 mm
and 6 mm, respectively. The compressor discharge air wraps around the outside of the
combustor to cool the combustor walls, capturing the waste heat and thus increasing the
combustor efficiency while reducing the external package temperature. The rotor was
supported on a journal bearing on the periphery of the compressor and/or turbine and by
thrust bearings on the rotor centerline. All the components were fabricated using MEMS
manufacturing techniques and represent the state of the art in micro fabrication. This is
represent one of the major contributions of the development along with demonstration of
long term operation of a Silicon based micro-combustor burning hydrogen and air25 and
hydrocarbon mixtures and the operation of the turbine at over 1.3 million RPM’s on air
bearings26.

54
Figure 2.19.MIT micro-turbine schematic and SEM Image.26
Youngner27 patented an invention by which thrust was produced from the combustion
of solid propellants in a micro-machined enclosure and the high temperature high
pressure gas was expelled through a micro-nozzle. A schematic and photograph of the
device are shown in Figure 2.2028, below. The novel approach eliminates the need for
external propellant storage and management, namely tanks and valves. However, the
consequence was a single shot thruster incapable of reuse. Several fabrication techniques
have been used to assemble the thruster assemblies which were comprised of three
individual components and no moving parts. The top layer consists of a silicon nitride
burst diaphragm and nozzle which was fabricated by anisotropic KOH wet etching of a
silicon wafer. The second layer was the combustion chamber formed from through-holes
HF etched into FOTURAN photosensitive glass; the chambers were loaded with lead
styphnate propellant based on the required impulse bit. The bottom layer consists of a
matching array of polysilicon micro resistors which acted as igniters.28 When power was
applied to the polysilicon resistors the lead styphnate propellant was heated to its auto
ignition temperature (543°K23). The combustion increased the pressure until the burst
diaphragm ruptured and the gas was expelled through the nozzle.

55
Figure 2.20.Digital micro-thruster schematic and photograph28
The small size allowed for up to a million thrusters, which can be fired individually
or in clusters, to be fabricated on a single wafer. Each thruster was capable of a
minimum impulse bit of 10-4 N-s, using lead styphnate as propellant.28
Masel and Shannon29 developed a micro-combustor fabricated from stacked silicone
wafers utilizing catalytic ignition to initiate combustion in a long serpentine two-stage
channel. The combustor is schematically shown in Figure 2.21.29 The unique combustor
utilizes a Y shaped passive mixer at the inlet, immediately downstream is an electrically
heated Pt strip used for ignition, followed by two serpentine reaction sections. The first
reaction section is a catalytic channel that allows for the catalytic combustion of fuel and
oxygen, and the second is a gas phase combustion section where the combustor walls are
specially treated to inhibit radical quenching. Radical quenching occurs when reactive
species are removed from the reaction by the material forming the combustion chamber
walls through the process of chemisorbtion. For radical quenching to be avoided the
combustor walls must have a low well depth, which is defined as the heat of absorption
of radicals on the surfaces. The heat of absorption being further defined as the energy
required by molecules to adhere to other materials, so that as the well depth approaches

56
zero the probability of a radical being trapped decreases.29 The use of Silicon Carbide
due to its low well depth and favorable high temperature properties is unique to this
combustor. Thermal management through the use of low thermal conductivity materials
and thermal isolation cavities helps prevent overall heat loss and enables the combustor
to maintain high wall temperatures thus inhibiting thermal quenching.
Figure 2.21.Catalytic SiC micro-combustor29
In a more conventional geometry London, Ayon, Epstien, Spearing, Harrison,
Peles and Kerrebrock30 developed a micro fabricated silicon thruster designed for high
pressure combustion (chamber pressures of 125 atm.) with liquid oxygen and ethanol.
The thruster was fabricated from a six wafer silicon stack that includes fuel and oxidizer
injection orifices and cooling passages for the combustion chamber, throat, and nozzle.
The fabrication was achieved using the Deep Reactive Ion Etching (DRIE) technique
which allowed for the fabrication of high aspect ratio features with high precision.30 The
thruster has been tested with gaseous oxygen and methane using ethanol as a coolant at a
chamber pressure of 12atm and this produced thrust levels as high as 1N. The thruster is
shown in Figure 2.2230.

57
Figure 2.22.Two halves of a micro-rocket thrust chamber, the die size is 18mm x 13.5mm x 3mm.30
Wu, Wang, Yang, and Yetter31 utilized asymmetric “whirl” whereby flow
recirculation acts as a source of enthalpy and radical species to stabilize flames in
geometries close to the quenching distance. Developed as a precursor to a meso-scale
thruster the H2/Air “whirl’ combustor demonstrated relatively high C* efficiency ratios,
defined as the ratio of hot flow C* efficiency to cold flow C* efficiency, indicating high
combustion efficiency. Additionally, the lack of heat exchangers for heat transfer
between products and reactants makes for small overall geometries; however, the
combustor characteristic length was larger than the quenching distance at standard
conditions. The same geometry was also used to test the high pressure decomposition of
nitro-methane in monopropellant mode. The configuration along with flow streaklines are
shown in Figure 2.23.31 Additionally, the fabrication of meso- and micro-scale, 3-
dimensional, uni-body combustion chambers and nozzles from ceramics using
stereolithography was demonstrated.31

58
Figure 2.23.Asymmetric whirl combustor configuration with flow streaklines.31
Herrault, Crittenden, Torish, Birdsell, Glezer, and Allen32 developed a self resonant
MEMS-fabricated air-breathing engine, or valveless pulsejet where the pulsing exhaust
can be used to either generate thrust or converted into vibrational energy for electric
power generation. The combustor was fabricated from laser machined ceramic cross
sections which are laminated and sintered to form the cylindrical combustor body.
Figures 2.2432, and 2.2532 show the combustor and power generation cycle, respectively.
Figure 2.24.Valveless pulse jet assembly32

59
Figure 2.25.Valveless pulsejet cycle32
In the power generation cycle the initial charge comprised of forced air and fuel that
was ignited by spark. The high pressure combustion products then exit through both the
air inlet and resonant tailpipe. During this evacuation process the pressure in the
chamber drops to sub-atmospheric levels and fresh air was sucked into the combustion
chamber. Additionally, some of the hot exhaust products and active chemical species
were sucked up from the resonant tailpipe allowing for re-ignition providing fresh fuel is
supplied. With hydrogen and air the engine resonates in the frequency range of 0.9-
1.6kHz with pressure differentials in the chamber of up to 10kPa.
Electricity Generation
The development of electricity through micro-and mesoscale combustion represents
largely two scenarios: the first is the conversion of shaft power from microscale heat
engines into electricity via dynamo, and the second is the direct conversion of thermal
energy lost through the combustor walls into electrical energy via the Seebeck and Peltier
effects and through thermo-photo voltaic conversion (TPV).

60
Early attempts at developing microscale heat engines were focused on the
miniaturization of their existing macro-scale counterparts utilizing both the Brayton and
Otto power cycles. Fernandez-Pello33 focused on power generation using small rotary or
“Wankel” engines, chosen because the planar configuration lends itself to
microfabrication. Figure 2.26 shows both the meso-scale and micro-scale engine.33 The
mesoscale engine was fabricated from stainless steel by wire EDM and was successfully
operated with hydrogen and air with a rotor speed of 9300rmp generating 4W at the
output shaft.1 However the overall efficiency was low (~.2%) largely due to low
compression ratio arising from leakage between the rotor tip seals and the housing. The
micro-scale version was fabricated from silicon using MEMS manufacturing; the rotor
included integrated apex seals and a silicon carbide coating to add oxidation resistance,
wear resistance, and to prevent leakage. The proposed device will include an integrated
magnetic-electric generator.1 It is important to note that MEMS manufacturing
technology has enabled the integration of high temperature materials with
electromechanical hardware allowing for a wide variety of designs that would otherwise
be extremely difficult or impossible to fabricate.

61
Figure 2.26.Rotary engine prototypes under development33
Aichlmayr, Kittelson, and Zachariah34 designed a Homogenous Charge Compression
Ignition (HCCI) free piston micro-engine with a power production capability of 10W. In
HCCI engines the premixed air-fuel mixture is compressed until ignition occurs
spontaneously and as a result do not require an external ignition source. Additionally,
variations in charge composition and temperature cause ignition to occur in reaction
centers distributed throughout the combustion chamber, hence it is not subjected to the
limitations of conventional flame propagation, such as quenching distance. Power was
generated by the motion of the free piston in the magnetic field induced by the permanent
magnet generator.34 Normal Heptane (n/heptane) and air mixture at equivalence ratio of
0.69 and 0.25 were successfully ignited in the single shot HCCI engine with a stroke of
57mm.34 A schematic and photograph of the experimental engine are shown in Figure
2.27.34

62
Figure 2.27.Schematic and photograph of the HCCI free piston micro-engine.35
Dahm, Ni, Mijit, Mayor, Qiao, Benjamin, Gu, Lei, and Papke35 developed a micro
internal combustion swing engine (MICSE) for the 20W power range operating on butane
fuel. A swing engine is a rotationally oscillating free-piston engine in which combustion
occurs in four chambers separated by a single rotating swing arm, the swing arm being
virtually the only moving part. The rotational oscillatory motion was more readily
converted to electrical energy than the linear motion of a free piston.
Energy conversion without utilizing shaft work from a heat engine is generally
carried out through thermoelectric and thermo photovoltaic systems. Thermoelectric
systems consist of four major components: a micro combustor, a thermal spreader, a
thermoelectric device and a heat sink. In general the heat generated from the micro
combustor is conducted through the heat spreaders to the thermoelectric device, which is
connected to a heat sink. The thermoelectric device operates based on the Seebeck effect
where two different thermoelectric materials, with different Seebeck coefficients, are
placed in thermal contact with each other. For energy production (as opposed to
temperature measurement) the thermoelectric materials are typically p and n type
semiconductors. When subjected to a temperature gradient electrons move from the n-
type semiconductor to the cooler region, the holes in the p-type semiconductor will flow
in the direction of the current, which is used to power a load.26 Bismuth telluride
compounds, such as, Bi2Te3 and Bi2-XSbXTe3 are commonly employed n-type and p-type

63
materials, respectively. A schematic of a microcombustor-thermoelectric generator assembly
is shown in Figure 2.28.26
Figure 2.28.Typical meso-combustor thermoelectric generator lay up.26
It is important to note that although the power output from the thermoelectric
generator is proportional to the square of the temperature gradient the maximum working
temperature of the thermoelectric materials is on the order of 300 oC, limiting their
application to combustors that operate catalytically at low temperature or having
sophisticated thermal management.26
Vlachos, Wetzel, Voit, Bruggemann, Norton, and Federici36 developed a catalytic
micro combustor with integrated thermoelectric elements for portable power production.
The combustor was formed by a microchannel (300 micron width) between two catalytic
surfaces. The catalyst was formed by depositing platinum on an alumina substrate.
Alumina was chosen due to its extreme porosity, yielding 1500m2 of alumina for every
geometric meter of coverage. A thermoelectric sandwich was formed by placing a thin
aluminum nitride insulating sheet in between commercially available thermoelectric
elements. Copper heat spreaders were placed between the thermoelectric material and
the combustor in order to take heat from the reaction zone and spread it uniformly over
the device. The study focused on the effects of fuel flow rate and heat removal from the

64
cold side on power generation. As expected power generation was found to increase with
fuel-air flow rate. Forced convective cooling of the cold side of the thermoelectric device
was found to greatly increase power generation by establishing larger temperature
gradients. Maximum power generated was 0.65W at 1.1% efficiency with methanol/air.
A schematic of the facility is shown in Figure 2.29.36
Figure 2.29.Schematic view of the micro combustor and thermoelectric device36
Cohen, Ronney, Frodis, Sitzki, Melburg and Wussow37 patented a device based on a
swiss-roll countercurrent combustor that has a toroidal design formed by circularly
extruding a 2-D swiss roll combustor in order to avoid out of plane heat losses. The
thermoelectric elements were integrated into the walls of the combustor’s heat exchanger
channels. The design suggests that the complex geometry should be fabricated by
electrodeposition in layers that include the combustor body, thermoelectric materials, and
heat spreaders integrated into the walls of the combustor. The toroidal microcombustor
and combustion-based thermoelectric microgenerator are shown in Figure 2.30.37

65
Figure 2.30.Toroidal microcombustor and combustion based thermoelectric microgenerator.37
Thermophotovoltaic (TPV) systems generally operate by using the heat released from
combustion to heat a material which radiates thermal energy (the material could be either
the combustor body or some other secondary material). The radiated energy is converted
to electricity through the use of photo-voltaic cells. This means of energy generation
favors gas phase combustion because, unlike thermoelectric materials, the emitter
materials can be raised to very high temperatures without degrading.
Thermophotovoltaic cells operate in much the same way as common photovoltaic (PV)
“solar” cells in that they absorb optical energy and use it to generate and separate charge
carriers that result in the flow of current. The functional difference between TPV and PV
cells is the optical wavelength over which they are most efficient. In order for a
photovoltaic system to work the wavelength of the absorbed optical energy must be equal
to or greater than the band-gap of the TPV material, energy above and below the band-
gap will result in undesirable heating.26 In order to fully utilize the emitted radiation

66
from the combustor, selectively emitting materials and optical filters are often used to
ensure that all the photons reaching the TPV material are of the appropriate wavelength.
Selective emitters are materials that emit thermal radiation over a narrow bandwidth, the
choice of material matches this bandwidth with the band gap of the TPV cell. Selective
emitters matching the bandgap of Gallium Arsenide (GaAs) TPV cells include oxides of
Erbium, Samarium, Neodynium, and Ytterbium.38
Xue, Yang, Chou, Shu, and Li39 utilized a cylindrical microcombustor with a
backwards facing step to create heat recirculation behind the step to enhance the fuel
oxidizer mixing process. The combustor was fabricated from SiC which exhibited broad-
band emission and utilized cobalt/nickel-doped magnesium oxide as the selectively
emitting material in conjunction with Gallium Antimonide TPV cells. The combustor
demonstrated uniform wall temperatures of up to 1000K and produced electric power
ranging from 0.7-0.74 watts burning hydrogen/air.
Lee and Kwon40 utilized a cylindrical heat recirculating combustor as a micro-emitter
for a 1-10W power generating TPV system. Heat recirculation was used to achieve
stable combustion in a micro-scale environment, and provide high and uniform wall
temperatures, so that the TPV cells are subject to uniform radiation over their entire area.
Calculations show that the system could potentially deliver up to 3.6W at 3.2% efficiency
with a one percent increase in efficiency available by changing the combustor material to
SiC. A schematic of the TPV system is shown in Figure 2.31.40
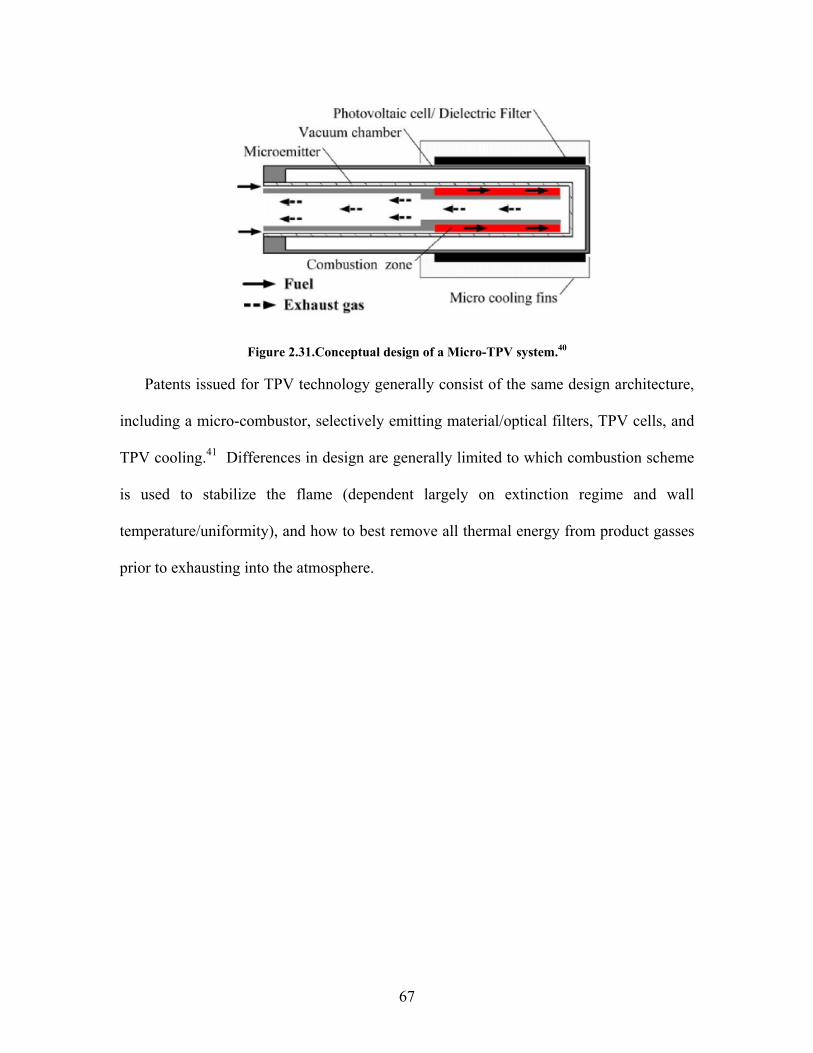
67
Figure 2.31.Conceptual design of a Micro-TPV system.40
Patents issued for TPV technology generally consist of the same design architecture,
including a micro-combustor, selectively emitting material/optical filters, TPV cells, and
TPV cooling.41 Differences in design are generally limited to which combustion scheme
is used to stabilize the flame (dependent largely on extinction regime and wall
temperature/uniformity), and how to best remove all thermal energy from product gasses
prior to exhausting into the atmosphere.

68
Section 8. References
1Jacobson, S., and Epstien A. "An Informal Survey of Power MEMS." International
Symposium on Micro-Mechanical Engineering. Tsuchiura and Tsukuba, Japan,
December 1-3, 2003.
2 Ahmed, Mahabub., “Flame Dynamics of a Mesoscale Combustor,”. PhD Dissertation,
University of Texas at El Paso. 2008.
3 Wu, M-H., Wang, Y., Yang, V., and Yetter, R. A., “Combustion in Meso-Scale Vortex
Chambers,” Proceedings of the Combustion Institute, Vol. 31, Issue 2, Jan. 2007,
pp.3235-3242.
4 Sitzki, L.,Borer, K., Schuster, E. and Ronney, P. "Combustion in Microscale Heat-
Recirculating Burners" Third Asia Pacific Conference on Combustion. Seoul, Korea,
June 24-27, 2001.
5 Sher, I., Levinson-Sher, D., and Sher, E., “Miniaturization limitations of HCCI Internal
Combustion Engines,” Applied Thermal Engineering, Vol. 29, Issues 2-3, Feb. 2009, pp.
400-411.
6 Jones, A.R., Lloyd, S.A., and Weinberg, F.J., “Combustion in Heat Exchangers,”
Proceedings of the Royal Society of London. Series A, Mathematical and Physical
Sciences, Vol. 60, 1978, pp.97-115.

69
7Vijayan, V., Gupta, A.K., “Combustion and Heat Transfer at Meso-scale with Thermal
Energy Recirculation” 6th International Energy Conversion Engineering Conference
(IECEC). Cleveland, OH. July. 28-30, 2008.
8 Cho, J-H., Chien, S. L., Richards, C., D., Richards, R. F., Ahn, J., and Ronney, P, D.,
“Demonstration of an External Combustion Micro-Heat Engine,” Proceedings of the
Combustion Institute, Vol. 32, 2009, pp.3099-3105.
9 Turns, S., An Introduction to Combustion. 2nd ed., McGraw Hill, Boston, 2006.
10 Vijayan, V., Gupta, A.K., “Experimental Investigation of a High Power Density
Ceramic Meso-scale Combustor ” 47th AIAA Aerospace Sciences Meeting including The
New Horizons Forum and Aerospace Exhibition. Orlando, FL. Jan. 5-8, 2009.
11 Vijayan, V. and Gupta, A.K., “Experimental Investigation of a Meso-scale Liquid
Fueled Combustor ” 45th AIAA/ASME/SAE/ASEE Joint Propulsion Conference and
Exhibit. Denver, CO. Aug. 2-5, 2009.
12 Oh, H., Huh, H., Ahn, J. and Ronney, Paul. “Effect of Scale on the Performance of
Heat-Recirculating Reactors”. 4th International Energy Conversion Engineering
Conference and Exhibit. San Diego, CA. June. 28-29, 2006.

70
13 Lee, M., Cho, S., Choi, B. and Kim N. “Scale and Material Effects on Flame
Characteristics in Small Heat Recirculation Combustors of a Counter-Current Channel
Type” Applied Thermal Engineering, Vol. 30, 2010, pp. 2227-2235.
14 Lee, M. and Kim N. “Experiment on the Effect of Pt-Catalyst on the Characteristics of
a Small Heat-Regenerative CH4-air Premixed Combustor” Applied Energy, Vol. 87,
2010, pp. 3409-3416.
15 Vijayan, V. and Gupta, A.K., “Effect of Channel Length on a Meso-Scale Spiral
Combustor Performance” 46th AIAA/ASME/SAE/ASEE Joint Propulsion Conference and
Exhibit. Nashville, TN. July. 25-28, 2010, Paper No. AIAA-2010-7065.
16 Kim, N., Kato, S., Kataoka, T., Yokomori, T., Maruyama, S., Fujimori, T., and Maruta,
K. “Flame Stabilization and Emission of Small Swiss-roll Combustors as Heaters”
Combustion and Flame, Vol. 141, 2005, pp.229-240.
17 Spadaccini, C.M., Zhang, X., Cadou, C. P., Miki, N., and Waitz, I. A. "Development of
a Catalytic Silicon Micro-Combustor for Hydrocarbon-Fueled Power MEMS”, MEMS
2001, Las Vegas NV, Jan 2002
18 Vijayan, V., and Gupta, A.K., “Flame Dynamics of a Meso-scale Heat Recirculating
Combustor” 7th International Energy Conversion Engineering Conference. Denver, CO.
Aug. 2-5, 2009, Paper No. AIAA 2009-4604.

71
19Ahn, J., Eastwood, C., Sitzki, L., and Ronney, P. D., “Gas Phase and Catalytic
Combustion in Heat Recirculating Burners,” Proceedings of the Combustion Institute,
Vol. 29, Issue 7, 2002, pp.957-963.
20Vijayan, V., and Gupta, A.K., “Thermal Performance of a Meso-scale Heat
Regenerating Combustor” 7th International Energy Conversion Engineering Conference.
Denver, CO. Aug. 2-5, 2009.
21 Vijayan, V., and Gupta, A.K. “Thermal Performance of a Meso-scale Liquid Fueled
Combustor” Applied Energy, 2011.
22 Vijayan, V., and Gupta, A.K. “Flame Dynamics of a Meso-scale Heat Recirculating
Combustor” Applied Energy, Vol. 87, 2010, pp.3718-3728.
23 Jejurkar, S., and Mishra, D. “A Review of Recent Patents on Micro-Combustion and
Applications” Recent Patents in Engineering, Vol. 3, 2009, pp.194-209.
24 Epstein, A.H., Senturia, S.D., Waitz, I.A., Lang, J.H., Jaconson, S.A., Ehrich, F.F.,
Schmidt, M.A., Ananthasuresh, G.K., Spearing M.S., Breuer, K.S., Nagle, S.F.: US
Patent US20026392313B1, 2002.

72
25 Mehra, A., and Waitz, I. A, “Development of a Hydrogen Combustor for a
Microfabricated Gas Turbine Engine”, Solid State Sensor and Actuator Workshop, Hilton
Head, GA, 1998.
26 Vijayan, V., “Combustion and Heat Transfer in Meso-Scale Heat Recirculating
Combustors,”. PhD Dissertation, University of Maryland at College Park, 2010.
27 Youngner, D. W.: US patent US20026378292B1 (2002).
28Lewis, David., Janson, Siegfried., Cohen, Ronald., Antonsson, Erik. “Digital
MicroPropulsion” Sensors and Actuators A, Vol. 80, 2000, pp.143-154.
29 Masel, R.I., and Shannon, M.A.: US patent US20016193501B1, 2001.
30 London, A.P., Ayon, A.A, Epstien, A.H., Spearing, S.M., Harrison, T., Peles, Y., and
Kerrebrock, J.L.. “Microfabrication of a High Pressure Bipropellant Rocket Engine”
Sensors and Actuators A, Vol. 92, 2001, pp. 351-357.
31 Yetter, R.A, Yang, V., Aksay, I.A and Dryer, F.L. Meso and Micro Scale Propulsion
Concepts for Small Spacecraft. Arlington VA. AFOSR. 2004. AFRL-SR-AR-TR-05-
0016,FA9260-01-1-0376.

73
32 Herrault, F., Crittenden, T., Yorish, S., Birdsell, E., Glezer, A., and Allen, M. G. “A
self-resonant MEMS-fabricated, Air-breathing engine” Solid-State Sensors, Actuators,
and Microsystems Workshop, Hilton Head Island, South Carolina, June 1-5 2008.
33 Fu, K., A.J. Knobloch, F.C. Martinez, D.C. Walter, C. Fernandez-Pello, A.P. Pisano, D.
Liepmann, K. Miyasaka, and K. Maruta. "Design and Experimental Results of Small-scale
Rotary Engines." Proceedings of 2001 ASME International Mechanical Engineering
Congress and Exposition. New York, NY, ASME, 41, pp. 295-302.
34Aichlmayr, H. T., Kittelson, D. B. and Zachariah, M. R. “Miniature Free-piston
Homogeneous Charge Compression Ignition Engine-compressor Concept- Part I:
Performance Estimation and Design Considerations Unique to Small Dimensions”,Chemical
Engineering Science, vol. 57, 2002, pp. 4161-4171.
35 Dahm, W. J. A., Ni, J., Mijit, K., Mayor, J. R., Qiao, G., Dyer, S. W., Benjamin, A. G. ,
Gu, Y., Lei, Y., and Papke, M.L., “Micro Internal Combustion Swing Engine (MICSE)
for Portable Power Generation Systems”. AIAA Paper 2002-0722, AIAA, Reno, NV.
2002.
36 Federici, J. A., Norton, D. G., Bruggemann, T., Voit, K. W., Wetzel, E. D., and
Vlachos, D. G. “Catalytic Microcombustors With Integrated Thermoelectric Elements for
Portable Power Production” Journal of Power Sources ,Vol.161, 2006, pp.1469–1478.

74
37 Cohen, A L., Ronney, P., Frodis, U., Sitzki, L.; Meiburg, E., and Wussow S.: US
patent 6,613,972 B2, 2003.
38Guazzoni, “High Temperature Spectral Emittance of Oxides of Erbium, Samarium,
Neodynium, and Ytterbium”, Applied Spectroscopy, Vol. 26, 1972, pp. 60-65.
39Xue, H., Yang, W. M., Chou, S. K., Shu, C. and Li, Z. W. “Microthermophotovoltaics
power system for portable mems devices”, Microscale Thermophysical Engineering, 9
2005, pp.85-97
40 Lee, K. H., and Kwon, O. C. “Studies on a Heat-recirculating Microemitter for a Micro
thermophotovoltaic System”. Combustion & Flame, 153, 2008, pp. 161-172
41Nelson, R.: US patent 4,584,426, 1986.

75
Chapter 3: Experimental Facilities and Procedures
Section 1 Combustors
Combustor Geometries
A number of combustor geometries and configurations were used during the
course of the experimental program, some geometrical modifications were made to
alleviate functional problems that arose during experimentation, and others were made in
order to parametrically study the effects of geometry on performance. The different
geometries used will be discussed below. The baseline combustor is a 2.5 turn design
adopted from the work of Vijayan and Gupta1 the channel cross section is 0.0625 in. x
0.11811 in. and the combustor was initially fabricated from Zirconium phosphate. This
material was chosen because of it low thermal conductivity (0.8W/mK) and its resistance
to thermal shock. Initially the liquid fuel was introduced partially premixed; the fuel was
injected through a porous heat recuperator placed 0.75 turns upstream of the combustor
volume. The heat recuperator was used because fuel evaporation and mixing times can be
significant when compared to the gaseous premixed residence time, because liquid
evaporation and mixing at low Reynolds numbers is generally poor. Space constraints
related to feeding ignition wires, plumbing, and diagnostics through the back of the
combustor dictate the exact location of the porous fuel injector. Compressed double aught
steel wool was used as the recuperating material. Figure 3.1, below shows the combustor
with heat recuperator. The exact dimensions of the combustor can be found in the
appendix.

76
Figure 3.1. 2.5 Turn zirconium Phosphate Heat Recirculating Combustor
Subsequent combustors were shortened in size from 2.5 turns to 1.0 turn while
maintaining the same channel cross section and combustion chamber geometry. This was
done because increasing the heat exchanger length leads to higher reactant temperatures,
the ability to support lean flames, and broader stability regimes. However, large heat
exchanger lengths naturally translate to higher surface areas for heat loss, leading to
lower exhaust enthalpy. Additionally, shortening the heat exchanger length lowers the
preheat temperature and as a consequence the flame velocity, enabling the combustor to
operate at low heat loads (low thrust). Hence the change in geometry is driven entirely
by application, for propulsion the channel length is minimized to maximize the exhaust
enthalpy, however for power generation a long channel length is preferable since heat
loss through the walls is the mechanism by which power is generated (for example in
TPV and TE systems). This change in combustor geometry also came with a change in
material. Alumina Silicate was used in favor of Zirconium Phosphate; this was done

77
because alumina silicate is substantially less porous than zirconium phosphate, this
prevents the material from absorbing liquid fuels that are injected into the combustor.
The downside of the lower porosity is higher thermal conductivity; alumina silicate has a
thermal conductivity of roughly 1.98W/mK relative to 0.8W/mK for zirconium
phosphate. The single turn combustor is shown in Figure 3.2, below.
Figure 3.2. Single Turn Combustor. The non-premixed configuration is shown, two mixing strategies were examined.
Iterations on the single turn geometry were made to study the effect of channel
geometry on the extinction limits of the combustor. Three variations were fabricated; the
channel aspect ratios (width/depth) were varied from 0.5 to 0.3 in increments of 0.1 with
constant hydraulic diameter. The hydraulic diameter was kept constant so that the cold
flow Reynolds numbers would be constant between combustor for the same inlet
conditions. Note that since the whole combustor is at constant depth changing the depth
of the channel changes the depth of the combustion chamber as well, and hence a
combustor with lower aspect ratio channels has a combustion chamber with larger
volume.
Typically, in a bi-propellant hydrogen peroxide thruster, hydrogen peroxide is
decomposed in a gas generator using an appropriate catalyst into superheated steam and

78
oxygen. This happens upstream of the combustion chamber. The global decomposition
reaction proceeds according to Equation 3.1.
2222 22 OOHOH Eq. 3.1 The decomposition products are passed to the combustion chamber and burnt with fuel.
For the experimental combustor the superheated steam/oxygen mixture is generated using
a lean burning hydrogen oxygen flame (Φ=0.5) upstream of the combustor, the
stoichiometry of which is shown in Equation 3.2. This was done in order to study the
flame dynamics of the experimental combustor while decoupling it from the complexity
of developing a meso-scale hydrogen peroxide gas generator.
2222 222 OOHOH Eq. 3.2
For fabrication simplicity the hydrogen oxygen burner and heat recirculating
combustor are fabricated into a single unit, with the exhaust from the hydrogen oxygen
burner ported into the inlet channel of the heat recirculating combustor. Since the heat
release rate from a hydrogen-oxygen flame is larger than the heat release rate from
hydrogen peroxide decomposition, a thermal isolation cavity is machined in between the
steam generator and the heat recirculating combustor. Note that due to the large heat
release intimate thermal contact between the hydrogen/oxygen burner and the heat
recirculating combustor could unduly influence the results.
Because the product gas temperature of a hydrogen/oxygen flame can easily
surpass the adiabatic decomposition temperature of hydrogen peroxide, the experimental
conditions that can be realistically tested are limited to those where the steam/oxygen
temperature is less than or equal to the hydrogen peroxide adiabatic decomposition

79
temperature. Hence there is an upper limit on the amount of H2/O2 that can be burnt
before the temperature limit is reached. All the experimental results presented are below
this limit. The combustor/steam generator system was calibrated with the steam
generator only in order to determine this limit.
As mentioned previously, the combustor was fabricated from alumina-silicate.
Initial experiments were conducted with the combustor material in its green state.
However, stresses possibly arising from differential thermal expansion of the material
and its housing led to cracking at high heat loads, thus limiting the regime over which the
combustor could operate. A heat treatment of 45 minutes at 1050°C with a ramp rate of
2°C per minute was used to increase both the hardness and strength of the material with
promising results. Additionally, the steam generator was lined with a refractory zirconia
blanket to protect the alumina silicate from the hydrogen/oxygen flame, the blanket was
both rigidized and surface hardened to prevent deterioration. Figure 3.3 shows the
combustor/steam generator used in the experiments.
Figure 3.3. Combustor/Steam Generator

80
A second fuel injection configuration was tested whereby fuel is injected through
an alumina/zirconia porous ceramic heat recuperator placed directly in the combustion
chamber, wherein the recuperator receives heat directly from the flame. This
configuration was chosen based on a combination of empirical experience and numerical
simluations. The exact location was selected such that the interplay between the
aerodynamics of the combustion volume and the injected fuel lead to both rapid mixing
and flame stabilization. Aerodynamic flame holding is achieved via a step entrance to
the combustion chamber, which provides a vortical flow structure and a local
recirculation zone, thus recirculating both heat and active species from the products to the
reactants. The fuel is injected into the center of the vortex. Figure 3.4 shows the fuel and
oxidizer injection configuration indicating the steam/oxygen inlets, the combustion zone,
and the fuel injection location. Additionally, flow pathlines through the combustion
chamber are shown to illustrate the flow structure in the chamber and the direction of fuel
injection relative to the vortical flow structure in the chamber.
Figure 3.4. Non-premixed combustor
In order to pressurize the thrust chamber a converging nozzle was fabricated into
the exhaust. The relative geometry of the nozzle is shown in Figure 3.5, below, along
with pressure tap and thermocouple locations. The nozzle has a rectangular cross section

81
and three sides of the nozzle are converged in two stages. The initial convergence begins
at the hatched region of Figure 3.5, just downstream of the chamber pressure tap. In this
region the depth of the channel is reduced by 58%. This was done for fabrication reasons
since fabricating the throat section of the nozzle at full channel depth on a CNC would
require a long slender tool that would lack the rigidity to make an accurate cut. In the
second converging stage the channel width is reduced 75% from the full channel width to
the throat width. This leads to a nozzle contraction ratio 9.52, the contraction ratio being
defined as the ratio of the inlet area of the nozzle to the throat area of the nozzle.
Figure 3.5. Combustor with Nozzle
In order to determine discharge characteristics the throat area was determined by
flowing high flow rates of oxygen through the thrust chamber and measuring the chamber
pressure and mass flow rate discharged through the nozzle. This calibration was
performed at high Re so that the discharge coefficient can be assumed to be 1.0. The
throat area was then calculated based on the measured pressure ratio and flow rate. This
was done for two reasons. First, as mentioned previously, the thrust chamber is machined
in its green state and then heat treated to increase its strength and temperature resistance.

82
However, the heat treatment also results in an ~2% dilation in the material volume, which
causes channel widths to decrease from the as-machined state. Additionally, the thrust
chamber is fabricated from a porous ceramic material, as such all plumbing is bonded and
sealed to the back of the combustor using refractory alumina bonding and sealing cement.
Since the cement is composed of fine particles it has some porosity which limits its
capacity to seal against pressure. Since multiple thrust chambers are used during the
course of an experimental program, each one is calibrated for effective throat area prior
to data analysis.
For steady state performance the hot steam and oxygen mixture is allowed to
come to thermal equilibrium in the thrust chamber prior to introducing the fuel, hence the
heat recuperator is hot and readily vaporizes the fuel. However, this situation does not
arise when pulsing from a cold start. In order to provide the initial heat necessary to
vaporize the fuel a miniature resistive heating element is fabricated into the porous heat
recuperator, the element consumes 6W and brings the recuperator to roughly 160°C.
Figure 3.6 shows the combustor with resistive heating element installed along with a
thermocouple for measuring the recuperator temperature.
Figure 3.6.Combustor with heating element and thermocouple fabricated into the heat recuperator
1.5mm
Resistive Heating Element
Thermocouple

83
Note that the exact dimensions of the combustors along with the NC codes used to
machine them are provided in the appendix.
Ignition
In all of the presented experimental results ignition is achieved via spark.
Achieving successful spark ignition in a meso-scale chamber is complicated both by the
underlying physics of heat recirculating combustors and the engineering challenges that
come with providing high voltage in confined spaces while avoiding undesired arcing.
With regard to the former, since a high preheat temperature is required to stabilize the
flame the ignition source must remain on until the flame heats both the incoming
reactants and the combustor walls enough to stabilize itself. During this process the
flame is in a periodic cycle of ignition and extinction where the spark acts as the excess
enthalpy source required for stabilization. If the spark frequency is too low then the
thermal energy added during an ignition event to both the walls of the combustor and the
reactants will be lost during an extinction event before the arrival of the next spark, and
in this scenario the flame could never stabilize.
A purpose built igniter was developed based on an Echlin E6-B 6Volt automotive
ignition coil. The coil was driven via a square wave generator that provided short square
pulses with both variable frequency and duty cycle, in order to tailor the spark frequency
required to stabilize the flame at the required the inlet total mass flow rate and
equivalence ratio. Because the ignition coil discharges the spark when the circuit
providing power to the coil is opened, the width of the pulse or “high time” is not as
significant as the pulse frequency, since the spark occurs only on the falling edge of the
pulse. Note that because the square wave generator cannot provide the power required to

84
drive the ignition coil the generator was used to drive a relay, the relay rapidly connected
and disconnected the ignition coil ground to provide the spark. Power to the coil and
pulse generator was provided via a 400 Watt modified ATX power supply. Power for
other facility equipment was provided largely from the same unit. The circuit diagram
for the ignition system is shown in Figure 3.7. Element values are shown in Table 3.1.
Figure 3.7. Ignition circuit the values used for the circuit elements are shown in the accompanying table. The circuit is based on the a-stable 555 timer oscillator.
Table 3.1 Ignition Circuit Element Values
Element Name Value
R1 1kΩ
R2 0-10 kΩC1 .1μF
Rectifying Diode 1N4001
Signal Diode 1N4148
Fabrication
The methodology for feeding ignition lines into the combustor has evolved as a
consequence of both experimental and fabrication experience. Initially bare Kanthal
resistance wires (1/64 in. diameter) were fed through the back of the combustor, the feed-
throughs being sealed with refractory alumina cement. An air gap was maintained
between the alumina seals for each of the Kanthal wires in-order to provide sufficiency
electrical insulation. A sketch of this configuration is shown in Figure 3.8, below.

85
Figure 3.8. Combustor with Kanthal wire igniters
During experimentation it was found that the Kanthal wires suffer substantial
corrosion as a result of exposure to the flame. This corrosion products lead to changes in
the geometry of the wire and deterioration of the wire performance. In order to extend the
life of the ignition electrodes and provide a combustion volume that is free from
protrusions (note that the Kanthal wires although 1/64in. in diameter are nearly 25% of
the width of the combustor) flush mounted silicon carbide ignition electrodes were
integrated into the combustor body. The combustor with electrodes is shown in Figure
3.9.
Figure 3.9. Silicon carbide ignition electrodes
Silicon Carbide Electrodes

86
The electrodes were connected to custom machined brass banana-jack terminals
via copper wires fed through the sides of the combustor. The terminals were mounted at
the sides of the combustor in order to provide maximum separation and avoid undesired
arcing. A sketch of the combustor with both igniters and side mounted ignition terminals
is shown in Figure 3.10.
Figure 3.10. Combustor with silicon carbide igniters
Section 2 Flow Control
Steady State Measurement of Extinction and Thermal Performance
The experimental facility was designed to provide the necessary controls and
diagnostics for determining stability regimes and thermal performance of the combustor,
in addition to measuring the chamber total pressure, chamber dynamic pressure, and
pressure and temperature startup transients. Omega FMA 5500 Thermal conductivity
mass flow controllers were used to control the flow rates of hydrogen and oxygen. The
accuracy of each flow controller is ±1.5% of full scale, a number of controllers were used
during the course of the experiment to minimize the experimental errors. The maximum

87
error was 7.5mL/min and the maximum error in flow rate is 75mL/min. A Harvard
Apparatus PHD2000 infusion syringe pump was used to control the methanol and
kerosene fuel flow rates. A K-Type thermocouple (Nickel-chromium vs. Nickel-
Aluminum) was used to measure the temperature of the product gas just prior to entering
the throat section of the nozzle. A National Instruments NI9211 cold junction
compensated thermocouple data acquisition module recorded the temperature through a
personal computer at a sample rate of 4Hz with an accuracy of 2.2°C. The
thermocouples were unsheathed and the exposed beads yield a blockage ratio of
approximately 2.8%; careful installation insured that the thermocouple beads did not
make any contact with the combustor material. Chamber pressure was measured using a
SETRA model 204 digital pressure transducer with an accuracy of 0.11% of full scale,
the measurements were acquired through a data acquisition module sampling at 100Hz
and recorded through a personal computer. Dynamic pressure was measured using an
excited piezoelectric dynamic pressure sensor with a sensitivity of 50mV/psi, the data
was acquired through a data acquisition module sampling at 2000Hz and recorded on a
personal computer. A schematic diagram of the steady state facility is shown in Figure
3.11, below.
The experimental error has been determined based on the above values. Results
provided without error bars are provided as such because the experimental error is too
small to be interpretable in the figure (i.e in temperature measurements where the fixed
2.2°C is small compared to measured temperatures which may by on the order of
1000°C).

88
Electric Flow LineFlow Line
H2
O2
Pressure Regulator
Needle Valve
Flow Controller
Control Circuit
Steam Chamber
H2/O2 Inlet
Oxidizer Inlet Channel
Thermocouple, Pressure, and Dynamic Pressure Acquisition
Syringe Pump
To PC
Electric Flow LineFlow Line
H2
O2
Pressure Regulator
Needle Valve
Flow Controller
Control Circuit
Steam Chamber
H2/O2 Inlet
Oxidizer Inlet Channel
Thermocouple, Pressure, and Dynamic Pressure Acquisition
Syringe Pump
To PC
Figure 3.11. Schematic of the experimental facility
Pulsing
A pulsing and thrust measurement facility was fabricated to allow for pulsing of
the thruster at high pressure ratios and rapid response times. Fuel was provided via a
pressure fed fuel tank with regulated tank pressure. Oxidizer was provided via high
pressure industrial oxygen cylinder. Oxidizer and fuel delivery to the combustor was
controlled via miniature solenoid valves placed upstream of the combustor. Clippard EV-
2-06 and E210A-1W012 miniature solenoid valves were used because of their low power
consumption and voltage requirements along with high pressure tolerance. Custom valve
manifolds were fabricated from free machining brass for the E210A-1W012 valves. The
facility measures the chamber pressure, differential pressure across the valve, the trigger
pulses, and the thrust. The data is acquired through National Instruments NI USB 6008
and NI USB 9215 high speed data acquisition cards sampling at 100Hz. The pulsing
facility is shown in Figure 3.12, below; the facility is mounted to a sled carrying the
valves, thruster, and valve electronics. A Light Emitting Diode (LED) is wired into the

89
power line for the fuel valve and acts as a synchronization lamp for the high-speed
camera.
Figure 3.12.Pulsing facility including valves, valve electronics, and thruster
Meso-Thruster
Low Power Heating Element
Fuel and Oxidizer Valves
Valve Manifold
Pulse Generation/Valve Controller
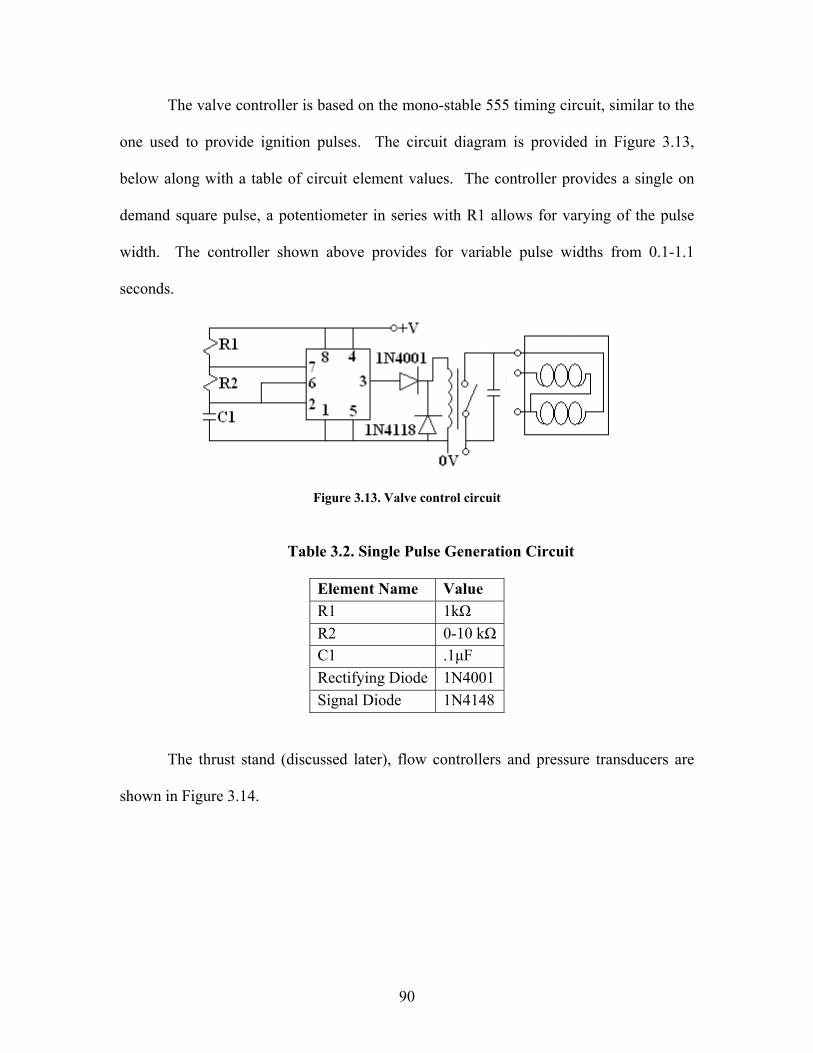
90
The valve controller is based on the mono-stable 555 timing circuit, similar to the
one used to provide ignition pulses. The circuit diagram is provided in Figure 3.13,
below along with a table of circuit element values. The controller provides a single on
demand square pulse, a potentiometer in series with R1 allows for varying of the pulse
width. The controller shown above provides for variable pulse widths from 0.1-1.1
seconds.
Figure 3.13. Valve control circuit
Table 3.2. Single Pulse Generation Circuit
Element Name Value
R1 1kΩ
R2 0-10 kΩC1 .1μF
Rectifying Diode 1N4001
Signal Diode 1N4148
The thrust stand (discussed later), flow controllers and pressure transducers are
shown in Figure 3.14.

91
Figure 3.14. Relative locations of the mass flow controllers, pressure transducers, and thrust stand used in pulsing experiments
Since the maximum pulse width used was 1.1 seconds the flow rate delivered by
the system during that pulse could not be measured in real time because the response
times of the mass flow controllers is too slow. In order to estimate the global equivalence
ratio and the total amount of mass consumed during the pulse the flow rate of fuel was
calibrated a priori. The fuel flow rate was determined by discharging the fuel for one
second at a particular pressure ratio into a catch tank, the mass of fuel discharged into the
catch tank was measured on a scale and it is assumed that the fuel was discharged at a
constant flow rate for the width of the one second pulse. Figure 3.15 shows a sample
calibration curve for methanol.
Thrust stand impulse plate Calibration Pulley System Non-Contact Inductive Displacement Sensor
Flow Controllers
Pressure Transducers

92
y = ‐0.0004x2 + 0.0025x ‐ 0.0019R² = 0.9985
0
0.0005
0.001
0.0015
0.002
0.0025
0.003
1 1.5 2 2.5 3 3.5
Flo
w R
ate
Kg/
sec
Pr
Figure 3.15. Calibration curve for methanol in terms of total mass flow rate versus pressure ratio (upstream/chamber)
The oxygen flow rate was determined in a similar fashion whereby the value set
by the thermal mass flow controller was correlated to the pressure drop across the oxygen
injection apparatus. The calibration curve for oxygen is shown in Figure 3.16, below.
y = -0.0027x2 + 0.0044x - 0.0018
R2 = 0.9974
0
0.00001
0.00002
0.00003
0.00004
0.00005
0.00006
0.00007
0.00008
0.00009
0.86 0.88 0.9 0.92 0.94 0.96 0.98 1
Pressure Ratio
Oxy
gen
Flo
w R
ate
[Kg/
sec]
Figure 3.16. Oxygen flow rate versus pressure ratio across the injector

93
Additionally, preliminary experiments injected the fuel directly into the porous
heat recuperator using a 1/16in. OD tube with 1/32” ID. This provided for flow rates that
were substantially larger than what the combustor could tolerate, ultimately leading to
flooding. A small micro-orifice fuel injector was developed prevent combustor flooding.
The fuel injector is shown in Figure 3.17, below. The diameter of the orifice is .003 in.
Figure 3.17. Fuel injector
Section 3 Optical Diagnostics
High Speed Video
High speed vide was used extensively to evaluate the presence of instabilities and
study the evolutionary nature of the flame during a thrust pulse. An IDT Red-Lake Y4M
high speed black and white video camera with a maximum frame rate or 4000fps was
used in the experiments. For steady state experiments the high speed video was used to

94
track the flame dynamics and instability behavior. Each frame was analyzed using
MatLab by tacking certain pixels or regions of interest and tabulating the intensity values
for those regions versus time. Post processing techniques such as the Fast Fourier
Transform were used to analyze the results. A copy of the MatLab code used to acquire
the data is provided in the Appendix. For pulsing experiments the high speed camera was
synchronized to the data acquisition module via a synchronization lamp wired into the
fuel valve power line. The lamp was on upon initiation of the valve trigger. The video
data was used to determine the chamber L* along with the ignition delay times versus
chamber conditions. The images of the plume along with its phenomenology were also
acquired using the high speed video, however no post-processing of the data was
performed.
Section 4 Thrust Measurement
Impulse Balance Thrust Stand
In order to determine the overall performance of the thrust chamber a mN level
thrust stand has been developed based on the indirect measurement principle, whereby
the impulse of the exhaust jet on a plate placed downstream of the jet is measured. The
control volume for the thruster-impulse plate system is shown in Figure 3.19, below. 2
This measurement technique has been used by a number of researchers 2,3 for determining
the thrust from micro-thrusters, and is used in systems where allowing the thruster to
translate is inconvenient because the thrust levels produced are too small to overcome the
stiffness of propellant lines and diagnostics fed to the thruster. The basic principle can be
expressed by applying the conservation of momentum theorem to the control volume
shown in Figure 3.19 2.

95
Figure 3.19. Control volume for indirect thrust measurement [adapted from Wu et al., Ref. 2]
In Figure 3.19 the boundaries of the control volume are placed far enough from
the thruster and thrust plate that the pressure at the boundary equals the environmental
pressure and the inlet mass flow is entering orthogonal to the direction of the thrust force.
In this scenario the force experienced by the force transducer attached to the plate, F, is
equal to the reaction force exerted by the sting on the thruster ,T’. Detailed analysis of
the aerodynamics of indirect thrust measurement show that this simplified scenario is
accurate as long as the thrust plate is large enough that the exhaust gases leave the control
volume perpendicular to the thrust force and the plate is far enough away from the
thruster exit plane that the impinging exhaust gasses do not interfere with the jet. 2
The thrust stand is comprised of a cantilevered brass beam with a cross section of
4in. x 0.01in. and a length of 7.0 in. supported at the root by a heavy base clamp. Note
that the thrust stand total plate area is 17,920 times larger than the exit plane area of the
thruster. The thrust force is related to the displacement of the beam through calibration.
The calibration is performed by suspending weights from a pulley mounted to a fixture
above the thrust stand, the tension in the line in coincident with the thrust force. The
displacement is measured close to the root via an inductive non-contact displacement

96
sensor. As mentioned previously calibration was performed by applying a load coincident
with the thrust force through calibration pulley and dead weights. The relative locations
of the thrust stand, displacement sensor, and calibration pulley are shown in Figure 3.20.
In the Figure a calibration jet is positioned below the thrust stand.
Figure 3.20. Thrust stand with calibration jet indicating the locations of the impulse plate, calibration system, and non-contact displacement sensor
Potential sources of errors associated with the measurement technique are
discussed below. Note that these are in addition to those intrinsic to the sensor used to
measure either the force on the plate or its displacement.
i. Loss of momentum due to the flow leaving the control volume with
residual momentum in the direction of the thrust vector.
ii. Interaction between the exhaust plume and the flow impinging on the
plate.
iii. Because the thrust stand is cantilevered, force added to the tip causes a
change in the angle of the plate relative to the jet exit plane. This can
Thrust stand impulse plate Calibration Pulley System Non-Contact Inductive Displacement Sensor

97
cause potential errors due in part to both axial momentum loss and a
decrease in the thrust force due to the component of the shear force on
the plate in the direction of the thrust vector. There effects are
described schematically in Figure 3.21, below
Figure 3.21. Potential sources of error due to the use of a cantilevered beam; the schematic on the right shows the ideal impulse plate force balance, whereas the schematic on the right shows the cantilevered force balance
Experimental analysis has been performed to address these issues and answer the
following related questions;
i. How large should the plate be relative to the jet to accurately capture the
thrust?
ii. How far from the plate should the jet exit plane be to accurately capture
the thrust?
iii. Is deflection angle a concern, and if so what deflection angle is tolerable?
The issue of momentum loss due to flow leaving the control volume in a direction
not orthogonal to the thrust vector was not addressed experimentally as this would
involve the fabrication of a number of thrust stands of varying size. Alternately the plate
FPlate FPlate
Thrust Thrust
Shear and component of shear in the direction of the thrust

98
area was sized substantially larger than the jet exit area (17920 times larger) to avoid this
problem.
Experiments were performed to determine the appropriate separation distance
between the thruster and thrust stand. A facility was developed utilizing a moving
calibration jet to simultaneously measure the distance between the thrust stand and the jet
exit plane and the thrust. The facility is shown in Figure 3.22, below.
Figure 3.22. Calibration jet (#55), position indicating potentiometer, and thrust stand
The calibration jet [diameter = .0445in. (#55)] is mounted on a carriage and rail
assembly and held in place by a set screw. A linear taper potentiometer is attached to the
top of the rail and attached to a lug on the back of the carriage via pulley and thread; as
the carriage moves the output is from the potentiometer changes, forming an ad-hoc
traversing mechanism. In order to acquire the data the thrust stand is zeroed, and the
calibration jet is brought as close to the thrust stand as possible. Flow through the
Potentiometer and thread Calibration Jet

99
calibration jet is started and the carriage set screw is released, as the carriage falls away
from the thrust stand the potentiometer resistance changes and the displacement is
calculated via Equation 3.3.
oof
of
of
of VVV
DDV
VV
DDy
Eq. 3.3
Figures 3.23, 3.24, and 3.25 show the results of the separation distance experiments at
supple pressures of 60psig, 80psig, and 100psig. The pressures correspond to volumetric
flow rates of 6.40SCFH, 8.12SCFH, and 9.81SCFH as determined via calibrated orifice
(diameter=.010in.).
0
0.2
0.4
0.6
0.8
1
1.2
1.4
0
0.5
1
1.5
2
2.5
3
3.5
4
4.5
5
0 10 20 30 40 50 60
Displacement ‐in
Thrust ‐mN
Time ‐s
Thrust
Distance from plate
100 per. Mov. Avg. (Thrust)
Figure 3.23. Thrust versus distance at 6.40SCFH oxygen flow rate. The green line represents the displacement whereas the black line represents a moving average of the thrust taken in 100 sample increments (at the sampling frequency). The red markers are the raw data, the spread in the raw data is due to zero mean random noise which has been shown, via FFT, to have no discrete frequency components.

100
0
0.2
0.4
0.6
0.8
1
1.2
1.4
0
1
2
3
4
5
6
12 17 22 27 32 37 42
Displacemen
t‐in
Thrust‐m
N
Time
Thrust
Displacement
100 per. Mov. Avg.(Thrust)
Figure 3.24. Thrust versus distance at 8.12SCFH oxygen flow rate. The green line represents the displacement whereas the black line represents a moving average of the thrust taken in 100 sample increments (at the sampling frequency). The red markers are the raw data, the spread in the raw data is due to zero mean random noise which has been shown, via FFT, to have no discrete frequency components.
0
0.2
0.4
0.6
0.8
1
1.2
1.4
0
1
2
3
4
5
6
7
8
9
0 10 20 30 40 50 60
Displacement‐in
Thrust‐m
N
Time‐s
Thrust
oxpulse
100 per. Mov. Avg.
(Thrust)
Figure 3.25. Thrust versus distance at 8.12SCFH oxygen flow rate. The green line represents the displacement whereas the black line represents a moving average of the thrust taken in 100 sample increments (at the sampling frequency). The red markers are the raw data, the spread in the raw

101
data is due to zero mean random noise which has been shown, via FFT, to have no discrete frequency components.
In Figures 3.23, 3.24, and 3.25 the right hand side ‘y’ axis represents the
displacement from the plate in inches. The zero displacement level, where the calibration
jet is almost touching the thrust stand, corresponds to the minimum thrust level on the
left. As the jet is moved away from the thrust stand the thrust increases, and above a
certain distance no measurable increase in thrust can be observed. For the three examples
shown above this distance is approximately .9in away from the thrust stand, however
90% of the mean thrust us realized once the calibration jet has cleared .4in from the thrust
stand or approximately 10 jet diameters. The measured thrust decreases sharply below
this point.
In order to determine the effect of plate angle on the measured thrust an
experiment was conceived whereby the plate would be displaced by a measured pre-load.
Digital images were used to determine the tip deflection angle. The images and
corresponding beam deflection angles are shown in Figure 3.26, below.

102
The preload was not used to calculate the angle based on beam bending theory
because the beam deflects under its own weight, and a certain amount of preload is
required to maintain a level surface. Once the deflection angle has been established and
the beam has stabilized the calibration jet is used to apply a force of fixed flow rate
(9.81SCFM or 7.48mN as calculated from continuity) and the output from the
displacement sensor recorded. The variation in displacement in response to the jet as a
function of the beam deflection angle is shown in Figure 3.27, below.
Figure 3.26. Four measurements of beam deflection by a pre load to a specific angle. The lines used to calculate the angular deflection and the deflection angles are shown in the figure.
~0 Deg 1 Deg
3 Deg 6.5 Deg

103
0
1
2
3
4
5
6
7
8
0 1 2 3 4 5 6 7
Thrust‐m
N
Deflection angle‐Deg
Figure 3.27. Deflection angle versus measured thrust for a 9.81SCFM calibration jet; note that the measured thrust decays rapidly with any increase in deflection angle, and tends to level off at large (~7 Deg.) deflection angles.
The results shown in Figure 3.27 indicate that even small deflections in the beam
angle can result in significant variation in the thrust measurement. As second experiment
was conducted to determine the effect of beam deflection angle on a variable thrust force
and determine a correction factor that relates the measured thrust and the actual thrust.
Figure 3.28 shows the variation in thrust calculated at the exit plane of the
calibration jet (shown in Figure 3.27) based on continuity versus the thrust force
measured at the thrust stand. Additionally the ratio of the measured thrust to actual thrust
is also shown (T/T0).
Mean thrust based on continuity is 7.48mN

104
0
0.1
0.2
0.3
0.4
0.5
0.6
0.7
0.8
0.9
0
50
100
150
200
250
300
350
0 50 100 150 200 250 300
T/T0
Calculated Calibration Thrust [mN]
Measure Thrust [mN]
Figure 3.28. Variation in thrust calculated at the exit plane of the thruster versus the measured thrust along with the ratio of the measured thrust to the calibration thrust Figure 3.28 shows that the effect of deflection angle is dramatic at low to
moderate thrust levels however the T/T0 ratio grows as the thrust force increases. This
can be seen in Figure 3.27 as well where the measured thrust decreases sharply with
deflection angle up to a deflection angle of ~2.5° at which point any increase in the
deflection angle produces a negligible change in the error. Since a wide variety of beams
are available in the 4in. width required for the thrust stand assembly in the course of
experimentation beam bending theory was used to determine the beam thickness required
that would result in the minimum displacement for the expected thrust level.
Additional sources of error may arise from the following sources (non-inclusive):
twisting of the beam due to a non-centered application of the load and effects of the beam
surface not being parallel with the sensor plane. Both of these effects can be minimized
by careful experimentation and calibration, respectively.
The composite result of seven calibrations from 0-100mN is shown in Figure
3.29; the results are presented in terms of voltage output from the sensor along with the
theoretical results for beam displacement versus load. The composite result shows a
2.5° Deflection

105
linear relationship between the applied load and the voltage output from the displacement
sensor which is consistent with both the linear response of the sensor, and the linear
relationship between load and displacement provided by beam bending theory. Note that
in measuring the thrust the thrust stand is recalibrated immediately prior to each
experiment and the calibration obtained is used to determine the thrust.
Figure 3.29. Composite calibration curves for the cantilever beam versus both voltage and displacement Figure 3.30 shows the calibration curve extended to 366mN, above ~100mN the
calibration is no longer linear and a quadratic fit is used to obtain the thrust
measurements. Measurements at high loads (large beam displacements) are more prone
to error due to inclination angles between the thrust stand and sensor face, and the thrust
stand and nozzle exit plane as discussed above.

106
y = 13.472x2 + 84.998x + 4.9254R² = 0.9981
050
100150200250300350400
0 0.5 1 1.5 2 2.5 3 3.5 4
mN
Voltage
Figure 3.30. Calibration curve extended to 366mN, note that above 100mN the calibration is non-linear. The quadratic curve fit to the calibration data is shown as well
The sensitivity of the thrust stand was measured by incrementally increasing the
load until the output from the sensor could be differentiated from the noise; the sensitivity
was determined to be 1.2mN. A histogram of the output voltage measured at the step
calibration load (3mN) over 300 measurements was used to determine the precision error
in the measurement, the mean and standard deviation (scaled by the calibration curve)
was found to be 3.006mN and .1026mN respectively. Figure 3.31 shows both the
sensitivity and precision error measurements.
1.2mN
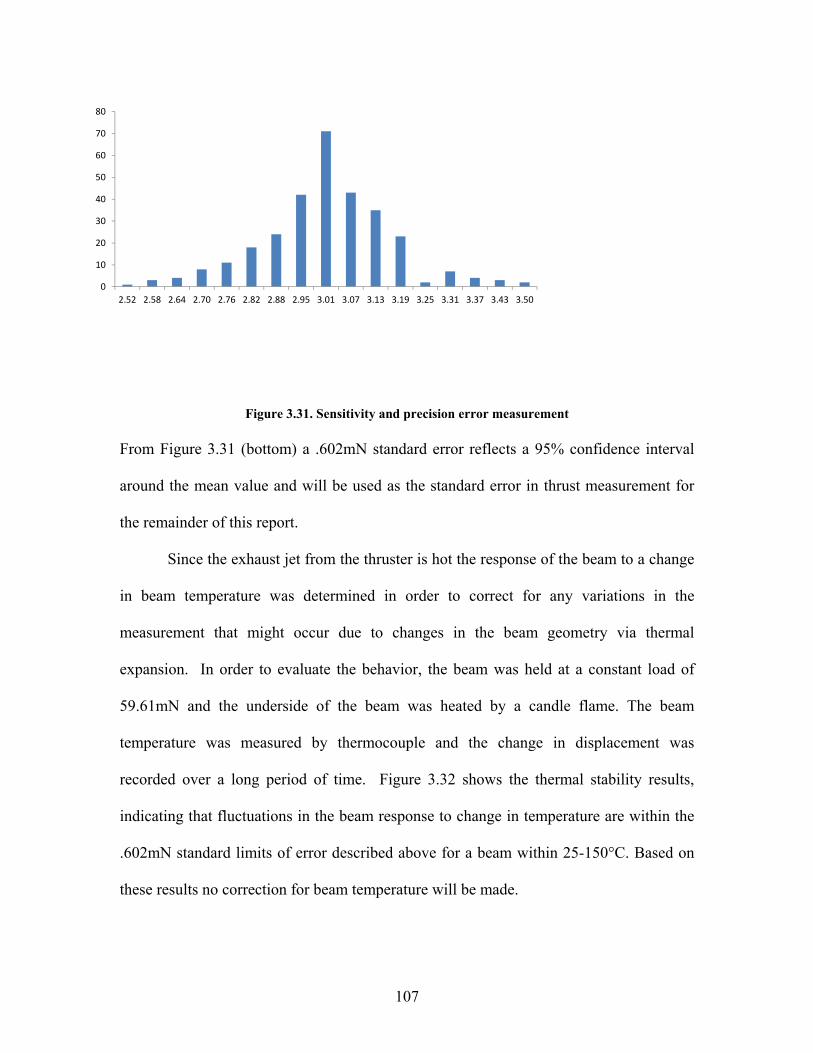
107
0
10
20
30
40
50
60
70
80
2.52 2.58 2.64 2.70 2.76 2.82 2.88 2.95 3.01 3.07 3.13 3.19 3.25 3.31 3.37 3.43 3.50
Figure 3.31. Sensitivity and precision error measurement
From Figure 3.31 (bottom) a .602mN standard error reflects a 95% confidence interval
around the mean value and will be used as the standard error in thrust measurement for
the remainder of this report.
Since the exhaust jet from the thruster is hot the response of the beam to a change
in beam temperature was determined in order to correct for any variations in the
measurement that might occur due to changes in the beam geometry via thermal
expansion. In order to evaluate the behavior, the beam was held at a constant load of
59.61mN and the underside of the beam was heated by a candle flame. The beam
temperature was measured by thermocouple and the change in displacement was
recorded over a long period of time. Figure 3.32 shows the thermal stability results,
indicating that fluctuations in the beam response to change in temperature are within the
.602mN standard limits of error described above for a beam within 25-150°C. Based on
these results no correction for beam temperature will be made.

108
Figure 3.32. Temperature stability over time, representative error is shown by the error bar on the right
Using both the calibration and error estimation presented in Figures 3.29 and 3.31
the thrust stand was tested by measuring the thrust force exerted by a 1.0mm diameter
circular jet on the plate and comparing it to the calculated thrust force at the exit plane of
the jet. The force was calculated as the product of the mass flow rate and the velocity,
where the velocity was calculated through continuity, the flow was assumed to be both
uniform and incompressible at the jet exit plane. Figure 3.33 shows the thrust force
versus oxygen volumetric flow rate for the circular jet test where the discrete points are
the experimental data and the dashed red line is the calculated theoretical result.
Figure 3.33. Thrust force exerted by a circular jet on the thrust stand versus the theoretical result
Theoretical Result

109
Figure 3.33 shows reasonable agreement between the measured thrust force and the
calculated results. The measured values deviate from the theoretical result at low flow
rates (low thrust) because the calibration curve does not pass through the origin, whereas
the theoretical result does.
Since the thrust stand behaves like an under damped mass-spring-damper system
the damped natural frequency, spring constant, and damping ratio were determined
experimentally in order to analyze the temporal variations in the thrust force at steady
state. Figure 3.34 shows the time decay in displacement for the thrust stand resulting
from an arbitrary initial displacement. The experimentally determined values yielded a
damping ratio of 0.0885, damped natural frequencies of 3.55Hz, 15.1Hz, and 34.71Hz,
and a spring constant of 382.49mN/cm.
Figure 3.34. Time history in displacement (in volts) for the thrust stand in free vibration
The natural frequencies of the thrust stand were filtered out of the final result
using a digital stop band filter integrated into the National Instruments Lab-View virtual
instrument used to gather and process that data.

110
Section 5 Procedures
Experimental procedures will be discussed in the results section, this is done to
allow for the discussion of the effects of procedure on both the results and the
performance of the thruster.
Section 6 References
1 Vijayan, V., “Combustion and Heat Transfer in Meso-Scale Heat Recirculating
Combustors,”. PhD Dissertation, University of Maryland at College Park, 2010.
2 Wu, C.K.,Wang, H.X., Meng, X., Chen, X. Pan, W.X. “Aerodynamics of indirect thrust
measurement by the impulse method”, Acta Mechanica Sinica, Vol.27, 2011, pp. 152-
163.
3 Lun, J. “Development of a vacuum arc thruster for nanosatellite propulsion”. Masters
Thesis. Stellenbosch University.2008

111
Chapter 4: Results
Section 1 Organization of the experimental results
The experimental results will be organized in way that highlights the
developmental progress of the meso-scale thruster while capturing the technical lessons
learned along the way. Experimental results will be compared to those found in the
literature to explain the physical significance of the results and attempt to shed light on
the phenomenology. The results are presented by first discussing the nature of flame
extinction in meso-scale thrust chambers and the effects of fuel/oxidizer inlet conditions,
fuel injection strategy, and geometry on the flame extinction limits. The effects of fuel,
geometry, and fuel injection strategy on the thermal performance of the combustion will
then be addressed. Third the effects of Reynolds number on the thruster nozzle discharge
coefficient and steady state thrust production will be discussed and compared to the
thermal performance results presented prior. The results section will conclude with a
discussion of the pulsing performance of the thruster.
Section 2 Extinction Behavior
Partially Premixed Combustion
Micro and meso-scale combustor in the literature largely focus on the combustion
of premixed gaseous reactants. This is done because mixing and burning in small
volumes with very limited residence times adds an additional challenge to the meso-
combustion problem. Although the gaseous premixed configuration is valuable in
addressing the basic characteristics of the combustor, moving toward a non-premixed

112
liquid fuelled configuration is necessary in order to apply the combustor to any practical
device. As such the initial configuration used here is a partially-premixed with the fuel
being injected through a porous heat recuperator placed upstream of the combustion
volume. The combustor is shown in Figure 4.1 below.
Figure 4.1. Single turn partially-premixed combustor
In the analytical study of non-adiabatic heat recirculating combustors Ronney 1
identifies two distinct extinction limits; a high mass flow rate or “blow off” limit where
fresh mixture is delivered to the reaction zone faster than it can be consumed, and a low
mass flow rate heat-loss driven limit where the fraction of heat release lost to the ambient
increases with decreasing mass flow rate leading to thermal quenching of the flame. This
dual limit behavior is consistent with the findings of other researchers. 2,3 However, the
analytical model is limited by the fact that the reaction zone is assumed to remain in the
same location regardless of the inlet conditions.
Figure 4.2 shows the extinction regime for the partially-premixed combustor with
aspect ratio of 0.5 utilizing steam and oxygen as an oxidizer and methanol as fuel. The
Exhaust Channel
Inlet Channel
Fuel InletSteam/Oxygen Inlet Direction of Heat TransferCombustion Volume

113
extinction regime demonstrates the dual branched behavior that is typical of this type of
combustor. The fuel lean limit represents flame blow-off which was observed through
the window of the combustor. The rich combustion limit represents a flashback limit
where high fuel concentrations and high oxidizer inlet temperatures (between 500-550°C
prior to mixing with fuel) combine with low channel velocities allowing the flame to
propagate upstream of the combustion chamber, and stabilize at the fuel injection
location. [Note that auto ignition temperature of methanol is 470°C]. This is analogous
to the “out-of-center” reaction zone reported by Ronney et. al.4 (see Figure 2.5 Section
2.1), however, in the context of this study the flame is considered “extinct” at the flash-
back limit.
0.00
1.00
2.00
3.00
4.00
5.00
1.50E-05 1.70E-05 1.90E-05 2.10E-05 2.30E-05 2.50E-05 2.70E-05 2.90E-05
Total Mass Flow Rate [Kg/sec]
O/F
Combustion
No Combustion
~Ф
A
B
C

114
0.00E+00
5.00E-06
1.00E-05
1.50E-05
2.00E-05
2.50E-05
3.00E-06 3.50E-06 4.00E-06 4.50E-06 5.00E-06 5.50E-06 6.00E-06 6.50E-06 7.00E-06
Fuel Mass Flow Rate [Kg/sec]
Oxi
dize
r M
ass
Flo
w R
ate
[Kg/
sec]
Figure 4.2. Extinction limits for the partially-premixed combustor burning methanol-steam-oxygen In Figure 4.2, top, the top line representing the lean blow off limit is nearly
horizontal with only a slight increase in slope with increase in total mass flow rate
towards high O/F ratios (lower Ф). This is because the inlet velocity to the combustion
volume is largely dependent on the oxidizer flow rate and independent of the fuel flow
rate. Because of this, the combustor blows off at almost the same oxidizer flow rate for
all conditions, the slight increase in the equivalence ratio being due to the addition of
slightly more fuel. Note that in order to determine the upper performance limit a flame is
stabilized at an equivalence ratio close to unity and the hydrogen and oxygen flow rates
are incrementally decreased at constant equivalence ratio until a flame is no longer
supported. The lower limit is found through an analogous procedure. At each increment
the combustor is allowed to reach steady state, this was determined by thermocouple
measurements taken in the exhaust.
The ‘C’ shape is essentially described by three points, as labeled in the figure:
point A is a structural limit which is discussed later, point B is the minimum stable Re
Combustion
No Combustion
AB
C

115
(rich extinction limit at the minimum heat input), and point C is the rich extinction limit
at the maximum heat input. Experimentally, point A is the point where the combustor
fractures due to overheating and occurs at roughly the same point for all the tested
configurations and is thus dictated by material properties. The fracture occurs at the
junction of the steam generator and the heat recirculating combustor. Points B and C are
associated with flame flashback and are thus sensitive to the combustor geometry, since it
plays a role in channel velocities and upstream gas temperature which influences flame
velocities.
In order to further understand the flashback behavior simulations were performed
in Chemkin to determine the laminar flame speeds of mixtures of
methanol/steam/oxygen. The flame speeds of mixtures of methanol/superheated steam/
and oxygen are calculated using the C1 mechanism 5,6 for methanol oxidation. However
they are not correlated to experimental data due to a lack thereof, for this reason the
calculations should be taken only as a qualitative comparison to established experimental
data for methanol/air. Flame speeds are calculated using the PREMIX subroutine of the
Chemkin software package. Figure 4.3 shows the flame speeds for a mixture of
steam/oxygen/methanol at 400K, along with simulation results for methanol/air at 358K
and experimental results from Liao et. al.7 and Saeed and Stone8 for methanol/air at
358K. For the following calculations the molar ratio of steam to oxygen is fixed at 2 to 1.

116
Figure 4.3. Laminar flame speeds for methanol/superheated steam/oxygen and methanol/air as compared to literature values The 358K methanol/air simulation results correlate well with the experimental
data in the lean regime with slight overestimation in the rich regime. Due to the
reasonable fit the same model parameters (grid points, gradient and adaptive curvature
options) used for the methanol/air simulations were used for the superheated
steam/oxygen/methanol simulations. Flame velocities for methanol/superheated
steam/oxygen are estimated to lie between 35cm/s and 1.1m/s with a maximum at an
equivalence ratio of roughly ~1.1. Additionally, Figure 4.3 shows the flame velocity for
decreased oxygen concentration (36% by mass). Figure 4.4, shows the adiabatic flame
temperatures for superheated steam/oxygen/methanol and air/methanol. The burned gas
temperature is higher for mixtures of steam/oxygen/methanol as compared to mixtures
with air for the same unburned gas temperature; this likely drives the higher flame speeds
since flame speed has a strong direct dependence on burned gas temperature.21 Adiabatic
flame temperatures are calculated using CEA.
400K Steam/Oxygen [oxygen 47%]
400K Steam/Oxygen [oxygen 36%]

117
0
500
1000
1500
2000
2500
3000
0.5 0.7 0.9 1.1 1.3 1.5
Fla
me
Tem
p [K
]
Equivalence Ratio
Methanol/Steam/Oxygen Methanol/air
Figure 4.4. Adiabatic flame temperatures for methanol/superheated steam/oxygen and methanol/air
Using the flame speed data shown in Figure 4.3, the quenching distance can be
approximated using Equation 4.1 .9
LSbd /2 Eq. 4.1
In Equation 4.1 “d” is the quenching distance, “α” is the thermal diffusivity of the
burned gas, “b” is an arbitrary parameter, and “SL” is the flame speed. It is important to
note that Equation 4.1 is derived for a one dimensional laminar flame in a slot formed by
two parallel walls, subject to the condition that the rate of heat liberated by chemical
reaction is equal to the rate of heat lost from the flame by conduction to the walls. Figure
4.5 shows the schematic diagram used to formulate the model.9 This approximate
solution considers only thermal quenching of the flame and does not consider quenching
caused by the diffusion and termination of active species at the wall.10 Figure 4.6 shows
the approximate quenching distance for methanol/steam/oxygen and methanol/air for an
un-burnt gas temperatures of 400K. The thermal diffusivities of the equilibrium
combustion products are calculated using CEA. The value of “b” has been chosen such
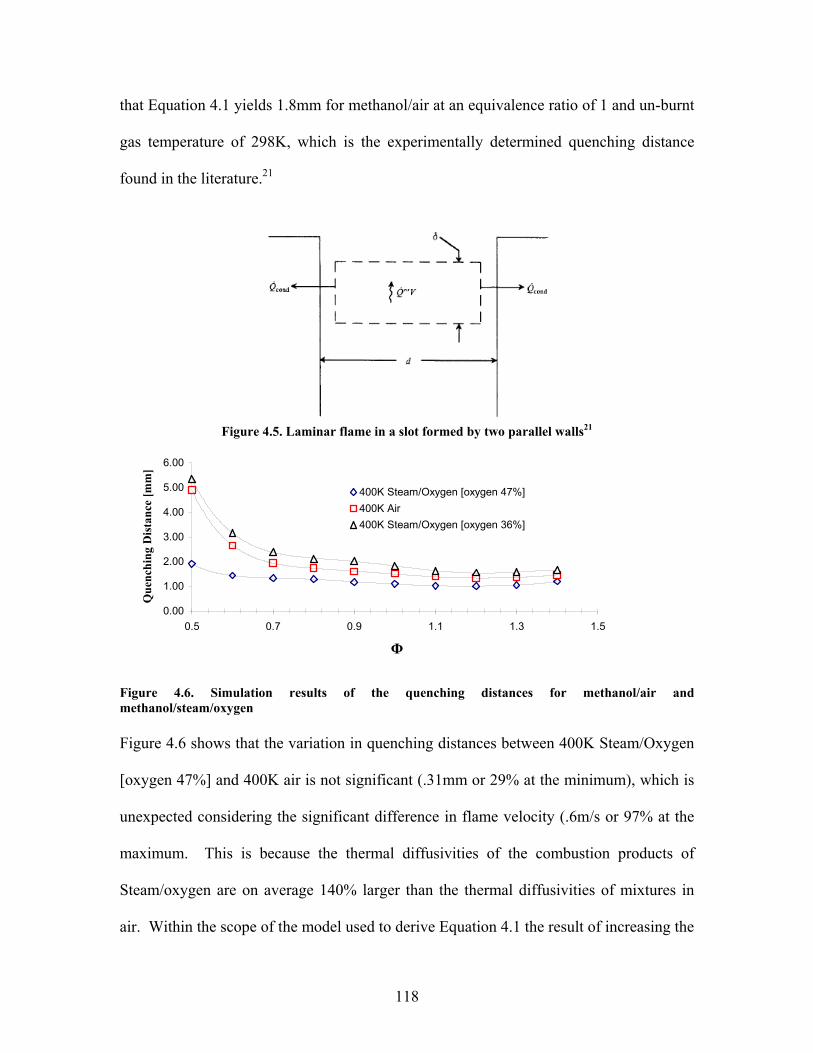
118
that Equation 4.1 yields 1.8mm for methanol/air at an equivalence ratio of 1 and un-burnt
gas temperature of 298K, which is the experimentally determined quenching distance
found in the literature.21
Figure 4.5. Laminar flame in a slot formed by two parallel walls21
0.00
1.00
2.00
3.00
4.00
5.00
6.00
0.5 0.7 0.9 1.1 1.3 1.5
Φ
Qu
ench
ing
Dis
tan
ce [
mm
]
400K Steam/Oxygen [oxygen 47%]
400K Air
400K Steam/Oxygen [oxygen 36%]
Figure 4.6. Simulation results of the quenching distances for methanol/air and methanol/steam/oxygen Figure 4.6 shows that the variation in quenching distances between 400K Steam/Oxygen
[oxygen 47%] and 400K air is not significant (.31mm or 29% at the minimum), which is
unexpected considering the significant difference in flame velocity (.6m/s or 97% at the
maximum. This is because the thermal diffusivities of the combustion products of
Steam/oxygen are on average 140% larger than the thermal diffusivities of mixtures in
air. Within the scope of the model used to derive Equation 4.1 the result of increasing the

119
thermal diffusivity is an increase in the thickness of the laminar flame, which results in a
larger projected area of the flame on the wall and larger rates of heat loss. At lower
oxygen concentrations, the quenching distances are larger than those in air due to the
same effect, even though the flame velocities are slightly higher.
Since the fuel lean and fuel rich extinction limits are blow-off and flash-back
limits respectively they are intrinsically related to the velocities and mixture composition
at the inlet to the combustion volume. The latter relates to the flame velocity that can be
supported by the inlet mixture. Hence extinction limit control should be possible by
varying either the inlet geometry (inlet to the combustion chamber, which is analogous to
the channel geometry) or the inlet mixture composition. Varying the inlet mixture
composition is done by changing the concentration of oxygen in the oxidizer stream,
which is analogous to changing the inlet concentration of hydrogen peroxide. Two
additional combustors were fabricated to test the effect of channel width on the
combustor extinction limits; the channel aspect ratio was sized such that the Reynolds
number, based on hydraulic diameter, was constant between the two combustors for
identical inlet conditions. Hence the narrower channel is deeper in order to maintain a
constant hydraulic diameter. The result is three combustors with channel aspect ratios of
.5, and .4, and .3 respectively. Figure 4.7 shows the extinction regimes for the three
combustors. The extinction regimes are written in terms of total mass flow rate and O/F
ratio and in terms of cold flow inlet velocity versus O/F ratio. Note that the cold flow
channel velocities are calculated for oxygen, steam, and methanol, and the 100C
(temperature of saturated steam at 1atm).

120
0.00
1.00
2.00
3.00
4.00
5.00
6.00
0.000005 0.00001 0.000015 0.00002 0.000025 0.00003
Total Mass Flow Rate [Kg/sec]
O/F
Mas
s M
ixtu
re R
atio
0.00
1.00
2.00
3.00
4.00
5.00
6.00
2.00 3.00 4.00 5.00 6.00 7.00 8.00 9.00 10.00 11.00
Channel Velocity [m/s]
O/F
Mas
s M
ixtu
re R
atio
Figure 4.7. Extinction regimes for the partially-premixed combustors with three different aspect ratios, the arrow points in the direction of decreasing channel aspect ratio.
In Figure 4.7, top, the low mass flow rate extinction limits shift to the left with
decreasing channel aspect ratio. In each of the three cases the upper branch represents a
blow off limit while the lower branch represents a flashback limit. In Figure 4.7, bottom,
the lean blow off limits for the three combustors lie along roughly the same line, however
the rich limits are biased towards lower channel velocities for lower aspect ratios. Since
preheating will cause a substantial increase in the mixture temperature the channel
velocities shown in Figure 4.7, bottom, are likely less than what actually occurs.
However, it is possible that the enhancement of flame velocity due to preheat offsets the
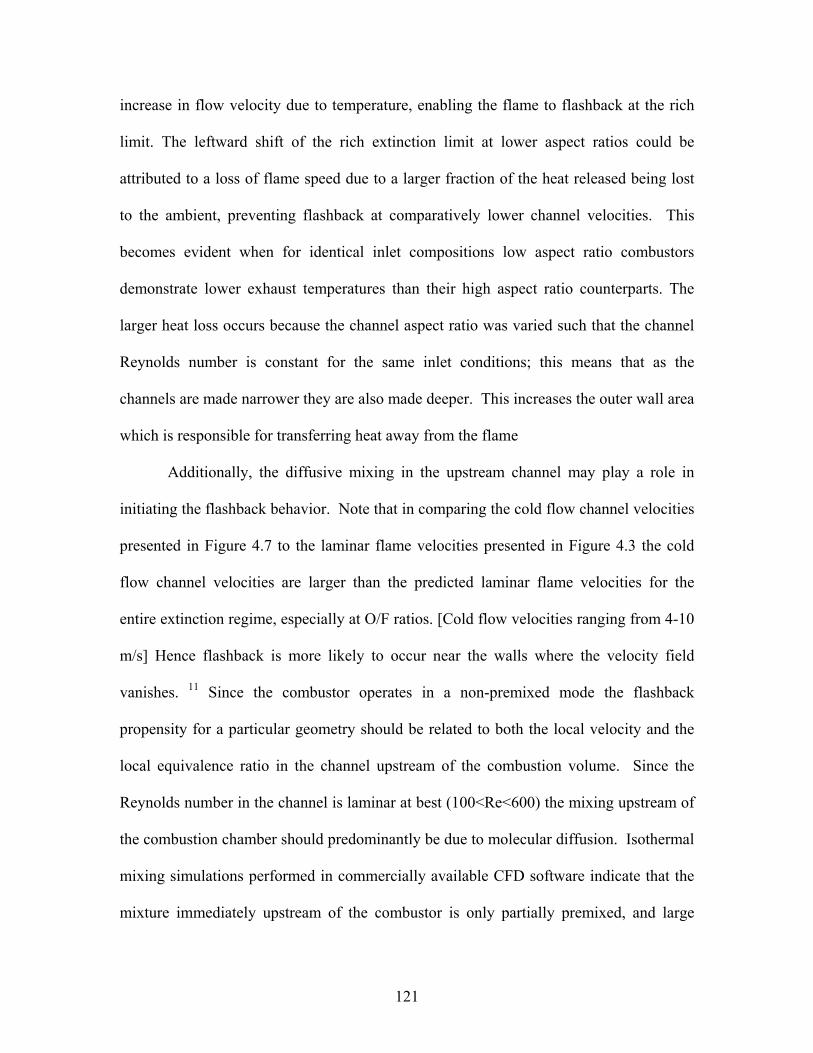
121
increase in flow velocity due to temperature, enabling the flame to flashback at the rich
limit. The leftward shift of the rich extinction limit at lower aspect ratios could be
attributed to a loss of flame speed due to a larger fraction of the heat released being lost
to the ambient, preventing flashback at comparatively lower channel velocities. This
becomes evident when for identical inlet compositions low aspect ratio combustors
demonstrate lower exhaust temperatures than their high aspect ratio counterparts. The
larger heat loss occurs because the channel aspect ratio was varied such that the channel
Reynolds number is constant for the same inlet conditions; this means that as the
channels are made narrower they are also made deeper. This increases the outer wall area
which is responsible for transferring heat away from the flame
Additionally, the diffusive mixing in the upstream channel may play a role in
initiating the flashback behavior. Note that in comparing the cold flow channel velocities
presented in Figure 4.7 to the laminar flame velocities presented in Figure 4.3 the cold
flow channel velocities are larger than the predicted laminar flame velocities for the
entire extinction regime, especially at O/F ratios. [Cold flow velocities ranging from 4-10
m/s] Hence flashback is more likely to occur near the walls where the velocity field
vanishes. 11 Since the combustor operates in a non-premixed mode the flashback
propensity for a particular geometry should be related to both the local velocity and the
local equivalence ratio in the channel upstream of the combustion volume. Since the
Reynolds number in the channel is laminar at best (100<Re<600) the mixing upstream of
the combustion chamber should predominantly be due to molecular diffusion. Isothermal
mixing simulations performed in commercially available CFD software indicate that the
mixture immediately upstream of the combustor is only partially premixed, and large

122
gradients in fuel mass fraction (local equivalence ratio) exist in the channel. Figure 4.8
shows the simulation results for methanol at the rich extinction limit of the AR=.5
combustor for an inlet methanol flow rate of .30mL/min. From left to right: (i) shows the
velocity field at the entrance to the combustion chamber, (ii) shows the equivalence ratio
field at the entrance to the combustion chamber and (iii) shows regions on the plane
where the local flow velocity in the direction of the channel is smaller than the local
flame velocity at the same location (0<Vy/SL<1), these are regions where flashback
would be more probable.
Figure 4.8.Channel Velocity, Equivalence Ratio, and Flashback Propensity on the cutting plane
In Figure 4.8i the velocity field in the direction of the channel indicates low
velocity regions on the bottom left and right hand portions of the channel with higher
velocities at the top of the channel close to the entrance to the combustion chamber and
the high velocity core flow. In Figure 4.8ii the reddish region near the bottom of the
image represents the developing fuel mass as it diffuses into the oxidizer rich region
(i)– Channel Velocity [m/s] (ii)-Φ (iii)-Vy/SL

123
above it; due to the high global equivalence ratio stoichiometric conditions are found near
the top left hand portion of the channel with fuel rich regions in the high speed core flow.
Figure 4.8iii shows regions where the flashback propensity should be high (regions where
Vy<SL), these regions are close to the wall and predominantly at the top left hand corner
of the channel, where the local equivalence ratios favor higher flame velocities. The
results suggest two conclusions: first, even in the presence of high mean channel
velocities the partially premixed combustor can succumb to flame flashback if the local
equivalence ratio near the wall can support large flame velocities; and second, the
tendency for flashback is a symptom of incomplete mixing. Providing more aggressive
mixing upstream of the combustion chamber inlet could alleviate this problem by
ensuring that the mixture is closer to the global equivalence ratio, which at the rich
extinction limit cannot support high flame velocities.
The rich extinction behavior has also been investigated through thermodynamic
analysis of the combustors it approaches the rich extinction limit. This is done semi-
empirically by measuring gas temperatures at particular locations in the combustor and
using tabulated gas properties to calculate the enthalpy flow rate of the gas at that
location. The net rates of heat transfer are calculated using a first law based model. In
order to provide a sufficient amount of detail in the analysis, the combustor has been
divided into five sections. Section one is the steam generator, section two is the cold side
of the heat exchanger, section three is the mixing stage (which is the second leg of the
cold side of the heat exchanger and represents the introduction of fuel into the oxidizer
stream), section four is the combustion volume, and section five is the exhaust channel or
hot side of the heat exchanger. Figure 4.9 shows the model schematic along with the

124
thermocouple locations labeled 2, 3, 4, 5 and 6 representing the inlet and outlet
conditions for sections one through five. Thermocouple location 1 is the ambient lab
temperature and represents the inlet to section one.
Figure 4.9. First Law Model of the Combustor
In section one the inlet mass fluxes are room temperature hydrogen and oxygen at a fixed
equivalence ratio of .5 (Φ=.5). The energy balance on section one is shown in Eq. 4.1
and involves the H2/O2 heat of reaction, the heat transferred from section one to two and
the heat lost from section one. Note that the specific heat at section two is different from
the specific heat at section one due to the reaction and represents a mixture of steam and
oxygen with a steam mass fraction of .53. For all sections unless otherwise specified
temperature dependent specific heats are used to calculate the enthalpy flux terms. These
are found in the NIST online chemistry webbook16, and are weighted by mass fraction.
1 ,2 2 1 ,1 1 1 2 ,1p p reaction lossm C T m C T Q Q Q Eq.4.1
125
Section two is the beginning of the cold side of the heat exchanger and the first preheat
section, the energy balance on section two is shown in Eq. 4.2 and involves the heat
transferred from section one, the heat transferred from section five and the heat lost from
section two in addition to the inlet and exit enthalpy flux.
1 ,2 3 2 ,2 2 1 2 5 2 ,2p p lossm C T m C T Q Q Q Eq. 4.2
Section three is the mixing section and the inlet corresponds to the injection point for the
methanol. The energy balance involves the heat transferred from section four, the heat
lost from section three, and the influx of methanol from the heat recuperating fuel
injector in addition to the steam oxygen mixture coming from section two. The energy
balance is shown in Eq. 4.3.
2 ,3 4 2 ,3 3 4 3 ,3p p lossm C T m C T Q Q Eq. 4.3
Section four is the combustion volume and the first hot section of the combustor. The
energy balance involves the heat transferred to the mixing section, the heat transferred to
the exhaust channel, and the heat of reaction for methanol/steam/oxygen in addition to
the inlet and exit enthalpy fluxes. The specific heat at the exit is calculated through
adiabatic isobaric equilibrium simulation performed in CEA. The species and specific
heat are frozen at the exhaust of section four and assumed constant for section five. The
energy balance for section four is shown in Eq. 4.4.
2 ,4 5 2 ,3 4 4 3 4 5 ,4p p reaction lossm C T m C T Q Q Q Q Eq. 4.4

126
Section five is the exhaust section and the hot side of the heat exchanger. The energy
balance involves the heat transferred from section four to section five, the heat transferred
from section four to section two and the heat lost from section five, in addition to the inlet
and exit enthalpy fluxes. As mentioned previously, because of the complex mixture
composition a constant specific heat is assumed between the inlet of section five (which
is the exhaust of section four) and the exhaust of section five.
2 ,4 6 2 ,4 5 4 5 5 2 ,5p p lossm C T m C T Q Q Q Eq. 4.5
Temperatures two through six are measured with k-type thermocouples and the
measurements are left uncorrected, temperature one is assumed to be 298K. The above
five equations cannot be solved together for the individual terms involved, however they
can be used independently to draw conclusions about the net effect of heat transfer in
each section of the combustor. Figure 4.10-4.14 show the enthalpy flow rate (Watts) of
the gas at thermocouple locations one through six for a fixed fuel flow rate of .30mL/min
and varying equivalence ratio. The enthalpy flow rate is calculated as the product of the
heat capacity rate in that section and the temperature at the inlet and exit.

127
0
2
4
6
8
10
12
14
1 1.2 1.4 1.6 1.8 2
Φ
Ene
rgy
Con
tent
[W
]
H1 H2
Figure 4.10. Enthalpy flow rate at locations one and two for a methanol flow rate of .3mL/min
0
5
10
15
20
25
30
35
1 1.2 1.4 1.6 1.8 2
Φ
Ene
rgy
Con
tent
[W
]
H3 H2
Figure 4.11. Enthalpy flow rate for locations two and three for a methanol flow rate of .3mL/min
0
5
10
15
20
25
30
1 1.2 1.4 1.6 1.8 2
Φ
Ene
rgy
Con
tent
[W
]
H3 H4
Figure 4.12. Enthalpy flow rate for locations three and four for a methanol flow rate of .3mL/min

128
0
10
20
30
40
50
60
70
80
1 1.2 1.4 1.6 1.8 2
Φ
Ene
rgy
Con
tent
[W
]
H4 H5
Figure 13.Enthalpy flow rate for locations four and five for a methanol flow rate of .3mL/min
0
10
20
30
40
50
60
70
80
1 1.2 1.4 1.6 1.8 2
Φ
Ene
rgy
Con
tent
[W
]
H6 H5
Figure 4.14. Enthalpy flow rate for locations five and six for a methanol flow rate of .3mL/min
In Figure 4.10 the data set labeled H1 represents the oxidizer input power to the
combustor and decreases with increasing equivalence ratio at constant fuel flow rate. H2
represents the output power from section one and the difference between H1 and H2 is
equal to the sum of the heat of reaction for the steam generator, the heat lost from the
steam generator to the ambient and the heat transferred by conduction from the steam
generator to the cold side of the heat exchanger. As the mixture is made progressively
fuel rich the difference between H1 and H2 becomes smaller indicating that the net heat
transfer from section one becomes large compared to the heat released by reaction at low

129
flow rates. Recall that the reaction in section one is at constant equivalence ratio. In
Figure 4.11 the data set labeled H2 represents the input power to the cold side of the heat
exchanger and the data set labeled H3 represents the output power to the mixing section.
The difference between H2 and H3 is equivalent to the heat transferred from the steam
generator, the heat transferred from the exhaust, and the heat lost to the ambient. This
difference is relatively insensitive to equivalence ratio, indicating that for a fixed fuel
flow rate the net heat input to the cold side of the heat exchanger does not vary
significantly with inlet composition. In Figure 4.12, the data set labeled H3 is the input
power to the mixing section and the data set labeled H4 is the output power to the
combustion volume. The difference between H3 and H4 shows that the heat input from
the combustion volume and the heat lost from the mixing section are balanced in the rich
regime with a small net heat loss close to the stoichiometry and a small net heat gain
close to the rich extinction limit. This indicates that the contribution to preheat from the
mixing section is negligible at best. The reason for this is the nearly two-fold increase,
on average, of the heat capacity rate compared to section two meaning that the same heat
release from the combustion volume must heat up a mixture with nearly twice the thermal
mass as section two with the additional introduction of cold reactants.
The combustion zone is the beginning of the hot side of the combustor and in
Figure 4.13 the data set labeled H4 is the input power to the combustion zone and the
data set labeled H5 is the output power to the exhaust channel. The difference between
H4 and H5 is equivalent to the sum of the heat of reaction, the heat transferred to the
exhaust, the heat transferred to the mixing region and the heat lost from the combustion
zone. Close to stoichiometric conditions, the heat of reaction is significantly larger than
130
the combined heat transfers away from the combustion zone, however, as the mixture is
made rich the difference rapidly decays. The combustor succumbs to flashback before
H4 becomes equal to H5, however, this would represent the theoretical thermal
quenching limit had flashback not taken place.
In Figure 4.14 H5 represents the output power from the combustion zone and H6
represents the exhaust power. The difference between H5 and H6 is the combination of
heat transferred from the combustion zone to the exhaust channel, the heat transferred
from the exhaust channel to section two, and the heat lost from the exhaust channel. The
exhaust channel experiences a net heat loss which decreases as the mixture is made fuel
rich, indicating that the heat gained through conduction from the combustion volume
tends to balance the net heat lost through the walls. This is consistent with the
predictions shown in Figure 4.15 however a decrease in the net heat loss would be
expected in the lean regime.
The net heat recirculated from the exhaust channel back to the reactants (from
section five to section two) cannot be calculated directly from Eqs 4.1-4.5 and the
experimental data. However, it can be approximated by the difference between the output
power from section one and the input power to section three prior to ignition and after
stabilization of the flame, shown by the difference between Eq. 4.6 and Eq.4.7. The net
heat transfer to the reactants is shown in Figure 4.15 along with the net heat transfer as a
fraction of the heat input. The heat transferred to the reactants is roughly constant with
equivalence ratio at constant fuel flow rate varying between 6.2 and 7.57 Watts. The ratio
of the heat transfer to heat input increases with equivalence ratio due to the concurrent

131
decrease in input heat. The heat transferred to the reactants is highest at the rich
extinction limit at 6.9%.
2,2521232, )( lossp QQQTTCm [With stable flame] Eq. 4.6
2,21232, )( lossp QQTTCm [Prior to Ignition] Eq.4.7
0.001.002.003.004.005.006.007.008.009.00
1 1.2 1.4 1.6 1.8 2
Φ
Net
Hea
t Tra
nsfe
red
to
Rea
ctan
ts [
W]
0
0.01
0.02
0.03
0.04
0.05
0.06
0.07
0.08
Hea
t Tra
nsfe
red/
Hea
t Inp
ut
Heat Transfered Heat Transfered/Heat Input
Figure 4.15. Heat transferred to the Reactants, both net and as a fraction of the heat input for a Methanol flow rate of .30mL/min
In brief, the lessons learned from the partially premixed combustion scheme can
be summarized by the following:
The extinction regimes are limited by blow-off at the lean
combustion limit and flashback at the rick combustion limit
Decreasing the channel aspect ratio allows for the stabilization of
flames at lower total mass flow rates and richer equivalence ratios
due to suppression of flashback. This behavior could be due in part
to higher heat losses in smaller aspect ratio channels and
incomplete mixing in the upstream channel
All of the preheating occurs upstream of the fuel injection point
downstream of which the temperature variation is minimal, this is

132
due to the increase in heat capacity rate downstream of the fuel
injection point. If the mixing section of the inlet channel were
longer then the preheat temperature may increase due to larger
amounts of heat transfer from the products; however, this would
come at the expense of lower exhaust enthalpy
Non-Premixed Combustion
As mentioned in Section 3.1 a second fuel injection configuration was tested
whereby the fuel is injected directly into the combustion chamber. This configuration is
shown in Figure 3.4, and was tested with both methanol and kerosene (grade 1K). It is
important to note that kerosene combustion was not possible at any condition in the
partially premixed configuration. The extinction limits for the methanol flame in non-
premixed combustion are shown in Figure 4.16, below.
0
1
2
3
4
5
6
0.45 0.5 0.55 0.6 0.65 0.7 0.75 0.8 0.85
Methanol mL/min
Φ
Rich Extinction FREI LIMIT Approx. Limit Structural Limit
Figure 4.16. Extinction limits for non-premixed combustion of methanol
In Figure 4.16, Φ represents the global equivalence ratio and no absolute lean
extinction limit could be found due to limitations with the experimental facility that were

133
discussed in Section 3.0. The red line labeled Approx. Limit represents the point where
the steam/oxygen inlet temperature is larger than the adiabatic decomposition
temperature of pure hydrogen peroxide. The green line labeled structural limit is the
point where the combustor fractures at the inlet as shown in Figure 2, and the blue line
labeled FREI LIMIT are conditions where the flame experiences repetitive extinction and
ignition events (named Flame with Repetitive Extinction and Ignition (FREI) in the
literature 12). Temperatures were measured at four locations in this configuration, they
are: the inlet steam and oxygen temperature, the preheat temperature (which is the inlet to
the combustion chamber), the product gas temperature (which is the exit from the
combustion chamber), and the exhaust temperature. The four measured temperatures
versus equivalence ratio for a methanol flow rate of 0.45mL/min are shown in Figure
4.17.
0
200
400
600
800
1000
1200
1400
0 0.5 1 1.5 2 2.5 3 3.5 4 4.5Φ
Tem
pera
ture
[C
]
InletPreheatProduct gas temperatureExhaust
Figure 4.17. Inlet, preheat, product gas, and exhaust temperatures for non-premixed methanol combustion
Figure 4.17 shows similar global behavior as was experienced with partially
premixed combustion with exhaust temperatures increase monotonically in the fuel lean

134
direction, with the rate increasing at around Φ=1.5. It is important to note that the
preheat temperatures are always lower than the inlet temperatures unless the combustor is
operating in globally rich conditions with Φ>2. This means that the rate of heat loss from
the steam/oxygen mixture is larger than the rate of heat recirculation from the products.
Additionally, the inlet temperature increases with decrease in equivalence ratio due to the
larger amount of hydrogen and oxygen burnt to produce the oxidizer. The discontinuity
in the data at Φ~1.4 occurs because the flow controllers were changed at this point in
order to provide for a broader measurement range. Figure 4.18 shows the enthalpy flow
rates at the inlet, pre-preheat, product gas, and exhaust locations.
0
50
100
150
200
250
0.5 1 1.5 2 2.5 3 3.5
Φ
Ent
halp
y F
low
Rat
e [W
] Inlet Product Gas
Pre-Heat Exhaust
Figure 4.18. Enthalpy flow rates at the inlet, preheat, product gas, and exhaust locations versus equivalence ratio at a methanol flow rate of .45mL/min
Applying the same analysis as was applied to the partially-premixed combustor
the difference between the enthalpy flow rates at the product gas location and the preheat
location is equal to the difference between the heat gained due to combustion and the heat
transferred away from the combustion zone. The gain in product gas enthalpy at

135
extinction indicates that the rich extinction criteria is not due to thermal quenching but
rather some alternative mechanism.
Figure 4.19 shows the steam oxygen enthalpy flow rates at the inlet and preheat
locations versus equivalence ratio during methanol combustion (labeled after) and the
enthalpy flow rates at the inlet and preheat conditions without the methanol flame
(labeled before).
0
20
40
60
80
100
0.5 0.7 0.9 1.1 1.3 1.5
Φ
Ent
halp
y F
low
Rat
e [W
]
Before inlet
Before Preheat
After inlet
After Preheat
Figure 4.19. Inlet and preheat enthalpy flow rates before and after combustion
As mentioned previously, FREI instability behavior was observed in the lean
regime and is present at all conditions between the lines labeled FREI limit and Approx.
Limit in Figure 4.16. High speed cinematography was used to investigate the FREI
instability behavior in non-premixed methanol/steam/oxygen combustor with Kanthal
wire igniters. Figure 4.20 shows the combustor in the stable flame state, extinct state, and
at the initiation of a FREI event.
Heat Loss Before Heat Loss After

136
Since the flame surface is not clearly visible the grayscale intensity was tracked at
two locations inside the combustion chamber and one location just downstream of the
combustion chamber and the intensities used to infer the extinction and re-ignition event.
The time trace of the intensities is shown in Figure 4.21; the line labeled “Downstream
Location” is the intensity at the product gas thermocouple, the line labeled “In Chamber
1” is the intensity at the downstream ignition wire, and the line labeled “In Chamber 2” is
the intensity at the upstream ignition wire.
0
0.05
0.1
0.15
0.2
0.25
0.3
0 0.5 1 1.5 2
Inte
nsit
y -A
rbit
rary
Uni
ts
Time -sDownstream LocationIn Chamber 1In Chamber 2
Figure 4.21. Time trace showing the extinction and re-ignition process
Figure 4.20. High speed images of an FREI event. From left to right: Stable flame, extinct flame, onset of re-ignition
Initial extinction intensity decay
Intensity Increase due to re-ignition event
Extinction event
Stable Flame Extinct Flame Onset of Re-ignition

137
From the time history it can be inferred that after the initial intensity decay due to
flame extinction, cyclic re-ignition and extinction events occur in pulses roughly
separated by 0.175 sec. or 5.7Hz. The peak intensity rises with each subsequent pulse
because each prior pulse heats the combustor slightly and the next pulse comes before the
heat can be lost. This continues until the flame is re-stabilized inside the combustion
chamber. The high speed video shows that the re-ignition occurs in the exhaust and the
flame propagates back upstream. A proposed mechanism for re-ignition is shown in
Figure 4.22.
Figure 4.22. FREI mechanism for the heat recirculating combustor
In Figure 4.22, drawing (i) shows a flame stabilized in the combustion chamber
with hot steam and oxygen mixture entering through the inlet channel and hot
combustion products exiting through the exhaust channel. The direction of heat transfer
is from the hot combustion products to the steam oxygen mixture, as can be seen in
Figure 4.22. In drawing (ii) the flame is extinct, hot steam and oxygen are still entering
through the inlet channel; however, fresh mixture at a lower temperature is exiting
through the exhaust channel; here the direction of heat transfer is from the steam oxygen
mixture to the exhaust. In drawing (iii) the heat input from the steam oxygen mixture
causes re-ignition of the reactant stream flowing out of the exhaust; with no-where to
Hot Reactants
Hot Products
Heat Transfer
Flame
Re-ignition and flashback
Fresh Mixture

138
anchor, the flame flashes back into the combustion chamber and re-stabilizes. Although
the proposed mechanism for re-ignition is plausible, the cause for the initial flame
extinction is not readily apparent. It will be shown later that the FREI instability behavior
can be eliminated by changing the ignition hardware from Kanthal wires protruding into
the chamber to flush mounted SiC igniters, suggesting that the extinction is caused by
interaction between the flame and ignition wires.
As mentioned previously the non-premixed combustor was tested with kerosene
as well. Figure 4.23 shows the extinction regime for kerosene/steam/oxygen combustion;
note that this combustor utilized flush mounted SiC igniters due to the heightened
performance and more stable operation with methanol. Because of limitations with the
experimental facility the lean extinction limit could not be determined and is represented
by the approximation and structural limits shown in Figure 4.16. Because the combustor
was able to support kerosene flames at very high global equivalence ratios the rich limit
was defined as the point where the combustor begins producing noticeable amounts of
soot. Soot formation is caused by a competition between soot production and soot
oxidation and is an intrinsic property of hydrocarbon diffusion flames. The propensity for
soot formation is a strong function of equivalence ratio, flame temperature, and mixing 13.
In the experimental facility the onset of soot production was identified by the deposition
of soot on both the channel walls and quartz window and the yellowish white
incandescence from the soot producing regions of the flame. Operation at global
equivalence ratios larger than the limit for soot production would be undesirable since
deposition on the channel walls would alter the characteristics of heat transfer to the

139
reactants and may clog small passages downstream of the combustor, like a meso-scale
nozzle throat, for example.
0
1
2
3
4
5
6
0.2 0.22 0.24 0.26 0.28 0.3 0.32Kerosene mL/min
Φ
Soot FormationPoint
Figure 4.23. Extinction regime for kerosene combustion
Kerosene combustion is possible over a relatively narrow range of fuel flow rates,
between 0.2mL/min. and 0.3mL/min. and the global equivalence ratio limit for the
formation of soot tends to increase with increase in fuel flow rate. No FREI or other
instability mechanisms were observed at any condition. Figure 4.24 shows the flame
images and the development of the global flame structure for the kerosene flame from the
soot production limit to the approximate limit for a fuel flow rate of 0.2mL/min.
Stable combustion with no noticeable soot formation
Sooty flame

140
Figure 4.24 shows the progression of the global flame structure from a diffusion
flame with a very discrete reaction zone at very rich conditions to a condition that
exhibits no visible flame at very lean conditions. At Φ =2.27 the deposition of soot on
the channel walls and quartz window becomes visibly apparent, and at Φ=5.31 the soot
deposition on the window is so thick that it obscures the luminosity from the channel
entirely. The regions of the flame exhibiting soot nucleation and incandescence become
visible at Φ=1.99. In the globally fuel rich regime the flame appears to be anchored at
two locations, one anchoring location is at the fuel injector and the other at downstream
edge of the step inlet to the combustion chamber. This dual branching behavior is
apparent at Φ=2.27 and Φ=1.77 but is most obvious at Φ=1.99. At Φ=1.77 the reaction
Figure 4.24. Development of the kerosene global flame structure

141
zone spreads out, and although the anchoring locations are still apparent the surface of
the flame is not as distinct. Close to the lean Approximate Limit the flame loses all
visible emission and the combustor operates in the “flameless” mode. This combustion
mode has been reported by Ahn et. al 14 in mesoscale heat recirculating combustors
burning propane and air, and in macro-scale combustors with non-premixed fuel and
highly pre-heated air. The reason for reaction zone broadening and “flameless”
combustion in mesoscale heat-recirculating burners could be due to the small
characteristic geometries and highly-preheated reactants which make it difficult to
support the large temperature gradients associated with thin reaction zones. 14
The extinction regime for the combustor with nozzle shown in Figure 3.5 was also
tested with methanol/steam/oxygen to study the effect of both pressure and exhaust
channel geometry on flame extinction. Figure 4.25 shows the global stability regime for
the thrust chamber; the stability regime for the open channel combustor (chamber
pressure of 1 atm.) is also shown for comparison. In the figure, the line representing the
thrust chamber stability regime is labeled ‘confined’ while the line representing the open
channel stability regime is labeled ‘unconfined’. No absolute lean limit of combustion
was determined due to limitations with the experimental facility that were discussed
above. The red line labeled “Approx. Limit” represents the point where the
steam/oxygen inlet temperature is larger than the adiabatic decomposition temperature of
pure hydrogen peroxide.

142
0
1
2
3
4
5
6
0.45 0.5 0.55 0.6 0.65 0.7 0.75
Methanol mL/min
ΦUnconfined Approx. Limit
Confined Linear (Approx. Limit)
Figure 4.25. Global Flame Stability Regime
From Figure 4.25 it is evident that the global extinction regime for methanol
combustion in the confined combustor is substantially narrower than the global extinction
regime for the unconfined combustor. However, the trend in flame extinction is similar,
with a wider extinction limits at low heat loads, and a narrower extinction limits at high
heat loads. The differences in the extinction regimes can be explained through trends in
both the exhaust and pre-heat temperatures of both the confined and unconfined
combustors. Figures 4.26 shows both the exhaust temperature and pre-heat temperatures
for both the confined and unconfined combustors for a methanol flow rate of
0.45mL/min. Note that other than the presence of the nozzle the combustors are identical.
Figure 4.27 shows that exhaust temperatures for the confined combustor are higher than
for the unconfined combustor over the entire extinction regime, the difference in
temperature decreases as the mixture is made fuel rich. Note that Figure 4.26 only shows
conditions where the extinction regimes for the confined and unconfined combustors
overlap. Recall from Section 3.1 that the nozzle is converged from the nozzle inlet cross
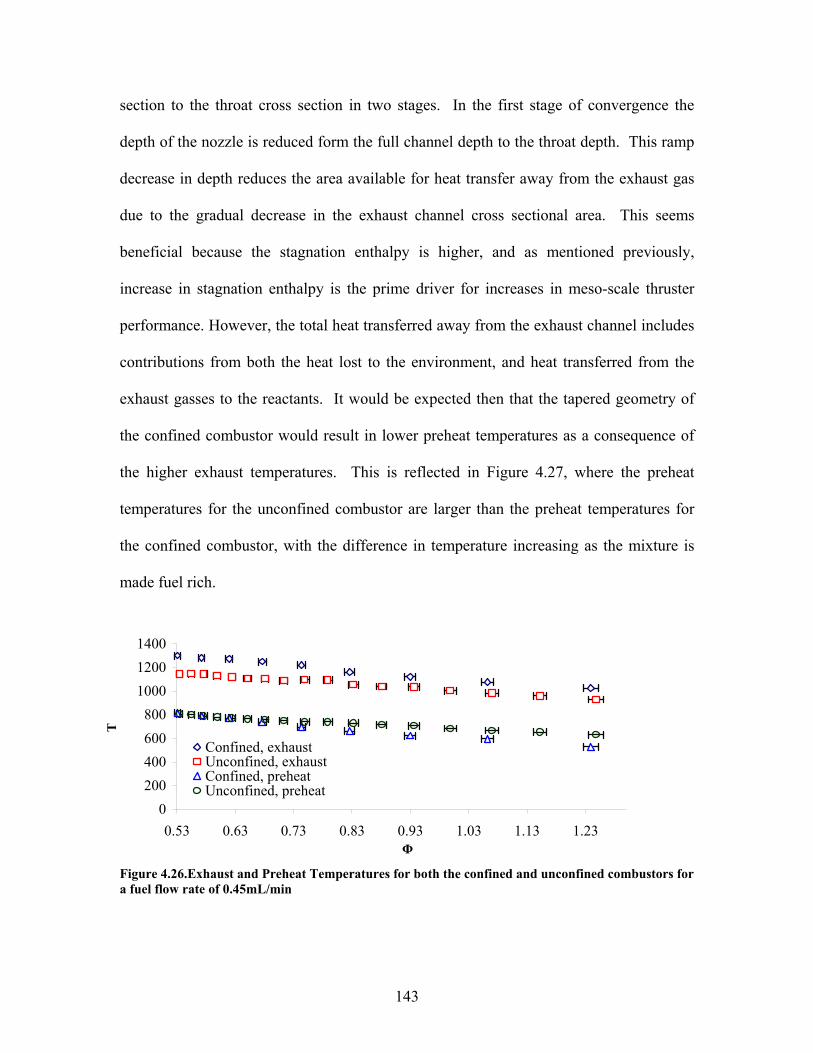
143
section to the throat cross section in two stages. In the first stage of convergence the
depth of the nozzle is reduced form the full channel depth to the throat depth. This ramp
decrease in depth reduces the area available for heat transfer away from the exhaust gas
due to the gradual decrease in the exhaust channel cross sectional area. This seems
beneficial because the stagnation enthalpy is higher, and as mentioned previously,
increase in stagnation enthalpy is the prime driver for increases in meso-scale thruster
performance. However, the total heat transferred away from the exhaust channel includes
contributions from both the heat lost to the environment, and heat transferred from the
exhaust gasses to the reactants. It would be expected then that the tapered geometry of
the confined combustor would result in lower preheat temperatures as a consequence of
the higher exhaust temperatures. This is reflected in Figure 4.27, where the preheat
temperatures for the unconfined combustor are larger than the preheat temperatures for
the confined combustor, with the difference in temperature increasing as the mixture is
made fuel rich.
0
200
400
600
800
1000
1200
1400
0.53 0.63 0.73 0.83 0.93 1.03 1.13 1.23Φ
T
Confined, exhaustUnconfined, exhaustConfined, preheatUnconfined, preheat
Figure 4.26.Exhaust and Preheat Temperatures for both the confined and unconfined combustors for a fuel flow rate of 0.45mL/min

144
Figure 4.27 shows the preheat-temperatures for the confined and unconfined combustor;
however, the regime is extended to the rich extinction limit for the unconfined
combustor.
0100200300400500600700800900
0.53 1.03 1.53 2.03 2.53 3.03 3.53 4.03
Φ
Tem
per
atu
re [
C]
Confined
Unconfined
Figure 4.27. Preheat temperatures for the confined and unconfined combustors for a fuel flow rate of 0.45mL/min
Figure 4.27 suggests that the rich extinction criteria can be pinned to certain
preheat temperature, which is then independent of the channel geometry. For a fuel flow
rate of 0.45mL/min this appears to be ~490°C. Note that the auto ignition temperature for
methanol is 470°C. In this case the rich extinction (low Re) limit could be identified by
the point where the hot oxidizer is no longer able to auto-ignite the freshly vaporized fuel.
Since at higher fuel flow rates more heat is required to raise the fuel temperature to the
auto-ignition temperature an extinction criteria (Ecrit) can be defined by equating the
enthalpy flow rate of the oxidizer to the enthalpy flow rate of the fuel. Solving for the
fuel temperature and then normalizing by the auto-ignition temperature of the fuel, as per
Equation 4.8, if Eq. 4.8 is less than one the flame will become extinct, because the fuel
temperature will be less than the auto-ignition temperature.

145
AIfuelpfuel
poxpoxcrit TCm
TCmE
,
,
Eq. 4.8
Figure 16 shows the extinction criteria versus equivalence ratio for five different
methanol flow rates of: 0.45mL/min, 0.5mL/min, 0.55mL/min, 0.6mL/min, and
0.65mL/min. In Figure 7 the isobaric temperature dependent specific heats were obtained
from the NIST chemistry Web Book. 15 Figure 4.28 shows that for the five flow rates
presented extinction occurs within a narrow band around an extinction criteria of one
(Ecrit=1). The points where rich extinction occurs are marked with bold filled symbols.
0
0.5
1
1.5
2
2.5
0 0.5 1 1.5 2 2.5 3 3.5 4
Φ
Ecr
it
.45mL/min .5mL/min
.55mL/min .6mL/min
.65mL/min
Figure 4.28. Extinction criteria versus equivalence ratio for five methanol fuel flow rates for both the confined and unconfined combustor, the points where rich extinction occurs are marked with bold filled symbols. Figure 4.28 shows that for the non-premixed configuration described above and for a
prescribed set of inlet conditions, namely fuel and oxidizer mass flow rates; the preheat
temperature required to avoid extinction can be determined from Eq. 5.
Referring back to Figure 4.16, procedurally the experiment was conducted by
igniting a flame close to a global equivalence ratio of one and decreasing the oxidizer
No Combustion Ecrit<1
Combustion Ecrit>1
Critical Line for Extinction

146
flow rate until the flame became extinct. Figure 4.29 shows a generic extinction regime
for a non-premixed, non-soot producing combustor.
Figure 4.29. Generic extinction regime for a non-premixed, non-sooting combustor. The red arrow is the progress of the experiment from the ignition condition to the rich extinction limit. From Figure 4.29 as the fuel flow rate is increased the extinction limit tends towards
lower global equivalence ratios. This is because a larger oxidizer enthalpy (preheat
temperature) is required to ignite the larger amount of fuel. Since the temperature is
provided via pre-heating of the oxidizer a higher flame temperature is required to provide
an adequate amount of heat transfer to the reactants, and hence the tendency is for the
rich extinction limit to decrease toward lower equivalence ratios (closer to one) as the
fuel flow rate is increased.
Section 3 Thermal Performance
The thermal performance of the combustor, both in the partially-premixed and
non-premixed modes has been determined based on computation of the enthalpy flow
rates. The measurements are taken primarily in the exhaust however upstream
measurements are taken at times to explain the experimental results. Thermal and
Ф
Fuel Flow Rate

147
performance efficiencies are determined and act as a base for comparison with the thrust
results that will be presented later in this report.
Partially-Premixed Combustion
Figure 4.30 shows the exhaust temperature versus equivalence ratio for three
different fuel flow rates .30mL/min, .25mL/min, and .20mL/min. The exhaust
temperature increases steadily in the fuel lean direction, this result is counterintuitive
since the flame temperature decreases in both the lean and rich directions peaking at close
to stoichiometry. This behavior is consistent with premixed heat recirculating
combustors discussed in Section 2.0, and can be explained through a first law analysis of
the exhaust channel, shown in Eq. 4.9, assuming the exhaust gasses enter the exhaust
channel at the flame temperature.
exhasutlosschflame CTQQCT )( Eq.4.9
The combined rate of heat transfer from the exhaust channel can be calculated from Eq.
4.9 and is shown versus equivalence ratio for a methanol flow rate of .30mL/min in
Figure 4.31, along with the variation in heat capacity rate with equivalence ratio for the
same data set. The combined rate of heat transfer is calculated as the sum of both the heat
transfer from hot to cold flow and the heat lost from the exhaust channel.

148
0.00
200.00
400.00
600.00
800.00
1000.00
1200.00
0.00 0.50 1.00 1.50 2.00 2.50
Φ
T [
K]
.30mL/min .25mL/min .35mL/min
Figure 4.30.Variation of exhaust temperature with equivalence ratio for three methanol flow rates
0102030405060708090
100
0.40 0.60 0.80 1.00 1.20 1.40 1.60 1.80
Φ
Ove
rall
Hea
t tra
nsfe
r R
ate
[W]
0
0.01
0.02
0.03
0.04
0.05
0.06
0.07
0.08
Hea
t Cap
acity
Rat
e [W
/K]
Figure 4.31.Variation in combined heat loss rate and heat capacity rate from the exhaust channel for a methanol flow rate of .3mL/min
In Figure 4.31, as the equivalence ratio is decreased the combined heat transfer rate away
from the exhaust gas increases from 44W at the rich extinction limit to a maximum of
86W close to stoichiometry and then decreases as the mixture is made fuel lean. The heat
capacity rate increases monotonically over the same regime, and continues increasing in
the lean direction. This means that as the equivalence ratio decreases more substantial
rates of heat transfer away from the exhaust gasses would be required to induce the same
drop in gas temperature that would be experienced at either the rich or stoichiometric
conditions. However, the net heat transfer rate away from the channel decreases with

149
equivalence ratio in the lean direction, causing the temperature drop across the exhaust
channel to decrease as well (temperature drop being defined as the difference between the
flame temperature and the exhaust temperature). This allows the exhaust temperature to
increase as the mixture is made fuel lean even if the flame temperature is decreasing.
The exhaust channel temperature drop is shown in Figure 4.32 and is calculated as the
ratio of the overall heat transfer rate and the heat capacity rate.
0
500
1000
1500
2000
0.40 0.60 0.80 1.00 1.20 1.40 1.60 1.80Φ
Tem
pera
ure
Dro
p [K
]
Figure 4.32.Temperature drop across the exhaust channel The output power, calculated as the product of the heat capacity rate and the exhaust
temperature is shown in Figure 4.33 for three different methanol flow rates. The output
power increases continuously in the lean direction due to the increase in input heat with
decrease in equivalence ratio and relatively constant efficiency with variation in Φ
(discussed below). Figure 4.34 shows the overall heat loss, calculated as the difference
between the heat input and the heat output with equivalence ratio for the same fuel flow
rates. The overall heat loss through the combustor walls also increases with decrease in
equivalence ratio. For the same equivalence ratio both the output power and heat loss are
larger at higher fuel flow rates.

150
0
10
20
30
40
50
60
70
80
90
0.00 0.50 1.00 1.50 2.00 2.50
Φ
Out
put P
ower
[W
]
.30mL/min .25mL/min .35mL/min
Figure 4.33. Heat output for three different flow rates versus equivalence ratio
0.00
50.00
100.00
150.00
200.00
0.00 0.50 1.00 1.50 2.00 2.50
Φ
Obv
eral
l Hea
t Los
s [W
]
.30mL/min .25mL/min .35mL/min
Figure 4.34.Overall heat loss for three different flow rates versus equivalence ratio
Due to the overwhelming effect of the heat capacity rate over the rate of heat loss
from the exhaust channel the ratio of the overall heat loss from the combustor to the heat
input is minimized at fuel lean conditions and maximized at fuel rich conditions, this is
shown in Figure 4.35 for three different fuel flow rates. This behavior is somewhat
consistent with the performance of heat recirculating combustors burning mixtures with
air.16 However, the variation in efficiency with equivalence ratio is not as dramatic since
the heat input increases with decreasing equivalence ratio because production of the
oxidizer (steam + oxygen) releases heat into the system. Consequently, the efficiency

151
varies only 3% from minimum to maximum compared to over 30% for mixtures with air
over similar equivalence ratio regimes. 16
0
0.1
0.2
0.3
0.4
0.5
0.6
0.7
0.8
0.00 0.50 1.00 1.50 2.00 2.50Φ
Hea
t Los
s/H
eat I
nput
.30mL/min .25mL/min .35mL/min
Figure 4.35. Heat loss/Heat input, and overall heat loss from the combustor for three different fuel flow rates Figure 4.36 shows the overall heat loss along with the fraction of the input heat
associated with the oxidizer for a fuel flow rate of .30mL/min.
0.0020.0040.0060.0080.00
100.00120.00140.00160.00180.00
0.00 0.50 1.00 1.50 2.00
Φ
Hea
t Los
s [W
]
0
0.1
0.2
0.3
0.4
0.5
0.6
0.7
0.8
Fra
ctio
n of
Hea
t Inp
ut
Ass
ocia
ted
wit
h O
xidi
zer
Figure 4.36.Overall heat loss and the fraction of heat input associated with the oxidizer for a fuel flow rate of .3mL/min. Note that the inflection in the heat loss occurs because of a change in the flow controller

152
Since the input heat is determined based on complete consumption of the limiting
reactant the fraction of the heat input associated with the oxidizer is roughly constant in
rich conditions since the amount of fuel consumed increases with decreasing equivalence
ratio, offsetting the increase in oxidizer heat. In the lean regime the heat contribution
from the oxidizer source increases substantially, owing to a fixed heat release rate from
the fuel. This offsets the larger overall heat losses to the ambient experienced in the lean
regime, causing the ratio of heat loss/heat input to remain relatively constant. The ratio
of the output to input power is subject to the same effect and is shown in Figure 4.37 with
efficiencies as high as 34% at the lean extinction limit with a variation of 7% over the
entire regime tested.
0
0.05
0.1
0.15
0.2
0.25
0.3
0.35
0.4
0.00 0.50 1.00 1.50 2.00 2.50
Φ
Hea
t Out
put/H
eat I
nput
Figure 4.37. Heat output/Heat input for three fuel flow rates
Since this investigation is centered on the use of the heat recirculating combustor
in a propulsion device. The thermal performance is measured based on the specific
impulse and characteristic velocity efficiency (ηC* and ηIsp, respectively) of the
combustor. The efficiencies are defined as the ratio of the calculated value based on the
measured exhaust temperature and the adiabatic flame temperature for the same

153
conditions. The characteristic velocity and specific impulse are related to the enthalpy of
the product gas and is therefore dependent on gas properties, such as specific heat.
However, since the gas properties used in the calculation of both C* and Isp are based on
chemical equilibrium of the product gasses they are the same for both the experimental
conditions and the adiabatic conditions. Hence the ratio of experimental C* and Isp and
adiabatic C* and Isp is independent of gas properties. Equation 4.10 shows the
relationship used to calculate the efficiencies. Both the efficiencies and the exhaust
temperature are shown in Figure 4.38, for varying mixture ratio and four different fuel
flow rates.
adsp T
TIC exp* Eq.4.10
0.00
0.10
0.20
0.30
0.40
0.50
0.60
0.70
0.80
0.90
1.00
0.00 1.00 2.00 3.00 4.00 5.00 6.00 7.00 8.00 9.00
ηIsp
, ηC
*
O/F Mixture Ratio
.35mL/min
.30mL/min
.40mL/min
.45mL/min

154
0.00
200.00
400.00
600.00
800.00
1000.00
1200.00
1400.00
1600.00
0.00 1.00 2.00 3.00 4.00 5.00 6.00 7.00 8.00 9.00
O/F Mixture Ratio
T [
K]
.35mL/min
.30mL/min
.40mL/min
.45mL/min
Figure 4.38.Thermal performance of the heat recirculating combustor. Top: C* and Isp efficiencies, Bottom: exhaust temperature.
Figure 4.38 shows that the maximum efficiencies are found at the fuel lean
extinction limit for all four fuel flow rates, and the minimum at stoichiometric conditions
with the overall range between ~60% and ~90%. Figure 4.38 also shows that the exhaust
temperatures increase monotonically as the mixture is made fuel lean. Since the product
gasses undergo heat exchange with the reactants and heat loss to the combustor material
before exiting the combustor, the exhaust temperature is related to both the rate of heat
loss from the product gas, its temperature as it exits the combustion chamber, and its heat
capacity rate (the product of the total mass flow rate and the specific heat capacity). The
flame temperature decreases as the mixture is made fuel lean while the heat capacity rate
increases. Because of the latter the energy content (enthalpy flow rate in watts) is much
larger at lean conditions because of the larger mass flow rate, and the heat exchanger
cannot provide a means to lose that energy. This allows the temperature to increase as the
mixture is made fuel lean despite the drop in flame temperature. For this reason, at a

155
particular fuel flow rate, the efficiencies are largest at the fuel lean limits, and at the
maximum the exhaust temperature is 83% of the adiabatic flame temperature.
The characteristics of the thermal performance: the monotonic increase in
temperature with decrease in equivalence ratio and performance regimes that are flat with
respect to equivalence ratio are the same for both the partially-premixed combustor and
non-premixed combustor. The specific performance results are presented below for the
non-premixed combustor burning methanol/steam/oxygen and kerosene/steam/oxygen.
The thermal efficiency of the non-premixed combustor is shown in Figure 4.39.
As in Figure 4.38, the efficiencies are reported in terms of Isp and C* efficiency as per
Eq. 4.10. The thermal efficiency of the partially premixed combustor for the same fuel
flow rate (0.45mL/min) is also shown for comparison.
00.10.20.30.40.50.60.70.80.9
1
0.3 0.8 1.3 1.8 2.3 2.8 3.3 3.8
Φ
ηIsp
, ηC
*
.45mL/min Non-Premixed
.45mL/min Partially Premixed
Figure 4.39.Thermal efficiencies of partially premixed and non-premixed combustor
Overall, the partially-premixed and non-premixed combustors demonstrate similar trends
in thermal efficiency with minimums in the slightly fuel rich regime and maximums close
to the fuel lean limit. The maximum efficiency is found at the lean extinction limit with a
1.4% variation in efficiency between the two combustors. The jump in efficiency in the

156
partially premixed case at Φ=1.5 is an artifact of the experimental facility since the flow
controllers were changed at this point to accommodate higher flow rates. Additionally,
Figure 4.39 shows that the combustor is able to support a flame in the combustion
chamber over a much broader range of equivalence ratio, since in the non-premixed case
the flashback mechanism of flame extinction is irrelevant.
As mentioned previously, changing the ignition hardware from Kanthal wire
electrodes that protrude into the chamber to flush mounted SiC igniters has a marked
effect on stability, eliminating the FREI instability present in the methanol combustor. It
is interesting to note that the change in ignition hardware comes with a change a variation
in the thermal performance and global flame structure as well. Global flame images of
the partially-premixed and non-premixed combustor also show notable differences in
flame location and shape. Figure 4.40 shows flame images of the partially premixed and
non-premixed combustors at roughly the same global equivalence ratio (Φ=1.0 and
Φ=1.15, respectively), and subsequent images of the non-premixed combustor at
equivalence ratios of Φ=0.83 and Φ=0.68. Although the flame surface is not explicitly
visible in any of the images the high luminosity from the walls in the partially-premixed
combustor just left of center in the combustion chamber suggests a localized reaction
zone at that location. The wall luminosity in the non-premixed combustor is more
uniform and suggests a broader reaction zone. In the non-premixed combustor as the
global equivalence ratio is decreased at constant fuel flow rate the flame appears to be
pushed further away from the combustor inlet. This is made apparent by the glowing of
the downstream ignition wire and product gas thermocouple.

157
Non-Premixed
Partially-Premixed
Possible Reaction Zone Location
Φ=1.15 Φ=.83 Φ=.68
Kanthal Wire Igniters
Thermocouple
Φ=1.0
Non-Premixed
Partially-Premixed
Possible Reaction Zone Location
Φ=1.15 Φ=.83 Φ=.68
Kanthal Wire Igniters
Thermocouple
Φ=1.0
Ignition Wire
Non-Premixed
Partially-Premixed
Possible Reaction Zone Location
Φ=1.15 Φ=.83 Φ=.68
Kanthal Wire Igniters
Thermocouple
Φ=1.0
Non-Premixed
Partially-Premixed
Possible Reaction Zone Location
Φ=1.15 Φ=.83 Φ=.68
Kanthal Wire Igniters
Thermocouple
Φ=1.0
Ignition Wire
Non-Premixed
Partially-Premixed
Possible Reaction Zone Location
Φ=1.15 Φ=.83 Φ=.68
Kanthal Wire Igniters
Thermocouple
Φ=1.0
Non-Premixed
Partially-Premixed
Possible Reaction Zone Location
Φ=1.15 Φ=.83 Φ=.68
Kanthal Wire Igniters
Thermocouple
Φ=1.0
Ignition Wire
Figure 4.40. Flame images of the partially-premixed and non-premixed combustor. The bottom right-most image shows a partially-premixed propane air flame that appears to be stabilized on the upstream ignition wire.
Note that the size of the Kanthal ignition wires (1/64 in. diameter) is significant
compared to width of the combustion chamber, and at Φ=0.83 and Φ=0.68 it appears that
the flame may be stabilized on the downstream ignition wire and the product gas
thermocouple. In order to test this, a second variation of the non-premixed combustor
was fabricated without the product gas thermocouple and with Silicon Carbide (SiC)
igniters that are flush mounted with the bottom of the combustor, so that nothing is
protruding into the combustion chamber. Figure 4.41 shows the flame images for the
non-premixed combustor with flush mounted SiC igniters.

158
Φ=1.15 Φ=.83 Φ=.68
SiCIgniter
Φ=1.15 Φ=.83 Φ=.68
SiCIgniter
Figure 4.41. Flame images with SiC igniters
Based on the wall luminosity the non-premixed combustor with SiC igniters also
shows a broad reaction zone as compared to the partially-premixed case, with regions of
higher luminosity close to the exit of the chamber. What is notable is that changing the
ignition scheme changes the dynamics of the flame in several ways. First, the reaction
front does not move away from the fuel injector as the equivalence ratio is decreased.
Second, the combustion with the wire igniters is very loud, with high pitched acoustics
over the entire extinction regime which is accompanied by motion of the flame inside the
combustion chamber as seen from high speed cinematography (at 200fps). Over the same
conditions, the combustor with the flush mounted SiC igniters is silent with no apparent
flame motion; this is accompanied by higher exhaust temperatures than the combustor
with wire igniters. Finally, the combustor with SiC igniters does not demonstrate any
FREI behavior. The exhaust temperatures and thermal efficiencies of the non-premixed
wire igniter combustor and non-premixed SiC igniter combustor are shown in Figure
4.42, for a methanol flow rate of 0.45mL/min.

159
0
200
400
600
800
1000
1200
1400
1600
0.57 0.67 0.77 0.87 0.97 1.07 1.17 1.27 1.37 1.47Φ
Exh
aust
Tem
pera
ture
[C
]
00.10.20.30.40.50.60.70.80.91
ηIsp
, ηC
*
Exhaust SiCExhaust KanthalEfficiency SiCEfficiency Kanthal
Figure 4.42. Exhaust temperatures and thermal efficiencies for the non-premixed combustor with Kanthal wire igniters and SiC igniters at a methanol flow rate of 0.45mL/min.
The efficiency of the non-premixed combustor with flush mounted SiC igniters is
on average 2.3% higher than the non-premixed combustor with Kanthal wire igniters
with a maximum efficiency difference of 3.2% at the lean extinction limit and a
minimum of 1.6% at Φ=1.37.
Figure 4.43 shows the exhaust temperatures and thermal efficiency for kerosene
combustion at a fuel flow rate of 0.2mL/min, along with methanol combustion at
0.45mL/min. The heat inputs, calculated as the product of the lower heating value (LHV)
and the fuel flow rate, are similar for the above kerosene and methanol cases at ~120W
and ~125W respectively. In order to apply Eq.4.10 to calculate the efficiency for
kerosene combustion, kerosene was modeled as C8H18.

160
0200400600800
100012001400160018002000
0.5 0.6 0.7 0.8 0.9 1 1.1 1.2 1.3 1.4
Φ
Tem
pera
ture
[C
]
00.10.20.30.40.50.60.70.80.91
ηIsp
, ηC
*
KeroseneMethanolMethanol EfficiencyKerosene Efficiency
Figure 4.43.Thermal performance of kerosene combustor with methanol for comparison
Figure 4.43 shows that both the exhaust temperatures and combustor thermal
efficiency for methanol and kerosene are similar, with maximum thermal efficiency of
approximately 88% occurring at the lean limit. It would appear from Figure 4.43 that
performance of the combustor at similar heat inputs with kerosene and methanol is nearly
identical, and in fact calculated estimates of the specific energy of the exhaust gas (CpT)
show that methanol has a higher specific energy (at the lean limit where the efficiency is
highest) than kerosene and is therefore more efficient in terms of mass consumption.
However, for small scale devices and micro-satellites in particular, propellant mass is not
the limiting factor especially considering that small satellites tend to piggyback on larger
satellites in launch fairings that are not stretched for mass (lifting capacity of the launch
vehicle) but are severely constrained in volume (available space in the launch fairing). 17
For this reason the volume specific energy (ρCpT) may be a more applicable measure of
performance, this is analogous to the density-impulse or ‘ρIsp’ sometimes used to
characterize rocket propellants and is a measure of how much volume of propellant is

161
required to produce a certain amount of thrust. Figure 4.44 shows the specific energy
and density impulse from experiments for methanol, kerosene, and adiabatic values for
hydrazine monopropellant and hydrazine/nitrogen tetroxide bi-propellant found in the
literature. The density impulse is calculated based on the exhaust temperature and
adiabatic equilibrium gas properties determined using CEA 18 assuming a 1 atm. chamber
pressure and expansion to vacuum. Additionally, the density impulse is calculated using
the density of the fuel and oxidizer at room temperature assuming the oxidizer originates
as 100% hydrogen peroxide.
0
1000000
2000000
3000000
4000000
5000000
6000000
0.6 0.7 0.8 0.9 1 1.1
Φ
J/K
g
Kerosene SpecificEnergyMethanol SpecificEnergy
100000
150000
200000
250000
300000
350000
400000
450000
500000
0.6 0.7 0.8 0.9 1 1.1Φ
Kg
/cu
.m-s
Kerosene
Methanol
Hydrazine/NTO
Monoprop.Hydrazine
Figure 4.44. Top: Specific energy and Bottom: Density impulse for methanol (.45mL/min) and kerosene (0.20mL/min)

162
The calculated density impulse of kerosene/steam/oxygen is maximum at slightly
fuel lean conditions (Φ =0.93) and 5.6% smaller than the adiabatic density impulse of bi-
propellant hydrazine/nitrogen tetroxide. However, heat losses from a meso-scale
hydrazine thrust chamber would lower that value considerably and bring it closer to the
experimental values reported above. Also, although the specific energies reported above
are high, they are applied to mass flow rates in the mg/sec range with maximum output
enthalpy flow rates of ~170W. In order to determine the performance characteristics of
the thrust chamber as a whole, an understanding of the nature of low Reynolds number
discharge through micro-nozzles is necessary. These inherent physical limitations
combine with the combustion efficiency to determine the overall efficiency of the
thruster.
Section 4 Discharge Through low Reynolds Number Nozzles
It is well known that discharge though small scale nozzles, particularly at low Re,
is adversely affected by boundary layer growth within the nozzle. The pioneering work
on understanding the structure of low Reynolds number nozzle flows was performed by
Rothe 19 who used electron beam measurements to study the internal flows of optically
accessible graphite nozzles with 2.5 and 5.0mm throat diameters operating at chamber
pressures of 0.15psia (55<Re<550) using room temperature nitrogen as the propellant.
By determining the temperature and density profiles in the nozzle it was inferred that the
ability of the nozzle to expand the flow diminishes with decrease in Reynolds number
because some of the kinetic energy of the flow is converted to heat through viscous
dissipation, causing the temperature to increase. Massier 20 investigated the variation in
discharge coefficient (Cd) between Reynolds numbers of 650-350,000 through a

163
0.5944in. throat diameter circular nozzle using room temperature Ar, N2, and He as
propellants, demonstrating discharge coefficients above 90% in this regime. Kuluva and
Hosack 21 investigated the discharge coefficients of 1mm. throat diameter circular nozzles
and determined that the ability of a nozzle to discharge decays rapidly at a Reynolds
number of roughly 500. This behavior was approximated analytically for an axis-
symmetric circular nozzle by solving for the discharge coefficient in terms of the
Reynolds number by using the concept of boundary layer displacement thickness.
Although a reasonable agreement was found between the analytical and experimental
data for axis-symmetric circular nozzles, extending the analysis to a two dimensional
rectangular nozzle, which is the preferred geometry for a micro-machined thruster, has
not been performed. Bayt et. al 22 studied the discharge characteristics of rectangular
MEMS machined nozzles with throat widths of 19-35μm using room temperature
nitrogen as a propellant. Again the coefficient of discharge was observed to decrease
substantially at Re<500. In this section the discharge characteristics were determined for
a low pressure (14.7psia<P0<20psia) converging nozzle for high temperature flows
resulting from the combustion of both methanol/oxygen, and methanol/steam/oxygen.
Since the nozzle discharges into atmospheric pressure all but the highest Reynolds
numbers tested are at subsonic conditions. In this case the calculation of the isentropic
mass flow rate involves determination of the flow Mach number. The Mach number was
calculated under the assumption of isentropic flow based on the pressure ratio and
exhaust gas properties determined through chemical equilibrium of the exhaust products
at the measured chamber pressure and temperature. Note that the gas temperature was
measured just upstream of the throat. Equation 4.11 shows the pressure ratio as a function

164
of the Mach number and ratio of specific heats.23 Equation 4.12 shows the isentropic
mass flow rate as a function of the chamber pressure, throat area, Mach number,
stagnation temperature and exhaust gas properties. 23
12
0
)2
11(
k
k
Mk
P
P Eq.4.11
)1(2
1
2
0
0 )2
11(
k
k
t Mk
MR
k
T
PAm Eq.4.12
The discharge coefficient is calculated based on the ratio of the measured mass flow rate
and the mass flow rate calculated as per Eqs. 4.11 and 4.12. The Reynolds number is
calculated based on the mass flow rate and the hydraulic diameter based on Equation
4.13.
P
m4Re Eq.4.13
Note than in Eq. 4.13 the viscosity is calculated based on the equilibrium gas composition
using the viscosity of the individual species, the mol fraction of the individual species,
and an interaction parameter. The calculation is performed automatically by the NASA-
Lewis Chemical Equilibrium with Applications (CEA) software. Initial experiments
were conducted with room temperature oxygen, in a similar fashion to experiments found
in the literature. This was done to ensure that the thrust chamber was behaving as
expected and isolate any leaks. Figure 4.45, shows the discharge coefficient as
determined from Equations 4.11 and 4.12 versus Reynolds number for the thrust chamber
for mixtures of both oxygen/methanol and steam/oxygen/methanol.

165
0
0.2
0.4
0.6
0.8
1
1.2
100.00 1000.00 10000.00
Re
Cd
or η
C*
Oxygen/Methanol
Oxygen 298K
Steam/Oxygen/Methanol
Figure 4.45. Discharge Coefficients versus Reynolds number for: oxygen, oxygen/methanol, and steam/oxygen/methanol. Note that the Re is on a logarithmic scale.
Figure 4.46, shows the discharge coefficient vs Reynolds number for the data
presented in Figure 4.45 along with historical data obtained from Rothe 19, Kuluva et al.21,
Messier et al. 20, and Bayt et al. 22. A correlating function, Equation 4.14, is also
presented that relates Cd to the Reynolds number. The correlation is valid with the range
40<Re<355000 for cold flows. A summary of the test conditions covered by the data is
shown in Table 4.1. The wide range of test conditions accounts for large variability in the
throat geometry, chamber pressure, stagnation temperature, ambient conditions, and
exhaust gas properties (specific heat ratio, gas viscosity, and exhaust gas molecular
weight). Note that in Figure 4.46, reacting flow cases are fit to the red line and cold flow
cases are fit to the green line.

166
Table 4.1: Summary of the Test Condition Covered in Figure 4.39
Author Throat
Characteristic Dimension/X-sect
Gas Stagnation Temp. [K]
Stagnation Pressure [Psia]
Baryt, R. et al.[21]
19-35μm/rectangular
Nitrogen 300 5-100
Kuluva, G.A et al. [20]
1mm/circular Argon, Helium 300 -
Rothe, D.E [18] .5-2.5mm/circular Nitrogen 300 -
Massier, P [19] .5944in/circular Argon, Nitrogen,
Helium 300 <14.7
This Study .0156in/rectangular
Oxygen Cold Gas, Methanol/Oxygen
combustion products, Methanol/Steam/oxygen
combustion products
298-2383 14.9-19.7
0.00
0.20
0.40
0.60
0.80
1.00
1.20
1.00 10.00 100.00 1000.00 10000.00 100000.00 1000000.00
Cd
Re
Bayt et. al 2001 [2] Kuluva et al. 1971 [3]Kuluva et al. 1971 [3] Messier et al. 1970 [4]Rothe 1971 [5] Oxygen 298KMethanol/Oxygen Oxygen 298KH2O2/Methanol
Figure 4.46. Discharge coefficient versus Reynolds number. Note that the x-axis is on a log scale.
(Re)
78.2(Re)75.833.1 204
LnLneCD For 40<Re<355000 Eq.4.14
Cold Flow, Eq.8
Reacting (hot) flow

167
Note that for the reacting flow cases, indicated by the red line, the discharge
coefficient decreases more rapidly as the throat Reynolds number is decreased. Discharge
coefficients as low as 0.69 occur at Reynolds numbers as high as 500. Whereas a
Reynolds number of ~100 is required to achieve the same discharge coefficient in cold
flow conditions. Note that the decay in discharge coefficient with decrease in Reynolds
number occurs because the large boundary layers effectively reduces the throat area,
thereby reducing the mass flow rate discharged at a particular chamber pressure.24 Since
the boundary layer displacement thickness is a function of the Reynolds number its
sensitivity to gas temperature and gas viscosity is different from the sensitivity of
Reynolds number to temperature. It would be expected then that increasing the gas
temperature would cause the discharge coefficient to remain low, even if the Reynolds
number is high. This effect was predicted by Louisos and Hitt25 in a numerical study who
found that larger gas temperatures led to thickening of the boundary layer for flows with
the same throat Reynolds number, however the effect was not confirmed experimentally.
The overall performance of a thruster in terms of impulse is related to the product of the
total mass flow rate through the nozzle and the exhaust gas velocity. The former is
directly dependent on the discharge coefficient and the latter is directly dependent on the
combustion efficiency. A tradeoff occurs at high temperatures and low Reynolds numbers
because increasing the combustion efficiency results in higher gas temperatures,
however, higher gas temperatures result in lower discharge coefficients. Since the
temperature of the gas at the throat section of the nozzle is not known a correlation for
the hot flow is not provided.

168
Section 5 Thrust Measurement
Steady State
Using the thrust stand described in Section 3.4 the thrust was measured for both
cold flow and hot flow conditions. The thrust force versus oxygen volumetric flow rate
for oxygen cold flow is shown in Figure 4.47 along with the theoretical results (shown in
blue). Since both the thrust and chamber pressures are stable in cold flow conditions
these measurements were used to re-validate the thrust stands performance and check for
leaks. Note that all the measurements presented are subsonic with the jet discharging into
the ambient lab conditions (static pressure of 1atm.).
0
5
10
15
20
25
30
35
40
45
0 2 4 6 8 10
Th
rust
mN
Oxygen L/min
Figure 4.47.Cold flow thrust measurements and theoretical prediction.
As in Figure 3.34 the measured thrust agrees favorably with the predicted values
with a slight over-prediction at low thrust levels due to characteristics of the calibration
discussed above. Unlike the results presented in Figure 3.34 the predicted thrust is
calculated as the product of the exit plane Mach number, the local sound speed, and the
measured mass flow rate in order to account for compressibility of the gas.
Theoretical Result

169
Unlike the cold flow measurements shown above hot flow measurements taken
with methanol/steam/oxygen are subject to combustion instabilities that contribute to
temporal variations in the thrust force. Figure 4.48, below shows the time history of the
thrust force for a methanol flow rate of 0.85mL/min and an equivalence ratio of 1.28.
0
5
10
15
20
25
0 5 10 15 20 25 30 35 40 45 50
Time-s
Th
rust
-mN
Figure 4.48. Time history of the thrust produced at a methanol flow rate of .85mL/min and an equivalence ratio of 1.28.
Spectral analysis through the Fast Fourier Transform was used to determine the
frequency and magnitude of the fluctuations in the thrust around the mean value. Figure
4.49 shows the fluctuating frequency versus the ratio of the fluctuations in the thrust to
the mean thrust for a methanol flow rate of 0.85mL/min and equivalence ratios of 2.81,
2.01, and 1.76.

170
Figure 4.49. Fluctuating thrust/Mean thrust for a methanol flow rate of .85mL/min and equivalence ratios of 2.81,2.01,1.76, at mean thrust levels of 9.24mN, 9.45mN and 13.40mN respectively.
Figure 4.49 shows that fluctuations in the thrust force drive the thrust stand at a
number of frequencies. Dominant frequencies include the thrust stand damped natural
frequency of approximately 15Hz and a secondary frequency of ~40Hz. As a percentage
of the mean thrust the ~40Hz fluctuations decrease from ~4.25% to ~2.10% in magnitude
as the mean thrust is increased (with simultaneous decrease in the equivalence ratio), with
a shift in the peak towards high frequencies. However, the percentage variation in the
thrust is smaller than the standard error in the thrust measurement and hence the
fluctuations in the thrust measurement are not considered substantial with respect to the
mean thrust level.
Since the thrust force, chamber pressure, and upstream fuel pressure were
acquires simultaneously the spectral components of the chamber and fuel pressure were
analyzed to determine if propellant delivery is the cause of the instability shown in Figure

171
4.49. Figure 4.50 shows the FFT of the thrust, chamber pressure, and upstream fuel
pressure for a methanol flow rate of .85mL/min and an equivalence ratio of 1.76.
Hz
0 10 20 30 40 500
2
4
6
8
10
12
14
16
0 10 20 30 40 500
0.05
0.1
0.15
0.2
0.25
0.3
0.35
0 10 20 30 40 500
0.05
0.1
0.15
0.2
0.25
0.3
0.35
0.4
0.45
0.5
10 20 30 400
0.05
0.1
0.15
0.2
0.25
0.3
0.35
0.4
0.45
0.5
Hz Hz
Thr
ust-
mN
Cha
mbe
r Pr
essu
re/1
0-P
sig
Fue
l Pre
ssur
e/10
-Psi
g
Hz
0 10 20 30 40 500
2
4
6
8
10
12
14
16
0 10 20 30 40 500
0.05
0.1
0.15
0.2
0.25
0.3
0.35
0 10 20 30 40 500
0.05
0.1
0.15
0.2
0.25
0.3
0.35
0.4
0.45
0.5
10 20 30 400
0.05
0.1
0.15
0.2
0.25
0.3
0.35
0.4
0.45
0.5
Hz Hz
Thr
ust-
mN
Cha
mbe
r Pr
essu
re/1
0-P
sig
Fue
l Pre
ssur
e/10
-Psi
g
0 10 20 30 40 500
2
4
6
8
10
12
14
16
0 10 20 30 40 500
0.05
0.1
0.15
0.2
0.25
0.3
0.35
0 10 20 30 40 500
0.05
0.1
0.15
0.2
0.25
0.3
0.35
0.4
0.45
0.5
10 20 30 400
0.05
0.1
0.15
0.2
0.25
0.3
0.35
0.4
0.45
0.5
Hz Hz
Thr
ust-
mN
Cha
mbe
r Pr
essu
re/1
0-P
sig
Fue
l Pre
ssur
e/10
-Psi
g
Figure 4.50. From left to right: FFT of thrust, chamber pressure, and fuel delivery pressure. The inset on the left most figure is a magnification or the thrust spectrum. The results suggest that fluctuations in the measurements of the chamber pressure and fuel delivery pressure are due to random signal noise and are not physical in nature.
Figure 4.50 shows the FFT results of the thrust, chamber pressure, and fuel
delivery pressure. Note that the pressures given are raw data and are equivalent to one
tenth of the actual pressure in psig. Figure 4.50 shows that the 40Hz fluctuation in the
thrust force, through well below the mean thrust value, are entirely uncorrelated to
fluctuations in the chamber pressure or fuel delivery pressure. Since the mass flow rates
are electronically controlled the variation in thrust force is likely caused by fluctuations
in the chamber temperature arising from a fluctuating heat release rate. Because the
fluctuations were small relative to the mean thrust value the cause of the fluctuations was
not investigated.

172
Figure 4.51, below shows the measured hot flow thrust for a methanol flow rate of
0.85mL/min and varying equivalence ratio, along with the values predicted from
isentropic theory assuming that the gas properties in the combustor are the equilibrium
gas properties at the measured chamber temperature and pressure (shown in blue). The
values presented are mean values of the thrust measurement.
0.00
5.00
10.00
15.00
20.00
25.00
30.00
1.00 1.50 2.00 2.50 3.00
Thr
ust
-mN
Equivalence Ratio
Figure 4.51. Thrust force versus equivalence ratio for methanol/steam/oxygen with a methanol flow rate of 0.85mL/min
In Figure 4.51 the maximum measured thrust is 24.71mN at an equivalence ratio
of 1.0. The monotonous increase in thrust with decrease in equivalence ratio is expected
since the combustor thermal performance increases monotonously as the mixture is made
fuel lean, see Fig.4.43 and Ref. 2. At low thrust levels the measured thrust is higher than
the theoretical result due to the calibration characteristics discussed previously. Since the
theoretical result is calculated based on the measured chamber temperature, chamber
pressure, and equilibrium gas properties it represents the thrust that would be produced
through an ideal nozzle. The close agreement between the isentropic result and the
experimental values indicates reasonable efficiency in the nozzles ability to convert the
Theoretical Result

173
stagnation enthalpy of the product gasses into thrust relative to the theoretical predictions
even at moderate chamber pressures (maximum chamber pressure of 19.16psia with an
average specific impulse efficiency of 91%).
The specific impulse efficiency, defined as the ratio of the delivered specific
impulse to the specific impulse predicted based on equilibrium at the adiabatic flame
temperature is shown in Figure 4.52, below. The thrust data is taken at a fuel flow rate of
0.85mL/min. Figure 4.52 also shows the specific impulse efficiency defined as the ratio
of the specific impulse based on chemical equilibrium at the measured chamber
temperature, and the specific impulse based on equilibrium at the adiabatic flame
temperature.
0.00
0.20
0.40
0.60
0.80
1.00
1.20
1.40
1.60
1.00 1.20 1.40 1.60 1.80 2.00 2.20 2.40 2.60 2.80 3.00
ηIs
p
Φ
Isp efficiency based on chamber temperature and chemical equilibrium
Isp efficiency based on thrust
Figure 4.52. Specific impulse efficiency based on both delivered thrust and chamber thermodynamics
Figure 4.52 shows the specific impulse efficiency for a fuel flow rate of
0.85mL/min and varying equivalence ratio (Φ). The agreement between the Isp
predictions based on the measured chamber temperature and equilibrium gas properties
and the Isp based on the measured thrust is acceptable within the error margins of the
thrust stand. The error being larger at higher equivalence ratios where the thrust output is

174
lower, see Fig. 3.31 and 3.34. The agreement suggests that the enthalpy of the
combustion products is close to the enthalpy of the combustion products if they were at
chemical equilibrium at the measured chamber temperature. This indicates that the
combustion efficiency is high and the low chamber temperatures are due to wall heat
losses and not incomplete combustion. Note also that the efficiency does not vary much
with equivalence ratio, this is due to the unique thermal characteristics of the heat
recirculating combustor where the chamber temperature increases monotonously from the
rich extinction limit to the lean extinction limit; this provides for a situation where the
thermal performance of the thruster is independent of equivalence ratio at constant fuel
flow rate. 2
Pulsed Performance
Pulsing measurements were taken with mixtures of methanol/oxygen. The
mean and transient qualities of the thrust and chamber pressure were measured during the
duration of the pulse and synchronized high speed video was taken to study the
evolutionary nature of the flame during the pulse. Figure 4.53 shows a time trace of the
one second pulse used in the experiments.

175
‐4
‐2
0
2
4
6
8
13 13.2 13.4 13.6 13.8 14 14.2 14.4 14.6 14.8 15
Volts
Time [s]
Figure 4.53.Trigger pulse used for the fuel and oxidizer solenoid valves.
Figure 4.53 shows the single square pulse used to trigger the solenoid valves, the
pulse is high for one second while the beginning of the rising edge and the end of the
trailing edge are separated by 1.08 seconds. The output power from the trigger is such
that the valves are active only when the voltage is high.
Figure 4.54 shows the results from a single oxygen/methanol pulse with an
oxidizer upstream pressure of 50psig and a fuel upstream pressure of 30psig. The
upstream pressures were iteratively tuned so that the fuel and oxidizer enter the
combustion chamber at approximately the same pressure.
Switch Bouncing

176
0
50
100
150
200
250
0
10
20
30
40
50
60
70
10 11 12 13 14 15 16 17 18 19 20
Thr
ust-
mN
Psi
a
Time -s
Chamber Pressure
Trigger
Thrust
Thrust Filtered
Figure 4.54. Characteristic methanol and oxygen thrust pulse, the difference between the rising edge of the pulse and the tign (the black line in the figure) is the ignition delay time
Figure 4.54 shows the trigger pulse, the raw thrust data, the filtered thrust data,
the chamber pressure and the ignition delay time. The peak thrust, indicated by the red
circle in the figure, occurs 250ms after ignition of the mixture and is 40% larger than the
mean thrust. Because the peak thrust is larger than the mean thrust the thrust stand
oscillates around the mean thrust at the thrust stand damped natural frequency. A digital
stop-band filter was used to filter out the natural frequencies of the system (Fig. 3.45); the
filtered result is shown in red. The result is a mean thrust of 147mN. Note that the
chamber pressure fluctuates mildly for the duration of the thrust. As was done with the
steady state results the flame dynamics were analyzed using a combination of high speed
video and spectral analysis of both the thrust force and associated pressures. Utilizing the
routine developed for tracking the approximate motion of the flame during FREI
instability the flame was tracked for a 320mN pulse with chamber pressure ~70psia.
Figure 4.55 along with the locations where the image intensity was tracked. In Figure
4.55 location 1 is the high speed video synchronization lamp, location 2 is the fuel
injection head, location 3 is the exit to the combustion volume, location 4 is the entrance
Chamber Pressure
Filtered Thrust Result
Raw Thrust Data
Trigger Pulse
tign

177
to the exhaust channel, location 5 is the middle of the exhaust channel, and location 6 is
the entrance to the nozzle.
0 100 200 300 400 500 6000
200
400
0 100 200 300 400 500 6000
200
400
0 100 200 300 400 500 6000
200
400
0 100 200 300 400 500 6000
200
400
0 100 200 300 400 500 6000
200
400
0 100 200 300 400 500 6000
200
400
1
2
3
4
5
6
0 100 200 300 400 500 6000
200
400
0 100 200 300 400 500 6000
200
400
0 100 200 300 400 500 6000
200
400
0 100 200 300 400 500 6000
200
400
0 100 200 300 400 500 6000
200
400
0 100 200 300 400 500 6000
200
400
1
2
3
4
5
6
Figure 4.55. Time series of image intensities at various locations inside the combustor. Location 1 is the high speed video synchronization lamp, location 2 is the fuel injection head, location 3 is the exit to the combustion volume, location 4 is the entrance to the exhaust channel, location 5 is the middle of the exhaust channel, and location 6 is the entrance to the nozzle.
In Figure 4.55 the trigger is clearly shown in the top most image labeled ‘1’. The
trigger duration is 1.0 sec. The image intensity at the injection head (labeled ‘2’) saturates
rapidly with a time delay of approximately equal to the ignition delay time, discussed
later. The fluctuating intensity prior to triggering the pulse is due to the ignition spark.
The bottom four plots, labeled 3-6 highlight the nature of the flame during the pulse. The
spike in intensity following the initiation of the trigger pulse is due to hard start and the

178
delay time prior to stabilization of the flame occurs approximately 150ms after initiation
of the pulse. The stabilization process is highly dynamic with the flame size oscillating
between locations 2 through 4, 2 through 5, and 2 through 6. FFT of the six plots shown
in Figure 4.55 along with the thrust force and chamber pressure show no correlation and
only minor harmonic fluctuations other than those induced by the thrust stand natural
frequency. Figure 4.56 shows the FFT of the thrust force.
0 5 10 15 20 25 30 35 40 45 500
20
40
60
80
100
120
140
160
180
0 5 10 15 20 25 30 35 40 45 50
0
5
10
15
20
25
30
35
Hz
Thr
ust-
mN
0 5 10 15 20 25 30 35 40 45 500
20
40
60
80
100
120
140
160
180
0 5 10 15 20 25 30 35 40 45 50
0
5
10
15
20
25
30
35
Hz
Thr
ust-
mN
Figure 4.56. FFT of the thrust force issued from the thruster at a mean chamber pressure of 70psia and a mean thrust force of 320mN
Figure 4.56 shows the spectral characteristics of the thrust force issued from the
combustor at a mean chamber pressure of 70psia and a mean thrust force of 320mN. Note
that minor fluctuations occur at ~5 and ~15Hz these correspond to the natural frequencies

179
of the thrust stand. A small peak at ~35Hz is also apparent however the amplitude is
<5mN which is less than 2% of the mean thrust level (see inset).
Note that the thrust overshoots the falling edge of the trigger pulse by ~170ms.
This value is relatively constant for all tested conditions and possibly represents the
amount of time required to burn down the fuel and oxidizer that remain in the lines
between the valve and combustor after the valve is closed. The ignition delay time was
determined through high speed cinematography of the flame during the pulse. The high
speed images of the ignition sequence are shown in Figure 4.57. The high speed video
frame rate is set to 100 Hz in order to synchronize the high speed video with the data
acquisition module. In the figure, the emissions from the combustor at t=0.00 and t=0.02
are due to the ignition spark.
Figure 4.57 shows the ignition sequence for the data set shown in Figure 4.54. The
ignition delay time (tign in the figure) is 70ms. The bottom rightmost image shows the
Figure 4.57. Ignition sequence, the white lamp below the combustor is the high speed synchronization lamp

180
ignition of the flame, note that the combustion is occurring in the combustion chamber, in
the exhaust channel, and slightly upstream of the combustion chamber as well. This
suggests fuel build up in the combustor leading to the explosive ignition and over
pressurization of the chamber. This hard start is responsible for the high peak in thrust
shown in Figure 4.54 prior to stabilization of the combustor at the mean thrust level.
Figure 4.58 shows the ignition sequence for the same condition taken at 1000Hz. In
image (A) the ignition kernel originates at the exit plane of the heat recuperator and
ignites accumulated mixture in the exhaust channel (image C). Burn-down of the
accumulated mixture occurs for ~.01 seconds prior to the flame stabilizing in the
combustion chamber (not shown in the Figure).

181
Figure 4.58. Ignition sequence taken at 1000HZ the ignition kernel originates at the heat recuperator and ignites the accumulated mixture downstream of the combustion chamber
Ignition Kernel
Ignition kernel originating at the exit from the heat recuperator
Ignition of mixture downstream of the combustion chamber
A B C D
E F G H

182
Pulse data was collected for a number of conditions. The results for those conditions
in terms of max thrust, mean thrust, response time, and overshoot times as a function
of pressure ratio (Pchamber/Pexhaust) are shown in Figure 4.59. Note that the response
time is the time difference between the peak trigger voltage and the peak thrust, and
the overshoot time is the time difference between the falling edge of the trigger and
the zero thrust level. In all cases the mean mixture ratio is near stoichiometric.
0
50
100
150
200
250
300
350
400
450
2.5 3 3.5 4 4.5 5
Pchamber/Pexhaust
Thrust‐m
N
0
0.05
0.1
0.15
0.2
0.25
0.3
Response and Overshoot Times ‐s
Mean Thrust mN Max Thrust mN
Response Time ‐s Overshoot Time ‐s
Figure 4.59. Mean and max thrust versus pressure ratio for the three tested conditions
Figure 4.59 shows that the max and mean thrust increase with pressure ratio
with a maximum of 317mN mean thrust and 411mN max thrust as a pressure ratio of
4.77. The difference between the max thrust and mean thrust increase with pressure
ratio, this is likely because the ignition delay time is relatively invariant with pressure
ratio (as determined from the high speed videos). This means that at high pressure
ratios a larger amount of fuel is discharged into the combustor prior to ignition,
resulting in larger spikes in thrust due to hard start. Overshoot times are relatively
constant with pressure ratio because the volume of fuel trapped in the lines after the

183
valve is closed does not depend on the pressure ratio of the combustor. Figure 4.60
shows the specific impulse, specific impulse efficiency, and the discharge coefficient
for the three pressure ratios shown in Figure 4.59.
0
0.2
0.4
0.6
0.8
1
1.2
1.4
1.6
0102030405060708090100
2.5 3 3.5 4 4.5 5
ηIs
p o
r C
f
Isp
-s
Pchamber/Pexhaust
Figure 4.60. Specific impulse, specific impulse efficiency, and thrust coefficient for methanol/oxygen at varying pressure ratio.
In Figures 4.59 and 4.60 the thrust, specific impulse, specific impulse efficiency, and
thrust coefficient peak at pressure ratio of 4.1 and decay in either direction. With
regards to calculating the specific impulse efficiency the adiabatic-equilibrium
specific impulse is determined based on the ratio of the measured specific impulse to
the sonic velocity at the throat calculated from the adiabatic flame temperature and
the equilibrium gas products. The maximum measured Isp efficiency is 83% at a
pressure ratio of 4.1. This value is consistent with the low pressure, low thrust, steady
state data presented in Fig. 4.52 However, the trend is inconsistent with ideal rocket
theory which suggests a direct relationship between chamber pressure and thrust at
constant mixture ratio. Likely performance losses could be attributed to incomplete
vaporization or low combustion efficiency at certain conditions. High speed images

184
of the flames at 100% methanol concentration for each pressure ratio are shown
below in Figure 4.61 along with their associated experimental conditions.
Figure 4.61. Characteristic images of the methanol/oxygen flame taken with high speed cinematography (100Hz) at three pressure ratios The flame images show the variation in the volume occupied by the visible
flame with variation in pressure ratio. At low and high pressure ratios the flame
occupies the combustion chamber, exhaust channel, and a portion of the inlet channel
with the largest flame at the lowers pressure ratio. This large flame volume suggests
that the combustion is incomplete, i.e insufficient chamber characteristic length (L*).
L* is related to the length of combustor required to vaporize, mix, and burn the fuel
and oxidizer. Hence the volume occupied by the flame and the L* should be related.
The minimum L* occurs at a pressure ratio of 4.1 concurrent with the maximum in
performance with regards to thrust, specific impulse, and both specific impulse
efficiency and thrust coefficient. The L* at this condition, which is calculated as ratio
of the volume of the combustor occupied by the flame (including the volume of the
heat recuperator) and the throat area, is 0.1170m.

185
Additional measurements were taken at lower heat loads by diluting the
methanol fuel with water. Thrust data for methanol water mixtures of 90%
methanol/10% water and 80% methanol/20% water were taken at varying pressure
ratio. The methanol-water mixtures were used to approximate the global
stoichiometry of superheated steam/oxygen/methanol since a high pressure on-
demand steam oxygen generator was not available. Additionally, the dilution of the
fuel with water results in a mixture that is less volatile, and consequently more
difficult to vaporize.
Figure 4.62 shows the thrust delivered versus pressure ratio for the 100%
methanol, 90% methanol, and 80% methanol conditions.
0
50
100
150
200
250
300
350
2.6 3.1 3.6 4.1 4.6 5.1PChamber/Patn
Th
rust
-mN
90%Methanol10%Water 100%Methanol 80%Methanol20%Water
Figure 4.62. Measured thrust levels versus chamber pressure for the three tested fuel/water blends. Figure 4.62 shows the measured thrust levels for three different fuel water
blends. For both the 100% methanol and 90% methanol blends the thrust increases
until the point of minimum L*, as discussed above, however in the 80% methanol
case the decrease in the thrust with increase in pressure ratio above the condition of
minimum L* is more substantial. It was determined during the course of the

186
experiments that the sharp decrease in performance is due to two phase losses that
occur because heat feedback from the flame is insufficient to pre-vaporize the fuel
that passes through the heat recuperator. Additionally, once the fuel leaves the
recuperator the residence time in the chamber is insufficient for vaporization and
combustion of the fuel. The liquid being ejected from the combustor can be seen in
the high speed images along with the diamond shock structure in the exhaust plume.
The presence of liquid was also seen on the underside of the thrust stand where the
stand impinges with the jet.
Figure 4.63. High speed (100Hz) flame images at Methanol volume fractions of 1.0,0.9,and 0.8. Note the presence of liquid in the exhaust jet (highlighted by the red square, and the presence of the exhaust plume shock structure. In the image the percentages are Methanol/Water vol/vol.
In Figure 4.63 the exhaust plume shock structure is indicated by the light and
dark regions of the plume in the bottom left and right insets. Additionally, the liquid

187
spray in the exhaust plume is highlighted by the red square in the bottom rightmost
image. It is inconclusive whether or not the liquid spray is methanol, water, or both.
Section 6: Experiments with Hydrogen Peroxide
Hydrogen peroxide experiments were conducted with three primary objectives
presented below arranged in descending order or importance:
Validation of the steam/oxygen/methanol or kerosene data presented
above via oxidizer inlet temperature matching, explained in more detail
below
Demonstration of combustion with hydrogen peroxide decomposition
products with a hydrocarbon fuel (preferably methanol or kerosene)
Thrust production, specific impulse, density impulse and combustion
efficiency measurement with hydrogen peroxide and a hydrocarbon fuel
As mentioned above the principle objective of the hydrogen peroxide experiments is
to validate the steam/oxygen/hydrocarbon experiments presented in earlier in this
report. To recall, these experiments were conducted by producing a steam oxygen
mixture upstream of the inlet channel to the combustor via a lean burning hydrogen-
oxygen flame. It is readily apparent that the heat release from a hydrogen oxygen
flame is much higher than the heat released by hydrogen peroxide decomposition, and
that this difference may produce unreliable results. In order to validate these results it
is necessary to match the inlet temperature to the combustion volume prior to ignition
with the superheated steam generator, with the inlet temperature prior to combustion
with hydrogen peroxide decomposition products. The rationale being that if the inlet
oxidizer streams are equivalent in mass flow rate and composition and the inlet

188
temperature to the combustion chamber is equal, then the same performance should
be expected between both the thrust chamber operating on steam and oxygen
produced from the hydrogen oxygen flame and the thrust chamber operating on steam
and oxygen produced from the decomposition of hydrogen peroxide.
Catalyst Placement
As mentioned in Section 1.0 the performance of a hydrogen peroxide catalyst
bed at the small scale is limited by the heat lost from hydrogen peroxide
decomposition to both the catalyst material and the liquid constituents of the inlet
hydrogen peroxide. In order to overcome this limitation the hydrogen peroxide
catalyst is integrated into the inlet channel of the combustor, the reason for this is
three fold:
First, the catalyst material will be insulated by the low thermal
conductivity base material of the combustor
Second, upon ignition the catalyst material will be heated by
the product gasses from the flame, alleviating the issues
associated with poor decomposition efficiency due to heat
losses from the catalyst bed
Third, integrating the catalyst bed into the combustor, as
opposed to placing it upstream, reduces the potential for re-
condensation of the steam upstream of the combustion volume
For the experiments that follow the catalyst bed is fabricated by compressing silver
swarth produced from the surface milling of a (.999) fine silver ingot into the inlet

189
channel of the combustor. A porous surface harderened alumina/zirconia blanket is
placed at the downstream end of the catalyst bed in order to prevent attrition of the
catalyst material. Further, the catalyst bed is instrumented with thermocouples at the
midpoint and at the exhaust. Additional thermocouples were placed at the preheat
location (inlet to the combustion chamber), the combustion volume exhaust, and the
combustion chamber exhaust.
As a note, hydrogen peroxide was produced in house at high concentrations
(>90%) via vacuum distillation of hydrogen peroxide of a lesser concentration (35%).
The distillation was performed in a rotary evaporation column. The hydrogen
peroxide was concentrated from 35% to 70% with a water bath temperature of 80C at
a pressure of 25inHg vacuum. The condensate recovered had 6% hydrogen peroxide
by mass remaining. A second round of distillation raised the concentration from 70%
to 96% and was conducted at a water bath temperature of 80C and a pressure of
29inHg vacuum. The condensate recovered was 50% hydrogen peroxide by mass.
Reducing the vacuum level to below 25inHg is crucial in the second round of
distillation in order to keep the hydrogen peroxide vapor below the detonation limits
and promote boiling of the water in solution below 90C, the temperature at which the
hydrogen peroxide liquid will auto-decompose. The concentrations were measured
by determining the refractive index using a handheld refractometer and relating the
refractive index (in percent Brix) to the density.
The hydrogen peroxide was fed into the catalyst bed through a passivated
Teflon syringe, stainless steel lines, and syringe pumps.

190
Immediate problems were encountered upon introduction of the hydrogen
peroxide into the catalytic reactor. Starting from a cold start the heat released by the
decomposition of the hydrogen peroxide was not capable of boiling off the
constituents of the initial solution of hydrogen peroxide and water, and the water that
is evolved as a consequence of decomposition. As mentioned in the background
section of this report the volatilization of the liquids present in the catalytic reactor is
key to achieving high product gas temperatures. Fig. 4.64, below shows the quasi-
steady state temperatures measured at the locations discussed above.
0
50
100
150
200
250
300
0 0.2 0.4 0.6 0.8 1 1.2 1.4 1.6 1.8 2
Hydrogen Peroxide Flow Rate [mL/min]
Temp (C) T1 [C
T2 [C
T3 [C]
T4 [C]
Figure 4.64. Thermocouple temperatures at various locations across the combustor versus hydrogen peroxide flow rate
The temperatures shown in Fig. 4.64 reveal some interesting qualities about
the evolutionary process of steam and oxygen in the combustor. Note that T1 is the
temperature in the center of the catalyst bed, T2 is the temperature at the exhaust of
the catalyst bed, T3 is the temperature at the inlet to the combustor (the preheat

191
temperature), and T4 is the temperature at the middle of the exhaust channel. Steady
state temperatures in the catalyst bed are greater then the boiling point of water for
the majority of the tested conditions. At the other locations substantially higher rates
of heat release were required to achieve gas phase steam in the inlet channel. It is
important to note that in the initial start up process a substantial amount of liquid is
absorbed by the porous alumina silicate combustor material. As the combustor heats
up the temperature increase is inhibited by the latent heat of vaporization of the stored
liquid. This is shown in the Figure by the regions on the plot where the temperature
does not increase with increase in the flow rate of hydrogen peroxide, despite there
being gas phase decomposition products in the inlet channel This is because any
extra heat liberated by the decomposition of more hydrogen peroxide is being used to
vaporize more stored water, instead of increasing the temperature of the gas.
Additionally, gas phase decomposition products at the combustion volume inlet (T3)
are not present until hydrogen peroxide flow rate of .55mL/min or higher, an
immediate consequence being that the stability regimes for methanol and kerosene
shown in previous sections can be truncated based on this value, since ignition from a
cold start would not be possible below .55mL/min of hydrogen peroxide.

192
Additionally, temperature increase in the combustion chamber is stable and
essentially linear once all the temperatures in the combustion chamber are larger than
the boiling point of water (above 1.0mL/min hydrogen peroxide). Note that the
experiment has to be prematurely terminated because the syringe volume was only
5.0mL, not enough to experience a steady state temperature at the highest flow rate.
In order to overcome this limitation the combustor was heated with a oxygen
methane flame prior to the introduction of hydrogen peroxide. Upon introduction of
the hydrogen peroxide the oxygen supply was shut off and the combustor was
allowed to cool to the steady state decomposition temperature of the hydrogen
peroxide. An attempt was made to stabilize the hydrogen peroxide methane flame,
but the hydrogen peroxide was delivered from the syringe in pulses preventing
stabilization of the flame. On this note delivering a stable flow of hydrogen peroxide
would require a pressure fed system. However, even slightly pressurizing the
hydrogen peroxide vessel would place the vapor present in the vessel well in the
detonation limits for hydrogen peroxide, whereby even slight catalysis (for example
contamination present in the pressure vessel) could lead to an explosion of the
hydrogen peroxide vapor. The detonation limits for hydrogen peroxide are shown in
Ref. 10.

193
Because the flame could not be stabilized with the syringe pump, and a
pressure fed system would require substantial safety consideration, combustion
experiments with hydrogen peroxide were not conducted.
Steady state decomposition temperatures for hydrogen peroxide
decomposition obtained via the method described above are shown in Fig. 4.65,
below.
0
100
200
300
400
500
600
0 50 100 150 200 250
Time ‐s
Temperature (C)
cat bed center
Preheat
Combustor Exit
Figure 4.65. Steady state temperature obtained by preheating the combustor and allowing it to cool with hydrogen peroxide flowing, the circle marks the point where the fuel and oxygen are shut off. In Fig. 4.65 the circle marks the location where the fuel and oxygen are shut
off and the hydrogen peroxide decomposes as the combustor cools. Prior to removing
the methane and oxygen the temperature in the catalyst bed and the preheat
temperature are higher than the temperature at which hydrogen peroxide thermally
decomposes, suggesting complete decomposition of the hydrogen peroxide, and
further indicating that when the flame is present, heat transfer to the catalyst bed is
high enough to promote efficient decomposition. Fig. 4.66 shows an image of the
combustor after the methane and oxygen have been removed and the decomposition

194
temperature is approaching steady state. Note the orange glow in the catalyst bed due
to the heat release from the hydrogen peroxide decomposition.
Figure 4.66. Combustor showing the decomposition of hydrogen peroxide after the methane and oxygen flame is removed. Note the orange glow in the catalyst bed due to the heat release from the hydrogen peroxide decomposition. It is important to note that the temperature at the inlet to the combustion
volume, labeled “preheat” temperature in Fig. 4.66, is ~200 C (approaching steady
state at close to 225 C), again the experiment was stopped when the 5.0mL syringe
was empty. This temperature is close to the temperature measured at the inlet to the
combustion volume when the steam and oxygen is produced by the lean burning
hydrogen oxygen flame presented earlier. The inlet temperatures versus the
combined flow rate of hydrogen and oxygen is shown in Fig. 4.67, below.

195
0
50
100
150
200
250
300
0.4 0.45 0.5 0.55 0.6 0.65 0.7
Total oxidizer flow rate [Kg/sec]
Tem
per
atu
re [
C]
Figure 4.67. Temperatures to the inlet of the combustion volume versus total oxidizer flow rate

196
Section 6 References
1 Ronney, P.D., “Analysis of Non-adiabatic Heat-recirculating Combustors,”
Combustion and Flame, Vol. 135, 2003, pp. 421-239
2 Vijayan, V. and Gupta, A.K., "Combustion and Heat Transfer at Meso Scale with
Thermal Energy Recirculation," 47 AIAA Aerospace Sciences Meeting, January 5-8,
2009.
3 Vijayan, V., and Gupta, A.K., “Effect of Channel Length on a Meso-Scale Spiral
Combustor Performance” 46th AIAA/ASME/SAE/ASEE Joint Propulsion Conference
and Exhibit. Nashville, TN. July. 25-28, 2010, Paper AIAA 2010-7065.
4 Oh, H., Huh, H., Ahn, J. and Ronney, Paul. “Effect of Scale on the Performance of
Heat-Recirculating Reactors”. 4th International Energy Conversion Engineering
Conference and Exhibit. San Diego, CA. June. 28-29, 2006.
5 http://www.princeton.edu/~combust/database/other.html
6 Liao, S.Y., Jiang, D.M., Huang, Z.H., Shen, W.D., and Yuan, Q, Chen., “Laminar
Burning Velocities for Mixtures of Methanol and Air at Elevated Temperatures,”
Energy Conversion and Management, Vol. 48, Issue 3, March 2007, pp.857-863

197
7 Saeed, Khizer., and Stone, C.R.,“Measurements of the Laminar Burning Velocity
for Mixtures of Methanol and Air from a Constant Volume Vessel Using a Multi
Zone Model,” Combustion and Flame, Vol. 139, Issue 1-2,Oct. 2004, pp.152-166.
8 Turns, Stephen. An Introduction to Combustion. 2nd ed., Boston, McGraw Hill,
2006.
9 Barnett, H.C., and Hibbard, R.R., “Basic Considerations in the Combustion of
Hydrocarbon Fuels,” NACA Report 1300, 1959.
10 Lewis, B. and Von Elbe, G. Combustion Flames and Explosions in Gases,
Academic Press, 1987.
11 Davu, D., Franco, R., Choudhuri, A., and Lewis, R., Investigation on Flashback
Propensity of Syngas Premixed Flames, 41st AIAA/ASME/SAE/ASEE Joint
Propulsion Conference and Exhibit, Tucson, Arizona, Paper No. AIAA‐2005‐3585.
12 Vijayan V, Gupta AK. Flame dynamics of a meso-scale heat recirculating
combustor. Appl Energy 2010;87:3718–28.
13 Ahn, J., Eastwood, C., Sitzki, L., and Ronney, P.D., “Gas Phase and Catalytic
Combustion in Heat Recirculating Burners,” Proceedings of the Combustion Institute,
Vol. 29, Issue 7, 2002, pp.957-963.

198
14 http://webbook.nist.gov/chemistry/
15 Vijayan, Vineeth., “Combustion and Heat Transfer in Meso-Scale Heat
Recirculating Combustors,”. PhD Dissertation, University of Maryland at College
Park. 2010
16 Osiander, Robert., Darrin, Garrison M. Ann., and Champion, John., MEMS and
Microstructures in Aerospace Applications,1st ed., CRC Press: Taylor and Francis
Group, New York, 2006.
17 http://www.grc.nasa.gov/WWW/CEAWeb/
18 Rothe, D.E. "Electron Beam Studies of Viscous Flow in Supersonic Nozzles."
AIAA Journal. 9.5 (1971): 804-811.
19 Massier, P, L Back, M Noel, and F Saheli. "Viscous Effects on Flow Coefficient
for a Supersonic Nozzle." AIAA Journal. 8.5 (1970): 605-607
2 Kuluva, G.A, and N.M Hosack. "Supersonic Nozzle Discharge Coeffiicients at Low
Reynolds Number." AIAA Journal. 9.9 (1971): 1876-1877.

199
21 Bayt, R, and K Bruer. "Systems Design and Performance of Hot and Cold
Supersonic Microjets." 39th AIAA Aerospace Sciences Meeting and Exhibit. 8-11
January, 2001. Reno, Nevada.
22 Sutton, G. Rocket Propulsion Elements. 7. New York: John Wiley and Sons, 2001.
23 Shirsat, V., Gupta, A.K. “Performance characteristics of methanol fuelled meso-
scale heat-recirculating combustors.” Applied Energy, Vol. 88, Issue 12, pp.5069-
5082.
24 Louisos, W., Hitt, D. "Viscous Effects in Performance of Two-Dimensional
Supersonic Linear Micronozzles." Journal of Spacecraft and Rockets, Vol. 45, Issue
4, 2008, pp. 706-15.

200
Chapter 5: Contributions and Recommendations for Future Work
The work presented in this thesis is a continuation of fundamental research
performed by Vijayan and Gupta, between 2006-2010. Their work was focused on
developing a fundamental understanding of the effects of basic combustor
characteristics on the combustor performance. These include: material thermal
conductivity, heat exchanger length, and the effect of inlet conditions (inlet Re and
Φ). This work focuses on the application of those fundamental insights towards the
development of a meso-scale bi-propellant thruster. These include the departure from
premixed gas phase combustion to partially-premixed and non-premixed combustion
of liquid fuels. The use of porous heat recuperation for the pre-vaporization of liquid
fuels. The development and analysis of a thrust stand with an accuracy of better than
1mN. An understanding of the characteristics of micro-nozzle flow at high
temperatures, and both the steady state and pulsing performance of the combustor.
Section 1 Mixing
Partially-premixed combustion
Partially premixed combustion was studied with mixtures of
methanol/superheated steam/oxygen. The steam oxygen mixture served as the
oxidizer and was tailored to act as a surrogate to fully decomposed hydrogen
peroxide. The effect of channel geometry on the performance of the combustor was

201
also studied in this phase. Conclusions from the partially premixed study can be
summarized as follows, note that many open ended questions remain with regards to
partially-premixed combustion, solutions to these questions were not pursued because
the flashback characteristics make the configuration non-viable from a practical
standpoint and the extinction regime of the non-premixed configuration is broader.
The extinction regimes are limited by blow-off at the lean combustion limit
and flashback at the rich combustion limit for mixtures with inlet steam/oxygen ratios
of 2:1 vol/vol. If the ratio of steam to oxygen is increased, representing the use of
hydrogen peroxide of less concentration, the stability limits are effected only slightly.
However, the nature of the rich extinction changes from flashback to blow-off. This
is because the flame velocity of the global mixture decreases substantially with any
increase in the steam volume fraction. The flame velocities and quenching distances
for mixtures of methanol/steam/oxygen have been predicted numerically using
Chemkin, calculations of the Damkholer number lend credence to the simulations,
however, the flame velocity and quenching distance calculations are not validated
with experiments.
Decreasing the channel aspect ratio allows for the stabilization of flames at
lower total mass flow rates and richer equivalence ratios due to suppression of
flashback at those conditions. The flashback likely occurs because of incomplete
mixing in the upstream channel allowing for nearly stoichiometric mixture in regions
of low channel velocity. Flashback may be suppressed a narrower channel widths
due to a number of reasons. First: the channel aspect ratio was decreased while
maintaining the inlet Reynolds number constant between combustor for the same inlet

202
conditions meaning that the channels were made both narrower and deeper.
Increasing the depth increases the area of the channel wall exposed to the ambient
increasing the heat-loss, decreasing the inlet temperature and leading to lower flame
velocities in the channel. Second: the narrower channel may suppress flashback by
quenching the flame.
All of the preheating occurs upstream of the fuel injection point, downstream
of which the temperature variation is minimal, this is due to the increase in heat
capacity rate downstream of the fuel injection point. If the mixing section of the inlet
channel were longer then the preheat temperature may increase due to larger amounts
of heat transfer from the products; however as discussed by Vijayan and Gupta, this
would come at the expense of lower exhaust enthalpy and is undesirable for
propulsion applications.
Non-Premixed Combustion
The non-premixed configuration was tested with both methanol/steam/oxygen
and kerosene/steam/oxygen. Extinction limits in the non-premixed configuration
burning methanol were limited by FREI instability and combustor failure at the lean
limit and insufficient inlet oxidizer enthalpy at the rich limit. It was found that rich
extinction could be predicted by estimating the amount of inlet enthalpy required for
auto-ignition of the fuel, an extinction criteria was formulated to predict rich
extinction based on this observation. FREI instability was observed in the globally
lean regime, this instability was eliminated by replacing the Kanthal wire igniters
with flush mounted silicon carbide igniters suggesting that the cause of the initial
extinction is hydrodynamic in nature.

203
Kerosene combustion was achieved in the non-premixed configuration with
excessive soot production observed at the rich limit and combustor failure at the lean
limit.
Thermal Performance
The thermal performance of both the partially-premixed and non-premixed
combustors was used to estimate the thruster performance and evaluate tradeoffs in
the combustor design. For combustion with methanol/steam/oxygen in both the
partially-premixed and non-premixed configuration the exhaust temperature increases
with decrease in the global equivalence ratio with increase in temperature with
increase in the heat input associated with the fuel. This occurs because the
experiment is conducted by decreasing the global equivalence ratio at constant fuel
flow rate, which comes with substantial increases in the mass throughput of the
combustor. Although the measured flame temperature decreases as the mixture is
made globally fuel lean the larger mass of product gasses contain more total enthalpy
and are unable to loose that heat as they exit through the exhaust channel. This leads
to a monotonic increase in the exhaust temperature with decrease in equivalence ratio.
Additionally, because the oxidizer is created via exothermic chemical reaction it
contributes to the heat released into the system. This means that the heat input to the
combustor increases as the mixture is made fuel lean, lowering the thermal efficiency
in the lean regime and resulting in a combustor whose efficiency is insensitive to
changes in the equivalence ratio.

204
Other Notable Characteristics
From a design standpoint achieving ignition in meso-combustors is a
challenging task. Traditionally, studies of minimum ignition energy are conducted in
an essentially infinite medium and heat losses to the combustor wall are not a
concern. However in the case of meso and micro-combustors a larger ignition energy
is required to successfully ignite the mixture. Additionally, because preheat is
required to stabilize the flame the ignition source must be of continuous operation
and high frequency to achieve successful ignition. During the course of the
experimentation the spark electrodes were also changed from Kanthal wires
protruding into the combustion chamber to silicon carbide ignition electrodes flush
mounted with the bottom of the combustion chamber. This had a notable effect on
the dynamics of the flame including the suppression of FREI instability and quieter
combustor operation. It was also observed that at certain conditions the flame seems
to stabilize on the wire igniters, this is not the case with the silicon carbide ignition
hardware.
Qualitatively operation in the partially-premixed mode resulted in a localized
hot spot in the combustion chamber which led to cracking of the combustor wall at
the lean extinction limit. This localization was eliminated by operating in the non-
premixed combustion mode where the combustion appears much more diffuse with
no visible flame or localized heating of the combustor material.

205
Section 3 Nozzle Discharge Characteristics
The effect of nozzle Reynolds number on discharge characteristics was
evaluated for nozzles of rectangular cross section in both cold and hot flow
conditions. A correlation is presented between discharge characteristics and Reynolds
number that includes new experimental data and historical data taken from the
literature. It was found that the variation in discharge coefficient with Reynolds
number is dependent on the gas temperature. With high temperature flows showing a
more rapid decrease in the discharge coefficient with decrease in the Reynolds
number.
Section 4 Thrust Measurement
A mN level thrust stand was developed for the measurement of low thrust
levels indirectly, without allowing the thruster to translate. The impulse balance used
a deflecting cantilever beam to measure the thrust force. The characteristics of this
measurement technique were evaluated and the potential sources of error discussed in
detail. The thrust balance was used to measure thrust in both the steady state and
pulsed modes.
Section 5 Thruster Performance
In the steady state the thruster demonstrated performance at low chamber
pressures and thrust levels between ~7mN and ~25mN. The thrust output is very well
matched with the theoretical predictions based on the measured chamber temperature,
chamber pressure, and equilibrium assumption for the same conditions. The
instability in the thrust measurement were filtered out from the natural frequencies of

206
the thrust stand and are shown to be minimal relative to the mean thrust level >4%
and are not correlated to fluctuations in the chamber pressure and fuel delivery
pressure. The specific impulse efficiency was determined both based on the
measured chamber conditions and assumption of chemical equilibrium and based on
the measured thrust and total weight flow rate. For the tested conditions the ratio of
the ideal to measured specific impulse efficiency is very high, which suggests that the
combustor efficiency is a consequence of wall heat losses and not incomplete
combustion. Additionally, the insensitivity of the thrust chamber performance with
equivalence ratio, which was predicted from the thermal performance, results is
materialized in the thrust measurements. The implication for propulsion system
design is that the flow control hardware used upstream of the thrust chamber does not
need to be as accurate since the thrust chamber can tolerate variations in equivalence
ratio without performance loss.
Section 6 Recommendations for Future Work
Upstream and Cold Flow and Nozzle Discharge Analysis
The work presented in this thesis has covered only the qualitative and
quantitative characteristics of combustion and thrust production in a meso-scale thrust
chamber. In order to determine if the results can be practically applied to a space
system, it is necessary to consider the losses upstream of the combustion chamber and
determine the performance gain that is provided by combustion, as compared to a
cold gas discharged at similar chamber pressure.
Because the combustion products are at high temperature the energy

207
dissipated by viscous losses in both the combustor and the nozzle amount to an
effective loss in stagnation pressure in the thrust chamber; for this reason the thrust
produced via combustion should be compared to a baseline value. A baseline value
may be established via the thrust produced by a cold flow thruster, the stagnation
pressure of which is equal to the inlet pressures/forces to the combustor arising from
both the injection of fuel and oxidizer. This would provide an assessment of the
benefit provided by bi-propellant combustion as compared to cold-gas for the same
thrust level and chamber pressure.
Furthermore, Figure 4.46 shows that at high temperatures the discharge
coefficient through the nozzle decreases faster with decrease in Reynolds number
compared to cold flow. The motivation behind bi-propellant combustion is to
increase the stagnation temperature of the exhaust products and hence increase the
combustor performance. However, increasing the stagnation temperature results in a
decrease in the discharge coefficient due to viscous losses across the throat, therefore,
there is a competition between increasing the enthalpy of the combustion products via
an increase in the stagnation temperature, and decreasing the performance of the
nozzle via an increase in the gas viscosity. This competition suggests that there is an
optimum temperature which thrust chamber should operate in order to maximize the
performance gain due to combustion for a particular throat Reynolds number. This
optimum might be found by determining by determining the relationship between
discharge coefficient and throat Reynolds numbers for fixed stagnation temperature
over a wide range of temperatures.

208
Fuel Injection
Successful combustion has been demonstrated at both high and low pressure
ratios via injection of fuel through a porous heat recuperator. The fuel is pressure fed
into the heat recuperator via a syringe pump at low pressure (<2atm. absolute) and a
blow-down tank at higher pressures (>2atm. absolute). Delivering low thrust at high
pressures is hampered by the fact that the fuel delivery would require an inlet nozzle
of unreasonably small diameter. Alternative fuel injection schemes such as
electrospray should be investigated as a means or fuel delivery at flow rates necessary
for low thrust levels <10mN.
Multi-Material Combustor
Targeted thermal control of micro-combustion and micro-power generation
systems is necessary to optimize fuel efficiency at the small scale. This applies to
both propulsion and micro-turbine systems, where the goal is to maximize the exhaust
enthalpy, and to Thermo-Photo voltaic (TPV) and Thermo-Electric (TE) power
generation systems, where designed in heat-losses direct the thermal energy away
from the gas and towards the TPV or TE material.
Currently, the highest energy densities delivered by meso-scale liquid fueled
combustors has been achieved by utilizing spiral countercurrent heat exchangers
which are wrapped around the combustor in order to preheat reactants through
structural conduction. Combating the adverse effects of heat loss from the combustion
zone. These first generation of combustors utilized monolithic low thermal
conductivity ceramic bodies, which while preventing heat loss from the reaction zone,

209
were not optimized to maximize the heat transfer to the reactants. A schematic and
cross section of these combustors is shown in Figure 5.1.
Detailed computational studies have shown that utilizing low thermal
conductivity materials for the walls surrounding the combustion volume (those in
thermal contact with the flame) is necessary to stabilize the flame is sub-quenching
geometries. However if the same material is used for the entire combustor, as shown
in the figure above, two competing thermal pathways are established. The first is
across the channel, yielding productive heat transfer between the products and
reactants, and the second is perpendicular to the channel, yielding heat loss. The next
generation of spiral countercurrent meso-scale combustor should tilt the balance
towards productive heat transfer across the channel by using a mixture of both high
and low thermal conductivity materials. The proposed combustor is shown in Figure
5.2.
Figure 5.1. Traditional Swiss-Roll combustor
Combustion Zone
Product Gasses
Cold Reactants
Red Arrows indicate Directions of Heat loss
Green Arrows indicate directions of heat transfer to the

210
Through using a mixture of high thermal conductivity channel walls and low
thermal conductivity materials around the combustion zone and cold flow the
proposed configuration will maximize heat transfer to the reactants while minimizing
heat loss to the ambient. Using a mixture of materials enables a wide variety of
configurations that can be tailored to a specific need. For example, tailoring high
thermal conductivity walls to enable high preheat temperatures allows for ultra-lean
combustion and high mass throughputs which could be utilized in a micro-gas turbine
or propulsion, while the ultra low thermal conductivity material could simultaneously
keep surface temperatures within the range of compatibility with TE materials (on the
order of 300°C).
Figure 5.2. Mixed material combustor
The grey areas represent ultra-low thermal conductivity materials
Light blue areas represent high thermal conductivity metals

211
Integration of the Combustor with a Hydrogen Peroxide Catalyst Bed
In-order for the steam/oxygen/hydrocarbon combustors to become a viable
propulsion device they must be adapted for use with hydrogen peroxide. As
mentioned in Section 1.0 the performance of a hydrogen peroxide catalyst bed at the
small scale is limited by the heat lost from hydrogen peroxide decomposition to both
the catalyst material and the liquid constituents of the inlet hydrogen peroxide. It is
suggested that the hydrogen peroxide catalyst bed be integrated into the inlet channel
of the combustor, the reason for this is three fold:
First, the catalyst material will be insulated by the low thermal
conductivity base material of the combustor
Second, upon ignition the catalyst material will be heated by
the product gasses from the flame, alleviating the issues
associated with poor decomposition efficiency due to heat
losses from the catalyst bed
Third, integrating the catalyst bed into the combustor, as
opposed to placing it upstream, reduces the potential for re-
condensation of the steam upstream of the combustion volume
An image of the proposed combustor with integrated catalyst bed is shown in Figure
5.3.

212
Figure 5.3. Integrated hydrogen peroxide catalyst bed Swiss Roll combustor concept. The catalyst bed is integrated into the inlet channel of the combustor. Note that the top dimensions are in inches.
Further improvements must also be made into reducing the large heat up
period required prior to obtaining a hydrogen peroxide decomposition product gas
temperature suitable for combustion with a fuel in the heat recirculating combustor.
This may include mixing the hydrogen peroxide with a fuel, such as methanol, and
injecting it over the catalyst bed or employing homogenous catalysis.
Investigation into Alternative Oxidizers and Propellant Handling Systems
In large scale propulsion systems the propellant accounts for a large fraction
of the total propulsion system mass ~90%. However, in small scale systems the
fraction of the total mass associated with the propellant may be as low as ~30%. This
means that improving the thruster performance (Isp or ρIsp) may not lead to substantial
Diamond Post Catalyst Bed
Inlet Channel
Exhaust Channel
Combustion Volume

213
overall mass savings if the system static mass is not minimized as well. In this regard
using two liquid at room temperature propellants, such as hydrogen peroxide and
kerosene, would require two pumps, pump and valve control systems, valves, and all
the associated hardware in order to deliver the propellants at the required pressures
and flow rates. The large mass of all the ancillary equipment may outweigh the
benefits of using high Isp liquid bi-propellant systems. As an alternative, oxidizers
such as nitrous oxide which are readily liquefied and have a very high vapor pressure
at ambient conditions may be an attractive alternative. Novel design of the propellant
handling system may be employed to minimize the mass of the required hardware.
For example the high vapor pressure of the nitrous oxide may be used as both
oxidizer and fuel pressurant integrated into a single positive displacement tank.

214
Appendix A:
Nomenclature
d Quenching distance mm
α Thermal diffusivity m2/s
Texp Experimental temperature °C
Tad Adiabatic flame temperature °C
C Heat capacity rate kJ/K-s
Tflame Flame temperature °C
Texhaust Exhaust temperature °C
Q Heat transfer rate Watts
lossQ Heat loss rate Watts
Δv Velocity Change m/s
C* Characteristic Velocity m/s
Φ Equivalence Ratio Unit less
AR Aspect Ratio Unit less
Vy ‘y’ Velocity m/s
SL Laminar Flame Speed m/s
ηC* C* Efficiency Unit less
Isp Specific Impulse s
ηIsp Isp Efficiency Unit less
Texp Experimental Temperature °C
Tad Adiabatic Flame Temperature °C

215
Cp Constant Pressure Specific Heat KJ/KgK
ρ Density Kg/m3
C* Characteristic Velocity m/s
SL Laminar Flame Speed m/s
Φ Equivalence Ratio Unit less
Ecrit Extinction Criteria Unit less
oxm Oxidizer Mass Flow Rate kg/sec
fm Fuel Mass Flow Rate kg/sec
Cp,ox Oxidizer Heat Capacity kJ/kgK
Cp,fuel Fuel Heat Capacity kJ/kgK
Tp Preheat Temperature °C
TAI Auto-ignition Temperature °C
Cd Discharge Coefficient Unit less
P Ambient Pressure Pa
P0 Stagnation Pressure Pa
k Specific Heat Ratio Unit less
M Mach Number Unit less
T0 Stagnation Temperature °C
R Specific Gas Constant J/kgK
m Total Mass Flow Rate kg/sec
μ Viscosity Pa-s
Re Reynolds Number Unit less
ηC* C* Efficiency Unit less

216
thC * C* Thermodynamic m/s
exp*C C* Experimental m/s
At Throat Area m2
veff Effective Exhaust Velocity m/s
LHV Lower Heating Value J/kg

217
Appendix B: Publications Shirsat, V., Gupta, A.K. “Theoretical Performance and Efficiency of a Meso-Scale Thrust Chamber”. 50th AIAA Aerospace Sciences Meeting including the New Horizons Forum and Aerospace Exposition, Nashville, TN. Shirsat, V., Gupta, A.K.“Extinction, Discharge, and Thrust Characteristics of Methanol fueled Meso-Scale Thrust Chamber” Accepted for Publication in Applied Energy. Shirsat, V., Gupta, A.K.“A Review of Progress in Heat Recirculating Combustors” Review Article Applied Energy, Volume 88, Issue 12, December 2011, Pages 4294-4309 Shirsat, V., Gupta, A.K. “Performance characteristics of methanol fuelled meso-scale heat-recirculating combustors.” Applied Energy, Vol. 88, Issue 12, pp.5069-5082.

218
Bibliography
1Wertz, J. Reducing Space Mission Cost. Boston: Kluwer Academic Publishers,
1996.
2Bonafacio, S. “Analysis and Design of a Multi-phase Catalytic Reactor for the
Decomposition of Hydrogen Peroxide in Space Propulsive Systems”. PhD
Dissertation, Universita degli Studi di Napoli “Federico II”..Web. 2006
3Baker, A., Curiel, A., Schaffner, J., and Sweeting, M.""You can get there from
here”: Advanced Low Cost Propulsion Concepts for Small Satellites beyond LEO."
ACTA ASTRONAUTICA. 57. (2005): 288-301.
4Stokes, P.R. "Hydrogen Peroxide for Propulsion and Power." Science Museum of
London. London, Jan 14, 1998. Address.
5.Scharlemann. C., Schiebel., M, Marhold, K., Tajmar, M., Miotti, P., Kappenstain,
C., Batonneau, Y., Brahmi, R., “Development and Test of a Miniature Hydrogen
Peroxide Monopropellant Thruster”
6. Musker, A. Roberts, G., Ford, S., Reakes, E., Westbury, T. “Auto-Ignition of Fuels
Using Highly Stabilized Hydrogen Peroxide.”

219
7. Ventura, M.C. “Advancements in High Concentration Hydrogen Peroxide Catalyst
Beds.”
8. An, S., Lim, H. and Kwon, S., “Hydrogen Peroxide Thruster Module for
Microsatellites with Platinum Supported by Alumina as Catalyst”.
9. Zhou, X. Hitt, D.L. “One Dimensional Modeling of Catalyzed H2O2
Decomposition in Micro-Channel Flows”.
10. Schumb, Walter. “Hydrogen Peroxide”Reinhold Publishing Company New York,
New York. 1955
11. Fernandez-Pello, A.C, “Micro-Power Generation using Combustion: issues and
approaches” 29th Int. Symposium on Combustion, The Combustion Institute,
Pittsburgh, PA, 2002, pp. 1–45
12 Wu, M., Wang, Y., Yang, V., and Yetter, R.A., “Combustion in Meso-Scale Vortex
Chambers,” Proceedings of the Combustion Institute, Vol. 31, Issue 2, Jan. 2007,
pp.3235-3242.
13 Ahn, J., Eastwood, C., Sitzki, L., and Ronney, P.D., “Gas Phase and Catalytic
Combustion in Heat Recirculating Burners,” Proceedings of the Combustion
Institute, Vol. 29, Issue 7, 2002, pp.957-963.

220
14 Sher, I., Levinson-Sher, D., and Sher, E., “Miniaturization Limitations of HCCI
Internal Combustion Engines,” Applied Thermal Engineering, Vol. 29, Issues 2-3,
Feb. 2009, pp. 400-411.
15 Vijayan, V. and Gupta, A.K., "Combustion and Heat Transfer at Meso Scale with
Thermal Energy Recirculation," 47 AIAA Aerospace Sciences Meeting, January
5-8, 2009.
16 Kim, N., Aizumi, S., Yokomari, T., Kato., S., Fujimori, T. and Maruta, K.,
“Development and Scale Effects of Small Swiss Roll Combustors,” Proceedings
of the Combustion Institute, Vol. 31, 2007, pp. 3243-3250.
17 Jones, A.R., Lloyd, S.A., and Weinberg, F.J., “Combustion in Heat Exchangers,”
Proceedings of the Royal Society of London. Series A, Mathematical and Physical
Sciences, Vol. 60, 1978, pp.97-115.
Chapter 2
1Jacobson, S., and Epstien A. "An Informal Survey of Power MEMS." International
Symposium on Micro-Mechanical Engineering. Tsuchiura and Tsukuba, Japan,
December 1-3, 2003.
2 Ahmed, Mahabub., “Flame Dynamics of a Mesoscale Combustor,”. PhD
Dissertation, University of Texas at El Paso. 2008.

221
3 Wu, M-H., Wang, Y., Yang, V., and Yetter, R. A., “Combustion in Meso-Scale
Vortex Chambers,” Proceedings of the Combustion Institute, Vol. 31, Issue 2, Jan.
2007, pp.3235-3242.
4 Sitzki, L.,Borer, K., Schuster, E. and Ronney, P. "Combustion in Microscale Heat-
Recirculating Burners" Third Asia Pacific Conference on Combustion. Seoul, Korea,
June 24-27, 2001.
5 Sher, I., Levinson-Sher, D., and Sher, E., “Miniaturization limitations of HCCI
Internal Combustion Engines,” Applied Thermal Engineering, Vol. 29, Issues 2-3,
Feb. 2009, pp. 400-411.
6 Jones, A.R., Lloyd, S.A., and Weinberg, F.J., “Combustion in Heat Exchangers,”
Proceedings of the Royal Society of London. Series A, Mathematical and Physical
Sciences, Vol. 60, 1978, pp.97-115.
7Vijayan, V., Gupta, A.K., “Combustion and Heat Transfer at Meso-scale with
Thermal Energy Recirculation” 6th International Energy Conversion Engineering
Conference (IECEC). Cleveland, OH. July. 28-30, 2008.
8 Cho, J-H., Chien, S. L., Richards, C., D., Richards, R. F., Ahn, J., and Ronney, P,
D., “Demonstration of an External Combustion Micro-Heat Engine,” Proceedings of
the Combustion Institute, Vol. 32, 2009, pp.3099-3105.

222
9 Turns, S., An Introduction to Combustion. 2nd ed., McGraw Hill, Boston, 2006.
10 Vijayan, V., Gupta, A.K., “Experimental Investigation of a High Power Density
Ceramic Meso-scale Combustor ” 47th AIAA Aerospace Sciences Meeting including
The New Horizons Forum and Aerospace Exhibition. Orlando, FL. Jan. 5-8, 2009.
11 Vijayan, V. and Gupta, A.K., “Experimental Investigation of a Meso-scale Liquid
Fueled Combustor ” 45th AIAA/ASME/SAE/ASEE Joint Propulsion Conference and
Exhibit. Denver, CO. Aug. 2-5, 2009.
12 Oh, H., Huh, H., Ahn, J. and Ronney, Paul. “Effect of Scale on the Performance of
Heat-Recirculating Reactors”. 4th International Energy Conversion Engineering
Conference and Exhibit. San Diego, CA. June. 28-29, 2006.
13 Lee, M., Cho, S., Choi, B. and Kim N. “Scale and Material Effects on Flame
Characteristics in Small Heat Recirculation Combustors of a Counter-Current
Channel Type” Applied Thermal Engineering, Vol. 30, 2010, pp. 2227-2235.
14 Lee, M. and Kim N. “Experiment on the Effect of Pt-Catalyst on the Characteristics
of a Small Heat-Regenerative CH4-air Premixed Combustor” Applied Energy, Vol.
87, 2010, pp. 3409-3416.

223
15 Vijayan, V. and Gupta, A.K., “Effect of Channel Length on a Meso-Scale Spiral
Combustor Performance” 46th AIAA/ASME/SAE/ASEE Joint Propulsion Conference
and Exhibit. Nashville, TN. July. 25-28, 2010, Paper No. AIAA-2010-7065.
16 Kim, N., Kato, S., Kataoka, T., Yokomori, T., Maruyama, S., Fujimori, T., and
Maruta, K. “Flame Stabilization and Emission of Small Swiss-roll Combustors as
Heaters” Combustion and Flame, Vol. 141, 2005, pp.229-240.
17 Spadaccini, C.M., Zhang, X., Cadou, C. P., Miki, N., and Waitz, I. A.
"Development of a Catalytic Silicon Micro-Combustor for Hydrocarbon-Fueled
Power MEMS”, MEMS 2001, Las Vegas NV, Jan 2002
18 Vijayan, V., and Gupta, A.K., “Flame Dynamics of a Meso-scale Heat
Recirculating Combustor” 7th International Energy Conversion Engineering
Conference. Denver, CO. Aug. 2-5, 2009, Paper No. AIAA 2009-4604.
19Ahn, J., Eastwood, C., Sitzki, L., and Ronney, P. D., “Gas Phase and Catalytic
Combustion in Heat Recirculating Burners,” Proceedings of the Combustion Institute,
Vol. 29, Issue 7, 2002, pp.957-963.
20Vijayan, V., and Gupta, A.K., “Thermal Performance of a Meso-scale Heat
Regenerating Combustor” 7th International Energy Conversion Engineering
Conference. Denver, CO. Aug. 2-5, 2009.

224
21 Vijayan, V., and Gupta, A.K. “Thermal Performance of a Meso-scale Liquid
Fueled Combustor” Applied Energy, 2011.
22 Vijayan, V., and Gupta, A.K. “Flame Dynamics of a Meso-scale Heat Recirculating
Combustor” Applied Energy, Vol. 87, 2010, pp.3718-3728.
23 Jejurkar, S., and Mishra, D. “A Review of Recent Patents on Micro-Combustion
and Applications” Recent Patents in Engineering, Vol. 3, 2009, pp.194-209.
24 Epstein, A.H., Senturia, S.D., Waitz, I.A., Lang, J.H., Jaconson, S.A., Ehrich, F.F.,
Schmidt, M.A., Ananthasuresh, G.K., Spearing M.S., Breuer, K.S., Nagle, S.F.: US
Patent US20026392313B1, 2002.
25 Mehra, A., and Waitz, I. A, “Development of a Hydrogen Combustor for a
Microfabricated Gas Turbine Engine”, Solid State Sensor and Actuator Workshop,
Hilton Head, GA, 1998.
26 Vijayan, V., “Combustion and Heat Transfer in Meso-Scale Heat Recirculating
Combustors,”. PhD Dissertation, University of Maryland at College Park, 2010.
27 Youngner, D. W.: US patent US20026378292B1 (2002).

225
28Lewis, David., Janson, Siegfried., Cohen, Ronald., Antonsson, Erik. “Digital
MicroPropulsion” Sensors and Actuators A, Vol. 80, 2000, pp.143-154.
29 Masel, R.I., and Shannon, M.A.: US patent US20016193501B1, 2001.
30 London, A.P., Ayon, A.A, Epstien, A.H., Spearing, S.M., Harrison, T., Peles, Y.,
and Kerrebrock, J.L.. “Microfabrication of a High Pressure Bipropellant Rocket
Engine” Sensors and Actuators A, Vol. 92, 2001, pp. 351-357.
31 Yetter, R.A, Yang, V., Aksay, I.A and Dryer, F.L. Meso and Micro Scale
Propulsion Concepts for Small Spacecraft. Arlington VA. AFOSR. 2004. AFRL-SR-
AR-TR-05-0016,FA9260-01-1-0376.
32 Herrault, F., Crittenden, T., Yorish, S., Birdsell, E., Glezer, A., and Allen, M. G.
“A self-resonant MEMS-fabricated, Air-breathing engine” Solid-State Sensors,
Actuators, and Microsystems Workshop, Hilton Head Island, South Carolina, June 1-5
2008.
33 Fu, K., A.J. Knobloch, F.C. Martinez, D.C. Walter, C. Fernandez-Pello, A.P. Pisano,
D. Liepmann, K. Miyasaka, and K. Maruta. "Design and Experimental Results of Small-
scale Rotary Engines." Proceedings of 2001 ASME International Mechanical
Engineering Congress and Exposition. New York, NY, ASME, 41, pp. 295-302.

226
34Aichlmayr, H. T., Kittelson, D. B. and Zachariah, M. R. “Miniature Free-piston
Homogeneous Charge Compression Ignition Engine-compressor Concept- Part I:
Performance Estimation and Design Considerations Unique to Small
Dimensions”,Chemical Engineering Science, vol. 57, 2002, pp. 4161-4171.
35 Dahm, W. J. A., Ni, J., Mijit, K., Mayor, J. R., Qiao, G., Dyer, S. W., Benjamin, A.
G. , Gu, Y., Lei, Y., and Papke, M.L., “Micro Internal Combustion Swing Engine
(MICSE) for Portable Power Generation Systems”. AIAA Paper 2002-0722, AIAA,
Reno, NV. 2002.
36 Federici, J. A., Norton, D. G., Bruggemann, T., Voit, K. W., Wetzel, E. D., and
Vlachos, D. G. “Catalytic Microcombustors With Integrated Thermoelectric Elements
for Portable Power Production” Journal of Power Sources ,Vol.161, 2006, pp.1469–
1478.
37 Cohen, A L., Ronney, P., Frodis, U., Sitzki, L.; Meiburg, E., and Wussow S.: US
patent 6,613,972 B2, 2003.
38Guazzoni, “High Temperature Spectral Emittance of Oxides of Erbium, Samarium,
Neodynium, and Ytterbium”, Applied Spectroscopy, Vol. 26, 1972, pp. 60-65.
39Xue, H., Yang, W. M., Chou, S. K., Shu, C. and Li, Z. W.
“Microthermophotovoltaics power system for portable mems devices”, Microscale
Thermophysical Engineering, 9 2005, pp.85-97

227
40 Lee, K. H., and Kwon, O. C. “Studies on a Heat-recirculating Microemitter for a
Micro thermophotovoltaic System”. Combustion & Flame, 153, 2008, pp. 161-172
41Nelson, R.: US patent 4,584,426, 1986.
Chapter 3
1 Vijayan, V., “Combustion and Heat Transfer in Meso-Scale Heat Recirculating
Combustors,”. PhD Dissertation, University of Maryland at College Park, 2010.
2 Wu, C.K.,Wang, H.X., Meng, X., Chen, X. Pan, W.X. “Aerodynamics of indirect
thrust measurement by the impulse method”, Acta Mechanica Sinica, Vol.27, 2011,
pp. 152-163.
3 Lun, J. “Development of a vacuum arc thruster for nanosatellite propulsion”.
Masters Thesis. Stellenbosch University.2008
Chapter 4
1 Ronney, P.D., “Analysis of Non-adiabatic Heat-recirculating Combustors,”
Combustion and Flame, Vol. 135, 2003, pp. 421-239

228
2 Vijayan, V. and Gupta, A.K., "Combustion and Heat Transfer at Meso Scale with
Thermal Energy Recirculation," 47 AIAA Aerospace Sciences Meeting, January 5-8,
2009.
3 Vijayan, V., and Gupta, A.K., “Effect of Channel Length on a Meso-Scale Spiral
Combustor Performance” 46th AIAA/ASME/SAE/ASEE Joint Propulsion Conference
and Exhibit. Nashville, TN. July. 25-28, 2010, Paper AIAA 2010-7065.
4. Oh, H., Huh, H., Ahn, J. and Ronney, Paul. “Effect of Scale on the Performance of
Heat-Recirculating Reactors”. 4th International Energy Conversion Engineering
Conference and Exhibit. San Diego, CA. June. 28-29, 2006.
5 http://www.princeton.edu/~combust/database/other.html
6 Liao, S.Y., Jiang, D.M., Huang, Z.H., Shen, W.D., and Yuan, Q, Chen., “Laminar
Burning Velocities for Mixtures of Methanol and Air at Elevated Temperatures,”
Energy Conversion and Management, Vol. 48, Issue 3, March 2007, pp.857-863
7 Saeed, Khizer., and Stone, C.R.,“Measurements of the Laminar Burning Velocity
for Mixtures of Methanol and Air from a Constant Volume Vessel Using a Multi
Zone Model,” Combustion and Flame, Vol. 139, Issue 1-2,Oct. 2004, pp.152-166.
8 Turns, Stephen. An Introduction to Combustion. 2nd ed., Boston, McGraw Hill,
2006.

229
9 Barnett, H.C., and Hibbard, R.R., “Basic Considerations in the Combustion of
Hydrocarbon Fuels,” NACA Report 1300, 1959.
10 Lewis, B. and Von Elbe, G. Combustion Flames and Explosions in Gases,
Academic Press, 1987.
11. Davu, D., Franco, R., Choudhuri, A., and Lewis, R., Investigation on Flashback
Propensity of Syngas Premixed Flames, 41st AIAA/ASME/SAE/ASEE Joint
Propulsion Conference and Exhibit, Tucson, Arizona, Paper No. AIAA‐2005‐3585.(
12. Vijayan V, Gupta AK. Flame dynamics of a meso-scale heat recirculating
combustor. Appl Energy 2010;87:3718–28.
13 Ahn, J., Eastwood, C., Sitzki, L., and Ronney, P.D., “Gas Phase and Catalytic
Combustion in Heat Recirculating Burners,” Proceedings of the Combustion Institute,
Vol. 29, Issue 7, 2002, pp.957-963.
14 http://webbook.nist.gov/chemistry/
15 Vijayan, Vineeth., “Combustion and Heat Transfer in Meso-Scale Heat
Recirculating Combustors,”. PhD Dissertation, University of Maryland at College
Park. 2010

230
16 Osiander, Robert., Darrin, Garrison M. Ann., and Champion, John., MEMS and
Microstructures in Aerospace Applications,1st ed., CRC Press: Taylor and Francis
Group, New York, 2006.
17 http://www.grc.nasa.gov/WWW/CEAWeb/
18 Rothe, D.E. "Electron Beam Studies of Viscous Flow in Supersonic Nozzles."
AIAA Journal. 9.5 (1971): 804-811.
19 Massier, P, L Back, M Noel, and F Saheli. "Viscous Effects on Flow Coefficient
for a Supersonic Nozzle." AIAA Journal. 8.5 (1970): 605-607
2 Kuluva, G.A, and N.M Hosack. "Supersonic Nozzle Discharge Coeffiicients at Low
Reynolds Number." AIAA Journal. 9.9 (1971): 1876-1877.
21 Bayt, R, and K Bruer. "Systems Design and Performance of Hot and Cold
Supersonic Microjets." 39th AIAA Aerospace Sciences Meeting and Exhibit. 8-11
January, 2001. Reno, Nevada.
22 Sutton, G. Rocket Propulsion Elements. 7. New York: John Wiley and Sons, 2001.

231
23 Shirsat, V., Gupta, A.K. “Performance characteristics of methanol fuelled meso-
scale heat-recirculating combustors.” Applied Energy, Vol. 88, Issue 12, pp.5069-
5082.
24 Louisos, W., Hitt, D. "Viscous Effects in Performance of Two-Dimensional
Supersonic Linear Micronozzles." Journal of Spacecraft and Rockets, Vol. 45, Issue
4, 2008, pp. 706-15.

232