ABSTRACT Document: CROSS-SECTOR COLLABORATIVES: …
222
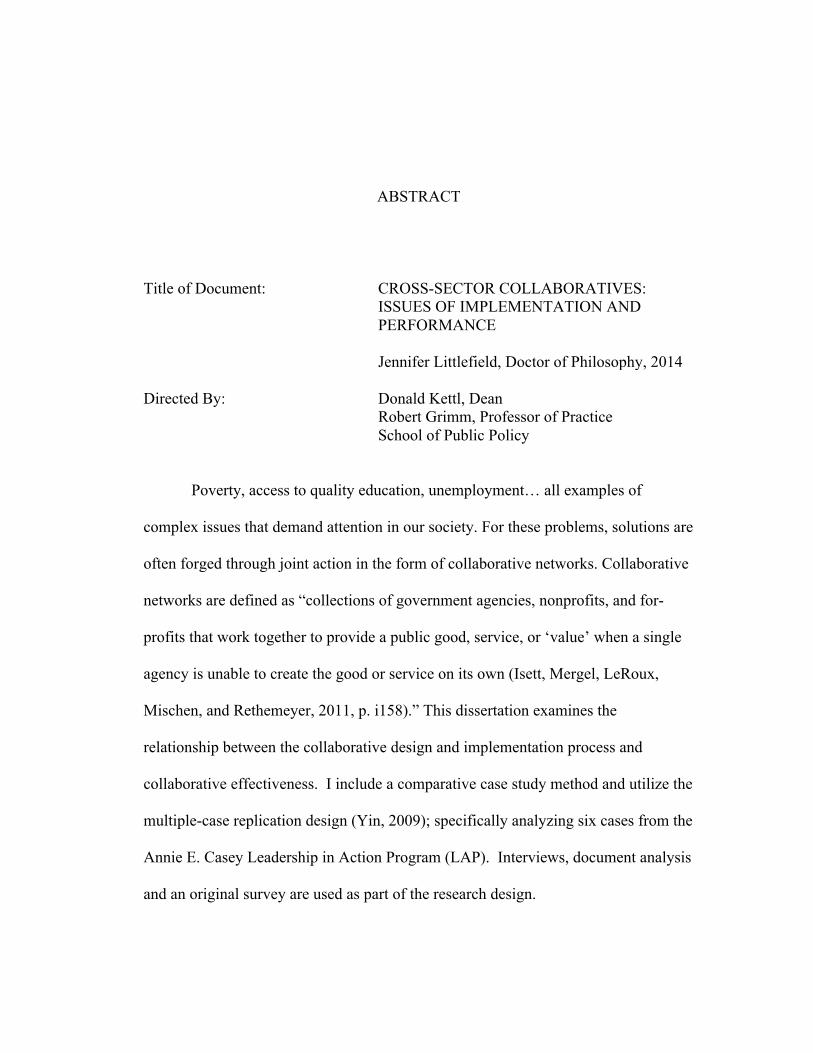
ABSTRACT Title of Document: CROSS-SECTOR COLLABORATIVES: ISSUES OF IMPLEMENTATION AND PERFORMANCE Jennifer Littlefield, Doctor of Philosophy, 2014 Directed By: Donald Kettl, Dean Robert Grimm, Professor of Practice School of Public Policy Poverty, access to quality education, unemployment… all examples of complex issues that demand attention in our society. For these problems, solutions are often forged through joint action in the form of collaborative networks. Collaborative networks are defined as “collections of government agencies, nonprofits, and for- profits that work together to provide a public good, service, or ‘value’ when a single agency is unable to create the good or service on its own (Isett, Mergel, LeRoux, Mischen, and Rethemeyer, 2011, p. i158).” This dissertation examines the relationship between the collaborative design and implementation process and collaborative effectiveness. I include a comparative case study method and utilize the multiple-case replication design (Yin, 2009); specifically analyzing six cases from the Annie E. Casey Leadership in Action Program (LAP). Interviews, document analysis and an original survey are used as part of the research design.
Transcript of ABSTRACT Document: CROSS-SECTOR COLLABORATIVES: …
ABSTRACT
Title of Document: CROSS-SECTOR COLLABORATIVES:
ISSUES OF IMPLEMENTATION AND PERFORMANCE
Jennifer Littlefield, Doctor of Philosophy, 2014 Directed By: Donald Kettl, Dean
Robert Grimm, Professor of Practice School of Public Policy
Poverty, access to quality education, unemployment… all examples of
complex issues that demand attention in our society. For these problems, solutions are
often forged through joint action in the form of collaborative networks. Collaborative
networks are defined as “collections of government agencies, nonprofits, and for-
profits that work together to provide a public good, service, or ‘value’ when a single
agency is unable to create the good or service on its own (Isett, Mergel, LeRoux,
Mischen, and Rethemeyer, 2011, p. i158).” This dissertation examines the
relationship between the collaborative design and implementation process and
collaborative effectiveness. I include a comparative case study method and utilize the
multiple-case replication design (Yin, 2009); specifically analyzing six cases from the
Annie E. Casey Leadership in Action Program (LAP). Interviews, document analysis
and an original survey are used as part of the research design.

This dissertation has two key components. First, I operationalize and expand
an important evaluative tool that allows collaboratives to understand their
performance at various levels and share their success and shortcomings in a rich,
straightforward, and cost effective manner. This framework allows for measurement
on multiple dimensions and levels, lending information on the relevance and impact
of collaborative groups. Secondly, I use my findings with regard to performance to
analyze the process of high, moderate, and low performing groups to determine the
most important elements of successful collaboration. This research demonstrates a
clear relationship between design process and effectiveness, with certain elements
making positive results more likely. These are: the use of an accountability system,
decision-making process, relationship building, and facilitation. Overall this research
fills a void and makes a significant contribution to the literature and practice of
collaborative networks, potentially impacting how future cross-sector collaboratives
work together to produce public value and address major public problems.

CROSS-SECTOR COLLABORATIVES: ISSUES OF IMPLEMENTATION AND PERFORMANCE
By
Jennifer Nash Littlefield
Dissertation submitted to the Faculty of the Graduate School of the University of Maryland, College Park, in partial fulfillment
of the requirements for the degree of Policy Studies
2014 Advisory Committee: Professor Donald Kettl, Chair Robert Grimm, Co-Chair, Professor of Practice Kenneth Apfel, Professor of Practice Howell Baum, Professor Noah Drezner, Assistant Professor

© Copyright by Jennifer Nash Littlefield
2014

ii
Dedication
This work is dedicated to the Littlefield boys. I love the three of you more than
words can express.

iii
Acknowledgements
This degree took me seven years to complete. Seven years that included
challenging teaching and graduate assistantships, a full time job, and the birth of two
busy, bouncing boys. To reach the finish line took a village… and I’m so fortunate to
have such a supportive village. Thank you to Bob Grimm and Donald Kettl for their
guidance and time. Thank you to my dissertation committee for their feedback and
insight.
Thank you to my neighbors and friends who cooked me dinner, babysat my
boys and picked me up when I was discouraged. Thank you to my mother who has
been a tireless advocate and supporter in all things that I do. Our moving to
Maryland was very hard for her, but she quickly rallied and visits almost every other
month. In those visits she has cooked, cleaned, babysat, organized my house and
helped in more ways than I can describe, all to give me a chance to write and gain
some sanity. Mom, you don’t hear it enough… you are so very appreciated and
loved, thank you for being so amazing!
Finally, thank you to my husband Tom. When I first got this crazy idea to get
a PhD he was finishing his PhD in Economics. I often say we traded hats and stayed
poor. He more than anyone knew the sacrifice involved… the sacrifice of time,
money and sanity. Yet he has been my biggest champion since that very first
conversation. His contributions have been endless and are more than I can list. Not
only did he work full time to support us monetarily, he then came home and took on
extra childcare and housework so I could write. He provided countless hours of
assistance, ranging from quantitative analysis to a shoulder to cry and to an ear to

iv
listen. Thank you honey, I absolutely believe I could not have done this without you.
I am so lucky to have you as my friend and partner in life.
To Lucas and Wynn, thank you for the privilege of being your Mommy.

v
Table of Contents
Dedication ..................................................................................................................... ii Acknowledgements ...................................................................................................... iii Table of Contents .......................................................................................................... v List of Tables .............................................................................................................. vii List of Figures ............................................................................................................ viii Chapter 1: Collaboratives – An Opportunity and a Challenge ..................................... 1
Collaborative Networks: General Overview ............................................................. 3 Overview of Collaborative Challenges and Introduction to Research ...................... 5
Collaborative Effectiveness .................................................................................. 7 The Collaborative Process .................................................................................. 12 Effectiveness and Process: Tying it all together ................................................. 13
Methodology – A Qualitative Approach ................................................................. 15 Dissertation Overview ........................................................................................ 17
Chapter 2: The Annie E. Casey Leadership in Action Program ................................. 20 LAP Framework ...................................................................................................... 22
Strong Accountability Partner ............................................................................. 27 Skilled Implementation Team ............................................................................. 28 Participant Accountability .................................................................................. 29 Collaborative Leadership Development ............................................................. 31
Background on LAP Cases ..................................................................................... 32 Local Management Board ....................................................................................... 33
Board of the Family League of Baltimore City .................................................. 33 Montgomery County Collaboration Council for Children, Youth and Families .... 33
Maryland Cases: Anne Arundel County, Baltimore City, and Montgomery County ................................................................................................................. 34 Counties Outside of Maryland: DeKalb County, Georgia; Polk County, Iowa; Marion County (Indianapolis), Indiana ............................................................... 36
Chapter 3: Examining Effectiveness and Understanding Outcomes .......................... 40 Methods and Data ................................................................................................... 41 Collaborative Effectiveness: A Qualitative Framework ......................................... 44 Analysis Variables .................................................................................................. 49
Community Level Evaluation ............................................................................. 49 Collaborative Level Evaluation .......................................................................... 52 Organization and Participant Level Evaluation .................................................. 53
Results: .................................................................................................................... 54 Discussion ............................................................................................................... 81 Conclusion .............................................................................................................. 86
Chapter 4: Examining Process – High and Moderate Performing Collaboratives ..... 88 The Collaborative Process ...................................................................................... 88 Data ......................................................................................................................... 92 Methods ................................................................................................................... 93
Analysis Variables .............................................................................................. 93 Case Analysis .......................................................................................................... 97 Conclusion ............................................................................................................ 125

vi
Chapter 5: Examining Process – Low Performing Collaboratives .......................... 126 Case Analysis ........................................................................................................ 126 Results from Process Analysis .............................................................................. 138 Conclusion ............................................................................................................ 143
Chapter 6: Lessons for Design and Evaluation of Collaboratives ........................... 145 An Evaluation Framework .................................................................................... 147 Process Elements for Effectiveness ...................................................................... 156 Conclusion ............................................................................................................ 168
Appendices ................................................................................................................ 170 Bibliography ............................................................................................................. 205

vii
List of Tables Table 1: Key Research Definitions ............................................................................. 14 Table 2: Case Descriptions ......................................................................................... 33 Table 3 Community Level Framework Variables ...................................................... 49 Table 4 Collaborative Level Framework Variables .................................................... 52 Table 5 Organization/Participant Level Framework Variables .................................. 53 Table 6 Effectiveness Evaluation Analysis .................. Error! Bookmark not defined. Table 7 Overall Ranking by Performance .................................................................. 85

viii
List of Figures
Figure 1 Provan and Milward Summary of Network Evaluation Relationships ........ 45 Figure 2: Process Framework ..................................................................................... 89

ix

1
Chapter 1: Collaboratives – An Opportunity and a Challenge
Poverty, access to quality education, unemployment—all complex issues that
demand attention in our society. They have been defined these as “wicked” problems,
or problems with no solutions, only temporary fixes and inefficient resolutions
(Harmon and Mayor, 1986). For wicked problems, solutions must often be forged
through joint action and analyses that are consistent with multiple societal interests.
Increasingly collaborative networks have become the method for addressing these
problems, implementing services and creating policy.
Collaborative networks are defined as “collections of government agencies,
nonprofits, and for-profits that work together to provide a public good, service, or
‘value’ when a single public agency is unable to create the good or service on its own
and/or the private sector is unable or unwilling to provide the goods or services in the
desired quantities (Isett, Mergel, LeRoux, Mischen, and Rethemeyer, 2011, p. 158).”
Examples of collaborative networks range from formal entities where government
agencies and nonprofits have a contract to implement services to informal groups
where multiple agencies from different sectors come together to address a community
issue such as high poverty.
The last 30 years have seen a huge increase in the government contracting of
an array of services as well as the expanded use of collaboratives for services; in fact
this transition to private contracts and networks has been called one of the biggest
challenges for public administration (Kettl, 2002). Collaborative network analysis
has been examined in the public administration and policy literature for decades, yet
many questions remain unanswered. The literature and practice are still trying to

2
understand whether collaboratives produce results that otherwise would not have
occurred (Agranoff and McGuire, 2001). A recent literature review with regard to
collaboration concludes that a low level of success should be expected given the
difficulty surrounding these efforts (Bryson, Crosby and Stone, 2006).
Substantial public value is being lost due to this insufficient collaboration
(Behn, 2001). Given the important issues being addressed by these groups and the
significant amount of time and resources being invested, it is critical to understand
how to best evaluate collaborative success and implement collaborative work. Current
research does not often link theory to practice, nor has it successfully answered these
questions (O’Leary and Vij, 2012). My research attempts to contribute to this
knowledge gap by asking the following questions:
• What is the relationship between design process and effectiveness? Do certain elements of the design process, such as accountability methods or strong relationships, make greater effectiveness more likely?

3
This research analyzes whether changes in my independent variable, the collaborative
design process, lead to changes in the dependent variable, collaborative effectiveness.
I define process as a series of actions or steps taken to achieve an end. How do
participants come together as a group and determine the best course of action? How
do they design and implement new programs and policies? How do they make
decisions and establish accountability? The process also involves the relationship
side of accountability. I define accountability as a relationship in which participants
and collaboratives are responsive to each other, external partners and the community
as a whole for the development process, outcomes and effectiveness of that
collaborative.
This work contributes to collaborative scholarship by providing an empirically
grounded, theoretically based framework evaluating collaborative performance, a
contribution useful for both future scholars and practitioners. Despite decades of
research on collaboratives, evaluative frameworks analyzing these groups are scarce
(Herranz, 2009; Provan, Fish and Sydow, 2007; Turrini, Cristofoli, Frosini, and Nasi,
2010; McGuire and Agranoff, 2011). The result of my analyses also contributes to
knowledge concerning essential elements of the process within a collaborative.
Overall this research provides guidance for collaborative design as well as evaluation,
potentially impacting how future cross-sector collaboratives work together to produce
public value and address major public problems.
Collaborative Networks: General Overview
In addition to the one above, there are many definitions and terms with regard
4
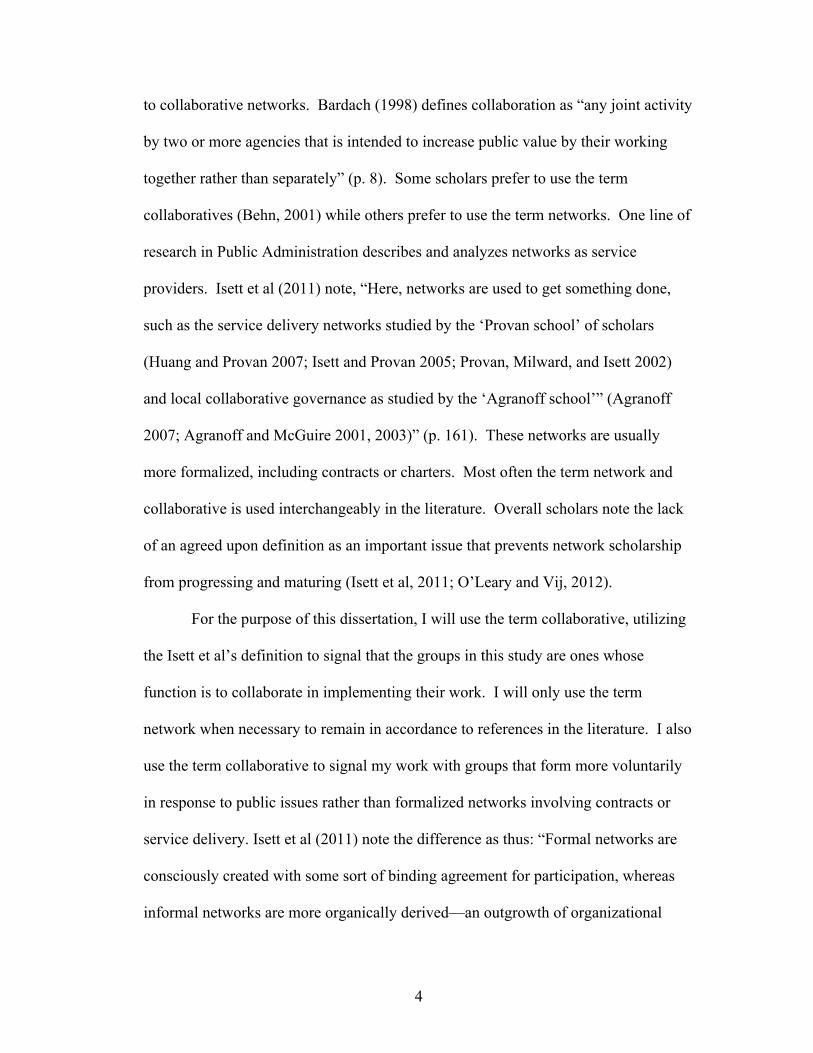
to collaborative networks. Bardach (1998) defines collaboration as “any joint activity
by two or more agencies that is intended to increase public value by their working
together rather than separately” (p. 8). Some scholars prefer to use the term
collaboratives (Behn, 2001) while others prefer to use the term networks. One line of
research in Public Administration describes and analyzes networks as service
providers. Isett et al (2011) note, “Here, networks are used to get something done,
such as the service delivery networks studied by the ‘Provan school’ of scholars
(Huang and Provan 2007; Isett and Provan 2005; Provan, Milward, and Isett 2002)
and local collaborative governance as studied by the ‘Agranoff school’” (Agranoff
2007; Agranoff and McGuire 2001, 2003)” (p. 161). These networks are usually
more formalized, including contracts or charters. Most often the term network and
collaborative is used interchangeably in the literature. Overall scholars note the lack
of an agreed upon definition as an important issue that prevents network scholarship
from progressing and maturing (Isett et al, 2011; O’Leary and Vij, 2012).
For the purpose of this dissertation, I will use the term collaborative, utilizing
the Isett et al’s definition to signal that the groups in this study are ones whose
function is to collaborate in implementing their work. I will only use the term
network when necessary to remain in accordance to references in the literature. I also
use the term collaborative to signal my work with groups that form more voluntarily
in response to public issues rather than formalized networks involving contracts or
service delivery. Isett et al (2011) note the difference as thus: “Formal networks are
consciously created with some sort of binding agreement for participation, whereas
informal networks are more organically derived—an outgrowth of organizational

5
contingencies that multiple actors come together to address” (p. 162). Because
formal and informal collaboratives differ greatly, this research attempts to understand
better nonhierarchical, informal (or non-chartered), cross-sector collaboratives. Since
these collaboratives are not bound by authority or contracts, they are faced with
special challenges such as limited capacity, accountability and motivation. These
important groups have been underexplored in the literature. My research will focus
on these informal, voluntary collaboratives in order to fill the literature gap.
Overview of Collaborative Challenges and Introduction to Research
Kettl (2009) maintains, “Political demands for more government solutions to
big problems balanced by political opposition to expanding government employment
to do the job led to reliance on nongovernmental partners” (p. 5). Goldsmith and
Eggers (2004) maintain there are three major trends that have contributed to the rise
of networked government: The growth of outsourcing; a movement towards joined-up
government service delivery or the movement to provide more integrated service
delivery to citizens by better linking up government agencies; and technology making
communicating and collaborating with partners across organizational boundaries
infinitely better, faster and cheaper. Behn (2001) notes “in the United States, most
public policies are no longer implemented by a single public agency with a single
manager, but by a collaborative of public, nonprofit and for-profit organizations” (p.
72).
These groups face many challenges and areas for question. Collaboration
occurs in turbulent environments where efforts of sustainability and success are
affected by outside factors beyond the control of collaborative members (Bryson,
6
Crosby and Stone, 2006). Kontopolous (1993) describes these groups as systems of
heterarchy, which differs from the top-down structure of hierarchy. The heterarchy
view of collaboratives maintains that interactions within a system are driven by
complicated group dynamics, complex external influences, and multiple stakeholders.
Babiak and Thibault (2009) discuss additional obstacles to effective cross-
sector collaboration, including conflicting goals and missions, lack of opportunity or
incentive to collaborate, inflexible policies and procedures that do not support the
partnership, constrained resources, mistrust, group attitudes about each other that may
not be accurate, different organizational norms and culture, and lack of support or
commitment to the partnership. They also find that collaboratives were generally
undermanaged with inadequate managerial structures in place to support the work.
Additionally, collaboratives include members from different sectors, with different
work styles, priorities, and organizational structures. García-Canal, Valdéz-Llaneza,
and Ariñio (2003) cite a lack of incentives to behave cooperatively and the free-rider
problem as issues with multiple partnerships. Additionally, collaboratives include
members from different sectors, with different work styles, priorities, and
organizational structures. O’Leary and Vij (2012) note that members of these groups
bring different missions, organizational cultures, methods of operation, funders and
stakeholders, and degrees of power.
Overall collaboratives occur in a complex and challenging environment.
Given the difficult yet necessary tasks surrounding collaboratives, it is important to
understand how to measure and define their effectiveness while identifying the
important components of the collaborative process that make the group most

7
successful.
Collaborative Effectiveness
The complexity in evaluating collaboratives leads to a difficulty in defining
collaborative effectiveness. Turrini, Cristofoli, Frosini, and Nasi (2010) noted in a
recent literature review regarding network effectiveness, “To date, literature on the
subject has developed in a fragmentary way. It has generally taken the form of
multiple definitions of public networks and network effectiveness (pg. 528).” When
conducting their review, when addressing network effectiveness they refer to “the
effects, outcome, impacts and benefits that are produced by the network as a whole
and that can accrue to more than just the single member organizations in terms of
increasing efficiency, client satisfaction, increased legitimacy, resource acquisition,
and reduced costs (Oliver 1990; Provan and Milward 2001). (pg. 529)” Their review
found that much of the research simply note the level of analysis, such as community
effectiveness or client level effectiveness, rather than a specific definition of
effectiveness. Overall they conclude that network effectiveness includes client level
effectiveness, network capacity at achieving stated goals, network stability and
viability, network innovation and change, and community effectiveness.
Provan, Fish and Sydow (2007) maintain that effectiveness means different
things to each network and to each sector in which a network exists. They believe the
focus should be at the network level rather than at the level of individual organization
members; however, who should benefit is still an important question unanswered by
the literature. McGuire and Agranoff (2011) also note the differing definitions and
measurement in network scholarship. They maintain, “… [T]he typical context for

8
networks is that they are held accountable by a stakeholder and partner constituency
(Human and Provan 2000) for the satisfactory design (in some networks) and delivery
of goods and services (McGuire 2002). Effectiveness can be measured by the extent
to which a network achieves its goals, whatever the goal is and however it has been
formulated (p. 272).” Provan and Milward (1995) define effectiveness as the degree
to which clients and their families were satisfied with the treatment they received
from the mental health system being studied.
Chen (2010) defines effectiveness as “a subjective judgment among partners
that their collaborative has achieved what it was intended to achieve, that it worked
smoothly, and that it was reasonably productive (p. 389).” For the purpose of his
study he considers “three dimensions of perceived effectiveness: (1) achieving goals
of service delivery, (2) improved interorganizational learning, and (3) increased
partner interactions.” Agranoff (2007) argues for the broad concept of adding public
value when looking at collaborative performance. He notes, “The primary concern
with network performance appears to center on the question of whether collaboration
adds value to the public undertaking (p. 156).” In addition, Agranoff (2007) agrees
that collaboratives often include outcomes that go beyond goals, such as cooperation
and learning. He argues that “networks be measured based on the subjective
judgment of the actors” and that “both substantive and process elements need to be
weighed (p. 157).” Agranoff defines success as adding value at the personal,
organizational and network levels. For the purpose of this research, I define
collaborative effectiveness as providing value to collaborative participants,

9
organizations and local communities in ways that could not have been achieved
through individual agencies alone.
Agranoff and McGuire (2001) maintain that in order to understand
collaboratives we must be able to measure the outcomes and effectiveness of
collaboratives. They argue that the most basic issues of collaborative management
are intertwined with our ability to assess effectiveness and then compare that
effectiveness against some baseline with which collaboratives can be held
accountable. Provan and Milward (2001) suggest, “at the broadest level of analysis,
community-based networks must be judged by the contribution they make to the
communities they are trying to serve (p. 416)”. Zakocs and Edwards (2006) agree
that collaborative effectiveness should be judged as to whether collaboratives affect
community-level changes. Since the goal of most collaboratives is to effect
community level change, it follows that evaluation criteria should be at this level.
Yet measuring collaborative effectiveness at the community level is difficult
for several reasons. First, these collaboratives occur in complex, turbulent
environments where efforts of sustainability and success are affected by outside
factors (Bryson, Crosby and Stone, 2006). This environment is often called a
complex adaptive system, which describes a series of interdependent agents where the
system is unpredictable, dynamic, and entangled (Dooley, 1997; Eoyang and Berkas,
1998). This makes it difficult to attribute community level data changes to particular
factors, such as the efforts and initiatives of a collaborative (McGuire and Agranoff,
2011).

10
Second, positive collaborative outcomes can go beyond that of simply
improving community-level numbers. Bryson, Crosby and Stone (2006) argue, “the
point of creating and sustaining cross-sector collaboratives ought to be the production
of ‘public value’ (Moore 1995) that cannot be created by single sectors alone (p. 51).”
Public value can be thought of as the equivalent of shareholder value in public
management (Moore, 1995); or, what the public values and what adds value to the
public sphere (Moore and Benington, 2011). It requires three processes: 1) Defining
public value 2) Creating the ‘authorizing environment’ necessary to achieve the
desired public value outcomes and 3) harnessing and mobilizing the resources to
achieve the desired public value outcomes (Moore, 1995; Moore and Benington,
2011).
McGuire and Agranoff (2011) note that a successful process can add public
value while also generating poor program outcomes. They add:
For example, when the community and all stakeholders to an issue are engaged in designing, planning, and implementing a program, and when participation, representation, and deliberation are intended to be the defining characteristics of the process, then the effectiveness of the program as measured in terms of standard indicators of performance may fall short, but meet the operating goals of the process. Indeed, network outcomes may accrue from the individual administrator, participating agency, network process, and tangible network outcome perspectives (Agranoff 2007). Such networks should not be devalued (p. 273).
Rodríguez, Langley, Béland and Denis (2007) study finds that despite being involved
in a process that was destined to fail due to issues in the health care system,
participants continued because “the processes themselves have some intrinsic value to
the people who participated in them (p. 178)”. They note one positive outcome being
that the process “socialized participants to a new language (for example, case

11
management, integrated networks) that might be drawn on more successfully in future
discussions (p. 184)”.
This leads to the third challenge with simply using community level data to
assess collaborative effectiveness. Collaboratives include multiple organizations with
multiple constituents who hold a variety of interests and needs, therefore arguing for a
broader level of assessment than simply community-level data. Klijn and Koppenjan
(2000) argue that evaluation criteria must consider “the multi-actor, dynamic
character of interaction in networks”. They maintain that simply using “the classic
goal achievement method” is not appropriate for collaboratives given that actors are
relatively autonomous and there is no central coordinating actor. Each participant has
their own objectives and it is difficult to determine which actor’s goals should be a
priority. It is even more difficult to determine which goal or actor represents the
public interest.
Finally, the most practical argument against solely using community level
data to evaluate collaboratives is the fact that these data are often difficult to obtain
(Isett, et al. 2011, Provan and Milward, 2001) Communities often do not collect the
data necessary to evaluate collaboratives due to lack of resources. Federal agencies
can fill this void but at times their data is at a macro-level; thus not appropriate for
community analysis with regard to collaborative performance (Provan and Milward,
1995; Provan and Milward, 2001).

12
The Collaborative Process
The challenges outlined above have direct impact on the design and process of
community collaboratives. Gray (1989) notes collaboration as an emergent process
with collective responsibility. Indeed, many scholars have noted that the process of
collaboratives occurs through compromise and coordination rather than a stepwise
movement from one phase to another; it is often called messy, dynamic, and
interactive (Thomson and Perry, 2006; Huxham and Vangen, 2005; Roberts and
Bradley, 1991).
Despite this recognition, some scholars have attempted to define the process
of collaboration and determine frameworks for analysis. Ring and Van de Ven
(1994) model the collaborative process as cyclical rather than linear, consisting of a
“repetitive sequence of negotiation, commitment, and execution stages (p. 97).” They
note the emergence of personal relationships that lead to psychological contracts
which in turn lead to informal understanding and commitments. Thomson and Perry
(2006) stipulate five key dimensions of collaboration, including the governance
dimension, or how collaborations make joint decisions and negotiate power
arrangements; the administration dimension, or the administrative structure that
assists the group in taking action; the autonomy dimension, or the ability of members
to develop collaborative competencies and move from individual agendas to shared
control; the mutuality dimension, or the process of forging mutually beneficial
relationships; and the trust and reciprocity dimension, which stresses the critical
component of trust necessary for collaboration. Finally, Bryson et al. (2006) present
a framework that seems the most inclusive of all the points made in the literature.

13
They note the following as affecting the successful implementation of a collaborative:
initial conditions, process dimensions, structural and governance dimensions,
contingencies and constraints, outcomes, and accountability issues. They also note
the overlap and relationship that exists with aspects of the initial conditions and
structure with the pieces they outline in process.
Effectiveness and Process: Tying it all together
The research presented in this dissertation attempts to link collaborative
process to collaborative effectiveness. I define process as a series of actions or steps
taken to achieve an end. How do participants come together as a group and determine
the best course of action? How do they establish accountability? What is the process
used by individuals to determine a policy intervention? What is the process through
which they determine the appropriate outcomes for that intervention? The process
also involves the relationship side of accountability. I define accountability as a
relationship in which participants and collaboratives are responsive to each other,
external partners and the community as a whole for the development process,
outcomes and effectiveness of that collaborative. O’Toole (1997) builds on findings
in social capital research, noting that “leveraging horizontal ties, building on trust and
encouraging the development of cooperative norms also can enhance administrative
capacity, and governmental capacity more generally (p. 455 – 456).” The need for
relationship building, norms established around trust and open, honest dialog are
often cited as necessary ingredients to group cohesion and strong collaboratives
(Babiak and Thibault, 2009; Bardach, 1998; Chaskin, 2003; García-Canal et al., 2003;

14
Chisholm, 1989; Wohlstetter and Malloy, 2005); however, there are not many studies
that look at the aspect of relationships relative to performance.
Yet processes and collaboratives are not useful unless they are deemed
effective. Groups are considered to be accountable if they do what they say they will
do; in other words, they create results. This difference between process and results is
important, yet the distinction is often not made. A group could generate results but
have an unfair process, which questions the efficacy of the result. Alternatively, a
group could build an equitable process and develop a strong level of trust and
relationships among members, but not be effective. Overall I will investigate the
relationship between process to effectiveness, leading to my two research questions:
What is the relationship between design process and effectiveness? Do certain
elements of the design process, such as accountability methods or strong
relationships, make greater effectiveness more likely?
Key research definitions from above are summarized as such:
Table 1: Key Research Definitions
Key Research Definitions
Accountability A relationship in which participants and collaboratives act responsible to each other, external partners and the community as a whole for the development process, outcomes and effectiveness of that collaborative.
Process A series of actions or steps taken to achieve an end, the “how” of collaboratives
Collaborative effectiveness
Providing value to collaborative participants, organizations and local communities in ways that could not have been achieved through individual agencies alone.

15
Methodology – A Qualitative Approach
This dissertation includes a qualitative approach to address the research
questions presented. The analysis includes a comparative case study method and
utilizes the multiple-case replication design outlined by Yin (2009); specifically, six
cases from The Leadership in Action Program (LAP). LAP is a program created by
the Annie E. Casey Foundation, whose mission is to foster community-level
collaboratives focused on one specific community issue. Launched in 2001, LAP has
helped facilitate 14 collaboratives representing jurisdictions from across the country.
More information about this program and the cases are presented in Chapter 2. I
incorporate document analysis, interviews with select past participants and a survey
for the qualitative research chapters. The data also includes the underlying theories of
change proposed by each group as well as an analysis of the strategies outlined by
each collaborative. I utilize cross-case synthesis and pattern matching to determine
differences and similarities around process of those ranked high, moderate and low on
the results framework. Additional information on methodology is discussed further
on an as needed basis in future chapters.
This methodology poses some challenges. Issues of external validity are a
potential challenge with any case study. While case studies are not comparable to
analytical generalization in which a sample is intended to generalize to a larger
universe, one can infer implications for theory through replication logic within
multiple case studies. The cases I have chosen are related in that they were
implemented with the support of the Annie E. Casey Foundation and conducted with
a similar framework. Yet they differ in that each group adopted the framework in

16
different ways. While the initial implementation framework was similar for each case,
the actual execution differs in a way that provides variability of process and results.
There are still concerns of course about the similarities inhibiting the generalizability
of my findings, but in contrast, the similarity may benefit my ability to isolate
variables in outcomes.
LAP’s framework in relation to other collaboratives is another question with
regard to external validity. First, there does not seem to be a normal collaborative.
The literature highlights a great variety of collaboratives with no one model in
common. Secondly, the Annie E. Casey Foundation has an emphasis on
accountability, which begs the question as to whether the model is unique or
unnatural; however, it is well documented in the nonprofit literature that funding
organizations have been emphasizing greater accountability models over the past 20
years (Chaskin, 2003; Ebrahim, 2005; Morrison and Salipante, 2007). LAP includes
other funders in addition to Annie E. Casey, most times investing as much or more
money than Casey. These funders come from the public, nonprofit and private
sectors, including agencies like the Governor’s Office, the United Way, the Better
Business Bureau, etc. Each collaborative has a different model of external partners
and funders. In this way the LAP model is very common in the world of
collaboratives. Casey serves to legitimize the initial efforts, to act as a “champion”
(Wohlstetter, et al., 2005) or a “superordinate” authority (Page, 2008), but serves as
only one of several of these external partners and funders. Finally, as outlined in the
next chapter, several other aspects of the LAP framework mirror recommendations
found in the literature. This makes the LAP model especially relevant for analysis, as

17
it can be broadly applicable to understanding other collaboratives attempting to affect
major policy issues.
Dissertation Overview
Chapter Two details the Annie E. Casey Leadership in Action Program and
the six cases presented in this research. Chapter Three examines the effectiveness
and outcomes from six collaboratives using qualitative analysis. As noted above, my
research questions examine the relationship between design process and greater
effectiveness and whether specific elements of the design process make certain
effectiveness more likely. In order to determine this, I must first establish which of
the six cases were actually effective. Through a qualitative analysis of interview and
survey results, this chapter attempts to look at collaborative effectiveness and
outcomes from a broad perspective by adapting Provan and Milward’s (2001)
framework to analyze results from the community, collaborative, and
individual/organizational level. This chapter concludes with an understanding of the
effectiveness of each collaborative at each level and allows me to group the six
collaboratives into high, moderate and low performing groups.
Chapters Four and Five analyze the processes of the high, moderate and low
performing groups using case study analysis. The purpose of this research is to
examine the elements of a collaborative process, and to determine the importance of
these elements to the collaborative results found in the previous chapter. Because the
six case studies I examine vary in performance, I am able to determine the importance
of elements in the development and implementation of high and low performing

18
collaboratives. In addition, I compare the process elements in my research to that
found in the literature. This analysis determines if high/moderate groups shared
certain traits which made their success more likely, and vice versa with the low
performing groups.
Chapter Six concludes my dissertation by synthesizing all of my analyses and
providing implications and areas for future research given my findings. It includes
contributions to the literature and lessons found for practitioners. Given the many
unanswered questions around the design and implementation process of
collaboratives and their relationship to collaborative outcomes, this research provides
a significant contribution to this area of study. This is especially true for research
around voluntary or non-chartered collaboratives. These analyses provide more
methodological rigor than many previously sited analyses given the large, detailed
dataset. In addition, this study uses a structured framework to evaluate process and
accountability and performance, something rarely seen in the literature. The analysis
of effectiveness offers an alternative way of evaluating collaboratives given the
challenges surrounding community level data, something important for both practice
and research.
Overall, these analyses address some of the most important issues facing
cross-sector collaboratives, namely performance and process design. Bryson et al
(2006) note that “few, if any, research studies have gathered data on all of these in a
way that could easily guide research or help policy makers in government, business,
nonprofits, the media, or communities understand when cross-sector collaborations
make sense, let alone how to design and implement them.” This research has the

19
potential to fill this void and make a significant contribution to the literature and
practice of collaborative networks, potentially impacting how future cross-sector
collaboratives work together to produce public value and address major public
problems.
20
Chapter 2: The Annie E. Casey Leadership in Action Program
In the late 1990s, the Maryland State Department of Education began to focus
on early childhood education, and quickly realized it had no measure to understand
the current abilities of children entering kindergarten. In 1997 the State of Maryland
Department of Education created an initiative titled Maryland Model for School
Readiness (MMSR) that focused on teacher professional development. Out of this
effort came the selection and implementation of a measurement tool called the Work
Sampling System (WSS) that is designed to assess kindergartener’s school readiness
skills. The WSS evaluates 30 indicators across seven domains of learning as well as
an overall composite score (Achieving School Readiness, 2002). The seven domains
of learning include: Personal and social skills, language and literacy, mathematical
thinking, scientific thinking, social studies, the arts, and physical development and
health.
The first evaluation occurred in 2001 and revealed that fewer than half of
Maryland’s kindergarteners had the skills necessary to succeed in school. Calvert
County, Caroline County, Cecil County, St. Mary’s County, and Worcester County
fell below the state average and Baltimore City, Baltimore County, Dorchester
County, and Prince George’s County had fewer than 40% of students assessed as
fully ready to learn (Achieving School Readiness, 2002). This was of immediate
concern as research shows that early learning before children enter formal education
is essential to later school and life success (School Readiness Baseline Information,
2001).

21
From this concern the Leadership in Action Program (LAP) was born. In
2001 the Annie E. Casey Foundation partnered with the Governor’s Subcabinet for
Children, Youth and Families and the Council for Excellence in Government to
launch the initiative. The Casey Foundation funded the entire initiative and hired
leadership consultants to design and implement the program. The program had two
purposes: to accelerate the rate at which children enter school ready to learn in
Maryland, and to increase the leadership capacity of those leaders in Maryland
accountable for that result (Achieving School Readiness, 2002). Over 40 different
participants met for ten months to deliberate and investigate best practices in early
childhood education. The result was a report to the Subcabinet for Children, Youth
and Families entitled “Achieving School Readiness: A 5-Year Action Agenda,”
which detailed six goals and twenty-five strategies the group determined as most
critical. The report noted, “It is our hope that you will consider this Action Agenda in
your own deliberations to develop the 5-year school readiness strategic plan to be
submitted to the Maryland General Assembly next February (Achieving School
Readiness, pg. i, 2002).” These specific goals can be found in Appendix A.
According to Sadie1, a long-time Casey staff member, this first LAP effort
was deemed valuable and successful both by the Casey Foundation and State
Superintendent Nancy Grasmick. Furthermore, the report served to highlight
Baltimore City as a particular problem for the state. In this environment, two
members of the Maryland State LAP approached Casey to launch a LAP program in
Baltimore City. Casey agreed, with Sadie saying, “We [Casey] knew there was not
likely to be funding in Baltimore and because we live in Baltimore and we care about 1 All names in this research have been changed and quotes screened to ensure anonymity

22
Baltimore and the numbers were so horrible, we funded them entirely.” Thus, the
first county LAP was born.
Sadie described the early days of LAP as an evolutionary process. There was
no staff or infrastructure at first, but after Baltimore City they “got the sense that this
was pretty good stuff.” The Casey Foundation began to invest in facilitator training
and reach out to other communities about the program. They also created a more
formal structure and framework for implementing each LAP group. Three years after
the launch of the Baltimore City LAP, Casey expanded to two additional Maryland
counties, Anne Arundel and Montgomery. These and subsequent groups enjoyed
more organization and staff support than Baltimore City. The LAP framework is
outlined in more detail below.
LAP Framework
The mission of LAP was to foster community-level collaboratives focused on
one specific community issue. Promotional materials described the effort: “It gathers
and mobilizes key leaders, managers, and residents in public agencies, nonprofit
organizations, and community groups to work collaboratively in new ways. It
provides training and support so that together, they can pick up the pace of change
and get concrete, measurable results.” The goals of the LAP program were as
follows:
1) LAP influences a leader’s ability to make measurable progress in fostering a condition of well-being for a targeted population.
2) LAP develops individual participants’ leadership competencies and commitment to aligned action and results.
3) LAP develops relationships and understanding among a group of leaders and facilitates collaboration, sharing and a commitment to reduce
23
community disparities around a condition of well-being for a targeted population.
4) Participants utilize the skills learned in LAP in their parent organization and other leadership venues.
5) LAP creates the capacity for leaders to have greater influence and leverage within their communities to foster a condition of well-being in the targeted population
LAP groups evolved through community members reaching out to the Casey
Foundation for support around an issue such as school readiness or recidivism. There
was no formal process with regards to marketing the program. Sadie noted that as
they expanded they were looking for “friendly partners, which consisted of places
where we had a relationship and had worked directly or we knew had an interest or
were working on a results framework.” They looked for places where there was a
person “with a deep anchor in that community” and willing to speak highly of the
program and the Casey Foundation to build interest. They were also seeking partners
that helped the LAP team and Casey understand the subtle dynamics of the
community.
Once a community expressed interest, staff from Casey met with leaders from
the community to determine if they were “a fit”. This process became more
structured over time, with the foundation creating “site readiness criteria”. Below is
an excerpt from the “Leadership in Action Program – Site Readiness Assessment
Tool”, an internal program delivery document.
The Leadership Development Unit of the Casey Foundation employs a unique set of criteria to determine if LAP and a site is a good match. The criteria also serve to determine when a site is prepared to launch LAP (the criterion is tracked in both the engagement and site-readiness phases). The criterion is incorporated into a self-assessment tool for the site to determine if LAP is right for them and to identify when they are ready.

24
There were seven ‘headline’ criteria, which were accompanied by specific measures. They are:
1. Clearly stated result and target population 2. Data at the population level 3. Accountability partner(s) that will hold the participants accountable for
results in one measurement cycle 4. A cadre of hands-on leaders – both agency and grassroots community
leaders – with demonstrated skills who are prepared to dedicate themselves to turning the curve
5. Existing infrastructure that can implement the decisions made by program participants
6. Co-investment to cover the costs of implementation of the LAP program
7. Position, interest and underlying interest of leaders
After extended dialog, research into the above factors, and a commitment
from the local community, the Casey Foundation decided whether to support the
initiative through funding and logistical assistance. The percentage funded by the
Casey Foundation varied from LAP to LAP. The Maryland statewide LAP and
Baltimore City LAP was fully funded by Casey since these groups were the first
collaboratives and given that Casey’s headquarters are in Baltimore; however, staff
are unsure as to whether the other Maryland LAPs were funded at the same level.
Once LAP sites moved out of the state, communities definitely shared in the cost.
LAP budgets have varied according to the region and the issue, ranging from
$270,000 – $500,000. Sometimes included in the budget were in-kind donations
from Casey such as logistical support in the form of staff, meeting materials and
location. The Annie E. Casey Foundation provided a percentage of the resources
with the community was responsible for the remaining amount. Usually fundraising
was the responsibility of the community partners.

25
Community partners invited members based on their relation to the issue of
interest and the potential resources they could bring to the group. For instance, if the
LAP was designed to improve early childhood education, members were invited from
the Department of Education, the Department of Human Services, nonprofit groups
working in that field, as well as teachers and parents. A committee was formed by
those community members working with Casey and tasked with generating a list of
40 – 50 appropriate members. Sadie said, “The criteria was people with authority to
make decisions, easy access to those able to make decisions, etc. We were looking
for balance in the sectors as well as a geographic balance. [Also] part of it was
whether we could we have enough understanding of the person or the organization
and interest to know if we were creating a cohort that had a high likelihood of
success… nobody got eliminated because they had a reputation for being obstinate or
isolated but it was important to have the knowledge and understanding as we put
together a cohort.” LAP resource documents note that communities should look for
participants with the “know-how, resources and willingness to take an active role in
impacting the result, people like agency managers, business people, leaders of
nonprofits, public officials, advocates, faith leaders, resident leaders.” Additionally
they state that participants should: “have a stake in the population/result; have
influence with/within an important organization or group/network (is a decision
maker or can influence/has ear of decision makers); bring significant human or
financial capital; hold critical or necessary knowledge/expertise; and reflect the
diversity of the program population”.

26
Once participants were identified, they were invited by the community
partners to join LAP. Letters and calls were placed to the supervisors or agency
directors of members to encourage support from the top level of organizations.
Membership in LAP was entirely voluntary as was attendance at scheduled meetings.
Those interested came to an initial meeting where the concept and framework of LAP
was presented. Not all that came to that meeting decided to continue involvement
and it was not unusual to see a drop off of participants in the first few meetings.
Support staff (usually from a local outside agency paid through the LAP
program) was present at every meeting to take detailed notes and document key group
decisions and work commitments made by members. Each LAP collaborative met
for two full days every four to six weeks for a total of ten meetings; therefore, each
LAP lasted approximately one year in its most formal form. Casey funding ended
after this time; however, many groups continued with varying success in raising funds
and varying models for continuing their work.
While LAP groups may have had some unique characteristics, they functioned
in much of the same way as other community collaboratives and followed many “best
practices” suggested in the literature, including a specific framework for
implementation. Bryson, Crosby, and Stone (2006) describe the leadership challenge
in cross-sector collaboration as the difficulty in “aligning initial conditions, processes,
structures, governance, contingencies and constraints, outcomes, and accountabilities
such that good things happen in a sustained way over time.” The LAP program was
built on the premise that successful collaboratives are those that not only create
formal accountability structures, but also build collaborative leadership skills that

27
foster competencies in using data to make decisions; address issues of disparate
outcomes based on class, culture and race/ethnicity; develop the ability to manage
and resolve competing agendas across agencies to move work forward; and leverage
relationships and resources to make and model practices or implement strategies in
one’s home agency (Pillsbury, 2008). These competencies are detailed further below.
Program developers maintained that once these collaborative leadership skills were
developed, participants’ individual efforts became aligned. Sadie noted the
importance of “creating the space to do the work, having the right tools to do it,
having the skilled facilitator to do it, being authorized by your supervisor to do the
work because its important, and people consistently showing up.” To develop the
competency of collaboratives to do this work, the LAP framework included four
specific components, namely: A Strong Accountability Partner, A Skilled
Implementation Team, Participant Accountability, and Collaborative Leadership
Development. These components are described below.
Strong Accountability Partner
Before a LAP was launched, the Annie E. Casey Foundation worked with
elected officials and/or top leaders in community organizations who had agreed to
lend public support to the collaborative and provide accountability to the group. LAP
called these individuals “accountability partners,” mirroring the literature’s call for an
outside authority to legitimize the group and provide additional accountability
(Bryson, et al., 2006; Page, 2008; Wohlstetter and Malloy, 2005; Human and Provan,
2000). Accountability partners were cross-sector groups of high-level leaders from

28
the public, nonprofit and private sectors. Public-sector participants at the state level
have been the governor and/or key designees. At the local level, participants included
mayors and their designees, council members, school superintendents, or county or
city managers. Nonprofit participants included heads of large national or local
foundations, the CEO of the United Way, or heads of relevant public-private
governance or planning bodies. These partners identified the specific issue to be
addressed by the collaborative, data indicators, and financial and logistical resources
to support the collaborative. They also identified community members, inviting them
to join the collaborative. Although these individuals and groups were important in
motivating the work of the collaborative, they were not actually involved in the work
as the collaborative remained independent from the accountability partners as it
developed strategies to address the social issue and implemented community-wide
initiatives related to those strategies.
Skilled Implementation Team
The model included an implementation team comprised of several individuals
who took on key roles, including neutral facilitators, a project manager, and a
documenter. At each meeting trained facilitators worked to build the leadership skills
and capacity of the members while guiding the group from planning to
implementation. Collaboratives face various issues of power with different actors
occupying different roles and positions of authority (Agranoff, 2006). Facilitation is
an important way for these groups to have a structured or intentional way to deal with
these power imbalances and other areas of conflict (Bryson et al, 2006: Herranz,

29
2007). The LAP program framework sought to establish trust and diminish political
barriers that impede action.
Facilitators sought to provide a structure to meetings and coached
collaborative participants on specific components of leadership competencies. Their
role was to manage conflict and maintain progress. The role of the project manager
and documenter was to ensure that the practical needs of the collaborative were met
(such as lunch and meeting space), and that all key decisions and commitments were
recorded and publicly available to all collaborative participants. Together the
implementation team helped the collaborative manage its relationship with the
accountability partners. The implementation team also provided the tools necessary
to increase individual participant accountability and to develop strong collaborative
leadership skills. Like the role of the Accountability Partners, the implementation
team had a neutral role, and was not actively involved in the work of the
collaborative; rather they sought to create a productive environment and provide the
necessary tools so all decisions and work could be conducted by the group.
Participant Accountability
Many scholars in the literature maintain that cross-sector collaborations are
more likely to be successful when they have an accountability system that tracks data,
processes, and results (Bryson et al., 2006; Bardach and Lesser, 1996; Page, 2004;
Bardach, 1998; Linden, 2002; Babiak and Thibault, 2009). Each LAP collaborative
was responsible for building an accountability system and performance measures that
best suited the group. The collaborative participants co-created their own

30
performance management system using a set of tools, behaviors, and skills that
allowed for a system of continuous assessment and improvement of efforts for
ongoing management of the process (Pillsbury, 2008). These specific tracking tools
were designed to promote a shared commitment to completing work related to
strategies. During each session, the facilitators introduced tools that allowed
members to publicly commit to specific action items throughout the course of the
session. Members were given a form at the end of each session on which they were
asked to brainstorm several tasks that they could complete, and how each task was
related to a specific strategy. They were then asked to write down the task(s) they
would complete, how they would complete it, and an estimated date for completion if
applicable. Members were also asked whether they would complete the task alone or
with partners. These work commitments were not required, so members could
commit to however many tasks they felt they could complete, with some members
making no commitments. They were given a copy of this form to keep, and submitted
a copy of the form to the facilitators. All the commitments documented on the form
were then entered into session notes that all group members could access. This tool
was not required, but a majority of the groups used it nonetheless.
While work commitment forms provided a formal structure for volunteering
to complete tasks related to the collaborative’s goals, members were also encouraged
by facilitators and one another to make work commitments at any point during the
two-day session. Members may decide to make a work commitment in this more
informal way during group discussions or strategy meetings. These commitments,
along with details on how they would complete them and if they would complete

31
them with partners, were also documented in the session notes that were easily
accessible to the individual and other LAP members. Finally, at each session
members reported on the progress they made between sessions on any commitments
made at the previous sessions. They were encouraged to report on commitments made
through the forms, as well as any informal commitments. All progress was then
documented in the notes.
Collaborative Leadership Development
Collaboratives are noted in the literature as experiencing issues of capacity as
they are often undermanaged, experience inadequate managerial structures, and
confront a free-rider problem among partners (Babiak and Thibault, 2009; García-
Canal, et al., 2003), thus a successful collaborative should address these issues. The
LAP model sought to have collaborative participants develop active listening skills,
negotiation skills, and collaborative problem-solving skills so they were able to make
productive decisions as a group and include the perspectives of all collaborative
participants. The literature notes that collaborative leadership skills lead to stronger
relationship patterns that emphasize cooperation among collaborative participants
(Kickert & Koppenjan, 1997). Collaboratives are successful when participants
cooperate and coordinate their work (Thomson and Perry, 2006; Huxham and
Vangen, 2005); thus training collaborative participants to build open and supportive
relationships should enable them to be successful in these interdependent groups.
The LAP framework includes a leadership development component that
focused on the development of four leadership competencies: results-based
accountability; race, class, culture; leading from the middle; and collaborative

32
leadership skills. The results-based accountability competency sought to build the
ability to use a process to take immediate action at a scope and scale that contributed
to measurable improvement in a community result (Pillsbury, 2008). The framework
included tools that assisted participants in developing and using performance
measures to track the effectiveness of their strategies and actions. The race, class and
culture competency sought to build the ability to engage in constructive dialogue
about race, class and culture that enables leaders to take action to address issues of
disparities. The leading from the middle competency sought to build the ability to
use leadership skills to achieve consensus, resolve conflict and competing interests
while enrolling managers (and above) as well as direct reports and peers to assist in
implementing strategies that work. Finally, the collaborative leadership competency
introduced tools to assist in the ability to make decisions and take action together in
service of a goal (Pillsbury, 2008). This included a consensus decision-making tool as
well as taking and sharing individual leadership assessments such as the Myers-
Briggs Type Indicator. Facilitators spent time focusing on these specific areas of
leadership development by leading capacity building exercises to strengthen these
skills and by incorporating specific tools while members worked to develop and
implement strategies. These competencies were discussed and practiced regularly
throughout the course of each LAP.
Background on LAP Cases
This research analyzes six LAP collaboratives from different areas of the
country. All but one focused on school readiness, while the sixth focused on reducing
33
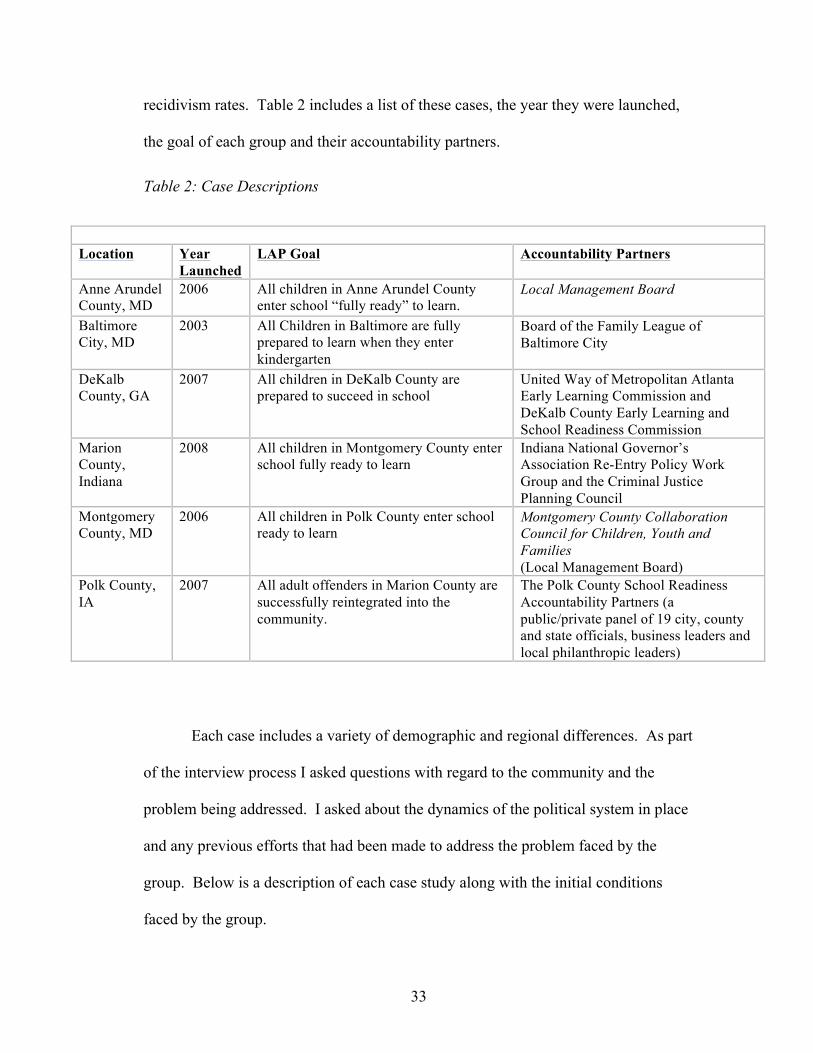
recidivism rates. Table 2 includes a list of these cases, the year they were launched,
the goal of each group and their accountability partners.
Table 2: Case Descriptions
Each case includes a variety of demographic and regional differences. As part
of the interview process I asked questions with regard to the community and the
problem being addressed. I asked about the dynamics of the political system in place
and any previous efforts that had been made to address the problem faced by the
group. Below is a description of each case study along with the initial conditions
faced by the group.
Location Year
Launched LAP Goal Accountability Partners
Anne Arundel County, MD
2006 All children in Anne Arundel County enter school “fully ready” to learn.
Local Management Board
Baltimore City, MD
2003 All Children in Baltimore are fully prepared to learn when they enter kindergarten
Board of the Family League of Baltimore City
DeKalb County, GA
2007 All children in DeKalb County are prepared to succeed in school
United Way of Metropolitan Atlanta Early Learning Commission and DeKalb County Early Learning and School Readiness Commission
Marion County, Indiana
2008 All children in Montgomery County enter school fully ready to learn
Indiana National Governor’s Association Re-Entry Policy Work Group and the Criminal Justice Planning Council
Montgomery County, MD
2006 All children in Polk County enter school ready to learn
Montgomery County Collaboration Council for Children, Youth and Families (Local Management Board)
Polk County, IA
2007 All adult offenders in Marion County are successfully reintegrated into the community.
The Polk County School Readiness Accountability Partners (a public/private panel of 19 city, county and state officials, business leaders and local philanthropic leaders)
34
Maryland Cases: Anne Arundel County, Baltimore City, and Montgomery
County
Anne Arundel County, Baltimore City, and Montgomery County varied
widely in their demographic and scope of the problem despite all being located in
Maryland. The statewide Maryland LAP mentioned above is not included in this
analysis. Upon completion, Baltimore City decided to build on the collaborative
initiative and launch the first local LAP program in 2003. Anne Arundel and
Montgomery County followed three years later. Each LAP included members that
either knew people who had participated previously or had participated themselves in
the State LAP; therefore, some participants had been exposed to the LAP framework
prior to joining their LAP group. Some held positive views of their experience while
were more negative, there does not seem to be an overall trend.
Baltimore City is a diverse, urban area that had by far the lowest school
readiness scores in the state of Maryland with only 26.5% percent of kindergarten
students scored fully ready to learn in 2003. The state average for Maryland at that
time was 55%. The school system was described as “a mess”. Yet, this also
presented an opportunity that motivated community members to come together. The
State Department of Education was said to be pushing early childhood. The area had
received grants from the Safe and Sound Campaign and the Robert Wood Johnson
Foundation. The United Way and the Family League (Baltimore’s Local
Management Board) had already started a joint effort to address early childhood.
Once Casey agreed to fund the Baltimore City LAP, the Family League agreed to

35
serve as the group’s accountability partner. At that time the role of the accountability
partner was not yet developed, and the Family League saw themselves as a neutral
convener. My interviews indicate confusion over their role, some called them a
convener, some named them as a group in which the LAP reported to and felt
accountable, while some said there was no such group serving that role.
Anne Arundel County houses the state capitol and includes both prosperous
areas and areas of need. Outlying regions lack access to public transportation. The
kindergarten readiness score for Anne Arundel was 68.6% of students entering fully
ready to learn when LAP launched in 2006, which was one and a half points above
the state average in that year. Participants described the early childhood climate as
one with silos and in which previous administrators lacked interest in early childhood
readiness. The previous county executive “did not have early childhood on his
radar,” according to one participant. The early childhood education community,
predominantly licensed childcare and Head Start, had a difficult time getting support
from county government and the school system. The previous director of early
childhood services in the school system was described in an interview as biased
against caregivers that were not authorized teachers in the school system. Members
also mentioned the county did not have sufficient pre-k programs and many were
skeptical at the launch of LAP around their ability to work together for a
comprehensive approach.
Montgomery County is one of the wealthiest counties in the country according
to median household income statistics gathered by U.S. Department of Commerce
Economic and Statistical Administration U.S. Census Bureau. A suburb of

36
Washington, D.C. Metropolitan Area, it has experienced a substantial amount of
recent immigration and a large increase in people at or below the poverty line over
the last 10 – 15 years. When Montgomery County launched its LAP in 2006, 68.3%
of kindergarten students were entering fully ready to learn. A participant described
the childcare situation as including a lot of providers but fairly diffuse, meaning
centers ranging from informal home-based care to private day cares spread
throughout the county. The superintendent was not described as supportive of early
childhood education efforts. Yet Montgomery County had a history of working
together and in fact already had a group that had formed to target early childhood
readiness. One participant said, “We have had a long history in Montgomery County
of working towards promoting a coordinated early childhood system…” A task force
was formed in the mid-1990s, which produced a report with recommendations to the
County. In 1999 a large group of over 100 people led by the local management board
came together and completed a community needs assessment, which included a
“massive amount of work”. This initiative led to a large document with initiatives
and plans for early childhood. The County Council contributed over $1,000,000 to
the plan. LAP was said to have come along at a good time to give this initiative a
“shot in the arm” to reinforce their work. One member said she was hoping LAP
would help them move to the next step.
Counties Outside of Maryland: DeKalb County, Georgia; Polk County, Iowa;
Marion County (Indianapolis), Indiana
The next three case studies took place outside of the state of Maryland.
37
DeKalb County, Georgia, and Polk County, Iowa, were launched in 2007 and
established the first out-of-state LAPs conducted by the Casey Foundation. While
these two counties had reliable community data at the start of LAP, both Georgia and
Iowa discontinued the use of their indicator down the road, leaving them with no data
indicator. The Marion County (Indianapolis) Indiana LAP was launched in 2008. It
represents the first time Casey funded a LAP that was not focused on early childhood
as it focused on lowering recidivism rates and reintegrating adult offenders into the
community. Casey chose this site as they had existing relationships with people in
the community and other programs addressing recidivism. They were also interested
in trying the LAP framework in a different social issue than early childhood
education. The community data for this collaborative was an internal data source that
experienced some issues as the LAP progressed, detailed further below.
DeKalb County is described as a very large, very diverse county in Georgia.
It is a minority majority county with a high foreign-born population and part of
metropolitan Atlanta. Over fifteen percent of the population is living below the
poverty level. The area was described as a likely target of the federal government to
locate refugees from around the world; therefore, there were existing concerns about
immigrant children and “underground” childcare not registered with the state. The
licensing process for pre-k is very difficult. Members noted the presence of multiple
groups within the county addressing early childhood prior to the implementation of
LAP. Participants described some “angst and confusion” over LAP since they had
just begun the DeKalb Early Learning Commission. The Commission served as one
of the Accountability Partners for the group. In addition, the United Way had

38
received a SPARK grant from Kellogg five years prior to LAP that also focused on
early childhood initiatives. The United Way was also an Accountability Partner;
however, some participants referred to them as a convener and not an Accountability
Partner. Shortly after DeKalb County launched, the state of Georgia decided to
abandon its use of the first grade data indicator, leaving the group with no good data
to measure early childhood outcomes. This struggle continues today.
Participants described Polk County, Iowa as an increasingly diverse
community, with one elementary school having such a diversity of background
amongst the children that more than 26 languages are spoken within the school. Polk
County also had an existing early childhood readiness group prior to LAP. One
participant noted that you could go back into the early 90s and late 80s for
collaborations that have been formed to address early childhood. Beginning in
2001/2002 the state of Iowa began distributing large funds, called Community
Empowerment Funding, targeting early childhood initiative and school readiness.
The United Way of Polk County was described as a major player in the community,
serving as the convener that brought people together to formulate a plan for the
Empowerment funding and later the convener for LAP. The group in Polk County
developed strategies and goals for using this funding prior to LAP. In addition, Polk
County had served as one of Casey’s Making Connections sites, a program that
includes a long-term grant for “1) promoting family economic success for parents,
and 2) ensuring that children get a good start in life, succeed in the early grades of
school, and are reading proficiently by the end of 3rd grade.”
(http://www.aecf.org/MajorInitiatives/MakingConnections.aspx)

39
Indianapolis is the capital of Indiana and the second largest city in the
Midwest after Chicago. It is largely urban and includes the highest recidivism rate in
the entire state with 30.4% of offenders returning to jail within 12 months of release.
One member thought the number was as high as 50 percent within a three-year period
of time. Many members of this LAP discussed the fact that there were previous
tensions and political difficulties existed. One member said it was a political
quagmire, “like trying to get a line of elephants to dance together”. They discussed
silos and issues of power. In addition, the Mayor’s office launched an initiative
targeting recidivism at the same time as LAP, despite the Mayor’s office being one of
the Accountability Partners for LAP. This has served as a duplicate/competing group
to this day.
The six cases presented here provide a diverse and robust vehicle for
understanding collaborative design and effectiveness. Representing two topic areas
and three separate regions in the United States, these collaboratives allow for variance
in population and approach to community work. The next chapter will explore
collaborative effectiveness and understand the performance of these six groups.

40
Chapter 3: Examining Effectiveness and Understanding Outcomes
One of the key questions in this research and in the literature is whether
collaboratives produce outcomes that otherwise would not have occurred, given the
difficulty surrounding achieving tangible outcomes (Agranoff and McGuire, 2001;
Behn, 2001; Bryson, Crosby and Stone, 2006; Babiak and Thibault, 2009). In order
to understand collaboratives we must be able to identify the strategies and
interventions conducted by the group and measure their resulting outcomes (Agranoff
and McGuire, 2001). McGuire and Agranoff (2007) note that collaborative outcomes
must be the ultimate dependent variable, in spite of the conceptual and empirical
roadblocks that presently make such an undertaking so challenging.
This chapter examines the effectiveness of these six collaboratives by
adapting and expanding the Provan and Milward (2001) framework. Collaborative
effectiveness is defined as providing value to collaborative participants, organizations
and local communities in ways that could not have been achieved through individual
agencies alone. This research evaluates effectiveness at the community, network and
organization/participation levels. It analyzes both the interventions, defined as the
implementation of strategies and programs, as well as outcomes of collaborative
action.
My research questions ask: What is the relationship between design process
and effectiveness? Do certain elements of the design process, such as accountability
methods or strong relationships, make greater effectiveness more likely? In order to
determine this, I must first determine which of the six cases were effective and
achieved stronger outcomes. This chapter presents a framework with which to

41
evaluate collaborative effectiveness at the community, collaborative, and
organizational/participant level. Since not all outcomes are alike, I research and
present the best practices in the literature with regard to addressing the community
issue at hand in order to determine the level of effectiveness achieved. The research
presented in this chapter shows varied levels of effectiveness achieved by the six
collaboratives and findings from these analyses allow me to group the six
collaboratives into different levels of effectiveness. This chapter will conclude with
an understanding of the effectiveness of each collaborative at each level. In Chapter
Four and Five, I use these groups to analyze the relationship between process and
collaborative outcomes, answering a key research question of whether certain
processes make effectiveness more likely.
Methods and Data
Survey information, coded interviews, and supplementary document analysis
provide information with regard to the planned and implemented interventions in
each initiative as well as the outcomes obtained by each group. Notes taken by
collaborative staff contained meeting decisions and group strategies, as well as the
overall goal for each collaborative. As noted, each group had one overarching goal
and was charged with creating and implementing strategies to address that goal. The
notes include strategies, or plan of action, developed by each group. I use a coding
system developed by the LAP research team (of which I was a part) to code the
strategies and interventions on their potential impact or strength. This coding outline
is documented in the Appendix B. The strategy ranking is included as a variable in
this analysis.

42
I conducted semi-structured interviews with a total of 27 members, with three
to six people from each group interviewed. I used heterogeneity sampling in order to
include a wide variety of opinions and views from each collaborative. The LAP
members interviewed were from the public, private, and nonprofit sector, and their
opinions and involvement in the collaborative varied. To ensure a diversity of
perspectives, I used data from the original collaborative, such as job title and
attendance, as well as snowball sampling, where I asked those interviewed for
recommendations of additional people with different perspectives to interview.
During interviews I explored individuals’ backgrounds and roles within their home
organizations, external factors in the community affecting collaboration, the
collaboration process, and outcomes generated from the group. Participants were
assured anonymity and encouraged to openly discuss the benefits, challenges,
successes and failures associated with the collaborative. Interviews were conducted
by phone and lasted thirty to sixty minutes. Each interview was transcribed and then
coded using NVivo, a qualitative research software. I then took the coded
information and analyzed it for themes within and across collaborative groups to
distill important information. This allowed me to draw conclusions based on patterns
and similarities within and across groups. The discussion and results section includes
quotes and findings based on the themes and patterns that emerged in this coding, not
simply one or two comments. Interview questions are located in Appendix C.
Part of my data comes from the Results Based Leadership Collaborative at the
University of Maryland School of Public Policy where I served as a research assistant
for three years. My role was to assess current Casey program methods, use the

43
information for assessment of success/impact, and identify areas for quality
improvement to enhance program design and implementation. I also collected data,
outlined research methods and implemented research projects. A survey was
conducted as part of a research initiative that included eight LAPs from across the
country, six of which are the LAPs in my sample. Participants were contacted via
email and invited to participate. In exchange for completing the survey, they were
offered one chance to win a $100 Amazon gift certificate and six chances to win a
$25 Amazon gift certificate. As part of this research team, I designed and
implemented the survey where I included information sought by both the team and
my dissertation research questions. Questions from the survey are listed in Appendix
D. Two hundred participants from these six case studies were initially contacted and
100 people took the survey, a response rate of 49.3%. Response rates for each group
varied, with DeKalb County receiving the highest at 77.3% and Montgomery County
the lowest at 32.4%. A breakdown of the response rates as well as survey
demographics are located in Appendix E.
A link to the survey was provided in the initial contact email. Once
participants began the survey they were informed that the goal of the survey was
program evaluation and being undertaken for research purposes and that their
responses would be kept entirely confidential and anonymous. They proceeded to
respond to various questions regarding their impressions of LAP in its infancy and
later in the LAP process as well as after the first year of implementation. The survey
included 135 questions; however, for the purpose of this chapter I use only the 34
questions related to my research question.

44
The survey data show areas for potential bias. When asked whether survey
participants were satisfied with the outcome of LAP and whether they considered it a
success, Anne Arundel was uniformly positive. This could indicate that their results
are biased toward the positive; however, this group did enjoy an almost 60 percent
response rate. Baltimore City’s survey results may be skewed given the amount of
time that has lapsed between participants’ involvement and the survey. The
Baltimore City LAP was launched in 2003 and was disbanded in 2008. This means
any participant had to recall details from 4 – 10 years ago. It was apparent in
interviews that at times members struggled to recall events and specifics;
nevertheless, often once they began talking and responding to questions many times
they were able to recall more information. Over 80% of Montgomery County survey
participants are still involved in the group; therefore their results may be skewed
more toward the positive given they are still involved. Other groups averaged
between 50 and 60%, except Polk, who did not continue to meet as a group after the
formal LAP ended. At 32.4%, this group also possesses the lowest response rate.
Collaborative Effectiveness: A Qualitative Framework
While there has been an increase in research focusing on the management of a
collaborative and the components of these groups, little attention has been paid to the
outcomes of the collaborative as a whole (Provan and Milward, 1995; Agranoff and
McGuire, 2001; Zakocs and Edwards, 2006). Provan and Milward (2001) note that
much of the current research surrounds how to build networks and is largely
anecdotal, while studies empirically linking group factors to effectiveness are missing

45
altogether. They also note that while networks have become a common mechanism
for the delivery of public service, “evaluating their effectiveness is extremely
complex and has generally been neglected.” This complexity comes from the fact
that these groups include multiple organizations with multiple constituents who hold
a variety of interests and needs, therefore making assessment problematic. Provan
and Milward also cite the scarcity of good comparative data that are tied to outcomes
as a reason for few studies focused on effectiveness.
Provan and Milward (1995) offer one of the most thorough examinations of
network effectiveness by comparing community mental health systems. The authors
collect data from surveys, interviews, documents and observations of agencies within
the network system as well as outcome
data from samples of clients, their
families and case managers. They
conclude that effective networks: are
integrated and coordinated centrally
through a single core agency; include
external control and funding systems
that are direct and cohesive; enjoy
adequate resources; and include
conditions of general sustainability.
Later work by Provan and
Milward (2001) offers a framework for evaluating service network effectiveness at
the community, network and organization/participation levels. They argue that
Figure 1 Provan and Milward (2001) Summary of Network Evaluation Relationships

46
different views of effectiveness at each level need to be considered when researching
collaborative outcomes. A summary of their suggested variables can be seen in Figure
1. This theoretical dimension is considered critical in the literature considering
networks, yet there are few studies that have been able to replicate the depth of their
analysis (McGuire and Agranoff, 2011) and none have adapted their work for
collaboratives.
A decade later scholars are still calling for more research addressing the
effectiveness of collaboratives (Herranz, 2009; McGuire and Agranoff, 2011).
Herranz (2009) builds on Provan and Milward’s (2001) work by adding a robust
framework to inform network performance management. Herranz uses indicators to
reflect Provan and Milward’s framework but limited his variables during his analysis
of three case studies due to data availability. In addition, his study did not include
preexisting performance targets by which to compare the groups and their outcomes.
Herranz (2009) also notes that neither his study nor Provan and Milward’s include
accountability as a factor, stating this as an important aspect for future work. Finally,
he suggests that an analysis that connects a sequence of processes to the outcomes
achieved by a network is needed for future analysis.
While an argument has been made here and in Chapter One for the importance
of measuring effectiveness at multiple collaborative levels, issues remain around
evaluation itself that have yet to be addressed in this discussion or in Provan and
Milward’s framework. Collaboratives often resist traditional evaluation given their
complexity and the difficulty in linking the actions of collaboratives directly to
community level outcomes, yet much of the current research does not distinguish how

47
best to delineate and define the many actions of collaboratives, instead grouping
together all collaborative actions as performance outcomes. Baum (2001)
distinguishes between interventions and the outcomes of these actions. While
traditional evaluation assesses the outcomes of a program or policy based on a set of
standards for improvement (Weiss, 1998), collaboratives do not fit this model for two
reasons. First, the goals of community initiatives, such as affecting change in
community institutions and community populations, are complex and difficult to
define. Second, the strategies associated with collaboratives require broad alliances
and coalitions in order to be implemented, adding to evaluation complexity (Baum,
2001). This suggests researchers should distinguish interventions separately from
outcomes. Baum (2001) recommends considering the intervention’s community
effect, or influence on community structures, policies and practices. He also suggests
looking at both short and long-term effects. Finally, he notes that community
initiatives are experiments, and will be partially successful at best, yet even those that
fail offer opportunities for learning; therefore, it is even more important to analyze the
implementation process or interventions in addition to outcomes.
In this chapter I provide a more robust approach to implementing Provan and
Milward’s (2001) framework than Herranz while also considering both the
interventions and outcomes of collaboratives. With six case studies and a survey, I
am able to better develop dependent variables that reflect the Provan and Milward
framework while also expanding the framework to include an analysis of
interventions based on their potential to affect community outcomes by using best
practices informed by the literature. My framework includes indicators related to the
48
process by which the collaborative sought to achieve outcomes, another important
distinction not made in previous research. These include variables such as
accountability, resource generation and membership commitment. Unlike Herranz,
each case includes predetermined performance targets and strategies for
implementation, taken from collaborative notes collected in the first year. I am able
to analyze the strategies outlined in each case and compare actual outcomes with the
overarching goal of each group. Finally, I adapt Provan and Milward’s (2001)
framework adjusted for a non-hierarchical, voluntary community collaborative rather
than large networks whose main focus is service provision. Variables in their
framework related to service provision are self-evident and thus removed, with
additional variables added based on theory from the collaborative literature presented
earlier.
The following analysis will utilize an outlined framework to determine the
overall level of effectiveness for each of my six collaboratives and break groups into
high, moderate, and low performing groups. These distinctions are noted below as I
outline the framework variables. Additionally it is important to note that the three
levels of analysis should not be considered equal when it comes to outcomes.
Community level outcomes and interventions are the ultimate goal of a collaborative
and will therefore be weighted the highest in this analysis. Collaboratives and
collaborative administrators look to satisfy the community outcomes first,
collaborative outcomes (and survival) second, individual/organization last (Provan
and Milward, 2001); therefore, this research will consider these weights in the
analysis.

49
Analysis Variables
My framework and each effectiveness measure are defined and detailed
below. A comparison of my variables to that of Provan and Milward (2001) is
located in Appendix F. The framework includes a consideration of both the
interventions and outcomes related to collaborative actions. It also includes
indicators related to the process by which the collaborative sought to achieve
outcomes.
Community Level Evaluation
Table 3 Community Level Framework Variables Community Level Variables Data Source Definition of Variable
Implementation of best practice community-wide initiatives
Survey and Interview
Survey questions asked whether the LAP group has or plans to implement community-wide initiatives and whether these initiatives will have a significant impact on the problem being addressed. Interviews generated a list of initiatives, and these initiatives are then compared to best practices in the literature in order to evaluate their potential for affecting community outcomes.
Implementation of new policy or legislative change
Survey and Interview
Survey questions asked whether the group was able to make changes or create new policies to better serve their community and whether those were local, state or national policy changes.
Changes in the incidence of the problem
Survey and Interview
Questions asked whether the work of LAP resulted in a positive change associated with the problem being addressed (i.e. recidivism or children entering school ready to learn) and had a strong potential to greatly impact the problem.
Provan and Milward (2001) note, “At the broadest level of analysis,
community-based networks must be judged by the contribution they make to the
communities they are trying to serve (p. 416).” My framework includes three
measurements at the community level: Implementation of best practice community-

50
wide initiatives; implementation of new policy or legislative change; and changes in
the incidence of the problem. In order to change a community indicator such as child
readiness and recidivism, extensive community-wide initiatives and interventions
usually must result from the collaboration. The facilitators encourage members to try
a strategy or program in an area, then take it to a larger scale and replicate it for the
larger community.
The first measurement includes an analysis as to whether groups implemented
best practice community-wide initiatives. The survey and interviews asked whether
these groups have or plan to implement such initiatives and whether they think these
initiatives will have a significant impact on the problem being addressed.
Additionally, these interventions must be worthwhile and at a level to actually affect
the problem at hand. While developing the strategy coding system mentioned above,
the LAP research team (of which I was a part) identified best practices in the
literature with regard to childhood readiness and recidivism. A checklist was created
to evaluate whether strategies followed these best practices, and these are located in
Appendix B. Overall the literature notes the importance of child physical health,
child mental health, parental ability, family/parent demographic characteristics, home
characteristics, early education from parents, and early childcare characteristics when
addressing issues in school readiness. With regard to recidivism, the literature points
to the importance of addressing issues related to employment, health, housing,
substance abuse, and family and community issues. I utilize this checklist when
evaluating the interventions described by the participants during interviews. A high
performing collaborative will have multiple initiatives related to these best practices

51
while a low performing group will have few if any initiatives and one or less
connected to best practices.
The second variable considers whether the group implemented new policy or
legislative change. Often policy or legislative change is an important outcome from
collaborative groups if they are negatively affecting the target population. Questions
were posed in the survey and interviews as to whether the group was able to make
changes or create new policies to better serve their community and whether those
were local, state or national policy changes. Unfortunately interviews did not include
a specific question related to policy or legislative changes so we cannot determine
specific changes to evaluate unless noted spontaneously by interview participants.
Since this variable is community dependent, it is not essential for high performing
groups; however, those groups demonstrating this outcome will be given more weight
for effectiveness.
The final variable, changes in the incidence of the problem, relies on
individual interpretation with regard to community level change, a method endorsed
by scholars (Agranoff, 2007; Klijn and Koppenjan, 2000; Chen, 2010) and important
given not all of my cases have community data available. I was able to ascertain
through survey and interview questions whether members thought aggregate changes
had occurred in the community and whether the LAP played a role in that change.
High performing groups demonstrate an impact on community changes and believe
their efforts contribute to community level data change. Low performing groups
either do not consider or demonstrate community impact or are satisfied with efforts
not intended to create higher level aggregate changes.

52
Collaborative Level Evaluation
Table 4 Collaborative Level Framework Variables Collaborative Level Variable Data Source Definition of Variable
Membership commitment and growth
Survey and Interview
Questions asked about membership commitment in the early and later stages of the LAP. Questions around membership attrition and growth/membership post Casey funding were asked in the interviews.
Member Driven Accountability System
Survey and Interview
Questions asked whether the group employed strategies to ensure people were responsible for their work commitments, whether this responsibility was informal or formal, and whether driven by coach facilitators or members themselves. The survey measure looks at the percent of people that said the accountability was driven by members and the percent change of this perspective from early to later in the process.
Collaborative Self-Assessment and Outcomes
Survey and Interview
Questions asked whether the resulting plan from their LAP group addressed the needs, concerns, and values of the organization they represented as well as whether they were satisfied with the current outcomes(s) of the LAP process. Interviews inquired into the level of conflict the group experienced as they decided upon strategies and the individual’s overall evaluation of collaborative outcomes. The strategy impact variable includes strategies coded by impact or strength according to best practices in the literature.
Continued existence of collaborative and resource generation after first year
Survey and Interview
Survey variables include the percent of respondents who continued to meet after the last session, and the percent who meet regularly today. Interviews asked questions around the current group and its administration. Survey and interview questions asked whether their LAP group was able to generate new and/or additional funds to continue their work, information on the different types of resources and fundraising efforts conducted by the group as well as their overall level of difficulty in acquiring funds.
Collaborative level variables consider those that related to the establishment
and survival of the collaborative in order to generate and implement interventions and
outcomes. My analysis looks at the establishment and strength of strategies, whether
members are accountable to those strategies, and whether the group established an

53
administrative framework upon the completion of the Casey grant that generated new
revenue for the group. Additionally I consider the level of member commitment and
growth of the collaborative as a whole. During interviews I was able to ascertain
whether the group struggled with membership, whether the members felt there was a
higher than normal level of attrition as the group went forward, and whether the
group has continued to grow after the Casey grant ended. Finally, I looked at whether
participants established a structured mechanism to encourage accountability within
the group as well as the overall level of accountability among members. High
performing groups generated strategies connected to the best practices in the
literature, included committed and accountable members, did not experience a high
level of attrition as the process progressed, and established a structured group that
continued to raise resources after the initial Casey grant.
Organization and Participant Level Evaluation
Table 5 Organization/Participant Level Framework Variables Organization/Participant Level Variables Data Source Definition of Variable
Individual self-assessment of personal skills and relationships
Survey and Interview
Survey questions asked whether the participant has gained new or improved skills; better working relationships with other individuals involved in this work; participated in new initiatives or activities (independent of LAP activities); has a better understanding of this issue and the population served; made contacts that are useful to them or their sector/organization. Interview questions asked about the leadership development component in LAP and whether participants had gained new skills personally.
Increased agency outcomes
Survey and Interview
Survey and interview questions asked whether the participant's involvement in LAP resulted in greater community legitimacy with clients and reputation with peers and funders and whether the participant's involvement in LAP resulted in participant's greater ability to obtain funds and acquire new resources for their individual

54
agency.
Increased client outcomes for organization Survey
Questions asked whether the participant's involvement in LAP resulted in increased ease of client access to services and whether the participant's involvement in LAP resulted in higher number of services offered, quality of services and coordinating care with other agencies.
Provan and Milward (2001) maintain, “Although network- and community-
level outcomes are valid ways of evaluating networks, it is important to recognize that
individual agencies and their managers are still motivated partly by self-interest.” (pg.
420) Members of collaboratives must first ensure the survival of their own agencies,
and being a member of a collaborative imparts costs, namely time and money. This
level of analysis looks whether agencies experience increased outcomes for their
organization as well as their clients. Since the Casey framework puts an emphasis on
leadership development, this level also includes a variable analyzing individual self-
assessment of new personal skills and relationships gained through the process. Since
this level is not as critical to overall collaborative effectiveness, it is not essential for
high performing groups to include positive outcomes with all of these variables;
however, those groups demonstrating outcomes at the level will be given more weight
for effectiveness.
Results:
Anne Arundel County: Community Level Effectiveness
Eighty-six percent of kindergarteners entered school ready to learn in 2011-
2012. This was up from 51% in 2001 when the test first launched and 69% in 2006
when the Anne Arundel LAP began. Members in Anne Arundel believe their efforts
have attributed to this rise, and described a long list of community-wide programs and
outcomes. One of the best practices methods for increasing school readiness is to

55
ensure children have access to books and that parents utilize the books and read to
their children. Anne Arundel has collected 15,000 – 20,000 books to distribute
through various service agencies. The group created a program with all the hospitals
in the county to ensure every child born in Anne Arundel is sent home with a book, a
packet for parents on early learning, and a library card. This intervention promotes
best practices related to increasing early education practices from parents. They were
also instrumental in getting the county a Judy Center, partnerships between local
school systems, local agencies, and community-based organizations for the purpose
of improving young children’s school readiness. Judy Center services include quality
early childhood education, health, and family support services (Achieving School
Readiness, 2002). The implementation of a Judy Center cuts across multiple best
practice recommendations around early childcare, child health, family characteristics
and early childhood family practices.
Mark, a longtime advocate for children in Anne Arundel, noted a variety of
programs resulting from the Anne Arundel LAP that are permeating different
populations, “We’re working with the medical community. There’s a doctor at the
Anne Arundel Medical Center who has started under the auspice of the Medical
Center a Community Health Center, and we’ve worked with him to include as a part
of the well baby visit developmental screening for all kids 0-5. And their population
is largely Hispanic, largely low-income…” He also noted that political leaders in the
county are now more aware of early childhood as an issue and the work is more at the
forefront of the county agenda. Mark continued, “Now we have some initiatives
going with the schools that are very promising. The county schools now have a Race

56
to the Top early literacy committee. The early childhood coalition is working with
that committee to do things like take programs that are successful at the Judy Center
and spin them out at the elementary schools. There was a parent and child program
that is going on at the Judy Center that shows parents how to play with their kids,
how to read with their kids. We’re hoping to spin that out in the fall to three more
schools.” Patricia, a member of the school system, concluded, “So when you put all
of that together, did it make a difference? Absolutely.”
One hundred percent of survey respondents reported changes in the incidence
of the problem and an increased awareness of the problem. Almost all participants
noted the implementation of community-wide initiatives. Two thirds of participants
reported a policy change from the LAP work and almost all report support from
legislators and external constituents. Members noted in interviews positive effects of
collaboration as well as engaging the school system for the first time. When
describing the greatest results from the group, Patricia summarized a common theme,
“I think [the effect is] two-fold. One it’s truly evolved into the early childhood
coalition, which is legitimately a partner with the school system. So it’s taken all of
the stakeholders… and everybody was doing their own thing… And now we’re all
working together collaboratively. Now we’re all on the same page. So that piece has
been invaluable.”
Anne Arundel County: Collaborative Level Effectiveness
All of people interviewed in Anne Arundel were extremely positive about
their relationships and the work they are doing. They mentioned very committed
people still involved in the effort because they felt the work was making a significant
57
difference. Betty, a social service provider, said, “I don’t know what it cost us… but
from my perspective, it was money well spent. Because it created something here, in
this county, that has lived on. I believe will continue to live on.” The survey shows
Anne Arundel with one of the highest positive changes in member commitment over
the course of the LAP. Anne Arundel has continued to bring in new members and
leaders have stepped up to facilitate the group. Overall those interviewed felt the
accountability among the group has been high and the group embraced the use of a
formal accountability system. Carol, a longtime member of the early childhood
community, expressed a common sentiment, “I am very sure that [the accountability
system] worked. Because we were on a mission to get things done. We knew we had
to get this done.”
While some experienced frustration at the speed and breadth of the strategy
process, the work in creating strategies did not include much conflict. Three quarter
of respondents felt the plan addressed the needs and concern of the agency and 100%
were satisfied with the outcome(s) of the LAP process. The strategies of Anne
Arundel scored the highest of all groups in terms of potential impact to affect the
issue of child readiness.
Half of those interviewed felt it was a struggle to create infrastructure and
obtain funding once Casey and its money left, but all interviewed mentioned that the
group has been able to fundraise and generate resources. Over 90% of survey
respondents noted the group’s ability to garner outside resources for their work. The
group has hired a part-time project manager and created a structure for continued
group performance, which includes tracking commitments and a formal decision-

58
making process. The group is hoping to expand its role and influence in the county
through a federal government early learning challenge grant called Race to the Top.
Mark described its impact, “Right now we’re waiting to find out what happens with
the new Race to the Top grant that Maryland got because it mandates early childhood
councils in every county, and we’re assuming we’re going to morph into that.” Carol
agreed, “Actually we’ve stopped doing that work [fundraising] as we’ve found that
the early learning challenge money is $40,000 in the first year, and if we get that
money, then that’s going to basically allow us to continue what we’re doing and
extend our strategic plan for another 5 years. We’re in our fifth year now, and we
really want to do an extension of the strategic plan.”
Anne Arundel County: Organization/Participant Level Effectiveness
The feedback around the leadership development piece of the LAP model was
mixed. Half of those interviewed in Anne Arundel felt their leadership skills had
increased while the other half felt they had them already. Anne Arundel showed the
highest survey results related to individual skill development and relationship
building as almost 90% noted improvement.
Interviews and surveys were also mixed around agency impact. Two-thirds
surveyed in Anne Arundel saw enhanced agency legitimacy and an increase in client
outcomes due to their involvement in LAP. Half of participants noted an increase in
service access and less than 40% noted organizational resource acquisition due to
LAP. Several participants noted in interviews specific ways their organization had
changed their strategy due to LAP. Betty said, “That whole getting kids ready for
school. If I’d of said, ‘That’s our mission,’ my [employees] would have said, ‘But
59
what’s that got to do with us?’ I was like, ‘Okay, well wait. Well, you work with
families with little kids. Let’s talk about how we can help parents have quality time
with their kids, be nurturing to their children and read to them.’ What a powerful
thing.” Patricia agreed. “[T]he school systems sometimes takes ownership of
anything that smells of school, the whole readiness thing. So this was truly the first
time… the school system is looking to other partners and truly saying we are
partners… My bosses said you have full sanction, I don’t care if you have a meeting
off school property, go do it.”
Baltimore City: Community Level Effectiveness
When the school readiness test was launched in 2001, only 28% of
kindergarteners in Baltimore City scored ready to learn. This number was an even
lower 26.5% in 2003 when the Baltimore City LAP formed. By 2006 this number
had risen to 58% and in 2011-2012 73% of kindergarteners enter school ready to
learn. Sarah, a member of the public sector, believed this rise is due in part to the
efforts of the Baltimore City LAP. “Oh, I think that’s across the board. Everybody
would say [LAP’s work contributed to the rise in test scores], that was the jumpstart
that was needed… I think that the conditions were right but… BLAP was kind of the
accelerant that [was] needed.” All participants but one in Baltimore City agreed with
Sarah that their efforts contributed significantly to this change in the community.
Participants described a number of successes during the approximately seven
years Baltimore City LAP was at work. The group was able to garner resources
though grant support that allowed for programs to increase early language acquisition.

60
Members created an estimated 8,000 – 10,000 literacy kits over a five-year period
that they distributed to home visiting organizations as well as child care organizations
to make the environment more literacy rich. This intervention promotes best practices
related to increasing early education practices from parents. The group also created a
Countdown to Kindergarten initiative that included both a communications strategy
as well as work with schools and communities to register children for kindergarten.
Kindergarten transition is noted as a best practice in the literature. The school system
was an active partner who, as Sarah noted, “came through with a commitment of
something like three thousand more Pre-K slots, or something incredible”, which
relates to the best practice of expanding early childhood education opportunities.
Participants mentioned the group’s ability to work collectively and be on the
same page rather than working in silos. They mentioned an increase in
communication among agencies and with the community. In addition, participants
noted the importance of going through this process together. Donna, a long-time
leader in the city, noted the significance, “[The group] was really able to look at the
whole process and see where there were things that were having an impact on the
numbers… it shined a light on the issue, but we were also able to pick up all the
baskets and look under them. In any kind of change process, people often look at the
big issues, but when you really break down and look at the total process from
beginning to end, you find all kinds of little details that are impeding process and
impeding positive outcomes… It’s just amazing what you find out when you have the
time to really go back and look at every little step.”

61
Baltimore City showed mixed results from the survey questions related to
community level analysis. Respondents were recalling events that took place many
years prior to the survey, which could have affected their answers. In addition,
interpretation of survey questions could have been skewed given the Baltimore City
LAP was together for many years but has since disbanded. Just over half of
respondents agreed the group had implemented community-wide initiatives while
two-thirds agreed the group had achieved policy changes and garnered support from
legislators and external stakeholders. Almost 80 percent felt their work had achieved
positive results and two-thirds felt the work would make a significant impact.
Baltimore City: Collaborative Level Effectiveness
Baltimore City participants described a high level of shared member
commitment. The survey showed Baltimore City as having the highest percent
increase in membership commitment over the course of LAP. Sarah noted a common
theme: “We had these things that were springing up… that was just fortuitous but
having the BLAP container as a place to do it, and then to have this five year plan that
we were writing where we could embed a lot of strategies that folks were very
interested in… that all became a way of acting on what really felt like a shared
commitment. I do think that there very much was this interest in our group because
[readiness scores] were really, really low… something had to be done.”
The majority of those interviewed felt that accountability was high in
Baltimore. While the formal accountability tool used in other groups and described in
Chapter One had not yet been developed, participants did remember making public
work commitments and reporting back to the group. Donna described their process,

62
“Yes, [the system was helpful]. Anytime that you write something down, first of all,
it’s such a simple little thing, and know you’re going to be called on it the next time
you came together. Sometimes there were groups that met separately. We had little
objectives under major goals, and some of the work groups got together under those
objectives or big areas… then come back to the group.”
Baltimore City’s strategies were the also high with regard to effectiveness.
Both Baltimore City and Anne Arundel used best practices found during the state-
LAP to model their strategies. While some experienced frustration at the speed and
breadth of the strategy process, the final work in creating strategies did not include
much conflict. Almost 80% of respondents felt the resulting strategic plan addressed
the needs of their organization. However, only slightly more than 50% were satisfied
with the current outcomes of the LAP process. This number could be affected
because the group no longer meets.
The Baltimore City LAP kept going for many years and has been heralded as
a success within the Casey Foundation, but those interviewed within the group and
within Casey are unclear at what point Casey completely pulled its funding and
facilitation or when the group finally dissolved. Since this LAP occurred many years
ago, many were fuzzy with regard to the timeline and discussions related to
relationships were not clear as to when they were occurring. Members within Casey
cannot clarify this information either. Several members mentioned that they were
able to garner additional resources and that their LAP work made the collaborative
attractive to additional grants and outside funding. Overall it seems that the
Baltimore City group lasted for 7 or more years and was eventually integrated to

63
standing committees with the city, which speaks to its sustainability and collaborative
success. Donna concluded, “We eventually died, but we did keep going and I think
still kept up a light on that movement and looking at the steps in the process… to
change the numbers.”
Baltimore City: Organization/Participant Level Effectiveness
The majority of those interviewed in Baltimore City noted improvement in the
area of personal leadership development. The group rated themselves high in the
survey around new personal skills and relationships with almost 80% noting
improvement. Participants noted that agencies started to do their work differently,
saying that they began to see LAP tools such as results based analysis come up in
other meetings outside of the collaborative. Donna summarized this by saying, “[I
saw] significant changes in how people conducted themselves as leaders.”
Approximately half of those surveyed implemented LAP strategies in their
home agencies and half noted an increase in client outcomes due to LAP.
Approximately 40% surveyed saw an increase in client legitimacy and resources due
to LAP and only 20% saw an increase in services. Interviews told a different story as
the majority of those interviewed noted changes in their home organization due to
LAP. This change could be a result of the fact that as participants discussed their
experience more memories and details came back to them despite the large time gap.
Sarah noted a variety of ways her department was influenced by LAP, from
institutionalizing the a national literacy program to incorporating literacy kits in all of
their home visiting services and training their home visitors on early language
acquisition. All but one participant mentioned new programs in their agencies and

64
half of those interviewed mentioned that LAP was an achievement their agency
pointed to externally. One participant said, “It was one of the things we were able to
point to as a success, that we kind of were heading it up in an accountability way.
And it was a success not because we were able to pull the people together and
continue to do it after Casey was no longer there... But to me, it was a success
because it was an example of how if you use data well, you can achieve results.”
DeKalb County: Community Level Effectiveness
Unlike Maryland counties, DeKalb County does not have a community-wide
data indicator with which to measure their work. The State of Georgia has changed
its assessments since the launch of LAP, making previous years impossible to
compare. The current assessments do not allow for a thorough evaluation of
kindergarten readiness. Two-thirds of the survey respondents felt their efforts had
strong potential to impact the problem of school readiness. Given the size,
complexity and diversity of the county, many members in interviews were hesitant to
speak with regard to community level change; yet, all members interviewed reported
different stories of success. One nonprofit was able to establish a pre-k program for
refugee children due to the relationships formed in LAP, which relates to the best
practice of expanding early childhood education opportunities. Members noted the
strong partnerships that formed between agencies in the group, including the school
system and the United Way. John, new to early childhood but not DeKalb County
social issues, noted, “The LAP enabled me to make contact with people in the early
learning community who were willing to help. To me, that was an amazing thing…

65
the partnerships and developing relationships of one kind or another helped develop
the agency, that was one of the main advantages of that program.” The school system
was described as a minor player at the start of the LAP but became a significant
partner as the group matured. Susan, a long time leader and advocate in early
childhood education, told a common story: “She [the representative from the school
system] became one of our biggest supporters and now the co-chair of the group is a
school board person.” The LAP group also played a role in the creation of
KinderCamp, which assists in the transition from pre-k to kindergarten, noted as a
best practice in the literature. Susan noted, “Believe it or not, even with a bad
economy, those KinderCamps are still going.” The group also worked to expand an
existing program called Parents As Teachers, which provides in-home services to
assist parents in early childhood development. This intervention promotes best
practices related to increasing early education practices from parents. John added,
“… that program was expanded and ultimately got a pretty significant grant from the
state, so that program expanded exponentially.”
Survey respondents support the interviews as two-thirds agreed the group had
implemented community-wide initiatives. Three-fourths reported a policy change
and over 80 percent reported support from legislators and external stakeholders.
Given the high response rate (over 65%) garnered in this group, the survey is a strong
factor in their story.
DeKalb County: Collaborative Level Effectiveness
DeKalb participants described a small but committed group. The group
membership diminished significantly over the process, from approximately 40

66
members to 15, yet no one interviewed thought this was a problem. A high level of
commitment was described by those interviewed. Susan used a member from county
government as an example, “… he was pretty funny because he’d walk in and say “I
have no idea what I’m doing here, but you made me come, so I guess I’ll stay for a
while.” He’s now become a total champion of early learning for our work, and he’s
now being asked to serve on a bunch of committees because he is so committed.”
Survey results show DeKalb with a modest increase in membership commitment at
approximately 6%.
The majority of those interviewed also felt accountability was high and the
accountability system helped. John expressed a common theme, “I think
accountability was pretty good. The process forced you to write down what you were
going to do. And the first thing you did when you got back to the next meeting was
tell what progress you made. A lot was done by committee. Other people were
working on the same issue, so if someone was following behind, there’d be a process
to self-correct between meetings. There were some people who didn’t deliver… but I
think the core group of 20 were pretty good about delivering what they promised.”
Input around collaborative performance was mixed. No one interviewed
mentioned significant conflict during the generation of strategies, instead they
mentioned using the process and data to drive strategy. One member said,
“[E]verybody is sort of partial to their own wants and desires and ideas, but we were
able to work those out. We did have the statistics and the information we needed to
make a wise decision and not just go with the passion, but look at what is the wise
decision – what we have and what we need.” DeKalb’s strategies were mid-level in

67
their strength and ranked in the middle of the group. Just over half surveyed agreed
the resulting plan for LAP addressed the needs of their organization; however, three
quarter of survey respondents were satisfied with the outcome(s) of LAP.
DeKalb has been one of the most successful groups at generating resources to
hire staff and facilitation to create an ongoing structured group. They continue to use
a structured accountability system and decision-making process and continue to pay
for a facilitator for their meetings. John noted, “I think the biggest thing is that
money always matters… because of the collaborative, DeKalb was able to apply for
the Governor’s office grant. And it’s a pretty nice size grant that included a system
administrator that is able to staff the group.” The group had a visit from a team in
Michigan to learn about their work involving early childhood education. This was
affirmed in the survey where 90% agreed the group had garnered external resources
to continue their work.
DeKalb County: Organization/Participant Level Effectiveness
Over 80% of survey respondents noted an increase in personal skills and
relationships. Half of those interviewed felt their leadership skills had increased
while the other half felt they had them already. John said, “I think most of the
leadership exercises didn’t produce results that were worth the effort.” Another
participant disagreed, “I felt like the leadership skills, the ability to resolve problems
with a group and to go away with hopefully everybody having more ownership of the
group because they felt more invested with it. It [benefitted me personally]. I got a
lot [out of] leadership skill [building, such as] the knowledge of how a county can
work together. That was pretty awesome. [How] a county of different professionals
68
can come together and work together. I was proud to be a part of that.” All those
interviewed noted strong relationships within the group. John appreciated this aspect,
saying, “[B]uilding relationships [allowed people to set aside their own agenda]… the
people cared about me and cared about [the issue], I’d go out of my way to help them
because I knew they’d help me.”
In terms of agency outcomes, approximately 60% of those surveyed noted an
increase in agency legitimacy and client outcomes and half saw an increase in service
access. The majority of those interviewed in DeKalb also mentioned that their
agency visibility went up. Almost 70% noted an increase in resources for their
organization. This was confirmed in interviews as two people mentioned they were
able to receive grants or funding for their individual agency because of their
involvement with LAP. The nonprofit member who established a new pre-k program
through LAP initiatives said, “I used to go back there just to sit in the back of the
room and watch [our new pre-k program], it was so impressive... It really changed
lives. And would this have happened if I wasn’t a part of LAP? Maybe. Maybe I
would’ve found a second wind or someone who could help me, but I think I was
running out of options at that point.”
Indianapolis: Community Level Effectiveness
Indianapolis/Marion County does not publicly release recidivism data, nor is it
clear who and how they collect their data. This is an issue the Indianapolis LAP
struggled with from the beginning of its tenure. It is improving, with some data being
made available to a nonprofit called Community Solutions. Their internal report

69
shows that within one year of release, 28.3% of ex-offenders in Indianapolis/Marion
County were returned to prison in 2008. This number dropped to 26.5% in 2009 and
23.5% in 2010 (Community Solutions). This is significant as a recent research study
conducted by the Center for Criminal Justice Research at Indiana University found
that reducing the recidivism rate by one percent in Marion County results in keeping
approximately 46 offenders from returning to prison, saving the state of Indiana
28,802 prison bed days and $1.55 million (Jarjoura and Haight). By comparison, the
Bureau of Labor reports that during 2007, a total of 1,180,469 persons on parole were
at-risk of reincarceration in the United States. This includes persons under parole
supervision on January 1 or those entering parole during the year. Of these parolees,
about 16% were returned to incarceration in 2007 (US Department of Justice, 2007).
The majority of those interviewed in the Indianapolis LAP said their efforts
were contributing to this decrease in recidivism. Ann, a nonprofit leader, expressed a
common sentiment, saying, “I believe we did attribute to a reduction in our rate of
recidivism. I think it’s as much about an awareness and a conversation, having the
data, having people focused on the data.” Data was described as an important
outcome of the group. Participants mentioned the importance of using new data,
noting that the Corrections Office now shares data they never shared with community
agencies before. Kimberly, a nonprofit member and long time advocate around
recidivism, noted, “We’ve taken data to a whole other level. I mean, before this
group started, we did not know the specific information about the people we were
trying to serve, we do now. Now we know why they go back, what’s the issue, their

70
education level. The community didn’t have data like that before, so we take that
data and manipulate strategies around what we get from the data.”
Multiple community-wide initiatives were mentioned. Over 80% of survey
respondents in Indianapolis agreed the group had implemented community-wide
initiatives and 70% felt their efforts would make a significant impact on the problem
of recidivism. Several people pointed to success related to working with the Office of
Motor Vehicles to allow ex-offenders the ability to obtain IDs, an important first step
in helping ex-offenders reintegrate into the community through jobs and housing.
Ann described the situation, “[T]he guy from Motor Vehicles said, “I don’t
understand why you all aren’t doing that, that’s our job, we need to do that. . .” And
within a very short timeframe, he did. He figured out systems to get us those ID’s
quickly and so obviously, when he understood the issue he understood the problem,
and he understood that it wasn’t really everybody else’s issue, it was his issue and his
department. He was not the head guy at the MV, but pretty high up there and he went
back and got it done really quickly.” Half of those interviewed pointed to a program
linked to Technical Rules violations as a major success of the group. The group
found that a significant number of ex-offenders are returned to prison for violations of
conditions of parole, or a Technical Rule Violation. They realized many of these
violations were not for crimes but minor offenses such as missing a treatment session.
“I think that the technical rules violations changes had a dramatic impact on what’s
happening in this state.” The other half interviewed felt this program fell short. Ann
agreed, saying “[The] strategy was strong, but. . . because we found this little pocket
of resources, and somebody had an ability to push through and in the position to XYZ

71
with it, I’m not positive that was the greatest response.” Survey responses also
seemed mixed as 60% of survey respondents attributed a policy change to the group.
Several people contributed an increased effectiveness in the community to the
fact that they are working collectively, increasing communication among agencies
and creating strong relationships and networks. Almost all participants noted the
relationships and collaborations that formed a significant outcome of LAP. Eric said,
a long-time public employee, said, “I think the most common result was bringing
everybody in the room and drive toward the same mission and still have the passion
we had all the way up until the end. And building the relationships, establishing and
maintaining relationships of people I never knew or only saw their names, and then
once we developed relationships, it still carries on.” Overall the impressions during
interviews on community-level outcomes were mixed. Richard, another public sector
employee, was skeptical. “Looking back to the LAP, I think the bottom line was that
Marion County may not have been the best place in the world to do a LAP, I don’t
know that it was ready… moving Marion County is like trying to get a line of
elephants to tap dance together.”
Indianapolis: Collaborative Level Effectiveness
Overall input around collaborative level effectiveness was mixed. The group
has brought in new members, but the issue of membership is a problem for the group
as they have experienced significant conflict throughout their tenure around how and
whether to add new members. This conflict was often destructive to the group, which
I will detail in the Chapter Four. In addition, several people I interviewed noted that
the overall level of involvement and member commitment has dropped, which is

72
reflected in the survey as numbers show a 6% drop in member commitment as the
group progressed. Some feel it's not the same since the facilitators left, others feel the
group dynamic has changed due to new members and the number of state government
members leaving with the facilitators. Kimberly shared a common outlook: “[For]
some, their job roles changed; some, honestly, when the facilitators left, we didn’t
have anyone to police the conversation in the room and so I think some people
thought, “Okay, I don’t know where this is going to go, this is probably not the best
use of my time.” ” Members noted the difficulty in orienting new members and
getting them as invested and trained as the original core.
Accountability was described as mixed. The majority of those interviewed
discussed the fact that the LAP model was created to increase accountability and have
participants hold themselves accountable; however, the majority noted that overall
accountability ebbed and flowed depending on the complexity of the work. Eric
noted, “If I was to give a percentage? I would say initially, because it’s like a bell
curve, initially not so much, then at certain times really high, and then not so much…
first we got some low -hanging fruit, for lack of a better term, and then we went after
some big stuff, and then some of that big stuff got bogged down because it wasn’t
like the low-hanging fruit.” All those interviewed noted the accountability system
was used; however, the perspective on its usefulness was mixed.
Collaborative performance feedback was moderate. No one interviewed
mentioned significant conflict during the development of the strategic plan, yet only
approximately half of those surveyed felt the strategies reflected the priorities of their
agency. Seventy percent of those surveyed agreed they were satisfied with the

73
outcome(s) of the LAP process; however, their strategies were not rated as very
strong given the literature around best practices.
The group has been very successful in raising funds to continue their work,
especially at immediately after the Casey grant ended. They were able to hire their
original facilitators for a significant period of time after the original Casey grant, the
only LAP group able to do so. These facilitators trained group members to facilitate
and then transitioned out of the work. The group continues to meet today and use a
structured accountability system and decision-making process, but their current
source of revenue is unclear.
Indianapolis: Organization/Participant Level Effectiveness
Indianapolis rated themselves very high when it came to individual self-
assessment and relationships. Almost 80% of those surveyed noted improvement
with new personal skills and relationships. This was confirmed in my interviews as
the majority of people referenced improved leadership skills and improved
relationships across agencies. Ann summarized this by saying, “Now I understand
that I was involved in a very great leadership opportunity. But I don’t think I did in
the beginning . . . I was brought in because I know about re-entry, and I’m a player in
the re-entry community. I didn’t know personally that I was going to be given the
opportunity to learn a different way to lead, a different way to motivate group work
and all of that . . . I mean that’s the greatest part.”
Approximately 40% surveyed noted an increase in agency legitimacy and
increased resources for their agencies. Approximately 40% of participants surveyed
reported service access while almost 60% have increased client outcomes due to

74
LAP. Participants in interviews noted new partnerships and connections and two
mentioned the creation of new programs. But overall interviews showed mixed
outcomes for home organizations. Ann said, “I think the relationships I have been
able to form have brought opportunities to [my organization]... I’m the president of
[a volunteer organization], I feel like I’ve been able to use my knowledge of the LAP
processes to sort of move that volunteer group as well… So I’m able to use some of
those skills in a different area.” Alternatively, Richard felt the effort was a waste of
time for him and his organization. “[I]t’s pretty apparent I never saw any results that
indicated that we had any impact on the recidivism rate in Marion County, and quite
frankly, part of that is some players in Marion County not willing to make some
changes and not willing to take a look at what there doing. And at that stage of the
game, I’ve got other things that I need to do.”
Montgomery County: Community Level Effectiveness
Eighty-one percent of kindergarteners entered Montgomery County schools
ready to learn in 2011-2012. This is up from 61% in 2001 when the test first
launched and 68% in 2006 when the Montgomery County LAP began. In interviews
with the Montgomery LAP, no one felt the work of LAP contributed to this rise of
readiness scores in the county. Few community-wide initiatives were mentioned.
The group has not created community-wide programs or programs/initiatives that deal
directly with children and families. Two people mentioned that the LAP developed a
one-pager for parents. Tracie, a long-time member of the early childhood
community, noted, “[It was] not necessarily just for kindergarten but to be better

75
prepared for school and life. It was Read to Me, Talk to Me, Play with Me and we
translated it into five languages and have distributed throughout the county.”
The group holds two events a year around education and awareness building.
Most participants noted this as the group’s most significant achievement. Legislators
and people working in the field of education are invited to hear speakers or panels.
Participants noted that these events were not going to bring the readiness scores up,
but instead are meant to build awareness. Overall participants were happy with these
events and with the relationships involved in the current group, but several
interviewees noted that they would have achieved this even without LAP. One
person felt LAP had actually slowed their progress as a community given the time
intensive process involved in LAP and the conflict that occurred in the group. Tracie
summarized this sentiment, saying “When at the end when we came up with our
target areas for young children at risk I think probably all of that would have been
done anyway, it’s just that we did it within the context of the LAP group… I certainly
don't think they were a result of the LAP process… I think it would have happened
probably earlier without LAP.”
Montgomery County survey results show a very different story with 80% of
the respondents agreeing the group had implemented community-wide initiatives and
the work had resulted in a positive change in the community. Seventy percent felt
their work would make a significant impact. Approximately 80% of the respondents
reported support from external stakeholders and 50% reported a policy change due to
the work of LAP.
Montgomery County: Collaborative Level Effectiveness
76
Input around collaborative effectiveness was generally negative in
Montgomery County. Only one person noted a high level of member commitment
within the group. The majority of those interviewed noted a high attrition rate as the
group progressed. Emily, a public sector member and long-time member of the early
childhood community, said, “There was attrition and I was part of it. I didn’t lose it
entirely but there were times I did miss or miss portions of a meeting. There were
fewer people, I think we lost of the diversity of the group...” Those interviewed felt
people left for different reasons, including the high demands of the group, the slow
pace of the work and absence of strategy development, the incorporation of
leadership building into the process, conflict and personality clashes and a feeling that
they were endlessly processing and not actually moving to action. Elizabeth, a
nonprofit member, expressed a common sentiment, “I think people dropped out
because of the time. It was a lot of time to have to devote to it. And for people whose
[involvement was] tangential to their regular job, they dropped out… it would be one
thing if we were doing something... we would just be sitting around endlessly
processing.”
Almost 90% of those surveyed agreed the group used a member-driven
accountability system; however, the majority of those interviewed did not support this
statement. Tracie expressed a widespread perspective, “I think most for most people,
it was an empty exercise. I don't think it really caught on.” Elizabeth agreed, “It may
have been embraced by some. I thought it was sort of tiresome.” Only one person
interviewed felt accountability and follow through among the group was high.

77
Collaborative performance feedback was mixed. Approximately three-fourth
of survey respondents agreed the resulting plan met their organizational needs and
were satisfied with the outcome(s) of LAP; yet, the overwhelming majority of
participants interviewed discussed collaborative performance as low. Tracie
expressed a common outlook: “Everybody was very frustrated because nothing was
happening. We were doing exercises that didn't seem to lead us anywhere and that we
didn't feel as if we were publishing anything. It was very frustrating. We examined
the kindergarten assessment scores, although, that would have been very easy to have
started in the first or second of our meetings. We didn’t start doing that until maybe
the eighth or ninth meeting so that’s when it felt like we started to at least do
something that was related to what we were there for. A lot of the LAP exercises and
things kind of prevented us from getting to the point where we needed to get to.” The
majority of those I interviewed noted that the group struggled to develop strategies,
causing the same frustration among other members. The strategies developed by the
group were rated mid-level in their capacity to affect the problem.
Montgomery County has continued as a small group. Tracie noted, “Well
finally after all the meetings, with the small group that was left, we established what
we call our Early Childhood Congress which continues to meet still as a steering
committee each year… we have no money and no staff. It’s [made of] those of us
who are very, very committed to child care and see the value of coordinating.”
Seventy percent of those surveyed agreed the group has been able to generate
resources to continue their work; however, all those interviewed said the group has
struggled with funding since the Casey funding ceased. Another member said, “[W]e

78
put on two events a year, a legislative briefing and an educational event, and every
time we think oh we’re not going to be able to do this. We don’t have any money.”
Montgomery County: Organizational/Participant Level Effectiveness
Montgomery County survey participants responded very positively with
regard to an increase in leadership skills and relationships despite interviews showing
an overall negative view around additional skills gained through the LAP process.
All those interviewed in Montgomery noted an increase in relationships with some
describing their ability to think more collectively and make more connections in the
community.
In terms of agency outcomes, the survey results were mixed, with 60% and
70% noting an increase in agency legitimacy and client outcomes and alternatively
only slightly more than one third noting an increase in resources or services. Eighty-
five percent of respondents said they have implemented different strategies due to
their involvement in LAP. The interviews were uniformly neutral or negative when it
came to questions around the impact of LAP on participants’ home organizations.
Tracie noted, “My supervisor was similarly frustrated with the process… I think our
distress with how things were going was communicated to [our organization]. I think
the [accountability partner] was aware of it… you know it was kind of frustrating to
see how we began and how we ended with just such a very, very small group.”
Elizabeth expressed a similar sentiment, noting that the relationships she made would
have occurred regardless of LAP. There were no specific organizational impacts
noted in the interviews that support the survey results.

79
Polk County: Community Level Effectiveness
Like DeKalb County, Polk County does not have reliable county level data in
which to measure their work. The State of Iowa has changed its assessments since
the launch of LAP, making previous years impossible to compare. Participants did
not mention current data as the Polk County LAP no longer meets. Those
interviewed shared few results from the LAP group and no community-wide
programs. Several noted that the group created brochures in multiple languages to try
to increase public awareness of early childhood education in different communities.
In addition, some noted that the group wanted to hold a kindergarten readiness camp
in the summer, but no one could give details about how or whether it was
implemented. These accomplishments were the only ones mentioned. Polk County
survey responses were also uniformly negative. Only a quarter reported a policy
change. One third agreed they had implemented community initiatives and the same
felt that the efforts of the group had made a positive impact.
Polk County: Collaborative Level Effectiveness
The survey showed member commitment in Polk County decreased as the
LAP progressed. The majority of those interviewed noted the high attrition rate as
the group went on and felt it was a big problem. As in the Montgomery case, those
interviewed felt people left for different reasons, including the high demands of the
group and a feeling that they were endlessly processing and not actually moving to
action. Barbara, a service provider, summarized this phenomenon: “People couldn’t
see where it was going, so people dropped. And you could’ve had stronger players…
the ones that hung in there were basically educators and daycare providers, and that

80
wasn’t the right group that needed to be at the table at the end of the day.” Caroline,
a member of the school system, agreed, “I think there were plenty of people who
were still very committed to the result of better outcomes for children, but I think
there was a sense of frustration that not only I had but other people too as it went
on… [frustration] with the time commitment and… with the process.” There were no
positive comments about group accountability and the survey shows only 40% felt the
group used a member-driven accountability system. Barbara noted a common
sentiment, “Maybe it was a good tool, I see it as cumbersome, and I never did it
because I couldn’t take on one more thing.”
Approximately one third of survey respondents were satisfied with the
outcome(s) of LAP. Caroline noted, “I have to say [the outcomes were] kind of weak
and maybe I’m being unfair, but I just don’t really remember being wowed. Like
‘wow we came together and did this great thing and people in our community are
better off.’” While the group did not discuss conflict related to creating strategies,
those interviewed did not have much to say about the plan and could not remember
specifics. The strategies were rated low on overall impact. Since the group did not
continue, they did not raise any additional funds or create a maintenance structure for
continued performance.
Polk County: Organizational/Participant Level Effectiveness
Few people in Polk County discussed individual or agency improvement due
to LAP. Barbara said, “It was so convoluted, you couldn’t tell if we were working on
leadership skills or we were looking at data and figuring out the players and what we
could do.” Only one person noted the relationships as being helpful for her and her

81
organization, others could not name any people they had kept in contact with after the
LAP ended. Caroline did not feel her organization saw LAP as a good investment.
Some described the low agency impact due to a failure of LAP, while others
described it as a by-product of budget cuts in the county. “[A]s cuts and budget cuts
came along, our staff began to shrink in terms of our administrative staff, and the
commitments started to get more restricted in terms of how much time we could
spend on community stuff and how much time we needed to spend just taking care of
daily commitments. And so I think that was a problem not only for me but for a lot of
people.” Polk County showed the poorest survey results in this area; however
approximately 60% of those surveyed noted increased relationships and individual
skills as well as an increase in client outcomes. The rest of the indicators around
client outcomes averaged 40% of those surveyed noting improvement.
Discussion
Determining how best to weigh interview and survey data is challenging. For
the purpose of this analysis, when presented with contradictory results between the
survey and the interviews, I weigh the interviews more heavily as the potential bias I
note above seems to be present in some LAP cases. This bias seems particularly
present in Montgomery County, as there was a significant disconnect between
Montgomery County interviews and survey results. Community level outcomes were
very positive in the survey, yet the outcomes described in interviews were negligible.
A large percentage was satisfied with the LAP outcome in the survey, while almost
everyone that I interviewed was generally negative about group outcomes from LAP.

82
One explanation is that participants interviewed seem very happy with their current
group and the work their group is doing now despite its low impact; therefore, they
may be more inclined to report positive results in a survey. Given over 80% of
Montgomery County survey participants are still involved in the group, it seems
responses were skewed more toward the positive. These participants seem fine with
the fact that their group is not producing community level outcomes, but instead are
focusing on building awareness and assisting group members. Participants could
have considered the community awareness events sponsored by the group as an
indication of community level initiatives and therefore agreed with that question. It is
less clear as to why survey respondents would report that their efforts were making a
difference in the readiness numbers when all of the participants I interviewed
disagreed with this assessment. I interviewed six people from Montgomery County
with a variety of backgrounds and perspectives, this diversity of the group gives
support to the robustness of the results I gained from these discussions. I am inclined
to give more weight to interview results over survey results as it pertains to this
group.
Indianapolis and Baltimore City also present contrasts between interview
findings and survey findings, though not to the degree of Montgomery County. In
interviews with all six groups, I was able to ask follow-up questions and the
interpretation of my questions was clear. Participants were able to point to actual
outcomes rather than simply agree to statements in a survey.
Table 6 shows the results of my effectiveness evaluation by variable. A
variable was determined high if multiple interviewees mentioned the variable and

83
evidence was seen in the survey results. A ranking of moderate was given if only two
interviewees mentioned the variable and survey results were less conclusive. A low
ranking was given if no one or only one person mentioned the variable and survey
results were not supportive. Appendix H shows the complete data use to create the
analysis in Table 6.
Table 6: Effectiveness Evaluation Analysis
Community Level
Implementation of best practice community-wide initiatives
Implementation of new policy or legislative change
Changes in the incidence of the problem
Anne Arundel High Moderate High Baltimore City High Moderate High DeKalb Moderate Moderate Low Indianapolis Moderate Moderate High Montgomery Low Low Low Polk Low Low Low
Collaborative Level
Membership commitment and growth
Member Driven Accountability System
Collaborative Self-Assessment and Outcomes
Continued existence of collaborative and resource generation after first year
Anne Arundel High High High High Baltimore City High High High High DeKalb Moderate High Moderate High Indianapolis Moderate Moderate Moderate Moderate Montgomery Low Low Low Low Polk Low Low Low Low

84
Organization/Participant Level
Individual self-assessment of personal skills and relationships
Increased agency outcomes
Increased client outcomes for organization
Anne Arundel High Moderate High Baltimore City Moderate Low Moderate DeKalb Moderate High High Indianapolis High Low Moderate Montgomery Low Moderate Low Polk Low Low Low
Anne Arundel was coded high in the majority of variables, with only two
incidences in the moderate category. Baltimore City was high in all but one variable
at the community and collaborative level, but moderate and low at the organization
and participant level. Polk was categorized as low in all variables while Montgomery
County was categorized as low in all but one. DeKalb County was moderate to high
in all variables except at the community level with regard to changes in the incidence
of the problem. Indianapolis was mostly categorized as moderate with a few
variations.
The three levels of analysis should not be considered equal when it comes to
outcomes, as noted earlier. Community level outcomes are the ultimate goal of a
collaborative and should therefore be weighted the highest in this analysis. For the
purpose of this analysis I follow Provan and Milward (2001) in considering the
community outcomes first, collaborative outcomes second, individual/organizational

85
outcomes last. Table 7 below ranks each collaborative based on my framework
analysis.
Table 6 Overall Ranking by Performance
Overall Ranking by Performance High Performing Moderate Performing Low Performing Anne Arundel County DeKalb County Montgomery County Baltimore City Indianapolis Polk County
Baltimore City’s high rankings and excellent community outcomes put the
city in the high performing group. DeKalb’s low performance in the community
outcome puts it in the moderate performing groups. Anne Arundel was clearly high
and Montgomery County and Polk were clearly lower and should be ranked low in
performance. This grouping of effectiveness will serve as a starting point for my next
two chapters where I will compare the processes of each LAP and see if there is a
pattern among the high, moderate and low performing groups.
It is noteworthy that while some authors in the literature maintain that
analyzing collaborative groups simply at the community level is not enough, the high
performing groups ranked high at all three levels and the low performing groups
ranked relatively low at all three levels. Analyzing each level provides clarity with
regard to moderate level performing groups as the outcomes of these groups are not
as clear-cut and direct. Looking at the three levels adds a richer story to the many
different outcomes possible with community collaborations. Often the story and
purpose of collaboratives is to affect community change, but this research
demonstrates there is the possibility for outcomes at many different levels, including

86
with individuals and participating agencies. The work of collaborating is arduous and
involves costs, and this richer story of possible outcomes can provide a motivating
factor for more communities to develop and implement collaboration.
Conclusion
This chapter implements an analysis of six collaboratives at the community,
collaborative and organizational/participant level using a modified and expanded
version of Provan’s and Milward’s (2001) framework. While Provan’s and
Milward’s framework is often referenced in the literature, few have actually utilized it
in practice or used it to the level of detail as my analysis. This analysis adds to the
current research on collaborative outcomes by extending and operationalizing a
critical framework for analyzing outcomes. In the next two chapters I will analyze the
processes, actions and relationships behind these outcomes to determine how they
relate to the outcomes found here.
This research is a clear answer to the question of whether collaboratives can
produce meaningful change. The high performing groups in this sample collected
tens of thousands of books, increased pre-k programs for children, added substantial
and meaningful programs and organizations to their communities, and became true
partners working toward the same goal. In addition, they developed personal
leadership skills and changed the culture and direction of individual agencies. This is
a significant finding highlighting the potential for these groups. It is clear given the
struggles of some of the other agencies that collaboration is not easy and not always
successful, but it is possible.

87

88
Chapter 4: Examining Process – High and Moderate Performing
Collaboratives
This chapter focuses on the process of collaboration, and specifically, how
collaboratives organize and implement their work. The purpose of this research is to
examine the elements of a collaborative process, and to determine the importance of
these elements to the collaborative results found in the previous chapter. Because the
six case studies I examine in the previous chapter vary in performance, I am able to
determine the importance of elements in the development and implementation of high
and low performing collaboratives. In addition, I compare the process elements in
my research to that found in the literature. This chapter details the literature
surrounding the collaborative process, provides a review of the data and an analysis
of the collaborative process for the high and moderate performing collaboratives
determined in the previous chapter. The next chapter analyzes the low performing
collaboratives and summarizes the overall findings from the high, moderate and low
collaborative process analyses.
The Collaborative Process
Gray and Wood (1991) define collaboration as occurring “when a group of
autonomous stakeholders of a problem domain engage in an interactive process, using
shared rules, norms and structures, to act or decide on issues related to that domain
(p.146).” Groups collaborate when they agree to work together to solve an identified
problem. Gray (1989) also recogizes collaboration as an emergent process with
collective responsibility. Indeed, many scholars have noted that the process of

89
collaboratives occurs through compromise and coordination rather than a stepwise
movement from one phase to another; it is often called messy, dynamic, and
interactive (Thomson and Perry, 2006; Huxham and Vangen, 2005; Roberts and
Bradley, 1991).
The process of collaborating occurs in turbulent environments where efforts of
sustainability and success are affected by outside factors beyond the control of
collaborative members (Bryson, Crosby and Stone, 2006). Most collaboratives consist
of interdependent as well as independent agents in a system that is emergent rather
than predetermined and where the system is unpredictable, dynamic, and without a
clearly defined hierarchy (Dooley, 1997; Eoyang and Berkas, 1998). Kontopolous
(1993) describes these groups as systems of heterarchy, which differs from the top-
down structure of hierarchy. Heterarchy takes into account that interactions within a
system are driven by complicated group dynamics, complex external influences, and
multiple stakeholders.
Despite this recognition, some scholars have attempted to define the process
of collaboration and determine frameworks for analysis. Ring and Van de Ven
(1994) model the collaborative process as cyclical rather than linear consisting of a
“repetitive sequence of negotiation, commitment, and execution stages (p. 97).” They
note the emergence of personal relationships that lead to psychological contracts
which in turn lead to informal understanding and commitments. Thomson and Perry
(2006) stipulate five key dimensions of collaboration, including the governance
dimension, or how collaborations make joint decisions and negotiate power
arrangements; the administration dimension, or the administrative structure that

90
assists the group in taking action; the autonomy dimension, or the ability of members
to develop collaborative competencies and move from individual agendas to shared
control; the mutuality dimension, or the process of forging mutually beneficial
relationships; and the trust and reciprocity dimension, which stresses the critical
component of trust necessary for collaboration. Finally, Bryson et al. (2006) present
a framework that seems the most inclusive of all the points made in the literature (see
Figure 2). They note the following as affecting the successful implementation of a
collaborative: initial conditions, process dimensions, structural and governance
dimensions, contingencies and constraints, outcomes, and accountability issues. They
also note the overlap and relationship that exists with aspects of the initial conditions
and structure with the pieces they outline in process. For the purpose of this research
I base my analysis on
the process as defined
by Bryson et al. (2006).
Key Elements of
Collaborative Process
There is
consensus in the
literature around several
key elements that are
essential components of
the collaborative
process. The first
Figure 2: Process Framework

91
element is a convener that serves to legitimize the group while providing
accountability and incentive for collaboration (Bryson, et al., 2006; Page, 2008;
Wohlstetter and Malloy, 2005; Human and Provan, 2000). The presence of a
convener facilitates the formation of an alliance while also establishing, legitimizing
and guiding the alliance (Gray and Wood, 1991; Foster-Fishman, Berkowitz,
Lounsbury, Jacobson, and Allen, 2001).
Groups also need the ability to forge agreements and engage in joint decision-
making while building the capacity of members to collaborate. Since these groups
often experience issues of collaborative capacity and confront a “free-rider” problem
among partners (Babiak & Thibault, 2009; García-Canal, Valdéz-Llaneza, & Ariñio,
2003), collaborative leadership skills are necessary to strengthen the existing patterns
of relationships and build consensus that furthers cooperation and joint problem
solving (Kickert & Koppenjan, 1997; Foster-Fishman, et al., 2001).
Third, relationship building is central to the collaborative process.
Specifically, the need for norms established for trust and open dialog are often cited
as necessary ingredients to group cohesion and strong collaboratives (Babiak and
Thibault, 2009; Bardach, 1998; Chaskin, 2003; García-Canal, Valdéz-Llaneza, and
Ariñio, 2003; Foster-Fishman, et al., 2001; Chisholm, 1989; Wohlstetter and Malloy,
2005).
Finally, collaboratives are especially prone to issues of accountability given
their voluntary, non-hierarchical nature; the different sectors, power differences and
incentives of the participants; their dynamic and emergent nature; and the lack of
performance data and agreement among participants about strategies and results

92
(Acar, Guo and Yang, 2008; Babiak and Thibault, 2009). The literature recommends
an accountability structure to address these issues inherent in non-hierarchical cross-
sector groups (Bryson et al., 2006; Bardach and Lesser, 1996; Page, 2004; Bardach,
1998; Linden, 2002; Babiak and Thibault, 2009).
Based on the above literature, my framework includes the following:
• External Factors o Competitive pressures o Existing Relationships or Networks o The establishment of an external partner(s) in which the collaborative
feels accountable for performance o Strength of implementation team (facilitator, support staff, etc.)
• Internal Factors
o Development of group leadership skills and forging agreements o Strong working relationships among collaborating participants and
agencies o The establishment of group norms around trust and open dialog o Management of power imbalances and conflict within group o Member commitment to collaborative o Group accountability and establishment and successful use of an
internal accountability system around performance
These are defined and outlined below.
Data
For the purpose of this chapter I am analyzing four cases from the Leadership
in Action Program (LAP) detailed in Chapter Two and identified as high or moderate
performers in Chapter Three. As noted in Chapter Two, LAP administrators utilize
an intentional framework, much of which is mirrored by the literature above and
common in collaborative practice. This framework includes external conveners,
building leadership capacity of participants, attention to relationship building and a
formal accountability structure. They also use facilitators, something cited as an

93
important way for these groups to have a structured or intentional way to deal with
the issues described above (Bryson et al, 2006: Herranz, 2007). LAP facilitators assist
in building leadership skills and capacity of the participants, aid in the development
of strong working relationships, work to reduce conflict and power imbalances, and
assist the group in making forward progress.
For the purpose of this chapter and Chapter Five, I again utilize the interviews
and survey outlined in the previous chapter. I took the coded interview information
and analyzed it for themes around process within and across collaborative groups to
distill important information. I analyzed 20 survey questions related to process in my
framework.
Methods
I developed a robust framework incorporating various elements from those
noted above with a particular focus on the Bryson et al. (2006) framework. Given my
extensive data set, I am able to determine how these collaboratives came together to
make decisions, develop trust and handle internal conflict, address issues of
accountability and performance, and more. Finally, I compare the process across the
four case studies in this chapter and two case studies in Chapter Five to determine if
high or low performing groups had any common themes.
Analysis Variables
My framework and results with regard to collaborative process for all six
collaboratives is included in Appendix G. It includes variables from the external
environment as well as the internal environment. As noted above, these groups occur

94
in a turbulent environment that often creates influences outside the group’s control.
In addition, there are many elements central to the internal environment that
influences outcomes and results of collaboratives. Specific variables are described
fully below.
External Variables
My analysis includes four process variables that are intended to capture the
external environment. First, I look at existing relationships prior to the start of the
collaborative. Survey and interview questions asked participants how many people in
the collaborative they knew prior to the start of LAP. Additional questions focused
on the early stage of LAP and whether the group experienced prior political/turf
relations between organizations that hindered collaboration and whether participants
enjoyed strong working relationships with one another. The second variable is
related to the competitive pressures that existed prior to the start of the collaborative.
Whether or not the group includes new partners, most collaboratives have a history of
trying to solve entrenched community problems such as the ones being tackled in my
case studies. Sometimes this history is positive, other times it is influenced by the
competitive pressures for funding and status and the political context of a community.
The interview questions focused on these issues, while the survey asked whether
individuals and/or organizations within the group were ever able to step out of past
history in order to start fresh. The third and fourth variable focus on aspects of the
process that were intentionally included in the Casey framework. As described
earlier, prior to the formation of a LAP, Casey works with partners in the community
to serve as external conveners. This is also mirrored in the literature; therefore, I

95
create a variable to identify the establishment of an external partner(s) in which the
collaborative feels accountable for performance. Interview questions asked whether
there was a group to which they felt accountable. Interview and survey questions
asked whether the LAP group felt responsible to perform well because of the support
they received from this group and whether these partners were actively involved in
the work of LAP. Other interview and survey questions asked how influential the
conveners were in the work of the LAP and whether that influence was positive or
negative. Finally, as mentioned previously, a major component of the Casey
framework was the use of trained facilitators. The final external variable focuses on
the strength of implementation team, which includes facilitators, support staff, and
logistics. Interview and survey questions asked whether the facilitators were skilled
in helping them make progress, acted in a neutral and unbiased manner, and improved
the group’s effectiveness. Additionally, survey participants were asked whether the
services provided by the LAP staff (such as notes, meeting space, food, posters
around the room) improved group effectiveness and whether group productivity fell
once the LAP team stopped managing the group.
Internal Variables
I include six variables meant to capture the internal dynamics that affect the
collaborative process. First, I include a variable to capture the development of group
leadership skills and forging agreements. Bryson et al. (2006) note building
leadership and forging agreements in their framework. The Casey framework
includes an intentional leadership development component and interview questions
focused on the impact of this piece. Survey and interview questions asked whether

96
all members had a voice in decisions and whether the group focused on shared goals
rather than individual agendas.
Relationships are repeatedly cited as integral to the collaborative process. The
second variable measures the strength of working relationships among collaborative
participants and agencies. It includes interview and survey questions concerning
whether the group enjoyed strong relationships with one another and whether they
saw one another as partners rather than competitors. The third variable of interest
identifies whether the group was able to establish group norms for trust and open
dialog. Survey questions asked whether members trusted one another and were
willing to share information, perceptions, and feedback. Interview questions looked
deeper into these issues. Another important aspect of relationship development in
collaboratives is the conflict and power imbalance. The fourth variable titled
management of power imbalances and conflict within group is derived from survey
and interview questions related to whether participants experienced prior political/turf
relations between organizations that hindered collaboration as the process progressed
and whether members effectively resolved differences of opinion and other forms of
conflict.
The fifth variable evaluates the overall member commitment to the
collaborative. Interview and survey questions looked at whether members were
committed to participating in LAP. The final and sixth internal process variable looks
at general group accountability and the establishment and successful use of an
internal accountability system around performance. Interview questions asked about
the tool introduced in the LAP process to track accountability and whether the group

97
adopted it or another system for accountability. I also inquired as to whether groups
continued to use a system once the formal LAP process ended. Additionally, the
survey asks whether members could be expected to complete their work in a timely
manner.
Case Analysis
High Performing LAPs: Anne Arundel County
Carol is an Anne Arundel resident with a long history in the early childhood
community. She had seen the results of the State LAP and was hopeful such an
initiative could make a difference in Anne Arundel County. Historically members of
the early childhood education community had difficulty working with the county
government and the school system. Carol explains, “We knew that we could make a
difference in getting kids ready for school, but we were having a tough time playing
in a system where the childcare folks in particular were looked down upon and Head
Start wasn’t given more respect.” Carol went on to describe a common theme, “I
think a lot of people came in with that kind of silo/turf issues… “Collaboration means
I get some of your money, but I keep mine.” I didn’t sense a strong feeling of
animosity between any particular agency representatives in the room, but there were
some who felt that they never got their due or share.” Another participant agreed,
“We are silos. Everywhere you go…. We have siloed funding. We have siloed
missions. We have siloed goals and objectives for our organization.” Survey
participants agree as half of those in surveyed from Anne Arundel felt the group had
experienced prior political/turf relations between organizations that hindered
collaboration early in the collaborative.

98
Mark and Patricia noted the roots of the problem around early childhood
readiness. Mark said, “It was influenced by whether or not kids were in an at-risk
population, it was influenced by their preschool experience or lack of experience and
the childcare they experienced… it was a really bifurcated community. There were a
lot of children with advantages and a lot of children without those advantages.
Although school readiness does cut across all socioeconomic levels, it was much
more of a problem for those of low-income status.” Patricia got more specific.
“There are pre-k programs for 4s that are based on income eligibility than anything
else. They are not in every school. If you do not go to your home school,
transportation’s not provided. And the population we frequently want to make a
difference with has one car, or no cars, and can’t get their kids to an alternative
location. We have nothing for 3s…the “at risk” kids- the socioeconomic risk,
environmental factor kinds of kids- really aren’t eligible and if they don’t get into pre-
k when they’re 3 then they don’t go to school until they go to school.”
Despite these challenges, all of the participants I interviewed in Anne Arundel
were hopeful they could make a difference for young children in their community.
Most participants interviewed encountered a mixture of new and old relationships at
the start of the LAP group. A high majority in the survey and interviewed felt the
early group enjoyed strong working relationships. Most members were invited by
their accountability partner, the Local Management Board, yet most of those
interviewed saw that group as more administrative and not a one holding authority or
accountability with the LAP group. Carol noted, “We almost felt that they were just
kind of administrative…they really wanted us to feel responsible to our own work
99
and to each other and not to them.” Mark said, “I think a lot of individuals saw their
employer as the person they were most accountable to. You know, the people
representing the community colleges or social services, those folks who were
employed by an entity that was engaged in this issue… I felt pretty purely that we
were accountable to the kids in a sense.” Survey participants differed as over 90% of
those surveyed responded that the group felt responsible to their accountability
partner and that this group had a positive influence on the collaborative.
The LAP experience was described as a process by all those interviewed, and
in that process facilitators played a critical role. All those interviewed in Anne
Arundel were positive about their facilitators and the role they played. This was true
in the survey results as well. Patricia described the facilitators as the initial leaders of
the group, saying, “[H]aving the facilitators take the onus of leadership, we didn’t
have to look at this rag tag group and try to figure out who was going to be the
leader.” Yet she and others did not feel the facilitators tried to direct the work.
“They made sure everybody’s voice was heard. They knew how to draw out
someone’s thought if they were sort of wandering with it. And they brought it back to
the group. They kept things rolling.” Mark agreed, “They didn’t want to be seen as
steering the work. I think they were very good in holding themselves back and not
even indirectly dictating to the group what the outcome should be.” The facilitators
were also described by all interview participants as critical to managing conflict and
helping the group move forward.
Participants took note that the LAP process included a framework (described
in Chapter One) in which facilitators did their work. Mark describes a common

100
sentiment, “It was a very interesting process. I’ve never been engaged in a process
that was that structured and that intense … it’s a model that makes you go very
slowly. And makes your group endure a fair amount of frustration. And we lost some
people as a result of that. But on the plus side, we got to know each other much better
than most groups working on a project of this nature. By struggling through some of
those points at which the frustration was greatest, I think we achieved a level of
commitment with the people that stuck with it that might not have happened with a
different model.” Carol agreed, “Some of us that wanted to establish a stronger
structure and move the group ahead, looking at the big pictures and developing a
strategic plan, I think we were the ones who were really frustrated… I think in the
end it was probably helpful in bringing the group together.”
Part of the process is a leadership development component, a piece that
received mixed reviews from participants. Mark stated, “I thought at points there was
a lot of tension between the leadership development component and the actual work
on behalf of children… You’d be short-circuited on the work that was leading to
taking action on behalf of kids by having to in a structured way go back and talk
about the Myers-Briggs stuff… and that’s just as an example.” Members echoed this
in other statements as many participants felt the time spent on developing leadership
skills would have been better spent on community development. Others found it
beneficial for their own skill develop as well as group cohesion. Patricia said, “I think
I’ve become a better leader… I just think it’s an invaluable process.”
Despite this element’s mixed reviews, the specific tools introduced through
this element were often cited as critical to the work. The two methods most cited

101
were around results based accountability tools that were introduced as well as a
consensus decision-making model. The results-based accountability piece introduces
methods for developing and using performance measures to track the effectiveness of
strategies and actions. “[W]e really try to talk about and work on results-based
evaluations in everything we do. That was probably one of the most important things
about the model that stuck.” The consensus decision-making tool requires all
members to agree to a proposal made in the group before moving on. Members
signal their agreement or disagreement with their thumbs up, down or sideways.
Those not in agreement discuss why they disagree as well as what steps would bring
them to agreement. Carol noted, “The consensus building process was wonderful.
That was a little trying at times too, but we really, really worked hard at building
consensus and our outcomes, our decisions, were better for it. And we still use our
thumbs to decide to this day… if anyone is not happy, we try to figure out what it
takes to bring their thumb up. That was a good process.” Mark added, “[T]he
consensus model of course could be wildly frustrating… on balance and in retrospect,
I’d have to say it was probably good. One of the things it prevented was leaving
people behind. People who, if we worked on a majority rule basis, would’ve felt
overruled too often and bailed on the process. So that was certainly one of the
benefits about it… we still [use] consensus.” All of those interviewed cited the
consensus decision-making model in their interviews and was often cited as a means
for dealing with conflict. Patricia added, “[I]n the long run… everyone was speaking
the common language and people got to air their concern or grievance. So it really
was a nice way of doing it instead of people just sitting there blaming.”

102
When asked about conflict, Carol responded, “I mean conflict is a part of life,
you don’t always agree on everything. But we didn’t have conflicts that weren’t
easily resolved with our consensus building. [If] we hit a point where we hadn’t
come to consensus, we would table it and bring it up the next month. And there was
never the kind of conflict that was ugly and divisive. It was conflict that took us to a
better evolution.” No one interviewed in Anne Arundel felt there was a high level of
conflict. The survey showed over 90% of survey participants felt the group
effectively resolved conflict. Mark shared a common sentiment, “[T]his size group
working on a complex issue, I’d say there was not a high level of conflict. First of all,
we started simply by the selection of a group with a consensus view felt this was a
very important issue. And it was a group also I think that had a fairly good perception
of the issue. And so, you know, there weren’t philosophical questions regarding the
importance of this, nor were their wildly divergent views of what the problem was. It
was more about inquiring into the details and lower levels of conflict.” Several
people mentioned one participant who often caused conflict during the meetings as
well as difficult conversations. Carol noted, “[T]here was occasionally a tone of
hostility from him which was tough for the group to work through, but they did work
through it.” Patricia agreed, “There were kind of undercurrents and grumblings for a
little while because people are people.” She added, “There were times where people
may have been intimidated. There was one time I was extremely intimidated by
someone… I think the facilitator could read my body language and watch what was
happening… he took me aside and said, “What could you have done differently?”
103
And he guided me through it because it was just a really awkward situation for me…
and it really did help me grow.”
Members in Anne Arundel County overwhelmingly discussed the strong
working relationships within the group. This was affirmed in the survey as over 90%
of participants noted strong working relationships. Those interviewed noted the
group’s willingness to be open and share information. The majority of the group
discussed getting to know each other across traditional boundaries. Carol
summarized, “[At] the launch meeting and the next meeting there was a lot of
bonding and getting to know each other and what they did. Within the first month,
people from infants and toddlers were going to the DSS office and talking about what
infants and toddlers had to offer. The library folks were working with the childcare
folks, and the joint efforts that were being made were just really cool, and they
developed really quickly. And those bonds are still in place.” Patricia added, “I don’t
even know that trust is the best word as much as respect. There were people with
areas of expertise that I really didn’t know anything about. I feel like I’ve learned a
lot from them. And I don’t think that a lot of people in the room knew a lot about [my
area]… So that was also very nice.” Several people mentioned how working across
boundaries has brought new partners to the table, such as the schools system. Carol
noted, “I mean even to the point within the organizations, like the public school
system…now they’re a very strong partner. [Name removed] and some other people
from the public school system who had been in the LAP had always been very good
partners, but it hadn’t ever permeated through the school system and up through the
superintendent’s office. But now the superintendent knows what we do.”

104
The ideas around respect, positive working relationships, and breaking out of
previous ways of working came up repeatedly. Carol said, “[E]veryone had just been
so busy in their little silos before that no one knew what was available to them. And it
just wasn’t the way the work had been done in the past. You did it the way someone
had told you it was done and had always done it. They were discovering so many
benefits from the collaboration…” All members interviewed in Anne Arundel
discussed a high level of trust within the group. Mark noted this level of trust by
saying, “Talking about race for example was difficult. The trust [had] developed to
the point where that was doable.” The survey shows variables around trust and open
dialog at 75% and 92%.
Anne Arundel members also adopted the formal accountability system
(outlined in Chapter One) and continue to use it today. The majority of those
interviewed felt this was a valuable exercise in helping group accountability. Anne
Arundel participants reported a high level of accountability within the group in the
interviews. When asked about the level of accountability, Mark responded, “In a
word it was pretty good. We’d all sign up for what we anticipated being able to do
between the sessions, and for the most part, people followed through.” Carol agrees,
“I’m not going to say it’s perfect, because it wasn’t. But I think on the whole, the
people who took on the larger tasks accomplished them successfully, not always
necessarily by the first deadline that they set for themselves. But if you missed, or
deadlines weren’t hit, there was a second effort made and tasks were accomplished.
We had some tough times, people with personal issues. People who were pulled off

105
track in situations that couldn’t be helped, but they got back on. We had some really
good level of commitment in this group.”
High Performing LAPs: Baltimore City
“Is this good enough? Is this what we want for the children and families of
Baltimore City?” “[We] came to the conclusion that, despite all the stuff that was
happening at the state level, unless something was done in Baltimore City, the city
scores would continue to hold back the state scores.” These statements by Donna and
Sarah summarized the motivation behind forming the first local LAP group in 2003.
As noted in the previous chapter, only 26.5% of kindergarteners in Baltimore City
came to kindergarten in 2003 ready to learn. Donna noted “that data is a huge
motivator for groups of people to work for change.”
The overall numbers presented a significant challenge for the group. Donna
summarized early thinking as the group came to fruition, “Well, the school system
was a mess, all of the data was bad. At that point we knew that in order to make the
change we were talking about, this wasn’t something the school system could do.
This needed to be a cross-agency, a cross-sector process. A whole lot of different
groups of people needed to come together to make any kind of meaningful change.”
Members described tensions among some of these groups. One participant noted, “I
recall the turf battle was primarily between the Baltimore City Public Schools, early
childhood folks and Head Start… all of which were represented in the group… I
don’t remember it being a huge issue, but I definitely remember some of the meetings
and some of that tension being present.” Donna agreed, “Of course it’s always
there… But I don’t remember that it was a huge thing.” Nina, a nonprofit leader, felt

106
the tension was more pronounced, “Everyone comes to the table with their own
agenda because everyone in the room had some part to play in the community to
achieve their strategic objectives for their organization.” She described a situation
where the group did not take advantage of an opportunity because of what she
considered political reasons. She believed members of the group were concerned
around credit for the project going elsewhere. “And that bothered me,
because…when we walk in the room, you let go to your agenda, and the child and the
parent are supposed to be what we are focusing on. And that didn’t always happen.”
Approximately one-third of those taking the survey agreed there were competitive
pressures within the Baltimore City LAP. All survey respondents felt the group had
experienced prior political/turf relations between organizations that hindered
collaboration early in the collaborative.
Baltimore City’s accountability partner was the board of the Family League of
Baltimore City. Only one person I interviewed thought they made a difference in
accountability, while others either thought that the relationship was unclear or that
there was no such group. Sarah noted that since this was the first local LAP this role
had not yet been well defined. Some described the Family League’s role as the
convener rather than someone in which the group reported to or felt accountable.
More than one person mentioned the leadership of Nancy Grasmick, the Maryland
Superintendent of Schools at the time and not someone officially affiliated with the
Baltimore City LAP. Survey results show three-quarters of those surveyed responded
that the group felt responsible to their accountability partner and two-thirds felt this
group had a positive influence on the collaborative.

107
Like participants in Anne Arundel County, facilitation played a prominent
role within the Baltimore City LAP. Donna shared a common response, “[The affect
of the facilitators was] huge, huge. You have to have the right facilitator. If you don’t
have the right facilitator, forget it… Their role is just so key and so multi-dimensional
because their role has to be knowledgeable about the process, knowledgeable about
the issue, knowledgeable about group dynamics. They have to be so skilled.” This
was true in the survey results as well as all responses were positive with regard to the
implementation team.
Members also felt the facilitators helped them get through conflict. Donna
discussed the influence of one particular facilitator. “Not everybody agrees with me
because she will call you on your shit in a minute, and people don’t like that. She
doesn’t do it in a way that publically humiliates you, but you know she sees what
you’re doing, and you might have been doing this stuff for years. She’ll help you if
you let her, to get past it and grow and develop in ways you didn’t think you had the
ability to do. She helps to lower those barriers, those defensive barriers, that you have
personally and built as part of your role in a public agency.” The LAP had one
member in particular that caused a good deal of conflict; however, those interviewed
noted that facilitators and other group members managed the situation. Donna added,
“Because we had skilled facilitators, they were always able to handle that conflict in a
way that it could be resolved.” Almost 90 percent of members surveyed in Baltimore
City felt the conflict was managed well in their group.
Sarah highlights an example of the intersection between facilitation and
conflict management when she described a particularly difficult conversion related to

108
strategy development. “Do we just adopt the five goals that came out of the state plan
and then work from those or should we… add a sixth goal which was much more a
reflection about what people felt about Baltimore City schools at the time? The sixth
goal was about the schools being ready to receive these kids because the concern was
if we were successful in doing all this terrific [work] to prepare families and young
children to go into Kindergarten… the school system was so screwed up it would
undo any good that might have been done.” She described tentativeness around
entering this debate, “Can we really talk honestly about the school system?” Member
of the school system were present in these conversations. Sarah attributed the
facilitation and setting of LAP in allowing that conversation to happen. “I’m not sure
where [else] those conversations would happen… it was an appropriate conversation
because we were talking about our goals and if we’re going to work with the MLAP
goals, were they sufficient for what folks felt [were] the important issues in Baltimore
City. But then the actual [act] having of the conversation and getting to a point where
we could make a decision about adding the sixth goal, I think that only happened
because we had really good facilitators… they facilitated the conversation happening
in such a way that the group arrived at a decision.” And that decision was to add the
sixth goal.
Members in the Baltimore City LAP did not have as many structured
leadership tools introduced as later LAPs; however, like Anne Arundel participants
they used the consensus tool for decision-making both during and after formal
facilitation. Sarah said, “And [consensus] based decision-making stuck. And that was
one that seeped into the other ways of doing business amongst our group because a

109
lot of these people were meeting in other capacities and other places and I know that
this notion [of consensus based] decision-making got carried out.”
Members of the Baltimore City group did not have as formal of an
accountability system, but participants reported in interviews that they captured
commitments and report back on them at the next session. The group continued to
use this system once formal facilitation ended. Members in the Baltimore City LAP
reported a high level of accountability within the group. Almost 80% of survey
participants noted that members could be trusted to complete commitments. Sarah
noted, “My impression was that the group was pretty accountable… I was amazed
at… how seriously people took the process… People stepped up to do their part in
making [it] happen.”
Participants interviewed from Baltimore City overwhelmingly discussed the
strong working relationships. This was affirmed in the survey as over 100% of
participants noted strong working relationships and 100% noted trust in the group.
Donna summarized a common sentiment, “[P]eople began to see and believe that you
can get things done if you come together and you’re willing to trust and to share.
Trust is a big issue in public agencies because they get beat up so much. If you let
somebody know that you screwed up, oh my god, you’re front page of the newspaper.
So it’s really hard to trust, but I think trust was built. Maybe not at the agency level,
but between individuals, people were able to form working relationships and work
together.” Sarah agreed, “People really did come to appreciate one another… that
group [had] the sense that we actually could do things…there really was a lot of
activity that started to happen as a result of the LAP work and that was very

110
encouraging. [W]hen I think back on it, it wasn’t like a process without its bumps on
the road but it actually is one of the few endeavors that I think many of us felt that we
were a part of that actually materialized into something.”
Moderate Performing LAPs: DeKalb County
“The thing about the group in DeKalb is they have a history of working
together, but not a lot of turf battles. It was more, what is this new thing? How is this
going to help us? Who are these people from Maryland or wherever they were from?
What is this?” Susan described initial confusion as the DeKalb County LAP came
together. “We had just started the DeKalb Early Learning Commission and we
weren’t really sure what that would be like, and we weren’t very happy with LAP
coming in at the same time as we were trying to get this other group off the ground,
but they were seen as an accountability partner. This meeting, I can remember it was
pretty horrible… The people who discussed LAP were way too vague and way too
theoretical. And people were confused about how this was different from the DeKalb
Early Learning Commission we had just set up like 3 weeks before. So I remember
there was some angst and some real initial confusion, but the ones coordinating it
decided that it would probably just be temporary and we’d just forge ahead.”
Participants interviewed described the need for additional pre-k programs as
well as more parents as teacher programs. All noted the fact that DeKalb is a very
diverse county with a high refugee population. Members noted concern that children
from these diverse backgrounds were not receiving the appropriate care and early
learning. John noted, “There were a lot of preschools around, a lot of pre-ks, but
none that administered to refugee kids with unique issues and problems.” Yet

111
DeKalb County members had a history of working together, at least for those in
government. Susan said, “We’re very insidious. Everybody knows everybody pretty
much. Maybe one or two new people, but I don’t think so. I think everyone in the
room had familiarity with everyone else except the people from LAP.” None of the
participants interviewed felt there were turf battles or previous negative working
relationships. The survey was consistent with this view as only half of participants
felt the group had an issue with past history and all respondents noted strong
relationships early in the process. John felt there were not enough nonprofits in the
room. “[I]t was a combination of state agency people, United Way people, people
who ran preschools and had an interest there, [there was] only [one] agency that
represented an ethnic minority or came to this from the vantage point of an interest
group.”
DeKalb County’s accountability partner was listed as the United Way of
Metropolitan Atlanta Early Learning Commission and DeKalb County Early
Learning and School Readiness Commission, though often in my interviews
participants would only cite one or the other. The majority of those I interviewed felt
they made a difference for the group in terms of effectiveness. John said, “We were
reported to them regularly… To the extent that we came up with a plan and we took it
to the DeKalb Early Learning Commission, which was made up of people throughout
the government, we broadened the interest in the topic and the support for it. So in
that extent it was valuable to have access to those groups.” No one had negative
comments about this relationship. This was true in the survey as well given almost
80% of those surveyed said there was an external group in which they felt
112
accountable and almost 70% felt this group had a positive influence on the
collaborative.
Another group considered positive to the work in DeKalb County was the
facilitators. John noted, “The program was financed for 14 months and then people
decided they wanted to keep it going but we had no money. We tried it without the
facilitators, and it didn’t work very well. We got a free facilitator for a while who
wasn’t very good, so we went back to paying for facilitators. That was really
important to have someone outside the group who had no vested interest but who
knew how to facilitate meetings, it turned out to be pretty important.” Susan agreed,
“Once we started going and having meetings, the facilitation team was excellent…
they were absolutely superb. I think everyone would say that.” This was true in the
survey results as well. When asked whether the coach facilitators were skilled in
helping them make progress and whether they improved group effectiveness, close to
90 percent surveyed in the DeKalb LAP agreed with both statements.
All of the participants interviewed mentioned the distinct process surrounding
the LAP framework. Susan said, “I think we grew to really like it because it gave
some structure to meetings when you’re really pushing people to get something
done… [but others] couldn’t take it…The process… and not moving into action.”
She described how some people left because they felt the work was moving too slow.
“I really value the relationships and exchange of ideas and things that happened
informally through LAP that people couldn’t really seem to put their hands on.” She
noted two success stories of people who came into the group skeptically but ended up
being active, contributing members. John on the other hand was frustrated at the
113
rigidity of parts of the process. He believed that deciding on the work and programs
was flexible, yet that the goal itself was not. He pointed out that the goal focused on
immediate outcomes, while improving early learning outcomes requires starting with
prenatal care. “We struggled for a long time with the goal. Do we just ignore the goal
and come up with the best programs we could for pre-k children or do we try to really
affect the outcome the mission was affecting? [The process] could’ve been improved
by having a more realistic one that was consistent with our mission. It could’ve been
improved by rallying us to alter the goal, which wasn’t an option for us.”
Like other groups, feedback around the leadership component was mixed.
John said, “I think most of the leadership exercises didn’t produce results that were
worth the effort… I didn’t learn anything there I hadn’t known already. Other people
learned a lot of stuff because they were younger and didn’t have management
training.” Others I interviewed disagreed, with one citing that as one of the most
important pieces of the process. All participants mentioned the consensus decision-
making tool and noted they still use the system today. Those interviewed felt it was
important for hearing everyone’s viewpoint. Over 90% of DeKalb County survey
respondents agreed all voices were heard in the process. Susan noted, “They’d make
people who weren’t happy talk about it instead of just stewing.” John discussed the
challenges with process, “It drove me crazy. The LAP process, the goal was to bring
everybody on board. The goal was to have everybody agree. If you had anyone with a
thumb down, you’d stop the process and figure out what their objections were and try
to overcome their objections. It… was a good way of getting people on board, but it
was a very slow process. I’m a Type A person, and I see what the problem is, figure

114
out solutions, get the answer, and move on. This was the opposite of that. And I tell
you, it was valuable in that regard, it improved relationships, you got everybody on
board so when you have a program everyone is willing to participate, but it was a
painful process.”
Despite the pain he endured with the process, John noted an absence of
conflict with the group. “I think there were differing opinions periodically. I
disagreed with the group a bunch of times, but nothing critical and nothing that
wasn’t solved by bending a program to make a person happy. The objections weren’t
enough to stop us from moving ahead. I don’t think there was ever a time where the
process [broke down] because of a difference of opinion.” Survey respondents
agreed as almost 90% felt conflict was effectively managed in the group and only
25% of respondents felt turf relations existed later in the process that inhibited
collaboration. Above all, John appreciated the relationships formed in the group.
“The LAP enabled me to make contact with people in the early learning community
who were willing to help… I think that summed up the value of the process, at least
for me. When you’re with people once a month, you get to know them pretty well.
I’m pretty shy and quiet, but in that environment, you can’t help but get to know
people and get to know who can trust and who delivers on what they say and who
was willing to step beyond their own narrow self interest and help you out. So I got to
know people in the county who cared about early learning in a really close way and as
a result I developed some really strong working relationships… It was the
partnerships and developing relationships of one kind or another that helped develop
[my] agency, but that was, to me, one of the main advantages of that program.”

115
Members interviewed in DeKalb had only positive things to say about
relationships, with comments ranging from discussing strong working relationships,
to building relationships with others on the same page, to getting to know one another
across traditional boundaries. Several members in DeKalb commented on the group
being very open and willing to share information. One member expressed a common
theme: “I think there was trust there. I think that probably over time… we all got a
lot more open. I’m fairly quiet, and there was a librarian there and she was fairly
quiet but toward the end we both were interjecting all the time.” Over 80% of survey
respondents agreed there was trust and openness in the DeKalb group. Interview
participants also mentioned the fact that everyone worked together to solve the same
problem, a fact that was satisfying given it had not been happening in the past. The
majority of DeKalb County participants discussed a high level of commitment within
the group and high accountability. Over 80% of survey respondents agreed there was
a high level of member commitment and 75% agreed there was a high level of
accountability around commitments.
This high level of accountability was often attributed to the formal
accountability system of writing down commitments, a tool still used today. John
said, “I think accountability was pretty good. The process forced you to write down
what you were going to do. And the first thing you did when you got back to the next
meeting was tell what progress you made. I think it was helpful. I think it was totally
appropriate, that sort of accountability.” Susan agreed, “It was really helpful. The
other thing the group kept was the check-in. If you didn’t have anything to check-in,
it was a semi-competition to see how much they’d be able to put on the sheet. The

116
group was a little competitive, in fun... The group really took it seriously, but there
was some peer pressure to follow through.”
Moderate Performing LAPs: Indianapolis
“Honestly, I thought it was the same old thing that we’d been involved with in
so many meetings and hence the reason why I didn’t want to be initially involved,
because I just didn’t want and couldn’t afford the time away to talk about the same
thing I’d been talking about for years or heard talked about for years. So, my initial
impression in all honesty is that this was just another one of those meetings that I
really wished I hadn’t wasted my time in.” Eric gave a common sentiment with
regard to his outlook in joining the Indianapolis LAP. Kimberly said about her
outlook, “I was hopeful, but I was skeptical at the same time because I thought, what
is this going to be about, is it going to be on the table? I was hopeful just because of
the accountability partners, and I thought okay, you know, at least we have someone
who can actually institute change, but at the same time, a lot of the people around the
table I knew, and had known forever, and so I thought, okay, how are we really going
to do anything different?”
Participants described issues of politics, with one interviewee calling
Indianapolis a “political quagmire.” Over 75% of survey participants felt the group
experienced prior political/turf relations between organizations that hindered
collaboration. Politics between local and state government was noted as an issue.
Ann notes that the Mayor’s office wanted its “own identity” despite being a minor
funder of LAP. She goes on, “There was confusion and probably some negativity
with our city’s administration and the LAP group. At that time our city was also
117
launching it's Re-entry Initiative… so they were sort of working parallel to each
other. I was invited into that group as well, and it was called the Mayor’s Re-entry
Task Force. So, it was really confusing to be sitting in two different rooms with
similar players. There was probably a handful of us, six to eight of us, involved in
both groups. We kept saying, “Why are we doing this; why do we have two groups
going on simultaneously?” It was evident there was a conflict and that continued for
almost the whole life cycle of our LAP.” The survey showed only slightly more than
half felt the group was able step out of past history and start fresh. Finally, the
problem of recidivism was a difficult and complex one as well. Kimberly noted,
“Well, our county, our city has the highest recidivism for the whole state. You can
put three other [Indiana] counties together, and you still don’t have the same
recidivism rate as we do. So, about 50% of the people that go in to prison go back
within a three-year period of time. That’s a huge number and so that’s why that topic
was picked for area.”
Indianapolis’s accountability partner was listed as the Indiana National
Governor’s Association Re-Entry Policy Work Group and the Criminal Justice
Planning Council, but participants usually referred to them as the Governor, Mayor,
and Commissioner of Corrections. The majority I interviewed said there was a
formal reporting relationship with this group. Members’ account of this relationship
was mixed, ranging from helpful to neutral to insufficient. Eric noted, “I think it does
make a difference because if you have someone like the Governor and the Mayor
there just waiting for you to report out, you kind of take that a little more seriously
than if you’re just doing it ‘to do it.’” Ann disagreed, “[Involvement was] pretty

118
weak. Our Accountability Partners did not stay engaged very well to the extent that
whoever was there representative went back and told them what’s going on… I think
there were times that if they had used their influence… then things would have
moved faster, or might have moved because clearly they have the ability to impact
things.” Survey results with regard to questions about accountability partners ranked
among the worst of all six groups. Only about half of survey respondents felt the
group had an external group to which they felt responsible and only approximately
65% felt they had a positive influence on the work of the group.
On the other hand, all participants interviewed in the Indianapolis LAP found
their facilitators essential to the group success. Individuals felt it was helpful to have
a facilitator and that they were a positive impact on the process, often crediting them
for helping the group move forward and allowing the group to have difficult
conversations. Ann expressed a common sentiment, “Our coach facilitators were
awesome. Frankly, we’d have probably never gotten off first base had we not had
them to coach us through some of the conversations because everyone in the room’s
mindset is working hierarchical.” She noted that at times many in the room wondered
whether they could challenge the Department of Corrections given many had a
funding relationship with the agency. “If I say this, will that reflect badly on [my
organization], will our contract be in jeopardy?” She believed the facilitators were
able to guide those conversations and “understand the story beneath the story”, which
in turn allowed needed conversations to occur. Kimberly agreed. When asked about
the facilitators’ impact on the process she responded, “Oh, everything. I mean, if we
wouldn’t have had them… everyone in that room was too passionate about that topic

119
to have a conversation all their own, so we needed a whole different set of tools. As
aggravating as it may have been sometimes, because you’re just wanting to say what
you had to say, we needed those tools to be able to have a competent conversation
about change. You know, if someone’s saying, “Hey, this needs to be changed in
probation,” and I run the Probation Department, then I’m going to take offense. But
if the tools are used and you have a facilitator saying, “Hold on a minute,”, it enabled
us to have difficult conversations that would have never happened without them being
in the room.” Survey results were equally positive. When asked whether the coach
facilitators were skilled in helping them make progress and whether they improved
group effectiveness, close to 90 percent in Indianapolis agreed with both statements.
Indianapolis members also felt the facilitators were essential in helping to
manage dominant personalities and traditional power dynamics. Several members in
the Indianapolis LAP mentioned one instance in particular when a facilitator
successfully neutralized a very powerful member of the community trying to
dominate the process. “I think one of the struggles we had in Marion County for
years is that dominant personalities would take over a meeting and then everyone
would be frustrated. But with the coach facilitators… they don’t care who the
Mayor’s representative is, they don’t care who the Governor sent. Everybody’s
treated equal… one of the judges got on his little bandstand and in a very polite and
cordial way, they ended up putting him in his place and reminding him that he’s not
there to validate the meeting. He left that afternoon and never came back. But you
know what, everybody in the meeting was okay with it because if not, he was going
to continue to be showcasing. So, I think the facilitators did a really good job at

120
getting us focused and staying on track.” Ann told the same story. “I can just
remember [a Judge] got neutralized pretty quickly, effectively. I remember sitting
there going, “Wow,” because it was early on and the Judge was espousing, ‘this is my
court’, and he was very vocal and used to getting the floor, and when he was talking,
no one else was supposed to. [The facilitator] was just really effective in kind of
talking him down a little bit, asking him some questions and asking him if we could
call him by whatever his first name was. One of the big powers of LAP is… for us all
to have voices and for our voices all to be equal in conversations… [This situation]
showed the other 39 of us that we had a voice, [which] was important because we
were all sitting there, just letting him dominate conversation, letting him guide the
discussion of where he wanted to take the direction of it… because [that was] our
hierarchal, normal mode of operation . . . Who’s going to interrupt the judge?”
More than any other group, Indianapolis members were positive about the
leadership component of LAP. Eric said, “I think Myers Brigg clearly helped me
when I was realizing who an introvert was and all the other roles that we got scored
on… that helped me in time adjust to some of those issues on the table. [It helped me]
know how that person could be as they present out… It’s not necessarily they don’t
want to be involved, they just don’t talk very much.” Ann felt she was given the tools
to lead and develop groups in a different way. Members in Indianapolis also used the
formal accountability system and continue to use it today. Eric found the system
helpful. “I used to take my copy of the paperwork and come back and put it on my
desk, because if I didn’t put it on my desk or I put it in my briefcase or I put it in a
folder, then I forgot about it because I’d get busy doing my stuff. So, having that

121
form in front of me, I got more work for the group done that way than I ever did any
other way.” Ann agreed, “[The group] embraced it and we still use it. [It was helpful
in terms of accountability] because if you make those action commitments, and if
keep them in front of you, it’s like your “to-do” list . . . I personally would always just
bring mine and stick it right on my computer so I would know what I said I would
do.” Overall however members in Indianapolis reported a mixed degree of
accountability, with some members saying it was high and some members saying it
was mixed. Sixty-five percent of Indianapolis survey respondents felt members could
be counted on to complete their commitments.
Like other groups, members of Indianapolis valued the consensus decision-
making model and continue to use it today. “I think what I liked most about that, is
that it made it so that everybody’s included, everybody had the opportunity to be
heard, and the ones that were maybe a little more shy or introverted, it almost pulled
them out and makes them either, “Put your thumb up and you’re buying in, I agree,”
or if you don’t, “Here’s your chance to say something and get it fixed.” I thought that
was very effective; that worked really, really well.” Eric agreed, “I think it was a
great way to make decisions. If you have the time to discuss [issues], we change
other people’s mind when you lay your cards on the table.” The survey was less
positive as only approximately 60% of respondents felt the group ensured everyone’s
voice was heard in decisions and 65% felt members focused on shared goals rather
than individual agendas.
While interview participants were positive about their decision-making
process, many noted that making these decisions included conflict. Almost two-

122
thirds of the respondents felt conflict was adequately managed, yet two-thirds of
respondents felt even later in LAP there were issues of turf that inhibited
relationships. Those I interviewed repeatedly mentioned conflict with regards to
decisions around membership. Some group members wanted to keep the group
closed while others wanted to open it up to more members of the community.
Kimberly recalled, “We had knock-down, dragged-out arguments, over half the
people would want one person and half the people wouldn’t want one person. I mean
I run an organization . . . I sat here for two hours while you all have argued about this
. . . it just was so ridiculous to me. And that’s why I feel like membership is a big
issue in making sure that this is all effective.” She argued that new members did not
understand the process or history of the work, so often they would suggest ideas that
had already been vetted and rejected by the group. She went on, “I think they felt on
the outs a little bit maybe. We spent a lot of time discussing things we already
discussed and explaining why we already did it, and then there would be conflict
about why did we do that? And so there was constant conflict. In the beginning there
may have been a little bit of debate here and there, but not like I saw as time went on.
That’s why a lot of people kind of fell off as far as being a part of the group over
time, because it gets frustrating when you have the same conversation over and over
and over again. As you add new members, and yes, you do need to add new
members, but at the same time I think we added too many.”
Ann also described the struggle, but from a different perspective. “[There
was] this perception that LAP was elitist… our LAP members really took
membership conversations to a totally higher level than I was ever really comfortable

123
with. There was a real almost closed mindset. [Some said] ‘I don’t understand why
we need to bring more people in; we won’t be able to teach them all these news
skills.’ Then there was this other cadre of folks that would say, ‘I don’t understand
why would we want to keep people out; I don’t understand why if they have interest
in re-entry and helping us with the work, and God knows there’s enough work to do,
and there’s already enough people who say, I don’t have enough time to invest in our
strategies, why we would we want to keep people out’. But we spent an inordinate
amount of time on every conversation on who could and couldn’t be on the LAP…
So this whole concept of being elitist and not understanding what LAP meant and it
being closed and invitation only, was somewhat disruptive. It was disruptive in the
community because, “Oh, you were in LAP, well I wasn’t invited.” So, that whole
concept of being an elitist group that somehow ‘I was in the club and others were out
of the club,’ was fracturing.”
Despite this conflict, the majority of those interviewed described strong
relationships among group members. Kimberly noted, “I think the relationships were
good… I think we all made valuable relationships, some were stronger than others. I
don’t think that the differences in the debates, or whatever you want to call it…
impacted our relationships with one another for the most part.” Ann expanded, “I
think there were those that were coming because they were being told to come and in
that group, trust never really probably manifested. But then with those that were
bought into the process who were doing the work between the work, which is the real
work, who were doing the action commitments and forming other relationships
outside of LAP because of the new opportunities. Those trust relationships I think

124
went through the roof. I have some of those, and I would never have had that
opportunity had I not been part of LAP. And they would not have known me as
personally or as deeply nor my skill set, nor where my passion lies had they not
experienced [LAP]. So, opportunities for me personally in the profession and for my
organization are still materializing as a result of the relationships that I formed in
LAP.” Eric agreed, “I made some good friends there, and I also knew that not only in
my group, but in the whole group, that I can just pick up the phone or send an email if
I needed because now because I was making connections, and usually everybody was
on the same page and wanted the same goal. So you got some of the stuff done rather
quickly. You got a lot of stuff done behind the scenes that I felt that LAP didn’t get
credit for… I mean I still email them or call them and say, “I need help here, and you
help me with this?” Or they call me, “Could you check on this for me?” And I don’t
think we had this, I know we didn’t have that before [LAP].” Three-fourths of those
surveyed felt the group enjoyed strong working relationships.
Overall Eric and the majority of those interviewed admitted their initial
skepticism around LAP changed as the process went on. “I can’t say it was like
lightening-strike change, but over the course of time I began to see the work and
realized that we were actually getting some progress made, which made it exciting to
go to these meetings in the initial stage because you can actually see results being
formed. You can see where you’re actually making a difference and in this business
that’s what we want to do, we want to make a difference.” Kimberly’s outlook
changed as well. “We have a stronger relationship with criminal justice partners…
you know we live on different sides of the world. They lock them up, we try to help

125
them, and so sometimes it’s hard to see the other person’s side. I think the group
brought us closer together… it’s kind of like we were on different softball teams, and
now we know we play on the same team.”
Conclusion
Members of the high and moderate performing collaboratives shared a variety
of tools and elements when implementing their work, but also faced unique
challenges. The following chapter will examine the process of low performing
groups then synthesize the data from Chapter 4 and 5 to understand whether this case
analysis can lend insight into best practices of cross-sector collaboration.

126
Chapter 5: Examining Process – Low Performing Collaboratives
Chapter 5 continues the case analysis with regard to the two low performing
collaboratives, Montgomery County Maryland and Polk County Iowa. The following
section will analyze the data presented here and Chapter 4. Finally, this chapter will
present findings and conclude my examination of the relationship between
collaborative design process and effectiveness.
Case Analysis
Montgomery County
“I was really excited [when LAP started]. I was really hoping that the LAP
process would expand what we've been trying to do in early childhood for many years
as... early childhood services are very fragmented. We have programs funded by the
County but we also have lots and lots of private-sector programs for childcare. We
have a lot of private non-profits, we have the school system, we have health programs
so this to me was an opportunity to pull all those early childhood stakeholders and
begin working in the direction of improving, promoting, coordinating and eventually
getting funding for early childhood services.” Like all of those I interviewed in
Montgomery County, Tracie expressed optimism at the start of LAP. Montgomery
County had what was described as a positive history of working together around early
childhood education. Efforts around collaboration began in the mid-1990s. Tracie
expanded, “We have had a long history in Montgomery County of working towards
promoting a coordinated early childhood system. This was something that was in a

127
vision in many people’s mind; recognizing that we really need it to work together in
order to best serve young children.”
Because of these earlier efforts, the group was mostly established at the start
of LAP. Participants noted that while there were some new people, most of them
were either new to the County or new to early childhood education. Opinions around
previous working relationships differed some, but most noted a positive history.
Tracie said, “The old people, we all had very positive feelings about each other, about
the County, about early childhood. We sort of had a general hope for where we're
going. I think we were very much of the same mind and I think we welcomed having
new people at the table. I think we all felt that we needed to expand and we wanted to
expand to the broader community. I think it was positive, very positive.” Emily noted
some turf issues within the group. “I think there was a lot of work that had been done
and had been ongoing – and it hasn’t stopped. We still have some structures in
place… But you know I would say that there was competition among the nonprofit
providers related to funding which is normal. There was turf there, and I also think
there was some possibly feelings you know of judgments related to quality related to
some of the people who were present. I think that was also there.” In addition, the
overall external environment, such as the Superintendent’s office, the Board of
Education, and the County Council in Montgomery County was described as very
politically charged.
Montgomery County’s accountability partner was the Montgomery County
Collaboration Council for Children, Youth and Families. This seemed clear to all the
participants I interviewed, yet the feedback I received around their influence varied.

128
Emily said, “I think they definitely were conveners. I think they were also supposed
to be an important connection to the LAP process, to Casey and sort of what this was
all about… I think that they shared a sense that we were accountable to each other
and that there was a sense of expectation for the group as a whole. And I guess the
Collaboration Council definitely helped with keeping us on task and with a sense of
what our expectations were and what we agreed to. In that kind of accountability,
they were a part of that. But to be honest... I think there’s a general sense to our
community that we have accountability to our community as a whole.” Tracie felt the
Collaboration Council took responsibility for keeping accountability, and added, “I
think it was very helpful and there was really no other agency that could have done
that. They had the time and the ability to devote staff to it.” Members of the
Collaboration Council were also part of the LAP. Survey results were uniformly
positive, with 90% of respondents feeling the accountability partner was a positive
influence on the LAP.
Montgomery County LAP members had a decidedly different view with
regard to their facilitators. The feedback was uniformly negative with members
describing them as unskilled and getting in the way of good work. The majority
interviewed said that the facilitators were more interested in going through a process
versus listening to the needs of the group. Elizabeth expressed a common sentiment,
“Well I found them rather irritating and just so focused on their process and not good
at listening to what was going on in the County. I think a number of us felt that they
were more in the way rather than facilitating good work. It was frustrating and I think
a whole lot of people dropped out over the course of year who might have stayed.”

129
The idea that the facilitators stuck to a structure/process/agenda at the expense of the
group came up repeatedly. Tracie agreed, “I would have to say, quite frankly, that the
facilitators were phenomenally unskilled… we were interested in moving early
childhood forward. They were interested in the structure they had for their leadership
and action programs… The facilitators or, I don't know, the accountability partner,
they should have looked at where the group was and took it from there as opposed to
imposing the LAP structure on a group which in many ways was a pre-existing
group.” Survey respondents in Montgomery County were also negative with only
50% of survey respondents saying the facilitators helped them make progress and
made the group more effective. This was by far the lowest score among the six cases.
This negative experience with the facilitators influenced participants’ opinions
about the leadership development piece of LAP. Tracie explained, “They wanted to
get through their LAP exercises, which I don't have a problem with. You know, I
think the results based accountability is a really great example. I've [had a lot of
experience with that concept]. It was not explained at all to our group yet each at
each of our sessions, we were supposed to talk about results based accountability.
Some people who hadn’t had it were terribly confused about what they were talking
about. What RBA was… it was like a foreign language to them. Even to the very end,
I'm quite sure that a lot of people never bought into it; never understood that
particular point.” She goes on, “Almost all us it had done Myers-Briggs before. I
love Myers-Briggs. I did it in the early 80s and I think most of the people there were
very familiar with Myers-Briggs. There was really no reason to spend several days on
Myers-Briggs. That was a real waste of time for our group as fun as it was, it was not

130
getting us anywhere.” Elizabeth agreed, “[The facilitators] were running through
their routine but it didn’t seem to haven't any flexibility to what you wanted to talk
about or sort of where we were in the County… I don’t think that they explained [the
tools] or made them useful tools. [For example,] RBA [results based accountability], I
didn’t feel that that people bought into that and that was disappointing as it could've
been a good tool.” Several members said there was a tension between the leadership
development piece and the need to do direct work on behalf of the goal.
Few members mentioned specific tools utilized by the group to enhance
consensus or group collaboration. Montgomery County did not embrace a formal
accountability system. Elizabeth said, ‘It may have been embraced by some. I
thought it was sort of tiresome.” Tracie agree, “Some people sometimes were very
proud to be able to report back that they had this great idea, they followed up on it,
and they did it; however, that was occasional. I think for most people, it was an empty
exercise. I don't think it really caught on.” Overall members of Montgomery County
reported lower overall accountability during interviews.
Members noted a high level of conflict in the group and felt that facilitators
did a poor job of managing it. Tracie gave an example, “[One member] was
constantly talking over the facilitators. She was very confrontational and hostile in
virtually every conversation and then she would quickly leave and come back the
next session and start the whole thing over again. It was frankly some of the most
bizarre behavior I’ve ever seen in a group situation like that. Some members of our
group, including myself, really wanted to do something immediately and the
facilitators really put us off. They really wouldn’t do anything. It was very

131
destructive to the group confidence and the group’s coming together. It came at a
critical time when we should have been jelling in terms of trust and relationships and
all of those things.” Another member, noting the same conflict, said, “I felt we lost
some valuable members because that [conflict] went on, and I think no one quite
knew how to stop it.” Elizabeth, like all members I interviewed, also noted a general
sense of conflict among members. “There certainly was conflict within the group.
There were people who had their one issue and by God we were going to talk about
their one issue type thing, [which] I think slowed us down.”
This high level of conflict seemed to translate into poorer relationships than
other groups in the sample. Only one person interviewed mentioned positive aspects
of the group’s relationships or a high level of trust. The same person was the only
one interviewed who cited group commitment as a strength. The majority of
members mentioned less commitment over time within the group and a high level of
attrition. Tracie said, “I think those of us who knew each other well and had worked
with each other over the many years continued to have those relationships. If you
look at the attendance information, you’ll see that we started with over 40 people and
ended up with about 10… it was very clear that people who didn't have this as a part
of their job description weren’t completely committed to it… The process did not
engage any new partners. There were no new people that continued on to the end.”
Low Performing LAPs: Polk County
“Des Moines has had a long history around coming together around children
at risk. You could go back into the early 90s, late 80s for collaborations that have
come together.” Caroline described some of Polk County’s previous collaborations.
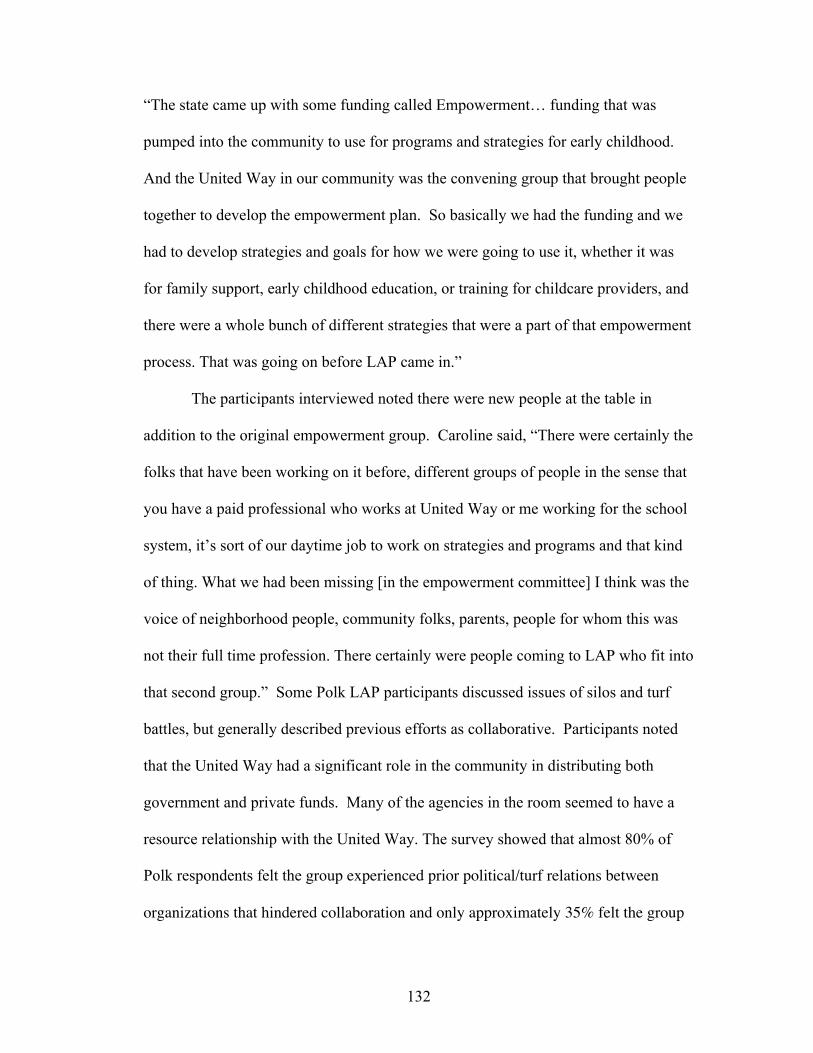
132
“The state came up with some funding called Empowerment… funding that was
pumped into the community to use for programs and strategies for early childhood.
And the United Way in our community was the convening group that brought people
together to develop the empowerment plan. So basically we had the funding and we
had to develop strategies and goals for how we were going to use it, whether it was
for family support, early childhood education, or training for childcare providers, and
there were a whole bunch of different strategies that were a part of that empowerment
process. That was going on before LAP came in.”
The participants interviewed noted there were new people at the table in
addition to the original empowerment group. Caroline said, “There were certainly the
folks that have been working on it before, different groups of people in the sense that
you have a paid professional who works at United Way or me working for the school
system, it’s sort of our daytime job to work on strategies and programs and that kind
of thing. What we had been missing [in the empowerment committee] I think was the
voice of neighborhood people, community folks, parents, people for whom this was
not their full time profession. There certainly were people coming to LAP who fit into
that second group.” Some Polk LAP participants discussed issues of silos and turf
battles, but generally described previous efforts as collaborative. Participants noted
that the United Way had a significant role in the community in distributing both
government and private funds. Many of the agencies in the room seemed to have a
resource relationship with the United Way. The survey showed that almost 80% of
Polk respondents felt the group experienced prior political/turf relations between
organizations that hindered collaboration and only approximately 35% felt the group
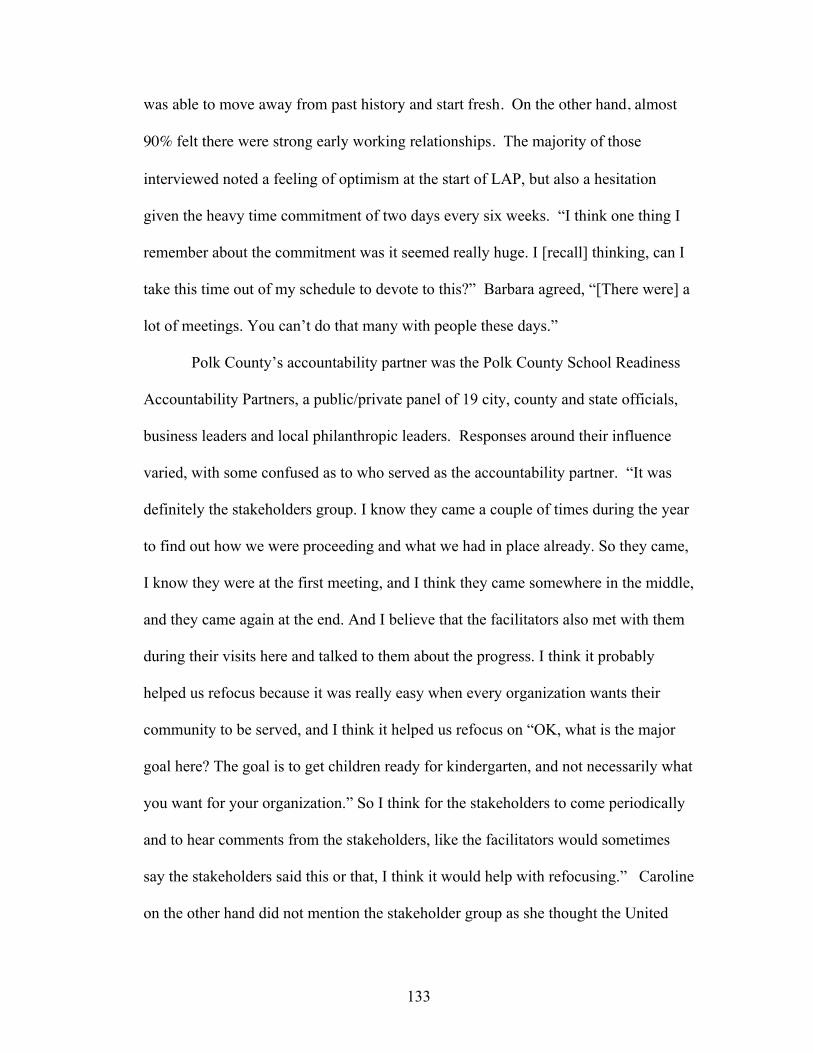
133
was able to move away from past history and start fresh. On the other hand, almost
90% felt there were strong early working relationships. The majority of those
interviewed noted a feeling of optimism at the start of LAP, but also a hesitation
given the heavy time commitment of two days every six weeks. “I think one thing I
remember about the commitment was it seemed really huge. I [recall] thinking, can I
take this time out of my schedule to devote to this?” Barbara agreed, “[There were] a
lot of meetings. You can’t do that many with people these days.”
Polk County’s accountability partner was the Polk County School Readiness
Accountability Partners, a public/private panel of 19 city, county and state officials,
business leaders and local philanthropic leaders. Responses around their influence
varied, with some confused as to who served as the accountability partner. “It was
definitely the stakeholders group. I know they came a couple of times during the year
to find out how we were proceeding and what we had in place already. So they came,
I know they were at the first meeting, and I think they came somewhere in the middle,
and they came again at the end. And I believe that the facilitators also met with them
during their visits here and talked to them about the progress. I think it probably
helped us refocus because it was really easy when every organization wants their
community to be served, and I think it helped us refocus on “OK, what is the major
goal here? The goal is to get children ready for kindergarten, and not necessarily what
you want for your organization.” So I think for the stakeholders to come periodically
and to hear comments from the stakeholders, like the facilitators would sometimes
say the stakeholders said this or that, I think it would help with refocusing.” Caroline
on the other hand did not mention the stakeholder group as she thought the United

134
Way acted as convener, but thought the group felt accountable to the Casey
Foundation. “I guess we all thought it was Casey because they were providing the
funding.” Only 50% of those surveyed in Polk felt their collaborative was
responsible to an external group; however, over 80% of those surveyed felt their
accountability partner had a positive influence on the collaborative.
Polk County participants were also mixed in their evaluation of the
facilitators. Survey results were positive with 80% of respondents noting the
facilitators helped them make progress and made the group more effective. Rachel,
from the public sector and relatively new to the community, was also positive. “They
tried very hard to stay neutral all the time, to have us lead with our ideas. They were
very good at redirecting us whenever we were getting off track and reminding us of
what our focus needed to be. I remember there would be arguments sometimes
amongst the participants about what we needed to do, and the facilitators were really
good at bringing us back and paraphrasing that and making sure we were all working
toward the same goal.” Yet many people in Polk expressed similar concerns around
the process as Montgomery County participants. Caroline expressed a common
sentiment, “I think the challenge for the facilitators is they were coming in from the
outside of the community, they don’t know the dynamics in the community, and
sometimes that’s good because they aren’t part of the dynamics. But I think some
people got frustrated that we had to keep going over the same stuff.” All facilitators in
LAP were usually from outside the community; however Polk and Montgomery were
the only two groups to make note of this disconnect. Barbara agreed, “[T]hey were
excellent, but they wouldn’t deviate from their training, [they needed] to make

135
adjustments because [they were] losing the group. And they tried to put it on us
because people weren’t coming, but people weren’t coming because the process
Casey used was so cumbersome… I can’t spend my days processing my behavior and
how that was going to converse with the group because I’ve got better things to do
with my time.”
Most members I interviewed expressed similar concern over the process.
Barbara said, “It was so convoluted, you couldn’t tell if we were working on
leadership skills or were we looking at data and figuring out the players and what we
could do… they lost a lot of people because the process was so cumbersome up
front.” Caroline agreed, “I think there was a sense that you could get too bogged
down in the process and feeling like you’re not ever getting to the content. [T]here
were people in the group who just hated group process and they’d be rolling their
eyes and be like, ‘Oh no, we don’t have to do another activity do we?’” Rachel was
more optimistic. “[The model] was very flexible. There was a lot of group work, so
you really got to know what other people were thinking. I mean it was two full days
in a row every month, so you really got to talk to the other people who were
participating and got to understand where they were coming from with their needs for
the community they were serving.” When asked about the leadership component, she
replied, “Sometimes I think it helped. I know for me it really made a big impact on
me because since I was new not only to my job but to the state of Iowa, it really gave
me an opportunity to become a leader within that group and community activity…
The problem is when you have a bunch of leaders in a room with their own agendas,

136
it can be hard to get to what’s going to be good for the whole group whether than
what do I want to see out of this.”
Several members within Polk County mentioned an issue with people having
their own agendas as well as other issues related to power dynamics. Rachel noted,
“There was a core group that you could count on being at very single meeting, who
were really dedicated to the project and sometimes it meant things were very
harmonious because everyone wanted to do something to help the preparation for
kindergarten, but every organization had their own agenda and they really wanted the
school readiness to fit into their agenda for what they wanted to accomplish at their
own organization.” Caroline felt there were outside influences at work as well. “I
think United Way [is] such a strong force in the community, and I think there were a
lot of provisions that were already made behind the scenes. So you were participating
in this process that was supposed to be democratic and everyone was supposed to
have a voice, but it seemed like there were decisions that had already been made.” In
particular she felt senior people in the Casey Foundation were exerting influence on
the group, noting that some funding decisions for certain groups were made during
the LAP process even though the decision wasn’t made by the LAP group. Caroline
also expressed a common sentiment about the power dynamics of the group itself. “I
think you had those sort of professionals that were in the role of ‘We do this for a
living and we know what we’re doing. And we’re pretty uncomfortable with
neighborhood people who don’t have the same kind of educational background that
we do.’ I think those voices are important, but I don’t think they were always honored
and heard. I think we had some very powerful people who kind of pushed the

137
process.”
Polk County only had one person mention positive aspects of the group’s
relationships. Like the others I interviewed, Barbara did not make any lasting
connections through the process. “[If] I run into those people now I try to say ‘hey
how are you’ if I remember them. But probably not much more than that.” Caroline
noted the lack trust in the group. “I think when you were talking earlier about factors
that made a difference, I think trust is a real big one. I think there was probably a lack
of trust on a lot of different levels that we were never able to break through. There
were parts of it, and alliances and trust between certain people and certain groups, but
there was always this cloud of distrust too.” No one from Polk cited group
commitment as a strength and members mentioned less commitment over time within
the group. Polk scored among the lowest of all cases with regards to these survey
variables as well.
This low commitment seemed to impact participants’ responses around
accountability. Barbara, “I never filled out those forms because they were too
cumbersome and I couldn’t add another thing to my plate. We always got these
sheets at the end of the day about what our actions were but you know, I was too
burned out to do it.” Rachel noted a mix of accountability, “There was variation. I
would say that probably half of the things you hoped to accomplish in the month
actually happened. You give yourself high goals, but then when you get back to your
office and you’ve missed two days of emails and phone calls and meetings and you
know you catch up on all of that, the time goes by very quickly and you know you

138
can’t actually get to all of that because your other work gets in the way in the
meantime.”
Overall all members interviewed in Polk were either negative or seemed to
have difficulty in recalling specifics. Caroline summarized it best when asked to
recall specific strategies and results. “Well you know, that’s the funny part [that I
can’t recall]. I’m thinking of all those meetings where we talked about early
childhood and we spent a lot of time talking about a summer program and how we
were going to do that… but I just don’t really remember being wowed. Like “wow
we came together and did this great thing and people in our community are better
off.”
Results from Process Analysis
Many common themes around collaborative process emerged among the six
collaboratives analyzed. When analyzing high, moderate, and low performing
groups, the following elements emerged as important to the process of successful
collaboration: the use of an accountability system, decision-making process,
relationship building, and facilitation.
Accountability System
High and moderate performing collaboratives all used a formal accountability
system with which to track commitments made by group members. While this formal
accountability system was introduced by the facilitators, all four of these
collaboratives used this system after the formal LAP sessions ended, demonstrating
its importance to the group. The two high performing collaboratives and one mid-

139
performing, DeKalb, reported a high level of accountability within the group, while
Indianapolis reported a moderate level.
The two low performing collaboratives did not make use of a formal
accountability system. Members did not see its value and found it to be something
imposed on them rather than a tool to use for effectiveness. These groups also
reported lower levels of commitment in the group and accountability. Overall
members resented the tools introduced by the facilitators and did not see their worth,
which seems to have lead to their resistance to using a formal accountability system.
Members reported in interviews and the survey a high level of commitment to the
group and the initiative early in the process; therefore, I would not equate this
resistance to the tool as due to low commitment.
Decision-making Process
A structured process of shared decision-making and consensus building was
mentioned repeatedly in the high and mid-performing collaboratives. All mentioned
that the groups have continued to use this as a mechanism for making decisions once
the formal LAP ended. This method was not mentioned in the low performing
collaboratives. Instead these members complained that LAP process was too time
consuming and involved too much talk and not enough action. Both groups in
interviews reported optimism and commitment at the start of LAP and enjoyed high
survey ratings around early relationships; therefore, it does not seem that their
resistance to a consensus model resulted from lower relationships.
Relationship Building

140
The two high performing collaboratives overwhelmingly discussed the strong
working relationships built in the group that crossed traditional boundaries. One mid-
performing group, DeKalb County, was also positive about relationships though not
as effusive as the high performing groups. A lack of members and lower membership
commitment was also an issue in DeKalb. Indianapolis, also a mid-performing
group, was more mixed, with half of the participants commenting positively on
relationships. The two high performing LAPs and one mid-performing LAP, DeKalb,
all discussed a high level of trust within the group despite issues of power and
conflict.
The low performing collaboratives rarely mentioned strong relationships;
instead, they discussed members having their own agenda. Members interviewed in
Polk did not have any lasting relationships. The majority of members in both groups
said there was a lack of trust among those in the collaborative.
Power and Conflict
All of the collaboratives experienced conflict, but the type and duration of that
conflict seems critical to the collaborative success. Both high performing
collaboratives were able to deal with conflict either through their decision-making
process or through facilitation. DeKalb County, a mid-performing group, had no
negative comments on conflict; members felt their facilitators and their use of data
helped manage any potential conflict.
Indianapolis, a mid-performing collaborative, had significant conflict about
membership that lasts to this day. Montgomery County, a low-performing LAP,
overwhelmingly discussed conflict in their group. They mentioned issues of power

141
and control and the inability of facilitators to manage the conflict. This was noted as
destructive to the group and something they struggled with during the majority of
LAP. Polk County noted issues of powerful influences both internally and externally.
Some felt decisions were being made outside the room. These dynamics led to a
debilitating lack of trust and motivation in the group.
Facilitation
Facilitation was a critical factor in the success of the LAP. Groups generally
felt strongly as to whether their facilitator was a help or hindrance to the process. The
success of a facilitator does not seem to be due to facilitator experience given each
LAP had a facilitator that had been in a prior LAP with different outcomes. For
example, Montgomery County, a low-performing LAP, had a facilitator that had
previously facilitated in Baltimore City, a high-performing LAP. Polk County,
another low-performing LAP, had a facilitator that had been a participant and leader
in Baltimore City as well as a facilitator in Anne Arundel, a high-performing LAP.
The other facilitator in Polk went on to facilitate in Indianapolis where he/she was
very successful. DeKalb County had the least experienced facilitators; however, they
received unanimous positive feedback about their skill and role in the process.
All of the high and mid-performing collaboratives found their facilitators
essential to the group success, citing them for managing conflict and power and
increasing overall group effectiveness. The two low performing groups were either
mixed or very negative toward facilitation. Montgomery County felt they were more
in the way of progress and were incapable of managing conflict in the room.
Additional Findings

142
The majority of my findings support the recommendations in the literature.
One variable that did not have as much effect as expected is that of the convener.
Survey results had a positive view of their role, but interviews did not show this
group playing a significant role in the collaborative. Instead, many members said
they were accountable to one another or the community. It does seem these groups
were important in bringing the collaborative together and lending legitimacy to the
effort; however, it also seems that collaboratives are able to hold themselves
accountable without the use of an external group to increase accountability.
While this analysis supported the recommendation of capacity building to
develop the ability to engage in joint decision-making, there was less support for the
development of general leadership skills. Participants interviewed were very mixed
as to whether this was a beneficial element or a hindrance. Overall this seems to
demonstrate that some skill building for advancing the process is necessary but other
more individualized skilled building is not. For example, exercises that assist group
development and conflict resolution, such as decision-making tools, accountability
and collaborative leadership skills, were ones the groups continued to use after the
formal LAPs ended. But exercises like taking personality assessments led many
participants to feel they were wasting time that could be spent on community
development.
Interestingly, this research shows little to no tension among the sectors.
Repeated interview and survey results showed conflicts that arose were not due to
sector differences but due to but more to personality clashes or specific ideas on how
the group should function. Not once in my interview discussions did people mention

143
conflict due to sector differences; instead, members disagreed when asked directly if
this was an issue. This was a surprising finding given the different cultures present in
public, nonprofit, and business organizations. It also runs counter to some research in
the field (Bryson, Crosby and Stone, 2006; Herranz, 2007).
Conclusion
When looking at collaboratives based on performance, the high performing
groups share several common factors, specifically the use of an accountability
system, decision-making process, relationship building, and facilitation. This type of
qualitative analysis makes it difficult to ascertain the specific relationships among
these factors; however, it seems the presence of power and conflict were influential as
to whether groups were able to have strong relationships and develop a shared
decision-making process. These factors all seem to be related to strong accountability
and the use of a formal accountability system. It is unclear in this analysis as to why
the low-performing groups did not adapt well to facilitation; however, one thing both
groups had in common was that they were part of a collaborative that included
members from previous groups. Members in both groups noted that facilitators did
not recognize previous efforts or specific issues related to their community. This is
one theory as to why facilitation may not have proved as effective in these groups.
My overall research findings are supported by a previous quantitative analysis
I conducted with Julia O’Brien (2012), which examined the collaborative process
across eight separate collaboratives, and used both semi-structured interviews and a
quantitative path analysis to determine the effect of process on results. These

144
analyses found that facilitators are important to group development as well as
individual development and both were related to results in the path analysis. In
addition, the path analysis showed that managing power and conflict is important to
relationship building, which in turn is in important to the decision-making process.
These are key elements in the process of collaboratives as they lead to participant
accountability, which in turn leads to results, or the establishment of strategies and an
improvement in the problem being addressed.
This research is one of the few in the literature to link elements of the
collaborative process to results. Previous literature discusses process in either a
theoretical way or based on individual case studies, but this approach allows me to
analyze processes based on multiple cases known to achieve results. Given the scarce
research on process in general these findings have significant implications for both
practitioners and scholars, as Chapter Six will discuss in detail.

145
Chapter 6: Lessons for Design and Evaluation of Collaboratives
My research questions ask: What is the relationship between design process
and effectiveness? Do certain elements of the design process, such as accountability
methods or strong relationships, make greater effectiveness more likely? I analyze
the process through which cross-sector collaboratives design and implement their
work, including how they organize themselves, build relationships, and become
accountable for outcomes and performance.
Overall collaboratives occur in a complex and challenging environment.
Given the difficult yet necessary tasks surrounding collaboratives, it is important to
understand how to measure and define their levels of effectiveness while identifying
the important components of the collaborative process that make the group most
successful. This research analyzes whether changes in my independent variable, the
collaborative design process, lead to changes in the dependent variable, collaborative
effectiveness. I define process as a series of actions or steps taken to achieve an end.
How do participants come together as a group and determine the best course of
action? How do they design and implement new programs and policies? How do
they make decisions and establish accountability? The process also involves the
relationship side of accountability. I define accountability as a relationship in which
participants and collaboratives are responsive to each other, external partners and the
community as a whole for the development process, outcomes and effectiveness of
that collaborative.
Yet processes and collaboratives are not useful unless they are deemed
effective. The literature contains multiple definitions of effectiveness (Turrini,

146
Cristofoli, Frosini, and Nasi, 2010; McGuire and Agranoff, 2011) with some
maintaining that effectiveness means different things to different groups (Provan,
Fish and Sydow, 2007). Increasingly scholars maintain that effectiveness be analyzed
at the community, collaborative and client/organizational level and include a focus on
increased perceived effectiveness or value at each level as well as the achievement of
stated goals (Turrini, Cristofoli, Frosini, and Nasi, 2010; McGuire and Agranoff,
2011; Agranoff, 2007; Provan and Milward, 2001). Given the nature of
collaboratives, the idea of effectiveness should be outcomes and results that could not
have been produced by just one member or agency alone (Turrini, Cristofoli, Frosini,
and Nasi, 2010, Agranoff, 2007). I define collaborative effectiveness as providing
value to collaborative participants, organizations and local communities in ways that
could not have been achieved through individual agencies alone.
The literature notes the scarce information on the process and work of
collaboratives. There is limited work with regard to the overall design process
broadly (Wohlstetter, Smith, Malloy; 2005); instead, studies often focus on internal
aspects such as building trust and leadership rather than the design of the work and
functioning of the group (Hays, Hays, DeVille, and Mulhall, 2000). Given the
expense of monetary and human resources, knowledge around the design and
implementation of collaboratives is essential. Collaborative work places unique
demands on participants, requiring special capacity and knowledge. Since the work is
influenced by the skills and attitudes of members as well as their ability to create and
implement programs and policies to address community issues, many groups seek
outside (and costly) technical assistance, such as with the cases in this research

147
(Foster-Fishman, Berkowitz, Lounsbury, Jacobson, and Allen, 2001). Additionally,
the question of effectiveness is one still discussed in the literature; therefore, there is
no agreed upon technique for evaluating effectiveness and groups struggle with
demonstrating impact.
In order to link process and effectiveness, I first develop an evaluative
framework in order to determine collaborative effectiveness. Then utilizing survey
and interview data, I am able to determine there is a relationship between design
process and effectiveness, specific elements are highlighted and explained below.
Overall, this research impacts the literature and the field in two ways: 1) Extending
and operationalizing a framework for collaborative evaluation; 2) Determining
critical elements within the collaborative process to increase effectiveness.
An Evaluation Framework
Collaboratives often resist traditional evaluation given their complexity and
the difficulty in linking the actions of collaboratives directly to community level
outcomes, yet much of the current research does not distinguish how best to delineate
and define the many actions of collaboratives (Zakocs and Edwards, 2006; Provan
and Milward, 2001; Agranoff and McGuire, 2001). Many scholars and practitioners
agree that collaborative effectiveness should be judged as to whether collaboratives
produce community-level outcomes; however, establishing a link between
collaborative action and community-level change is extremely difficult for several
reasons. First, these collaboratives occur in complex, turbulent environments where
efforts of sustainability and success are affected by outside factors (Bryson, Crosby

148
and Stone, 2006). Second, positive collaborative outcomes can go beyond that of
simply improving community-level numbers. Collaboratives can at times generate
public value while producing poor program outcomes (McGuire and Agranoff, 2011).
Third, collaboratives include multiple organizations with multiple constituents who
hold a variety of interests and needs, therefore arguing for a broader level of
assessment than simply community-level outcomes but outcomes important to the
different agencies involved. Finally, the most practical argument against solely using
community level data to evaluate collaboratives is the fact that these data are often
difficult to obtain. Even if data is available, finding funding for evaluations and
qualified staff is another hurdle facing collaborative groups.
My research analyzes multiple dimensions and multiple network levels by
adapting Provan and Milward’s (2001) framework. This framework evaluates
collaboratives at the community, network and organization/participation levels and
includes criteria and outcomes from various stakeholders. I develop variables that
reflect the Provan and Milward framework while also expanding the framework to
include an analysis of interventions based on their potential to affect community
outcomes. I use best practices informed by the literature to determine this potential.
My framework includes indicators related to the process by which the collaborative
sought to achieve outcomes, another important distinction not made in previous
research. These include variables such as accountability, resource generation and
membership commitment. I also analyze the strategies outlined in each collaborative
and compare actual outcomes with the overarching goal of each group. Finally, I
adapt Provan and Milward’s (2001) framework adjusted for a non-hierarchical,

149
voluntary community collaborative rather than large networks whose main focus is
service provision. My framework variables are outlined below.

150
Framework Variables Data Source Definition of Variable Community Level
Implementation of best practice community-wide initiatives
Survey and Interview
Survey questions asked whether the LAP group has or plans to implement community-wide initiatives and whether these initiatives will have a significant impact on the problem being addressed. Interviews generated a list of initiatives, and these initiatives are then compared to best practices in the literature in order to evaluate their potential for affecting community outcomes.
Implementation of new policy or legislative change
Survey and Interview
Survey questions asked whether the group was able to make changes or create new policies to better serve their community and whether those were local, state or national policy changes.
Changes in the incidence of the problem
Survey and Interview
Questions asked whether the work of LAP resulted in a positive change associated with the problem being addressed (i.e. recidivism or children entering school ready to learn) and had a strong potential to greatly impact the problem.
Collaborative Level
Membership commitment and growth
Survey and Interview
Questions asked about membership commitment in the early and later stages of the LAP. Questions around membership attrition and growth/membership post Casey funding were asked in the interviews.
Member Driven Accountability System
Survey and Interview
Questions asked whether the group employed strategies to ensure people were responsible for their work commitments, whether this responsibility was informal or formal, and whether driven by coach facilitators or members themselves. The survey measure looks at the percent of people that said the accountability was driven by members and the percent change of this perspective from early to later in the process.

151
Collaborative Self-Assessment and Outcomes
Survey and Interview
Questions asked whether the resulting plan from their LAP group addressed the needs, concerns, and values of the organization they represented as well as whether they were satisfied with the current outcomes(s) of the LAP process. Interviews inquired into the level of conflict the group experienced as they decided upon strategies and the individual’s overall evaluation of collaborative outcomes. The strategy impact variable includes strategies coded by impact or strength according to best practices in the literature.
Continued existence of collaborative and resource generation after first year
Survey and Interview
Survey variables include the percent of respondents who continued to meet after the last session, and the percent who meet regularly today. Interviews asked questions around the current group and its administration. Survey and interview questions asked whether their LAP group was able to generate new and/or additional funds to continue their work, information on the different types of resources and fundraising efforts conducted by the group as well as their overall level of difficulty in acquiring funds.
Organization/Participant Level
Individual self-assessment of personal skills and relationships
Survey and Interview
Survey questions asked whether the participant has gained new or improved skills; better working relationships with other individuals involved in this work; participated in new initiatives or activities (independent of LAP activities); has a better understanding of this issue and the population served; made contacts that are useful to them or their sector/organization. Interview questions asked about the leadership development component in LAP and whether participants had gained new skills personally.
Increased agency outcomes
Survey and Interview
Survey and interview questions asked whether the participant's involvement in LAP resulted in greater community legitimacy with clients and reputation with peers and funders and whether the participant's involvement in LAP resulted in participant's greater ability to obtain funds and acquire new resources for their individual agency.

152
Increased client outcomes for organization Survey
Questions asked whether the participant's involvement in LAP resulted in increased ease of client access to services and whether the participant's involvement in LAP resulted in higher number of services offered, quality of services and coordinating care with other agencies.
Using this framework, the collaboratives analyzed distinguish themselves in
high, moderate and low performing groups. It is noteworthy that the high performing
groups rank high at all three levels and the low performing groups rank relatively low
at all three levels. Analyzing each level provides clarity with regard to moderate
level performing groups as the outcomes of these groups are not as clear-cut and
direct.
The two high performing groups, Anne Arundel County and Baltimore City,
performed well at all three levels. Both groups implemented community-wide
projects that mirrored best practices in the literature while also seeing improvement in
county-level data related to child readiness scores. At the collaborative level both
groups showed strong levels of membership commitment, accountability and
continued to raise funds and attract members even after Casey funding was finished.
Both groups reported increased skills among individual members and increased
outcomes for organizations in the collaborative. The two moderate performing
groups, DeKalb County and Indianapolis, were less successful at implementing
county level programs that mirrored best practices. Their strategies, when compared
to the literature, were not as robust as the high performing groups. Indianapolis
showed a decrease in membership commitment over time. The two lowest groups,
Polk and Montgomery, performed poorly at almost all levels. These groups were

153
unable to create community-wide in initiatives and experienced high attrition of
members over time. The groups were not able to secure funding after the completion
of the Casey grant and overall accountability and self-assessment were low.
This research is a clear answer to the question of whether collaboratives can
produce meaningful change. The framework highlights high performing groups that
collected tens of thousands of books, increased pre-k programs for children, added
substantial and meaningful programs and organizations to their communities, and
became true partners working toward the same goal. Anne Arundel experienced a
17% rise in test scores. They have collected 15,000 – 20,000 books to distribute
through various service agencies. Every baby born in a county hospital is sent home
with a book and information on early childhood education. They were instrumental
in getting the county a Judy Center, which promotes partnerships between local
school systems, local agencies, and community-based organizations for the purpose
of improving young children’s school readiness. Baltimore City has seen test scores
rise by 55%. The group was able to garner resources though grant support that
allowed for programs to increase early language acquisition. Members created an
estimated 8,000 – 10,000 literacy kits over a five-year period that they then
distributed to home visiting organizations as well as child care organizations. They
created a Countdown to Kindergarten initiative and worked to significantly increase
Pre-K slots in the city.
Looking at the collaborative and organization/participation adds a richer story
to the many different outcomes possible with community collaborations. By
analyzing the individual and organizational levels we see that group members in these

154
collaboratives developed personal leadership skills and changed the culture and
direction of individual agencies. Anne Arundel described the relationships formed
through the collaborative as a significant outcome of the initiative. It mentions the
school system coming to the table for the first time as true partners. Their group has
now become the county’s official Race to the Top team, an indication of the
important role they play in the county. DeKalb County has been extremely successful
at garnering resources after the Casey grant ended. Members in Indianapolis herald a
new culture of data generation and use because of LAP. They also note an increased
ability to work collectively and break down silos as well as increased personal
leadership skills. Baltimore City members noted that agencies started to do their
work differently, saying that they began to see LAP tools such as results based
accountability come up in other meetings outside of the collaborative. Often the story
and purpose of collaboratives is to affect community change, but this research
demonstrates outcomes in the community as well as with individuals and
participating agencies.
The framework variables presented are straightforward and easily replicated
by other institutions seeking to evaluate their collaborative, providing value to the
planning and implementation of groups directing and participating in community
collaboratives. Collaboratives and the organizations within them are consistently
being asked to demonstrate effectiveness (Sowa, 2009); however, this is difficult
given they occur in multi-dimisional environments where various organizations and
efforts are going on at the same time. Quantitative analysis is costly, time-consuming
and difficult to demonstrate a clear link between the work of the collaborative and

155
community-level quantitative outcome. The evaluative approach outlined here using
qualitative data to understand dimisions at the community, collaborative and
organizational level is one useful to practitioners and funders in the field. The use of
the evaluative framework proposed here will capture success seen at the collaborative
and individual/agency level rather than just the community value. This provides a
richer picture of collaborative groups. The work of collaborating is arduous and
involves costs, and this richer story of outcomes can provide a motivating factor for
more communities to develop and implement a collaborative. This is a significant
finding highlighting the potential for these groups. It is clear given the struggles of
some of the other agencies that collaboration is not easy and not always successful,
but it is possible.
Overall this research contributes to collaborative scholarship by providing an
empirically grounded, theoretically based framework evaluating collaborative
performance useful for both future scholars and practitioners. It expands existing
theory and operationalizes Provan and Milward’s framework. This work offers a step
toward a more robust framework to evaluate all collaboratives broadly at various
levels of analysis. Despite decades of research on collaboratives, evaluative
frameworks analyzing these groups are scarce (Herranz, 2009; Provan, Fish and
Sydow, 2007; Turrini, Cristofoli, Frosini, and Nasi, 2010; McGuire and Agranoff,
2011). This research contributes to scholarship by advancing an existing framework
to include more variables related to effectiveness and allow for greater applicability to
a variety of collaborative forms, including previously neglected informal, non-
hierarchal groups such as the ones analyzed here. The findings in this analysis

156
illustrate the framework’s usability and potential. Additionally, this work builds out
indicators at the network level, something scarce in the literature (Provan, Fish and
Sydow, 2007; Turrini, Cristofoli, Frosini, and Nasi, 2010). In fact, Turrini, Cristofoli,
Frosini, and Nasi (2010) noted in their recent literature review little attention has been
paid to the issue of overall network effectiveness and its determinants and that
identifying an indicator of effectiveness at a network level might lead to a major
advance in network effectiveness theory.
Process Elements for Effectiveness
The second major impact of this research is the contribution to knowledge concerning
essential elements of process within a collaborative. McGuire and Agranoff (2011)
note that not enough is known about how networks overcome inertia and deliver
results, or how they can become more effective at their roles. Bryson, Crosby and
Stone (2006) conduct the most comprehensive review of process where they create a
series of propositions based on a thorough literature review. This research affirms
some of these propositions and challenges others. Based on their analysis as well as
my own literature review, I include the following elements in my analysis of
collaborative process:
• External Factors o Competitive pressures o Existing Relationships or Networks o The establishment of an external partner(s) in which the collaborative
feels accountable for performance o Strength of implementation team (facilitator, support staff, etc.)
• Internal Factors
o Development of group leadership skills and forging agreements o Strong working relationships among collaborating participants and
agencies

157
o The establishment of group norms around trust and open dialog o Management of power imbalances and conflict within group o Member commitment to collaborative o Group accountability and establishment and successful use of an
internal accountability system for performance
Of these, I found when analyzing high, moderate, and low performing groups, the
following elements emerged as the most important to the process of successful
collaboration: the use of an accountability system, decision-making process,
relationship building, and facilitation.
Accountability System
While there is much literature devoted to the issue of accountability within
collaboratives, only a few researchers discuss specific methods for dealing with the
issue of personal accountability and its relationship to effectiveness. Bryson, Crosby
and Stone (2006) propose, “collaborations are more likely to be successfully when
they have an accountability system that tracks inputs, processes and outcomes.” Page
(2004) also mentions the importance of a tracking system related to results.
My research shows that high and moderate performing collaboratives all used
a formal accountability system with which to track commitments made by group
members. These groups created specific tracking tools to promote a shared
commitment for completing work related to strategies. At the end of each session,
members were given a commitment form on which they wrote a task or tasks that
they planned to complete before the next session, how each task is related to a
specific strategy, how they plan to complete it, and an estimated date for completion.
All the commitments documented on the form were then entered into session notes
that all group members could access. Members could also make a work commitment

158
in a more informal way during group discussions or strategy meetings. These
commitments, along with details on how they planned to complete them and if they
planned to complete them with partners, were also documented in the session notes
that were easily accessible to the individual and other LAP members. Finally, at each
session members reported their progress on the commitments made at the previous
sessions. All progress was then documented in the notes. High and moderate
performing groups valued this tool as a part of their success and reported a high level
of accountability among members. The low performing collaboratives did not make
use of this or any other formal accountability system and reported lower levels of
commitment in the group and accountability.
This is a tangible and important finding for collaborative implementation.
Often voluntary cross-sector collaboratives are hesitant to have conversations about
accountability because they are in a group made of peers and not subordinates. Yet
this research demonstrates that these groups should not only discuss accountability
but also create a system in which they hold one another accountable. This research
indicates that groups must create accountability not just to the community or external
partner, but to each other. Members recorded and reported on their actions in notes
and in meetings; in other words, to their peers. This transparent commitment made
members more likely to follow though with their actions, subsequently members got
more done. Given the nature of collaboratives as non-hierarchical entities,
understanding how to successfully generate peer accountability and realizing the
importance of it in a critical finding. This is a tangible tool that can be used by
collaboratives of all types and area of focus.

159
Decision-making Process
A structured process of shared decision-making and consensus building is an
important tool used in the high and mid-performing collaboratives. The consensus
decision-making tool requires all members to agree to a proposal made in the group
before moving on. Members in these groups have continued to use this as a
mechanism for making decisions once the formal LAP ended. This method was not
mentioned in the low performing collaboratives. Instead these members complained
that the LAP process was too time-consuming and involved too much talk and not
enough action.
Most of the literature mentions decision-making broadly, noting how groups
make decisions will affect their process. Crosby, Bryson and Stone (2006) simply
propose that “Formal and informal governing mechanisms are likely to influence
collaboration effectiveness (p. 49).” McGuire and Agranoff (2011) discuss the issue
of “overprocessing” as an operational limitation with networks, citing the balance
between process versus action with regard to network momentum. They discuss the
need for effective decision-making to combat this issue. This research argues for a
specific type and method of decision-making as it relates to collaborative success.
Each high and mid-performing group used a consensus decision-making tool in which
members indicated their agreement by a thumbs-up or thumbs-down. Those with a
thumbs-down were brought into the process and the group deliberated until each
member had a thumbs-up. Facilitators focused on encouraging members to make
proposals and practice interest based negotiation in order to build consensus. As
noted in a previous LAP evaluation, “This technique kept ideas on the table without

160
stopping the work of the group. It prevented circular talk and helped leaders hold
each other and themselves accountable for thinking critically, finding solutions, and
being willing to move forward on a shared agenda. When it worked, it created a
tangible example of public buy-in and acknowledged the essentially political nature
of collaboration. (CITE)”
While members of the high and mid-performing groups often found this
frustrating, members of each group repeatedly mentioned it as important to their
success since it allowed for all members to buy into an initiative and collaborate on a
strategy. This is another specific recommendation that can be implemented during
the design process of a collaborative.
Relationship Building
Members of the two high performing collaboratives overwhelmingly
discussed the strong working relationships and a high level of trust that crossed
traditional boundaries. The low performing collaborative members rarely mentioned
strong relationships; instead, they discussed members a lack of trust. Trust and strong
working relationships are cited frequently in the literature, and this research supports
the importance of both elements within a collaborative. Crosby, Bryson and Stone
(2006) propose, “Cross-sector collaborations are more likely to succeed when trust-
building activities (such as nurturing cross-sectoral and cross-cultural understanding)
are continuous (p. 48).” LAPs took time out of their work to engage in a variety of
relationship building activities to build trust and encourage work between agencies
and sectors. A lack of members and lower membership commitment was one reason
that kept one of the mid-performing LAPs from becoming a high performing LAP.

161
While some interviewed saw this as time away from valuable work, it is clear that
those groups that had the highest indicators of relationships were the most successful.
Collaboratives in the field should take into account activities that both track and
develop relationships in order to be most successful.
Power and Conflict
All of the collaboratives experienced conflict, but the type and duration of that
conflict was critical to collaborative success. Both high performing collaboratives
were able to deal with conflict either through their decision-making process or
through facilitation. The presence of long-term conflict was a significant barrier to
the Indianapolis LAP, keeping it from becoming a high-performing group. Low
performing groups repeatedly mentioned the issue of power and conflict and its
destructive influence on the group.
Like trust, power and conflict are mentioned frequently in the literature, yet
there is little written on how to deal with power and conflict. McGuire and Agranoff
(2011) note power asymmetries as one of the main operational limitations to
networks. Bryson, Crosby and Stone propose, “because conflict is common in
partnerships, cross-sector collaborations are more likely to succeed when partners use
resources and tactics to equalize power and manage conflict effectively (p. 48).” My
research shows that the high performing LAPs all used the same tactic to manage and
equalize power, namely facilitation.
Facilitation
Facilitation was a critical factor in the success of the LAP. All of the high and
mid-performing collaboratives found their facilitators essential to the group success,

162
citing them for managing conflict and power and increasing overall group
effectiveness. Facilitators also kept groups on task, used tools to help them create
strategies and working goals, and helped increase urgency and momentum. The two
low performing groups were either mixed in their opinion toward facilitation or very
negative toward facilitation.
The influence or recommendation of the use of facilitation is hardly found in
the literature. With LAP, having a trained facilitator who was external to the group
proved the most commonly cited reason for effectiveness. All of the findings above
relate to the work of the facilitator. Facilitators helped group members manage
conflict, mitigate power, have difficult conversations, create strategies, design and
implement an accountability system, use consensus decision-making, develop trust
and relationships, and more. Hiring facilitators is very costly for a group; therefore, it
is something many groups dismiss. One member of a mid-performing LAP noted that
after the Casey grant ended they tried working without facilitation, but realized
quickly it was essential. They then spent money from a very tight budget to hire a
facilitator for the group. Findings from this research indicate that groups should
strongly consider a trained, neutral facilitator in order to increase their effectiveness.
This research indicates that facilitation is a critical component as it affects all the
other process elements necessary for group effectiveness.
Additional Findings
Several of my findings do not support recommendations in the literature. The
most surprising is the lack of support in the research on the effect of the convener, or

163
accountability partner. This outside authority is meant to legitimize the group and
provide additional accountability.
Accountability partners are cross-sector groups of high-level leaders from the
public, nonprofit and private sectors. These partners identify the specific issue to be
addressed by the collaborative, data indicators, and financial and logistical resources
to support the collaborative. They also invite individuals to join the collaborative and
provide motivation and accountability as the group progresses. These groups are not
meant to be involved in the work as the collaborative remains independent from the
accountability partners as it develops strategies to address the social issue and
implements community-wide initiatives related to those strategies.
Survey results had a positive view of accountability partners, but interviews
did not show this group playing a significant role in the collaborative. Instead, many
members said they were accountable to one another or the community rather than an
external convener. It does seem these groups were important in bringing the
collaborative together and lending legitimacy to the effort; however, it also seems that
collaboratives are able to hold themselves accountable without the use of an external
group to increase accountability. This research indicates that peer accountability was
critical to increasing collaborative effectiveness. This runs directly counter to
literature arguing that convening organizations are essential to group accountability
(Bryson, et al., 2006; Page, 2008; Wohlstetter and Malloy, 2005; Human and Provan,
2000).
Secondly, while this analysis supports the recommendation of capacity
building to develop the ability to engage in joint decision-making, there was less
164
evidence with regard to the development of general leadership skills. Participants
interviewed were very mixed as to whether this was a beneficial element or a
hindrance. Overall demonstrates that some skill building for advancing the process is
necessary but other more individualized skill building is not. For example, exercises
that assist group development and conflict resolution, such as decision-making tools,
accountability and collaborative leadership skills, were ones the groups continued to
use after the formal LAPs ended. But exercises like taking personality assessments
led many participants to feel they were wasting time that could be spent on
community development.
Third, this research shows little to no tension among the sectors. Repeated
interview and survey results show conflicts that arose were not due to sector
differences but due more to personality clashes or specific ideas on how the group
should function. Not once in my interview discussions was there mention of conflict
due to sector differences; instead, members disagreed when asked directly if this was
an issue. This was a surprising finding given the different cultures present in public,
nonprofit, and business organizations. It also runs counter to research in the field
(Acar, Guo and Yang, 2008; Babiak and Thibault, 2009). Bryson, Crosby and Stone
maintain that competing institutional logics are likely within cross-sector
collaborations and may significantly influence the extent to which collaborations can
agree on essential elements of process, structure, governance, and desired outcomes.
My research does not support this assertion.
Finally, there seems to be no connection between the status of relationships or
networks prior to the start of LAP and collaborative effectiveness. Some of the cases

165
analyzed had strong relationships before the collaborative came together and some
did not. All groups mentioned the presence of prior relations that hindered initial
collaboration, with Baltimore City being the most significant and DeKalb being the
least. Yet the high performing groups were able to move past these issues to become
successful. Overall this research indicates that despite conditions in the community
that may hinder collaboration, such as poor relationships among agencies, cross-
sector differences, and the lack of a strong convener, collaboratives can utilize the
design elements above to overcome these challenges and become effective.
Implications for Practitioners
This work has several implications for practitioners in the field with regard to
collaborative design and implementation. When designing a collaborative, leaders
should consider the following:
• External partners: This research suggests external partners are important for
convening members and providing legitimacy to the work. These partners can
also be critical later in the process once groups have developed policy
proposals as they can assist in the implementation of the work. Good external
partners act as champions for the group, easing the way when they encounter
bumps in the road.
• Member selection: In order to be successful at using the tools mentioned
here, such as facilitation and an accountability system, members must be open
to working with one another, often in a different way than in the past since
previous efforts have been unsuccessful. Good facilitation will push members

166
to look beyond traditional solutions and approaches while trying to mitigate
conflict and power imbalances. If members are too committed to the previous
way of working or unwilling to work collaboratively, the group will suffer
conflict and progress will be impeded.
• Member capacity and commitment: Previous work and individual
leadership capacity should influence the design of the collaborative. This
should be taken into account when selecting a facilitator in order to match his
or her skills with the needs of the group. Attention to member commitment
and group development is also critical to the process.
• Infrastructure: Collaboratives should strongly consider the use of a
facilitator to help manage conflict, address power imbalances and assist with
group momentum. They should also consider the resources and tools
available to manage group logistics. Tasks such as scheduling and note-taking
are time consuming but critical; therefore, agreements should be made
beforehand with regard to these responsibilities.
• Accountability and Decision-Making: Once a group has been launched,
early conversations should focus on how best to track and encourage
accountability and how groups will make decisions. This will improve
efficiency and reduce conflict.
• Evaluation: Early in the process groups should consider how they will
evaluate their work, rather than waiting until after the work has occurred.
Creating an evaluation system, setting performance targets, identifying data,
etc. will allow the group to create more impactful strategies and show

167
progress at an early stage of the work. This keeps moral high and momentum
going while also providing legitimacy for the work and perhaps additional
funding opportunities. Groups should consider both quantitative and
qualitative methods of evaluation, starting with the framework I present here.
Implications for Research
This research demonstrates several implications for the field of networks and
collaboratives and points to areas for further research.
Performance Framework: I’ve presented a grounded and expanded evaluative tool
with regard to collaborative performance at various levels. Further research should
utilize this framework to deepen the literature on its usefulness.
• Process Elements: Further research should be conducted with regard to the
elements found in this analysis, namely: the use of an accountability system,
decision-making process, relationship building, and facilitation. Additional
work should look at different models and level of impact of each of these
elements while also furthering our knowledge of collaborative process
generally.
• Facilitation: My analysis highlighted facilitation as particularly important to
the collaborative process, a recommendation often not found in the literature.
Further research should expand on these findings and understand the role of a
facilitator and the important qualities and conditions necessary for effective
facilitation.

168
Conclusion
This research demonstrates a clear relationship between design process and
effectiveness, with certain elements making positive results more likely. I’ve
introduced an important evaluative tool that allows collaboratives to understand their
performance at various levels and share their success and shortcomings in a rich,
straightforward, and cost effective manner. This research allows for measurement on
multiple dimensions and levels, lending information on the relevance and impact of
collaborative groups. Further research should investigate this framework to deepen
the literature on its usefulness.
Most importantly, this research shows specific elements essential to the
collaborative process: the use of an accountability system, decision-making process,
relationship building, and facilitation. Practitioners should strongly consider these
elements when designing and budgeting for collaborative efforts. Further research
should look at different models and level of impact of each of these elements while
also furthering our knowledge of collaborative process generally.
Bryson et al (2006) note that very few research studies have gathered data in a
way to guide research around collaboratives or help policy makers in government,
business, nonprofits or communities understand how to design and implement them.
The data in this analysis includes all sectors usually involved in a collaborative,
versus those studies written from the government perspective, and includes groups
that are voluntary and non-hierarchical versus more formal, contracted groups.
Overall this research fills a void and makes a significant contribution to the literature
and practice of collaborative networks, potentially impacting how future cross-sector

169
collaboratives work together to produce public value and address major public
problems.

170
Appendices
Appendix A:
AN ACTION AGENDA FOR MARYLAND
To achieve real improvements in the school readiness of our youngest children requires a plan that: (1) coordinates the patchwork of existing quality efforts and builds upon them; (2) is based on best and proven practices, such as those described above; (3) recognizes and addresses the fundamental root causes that contribute to the current ill-preparation of many of our children, as noted earlier in this report; and (4) is ambitious in its scope, while still realistic in its expectations.
The members of the Leadership in Action Program have spent the past several months developing such a plan. To reach our target of 75% of kindergartners assessed as fully ready in the 2006-07 school year, the members of the LAP propose the implementation of a 5-Year Action Agenda that focuses on achieving 6 goals, through the implementation of 25 strategies:
1) All children, birth through age 5, will have access to quality early care
and education programs that meet the needs of families, including full day options. Strategies include immediately targeting at-risk 4 year-olds for entry into a quality early care and education program, building a more coordinated and expansive system of early care and education to serve more families, and providing needed incentives to attract and retain quality staff in early care and education programs.
2) Parents of young children will succeed in their role as their child’s first teacher. Strategies focus on giving parents information, support and training about school readiness and tools they can use to implement school readiness activities with their child in the home, expanding parent-to-parent support opportunities, and empowering parents to better advocate for their children and participate as partners in program and policy development.
3) Children, birth through age 5, and their families, will receive necessary
income support benefits and health and mental health care to ensure they arrive at school with healthy minds and bodies. Strategies focus on improving access to the range of health and mental health services and income support programs needed by pregnant women and families with young children, with a particular focus on addressing substance abuse and childhood lead poisoning – two devastating problems with widespread implications for school readiness.

171
4) All early care and education staff will be appropriately trained in promoting and understanding school readiness. Strategies include implementing a range of initiatives aimed at enhancing the school readiness skills of early care and education providers, and increasing the number of degreed professionals working in the field.
5) All Maryland citizens will understand the value of quality early care
and education as the means to achieve school readiness. Strategies focus on implementing a widespread public engagement campaign to improve the understanding of the importance of school readiness.
6) Maryland will have an infrastructure that promotes, sufficiently funds,
and holds accountable its school readiness efforts. Strategies focus on institutionalizing policymaking, funding and accountability to support Maryland’s Action Agenda to achieve improvements in school readiness.

172
Appendix B: Strategy Coding Coding for LAP Strategies and Goals Based on Evidence-Based Assumptions Behind School Readiness For the purpose of this research, a strategy is defined as the following: A strategy is a coherent set of actions to improve results. It is a clear, concise statement of what works to do better, to make a measurable difference. Strategies represent an overarching approach that has the power to reach a stated goal/result. Strategies are the means, method or “the how.” Each strategy will have a set of actions that must be taken to fully implement the strategy. For each LAP strategy/goal, use the following scoring method:
1. Read strategy carefully. 2. Go into notes to find more details about the strategy and what actions were
taken related to the strategy. There may be information in the notes that seems related to a strategy but that isn’t specifically stated as related to the strategy. For example, if the strategy is ‘Transition to kindergarten’ and then in another part of the notes you see someone discussing working on providing rosters to teachers the summer before kindergarten, but it’s not specified that that is related to the strategy, you can consider that it is. So, if there is something in the notes that appears to be related to the strategy but isn’t specified that it’s related, consider it as related.
3. Look for relation to specific methods. Use the broad strategy as it’s discussed in the notes, and any other actions that seem to have been important and broad and also related to the stated strategy. Count number of specific methods that are related to the strategy (regardless of categories).
a. If there is an explicit relationship to any of the methods, the strategy is coded as Direct and receives a ‘2’.
i. Do not count a method if it seems like it could be related, but you’re not sure, or if the relationship to the method is indirect in any way.
ii. The strategy may be related to a specific method that seems like it wouldn’t actually have a large impact. But, try not to let your personal judgment influence your coding. If there is a relationship to a method, whatever the method is, it counts. Try not to be influenced by the impact of an individual method or strategy.
iii. To have a specific relationship to a method, it should be very clear how the strategy directly impacts the result. If you cannot say how the strategy directly impacts the result, then it probably isn’t specifically related to a method.
b. If there is no explicit relationship to any of the methods then the strategy is indirect and receives a ‘1’.

173
i. The strategy may be directly related to a Category (ex: Parental education), but isn’t related to any specific methods within the category. If that is the case then it is still only indirect. There MUST be a specific relationship to a method for the strategy to be direct.
c. If it’s related to neither, then it’s nothing and receives a ‘0’. To determine if strategy is directly related to an evidence-based strategy, use the chart below.

174
Early Childhood Readiness Best Practices from the Literature Evidence- Based Strategy
Method
Child Physical Health Improve access to immunizations Promote regular well-child visits and/or developmental screening
and assessments Provide support for children with special needs. For example:
pediatric monitoring, home visits, taking child to development centers and support group meetings for parents
Reduce risks of low birth weight and infant mortality Promote good prenatal care – especially for 1st time moms and
low-income moms Promote home-visits from RNs to address prenatal care, maternal
life-course management, healthy home environment, etc. Promoting parental education (ex. My Baby U videos on infant
care and health-related issues) Promoting good nutrition (ex. Breastfeeding, No solids before 4
months, no cow’s milk) Improving access to WIC Reducing child injuries (ex: providing car seats, smoke detectors) Reducing lead poisoning risk Improving dental health (ex: oral health screening, access to dental
care) Improving services for mentally or physically disabled children Child Mental Health Develop and support services that recognize/address/treat infant
and toddler mental health problems Develop and support services that recognize/address/treat child
abuse and/or neglect Implement programs to help parents and caregivers teach children
to regulate, express, and recognize emotions in self and others Implement programs to promote healthy relationships between
children and non-parental caregivers including secure and attached relationships between parent and child
Implement programs to promote social stimulation (ex. Relationships with peers, caregivers, learning social norms, etc.)
Parental Ability (non-education related)
Implement programs to address and improve parents’ psychological health
Implement programs to promote positive parenting attitudes and promote healthy parent-child relationship (cuddling, playing, hugging), encourage them to be nurturing and help them understand the importance of the parent-child relationship
Provide maternal support through improved social networks Provide maternal support through job training and/or education Improve specific parenting skills (ex: promoting routines, talking
to children, giving chores, discipline etc) Family/Parent Demographic Characteristics
Address parental and caregiver unemployment Address substance abuse in parents and caregivers Provide support to foster care and adoptive parents Improve family/parent experiences with criminal justice system Provide education and support around domestic violence Provide support for non-married families (single parents,
cohabiting parents) Provide support and language skills for parents with limited
English proficiency

175
Reducing Recidivism Best Practices from the Literature Evidence- Based Strategy
Method
Employment Provide employment-related training while still in prison Provide work release job programs in prison Address transportation issues related to employment Provide case-managed placement programs which allow for
frequent contact with case managers Allow for post-prison job training programs that not only
improve individuals’ job skills but also to improve job readiness, provide case management for other services, place former prisoners in jobs, and continue to work with them for a follow-up period.
Provide programs that focus on assistance finding legitimate, full-time and consistent employment
Create/utilize programs to work with employers to change their perspective on hiring ex-offenders.
Create or build on neighborhood-based networks of workforce development partners and local businesses that will target the preparation and employment of parolees.
Health Implement programs to identify and treat mental disorders
while in prison Implement programs to identify and treat physical disorders
while in prison Assist ex-offenders in finding access to comprehensive health
care Implement programs to begin identifying access to health
care and services prior to being released Provide programs that allow ex-offenders the ability to
continue the care needed upon release, including discharge planning and preparation for addressing health care needs upon release
Ensure the availability of treatment centers in the community for ex-offenders
Work with community agencies to ensure the successful reintegration of ex-prisoners with mental disorders
Work with community agencies to ensure the successful reintegration of ex-prisoners with physical disorders
Housing Provide access to affordable, stable housing options that will
aid the transition back to the community Provide support for family members/partners providing

176
Reducing Recidivism Best Practices from the Literature Evidence- Based Strategy
Method
housing to former inmates Provide special access for persons with mental illness Work with community agencies to ensure the successful
reintegration of ex-prisoners into community related to safe, affordable and stable
Help ex-offenders plan for and deal with the first 24-48 hours (where to go immediately after leaving prison, where to eat, sleep, etc).
Provide case-managed placement programs which allow for frequent contact with case managers
Substance Abuse Provide drug treatment programs while in prison Provide cognitive behavioral therapy programs and/or
therapeutic communities while in prison Provide drug treatment programs upon release Provide cognitive behavioral therapy programs and/or
therapeutic communities upon release Ensure the availability of treatment centers in the community
for ex-offenders Work with community agencies to ensure the successful
reintegration of ex-prisoners with substance abuse problems Provide programs that tailor to an individual’s need and level
of risk, are integrated across all stages of the justice system, and linked to drug treatment aftercare in the community
Provide case-managed placement programs which allow for frequent contact with case managers
Family and Community Issues
Allow for community contact during prison sentence, for example allow them to get driver’s licenses while still in prison.
Facilitate community contact upon release and engage local organizations in assisting ex-offenders. Assist ex-offenders in finding community resources
Allow for families and community organizations to maintain and establish connections while in prison.
Work with community agencies to ensure programs in place during prison continue upon release; community agencies should be notified and kept up to date on prisoner release information
Develop coalitions of resident leaders who will oversee the reentry efforts and provide accountability for community and offender obligations.

177
Reducing Recidivism Best Practices from the Literature Evidence- Based Strategy
Method
Provide programs that address changes in motivation and lifestyle away from criminal activity to positive engagement in the community
Engage local community-based organizations that can learn how to help family members support the parolee
Provide parolees opportunities to participate in community service and demonstrate that they can be community assets rather than simply neighborhood liabilities.
General recommendations
Provide programs that create a personalized plan to assess the risks of recidivism tailored for that individual
Provide programs that prioritize supervision and treatment resources for higher risk offenders.
Provide programs that allow for targeted interventions to individual needs.
Be responsive to temperament, learning style, motivation, culture, and gender when assigning programs.
Structure 40–70 percent of high-risk offenders’ time for 3–9 months.
Provide programs that increase ways for positive reinforcement
Offer peer mentorship programs. Program or strategy measures relevant processes/practices. Program or strategy provides measurement feedback. Programs that help offenders prepare forms for identification Increase quality of case management/parole officers. Address increasing parole violation rates using locally based
strategies

178
Appendix C: Participant Interview Questions Participant Background Questions:
- What was your role when you joined LAP (what sector?)? How was it that you came to join?
- Which session did you join? - What was your initial outlook on joining – hopeful, positive, skeptical? Did
you feel this was something different or something you and/or your community had tried before?
External Factors Concerning Process
- Can you describe the problem within your community (i.e. early childhood or recidivism)? What was the working environment like for you and other members – meaning the political environment, capacity to address the problem, anything else external that affected the work.
o What were members’ initial working relationships like, did you know each other from the start? Were there past tensions and turf battles? What was the level of competition with one another for resources?
- Were you aware of an accountability partner? How would you describe the
group’s relationship with the accountability partners? Did it help or hinder the process? Did the group feel responsible to the accountability partners?
o What is your assessment of the accountability partners themselves… did they embrace their role and use it effectively? Did they provide adequate resources and support?
- What is your impression of the LAP Implementation team, meaning the
facilitators and support staff? Were they neutral? Did they improve your overall effectiveness?
o How would you describe the process in terms of rigidity? o Was it top down or bottom up?
o What influence did Casey have on the process?
- Am I missing anything from the external factors… Internal Factors Concerning Process
- Was there initial group agreement around the urgency of the problem? Around the approach to the problem? Did you share similar philosophies around the work?
- How would you describe the process by which you formed work groups and generate strategies? Was the group open to establishing clear goals and strategies? How well did you use data to support your decisions?

179
- How would you describe your commitment to the problem over time? To the
LAP process? To building their leadership capacity? To the work?
- How well did the group deal with conflict? Did they consider all points of view or were there dominate members driving decision making? How did the group manage power imbalances within the group?
- Did you see any conflict among members of different sectors? Did one sector
dominate over others? Did the group attempt to ensure the members were diverse and representative of the community and the problem?
- What level of trust existed in the group? Would you say you saw each other as
partners or competitors? Did this change over time?
- How strong were the relationships as the LAP progressed? How willing were participants to share information and feedback with one another? Did they focus on shared goals or individual agendas?
- How was the support from the members’ home agencies? Did you have a
sense as to whether the right people were in the room? Were the members and their home agencies willing to dedicate the appropriate amount of resources necessary for success? (e.g., staff, time, funding, supplies)
- What was the level of peer accountability? How motivated were participants to complete their commitments? Did they embrace the accountability system introduced? Was the system they adopted more formal or informal? By the end of LAP was it working, and if so, was it driven by the CFs or the members themselves? What is your overall assessment of the accountability system used in the LAP?
- What tools were the most powerful? What stuck?
- In terms of the members that left the LAP, do you have a sense of why they
left the group? In other words, was there a common frustration among this group or was it more individual reasons?
Results
- Was the group able to establish concrete performance measures and strategies? What is your overall assessment of these strategies? Meaning their strength and potential to turn the curve.
- What is your assessment on the progress around these strategies? Member commitment to the strategies?

180
- How effective was the group at leveraging external resources and support? Did they acquire new resources to support their work?
- What happened to your group once the facilitators/implementation team left?
Did you and/or the group continue to meet? How effective were those meetings?
- What is your sense of the overall results generated from the LAP? Did you see any progress toward:
o Implementation of community wide initiatives? o Service integration among the agencies? o Decrease in cost to the community? o Changes in the incidence of the problem? o Changes in perception by the community?
- What changes did you experience as a participant? Additional leadership
qualities?
- What changes did your organization experience due to LAP: ! Enhanced legitimacy? ! Enhanced resources for agency? ! Implementation of new strategies due to LAP? ! Increase in client outcomes and service access?
- Did you turn a curve? If not, why or why not? Will the group turn a curve?
- Do you have any additional feedback you wish the research team to know
about your experience?
- Who else should I talk to in order to understand the group’s process and results? I’m interested in talking to a variety of perspectives, positive and negative.
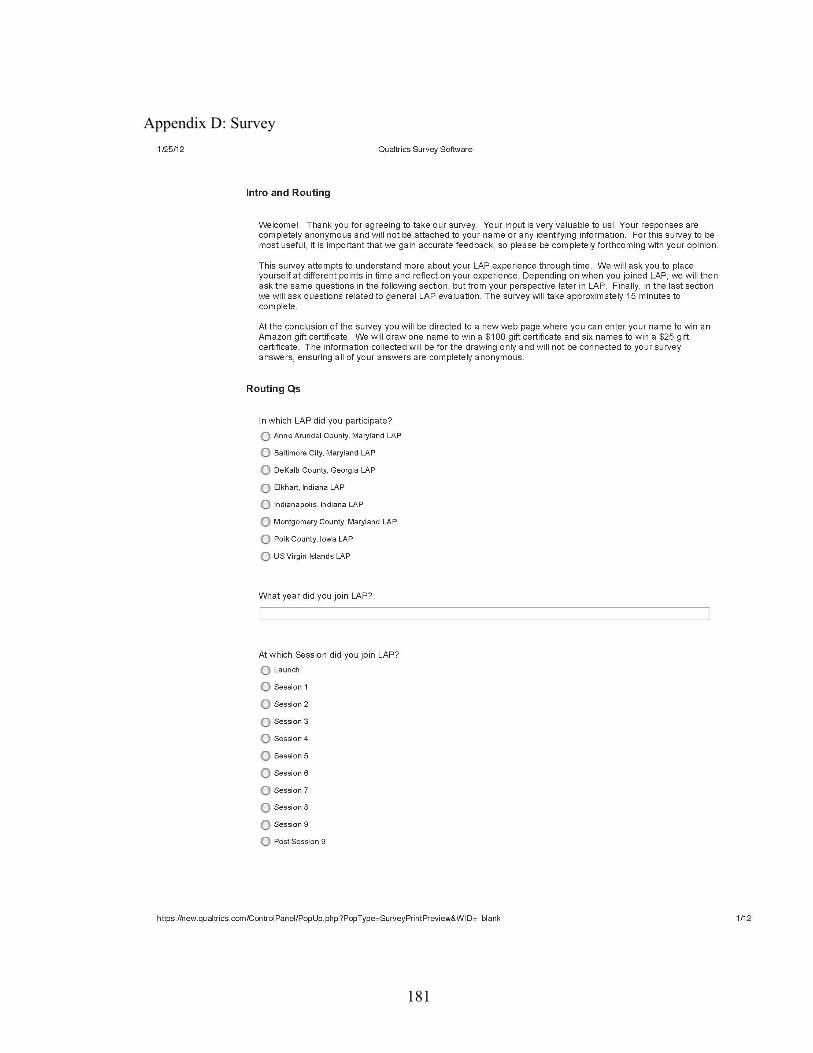
181
Appendix D: Survey

182

183

184
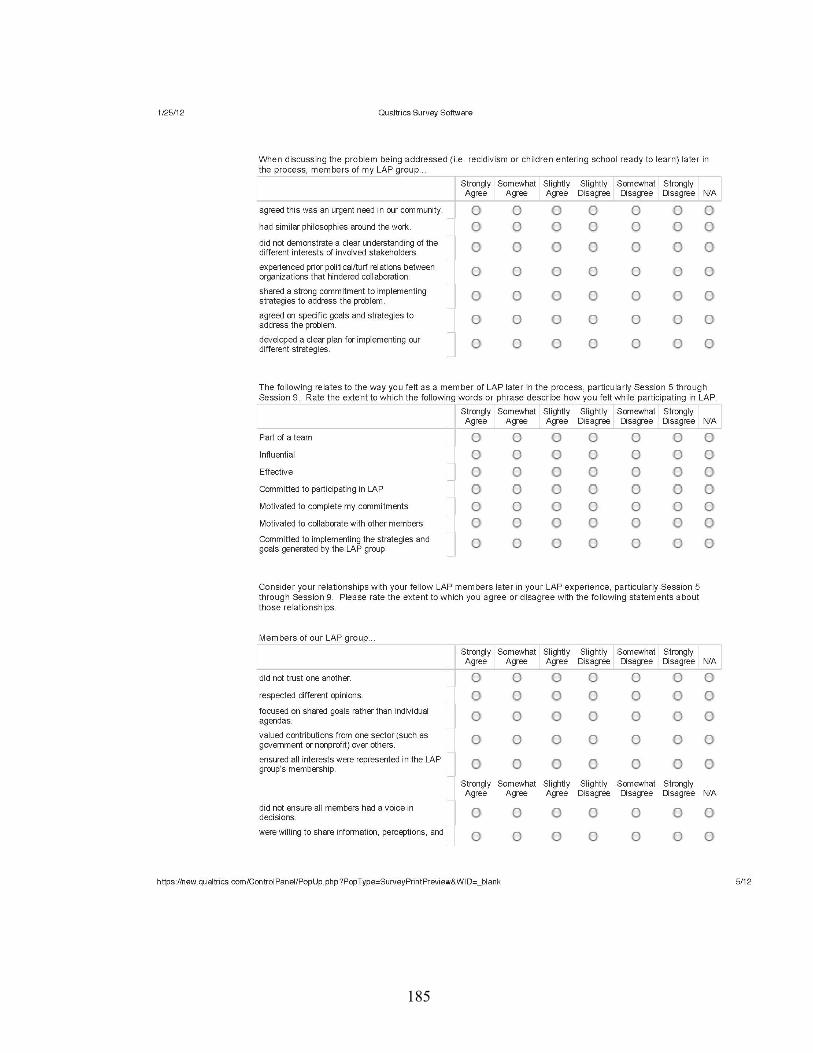
185

186

187

188
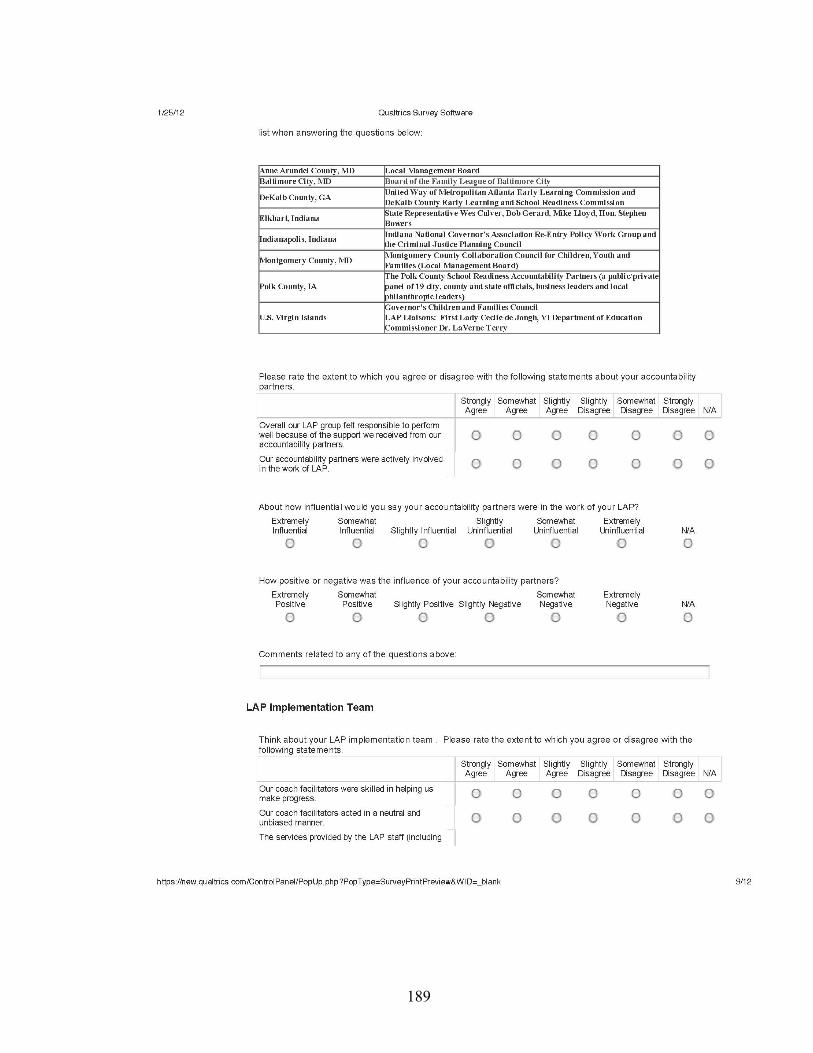
189

190

191

192

193
Appendix E: Survey Demographics In which LAP did you participate?
Answer Response % Total sent: Response rate:
Anne Arundel County, Maryland LAP 15 15% 26 57.7% Baltimore City, Maryland LAP 16 16% 34 47.1% DeKalb County, Georgia LAP 17 17% 22 77.3% Indianapolis, Indiana LAP 28 28% 54 51.9% Montgomery County, Maryland LAP 11 11% 34 32.4% Polk County, Iowa LAP 13 13% 33 39.4% Total 100 100% 203 49.3%
Which best describes your agency? Please select all that apply. Answer Response % Faith-based organization 2 2% Nonprofit 37 38% Business 2 2% School district or local school 9 9% Local government 20 20% State government 18 18% Federal government 0 0% University 1 1% Other 15 15% What is the approximate total number of full-time equivalent employees in your agency/organization? Answer Response % Under 25 21 22% 25 - 100 20 21% 100 - 250 14 14% 250 - 1000 21 22% 1000 or more 21 22% Total 97 100%
Please select the categories that best describe your role with the organization you represent(ed) in LAP (check all that apply) Answer Response % Direct service provider 10 10% Manager/Team Leader 34 35% Administrator 49 50% Collaboration project staff 13 13% Teacher / School personnel 4 4%

194
Elected official 1 1% Law enforcement personnel 1 1%
Judge / Magistrate / Court personnel 2 2% Business person 2 2% Representative of a faith-based organization 0 0% Researcher 2 2% Volunteer 3 3% Concerned community member 4 4%
Primary Caregiver (parent, guardian, kin, etc) of service recipient 0 0% Person receiving services 0 0% Other 11 11% Did you continue to meet with your group after LAP's last formal session, Session 9? Answer Response % Yes 56 72% No 22 28%* Total 78 100% *All that answered no were directed to questions about Accountability partners rather than about Post-LAP experience
Do you still continue to meet regularly today?
Answer Response % Anne Arundel
Baltimore City
DeKalb County Indy
Mont Cty
Polk County
Yes 23 41% 8 1 7 4 3 0 Yes, but our LAP group has merged with another group or become a totally different entity 13 23% 1 0 0 6 5 1 No, but we did meet for a period of time after the formal session ended. 17 30% 0 5 3 6 1 2 No, but I am continuing to move forward strategies developed during LAP with at least one other member from the original LAP group. 3 5% 0 2 0 0 0 1 Total answer for Post-LAP 56 100% 9 8 10 16 9 4 Total began survey 15 16 17 28 11 13 Percent post-LAP 60.0% 50.0% 58.8% 57.1% 81.8% 30.8%
Consider outcomes that have resulted from your LAP group (relationships, strategic plans, activities, initiatives, etc); Please rate the extent to which you agree or disagree with the following statements.

195
Question Percent agree
Percent Disagree
Anne Arundel
I am satisfied with the current outcome(s) of the LAP process. 100.0% 0.0%
I consider the LAP process a success. 100.0% 0.0%
Baltimore City
I am satisfied with the current outcome(s) of the LAP process. 55.6% 33.3%
I consider the LAP process a success. 66.7% 22.2%
DeKalb County
I am satisfied with the current outcome(s) of the LAP process. 72.7% 18.2%
I consider the LAP process a success. 83.3% 8.3%
Indianapolis
I am satisfied with the current outcome(s) of the LAP process. 70.0% 15.0%
I consider the LAP process a success. 65.0% 20.0%
Montgomery County
I am satisfied with the current outcome(s) of the LAP process. 70.0% 20.0%
I consider the LAP process a success. 70.0% 20.0%
Polk County
I am satisfied with the current outcome(s) of the LAP process. 37.5% 50.0%
I consider the LAP process a success. 75.0% 25.0%

196
Appendix F: Comparison of Provan and Milward Framework to Littlefield
Framework
Provan and Milward (2001) Framework Variables
Littlefield Framework Variables Definition of Variable
Community Level Community Level Cost to community Data not available
Building social capital Included in Process analysis in Chapter 4
Aggregate indicators of client well-being Data not available Public perceptions that the problem is being solved
Too similar to variables below
Changes in the incidence of the problem
Changes in the incidence of the problem
Questions asked whether the work of LAP resulted in a positive change associated with the problem being addressed (i.e. recidivism or children entering school ready to learn) and had a strong potential to greatly impact the problem.
NEW: Implementation of community-wide initiatives
Survey questions asked whether the LAP group has or plans to implement community-wide initiatives and whether these initiatives will have a significant impact on the problem being addressed. Interviews generated a list of initiatives, and these initiatives are then compared to best practices in the literature in order to evaluate their potential for affecting community outcomes.
NEW: Implementation of new policy or legislative change
Survey questions asked whether the group was able to make changes or create new policies to better serve their community and whether those were local, state or national policy changes.
Network Level Collaborative Level Range of services provided Not applicable Absence of service duplication Not applicable
Relationship strength Included in Process analysis in Chapter 4
Integration/coordination of services Not applicable

197
Network membership growth
Membership commitment and growth
Questions asked about membership commitment in the early and later stages of the LAP. Questions around membership attrition and growth/membership post Casey funding were asked in the interviews.
Creation and maintenance of a network administrative organization
Continued existence of collaborative and resource generation after first year
Survey variables include the percent of respondents who continued to meet after the last session, and the percent who meet regularly today. Interviews asked questions around the current group and its administration. Survey and interview questions asked whether their LAP group was able to generate new and/or additional funds to continue their work, information on the different types of resources and fundraising efforts conducted by the group as well as their overall level of difficulty in acquiring funds.
Cost of network maintenance
Incorporated into variable above: Continued existence of collaborative and resource generation after first year. See above
Member commitment to goals
Incorporated into variable above: Membership commitment and growth See above
NEW: Collaborative Self-Assessment and Outcomes
Questions asked whether the resulting plan from their LAP group addressed the needs, concerns, and values of the organization they represented as well as whether they were satisfied with the current outcomes(s) of the LAP process. Interviews inquired into the level of conflict the group experienced as they decided upon strategies and the individual’s overall evaluation of collaborative outcomes. The strategy impact variable includes strategies coded by impact or strength according to best practices in the literature.
NEW: Member Driven Accountability System
Questions asked whether the group employed strategies to ensure people were responsible for their work commitments, whether this responsibility was informal or formal, and whether driven by coach facilitators or members themselves. The survey measure looks at the percent of people that said the accountability was driven by members and the percent change of this perspective from early to later in the process.
Organization/participant level
Organization/participant level
Agency survival Not applicable

198
Cost of services Not applicable Minimum conflict for multi-program agencies across multiple networks
Included in Process analysis in Chapter 4
Enhanced legitimacy
Increased agency outcomes
Survey and interview questions asked whether the participant's involvement in LAP resulted in greater community legitimacy with clients and reputation with peers and funders and whether the participant's involvement in LAP resulted in participant's greater ability to obtain funds and acquire new resources for their individual agency.
Resource acquisition
Incoporated into Increased agency outcomes above See above
Client Outcomes
Increased client outcomes for organization
Questions asked whether the participant's involvement in LAP resulted in increased ease of client access to services and whether the participant's involvement in LAP resulted in higher number of services offered, quality of services and coordinating care with other agencies.
Service access
Incoporated into Increased client outcomes above see above
NEW: Individual self-assessment of personal skills and relationships
Survey and Interview: Whether participant has gained new or improved skills; better working relationships with other individuals involved in this work; participated in new initiatives or activities (independent of LAP activities); has a better understanding of this issue and the population served; made contacts that are useful to them or their sector/organization.

199
Appendix G
Community Level Analysis LAP
Survey: Percent Agree Interviews
Implementation of best practice community-wide programs or initiatives Anne Arundel 91.7% High Baltimore City 55.6% High DeKalb 66.7% Med-high Indianapolis 80.0% Med Montgomery 80.0% Med-low Polk 37.5% Low Implementation of new policy or legislative changes Implementation of new policy or legislative changes Anne Arundel 66.7% Didn't mention
Baltimore City 66.7% Didn't mention DeKalb 75% Didn't mention Indianapolis 60% Yes Montgomery 50% Didn't mention Polk 25% Didn't mention Changes in incidence of the problem Percent agree the work resulted in a positive change associated with the problem being addressed Anne Arundel 100%; 100% Yes Percent agree the work had a strong potential to greatly impact the problem. Baltimore City 78%; 67% Yes DeKalb 75%; 89% No Indianapolis 70%; 70% Yes Montgomery 80%; 70% No Polk 37.5%; 50% No Collaborative Level Membership commitment and growth Member Commitment, Percent Change Anne Arundel 8.9% Growing from Early LAP to Later LAP Baltimore City 11.9% Grew DeKalb 6.3% Struggled Indianapolis -6.3% Conflict Montgomery 3.2% High attrition Polk -1.8% High attrition Member driven accountability system Accountability - Percent Member Driven, Later LAP Anne Arundel 81.8%, 18.2% High Accountability - Percent Member Driven, Percent Baltimore City 62.5%, 6.9% High Change from Later LAP DeKalb 70%, 31.5% High Indianapolis 31.25%, -7.2% Med Montgomery 88.9%, 22.2% Med-low

200
Polk 42.9%, -1.6% Low Collaborative Self-Assessment and Outcomes The resulting plan from our LAP group addresses the needs, concerns, and values of the organization I represented. Anne Arundel 75%; 100%; 1.79
Little conflict forming strategies; Med-high
performance evaluation
I am satisfied with the current outcome(s) of the LAP process. Baltimore City 78%; 56%; 1.78
Little conflict forming strategies; Med-high
performance evaluation
Strength of Strategies (coded score) DeKalb 55%; 73%; 1.53
Little conflict forming strategies; Medium
performance evaluation
Indianapolis 55%; 70%; 1.38
Little conflict forming strategies; Medium
performance evaluation
Montgomery 80%; 70%; 1.5 Struggled to form strategies; Low performance evaluation
Polk 75%; 38%; 1.38 Struggled to form strategies; Low performance evaluation
Continued existence of collaborative and resource generation after first year
Percent who continued to meet after Session 9 Anne Arundel 75%; 92% Yes, Structure and additional
resources Resource acquisition for collaborative as a whole to continue services or work as a group Baltimore City 77.8%; 56%
Yes, Structure and additional resources
DeKalb 71.4%; 91% Yes, Structure and additional
resources
Indianapolis 68.2%; 50% Yes, unsure structure and
intermittent resources
Montgomery 90%; 70%
Yes, no structure; resources acquisition at first but now
none Polk 44.4%; 38% No Organization/Participant Level Individual self assessment of new personal skills and relationships
Anne Arundel 88% Med-high Baltimore City 78% Med DeKalb 83% Med-low Indianapolis 80% High Montgomery 78% Med-low Polk 67% Med-low Increased agency outcomes Resource acquisition for individual agencies
Anne Arundel 38%; 67%
No agency funding or additional legitimacy
mentioned Enhanced agency legitimacy
Baltimore City 39%; 39% No agency funding mentioned;
increased agency legitimacy
DeKalb 67%; 58%
Agencies acquired additional resources and increased
legitimacy
Indianapolis 40%; 43%
No agency funding or additional legitimacy
mentioned

201
Montgomery 35%; 60%
No agency funding or additional legitimacy
mentioned
Polk 39%; 44%
No agency funding or additional legitimacy
mentioned Increased client outcomes for organizations Increase in client outcomes for organizations Anne Arundel 66.3%; 50% Yes Increase in service access for clients Baltimore City 48%; 22% Yes DeKalb 61%; 50% Yes Indianapolis 59.3%; 40% Yes Montgomery 70%; 40% None mentioned Polk 59.7%; 44% None mentioned

202
Appendix H:

203
Collaborative Process Variables
LAP Survey: Percent Agree Interview Results
External Factors Existing Relationships or Networks How many did you know
prior to LAP? (Higher average indicates more
people) Anne Arundel
4 people; 46.2%; 84.6% Mixture of old and new relationships
Early LAP: experienced prior political/turf relations between organizations that
hindered collaboration. Baltimore City
3.3 people; 100%; 80% Mixture of old and new relationships
Early LAP: enjoyed strong working relationships with
one another. DeKalb 2.3 people; 53.8%; 100% Knew each other
Indianapolis 3.6 people; 76.9%; 78.6% Mixture of old and new relationships Montgomery 4.6 people; 55.6%; 88.9% Knew each other Polk 4.2 people; 77.8%; 88.9% Knew each other
Competitive pressures
Individuals and/or organizations in our LAP
group were able to step out of past history in order to
start fresh. Anne Arundel 83.3% Yes Baltimore City 66.7% Yes DeKalb 72.7% Yes Indianapolis 55% Yes Montgomery 90% Yes
Polk 37.5% Yes
The establishment of an external partner(s) in which the collaborative feels accountable for performance
The establishment of an external partner(s) in which
the collaborative feels accountable for
performance Anne Arundel 91.3%; 91.7% Med-Low Positive influence of convener relationship Baltimore City 77.8%; 66.7% Med-Low
DeKalb 83.3%; 83.3% Med Indianapolis 50%; 64.3% Med-High Montgomery 90%; 90% Med-Low
Polk 50%; 83.3% Med-Low
Strength of implementation team (facilitator, support staff, etc.) Average of four survey
questions related to implementation team Anne Arundel 97.9% High
Baltimore City 100.0% High DeKalb 89.4% High Indianapolis 90.5% High Montgomery 62.5% Low
Polk 80.6% Med
Internal Factors Development of group leadership skills and forging agreements Ensure all members had a
voice in decisions. Anne Arundel 83.3%; 91.7% Leadership skills - Medium; High
consensus decision-making Focused on shared goals
rather than individual 100%; 100% Leadership skills - Medium; Positive

204

205
Bibliography
Acar, M., Guo, C. and Yang, K. (2008). Accountability When Hierarchical Authority Is Absent. The American Review of Public Administration, 38 (1), 3-23.
Agranoff, R. (2006). Inside Collaborative Networks: Ten Lessons for Public
Managers. Public Administration Review, Special Issue: 56-65.
Agranoff, Robert. (2007). Managing Within Networks. Washington, D.C.:
Georgetown University Press. Agranoff R. and McGuire, M. (2001). Big Questions in Public Network Management
Research. Journal of Public Administration Research and Theory, 11 (3), 295-326.
Annie E. Casey Foundation Leadership in Action Program Final Report (2006).
Research Center for Leadership in Action, NYU Wagner Documentation Project. Internal Document.
Babiak, K. and Thibault, L. (2009). Challenges in Multiple Cross-Sector
Partnerships. Nonprofit and Voluntary Sector Quarterly, 38 (1), 117-143. Bardach, E. and Lesser, C. (1996). Accountability in Human Services Collaboratives:
For What? And to Whom?, Journal of Public Administration Research and Theory, 6 (2), 197-224.
Bardach, E. (1998) Getting Agencies to Work Together: The Practice and Theory of
Managerial Craftmanship. Washington, D.C.: Brookings Institution Press. Baum, H. (2001). How Should We Evaluate Community Initiatives?, Journal of the
American Planning Association, 67 (2), 147-158. Behn, R.. (2001) Rethinking Democratic Accountability. Washington, D.C.:
Brookings Institution Press. Bryson, J. M., Crosby, B. C., & Stone, M. M. (2006). The Design and
Implementation of Cross-Sector Collaborations: Propositions from the Literature, Public Adminsitration Review Special Issue, 44-55.
Chaskin, R. (2003). Fostering Neighborhood Democracy: Legitimacy and
Accountability Within Loosely Coupled Systems. Nonprofit and Voluntary Sector Quarterly, 32 (2), 161-189.

206
Bin, C. (2010). Antecedents or Processes? Determinants of Perceived Effectiveness of Interorganizational Collaborations for Public Service Delivery, International Public Management Journal, 13 (4), 381 – 407.
Children Entering School Ready to Learn: Baseline School Readiness Baseline
Information for School Year 2001-2002. (2002). Retrieved November 5, 2008, from http://www.marylandpublicschools.org/MSDE/newsroom/publications/school_readiness.htm
Chisholm, D. (1989) Coordination Without Hierarchy. Los Angeles, CA: University
of California Press. Connell, J.P and A.C. Kubisch (1998). Applying a Theory of Change Approach” in
K. Fulbright Anderson, A.C Kubisch and J.P. Connell (Eds) New Approaches to Evaluating Community Initiatives Volume 2: Theory, Measurement, and Analysis. Washington DC.: The Aspen Institute.
Coulson, A. (2005). A plague on all your partnerships: Theory and practice in
regeneration, The International Journal of Public Sector Management, 18 (2), 151-163.
Dooley, K. D. (1997). A Complex Adaptive Systems Model of Organization Change,
Nonlinear Dynamics, Psychology and Life Sciences 1 (1) Eoyang, G. H., and Berkas, T. H. (1998) Evaluating Performance in Complex
Adaptive System." In Managing Complexity in Organizations, by M. A. Lissack, 2-13. Westport, Connecticut: Quorum Books.
Ebrahim, A. (2005). Accountability Myopia: Losing Sight of Organizational
Learning, Nonprofit and Voluntary Sector Quarterly, 34, 56-87. Foster-Fishman, P., Berkowitz, S.; Lounsbury, S. and Allen, N. (2001). Building
Collaborative Capacity in Community Coalitions: A Review and Integrative Framework, American Journal of Community Psychology, 29 (2).
Gage, Robert. (1984). Federal Regional Councils: Networking Organizations for
Policy Management in the Intergovernmental System. Public Administration Review, 44 (2), 134–145.
García-Canal, E., Valdéz-Llaneza, A., and Ariñio, A. "Effectiveness of dyadic and
multi-party joint ventures." Organization Studies 24, no. 5 (2003): 743-770. Goldsmith, S. & Eggers, W. (2004) Governing By Network: The New Shape of the
Public Sector. Washington D.C.: Brookings Institution Press. Gray, Barbara. (1989) Collaborating: Finding Common Ground for Multiparty

207
Problems. San Francisco: Jossey-Bass. Gray, Barbara, and Donna Wood. 1991. Collaborative Alliances: Moving from
Practice to Theory. Journal of Applied Behavioral Science 27(2): 3-22. Harmon, Michael M. and Mayor, Richard T. Administration, Organization Theory for
Public. Glenview, IL: Scott, Foresman, 1986. Hatry, Harry. Performance Measurement: Getting Results. Washington, DC: Urban
Institute, 1999. Hays, C.; Hays, S.; DeVille, J.; Mulhall, P. (2000). Capacity for Effectiveness: The
Relationship Between Coalition Structure and Community Impact, Evaluation and Program Planning, 23, 373-379.
Herranz, Jr., Joaquín. "The Multisector Trilemma of Network Management." Journal
of Public Administration Research and Theory 18 (2007): 1-31. Herranz, J. (2009). Multilevel Performance Indicators for Multisectoral Networks and
Management, The American Review of Public Administration, 40 (4). Human, S.E. and Provan, K.G. “Legitimacy Building in the Evolution of Small-Firm
Networks: A Comparative Study of Success and Demise.” Administrative Science Quarterly, 45 (2000): 327-365.
Huxham, Chris, and Siv Vangen. 2005. Managing to Collaborate: The Theory and
Practice of Collaborative Advantage. New York: Routledge. Isett K., Mergel, I, LeRoux, Mischen, P. and Rethemeyer, R.K. “Networks in Public
Administration Scholarship: Understanding Where We Are and Where We Need to Go.” Journal of Public Administration Research and Theory 21 (2011): i157 – i173.
Ingraham, Patricia, and Donald Moynihan. "Beyond Measurement: Managing for
Results in State Government." In Quicker, Better, Cheaper? Managing Performance in American Government, by D.W. Forsythe, 309–33. Albany, NY: Rockefeller Institute Press, 2001.
Jarjoura, R.; Haight, K. Estimating the Cost Savings Associated with a 1% Reduction
in Recidivism for Marion County, Indiana Center for Criminal Justice Research, Indiana University Public Policy Institute Indiana University School of Public and Environmental Affairs, Internal report: IDOC Recidivism Data (data provided to Community Solutions by IDOC)

208
Kettl, D. (2002). The Transformation of Governance: Public Administration for Twenty-First Century America. Baltimore, MD: The Johns Hopkins University Press.
Kettl, D. (2009). Unlocking the Power of Networks: Keys to High Performance
Governance. Washington, D.C.: Brookings Institution Press. Kickert, W. J., & Koppenjan, J. F. (1997). Public Management and Network
Management: An Overview. In W. J. Kickert, E.-H. Klijn, & J. F. Koppenjan, Managing Complex Networks (pp. 35-61). London: Sage Publications.
Klijn, E.; Koppenjan, J. (2000) Public Management and Policy Networks: Foundation
of a Network Approach to Governance, Public Management, 2 (2), 135-158. Kontopoulos, K. (1997). The Logics of Social Structure. New York: Cambridge
University Press. Linden, Russell M. Working Across Boundaries. San Francisco, CA: John Wiley &
Sons, 2002. McGuire, M.; Agranoff, R. (2011). The Limitations of Public Management Networks,
Public Administration, 89 (2), 265-284) Morrison, J. B. and Salipante, P. "Governance for Broadened Accountability:
Blending Deliberate and Emergent Strategizing." Nonprofit and Voluntary Sector Quarterly 36 (2007): 195-217.
O’Leary, R., Bingham, L.B., & Choi., Y. (2010). Teaching Collaborative Leadership:
Ideas and Lessons for the Field. Journal of Public Affairs Education, 16(4), 565-592.
O’Leary, R. & Vij, N. (2012). Collaborative Public Management: Where Have We
Been and Where are We Going? The American Review of Public Administration, 42(5), 507-522.
O’Toole, L.J. “The Implications for Democracy in a Networked Bureaucratic.”
Journal of Public Administration Research and Theory Vol. 7, No. 3 (1997): 443-459.
Page, Stephen. "Building Collaborative Capacity in the Human Services." In Big
Ideas In Collaborative Public Management, by Lisa and O'Leary, Rosemary Blomgren Bingham, 138-161. Armonk, NY: M.E. Sharpe, 2008.
Page, Stephen. "Measuring Accountability for Results in Interagency Collaboratives."
Public Administration Review 64, no. 5 (2004): 591-606.

209
Pillsbury, J. B. (2008). Theory of Aligned Contributions: An Emerging Theory of Change. Draft White Paper (www.sherbrookeconsulting.com).
Provan, K.; Fish, A.; Sydow, J. (2007). Interorganizational Networks at the Network
Level: A Review of the Empirical Literature on Whole Networks, Journal of Management, 33, 479.
Provan, K. and Milward, H. B. "Do Networks Really Work? A Framework for
Evaluating Public-Sector Organizational Networks." Public Administration Review 61, no. 4 (2001): 414-423.
—. "A Preliminary Theory of Interorganizational Network Effectiveness: A
Comparative Study of Four Community Mental Health Systems." Administrative Science Quarteriy 40 (1995): 1-33.
Ring, Peter Smith, and Andrew H. Van de Ven. 1994. Development Processes of
Cooperative Interorganizational Relationships. Academy of Management Review, 19(1), 90-118.
Roberts, Nancy C., and Raymond Trevor Bradley. 1991. Stakeholder Collaboration
and Innovation: A Study of Public Policy Initiation at the State Level. Journal of Applied Behavioral Science 27(2): 209-27.
Rodriguez, C.; Langley, A.; Beland, F.; Denis, J. (2007). Governance, Power, and
Mandated Collaboration in an Interorganizational Network, Administration and Society, 39, 150-.
Romzek, Barbara S. and Melvin J. Dubnick. "Accountability." In International
Encyclopedia of Public Policy and Administration, by Jay M. Shafritz, 6. Boulder, CO: Westview Press, 1998.
Sowa, J. (2009). The Collaboration Decision in Nonprofit Organizations, Nonprofit
and Voluntary Sector Quarterly, 38 (6), 1003-1025 Thomson, A.M. & Perry J. L. (2006) Collaboration Processes: Inside the Black Box
Public Administration Review, 66, 20-32. Turrini, A.; Cristofoli, D.; Forsini, F.; Nasi, G. (2010). Networking Literature About
Determinants of Networking Effectiveness, Public Administration, 88 (2), 528-550.
United States Department of Justice Bureau of Justice Statistics. (2007). Recidivism.
Retrieved from http://www.bjs.gov/index.cfm?ty=tp&tid=17 Weiss, C. H. (1998). Evaluation (2nd ed.). Upper Saddle River, NJ: Prentice Hall.

210
Wohlstetter, P., Smith, J. and Malloy C. "Strategic Alliances in Action: Toward a Theory of Evolution." The Policy Studies Journal 33, no. 3 (2005): 419-442.
Yin, Robert. Case Study Research: Designs and Methods . Vol. 4. Thousand Oaks,
CA: SAGE Publications Inc., 2009. Zakocs, R. and Edwards, E. "What Explains Community Coalition Effectiveness? A
Review of the Literature." American Journal of Preventive Medicine 30, no. 4 (2006): 351-361