
ABSORPTION ENHANCED REFORMING OF LIGHT ALCOHOLS (METHANOL AND ETHANOL ... · ABSORPTION ENHANCED...
43
ABSORPTION ENHANCED REFORMING OF LIGHT ALCOHOLS (METHANOL AND ETHANOL) FOR THE PRODUCTION OF HYDROGEN: THERMODYNAMIC MODELING Miguel A. Escobedo Bretado 1 , Manuel D. Delgado Vigil 2 , Jesús Salinas Gutiérrez 2 , Miguel Meléndez Zaragoza 2 , Virginia Collins-Martínez 2 and Alejandro López Ortiz 2 1 Facultad de Ciencias Químicas, Universidad Juárez del Estado de Durango, Ave. Veterinaria s/n, Circuito Universitario, Durango 34120, México 2 Departamento de Materiales Nanoestructurados, Centro de Investigación en Materiales Avanzados, S.C. Miguel de Cervantes 120, Chihuahua, Chih. 31109, México, * contact email: [email protected] ABSTRACT Thermodynamic modeling of the steam reforming of light alcohols using CaO, CaO*MgO, Na 2 ZrO 3 , Li 2 ZrO 3 and Li 4 SiO 4 as CO 2 absorbents was carried out to determine promising operating conditions to produce a high hydrogen production ratio (HR) and concentration (% H 2 ) gas product. Light alcohols studied were ethanol and methanol at 300-850°C and 1 atm. Steam to alcohol (S/COH) molar feed ratio varied from 1:1 (stoichiometric) to 6:1 for methanol and from 3:1 (stoichiometric) to 6:1 for ethanol. Thermodynamic simulation employed the Gibbs free energy minimization technique to obtain equilibrium compositions. Results indicate no carbon formation at S/COH ≤ stoichiometric. Methanol reforming at 600°C and S/COH = 6, without CO 2 absorbent (WOA), produced a hydrogen ratio (HR) of 2.76 (molsH 2 /molCH 3 OH fed) and 73.5% H 2 . At the same conditions CaO, CaO*MgO, and Na 2 ZrO 3 produced a HR (% H 2 ) of 2.98 (98.2% H 2 ), 2.96 (96.4% H 2 ) and 2.91 (98.2% H 2 ), respectively. Ethanol reforming WOA generated a HR = 4.6 (69.5% H 2 ) at 600°C and S/COH = 6, while CaO, CaO*MgO, and Na 2 ZrO 3 showed a HR (% H 2 ) of 5.7 (96.6% H 2 ), 5.5 (94.1% H 2 ) and 5.4 (92.3% H 2 ), respectively. For both cases other absorbents produced lower values. In both reforming systems (methanol and ethanol) most favorable thermodynamics were obtained with CaO and CaO*MgO as absorbents; however stability of these absorbents CaO*MgO, and Na 2 ZrO 3 must be improved. While, Na 2 ZrO 3 is a promising alternate absorbent with comparable thermodynamics and greater kinetics and stability. Modeling results agreed with experimental evaluation of ethanol reforming using CaO*MgO, and Na 2 ZrO 3 . Key words: Absorption-Enhanced-Reforming, Ethanol, Methanol, CO 2 absorbent, Thermodynamics
Transcript of ABSORPTION ENHANCED REFORMING OF LIGHT ALCOHOLS (METHANOL AND ETHANOL ... · ABSORPTION ENHANCED...
ABSORPTION ENHANCED REFORMING OF LIGHT ALCOHOLS
(METHANOL AND ETHANOL) FOR THE PRODUCTION OF HYDROGEN: THERMODYNAMIC MODELING
Miguel A. Escobedo Bretado1, Manuel D. Delgado Vigil2, Jesús Salinas Gutiérrez2,
Miguel Meléndez Zaragoza2, Virginia Collins-Martínez2 and Alejandro López Ortiz2
1 Facultad de Ciencias Químicas, Universidad Juárez del Estado de Durango, Ave. Veterinaria
s/n, Circuito Universitario, Durango 34120, México 2 Departamento de Materiales Nanoestructurados, Centro de Investigación en Materiales
Avanzados, S.C. Miguel de Cervantes 120, Chihuahua, Chih. 31109, México, * contact email: [email protected]
ABSTRACT
Thermodynamic modeling of the steam reforming of light alcohols using CaO, CaO*MgO,
Na2ZrO3, Li2ZrO3 and Li4SiO4 as CO2 absorbents was carried out to determine promising operating conditions to produce a high hydrogen production ratio (HR) and concentration (% H2)
gas product. Light alcohols studied were ethanol and methanol at 300-850°C and 1 atm. Steam to alcohol (S/COH) molar feed ratio varied from 1:1 (stoichiometric) to 6:1 for methanol and from 3:1 (stoichiometric) to 6:1 for ethanol. Thermodynamic simulation employed the Gibbs free
energy minimization technique to obtain equilibrium compositions. Results indicate no carbon formation at S/COH ≤ stoichiometric. Methanol reforming at 600°C and S/COH = 6, without CO2
absorbent (WOA), produced a hydrogen ratio (HR) of 2.76 (molsH2/molCH3OH fed) and 73.5% H2. At the same conditions CaO, CaO*MgO, and Na2ZrO3 produced a HR (% H2) of 2.98 (98.2% H2), 2.96 (96.4% H2) and 2.91 (98.2% H2), respectively. Ethanol reforming WOA generated a HR
= 4.6 (69.5% H2) at 600°C and S/COH = 6, while CaO, CaO*MgO, and Na2ZrO3 showed a HR (% H2) of 5.7 (96.6% H2), 5.5 (94.1% H2) and 5.4 (92.3% H2), respectively. For both cases other
absorbents produced lower values. In both reforming systems (methanol and ethanol) most favorable thermodynamics were obtained with CaO and CaO*MgO as absorbents; however stability of these absorbents CaO*MgO, and Na2ZrO3 must be improved. While, Na2ZrO3 is a
promising alternate absorbent with comparable thermodynamics and greater kinetics and stability. Modeling results agreed with experimental evaluation of ethanol reforming using CaO*MgO, and
Na2ZrO3.
Key words: Absorption-Enhanced-Reforming, Ethanol, Methanol, CO2 absorbent,
Thermodynamics
2
1. INTRODUCTION
Today, fossil fuel reserves are in the way of depletion, since crude oil (a non-renewable resource),
cannot continue to meet the ongoing demand. Particularly, oil production has become limited by
the current capacity of extraction technology, causing supply and demand curves to diverge.
Therefore, the age of cheap liquid fuels is coming to an end, and a condition of meeting
additional demand is to develop unconventional resources, which translates to an increase in the
price of petroleum products. Furthermore, the capacity to meet liquid fuel demand is depending
upon the fast and immediate diversification of liquid fuels, the transition to alternative energy
carriers where applicable, and demand side measures such as behavioral change and adaptation.
[1]. Two main important issues are considered in the fossil fuel substitution; clean and
environmentally friendly fuels and improve their efficiency in energy conversion. In recent years,
fuel cells have become an option for high efficiency power generation based on renewable
hydrogen.
Hydrogen is an important raw material in the chemical and petroleum industries. Moreover,
hydrogen might become a new generation of clean energy carrier for transport, especially for fuel
cell applications, which would cause a huge increase in the hydrogen demand. Today 95% of
hydrogen production is based on the steam reforming of natural gas [2]. However, there is an
expected increase in hydrogen demand that is related to fuel cell applications, which could drive
the development of new methods for its production, particularly from renewable sources. The use
of biofuels (ethanol, diesel, etc.) for hydrogen production, through conventional industrial
processes (steam reforming, partial oxidation and dry reforming), presents the advantage of a
zero CO2 balance during the biofuels conversion, since the carbon dioxide released to the
atmosphere can be absorbed during the biomass formation process [3]. Ethanol and methanol are
considered potential candidates for hydrogen production from biomass [4]. Bio-ethanol can be
obtained from different biomass sources, which include; energy crops, agro industrial wastes,
organic material from urban solid wastes, etc. On the other hand, bio-methanol as a second
generation biofuel can also be considered as a suitable feedstock for hydrogen production.
3
Methanol is conventionally produced from fossil natural gas or by coal gasification, while
biomethanol is made from biogas generated exclusively from renewable and non-food crop
resources [5].
It is important to state that from these two potential fuels (ethanol and methanol) methanol
presents the highest value in hydrogen/carbon (H/C) atomic ratio and this means that in principle
its conversion could lead to a high purity hydrogen stream with expected low carbon formation.
Otherwise, the steam reforming of ethanol and/or methanol, which are oxygenated hydrocarbons,
is rather thermodynamically favored at lower temperatures than non oxygenated hydrocarbons
such as methane [6]. Steam reforming of methanol and ethanol for hydrogen production follow
the next stoichiometric reactions:
CH3OH(g) + H2O(g) = CO2(g) + 3H2(g) ΔH°298 = 48.2 kJ/mol (1)
C2H6O(g) + 3H2O(g) = 2CO2(g) + 6H2(g) ΔH°298 = 171.2 kJ/mol (2)
Even though these reactions appear to be simple, these are accompanied with a complex reaction
system of undesired reaction paths. Therefore, the hydrogen selectivity is dictated and limited by
the thermodynamic equilibrium of the reaction system. For proton exchange membrane fuel cell
(PEMFC) applications the maximum hydrogen production can be carried out in three steps. The
first step is the conversion of the biofuel into H2, CH4, CO and CO2 (steam reforming) followed
by a low temperature step where most of the CO produced is converted in CO2 and additional H2
by the water gas shift reaction (WGS):
.
CO(g) + H2O(g) = CO2(g) + H2(g) ΔH°298 = -41.2 kJ/mol (3)
Since the WGS is limited by the thermodynamic equilibrium the CO concentration after this step
is still high to be used in the PEMFC anode where a CO concentration greater than 50 ppm will
4
cause poisoning of the platinum catalyst. Consequently, a third step should be carried out, which
consists to remove the carbon monoxide such as preferential oxidation (polishing step). Finally,
in order to generate electric energy, the high purity hydrogen produced and oxygen can be used
as a feedstock for a PEMFC.
The need for a high purity hydrogen stream for PEMFC applications, without the need of a
process of several steps that conventional processes currently employ, has led to the scientific
community to propose alternate processes such as the absorption enhanced reforming (AER).
This AER process provides a promising alternative for a single step high purity hydrogen
production [7]. The fundamental concept in which this process is based is the Le Chatellier’s
principle in which the reaction equilibrium can be shifted towards the production of hydrogen
when CO2 is removed in situ within the reforming reactor. Thus if the carbon dioxide generated
during the steam reforming step is removed from the gas phase using a solid CO2 absorbent such
as CaO the hydrogen production will be enhanced. In the AER reactor a mixture of a CO 2
absorbent (for example CaO) and a reforming catalyst will theoretically produce a high purity
hydrogen stream in one single step. The combination of the CO2 absorption by CaO through the
reaction:
CaO + CO2(g) = CaCO3 ΔH°298 = -178.3 kJ/mol (4)
and the steam reforming of methanol and ethanol lead to the following reactions:
CH3OH(g) + H2O(g) + CaO = CaCO3 + 3H2(g) ΔH°298 = -130 kJ/mol (5)
C2H6O(g) + 3H2O(g) + 2CaO = 2CaCO3 + 6H2(g) ΔH°298 = -185.3 kJ/mol (6)
Comparing equations (1) and (2) with equations (5) and (6), it is evident that the use of a CO2
absorbent change from endothermic steam reforming reactions to exothermic reactions, which
implies potential energy savings with the use of both biofuels. However, this absorbent must be
5
regenerated if a continuous process is desired and then the high endothermic reverse reaction (4)
will eventually be required to be performed.
Thermodynamic analyses and experimental studies related to the use of simultaneous CO2
removal using CaO as absorbent combined with the steam reforming of methanol and/or ethanol
for hydrogen production has been reported by several authors [8, 9]. However, calcium-base
absorbents lose more than half of their absorption capacity after several absorption/regeneration
cycles (typically five), with the exception of calcined dolomite (CaO*MgO) which is able to
withstand several cycles with minor deterioration. The loss of capacity in these absorbents is due
to sintering of the materials consequence of the high temperature required for their regeneration
(T > 900°C) [10]. Therefore, the use of a suitable absorbent that combines relatively low
regeneration temperatures and good multicycle performance is highly desirable.
Recent studies have developed synthetic CO2 absorbents. Compounds such as: lithium
orthosilicate (Li4SiO4), lithium zirconate (Li2ZrO3) [11] and sodium zirconate (Na2ZrO3) [12],
which are able to withstand many carbonation/regeneration cycles without important loss of CO 2
absorption capacity and activity at high temperatures. Therefore, these synthetic absorbents have
become potential candidates to be used under the proposed AER process.
In the present study, a thermodynamic analysis of steam reforming of two light alcohols,
methanol and ethanol, with and without the use of a CO2 absorbent was carried out to determine
favorable operating conditions to produce a high purity hydrogen stream suitable for PEMFC
applications. The CO2 absorbents studied were; CaO, CaO*MgO, Na2ZrO3, Li2ZrO3 and Li4SiO4.
The influence of steam-to-fuel feed molar ratio and temperature on the product gas concentration
was investigated for all cases. Also, in the AER reaction system, pressure was kept at
atmospheric conditions. Results are compared with experimental (where available) and
theoretical data generated and found in existing literature. Furthermore, it is expected that during
the steam reforming of alcohols, carbon deposition over catalysts may be the main cause for
deactivation, resulting in low durability and activity loss. Therefore, additionally a study of
6
conditions where this carbon deposition is expected with and without the use of a CO2 absorbent
is presented. Finally, the thermal efficiency is evaluated in the conventional steam reforming and
AER processes for each absorbent studied.
2. SIMULATION CALCULATIONS
2.1 Gibbs Free Energy Minimization Technique
In a reaction system where many simultaneous reactions take place, equilibrium calculations can
be performed through the Gibbs energy minimization approach (also called the non
stoichiometric method). In this technique the total free energy of the system consisting of an ideal
gas phase and pure condensed phases, can be expressed as:
The technique is based in finding different values of ni which minimizes the objective function (7)
and subjected to the constraints of the elemental mass balance:
where aij is the number of atoms of the jth element in a mole of the ith species. Aj is defined as the
total number of atoms of the jth element in the reaction mixture [13]. All calculations were
performed through the using the equilibrium module of the HSC chemistry software for windows
[14]. HSC calculates the equilibrium composition of all possible combination of reactions that are
able to take place within the thermodynamic system. These equilibrium calculations make use of
the equilibrium composition module of the HSC program that is based on the Gibbs free energy
minimization technique. The GIBBS program of this module finds the most stable phase
combination and seeks the phase compositions where the Gibbs free energy of the system reaches
7
its minimum (equation 7) at a fixed mass balance (a constraint minimization problem, equation 8),
constant pressure and temperature.
In this non-stoichiometric approach every species in the system must be defined. The selection of
feasible products should be based on previous experimental results found in the literature. For
each system the possible species are specified based on reported experimental and
thermodynamic analysis studies. In the methanol and ethanol steam reforming system the species
included were: ethanol, ethylene, ethane, acetone, acetaldehyde, acetic acid, C, CO, CH4, CO2, H2,
and H2O and these were based on reported experimental species found in the literature [15-17].
Identical conditions were used for the cases where a CO2 absorbent was included, with the
exception that two solid phases were added; solid and elemental carbon. In the case of CO2
absorbent CaO, the species Ca(OH)2 and CaCO3 were added. For dolomite were: CaO*MgO,
CaO, CaCO3, MgCO3 and MgO. For sodium zirconate were: Na2ZrO3, Na2CO3 and ZrO2. For
lithium zirconate were: Li2ZrO3, Li2CO3 and ZrO2 and finally for lithium orthosilicate were:
Li4SiO4, Li2CO3 and Li2SiO3 all of these correspond to the following carbonation reactions:
CaO*MgO + CO2(g) = CaCO3 + MgO ΔH°298 = -170.9 kJ/mol (9)
Na2ZrO3 + CO2(g) = Na2CO3 + ZrO2 ΔH°298 = -151.5 kJ/mol (10)
Li2ZrO3 + CO2(g) = Li2CO3 + ZrO2 ΔH°298 = -162.5 kJ/mol (11)
Li4SiO4 + CO2(g) = Li2CO3 + Li2SiO3 ΔH°298 = -142.2 kJ/mol (12)
During the simulation work the reaction temperature was varied in the range of 300-850°C at 1
atm. Steam to alcohol (S/COH) molar feed ratio varied from 1:1 (stoichiometric) to 1:6 for
methanol and from 1:3 (stoichiometric) to 1:6 for ethanol. For the case of the carbon formation
study the S/COH molar feed ratio varied from 0.2 to 0.5 for each biofuel.
8
2.2 Thermal Efficiency Calculation
In the present work, the calculation procedure for thermal efficiency was based on the approach
developed by He and coworkers [18]. For converting a fuel into hydrogen by means of the
conventional steam reforming (SR) process, the efficiency of the reaction can be calculated by
the following expression:
Δ
where
is the number of moles of H2 in the outlet stream calculated at equilibrium conditions,
and
are the number of moles in the inlet stream of fuel and steam, respectively,
is the latent energy of steam fed, and and are the lower heating values of
hydrogen and fuel, respectively. The calculated values for the LHV of hydrogen, ethanol and
methanol are 239.2, 1240, and 651.7 kJ/mol, respectively. According to equations (1) and (2) the
maximum thermal efficiency for converting a biofuel with steam can be found by assuming that
one mol of fuel produce 3 and 6 moles of H2, for methanol and ethanol, respectively. And this is
true if only the reforming reaction may take place in the system. However, it has to be considered
that each reaction system is thermodynamically limited and therefore a complex network of
reactions occur in this leading to a non-trivial equilibrium composition that will eventually dictate
the thermal efficiency of the reaction system. Otherwise, the equilibrium composition and energy
requirements depend on reaction conditions. Thus, the energy input in the reaction system,
can be calculated as the enthalpy change due to the conversion of the fuel in other
words, the heat duty of the reaction system:
where and are the outlet and inlet enthalpies, respectively. The GIBBS module of the
HSC equilibrium performs such calculation as reaction enthalpy, Δ .
9
For the AER system the procedure to calculate the thermal efficiency is similar to the one
described above for the conventional SR process. However, the energy input in the AER process,
takes into account both the enthalpy change due to the fuel and the CO2 absorbent
conversion ( Δ reaction enthalpy in HSC) and the heat required for regenerating the
absorbent ( ). In fact, in order to obtain a continuous and economically feasible process, the
CO2 absorbent has to be recycled through carbonation/decarbonation reactions. The energy
required to regenerate the carbonated absorbents is dictated by the ΔH of regeneration reverse
reactions (4), and (9) through (12) at the required temperature. Therefore the can be
determined as follows:
For all the absorbents studied the can be calculated at specific regeneration temperatures.
Furthermore, in calculation HSC takes into account the fact that the feed to the reactor is
composed by biofuel, steam and a solid CO2 absorbent (typically 50% excess). Then the
efficiency of the AER process can be estimated as follows:
Δ
Therefore, the thermal efficiency depends on the production of hydrogen and the required
consumption of heat (heat duty) employed to regenerate the solid CO2 absorbent.
All the previous description of the simulation calculations is based on theoretical thermodynamic
considerations and these are to be taken as a guide to further experimental evaluation of the
reaction systems, since no heat and mass diffusional limitations as well as kinetics effects were
taken into account for the conformation of the present thermodynamic analysis.
10
3. RESULTS AND DISCUSSION
3.1 Thermodynamically Possible Products
During the equilibrium calculations the HSC program requires the input of all possible chemical
species present in the system as reactants and products. For the steam reforming system with and
without absorbents the species considered at equilibrium were all gaseous and solid species
already described in section 2.1 and the ones that were found in the current literature that appear
when each biofuel is converted along with other intermediate oxygenated hydrocarbons. For the
ethanol reforming system the additional intermediate species considered were: ethylene, ethane,
acetaldehyde, acetic acid and acetone [8, 9, 19-21]. Whereas, for the methanol steam reforming
no additional compounds were included in the calculations, since no other species were reported
as additional byproducts in the literature. In practice alcohol steam reforming reactions are under
kinetic control, where suitable catalysts and supports are able to completely convert all the
biofuels to avoid intermediate products. All this agrees well with the fact that only trace amounts
(less than 1ppm) of these oxygenated intermediates were found in all the thermodynamic
calculations performed and therefore these were not reported in the present study.
3.2 Ethanol Steam Reforming System
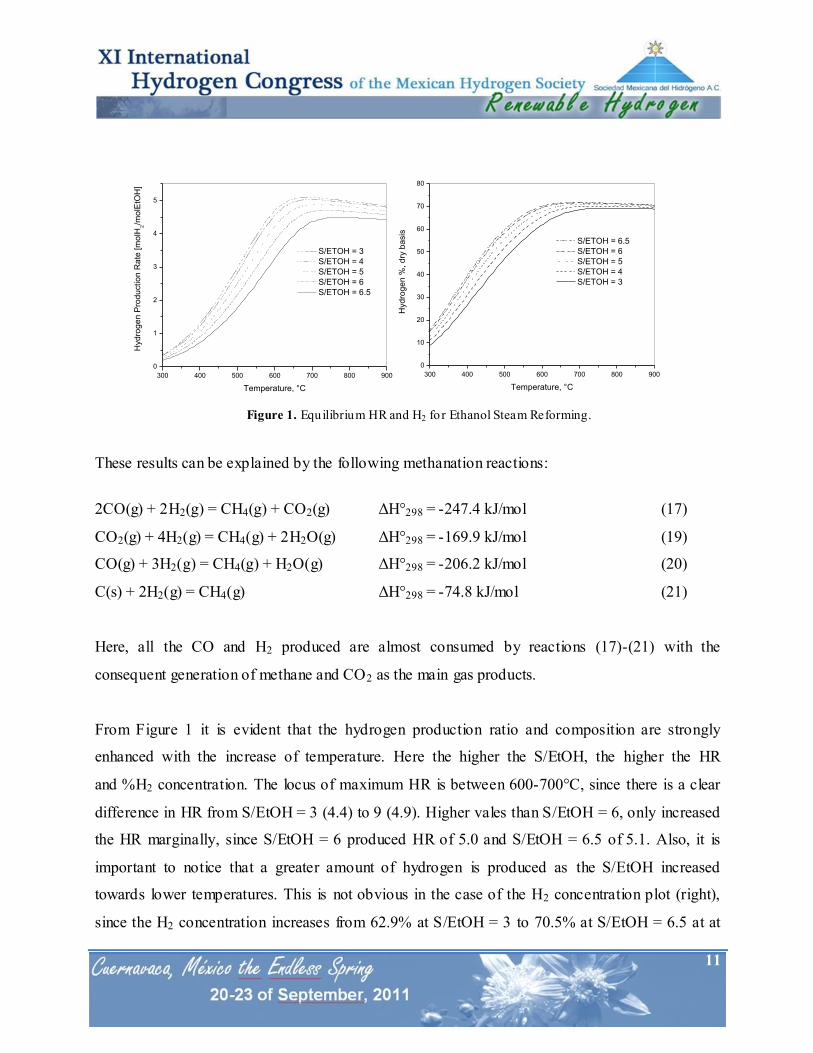
Figure 1 presents the effects of temperature, steam to ethanol molar feed ratio (S/EtOH) on
hydrogen production ratio (HR, defined as mols of H2 produced at equilibrium per mols of
ethanol fed to the system) and H2 dry basis gas concentration (% H2) in the product. This HR is a
way to quantitatively compare different reactions systems (with and without a CO2 absorbent) for
the hydrogen production at equilibrium.
The S/EtOH was varied from 3:1 (stoichiometric) to 6:1 in a temperature range of 300-900°C. In
this conventional system the production of CO (not shown in Figure) and H2 are grown as
temperature increases, since low temperatures corresponds with low CO and H2 production (as
low as 10% H2 at 300°C). At these (low T = 300°C) same conditions CO2 (25%) and CH4 (66%)
are the predominant gaseous species.
11
Figure 1. Equilibrium HR and H2 fo r Ethanol Steam Reforming.
These results can be explained by the following methanation reactions:
2CO(g) + 2H2(g) = CH4(g) + CO2(g) ΔH°298 = -247.4 kJ/mol (17)
CO2(g) + 4H2(g) = CH4(g) + 2H2O(g) ΔH°298 = -169.9 kJ/mol (19)
CO(g) + 3H2(g) = CH4(g) + H2O(g) ΔH°298 = -206.2 kJ/mol (20)
C(s) + 2H2(g) = CH4(g) ΔH°298 = -74.8 kJ/mol (21)
Here, all the CO and H2 produced are almost consumed by reactions (17)-(21) with the
consequent generation of methane and CO2 as the main gas products.
From Figure 1 it is evident that the hydrogen production ratio and composition are strongly
enhanced with the increase of temperature. Here the higher the S/EtOH, the higher the HR
and %H2 concentration. The locus of maximum HR is between 600-700°C, since there is a clear
difference in HR from S/EtOH = 3 (4.4) to 9 (4.9). Higher vales than S/EtOH = 6, only increased
the HR marginally, since S/EtOH = 6 produced HR of 5.0 and S/EtOH = 6.5 of 5.1. Also, it is
important to notice that a greater amount of hydrogen is produced as the S/EtOH increased
towards lower temperatures. This is not obvious in the case of the H2 concentration plot (right),
since the H2 concentration increases from 62.9% at S/EtOH = 3 to 70.5% at S/EtOH = 6.5 at at
300 400 500 600 700 800 900
0
10
20
30
40
50
60
70
80
Hyd
rog
en
%, d
ry b
asis
Temperature, °C
S/ETOH = 6.5
S/ETOH = 6
S/ETOH = 5
S/ETOH = 4
S/ETOH = 3
300 400 500 600 700 800 900
0
1
2
3
4
5
Hyd
rog
en
Pro
du
ctio
n R
ate
[m
olH
2/m
olE
tOH
]
Temperature, °C
S/ETOH = 3
S/ETOH = 4
S/ETOH = 5
S/ETOH = 6
S/ETOH = 6.5
12
about 650°C and from there remains as plateau for all S/EtOH ratios. This plateau in H2
concentration can be explained in terms of the inhibition of the exothermic WGS reaction (3).
Furthermore, at higher temperatures the methane concentration decreases from 66% at 350°C to
about 1.5% at 700°C for S/EtOH = 3, while CO2 concentration also decreases gradually from 25
to 10.5% at the same conditions. At the same time, CO concentration increases continuously with
temperature from 0.042 to 19.6% from 300-700°C. This behavior can be attributed to the reverse
WGS reaction. The above described trends are consistent with previous thermodynamic analysis
of this system performed by Fishtik et al. and Lima da Silva and Müller [8, 22]. These authors
claim that methane dry reforming (reverse reaction 17) and steam reforming (reverse reactions 19
and 20) domain at temperatures greater than 550°C. Also, this is in agreement with experime ntal
findings of Li et al. [23] who reported the effect of temperature on the product gas composition
for the ethanol steam reforming over a NiMg6 catalyst for a S/EtOH = 6. Since, as temperature
was increased from 450 to 700°C they observed a gradual decrease in CO2 and CH4
concentrations, while CO and H2 increased in this range. The present study generated a CO and
H2 concentrations of 1.27 and 49.7% at 450°C to 12.61 and 71.6% at 700°C, respectively, while
CO2 and CH4 concentrations varied from 24.04 to 15.5 and 24.9 to 0.28 mol%. These former
values are very close to those observed by Li et al. and others [21, 23-25]. Therefore, it can be
concluded that their experiments were not kinetically limited, since all equilibrium compositions
were almost reached and that the present thermodynamic analysis can be validated with the
observed experimental reported values.
3.2.1 AER of Ethanol CaO Absorbent
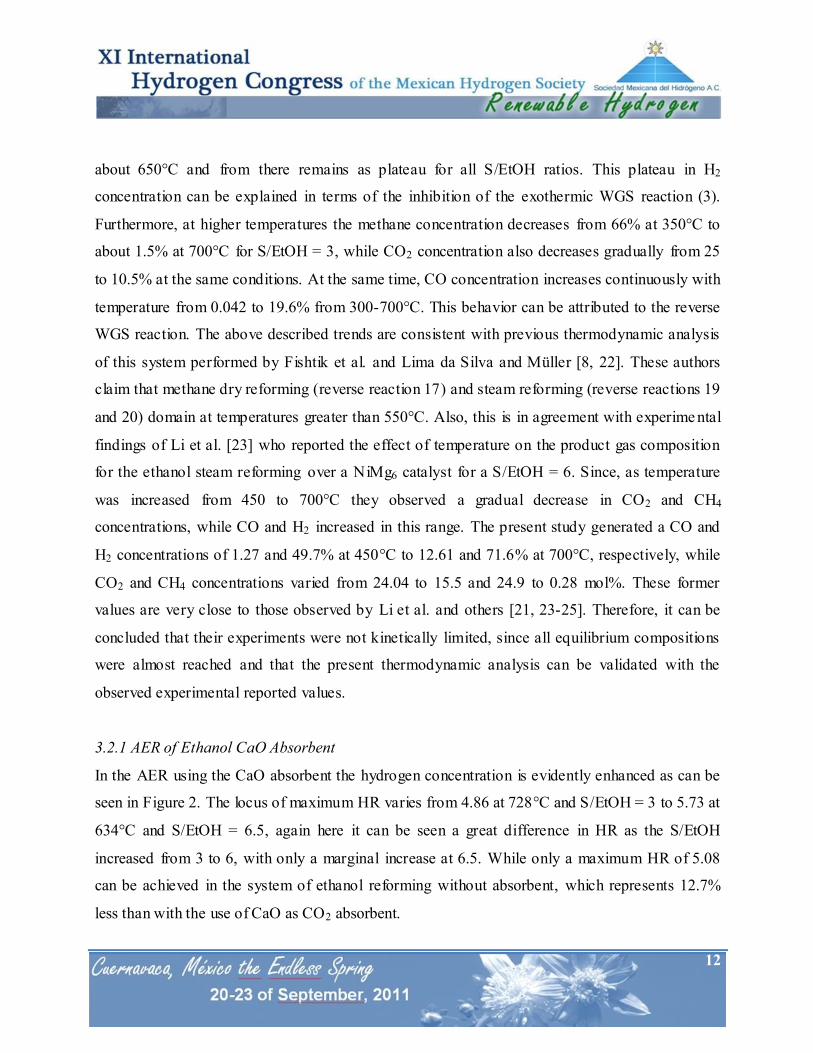
In the AER using the CaO absorbent the hydrogen concentration is evidently enhanced as can be
seen in Figure 2. The locus of maximum HR varies from 4.86 at 728°C and S/EtOH = 3 to 5.73 at
634°C and S/EtOH = 6.5, again here it can be seen a great difference in HR as the S/EtOH
increased from 3 to 6, with only a marginal increase at 6.5. While only a maximum HR of 5.08
can be achieved in the system of ethanol reforming without absorbent, which represents 12.7%
less than with the use of CaO as CO2 absorbent.
13
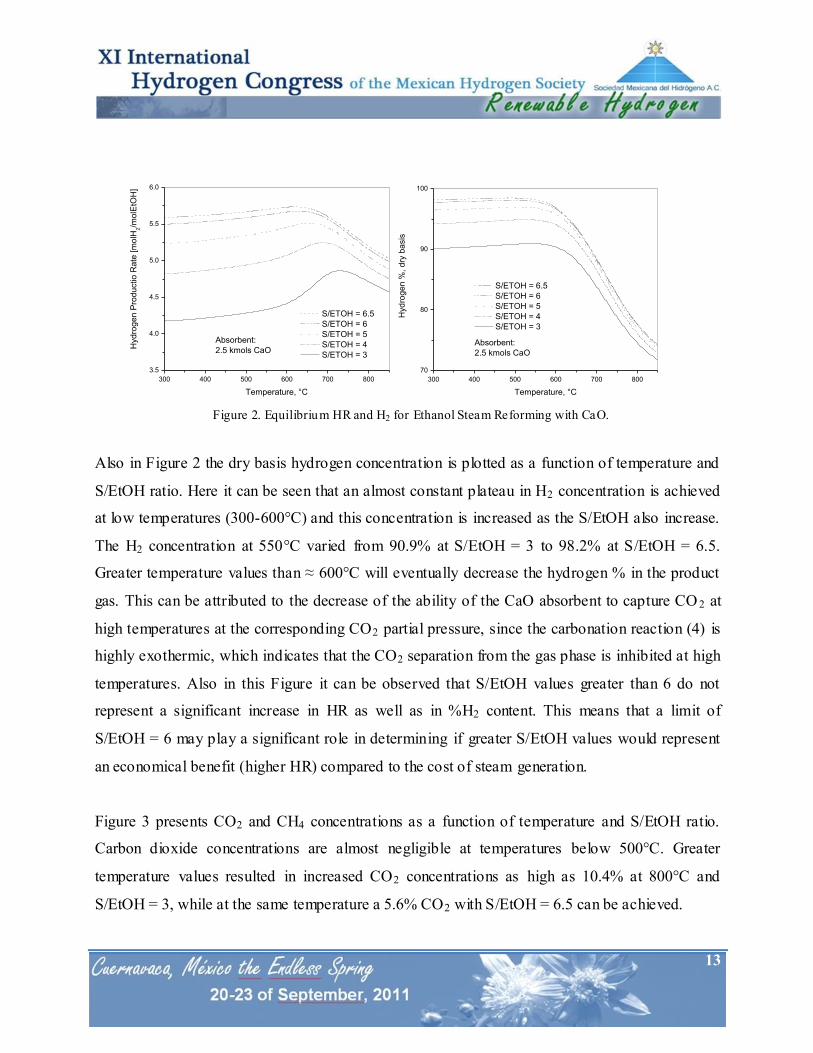
Figure 2. Equilibrium HR and H2 for Ethanol Steam Reforming with CaO.
Also in Figure 2 the dry basis hydrogen concentration is plotted as a function of temperature and
S/EtOH ratio. Here it can be seen that an almost constant plateau in H2 concentration is achieved
at low temperatures (300-600°C) and this concentration is increased as the S/EtOH also increase.
The H2 concentration at 550°C varied from 90.9% at S/EtOH = 3 to 98.2% at S/EtOH = 6.5.
Greater temperature values than ≈ 600°C will eventually decrease the hydrogen % in the product
gas. This can be attributed to the decrease of the ability of the CaO absorbent to capture CO 2 at
high temperatures at the corresponding CO2 partial pressure, since the carbonation reaction (4) is
highly exothermic, which indicates that the CO2 separation from the gas phase is inhibited at high
temperatures. Also in this Figure it can be observed that S/EtOH values greater than 6 do not
represent a significant increase in HR as well as in %H2 content. This means that a limit of
S/EtOH = 6 may play a significant role in determining if greater S/EtOH values would represent
an economical benefit (higher HR) compared to the cost of steam generation.
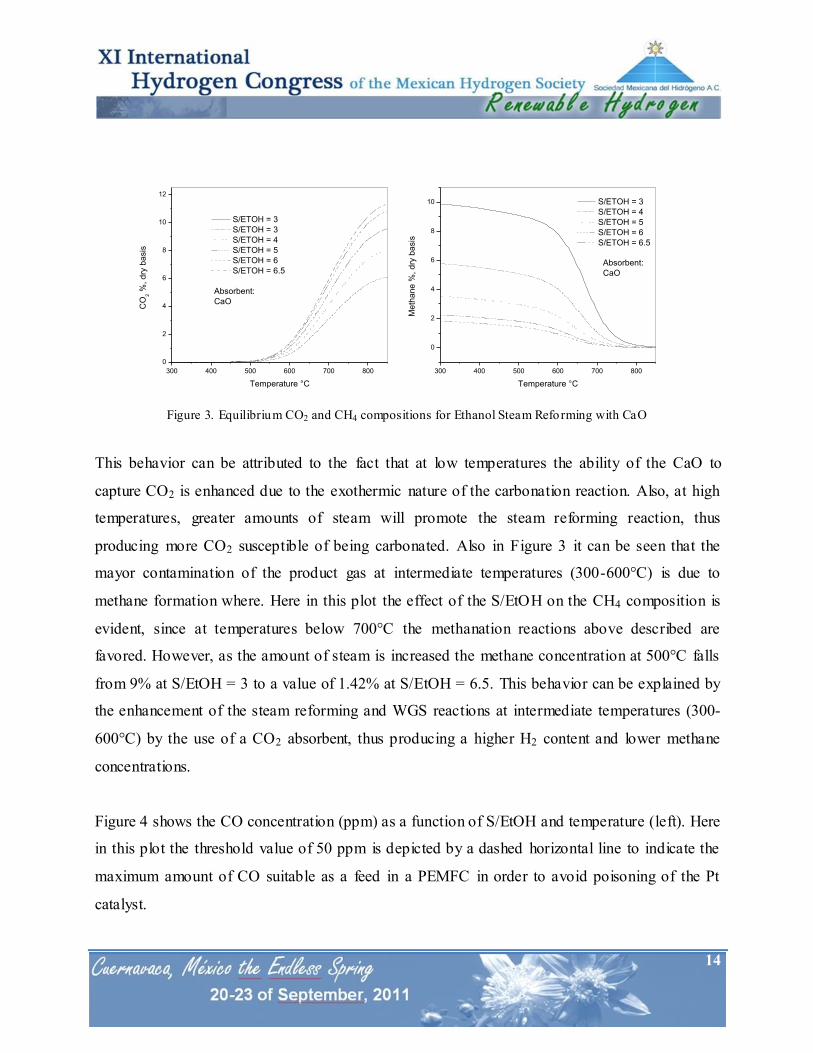
Figure 3 presents CO2 and CH4 concentrations as a function of temperature and S/EtOH ratio.
Carbon dioxide concentrations are almost negligible at temperatures below 500°C. Greater
temperature values resulted in increased CO2 concentrations as high as 10.4% at 800°C and
S/EtOH = 3, while at the same temperature a 5.6% CO2 with S/EtOH = 6.5 can be achieved.
300 400 500 600 700 800
70
80
90
100
Absorbent:
2.5 kmols CaO
Hyd
rog
en
%, d
ry b
asis
Temperature, °C
S/ETOH = 6.5
S/ETOH = 6
S/ETOH = 5
S/ETOH = 4
S/ETOH = 3
300 400 500 600 700 800
3.5
4.0
4.5
5.0
5.5
6.0
Absorbent:
2.5 kmols CaOHyd
rog
en
Pro
du
ctio
Ra
te [m
olH
2/m
olE
tOH
]
Temperature, °C
S/ETOH = 6.5
S/ETOH = 6
S/ETOH = 5
S/ETOH = 4
S/ETOH = 3
14
Figure 3. Equilibrium CO2 and CH4 compositions for Ethanol Steam Reforming with CaO
This behavior can be attributed to the fact that at low temperatures the ability of the CaO to
capture CO2 is enhanced due to the exothermic nature of the carbonation reaction. Also, at high
temperatures, greater amounts of steam will promote the steam reforming reaction, thus
producing more CO2 susceptible of being carbonated. Also in Figure 3 it can be seen that the
mayor contamination of the product gas at intermediate temperatures (300-600°C) is due to
methane formation where. Here in this plot the effect of the S/EtOH on the CH4 composition is
evident, since at temperatures below 700°C the methanation reactions above described are
favored. However, as the amount of steam is increased the methane concentration at 500°C falls
from 9% at S/EtOH = 3 to a value of 1.42% at S/EtOH = 6.5. This behavior can be explained by
the enhancement of the steam reforming and WGS reactions at intermediate temperatures (300-
600°C) by the use of a CO2 absorbent, thus producing a higher H2 content and lower methane
concentrations.
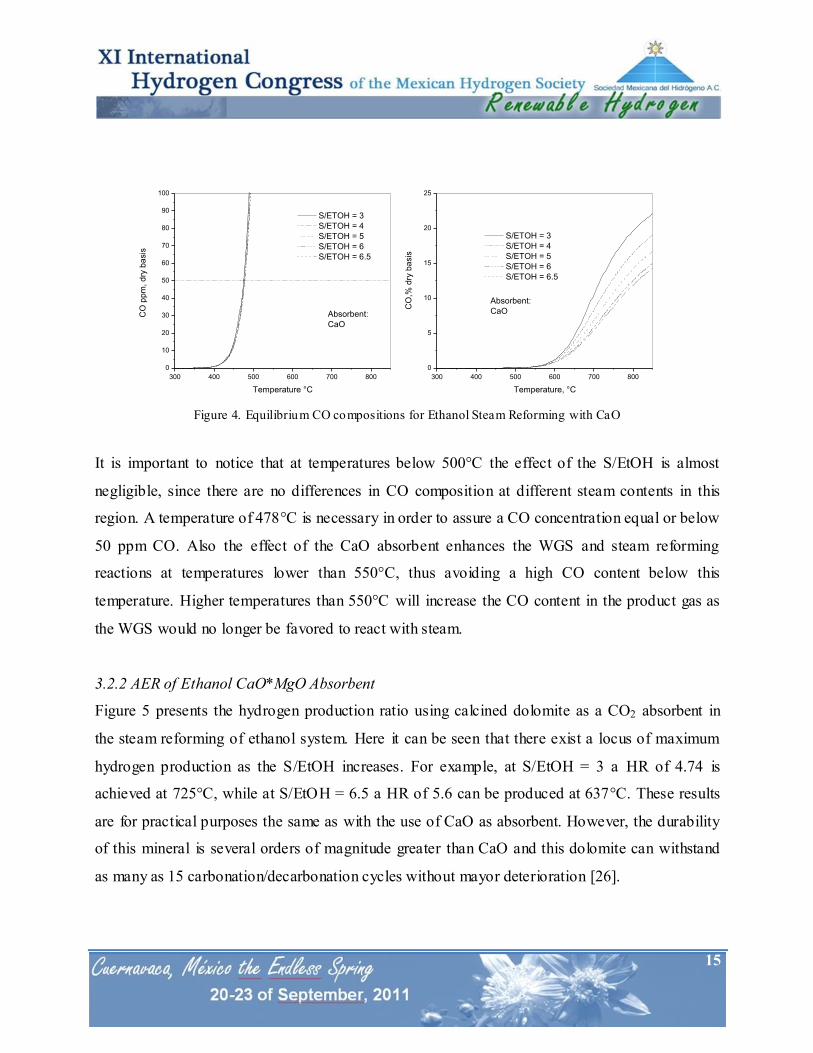
Figure 4 shows the CO concentration (ppm) as a function of S/EtOH and temperature (left). Here
in this plot the threshold value of 50 ppm is depicted by a dashed horizontal line to indicate the
maximum amount of CO suitable as a feed in a PEMFC in order to avoid poisoning of the Pt
catalyst.
300 400 500 600 700 800
0
2
4
6
8
10
Me
tha
ne
%, d
ry b
asis
Temperature °C
S/ETOH = 3
S/ETOH = 4
S/ETOH = 5
S/ETOH = 6
S/ETOH = 6.5
Absorbent:
CaO
300 400 500 600 700 800
0
2
4
6
8
10
12
Absorbent:
CaO
CO
2 %
, d
ry b
asis
Temperature °C
S/ETOH = 3
S/ETOH = 3
S/ETOH = 4
S/ETOH = 5
S/ETOH = 6
S/ETOH = 6.5
15
Figure 4. Equilibrium CO compositions for Ethanol Steam Reforming with CaO
It is important to notice that at temperatures below 500°C the effect of the S/EtOH is almost
negligible, since there are no differences in CO composition at different steam contents in this
region. A temperature of 478°C is necessary in order to assure a CO concentration equal or below
50 ppm CO. Also the effect of the CaO absorbent enhances the WGS and steam reforming
reactions at temperatures lower than 550°C, thus avoiding a high CO content below this
temperature. Higher temperatures than 550°C will increase the CO content in the product gas as
the WGS would no longer be favored to react with steam.
3.2.2 AER of Ethanol CaO*MgO Absorbent
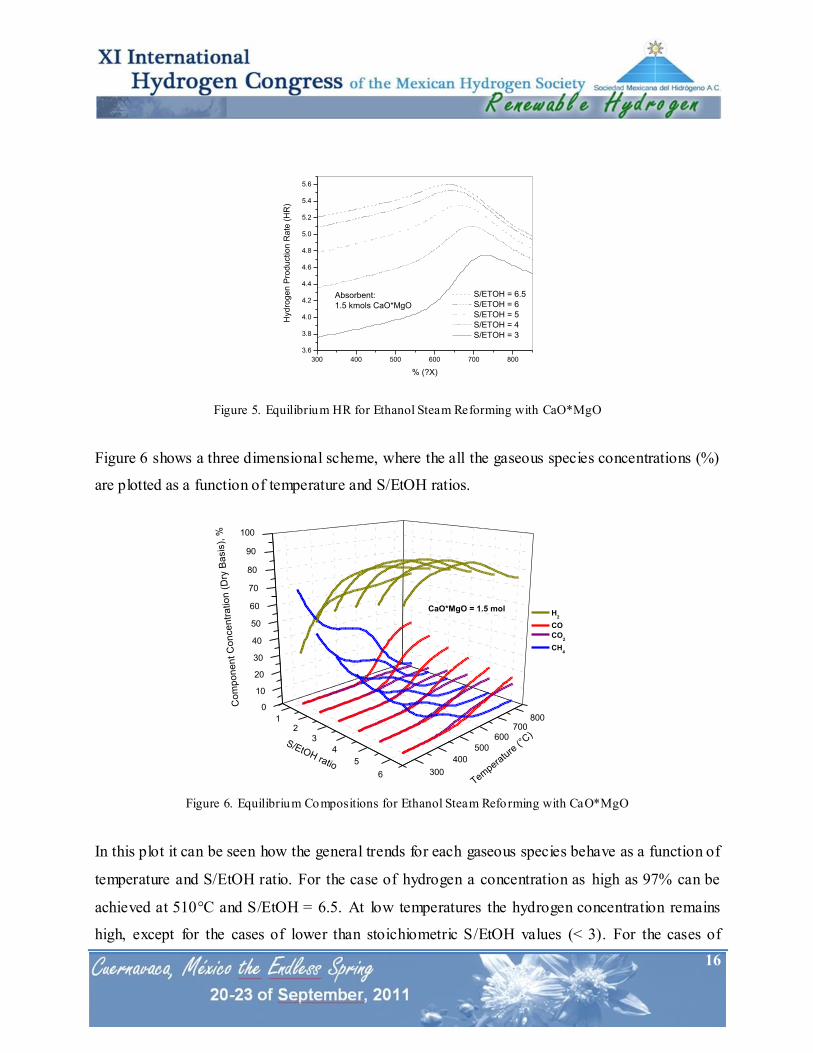
Figure 5 presents the hydrogen production ratio using calcined dolomite as a CO2 absorbent in
the steam reforming of ethanol system. Here it can be seen that there exist a locus of maximum
hydrogen production as the S/EtOH increases. For example, at S/EtOH = 3 a HR of 4.74 is
achieved at 725°C, while at S/EtOH = 6.5 a HR of 5.6 can be produced at 637°C. These results
are for practical purposes the same as with the use of CaO as absorbent. However, the durability
of this mineral is several orders of magnitude greater than CaO and this dolomite can withstand
as many as 15 carbonation/decarbonation cycles without mayor deterioration [26].
300 400 500 600 700 800
0
10
20
30
40
50
60
70
80
90
100
Absorbent:
CaO
CO
pp
m, d
ry b
asis
Temperature °C
S/ETOH = 3
S/ETOH = 4
S/ETOH = 5
S/ETOH = 6
S/ETOH = 6.5
300 400 500 600 700 800
0
5
10
15
20
25
Absorbent:
CaO
CO
,% d
ry b
asis
Temperature, °C
S/ETOH = 3
S/ETOH = 4
S/ETOH = 5
S/ETOH = 6
S/ETOH = 6.5
16
Figure 5. Equilibrium HR for Ethanol Steam Reforming with CaO*MgO
Figure 6 shows a three dimensional scheme, where the all the gaseous species concentrations (%)
are plotted as a function of temperature and S/EtOH ratios.
Figure 6. Equilibrium Compositions for Ethanol Steam Reforming with CaO*MgO
In this plot it can be seen how the general trends for each gaseous species behave as a function of
temperature and S/EtOH ratio. For the case of hydrogen a concentration as high as 97% can be
achieved at 510°C and S/EtOH = 6.5. At low temperatures the hydrogen concentration remains
high, except for the cases of lower than stoichiometric S/EtOH values (< 3). For the cases of
300 400 500 600 700 800
3.6
3.8
4.0
4.2
4.4
4.6
4.8
5.0
5.2
5.4
5.6
Absorbent:
1.5 kmols CaO*MgO
Hyd
rog
en
Pro
du
ctio
n R
ate
(H
R)
% (?X)
S/ETOH = 6.5
S/ETOH = 6
S/ETOH = 5
S/ETOH = 4
S/ETOH = 3
12
3
4
5
6
0
10
20
30
40
50
60
70
80
90
100
300
400
500
600700
800
CaO*MgO = 1.5 mol H
2
CO
CO2
CH4
Co
mp
on
en
t C
on
ce
ntr
atio
n (
Dry
Ba
sis
), %
Tempera
ture
(°C)
S/EtOH ratio
17
carbon oxides (CO and CO2) both concentrations are low at low temperatures as as consequence
of the CO2 absorption enhancement effect of the dolomite and gradually increase as temperature
is raised (S/EtOH = 6) to values up to 15.3 and 11.5% for CO and CO2, respectively. In Figure 6
it is evident that the mayor contaminant of the product gas is methane and this decreases as the
temperature and S/EtOH ratio increases, thus enhancing the steam reforming reaction.
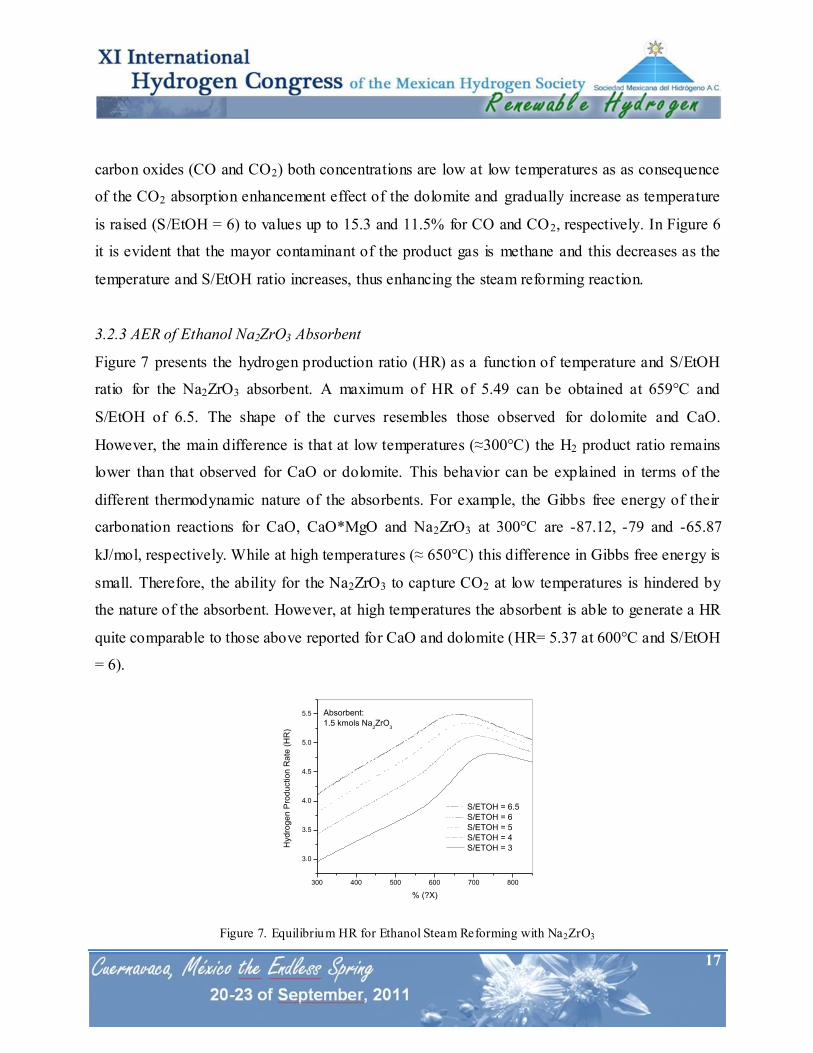
3.2.3 AER of Ethanol Na2ZrO3 Absorbent
Figure 7 presents the hydrogen production ratio (HR) as a function of temperature and S/EtOH
ratio for the Na2ZrO3 absorbent. A maximum of HR of 5.49 can be obtained at 659°C and
S/EtOH of 6.5. The shape of the curves resembles those observed for dolomite and CaO.
However, the main difference is that at low temperatures (≈300°C) the H2 product ratio remains
lower than that observed for CaO or dolomite. This behavior can be explained in terms of the
different thermodynamic nature of the absorbents. For example, the Gibbs free energy of their
carbonation reactions for CaO, CaO*MgO and Na2ZrO3 at 300°C are -87.12, -79 and -65.87
kJ/mol, respectively. While at high temperatures (≈ 650°C) this difference in Gibbs free energy is
small. Therefore, the ability for the Na2ZrO3 to capture CO2 at low temperatures is hindered by
the nature of the absorbent. However, at high temperatures the absorbent is able to generate a HR
quite comparable to those above reported for CaO and dolomite (HR= 5.37 at 600°C and S/EtOH
= 6).
Figure 7. Equilibrium HR for Ethanol Steam Reforming with Na2ZrO3
300 400 500 600 700 800
3.0
3.5
4.0
4.5
5.0
5.5 Absorbent:
1.5 kmols Na2ZrO
3
Hyd
rog
en
Pro
du
ctio
n R
ate
(H
R)
% (?X)
S/ETOH = 6.5
S/ETOH = 6
S/ETOH = 5
S/ETOH = 4
S/ETOH = 3
18
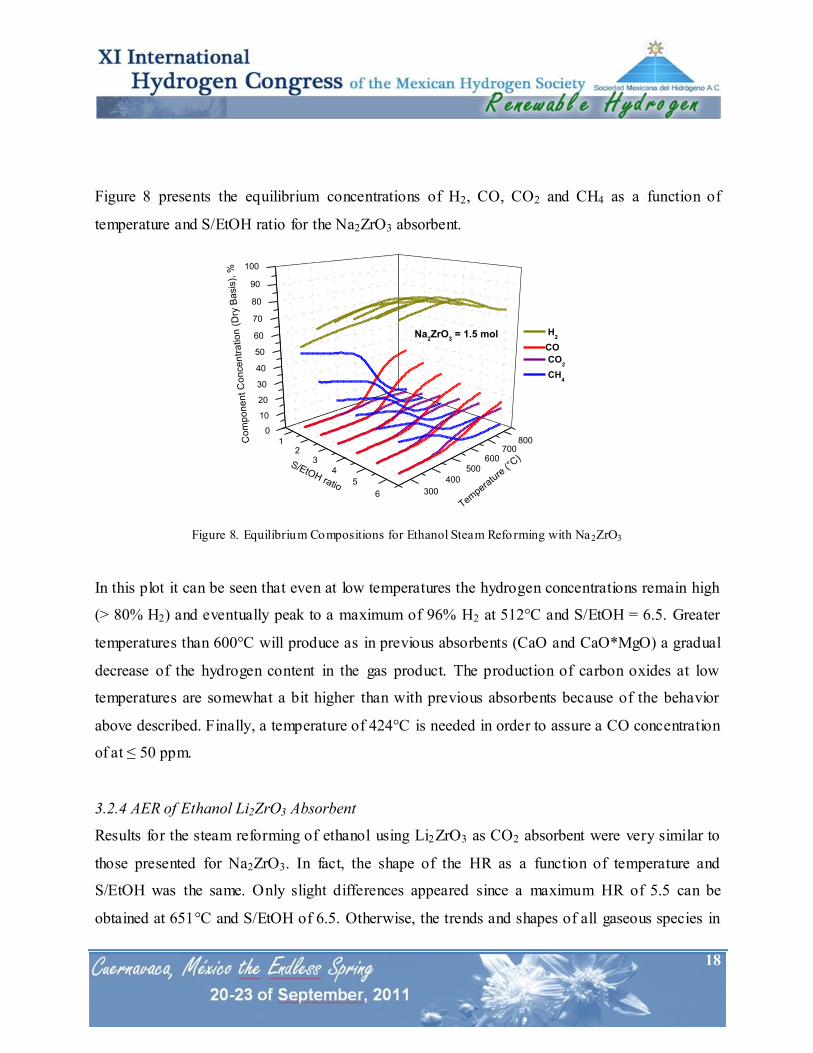
Figure 8 presents the equilibrium concentrations of H2, CO, CO2 and CH4 as a function of
temperature and S/EtOH ratio for the Na2ZrO3 absorbent.
Figure 8. Equilibrium Compositions for Ethanol Steam Reforming with Na2ZrO3
In this plot it can be seen that even at low temperatures the hydrogen concentrations remain high
(> 80% H2) and eventually peak to a maximum of 96% H2 at 512°C and S/EtOH = 6.5. Greater
temperatures than 600°C will produce as in previous absorbents (CaO and CaO*MgO) a gradual
decrease of the hydrogen content in the gas product. The production of carbon oxides at low
temperatures are somewhat a bit higher than with previous absorbents because of the behavior
above described. Finally, a temperature of 424°C is needed in order to assure a CO concentration
of at ≤ 50 ppm.
3.2.4 AER of Ethanol Li2ZrO3 Absorbent
Results for the steam reforming of ethanol using Li2ZrO3 as CO2 absorbent were very similar to
those presented for Na2ZrO3. In fact, the shape of the HR as a function of temperature and
S/EtOH was the same. Only slight differences appeared since a maximum HR of 5.5 can be
obtained at 651°C and S/EtOH of 6.5. Otherwise, the trends and shapes of all gaseous species in
12
3
4
5
6
0
10
20
30
40
50
60
70
80
90
100
300
400
500600
700800
Na2ZrO
3 = 1.5 mol H
2
CO
CO2
CH4
Co
mp
on
en
t C
on
ce
ntr
atio
n (
Dry
Ba
sis
), %
Tempera
ture
(°C)
S/EtOH ratio
19
the product gas were essentially the same, with a maximum H2 concentration of 95.5% at 504°C
and S/EtOH of 6.5. All these similarities can be explained in terms of the thermodynamic nature
of these absorbents. A comparison in terms of the Gibbs free energy of the carbonation reactions
(10) and (11) at 600°C results in very small differences since Na2ZrO3 and Li2ZrO3 show values
of -24.58 and -23.53 kJ/mol, respectively.
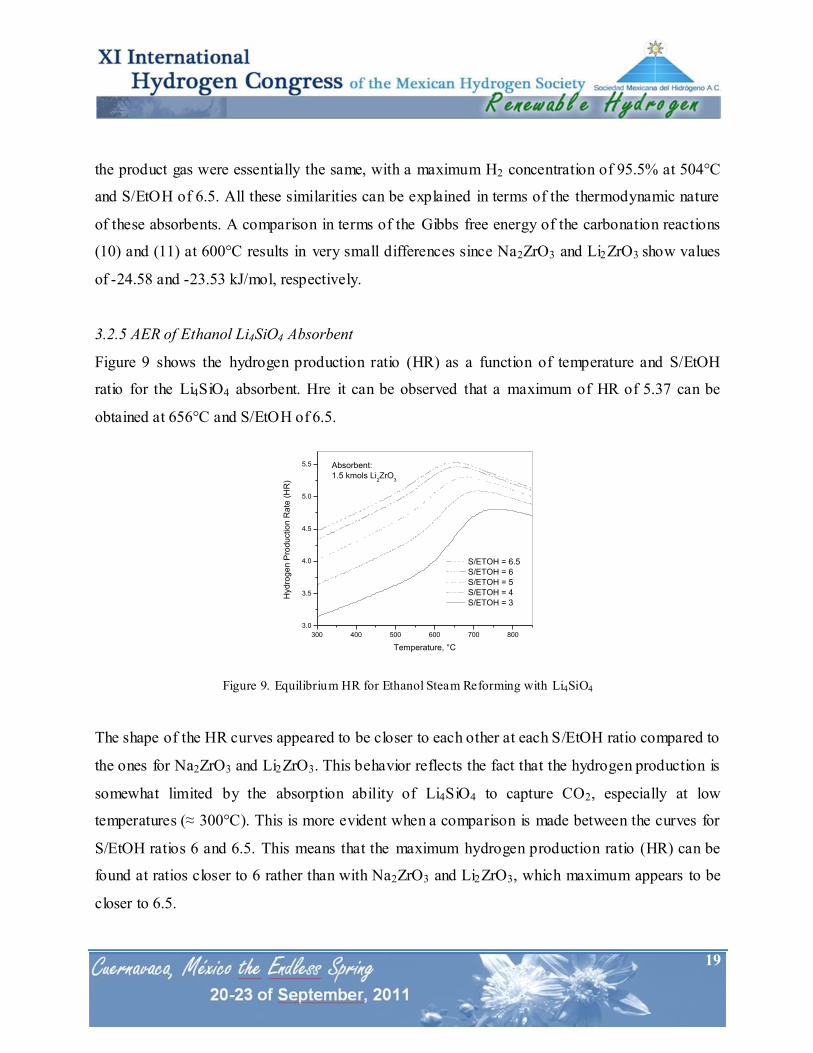
3.2.5 AER of Ethanol Li4SiO4 Absorbent
Figure 9 shows the hydrogen production ratio (HR) as a function of temperature and S/EtOH
ratio for the Li4SiO4 absorbent. Hre it can be observed that a maximum of HR of 5.37 can be
obtained at 656°C and S/EtOH of 6.5.
Figure 9. Equilibrium HR for Ethanol Steam Reforming with Li4SiO4
The shape of the HR curves appeared to be closer to each other at each S/EtOH ratio compared to
the ones for Na2ZrO3 and Li2ZrO3. This behavior reflects the fact that the hydrogen production is
somewhat limited by the absorption ability of Li4SiO4 to capture CO2, especially at low
temperatures (≈ 300°C). This is more evident when a comparison is made between the curves for
S/EtOH ratios 6 and 6.5. This means that the maximum hydrogen production ratio (HR) can be
found at ratios closer to 6 rather than with Na2ZrO3 and Li2ZrO3, which maximum appears to be
closer to 6.5.
300 400 500 600 700 800
3.0
3.5
4.0
4.5
5.0
5.5 Absorbent:
1.5 kmols Li2ZrO
3
Hyd
rog
en
Pro
du
ctio
n R
ate
(H
R)
Temperature, °C
S/ETOH = 6.5
S/ETOH = 6
S/ETOH = 5
S/ETOH = 4
S/ETOH = 3
20
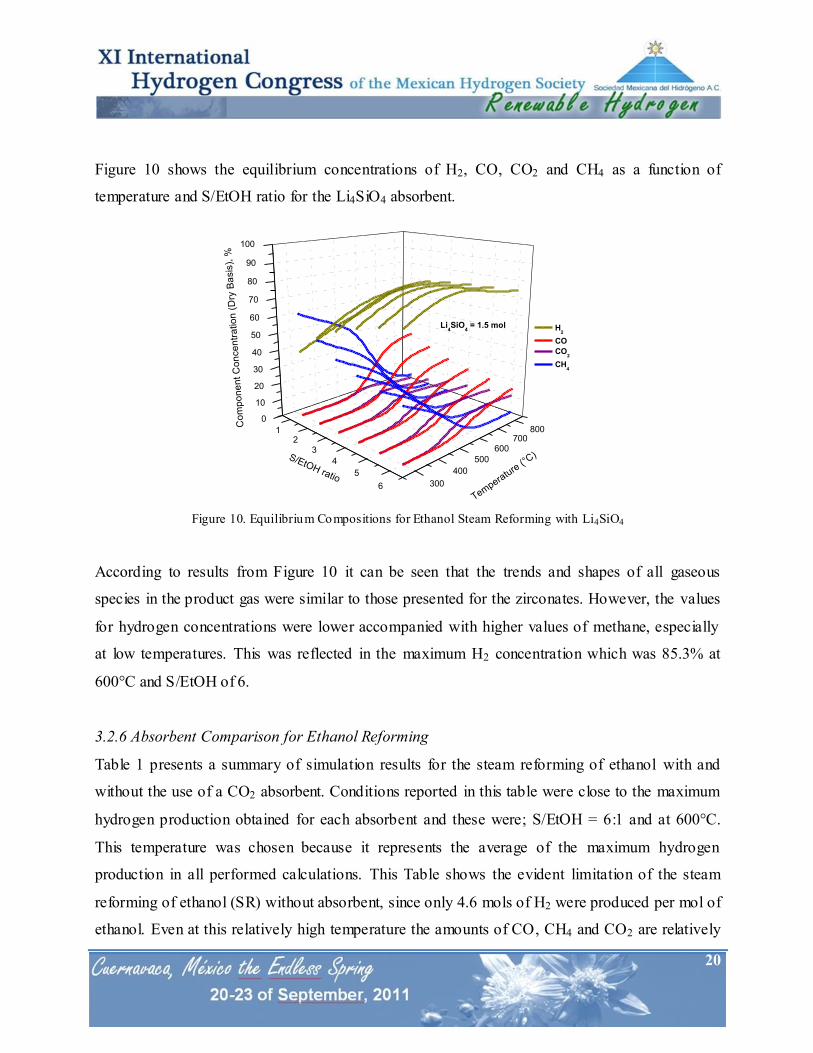
Figure 10 shows the equilibrium concentrations of H2, CO, CO2 and CH4 as a function of
temperature and S/EtOH ratio for the Li4SiO4 absorbent.
Figure 10. Equilibrium Compositions for Ethanol Steam Reforming with Li4SiO4
According to results from Figure 10 it can be seen that the trends and shapes of all gaseous
species in the product gas were similar to those presented for the zirconates. However, the values
for hydrogen concentrations were lower accompanied with higher values of methane, especially
at low temperatures. This was reflected in the maximum H2 concentration which was 85.3% at
600°C and S/EtOH of 6.
3.2.6 Absorbent Comparison for Ethanol Reforming
Table 1 presents a summary of simulation results for the steam reforming of ethanol with and
without the use of a CO2 absorbent. Conditions reported in this table were close to the maximum
hydrogen production obtained for each absorbent and these were; S/EtOH = 6:1 and at 600°C.
This temperature was chosen because it represents the average of the maximum hydrogen
production in all performed calculations. This Table shows the evident limitation of the steam
reforming of ethanol (SR) without absorbent, since only 4.6 mols of H2 were produced per mol of
ethanol. Even at this relatively high temperature the amounts of CO, CH4 and CO2 are relatively
12
3
4
5
6
0
10
20
30
40
50
60
70
80
90
100
300
400
500
600700
800
Li4SiO
4 = 1.5 mol H
2
CO
CO2
CH4
Co
mp
on
en
t C
on
ce
ntr
atio
n (
Dry
Ba
sis
), %
Tempera
ture
(°C)S/EtOH ratio
21
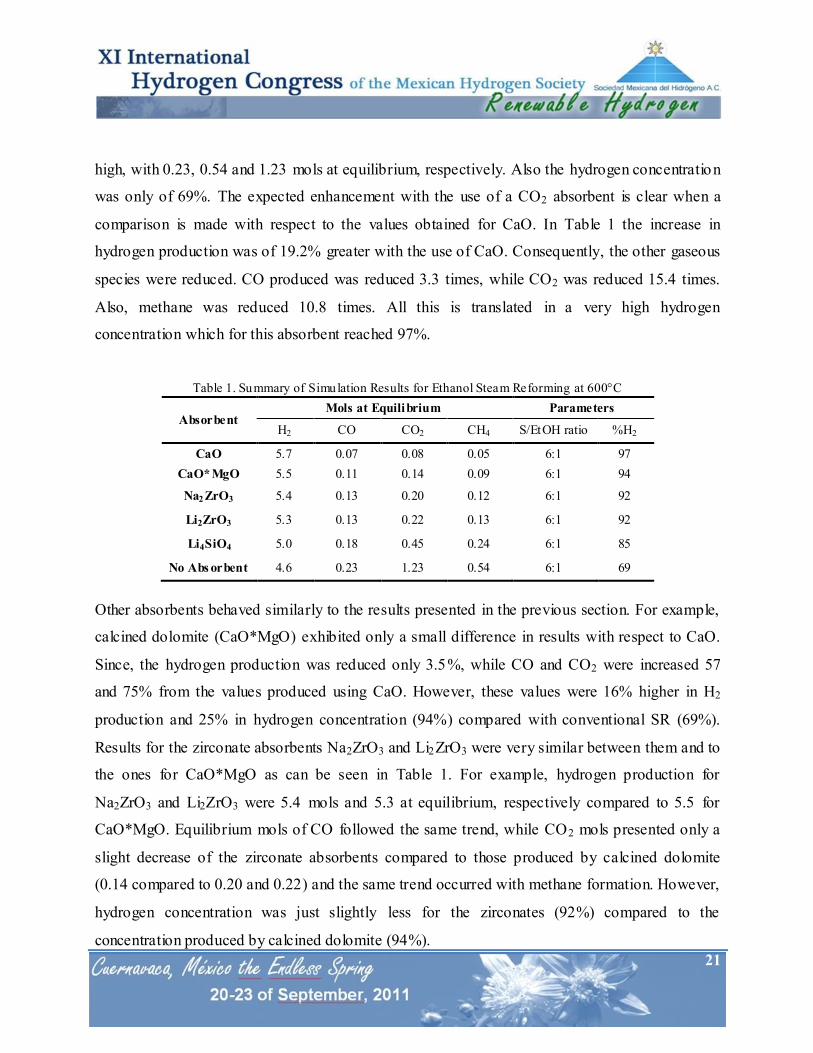
high, with 0.23, 0.54 and 1.23 mols at equilibrium, respectively. Also the hydrogen concentration
was only of 69%. The expected enhancement with the use of a CO2 absorbent is clear when a
comparison is made with respect to the values obtained for CaO. In Table 1 the increase in
hydrogen production was of 19.2% greater with the use of CaO. Consequently, the other gaseous
species were reduced. CO produced was reduced 3.3 times, while CO2 was reduced 15.4 times.
Also, methane was reduced 10.8 times. All this is translated in a very high hydrogen
concentration which for this absorbent reached 97%.
Table 1. Summary of Simulation Results for Ethanol Steam Reforming at 600°C
Absorbent Mols at Equilibrium Parameters
H2 CO CO2 CH4 S/EtOH ratio %H2
CaO 5.7 0.07 0.08 0.05 6:1 97
CaO*MgO 5.5 0.11 0.14 0.09 6:1 94
Na2 ZrO3 5.4 0.13 0.20 0.12 6:1 92
Li2ZrO3 5.3 0.13 0.22 0.13 6:1 92
Li4SiO4 5.0 0.18 0.45 0.24 6:1 85
No Abs orbent 4.6 0.23 1.23 0.54 6:1 69
Other absorbents behaved similarly to the results presented in the previous section. For example,
calcined dolomite (CaO*MgO) exhibited only a small difference in results with respect to CaO.
Since, the hydrogen production was reduced only 3.5%, while CO and CO2 were increased 57
and 75% from the values produced using CaO. However, these values were 16% higher in H2
production and 25% in hydrogen concentration (94%) compared with conventional SR (69%).
Results for the zirconate absorbents Na2ZrO3 and Li2ZrO3 were very similar between them and to
the ones for CaO*MgO as can be seen in Table 1. For example, hydrogen production for
Na2ZrO3 and Li2ZrO3 were 5.4 mols and 5.3 at equilibrium, respectively compared to 5.5 for
CaO*MgO. Equilibrium mols of CO followed the same trend, while CO2 mols presented only a
slight decrease of the zirconate absorbents compared to those produced by calcined dolomite
(0.14 compared to 0.20 and 0.22) and the same trend occurred with methane formation. However,
hydrogen concentration was just slightly less for the zirconates (92%) compared to the
concentration produced by calcined dolomite (94%).
22
Finally, Li4SiO4 was the absorbent that produced the lowest hydrogen production and higher by
product concentrations (CO, CO2 and CH4). This was translated in a lower hydrogen
concentration of only 85%. This behavior can be attributed to the thermodynamic nature of this
absorbent. For example, if the Gibbs free energy of carbonation at 600°C is compared between
the zirconates and the lithium orthosilicate, there exists a significant difference with values of -
24.6 and -23.5 kJ/mol for Na2ZrO3 and Li2ZrO3, respectively to a value of -12.5 kJ/mol for
Li4SiO4.
Therefore, a crucial feature within the hydrogen production through the absorption enhanced
reforming (AER) of ethanol and/or methanol resides in nature of the CO2 solid absorbent, which
apart from favorable thermodynamics, must present adequate absorption capacity and fast
absorption-regeneration kinetics. Several researches have focused their studies in the effects of
pressure, temperature and gas reactant composition on absorbents based on calcium oxide (CaO)
using the thermogravimetric (TGA) experimental technique [27, 28]. However, sintering of these
materials reduce their performance after several absorption-regeneration cycles. Calcined
dolomite (CaO*MgO) have shown to better perform in CO2 absorption at high temperatures
compared to CaO in multicycle tests [28]. Unfortunately, this mineral origin absorbent requires
high regeneration temperatures (T ≥ 950 °C) that produce degradation of the material after 10
absorption-regeneration cycles. Bandi et al. [29] proposed the use of the mineral huntite
(Mg3Ca(CO3)4) exhibiting good regeneration performance. However, this absorbent has several
disadvantages such as: a high regeneration temperature and low CO2 capacity. Also of mineral
origin the Mg6Al2(CO3)(OH)16*4H2O hydrotalcite was proposed by Hufton et al. [30] and Ding
and Alpay [31] which used this CO2 adsorbent at moderate temperatures (400-500 °C) resulting
in low adsorption capacity.
Studies from López Ortiz et al., [12] have shown the superior performance of Na2ZrO3 as an
alternate synthetic CO2 solid absorbent compared to expensive lithium-base absorbents (Li2ZrO3
23
and Li4SiO4) (Nakagawa and Ohashi [32] and Kato et al, [33]). This behavior was attributed on
its excellent thermal stability, kinetics and CO2 capture capacity features.
Recently, Ochoa Fernandez et al., [34] have experimentally evaluated several synthetic CO2
absorbents, under the AER of methane reaction scheme, such as: Li2ZrO3, LiSiO4 and Na2ZrO3
and concluded that Na2ZrO3 is the one that better performed towards high methane conversions,
hydrogen purity and reaction kinetics. Furthermore, Jakobsen and Halmøy [35] performed a
reactor modeling of the sorption enhanced steam methane reforming us ing CaO, Li4SiO4 and
Na2ZrO3 and also concluded that Na2ZrO3 is the most efficient absorbent with the highest
hydrogen production ratio (92.6%) compared to CaO (79.3%) and Li4SiO4 (82.1%) at the same
reaction conditions in a temperature range from 600°C to 800°C.
Therefore, from the above presented thermodynamic analysis of the absorption enhanced ethanol
reforming it can be concluded that Na2ZrO3 is a promising alternate absorbent with comparable
thermodynamics and greater kinetics and stability. Modeling results agreed with experimental
evaluation of ethanol reforming using CaO*MgO, and Na2ZrO3.
3.3 Methanol Steam Reforming System
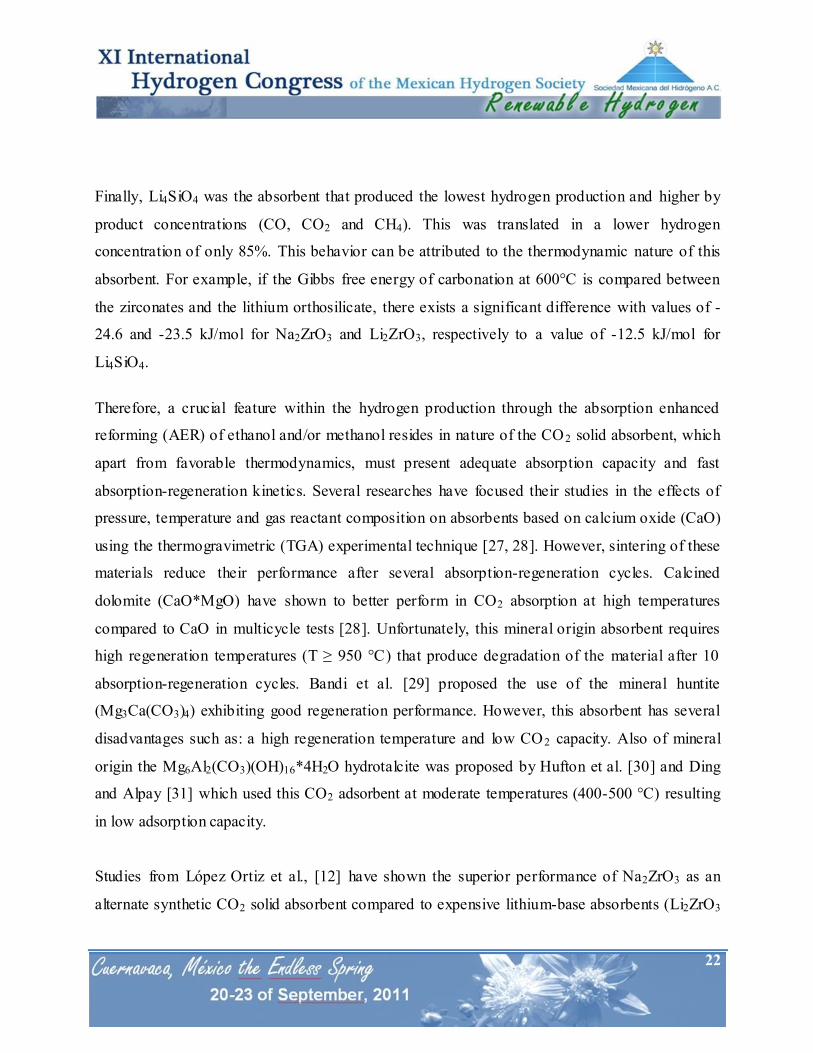
3.3.1 Gas Product Distribution without Absorbent Figure 11 shows the equilibrium hydrogen production ratio (HR) and H2 concentration (%) as a
function of temperature (350-800°C) and S/MeOH ratio (1-6). In this Figure it can be seen that a
maximum of 2.22 HR was reached at 725°C and S/MeOH of 1 (stoichiometric condition) As the
S/MeOH is increased from 1 to 6 the HR also raised towards values located at lower temperatures.
For example, a maximum of 2.76 HR was achieved at 595°C and S/MeOH of 6.
This behavior, as in the case of the ethanol reforming, can be explained by the promotion of the
methanation reactions at low temperatures (300-500°C). On the other hand, at stoichiometric
conditions (S/MeOH = 1), a maximum hydrogen concentration of 69% was reached at 731°C.
24
Again, the increase in S/MeOH ratio resulted in higher hydrogen concentrations at lower
temperatures. Since a value of 73% was reached at 576°C and a S/MeOH of 6.
Figure 11. Equilibrium HR and H2 for Methanol Steam Reforming
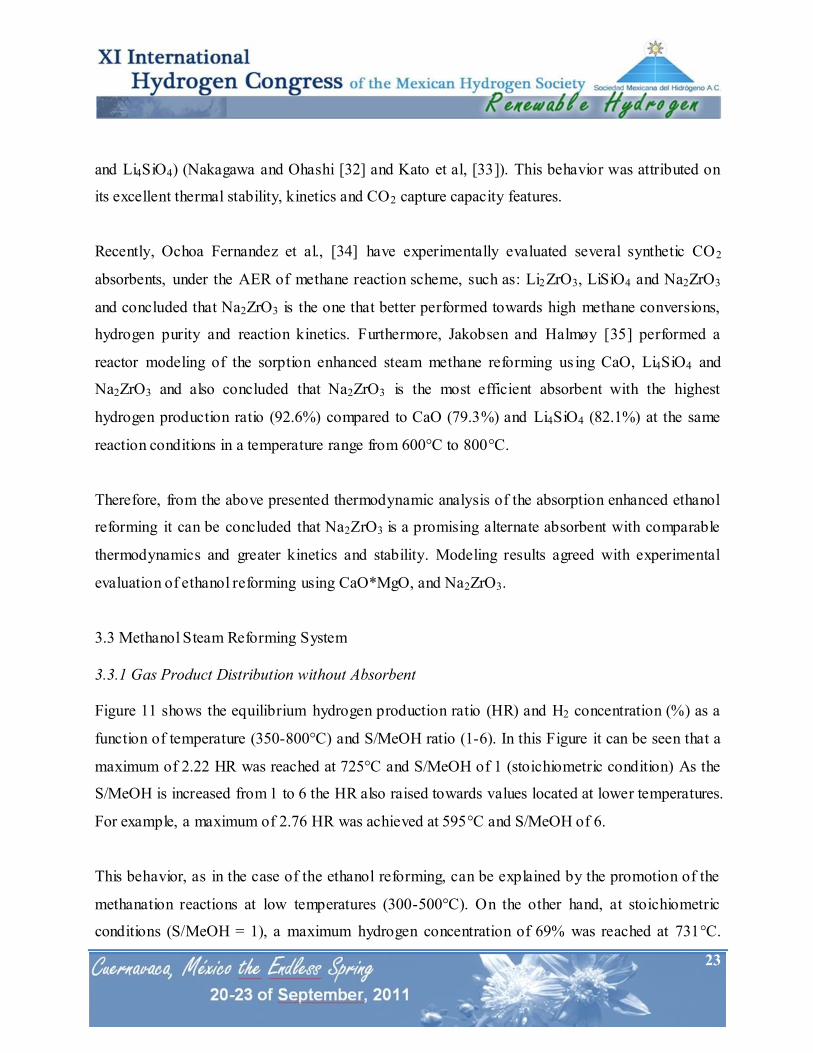
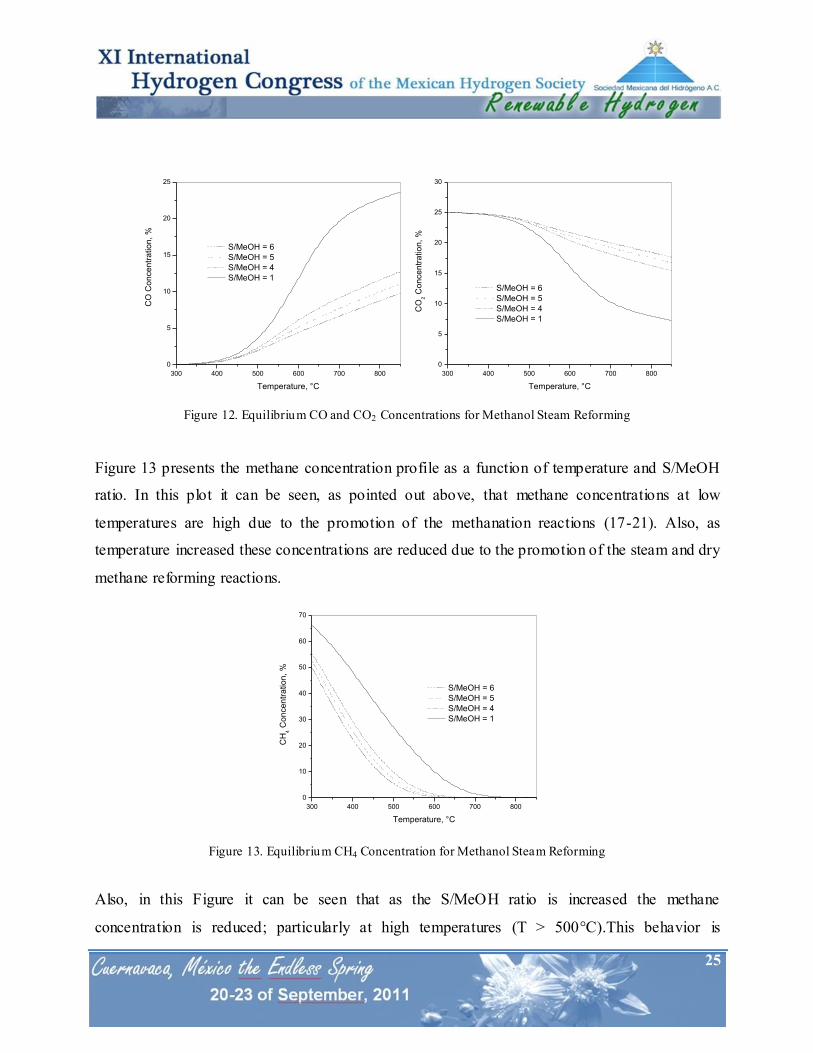
Figure 12 depicts the carbon oxide equilibrium compositions for methanol reforming. In this
Figure it can be seen that CO is produced at relatively small concentrations at low temperatures
(300-500°C) and as temperature increases CO concentrations also is raised and can be as high as
19.6% at 700°C and S/MeOH ratio of 6. CO production at high temperature is generated through
the dry reforming and steam reforming reactions, reverse reactions (17) and (20), respectively.
That is the reason why the CO concentration is increased at high temperatures (T > 500°C), while
CO2 and CH4 concentrations are lowered in this particular region. Also, in this Figure it can be
seen that a low level of 50 ppm of CO never is reached within the generated data, since the
lowest possible CO concentration is 0.032% which represents a value of 327 ppm of CO at
300°C and S/MeOH ratio of 6:1. Also in this Figure the CO2 concentration is high at relatively
low temperatures (300-500°C). This is due to the methanation reaction (17), which favors the
production of CO2 and methane at low temperatures. Also, as temperature is increased CO2 is
reduced due to the dry reforming reaction (reverse reaction 17) and to the fact that the WGS is no
longer favorable at these conditions.
300 400 500 600 700 800
0
10
20
30
40
50
60
70
80
Hyd
rog
en
Co
nce
ntr
atio
n, %
, d
ry b
asis
Temperature, °C
S/MeOH = 6
S/MeOH = 5
S/MeOH = 4
S/MeOH = 1
300 400 500 600 700 800
0.0
0.5
1.0
1.5
2.0
2.5
3.0
Hyd
rog
en
Pro
du
ctio
n R
ate
(H
R)
Temperature, °C
S/MeOH = 6
S/MeOH = 5
S/MeOH = 4
S/MeOH = 1
25
300 400 500 600 700 800
0
10
20
30
40
50
60
70
CH
4 C
on
ce
ntr
atio
n, %
Temperature, °C
S/MeOH = 6
S/MeOH = 5
S/MeOH = 4
S/MeOH = 1
Figure 12. Equilibrium CO and CO2 Concentrations for Methanol Steam Reforming
Figure 13 presents the methane concentration profile as a function of temperature and S/MeOH
ratio. In this plot it can be seen, as pointed out above, that methane concentrations at low
temperatures are high due to the promotion of the methanation reactions (17-21). Also, as
temperature increased these concentrations are reduced due to the promotion of the steam and dry
methane reforming reactions.
Figure 13. Equilibrium CH4 Concentration for Methanol Steam Reforming
Also, in this Figure it can be seen that as the S/MeOH ratio is increased the methane
concentration is reduced; particularly at high temperatures (T > 500°C).This behavior is
300 400 500 600 700 800
0
5
10
15
20
25
CO
Co
nce
ntr
atio
n, %
Temperature, °C
S/MeOH = 6
S/MeOH = 5
S/MeOH = 4
S/MeOH = 1
300 400 500 600 700 800
0
5
10
15
20
25
30
CO
2 C
on
ce
ntr
atio
n, %
Temperature, °C
S/MeOH = 6
S/MeOH = 5
S/MeOH = 4
S/MeOH = 1
26
consistent with the fact that a higher steam concentration will favor the steam methane reforming
reaction towards a higher production of H2 and CO2.
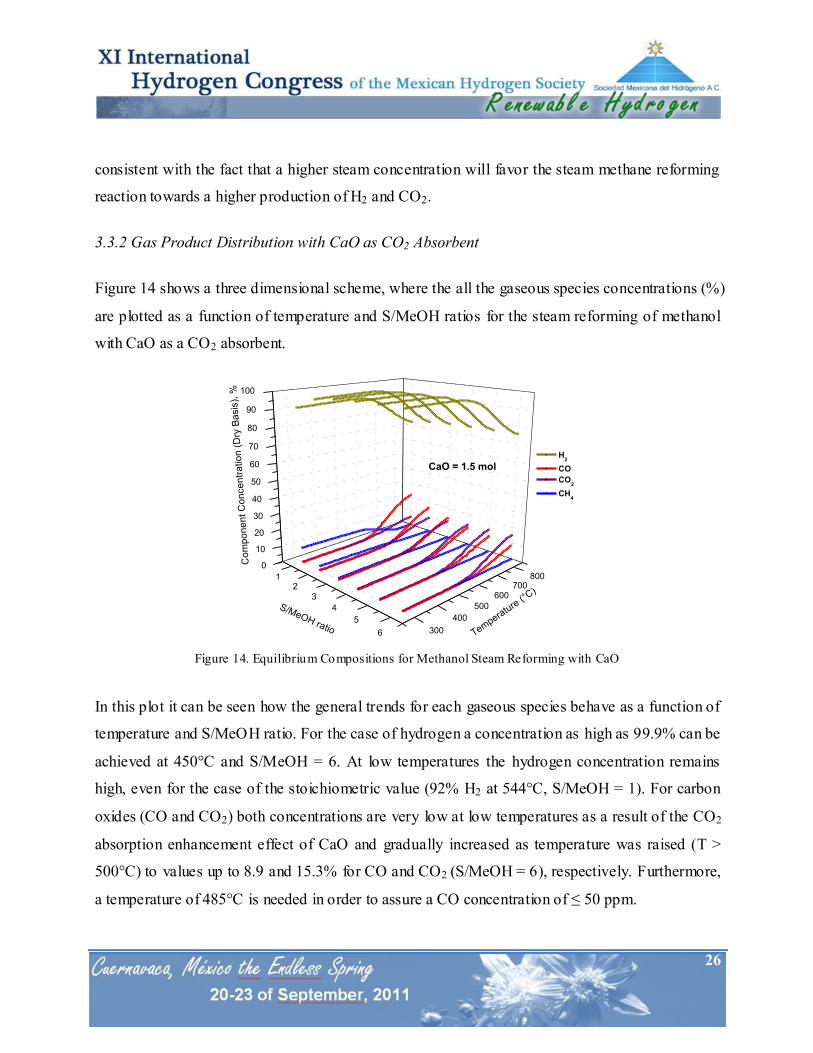
3.3.2 Gas Product Distribution with CaO as CO2 Absorbent
Figure 14 shows a three dimensional scheme, where the all the gaseous species concentrations (%)
are plotted as a function of temperature and S/MeOH ratios for the steam reforming of methanol
with CaO as a CO2 absorbent.
Figure 14. Equilibrium Compositions for Methanol Steam Reforming with CaO
In this plot it can be seen how the general trends for each gaseous species behave as a function of
temperature and S/MeOH ratio. For the case of hydrogen a concentration as high as 99.9% can be
achieved at 450°C and S/MeOH = 6. At low temperatures the hydrogen concentration remains
high, even for the case of the stoichiometric value (92% H2 at 544°C, S/MeOH = 1). For carbon
oxides (CO and CO2) both concentrations are very low at low temperatures as a result of the CO2
absorption enhancement effect of CaO and gradually increased as temperature was raised (T >
500°C) to values up to 8.9 and 15.3% for CO and CO2 (S/MeOH = 6), respectively. Furthermore,
a temperature of 485°C is needed in order to assure a CO concentration of ≤ 50 ppm.
12
3
4
5
6
0
10
20
30
40
50
60
70
80
90
100
300
400
500
600700
800
H2
CO
CO2
CH4
Co
mp
on
en
t C
on
ce
ntr
atio
n (
Dry
Ba
sis
), %
Tempera
ture
(°C)
S/MeOH ratio
CaO = 1.5 mol
27
In Figure 14 it is clear that the only significant contaminant of the product gas at low
temperatures is methane and this decreased as the temperature and S/MeOH ratio also increased,
thus enhancing the steam reforming reaction. Greater values of S/MeOH = 2 will insure very low
CH4 concentrations (less than 1%) in all the temperature range studied (300-850°C).
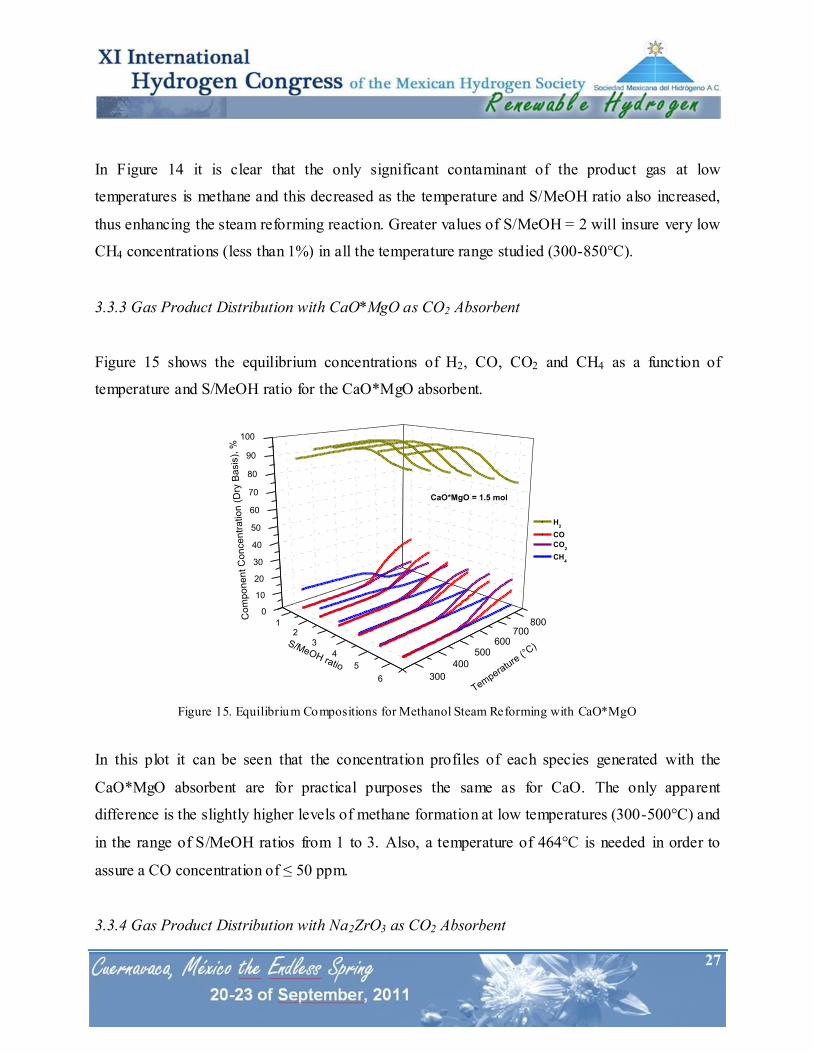
3.3.3 Gas Product Distribution with CaO*MgO as CO2 Absorbent
Figure 15 shows the equilibrium concentrations of H2, CO, CO2 and CH4 as a function of
temperature and S/MeOH ratio for the CaO*MgO absorbent.
Figure 15. Equilibrium Compositions for Methanol Steam Reforming with CaO*MgO
In this plot it can be seen that the concentration profiles of each species generated with the
CaO*MgO absorbent are for practical purposes the same as for CaO. The only apparent
difference is the slightly higher levels of methane formation at low temperatures (300-500°C) and
in the range of S/MeOH ratios from 1 to 3. Also, a temperature of 464°C is needed in order to
assure a CO concentration of ≤ 50 ppm.
3.3.4 Gas Product Distribution with Na2ZrO3 as CO2 Absorbent
12
3
4
5
6
0
10
20
30
40
50
60
70
80
90
100
300
400
500600
700800
CaO*MgO = 1.5 mol
H2
CO
CO2
CH4
Co
mp
on
en
t C
on
ce
ntr
atio
n (
Dry
Ba
sis
), %
Tempera
ture
(°C)S/MeOH ratio
28
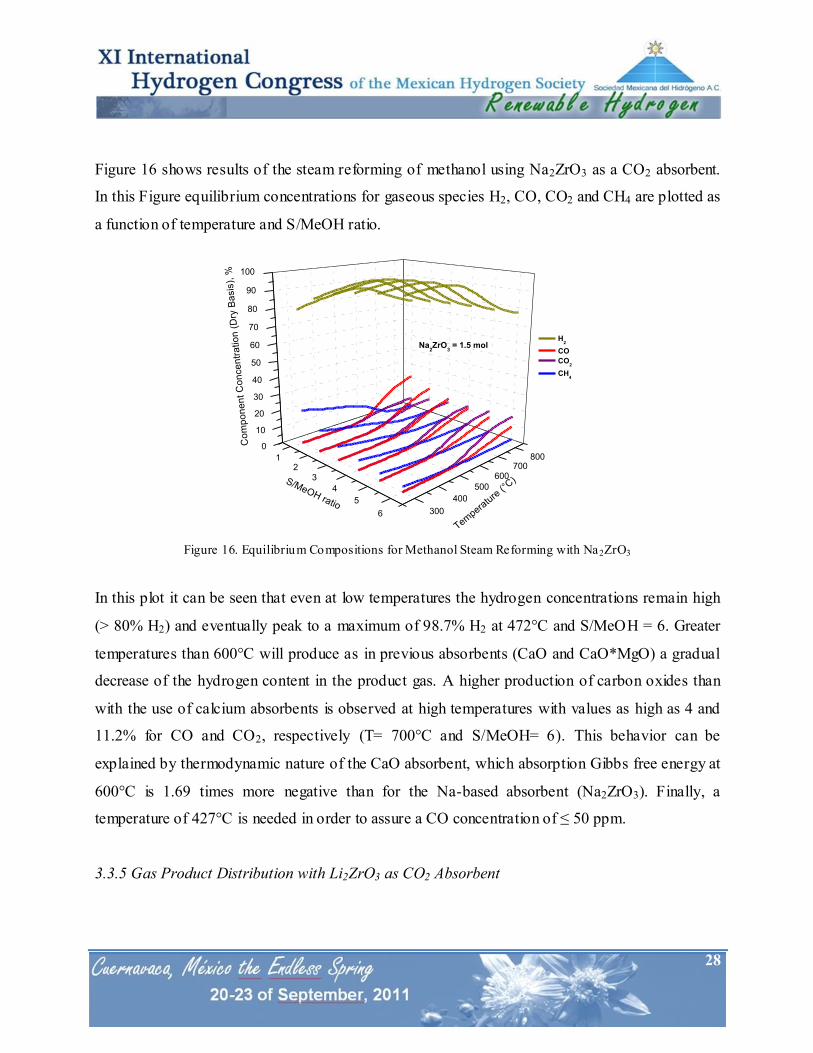
Figure 16 shows results of the steam reforming of methanol using Na2ZrO3 as a CO2 absorbent.
In this Figure equilibrium concentrations for gaseous species H2, CO, CO2 and CH4 are plotted as
a function of temperature and S/MeOH ratio.
Figure 16. Equilibrium Compositions for Methanol Steam Reforming with Na2ZrO3
In this plot it can be seen that even at low temperatures the hydrogen concentrations remain high
(> 80% H2) and eventually peak to a maximum of 98.7% H2 at 472°C and S/MeOH = 6. Greater
temperatures than 600°C will produce as in previous absorbents (CaO and CaO*MgO) a gradual
decrease of the hydrogen content in the product gas. A higher production of carbon oxides than
with the use of calcium absorbents is observed at high temperatures with values as high as 4 and
11.2% for CO and CO2, respectively (T= 700°C and S/MeOH= 6). This behavior can be
explained by thermodynamic nature of the CaO absorbent, which absorption Gibbs free energy at
600°C is 1.69 times more negative than for the Na-based absorbent (Na2ZrO3). Finally, a
temperature of 427°C is needed in order to assure a CO concentration of ≤ 50 ppm.
3.3.5 Gas Product Distribution with Li2ZrO3 as CO2 Absorbent
12
3
4
5
6
0
10
20
30
40
50
60
70
80
90
100
300
400
500
600700
800
H2
CO
CO2
CH4
Co
mp
on
en
t C
on
ce
ntr
atio
n (
Dry
Ba
sis
), %
Tempera
ture
(°C)S/MeOH ratio
Na2ZrO
3 = 1.5 mol
29
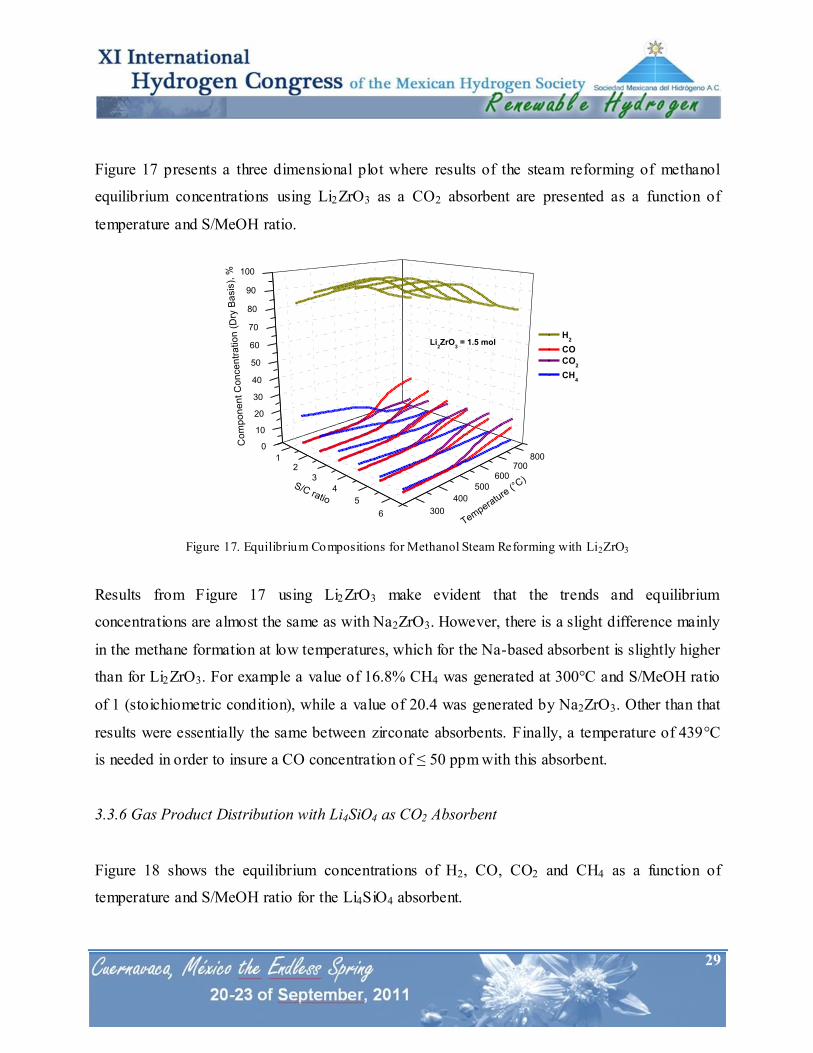
Figure 17 presents a three dimensional plot where results of the steam reforming of methanol
equilibrium concentrations using Li2ZrO3 as a CO2 absorbent are presented as a function of
temperature and S/MeOH ratio.
Figure 17. Equilibrium Compositions for Methanol Steam Reforming with Li2ZrO3
Results from Figure 17 using Li2ZrO3 make evident that the trends and equilibrium
concentrations are almost the same as with Na2ZrO3. However, there is a slight difference mainly
in the methane formation at low temperatures, which for the Na-based absorbent is slightly higher
than for Li2ZrO3. For example a value of 16.8% CH4 was generated at 300°C and S/MeOH ratio
of 1 (stoichiometric condition), while a value of 20.4 was generated by Na2ZrO3. Other than that
results were essentially the same between zirconate absorbents. Finally, a temperature of 439°C
is needed in order to insure a CO concentration of ≤ 50 ppm with this absorbent.
3.3.6 Gas Product Distribution with Li4SiO4 as CO2 Absorbent
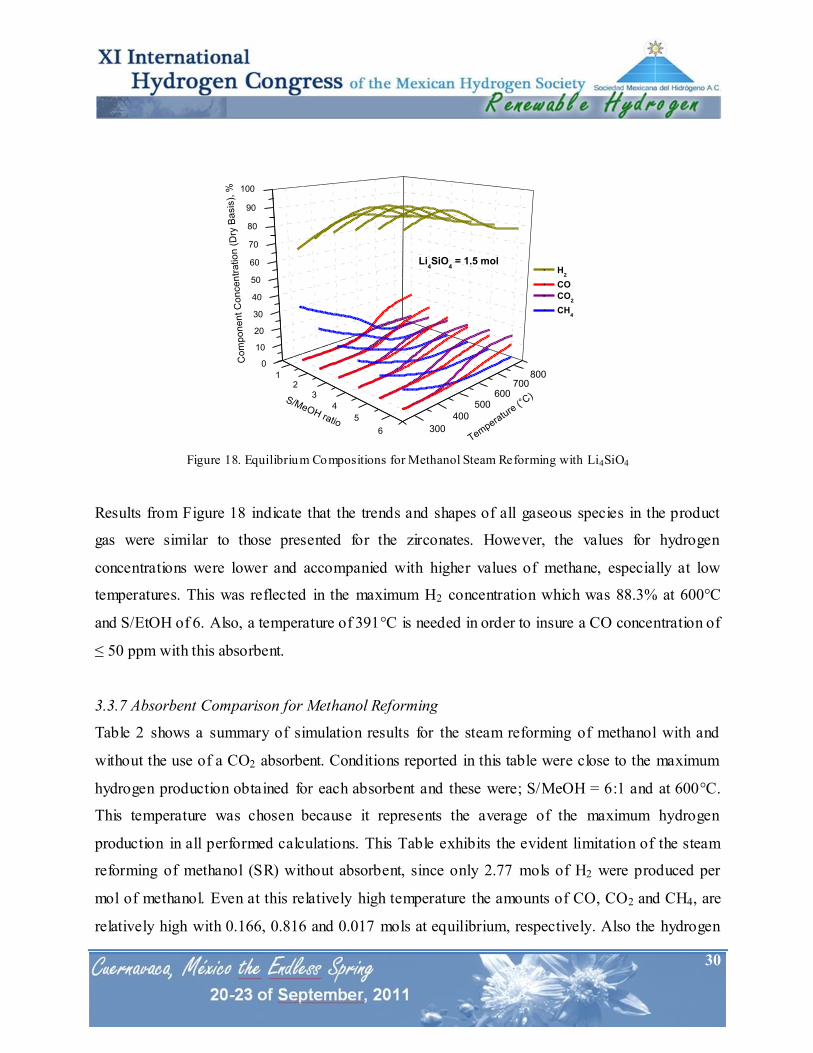
Figure 18 shows the equilibrium concentrations of H2, CO, CO2 and CH4 as a function of
temperature and S/MeOH ratio for the Li4SiO4 absorbent.
12
3
4
5
6
0
10
20
30
40
50
60
70
80
90
100
300
400
500
600700
800
Li2ZrO
3 = 1.5 mol
H2
CO
CO2
CH4
Co
mp
on
en
t C
on
ce
ntr
atio
n (
Dry
Ba
sis
), %
Tempera
ture
(°C)
S/C ratio
30
Figure 18. Equilibrium Compositions for Methanol Steam Reforming with Li4SiO4
Results from Figure 18 indicate that the trends and shapes of all gaseous species in the product
gas were similar to those presented for the zirconates. However, the values for hydrogen
concentrations were lower and accompanied with higher values of methane, especially at low
temperatures. This was reflected in the maximum H2 concentration which was 88.3% at 600°C
and S/EtOH of 6. Also, a temperature of 391°C is needed in order to insure a CO concentration of
≤ 50 ppm with this absorbent.
3.3.7 Absorbent Comparison for Methanol Reforming
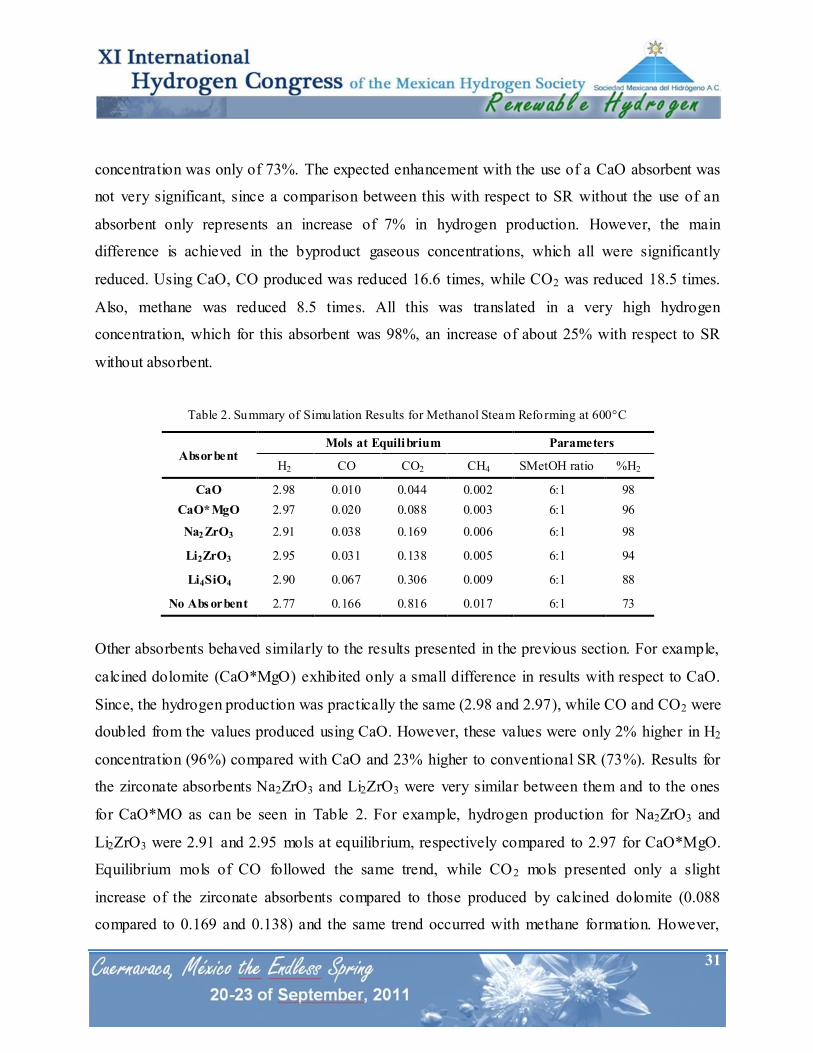
Table 2 shows a summary of simulation results for the steam reforming of methanol with and
without the use of a CO2 absorbent. Conditions reported in this table were close to the maximum
hydrogen production obtained for each absorbent and these were; S/MeOH = 6:1 and at 600°C.
This temperature was chosen because it represents the average of the maximum hydrogen
production in all performed calculations. This Table exhibits the evident limitation of the steam
reforming of methanol (SR) without absorbent, since only 2.77 mols of H2 were produced per
mol of methanol. Even at this relatively high temperature the amounts of CO, CO2 and CH4, are
relatively high with 0.166, 0.816 and 0.017 mols at equilibrium, respectively. Also the hydrogen
12
3
4
5
6
0
10
20
30
40
50
60
70
80
90
100
300
400
500600
700800
Li4SiO
4 = 1.5 mol
H2
CO
CO2
CH4
Co
mp
on
en
t C
on
ce
ntr
atio
n (
Dry
Ba
sis
), %
Tempera
ture
(°C)S/MeOH ratio
31
concentration was only of 73%. The expected enhancement with the use of a CaO absorbent was
not very significant, since a comparison between this with respect to SR without the use of an
absorbent only represents an increase of 7% in hydrogen production. However, the main
difference is achieved in the byproduct gaseous concentrations, which all were significantly
reduced. Using CaO, CO produced was reduced 16.6 times, while CO2 was reduced 18.5 times.
Also, methane was reduced 8.5 times. All this was translated in a very high hydrogen
concentration, which for this absorbent was 98%, an increase of about 25% with respect to SR
without absorbent.
Table 2. Summary of Simulation Results for Methanol Steam Reforming at 600°C
Absorbent Mols at Equilibrium Parameters
H2 CO CO2 CH4 SMetOH ratio %H2
CaO 2.98 0.010 0.044 0.002 6:1 98
CaO*MgO 2.97 0.020 0.088 0.003 6:1 96
Na2 ZrO3 2.91 0.038 0.169 0.006 6:1 98
Li2ZrO3 2.95 0.031 0.138 0.005 6:1 94
Li4SiO4 2.90 0.067 0.306 0.009 6:1 88
No Abs orbent 2.77 0.166 0.816 0.017 6:1 73
Other absorbents behaved similarly to the results presented in the previous section. For example,
calcined dolomite (CaO*MgO) exhibited only a small difference in results with respect to CaO.
Since, the hydrogen production was practically the same (2.98 and 2.97), while CO and CO2 were
doubled from the values produced using CaO. However, these values were only 2% higher in H2
concentration (96%) compared with CaO and 23% higher to conventional SR (73%). Results for
the zirconate absorbents Na2ZrO3 and Li2ZrO3 were very similar between them and to the ones
for CaO*MO as can be seen in Table 2. For example, hydrogen production for Na2ZrO3 and
Li2ZrO3 were 2.91 and 2.95 mols at equilibrium, respectively compared to 2.97 for CaO*MgO.
Equilibrium mols of CO followed the same trend, while CO2 mols presented only a slight
increase of the zirconate absorbents compared to those produced by calcined dolomite (0.088
compared to 0.169 and 0.138) and the same trend occurred with methane formation. However,
32
hydrogen concentration was just slightly lower for the Na2ZrO3 (98%) compared to the
concentration produced by calcined dolomite (96%) and Li2ZrO3 (94%).
Similarly to the case of ethanol reforming, methanol reforming using Li4SiO4 produced the
lowest hydrogen production and higher byproduct concentrations (CO, CO2 and CH4). This was
translated in a lower hydrogen concentration of only 88%. This behavior can be attributed to the
limited thermodynamic nature of this absorbent as pointed out before in the ethanol reforming
section.
Hence, from the above thermodynamic analysis for the absorption enhanced methanol reforming
it can be concluded that Na2ZrO3 and Li2ZrO3 are both promising alternate absorbents with
comparable thermodynamics to CaO based absorbent. However, greater kinetics and stability can
be achieved with the use of Na2ZrO3 [12]. Recent experimental results dealing with conventional
methanol steam reforming have used Cu-based catalyst [36, 37] and therefore, there is the chance
to suppress CH4 over this catalyst. However, it is well known that Cu-based catalysts suffer from
deactivation due sintering of the active Cu at the high operating temperatures (450-600°C) of the
AER process. Therefore, other materials such as Ni-based catalysts can be used in the AER of
methanol, as reported by Lysikov et al. [38].
3.4 Carbon Formation
3.4.1 Carbon Formation for the Ethanol Reforming System
Figure 19 shows the effect of steam to ethanol molar ratios and temperature on the number of
moles of carbon (graphite) produced in the steam reforming of ethanol (SR) and through AER
using all the absorbents studied in the present work. In this plot the maximum amount of carbon
produced is plotted as a function of the S/EtOH ratio from 0 to 1. In each data point the
temperature where the maximum carbon formation was found is specified. Also, in this plot there
is a table where the minimum temperature reached without carbon formation is depicted as a
function of the type of CO2 absorbent. The temperature in this table can be defined as the
33
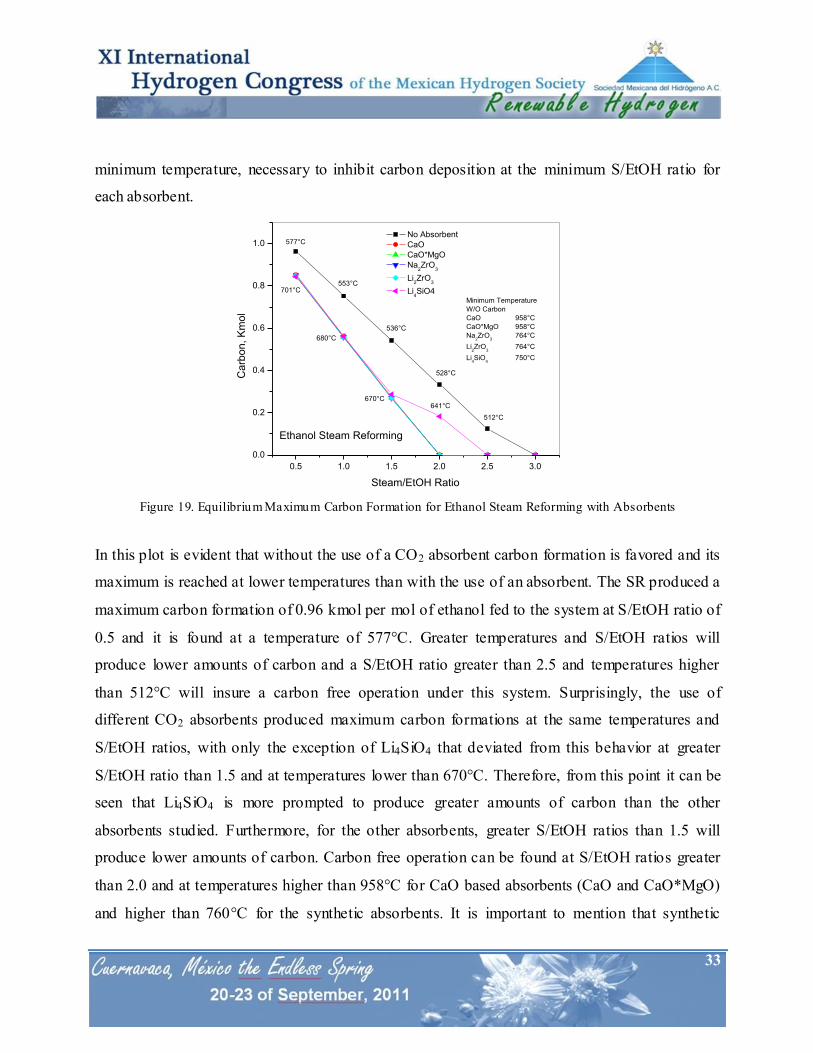
minimum temperature, necessary to inhibit carbon deposition at the minimum S/EtOH ratio for
each absorbent.
Figure 19. Equilibrium Maximum Carbon Format ion for Ethanol Steam Reforming with Absorbents
In this plot is evident that without the use of a CO2 absorbent carbon formation is favored and its
maximum is reached at lower temperatures than with the use of an absorbent. The SR produced a
maximum carbon formation of 0.96 kmol per mol of ethanol fed to the system at S/EtOH ratio of
0.5 and it is found at a temperature of 577°C. Greater temperatures and S/EtOH ratios will
produce lower amounts of carbon and a S/EtOH ratio greater than 2.5 and temperatures higher
than 512°C will insure a carbon free operation under this system. Surprisingly, the use of
different CO2 absorbents produced maximum carbon formations at the same temperatures and
S/EtOH ratios, with only the exception of Li4SiO4 that deviated from this behavior at greater
S/EtOH ratio than 1.5 and at temperatures lower than 670°C. Therefore, from this point it can be
seen that Li4SiO4 is more prompted to produce greater amounts of carbon than the other
absorbents studied. Furthermore, for the other absorbents, greater S/EtOH ratios than 1.5 will
produce lower amounts of carbon. Carbon free operation can be found at S/EtOH ratios greater
than 2.0 and at temperatures higher than 958°C for CaO based absorbents (CaO and CaO*MgO)
and higher than 760°C for the synthetic absorbents. It is important to mention that synthetic
0.5 1.0 1.5 2.0 2.5 3.0
0.0
0.2
0.4
0.6
0.8
1.0
Minimum Temperature
W/O Carbon
CaO 958°C
CaO*MgO 958°C
Na2ZrO
3764°C
Li2ZrO
3764°C
Li4SiO
4750°C
641°C670°C
680°C
701°C
512°C
528°C
536°C
553°C
Ca
rbo
n, K
mo
l
Steam/EtOH Ratio
No Absorbent
CaO
CaO*MgO
Na2ZrO
3
Li2ZrO
3
Li4SiO4
Ethanol Steam Reforming
577°C
34
absorbents (Na2ZrO3, Li2ZrO3 and Li4SiO4) have the tendency to present lower carbon free
operating temperatures than with the use of CaO-based absorbents. The behavior related to the
lower carbon formation found with the use of a CO2 absorbent (very low risk of carbon
formation), is directly related to the reduction in CO content. Li [39] confirmed in his
thermodynamic study, that graphite formation is suppressed with CO2 absorption. According to
this author, the Boudouard reaction:
2CO(g) = CO2(g) + C(s) ΔH°298 = -172.5 kJ/mol (22)
is shifted towards the reverse Boudouard reaction because its equilibrium constant is related to
the square of CO concentration.
3.4.2 Carbon Formation for the Methanol Reforming System
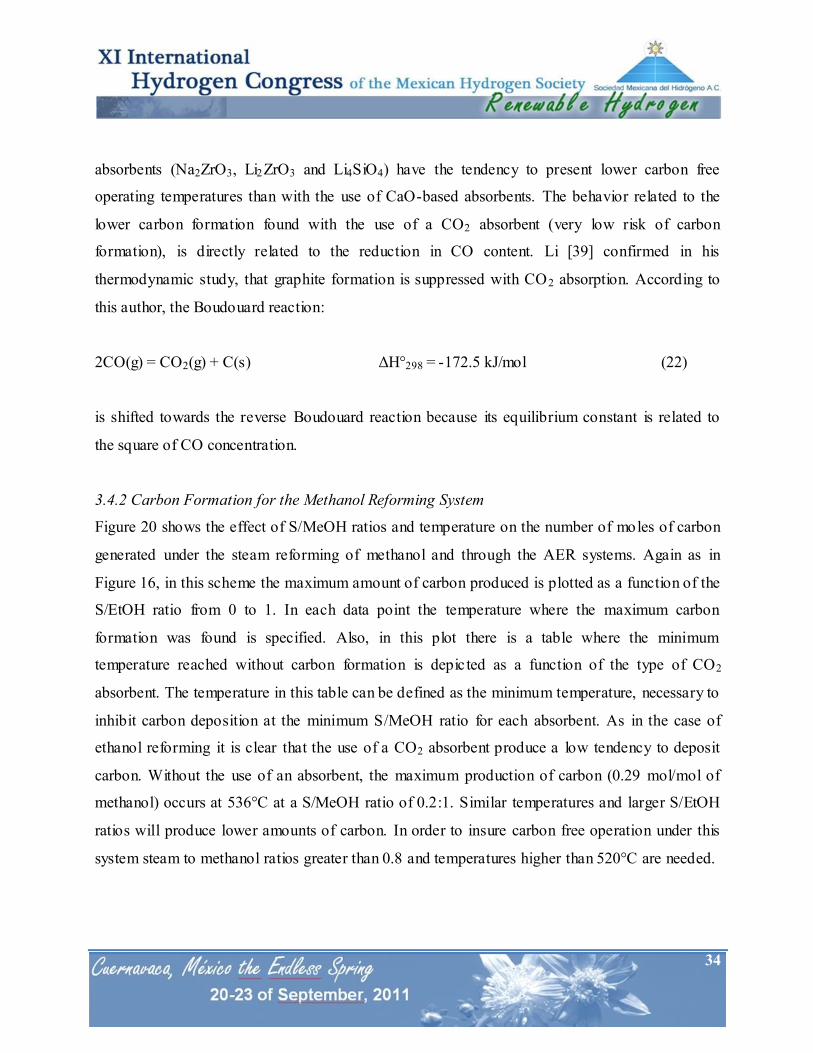
Figure 20 shows the effect of S/MeOH ratios and temperature on the number of moles of carbon
generated under the steam reforming of methanol and through the AER systems. Again as in
Figure 16, in this scheme the maximum amount of carbon produced is plotted as a function of the
S/EtOH ratio from 0 to 1. In each data point the temperature where the maximum carbon
formation was found is specified. Also, in this plot there is a table where the minimum
temperature reached without carbon formation is depic ted as a function of the type of CO2
absorbent. The temperature in this table can be defined as the minimum temperature, necessary to
inhibit carbon deposition at the minimum S/MeOH ratio for each absorbent. As in the case of
ethanol reforming it is clear that the use of a CO2 absorbent produce a low tendency to deposit
carbon. Without the use of an absorbent, the maximum production of carbon (0.29 mol/mol of
methanol) occurs at 536°C at a S/MeOH ratio of 0.2:1. Similar temperatures and larger S/EtOH
ratios will produce lower amounts of carbon. In order to insure carbon free operation under this
system steam to methanol ratios greater than 0.8 and temperatures higher than 520°C are needed.
35
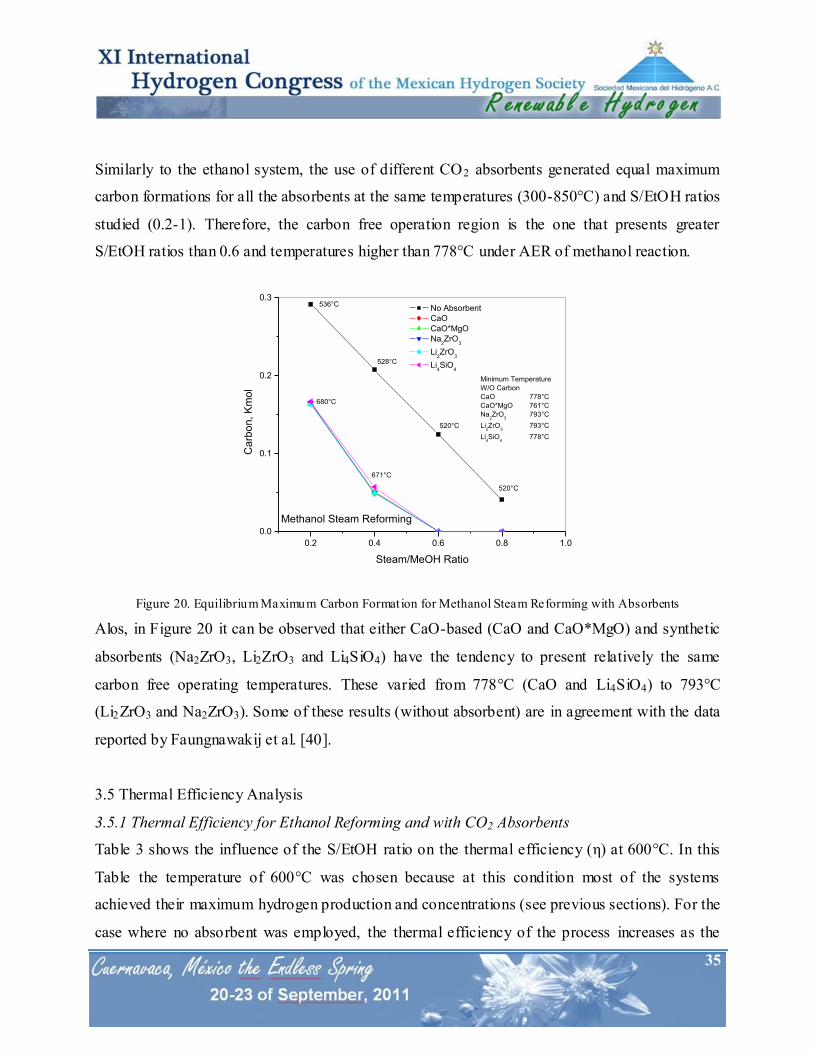
Similarly to the ethanol system, the use of different CO2 absorbents generated equal maximum
carbon formations for all the absorbents at the same temperatures (300-850°C) and S/EtOH ratios
studied (0.2-1). Therefore, the carbon free operation region is the one that presents greater
S/EtOH ratios than 0.6 and temperatures higher than 778°C under AER of methanol reaction.
Figure 20. Equilibrium Maximum Carbon Format ion for Methanol Steam Reforming with Absorbents
Alos, in Figure 20 it can be observed that either CaO-based (CaO and CaO*MgO) and synthetic
absorbents (Na2ZrO3, Li2ZrO3 and Li4SiO4) have the tendency to present relatively the same
carbon free operating temperatures. These varied from 778°C (CaO and Li4SiO4) to 793°C
(Li2ZrO3 and Na2ZrO3). Some of these results (without absorbent) are in agreement with the data
reported by Faungnawakij et al. [40].
3.5 Thermal Efficiency Analysis
3.5.1 Thermal Efficiency for Ethanol Reforming and with CO2 Absorbents
Table 3 shows the influence of the S/EtOH ratio on the thermal efficiency (η) at 600°C. In this
Table the temperature of 600°C was chosen because at this condition most of the systems
achieved their maximum hydrogen production and concentrations (see previous sections). For the
case where no absorbent was employed, the thermal efficiency of the process increases as the
0.2 0.4 0.6 0.8 1.0
0.0
0.1
0.2
0.3
671°C
680°C
520°C
520°C
528°C
Ca
rbo
n, K
mo
l
Steam/MeOH Ratio
No Absorbent
CaO
CaO*MgO
Na2ZrO
3
Li2ZrO
3
Li4SiO
4
Methanol Steam Reforming
536°C
Minimum Temperature
W/O Carbon
CaO 778°C
CaO*MgO 761°C
Na2ZrO
3793°C
Li2ZrO
3793°C
Li4SiO
4778°C
36
S/EtOH ratio also increases. However, as suggested by He et al. [18] the cost of the energy for
generating extra steam can be compensated by promoting hydrogen production in the reforming
process. For example at S/EtOH ratio of 5 the thermal efficiency is 64%, while an increase to 6
and produced an efficiency of 66.3%, which reflects the behavior above described. However, a
further increase in S/EtOH ratio to 6.5 only produced a marginal increase to 67% in thermal
efficiency. These values are in agreement with studies reported by Lima da Silva and Müller [8].
This above behavior was expected, since the one of the factors that has a great impact in the
thermal efficiency is the amount of hydrogen produced and a careful examination of Figure 1
reveals that also in that plot an increase in S/EtOH ratio from 5 to 6 and even to 6.5 produced
only a marginal increase in hydrogen production. Therefore, here it can be concluded that
S/EtOH = 6 and 600°C are a good choice of conditions where all the absorbents can be compared
in terms of thermal efficiency.
Table 3. Summary of Thermal Efficiency Results for Ethanol Steam Reforming at 600°C.
Absorbent S/EtOH Molar Rat io Thermal Efficiency (η, %)
No Absorbent
5 64.0
6 66.3
6.5 67.0
CaO
6 82.6
6.5 81.9
CaO*MgO 6 80.0
Na2ZrO3 6 78.3
Li2ZrO3 6 77.9
Li4SiO4 6 73.5
Also in Table 3 the values for the thermal efficiency for the AER of ethanol are reported for
every absorbent studied. The use of CaO produced a thermal efficiency of 82.6%, while an
increase in S/EtOH ratio of 6.5 slightly reduced its efficiency to a value of 81.9%. This means
37
that the amount of steam generated can eventually reduce the efficiency of the system, since not
only the gaseous species absorb the heat provided by the steam but the solid absorbent also takes
some of that heat. However, the advantage in the use of a CO2 absorbent (CaO) resulted in an
increase in thermal efficiency of 16.3%, which represents significant energy savings generated by
the AER process scheme. The use of calcined dolomite only reduced the thermal efficiency in 2%
with respect to CaO. This is understandable if it is considered that an inert (MgO) is used along
with the main absorbent compound (CaO). The same behavior is observed for Na2ZrO3, Li2ZrO3
and Li4SiO4, which were resulted in slightly lower efficiencies than CaO with values of 78.3,
77.9 and 73.5, respectively. The differences observed can be explained in terms of their
differences in regeneration temperatures, heats of reaction and regeneration and hydrogen
produced. Therefore, it is a complex combination of parameters that generates a specific thermal
efficiency. From the results of Table 3 it can be seen that the synthetic absorbent that better
performs in terms of thermal efficiency is Na2ZrO3, followed by Li2ZrO3 with a small difference,
while Li4SiO4 presented a limited thermal efficiency.
3.5.2 Thermal Efficiency for Methanol Reforming and with CO2 Absorbents
Table 4 presents results from calculations of the thermal efficiency (η) at 600°C at different
S/EtOH ratios. Again, here in this Table a temperature of 600°C was chosen because at this
condition most of the systems achieved their maximum hydrogen production and concentrations
(see previous sections). Without the use of absorbent the thermal efficiency increased as the
S/MeOH ratio also increased from 54% at S/MeOH of 1 (stoichiometric condition) to 67.5% at
S/MeOH of 4. A further increase in S/MeOH ratio resulted in a decrease in thermal efficiency to
values of 65.5 and 62.9% for S/MeOH ratios of 5 and 6, respectively. These results are in
agreement with reported data by He et al. [25] and Lima da Silva and Müller [8]. Therefore an
optimal S/MeOH ratio of 4 was employed for comparing the effect of each absorbent on the
thermal efficiency.
38
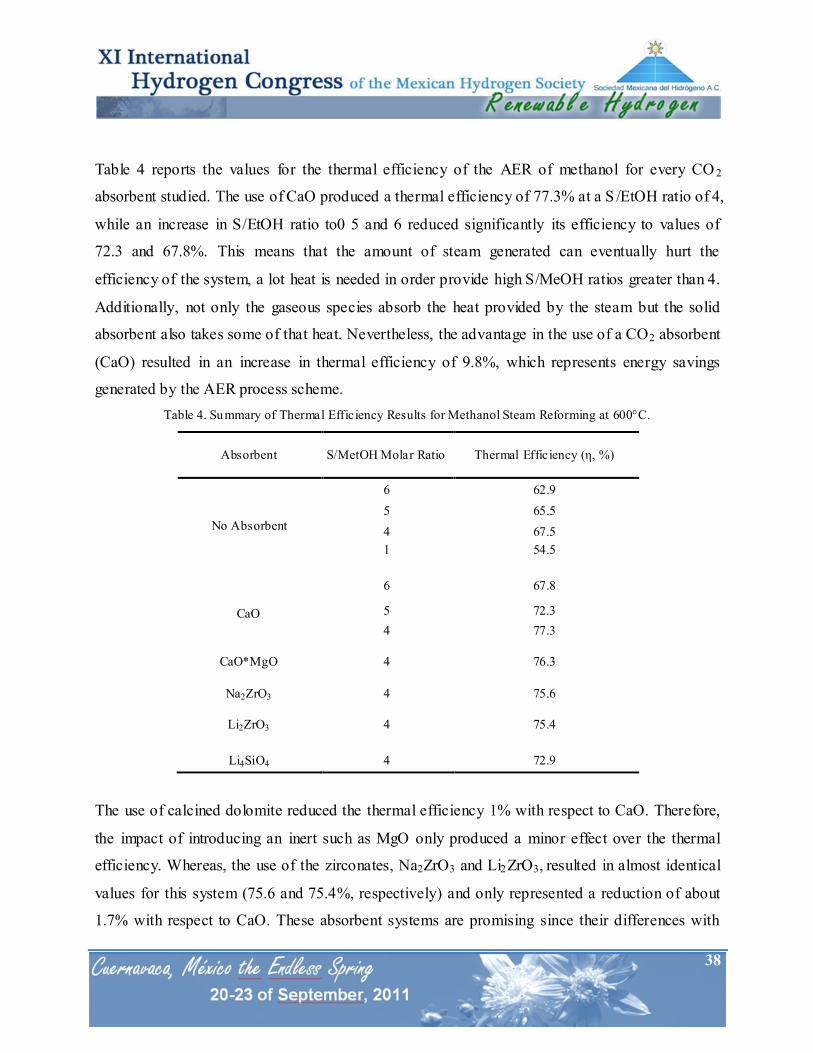
Table 4 reports the values for the thermal efficiency of the AER of methanol for every CO 2
absorbent studied. The use of CaO produced a thermal efficiency of 77.3% at a S /EtOH ratio of 4,
while an increase in S/EtOH ratio to0 5 and 6 reduced significantly its efficiency to values of
72.3 and 67.8%. This means that the amount of steam generated can eventually hurt the
efficiency of the system, a lot heat is needed in order provide high S/MeOH ratios greater than 4.
Additionally, not only the gaseous species absorb the heat provided by the steam but the solid
absorbent also takes some of that heat. Nevertheless, the advantage in the use of a CO2 absorbent
(CaO) resulted in an increase in thermal efficiency of 9.8%, which represents energy savings
generated by the AER process scheme.
Table 4. Summary of Thermal Efficiency Results for Methanol Steam Reforming at 600°C.
Absorbent S/MetOH Molar Ratio Thermal Efficiency (η, %)
No Absorbent
6 62.9
5 65.5
4 67.5
1 54.5
CaO
6 67.8
5 72.3
4 77.3
CaO*MgO 4 76.3
Na2ZrO3 4 75.6
Li2ZrO3 4 75.4
Li4SiO4 4 72.9
The use of calcined dolomite reduced the thermal efficiency 1% with respect to CaO. Therefore,
the impact of introducing an inert such as MgO only produced a minor effect over the thermal
efficiency. Whereas, the use of the zirconates, Na2ZrO3 and Li2ZrO3, resulted in almost identical
values for this system (75.6 and 75.4%, respectively) and only represented a reduction of about
1.7% with respect to CaO. These absorbent systems are promising since their differences with
39
respect to CaO are minor and they present the advantages of being materials with high thermal
stability and durability. Finally, from results of Table 4 it can be seen that Li4SiO4 presented a
limited thermal efficiency of 72.9%, which agrees well with its performance during the hydrogen
production thermodynamic analysis evaluation.
Additionally, for both biofuels analyzed (ethanol and methanol), it should be observed that in the
AER process the highest efficiencies occur in a limited range of steam-to-fuel ratios (6 for
ethanol and 4 for methanol).
3.6 Optimal Operating Conditions for AER process
For both bio- fuels, under the AER system, it can be seen that it is possible to obtain a hydrogen
concentration of ≈ 99% purity at 1 atm, 500°C and S/MeOH = 4 and 600°C and S/EtOH = 6.
However, in order to achieve a CO concentration below 50 ppm intended for PEMFC
applications a temperature around 450°C is needed, which represents a decrease in hydrogen
production as well as in hydrogen purity from the above described conditions. Therefore, a
preferential CO oxidation process performed in a COPROX reactor is necessary in order to
reduce CO concentration to appropriate levels for PEMFC applications. Conditions found in the
present thermodynamic analysis pointed out that for ethanol reforming S/EtOH = 6 and 600°C
will provide a HR of 5.7 and a hydrogen concentration as high as 97% with the use of a CO2
absorbent (CaO). Otherwise, for the steam reforming of methanol optimal conditions found were
S/MeOH = 4 and 600°C, which produced a hydrogen concentration of 98% using CaO as
absorbent. Also, it is worth to mention that the thermal efficiency is closely related to the
hydrogen concentration in the product gas as well as to the hydrogen production (HR). Therefore,
these set of conditions also insure high thermal efficiencies for the AER process.
4.0 CONCLUSIONS
40
Thermodynamic analysis of steam reforming of light alcohols (ethanol and methanol) with and
without CO2 absorbents were carried out to determine favorable operating conditions to produce
a high purity H2 gas product.
Results indicate no carbon formation at steam to alcohol ratios less than stoichiometric values
(S/COH ≤ stoichiometric) for the corresponding steam reforming reactions. However, for the
ethanol system using CO2 absorbents, carbon free operation can be found at S/EtOH ratios
greater than 2.0 and temperatures higher than 958°C. While, for methanol reforming carbon free
operation is achieved at steam/methanol ratios greater than 0.6 and temperatures higher than
778°C. Generally, carbon formation is suppressed with CO2 absorption compared to conventional
reforming operation for ethanol or methanol steam reforming.
The use of a CO2 absorbent resulted in an increase in HR (mols H2/mols alcohol) and H2 purity.
This enhancement under the ethanol reforming system produced a 19.2% increase in hydrogen
production with respect to the conventional reforming and the hydrogen concentration was
increased from 69 to 97%. Otherwise, with the methanol reforming system a 7% increase in
hydrogen production was reached, while the hydrogen concentration increased from 73 to 98%.
Under optimal operating conditions for AER process it is possible to produce a hydrogen
concentration of ≈ 99% purity at 1 atm, 500°C and S/MeOH = 4 for methanol reforming, while
this also can be achieved at 600°C and S/EtOH = 6 for ethanol reforming. For both alcohols CaO
and CaO*MgO showed similar results with high levels of hydrogen production ratios and
concentrations, Na2ZrO3 and Li2ZrO3 resulted only in slightly lower values than CaO, while
Li4SiO4 showed significantly lower values than CaO. The order from higher to lower hydrogen
production and concentration based on each CO2 absorbent was as follows: CaO > CaO*MgO >
Na2ZrO3 > Li2ZrO3 > Li4SiO4.
The thermal efficiency of the conventional reforming and AER systems were found to be
strongly related to the hydrogen concentration in the product gas as well as to the hydrogen
41
production ratio (HR). The thermal efficiency was also enhanced with the use of a CO2 absorbent
since with the ethanol reforming system an increase from 66 to 81% was found with respect to
the conventional process, while in the methanol reforming system the increase was from 67 to
77%.
The AER technology represents a promising low-temperature process for high-quality H2
production with low propensity to carbon formation. Furthermore, the use of low temperatures
could bring beneficial effects on the life of the catalysts and the construction materials of the
reformers as well as in substantial energy savings. Besides these technological aspects, other
advantages of the AER are expected, such as easy CO2 sequestration. In this case, the use of
alcohols in conjunction with AER could be a potentially viable carbon-negative process
Finally, Na2ZrO3 and Li2ZrO3 can be considered as promising alternate absorbents with
comparable thermodynamics to the reference CaO absorbent for alcohol reforming applications
in the present work. However, the limited durability of CaO and CaO*MgO absorbents make
these zirconate materials ideal absorbents to be used under the AER system. However, from the
two zirconates, Na2ZrO3 is the one that presents greater kinetics and superior stability. Therefore,
Na2ZrO3 should be considered as a high potential absorbent under the AER of ethanol and/or
methanol for future experimental evaluations.
5.0 REFERENCES
[1] N. A. Owen, O. R. Inderwildi and D. A. Kinga, Energy Policy, 38, 4743-4749 (2010)
[2] S. Dunn, Int J Hydrogen Energy, 27, 235-264 (2002)
[3] J. Schmidt, L. Sylvain, E. Dotzauer, G. Kindermann, E. Schmid, Appl Energ, 87, 2128-2141
(2010)
[4] L. F. Brown, Int. J. Hydrogen Energy, 26, 381-397 (2001)
[5] B. Amigun, J. Gorgens, H. Knoetze, Energy Policy, 38, 312-322 (2010)
[6] A. I. Lysikov, S. N. Trukhan, A. G. Okunev, Int J Hydrogen Energy, 33, 3061-3066 (2008)
42
[7] R. Davda, J. Shabaker, G. Huber, R. Cortright, J. Dumesic, Appl Catal B: Environ, 56, 171-
186 (2005)
[8] A. Lima da Silva, I. L. Müller, Int J Hydrogen Energy, 36, 2057-2075 (2011)
[9] E. Ochoa-Fernández, H. Berntsen, T. Zhao, L. Hi, E. A. Blekkan, D. Chen, “CO2 Sorption
Enhanced Steam Reforming of Ethanol”, North American Catalysis Society 20th North American
Meeting , June 17-22, Abstract P-S12-34B (2007).
[10] N. Hildengrand, L. Readman, I. M. Dahl, R. Blom, Appl. Catal., A, 303, 131-138 (2006)
[11] M. Kato, S. Yoshikawa, K. Nakawaga, J. Mater Sci. Lett., 21, 485 (2002).
[12] A. López, N. Pérez, A. Reyes, D. Lardizábal, Sep. Sci. Technol. 39, 3563–3579 (2004)
[13] S. Jarungthammachote, A. Dutta, Energy Convers. Manage, 49, 1345–1356 (2008).
[14] A. Roine, Chemical reaction and equilibrium software with extensive thermo-chemical
database. Outokumpu HSC 6.0 Chemistry for windows 2010.
[15] M. Benito, J.L. Sanz, R. Isabel, R. Padilla, R. Arjona, L. Daza, J Power Sources, 151, 11-17
(2005)
[16] A. N. Fatsikostas, X. E. Verykios. J Catal, 225, 439-452 (2004)
[17] P. Biswas, D. Kunzru, Int J Hydrogen Energy, 32, 969-980 (2007)
[18] L. He, J. M. S. Parra, E. A. Blekkan, D. Chen, Energy Environ Sci, 3, 1046-1056 (2010)
[19] A. J. Akande, “Production of Hydrogen by Reforming of Crude Ethanol”, Master of Science
Thesis, University of Saskatchewan, Saskatoon, Saskatchewan, Canada (2005).
[20] M. Li, Int J Hydrogen Energy, 34, 9362-9372 (2009)
[21] B. Zhang, X. Tang, Y. Li, W. Cai, Y. Xu, W. Shen, Catal Commun, 7, 367-372 (2006)
[22] I. Fishtik , A. Alexander, R. Datta, Int J Hydrogen Energy, 25, 31-45 (2000).
[23] M. Li, X. Wang, S. Li, S. Wang, X. Ma, Int J Hydrogen Energy, 35, 6699-6708 (2010)
[24] L. P. R. Profeti, E. A. Ticianelli, E. M. Assaf, Int J Hydrogen Energy, 34, 5049-60 (2009)
[25] L. He, H. Berntsen, E. Ochoa-Fernandez, J. C. Walmsley, E. A. Blekkan, D. Chen, Top
Catal, 52, 206-17 (2009).
[26] A. Lopez-Ortiz, D. P. Harrison, Ind. Eng. Chem. Res., 40, 5102 -5109 (2001)
[27] A. Silaban, D. P. Harrison, Chem Eng Comm, 47, 149-162 (1996)
43
[28] C Han, D. P. Harrison, Sep Sci Technol, 32, 681-697 (1997)
[29] A. Bandi, M. Specht, P. Sichler, N. Nicoloso, In situ gas conditioning in fuel reforming for
hydrogen generation. 5th International Symposium on Gas Cleaning at High Temperature.
Morgantown West Virginia. 2002. Available at: http://www.zsw-
bw.de/en/docs/research/REG/pdfs/REG_5th_ISGC_2002.pdf.
[30] J. R. Hufton, S. Mayorga, S. Sircar, AIChE Journal, 45, 248-256 (1999).
[31] Y. Ding, E. Alpay, Process Saf Environ Prot, 79, 45-51(2001).
[32] K. Nakagawa, T. J. Ohashi, J Electrochem Soc, 145, 1344-1346 (1998).
[33] M. Kato, S. Yoshikawa, K. Essaki, K. Nakagawa, Novel CO2 absorbents using lithium-
containing oxides. In Toshiba Corporation. INTERMAC, Japan Electric Measuring Instruments
Manufacturers' Association, Joint Technical Conference.; SE-3, 1021 (2001).
[34] E. Ochoa-Fernández, C. Lacalle-Vilà, T. Zhao, M. Rønning, D. Chen, Stud Surf Sci Catal,
167, 159-164 (2007).
[35] J. P. Jakobsen, E. Halmøy, Energy Procedia, 1, 725-732 (2009).
[36] J. Papavasiliou, G. Avgouropoulos, T. Ioannides, Catal Commun, 6, 497-501 (2005).
[37] B. A. Peppley, J. C. Amphlett, L. M. Kearns, R. F. Mann, Appl Catal A: Gen, 179, 21-29
(1999).
[38] A. I. Lysikov, S. N. Trukhan, A. G. Okunev, Int J Hydrogen Energy, 33, 3061-3066 (2008).
[39] M. Li, Int J Hydrogen Energy, 34, 9362-9372 (2009).
[40] K. Faungnawakij, R. Kikuchi, K. Eguchi, J Power Sources, 161, 87-94 (2006).


