Absolute-Dating Methods-4 types
79
• The discovery of radioactivity – destroyed Kelvin’s argument for the age of Earth – and provided a clock to measure Earth’s age • A. Radioactivity is the spontaneous decay – of an atom’s nucleus to a more stable form • The heat from radioactivity – helps explain why the Earth is still warm inside • Radioactivity provides geologists – with a powerful tool to measure – absolute ages of rocks and past geologic events B. Fission Track Measurements (0.4 to 1.5 MYA) C. Carbon 14 dating- less than 70,000 years old D. Tree Ring dating- back as much as 14,000 years ago Absolute-Dating Methods- 4 types
-
Upload
igor-valdez -
Category
Documents
-
view
40 -
download
0
description
Absolute-Dating Methods-4 types. The discovery of radioactivity destroyed Kelvin’s argument for the age of Earth and provided a clock to measure Earth’s age A. Radioactivity is the spontaneous decay of an atom’s nucleus to a more stable form The heat from radioactivity - PowerPoint PPT Presentation
Transcript of Absolute-Dating Methods-4 types
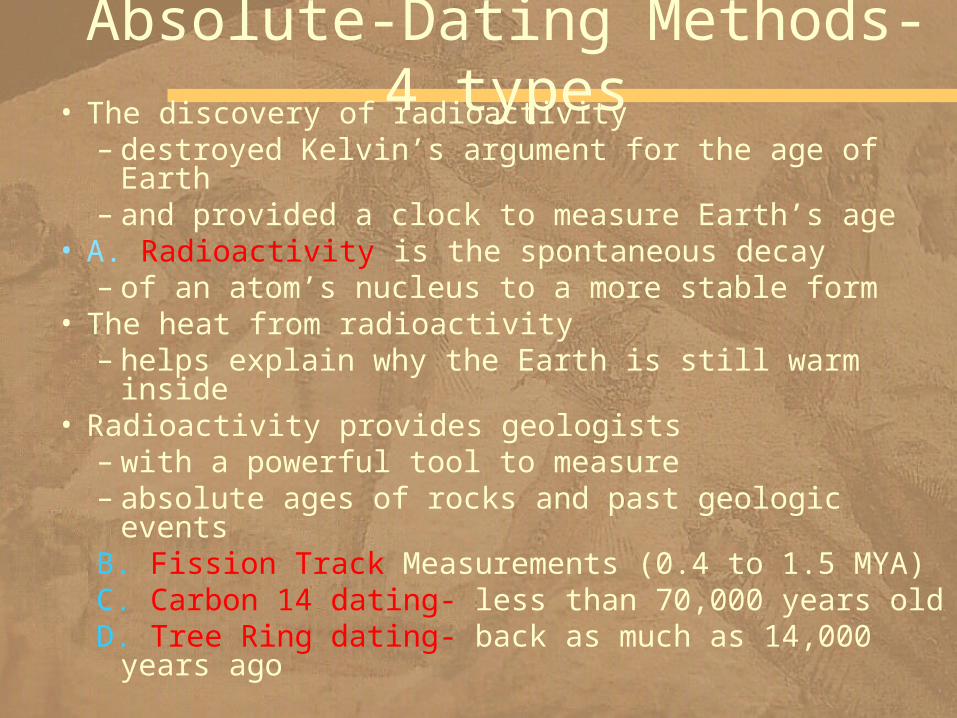
• The discovery of radioactivity– destroyed Kelvin’s argument for the age of Earth– and provided a clock to measure Earth’s age
• A. Radioactivity is the spontaneous decay – of an atom’s nucleus to a more stable form
• The heat from radioactivity – helps explain why the Earth is still warm inside
• Radioactivity provides geologists – with a powerful tool to measure – absolute ages of rocks and past geologic eventsB. Fission Track Measurements (0.4 to 1.5 MYA)C. Carbon 14 dating- less than 70,000 years oldD. Tree Ring dating- back as much as 14,000 years ago
Absolute-Dating Methods-4 types
• The different forms of an element’s atoms – with varying numbers of neutrons – are called isotopes
• Different isotopes of the same element – have different atomic mass numbers– but behave the same chemically
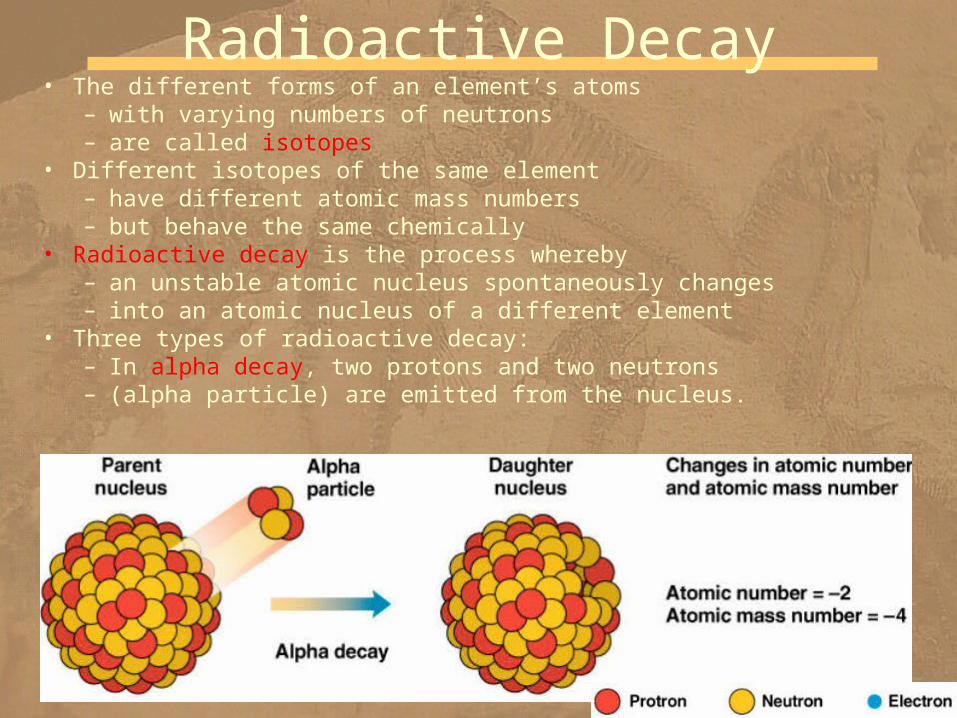
• Radioactive decay is the process whereby – an unstable atomic nucleus spontaneously changes – into an atomic nucleus of a different element
• Three types of radioactive decay:– In alpha decay, two protons and two neutrons – (alpha particle) are emitted from the nucleus.
Radioactive Decay
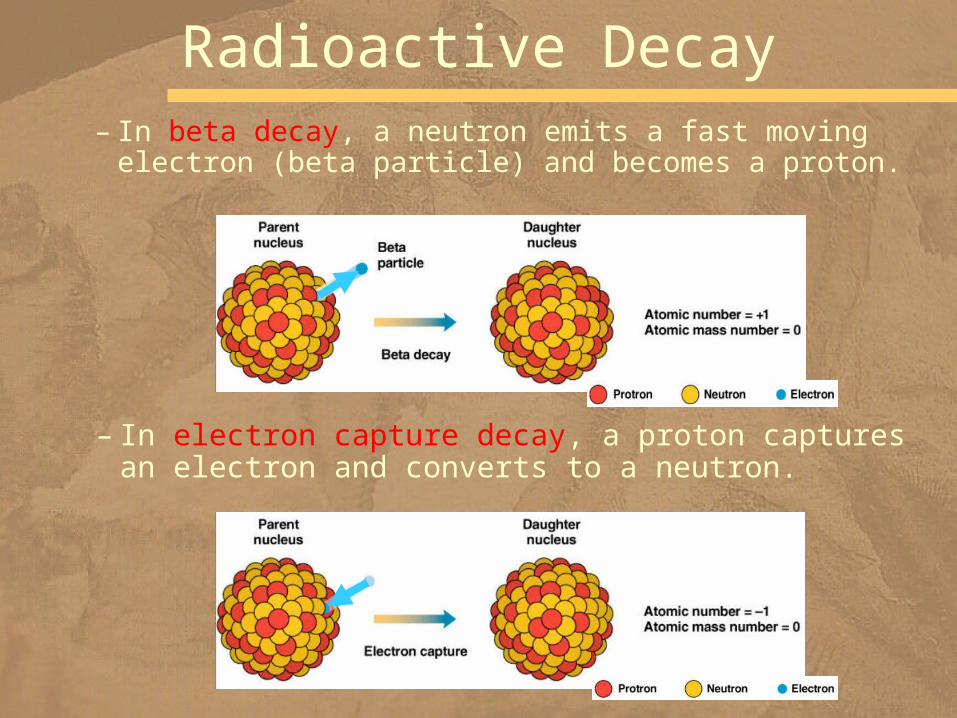
– In beta decay, a neutron emits a fast moving electron (beta particle) and becomes a proton.
Radioactive Decay
– In electron capture decay, a proton captures an electron and converts to a neutron.
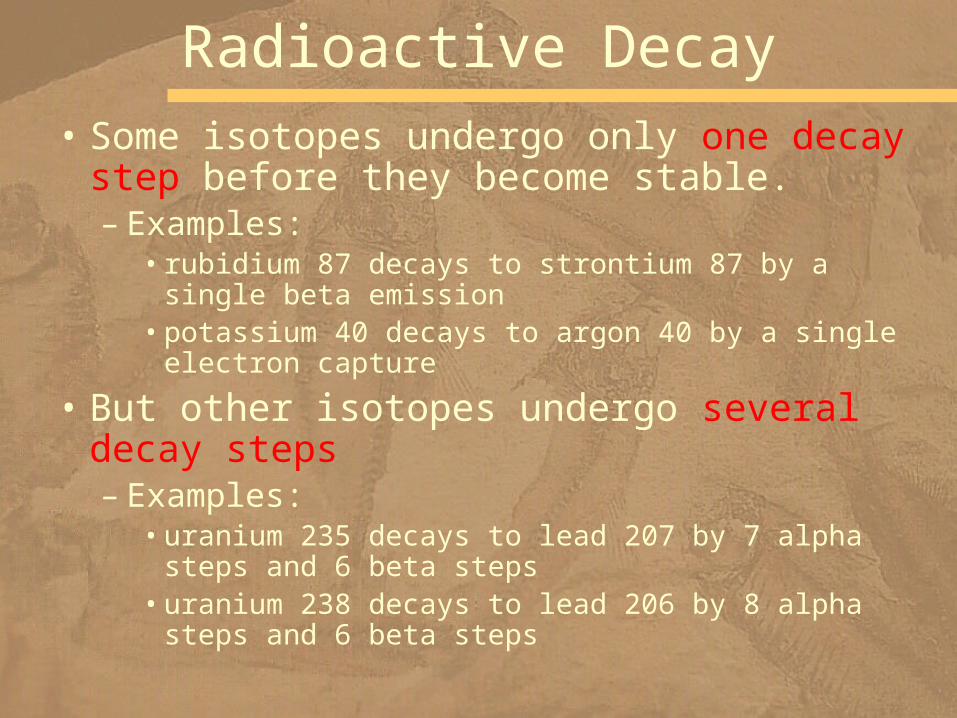
• Some isotopes undergo only one decay step before they become stable.– Examples:
• rubidium 87 decays to strontium 87 by a single beta emission
• potassium 40 decays to argon 40 by a single electron capture
• But other isotopes undergo several decay steps– Examples:
• uranium 235 decays to lead 207 by 7 alpha steps and 6 beta steps
• uranium 238 decays to lead 206 by 8 alpha steps and 6 beta steps
Radioactive Decay
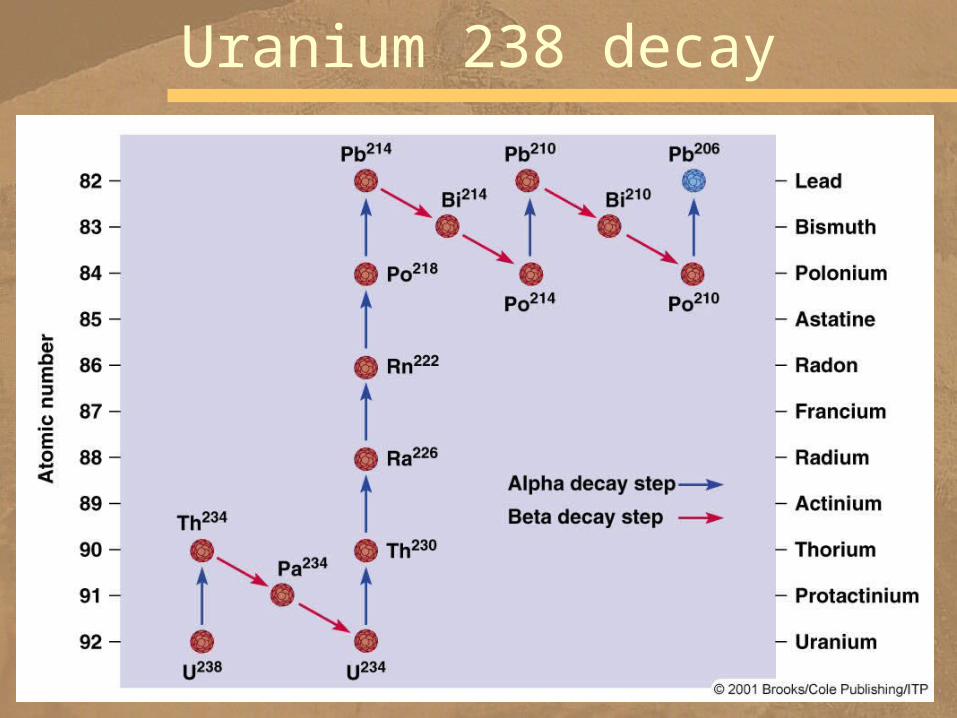
Uranium 238 decay
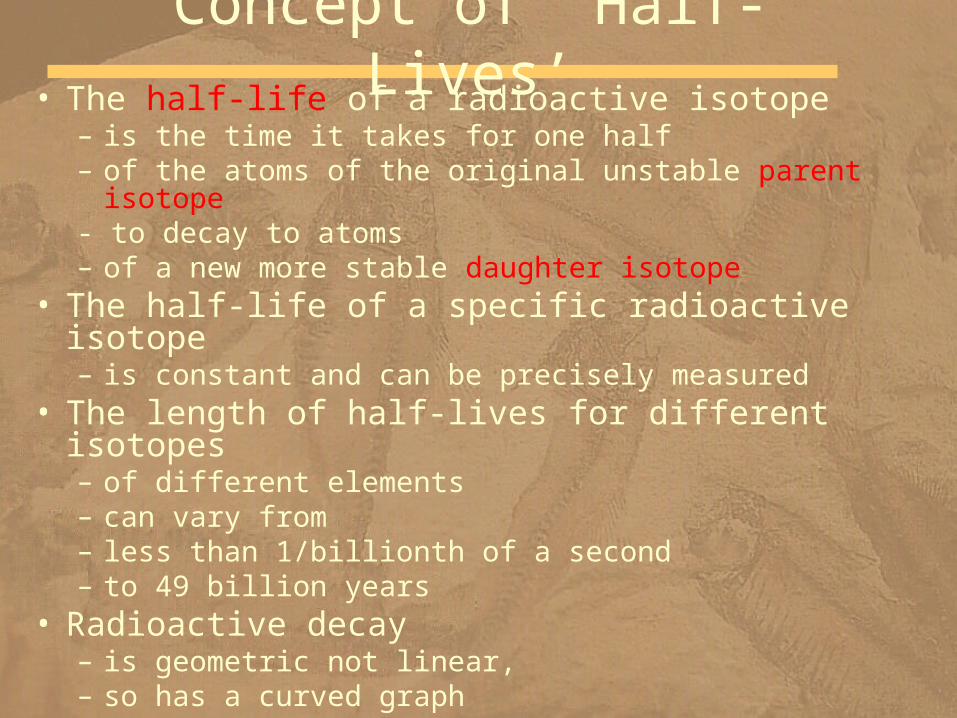
• The half-life of a radioactive isotope – is the time it takes for one half – of the atoms of the original unstable parent isotope - to decay to atoms – of a new more stable daughter isotope
• The half-life of a specific radioactive isotope – is constant and can be precisely measured
• The length of half-lives for different isotopes – of different elements – can vary from – less than 1/billionth of a second – to 49 billion years
• Radioactive decay – is geometric not linear, – so has a curved graph
Concept of ‘Half-Lives’
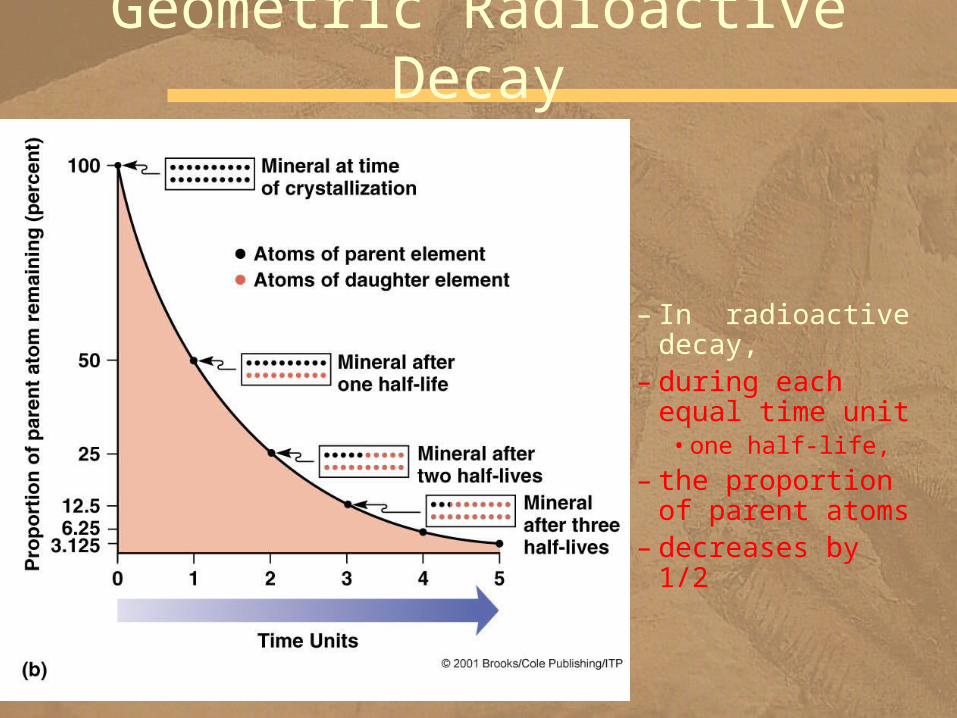
– In radioactive decay,
– during each equal time unit
• one half-life,
– the proportion of parent atoms
– decreases by 1/2
Geometric Radioactive Decay
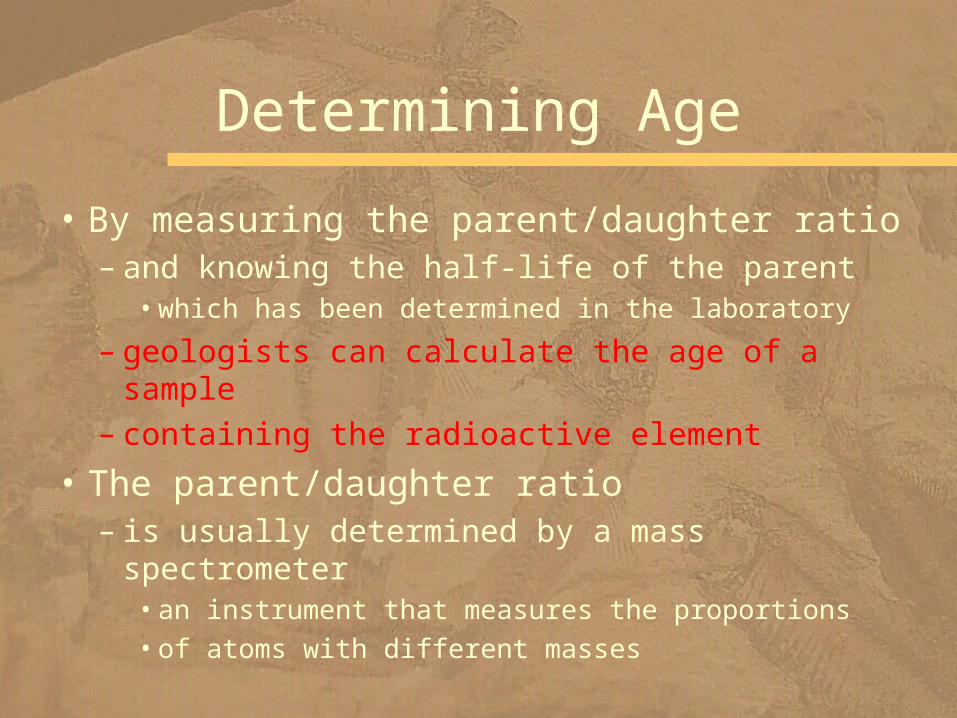
• By measuring the parent/daughter ratio – and knowing the half-life of the parent
• which has been determined in the laboratory
– geologists can calculate the age of a sample – containing the radioactive element
• The parent/daughter ratio – is usually determined by a mass spectrometer
• an instrument that measures the proportions
• of atoms with different masses
Determining Age
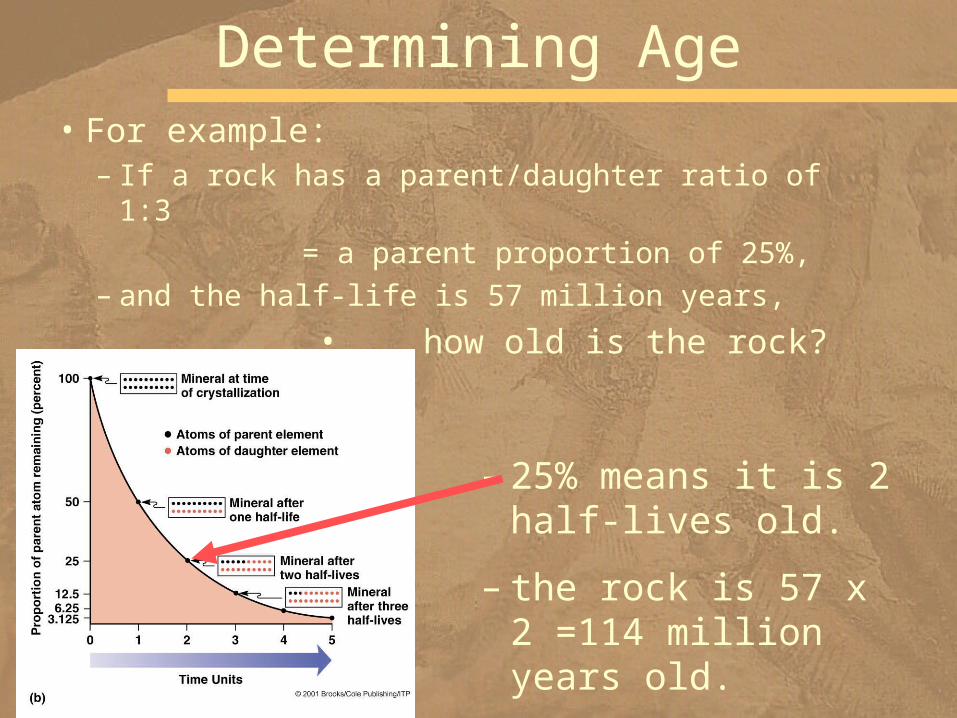
• For example: – If a rock has a parent/daughter ratio of 1:3
= a parent proportion of 25%, – and the half-life is 57 million years,
• how old is the rock?
Determining Age
– 25% means it is 2 half-lives old.
– the rock is 57 x 2 =114 million years old.
• Most radiometric dates are obtained – from igneous rocks
• As magma cools and crystallizes, – radioactive parent atoms separate – from previously formed daughter atoms
• Because they fit, some radioactive parents – are included in the crystal structure – of certain minerals
• The daughter atoms are different elements – with different sizes – and, therefore, – do not generally fit – into the same minerals as the parents
• Geologists can use the crystals containing – the parents atoms – to date the time of crystallization
What Materials Can Be Dated?

• Crystallization of magma separates parent atoms – from previously formed daughters
• This resets the radiometric clock to zero.• Then the parents gradually decay.
Igneous Crystallization
• Generally, sedimentary rocks cannot be radiometrically dated– because the date obtained – would correspond to the time of crystallization of
the mineral, – when it formed in an igneous or metamorphic rock,– not the time that it was deposited as a sedimentary
particle
• Exception: dating the mineral glauconite,– because it forms in certain marine environments as
a reaction with clay – during the formation of the sedimentary rock
Not Sedimentary Rocks
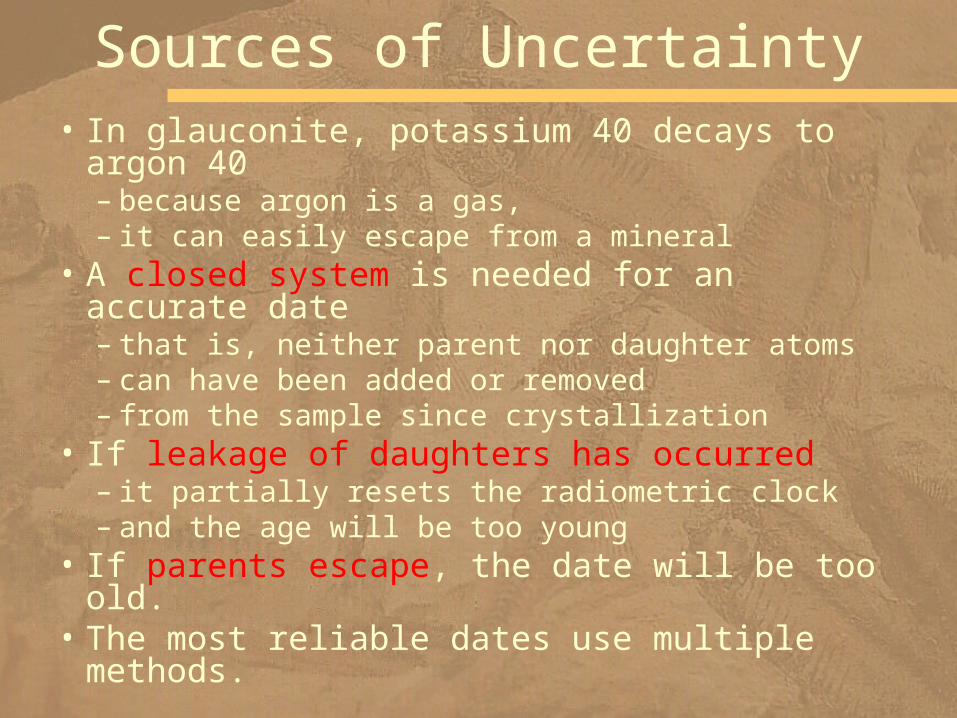
• In glauconite, potassium 40 decays to argon 40– because argon is a gas, – it can easily escape from a mineral
• A closed system is needed for an accurate date– that is, neither parent nor daughter atoms – can have been added or removed – from the sample since crystallization
• If leakage of daughters has occurred – it partially resets the radiometric clock – and the age will be too young
• If parents escape, the date will be too old.• The most reliable dates use multiple methods.
Sources of Uncertainty
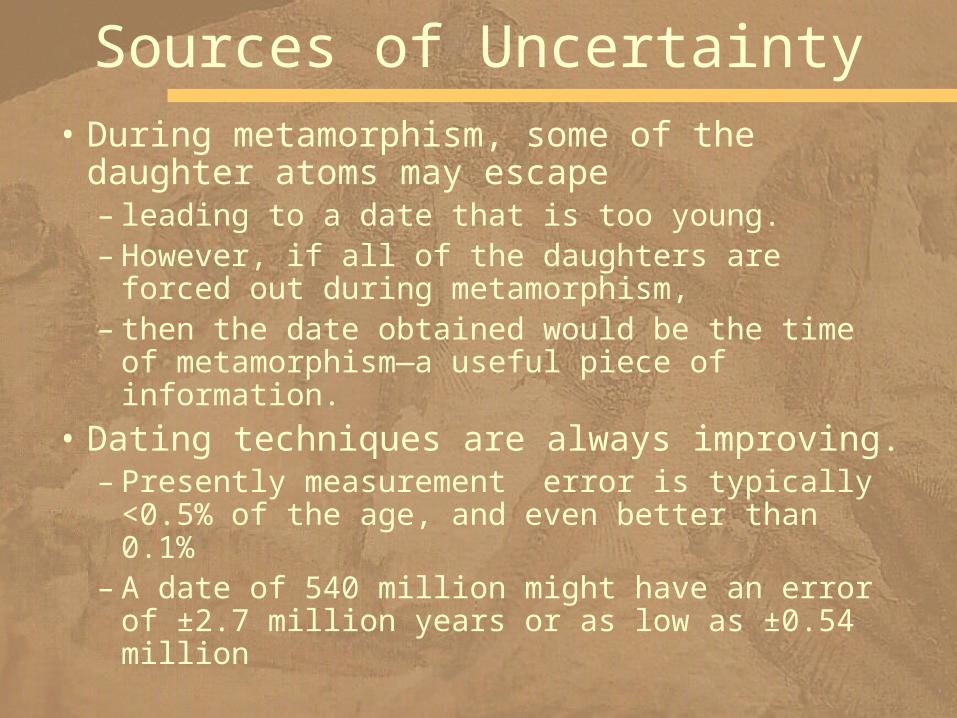
• During metamorphism, some of the daughter atoms may escape– leading to a date that is too young.– However, if all of the daughters are forced out
during metamorphism, – then the date obtained would be the time of
metamorphism—a useful piece of information.
• Dating techniques are always improving.– Presently measurement error is typically <0.5% of
the age, and even better than 0.1%– A date of 540 million might have an error of ±2.7
million years or as low as ±0.54 million
Sources of Uncertainty
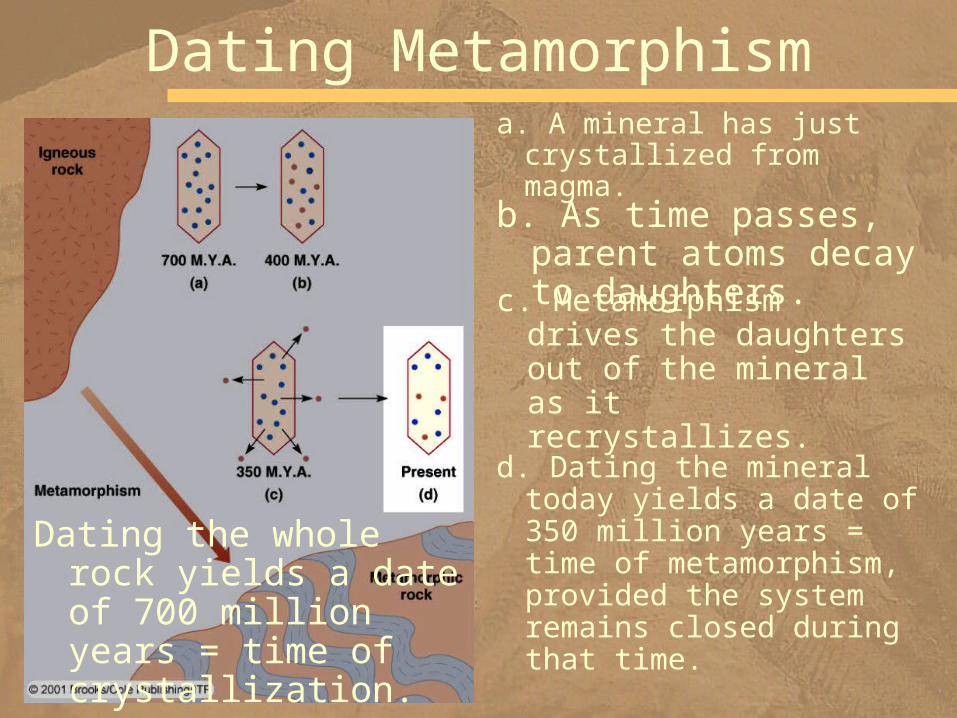
a. A mineral has just crystallized from magma.
Dating Metamorphism
b. As time passes, parent atoms decay to daughters.
c. Metamorphism drives the daughters out of the mineral as it recrystallizes.
d. Dating the mineral today yields a date of 350 million years = time of metamorphism, provided the system remains closed during that time.
Dating the whole rock yields a date of 700 million years = time of crystallization.
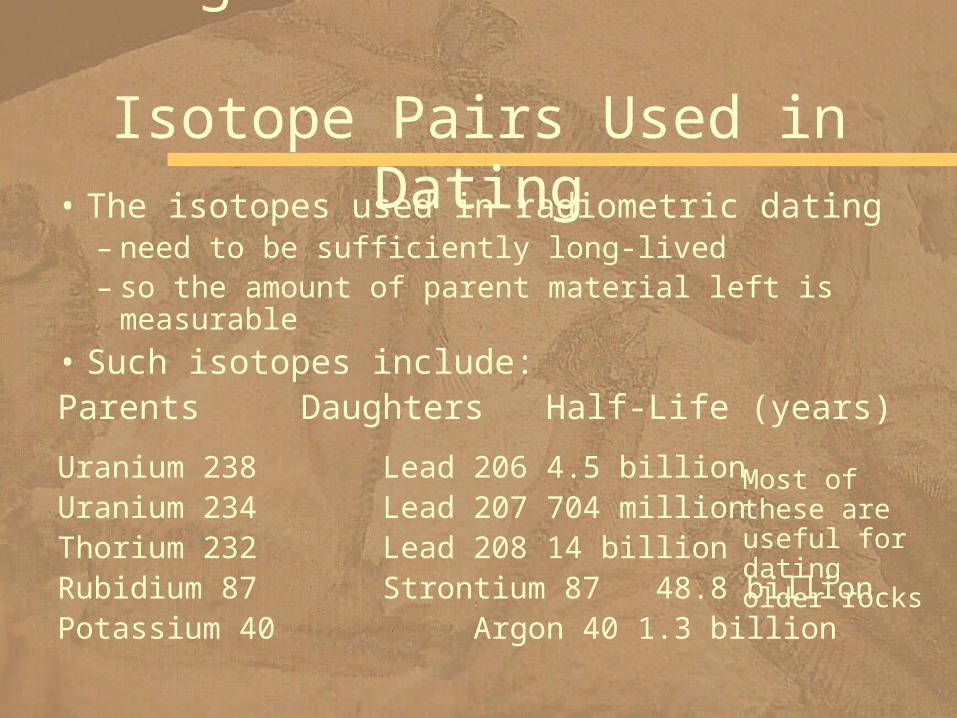
• The isotopes used in radiometric dating – need to be sufficiently long-lived – so the amount of parent material left is measurable
• Such isotopes include:Parents Daughters Half-Life (years)
Long-Lived Radioactive Isotope Pairs Used in Dating
Uranium 238 Lead 206 4.5 billionUranium 234 Lead 207 704 millionThorium 232 Lead 208 14 billionRubidium 87 Strontium 87 48.8 billionPotassium 40 Argon 40 1.3 billion
Most of these are useful for dating older rocks
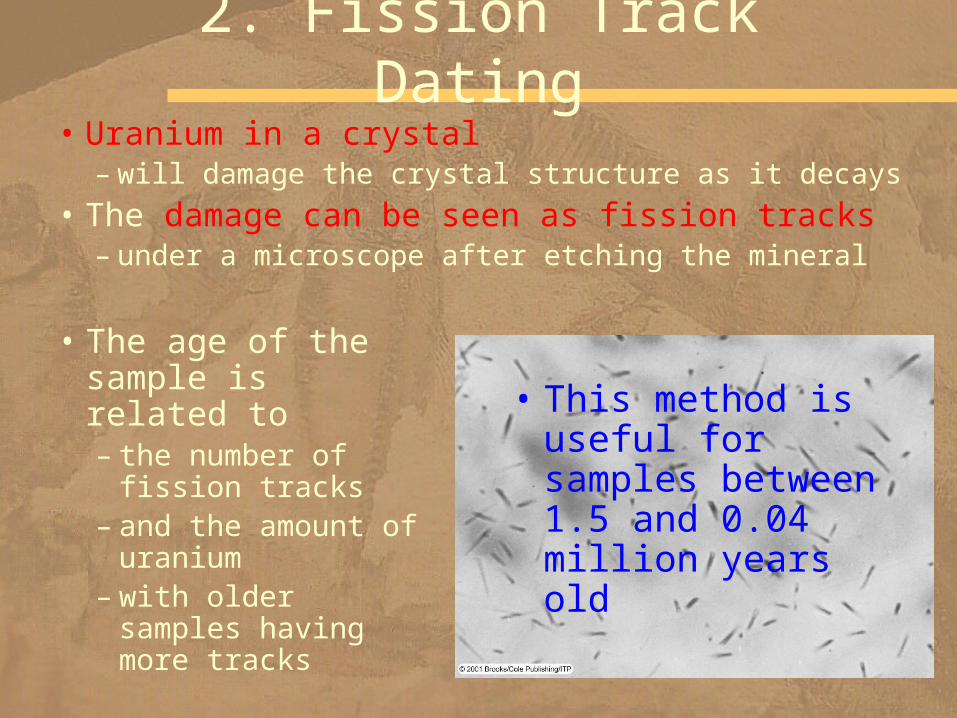
• Uranium in a crystal – will damage the crystal structure as it decays
• The damage can be seen as fission tracks – under a microscope after etching the mineral
2. Fission Track Dating
• The age of the sample is related to – the number of
fission tracks – and the amount of
uranium– with older samples
having more tracks
• This method is useful for samples between 1.5 and 0.04 million years old
• Carbon is found in all life• It has 3 isotopes
– carbon 12 and 13 are stable but carbon 14 is not– Carbon 14 has a half-life of 5730 years– Carbon 14 dating uses the carbon 14/carbon 12 ratio
• of material that was once living
• The short half-life of carbon 14 – makes it suitable for dating material – < 70,000 years old
• It is not useful for most rocks, – but is useful for archaeology – and young geologic materials
3. Radiocarbon Dating Method
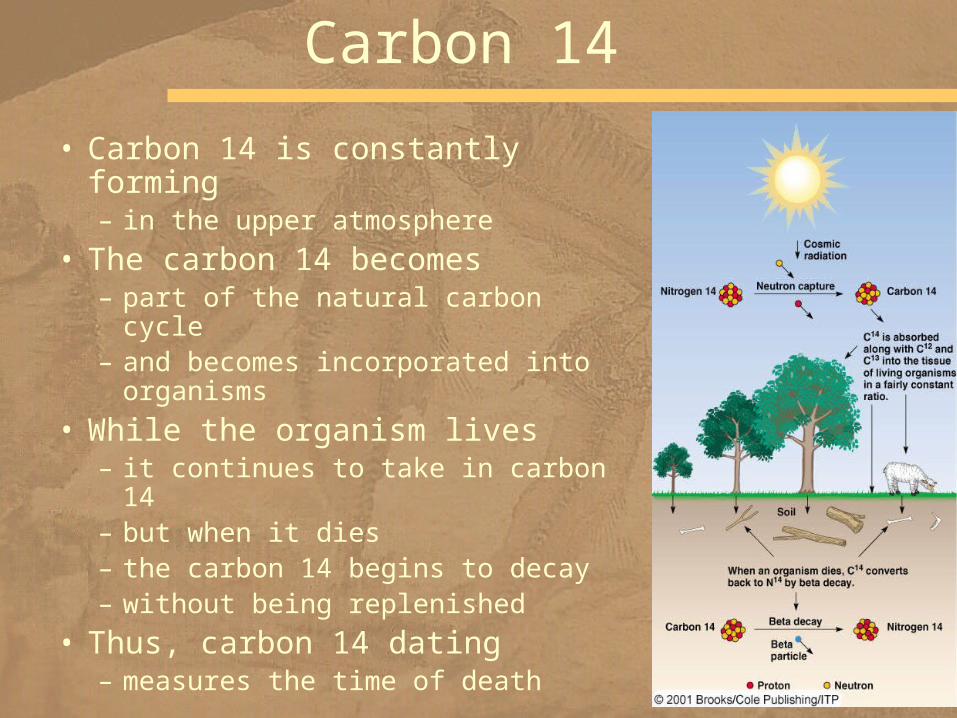
• Carbon 14 is constantly forming – in the upper atmosphere
• The carbon 14 becomes – part of the natural carbon cycle – and becomes incorporated into
organisms
• While the organism lives – it continues to take in carbon 14– but when it dies – the carbon 14 begins to decay– without being replenished
• Thus, carbon 14 dating – measures the time of death
Carbon 14
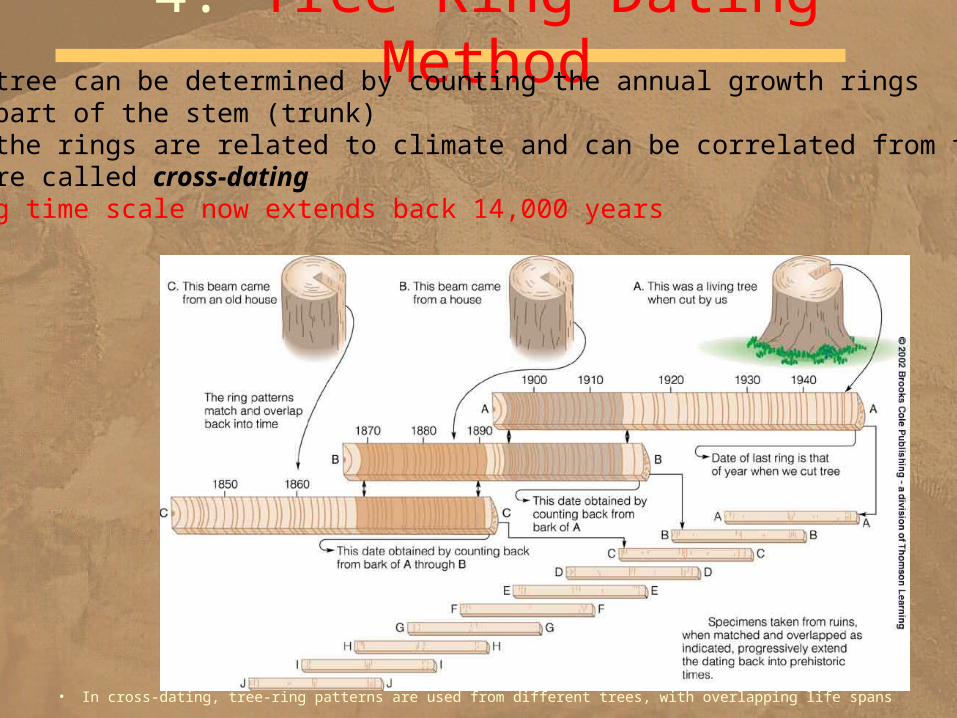
• In cross-dating, tree-ring patterns are used from different trees, with overlapping life spans
4. Tree-Ring Dating MethodThe age of a tree can be determined by counting the annual growth rings
-in lower part of the stem (trunk)The width of the rings are related to climate and can be correlated from tree to tree
-a procedure called cross-dating-The tree-ring time scale now extends back 14,000 years
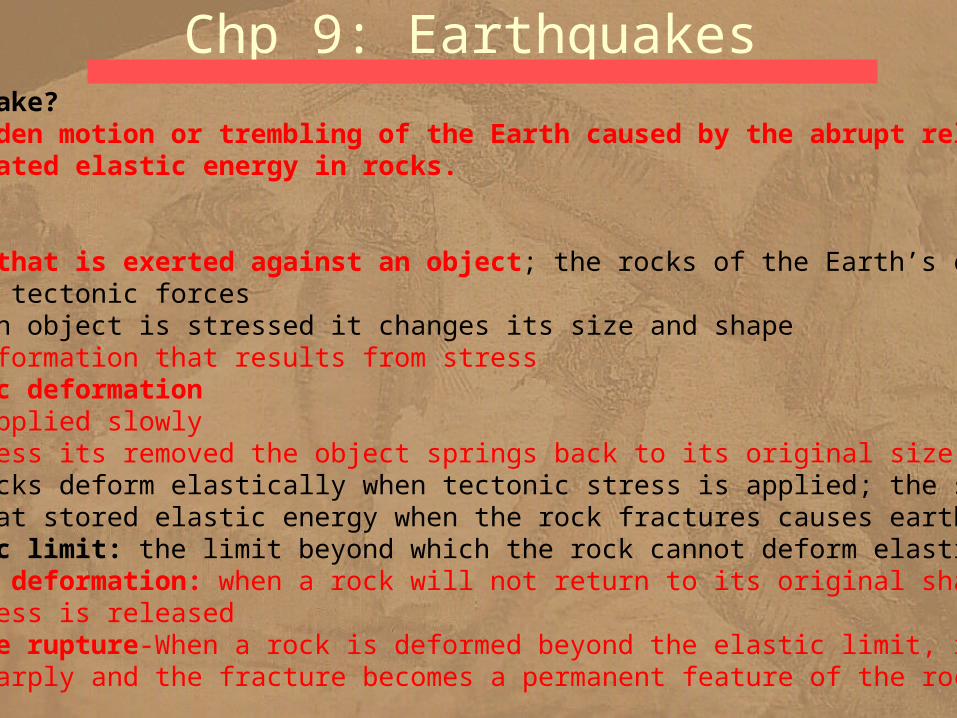
Chp 9: EarthquakesWhat is an Earthquake?Definition: a sudden motion or trembling of the Earth caused by the abrupt release of slowly accumulated elastic energy in rocks.
A. Stress -The force that is exerted against an object; the rocks of the Earth’s crust are stressed by tectonic forces -Whenever an object is stressed it changes its size and shape
B. Strain- The deformation that results from stress 1. elastic deformation
-Stress applied slowly -When stress its removed the object springs back to its original size and shape
2. All rocks deform elastically when tectonic stress is applied; the sudden release of that stored elastic energy when the rock fractures causes earthquakes 3. elastic limit: the limit beyond which the rock cannot deform elastically 4.plastic deformation: when a rock will not return to its original shape when the stress is released 5. brittle rupture-When a rock is deformed beyond the elastic limit, it may rupture
It breaks sharply and the fracture becomes a permanent feature of the rock
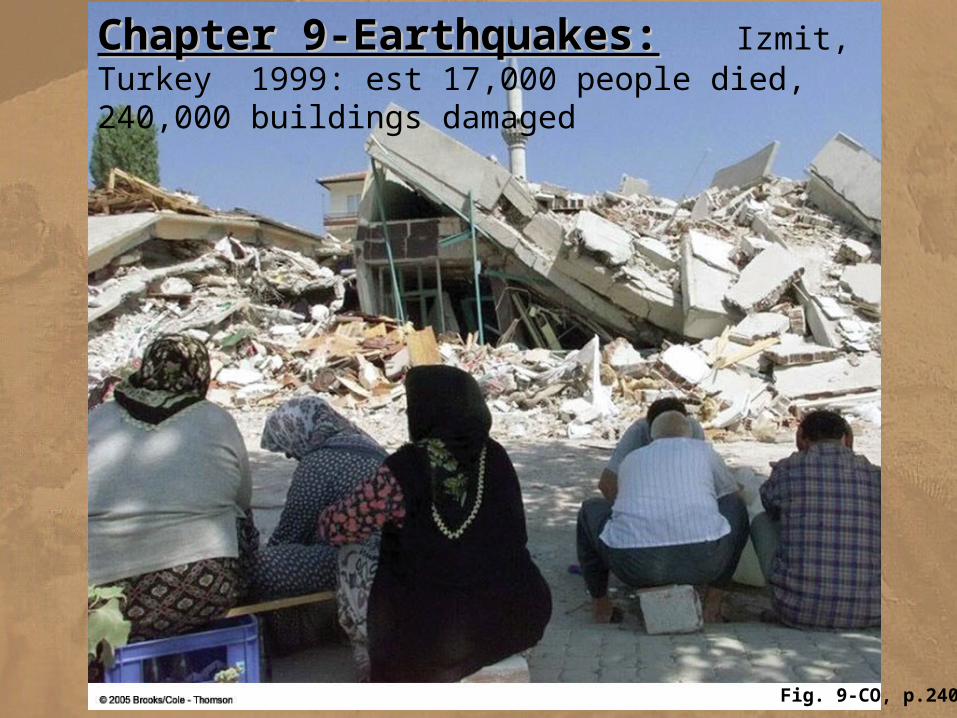
Chapter 9-Earthquakes:Chapter 9-Earthquakes: Izmit, Turkey 1999: est 17,000 people died, 240,000 buildings damaged
Fig. 9-CO, p.240
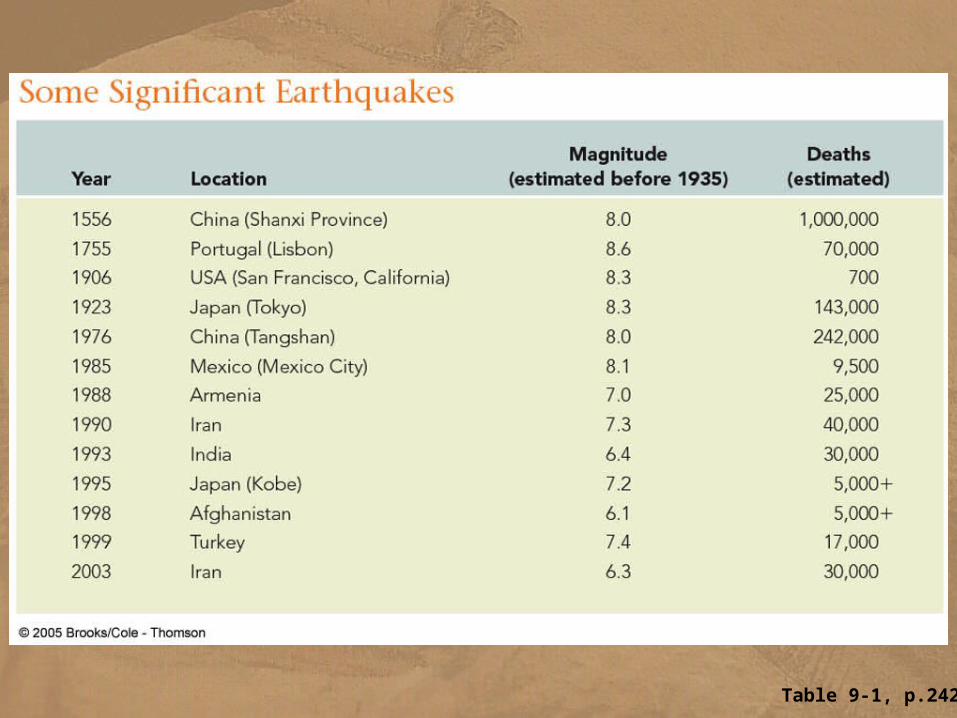
Table 9-1, p.242
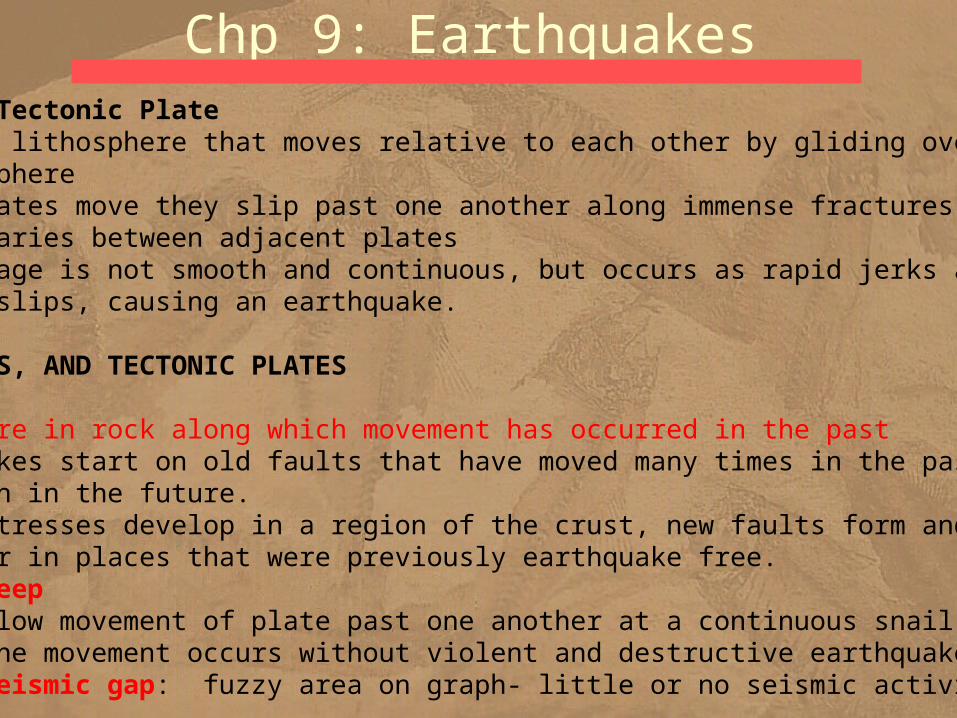
Chp 9: EarthquakesC. Deformation of Tectonic Plate
1. Segmented lithosphere that moves relative to each other by gliding over the asthenosphere 2. As the plates move they slip past one another along immense fractures that form the boundaries between adjacent plates 3. The slippage is not smooth and continuous, but occurs as rapid jerks as one plate suddenly slips, causing an earthquake.
EARTHQUAKES, FAULTS, AND TECTONIC PLATESA. Fault
1. A fracture in rock along which movement has occurred in the past 2. Earthquakes start on old faults that have moved many times in the past and will move again in the future. 3. If new stresses develop in a region of the crust, new faults form and earthquakes can occur in places that were previously earthquake free. 4. fault creep
a. Slow movement of plate past one another at a continuous snail-like pace b. The movement occurs without violent and destructive earthquakes c. seismic gap: fuzzy area on graph- little or no seismic activity
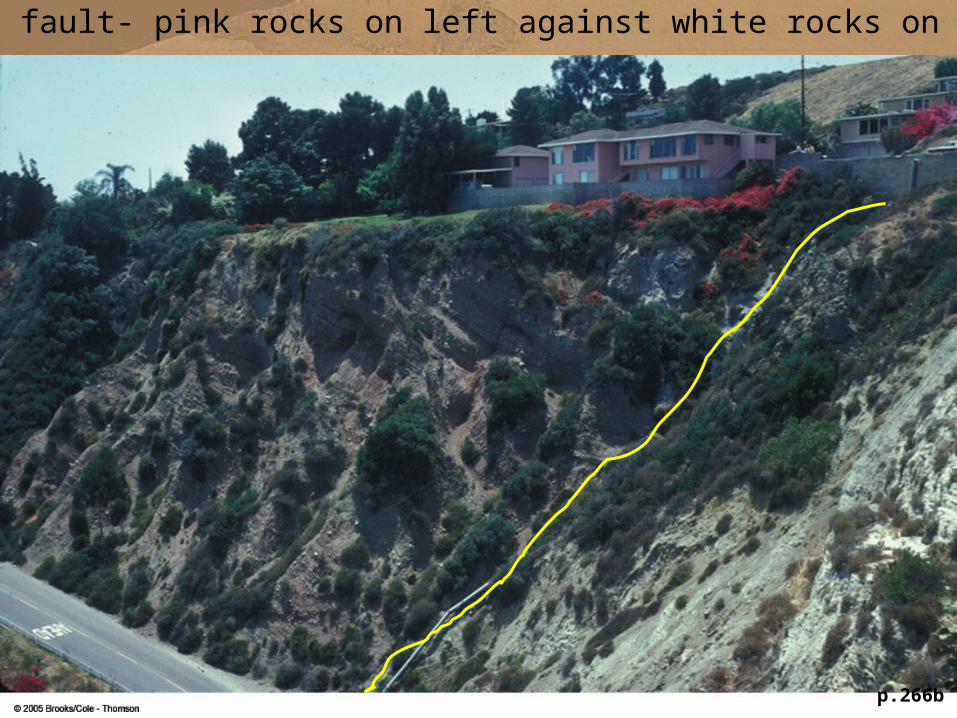
p.266b
Inactive fault- pink rocks on left against white rocks on right
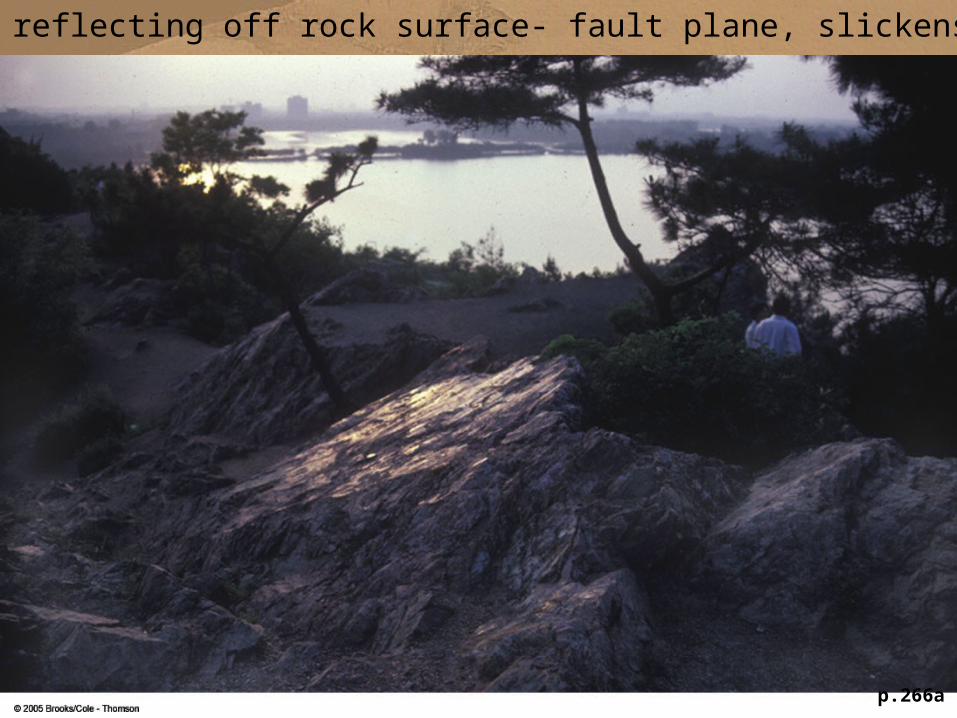
p.266a
Light reflecting off rock surface- fault plane, slickensided…
Chp 9: Earthquakes
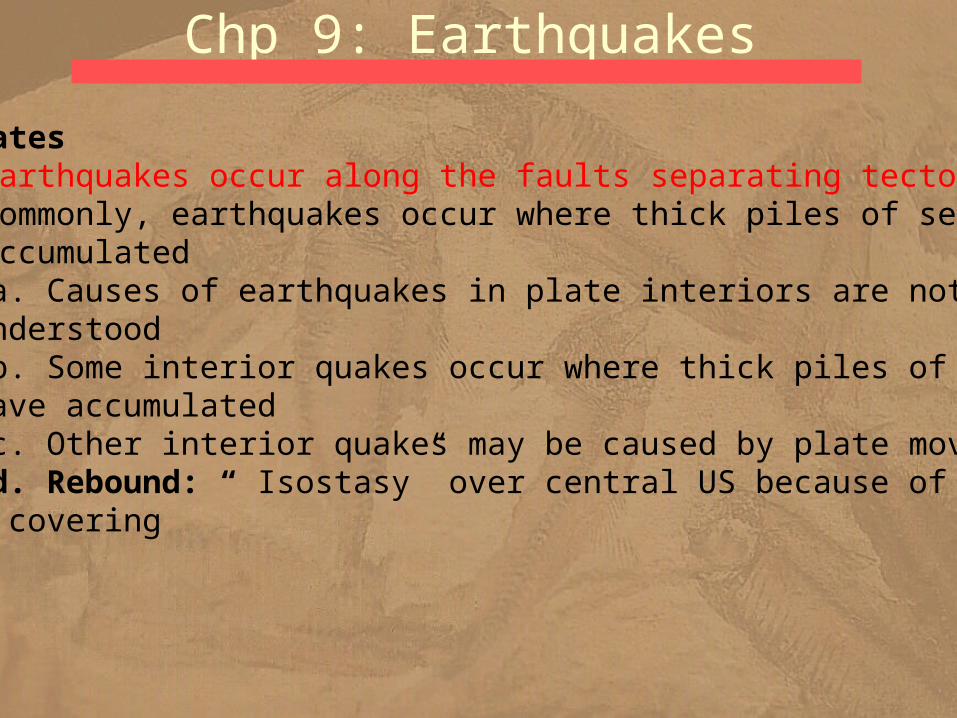
B. Tectonic Plates 1. Most earthquakes occur along the faults separating tectonic plates 2. Less commonly, earthquakes occur where thick piles of sediment have accumulated
a. Causes of earthquakes in plate interiors are not as well understood b. Some interior quakes occur where thick piles of sediment have accumulated c. Other interior quakes may be caused by plate movements d. Rebound: “ Isostasy” over central US because of glacial covering
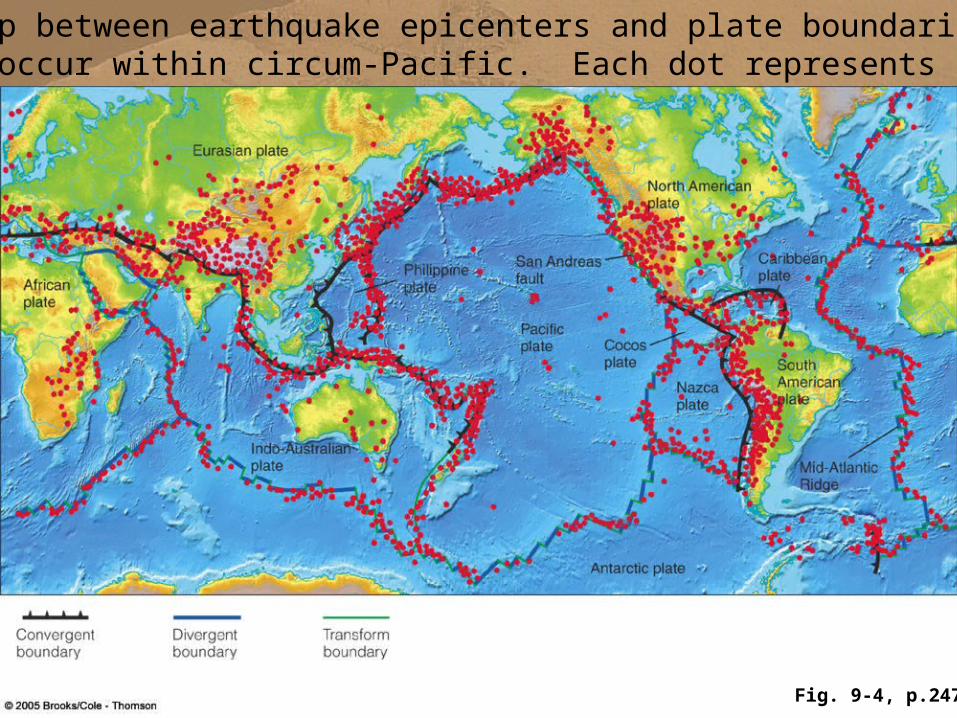
Fig. 9-4, p.247
Relationship between earthquake epicenters and plate boundaries!!approx 80% occur within circum-Pacific. Each dot represents one epicenter
Chp 9: EarthquakesEARTHQUAKE WAVES A. Body Waves
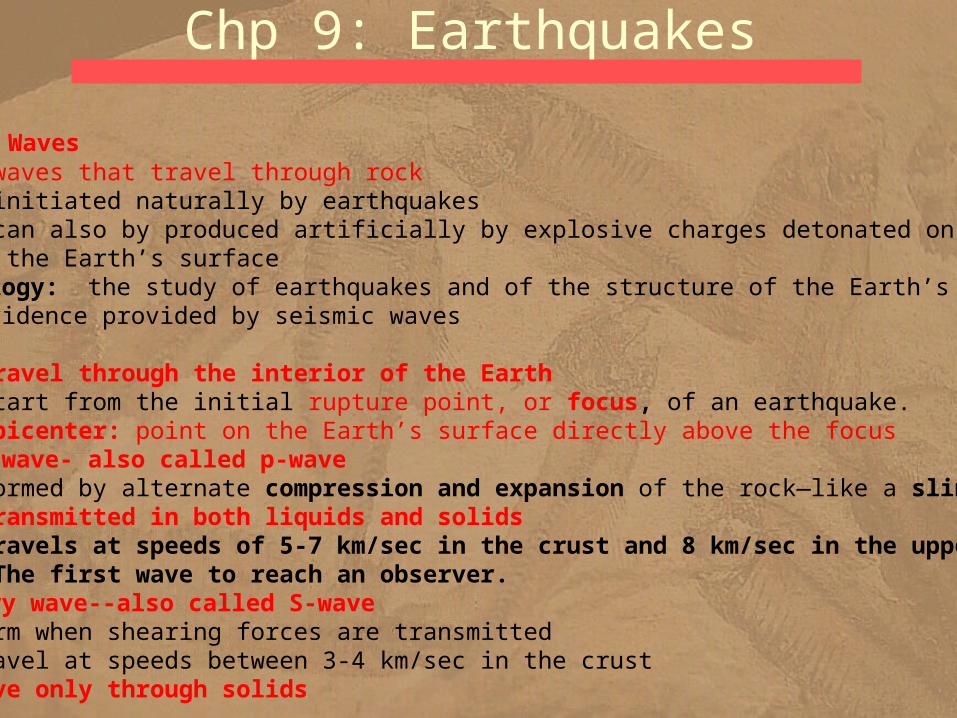
1. Seismic Waves -waves that travel through rock -initiated naturally by earthquakes -can also by produced artificially by explosive charges detonated on or beneath the Earth’s surface
seismology: the study of earthquakes and of the structure of the Earth’s interior from evidence provided by seismic waves body waves
-travel through the interior of the Earth -start from the initial rupture point, or focus, of an earthquake. -Epicenter: point on the Earth’s surface directly above the focus
a. primary wave- also called p-wave -formed by alternate compression and expansion of the rock—like a slinky. -Transmitted in both liquids and solids -Travels at speeds of 5-7 km/sec in the crust and 8 km/sec in the upper mantle -The first wave to reach an observer.
b. Secondary wave--also called S-wave -Form when shearing forces are transmitted -Travel at speeds between 3-4 km/sec in the crust -Move only through solids
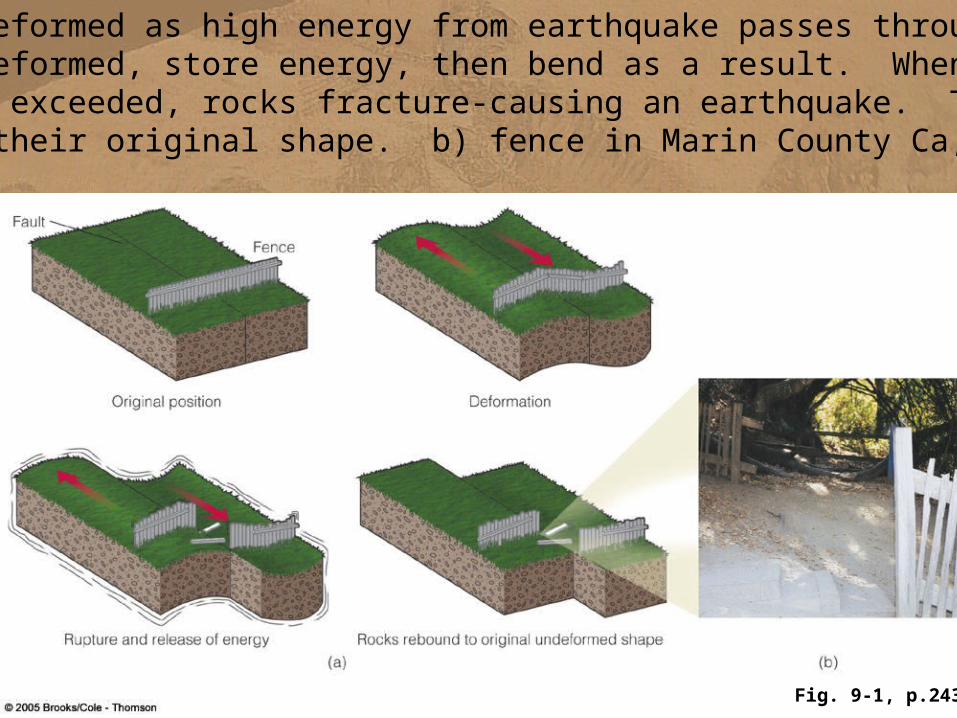
Fig. 9-1, p.243
Rocks are deformed as high energy from earthquake passes through-rocks are deformed, store energy, then bend as a result. When internalstrength is exceeded, rocks fracture-causing an earthquake. They rebound to their original shape. b) fence in Marin County Ca, offset 5m

Surface waves due to earthquake
Fig. 9-8, p.251
Pwave= parallel to direction of movement
Swave= perpendicular
Chp 9: Earthquakes 5. Secondary wave--also called S-wave
-Form when shearing forces are transmitted -Travel at speeds between 3-4 km/sec in the crust -Move only through solids
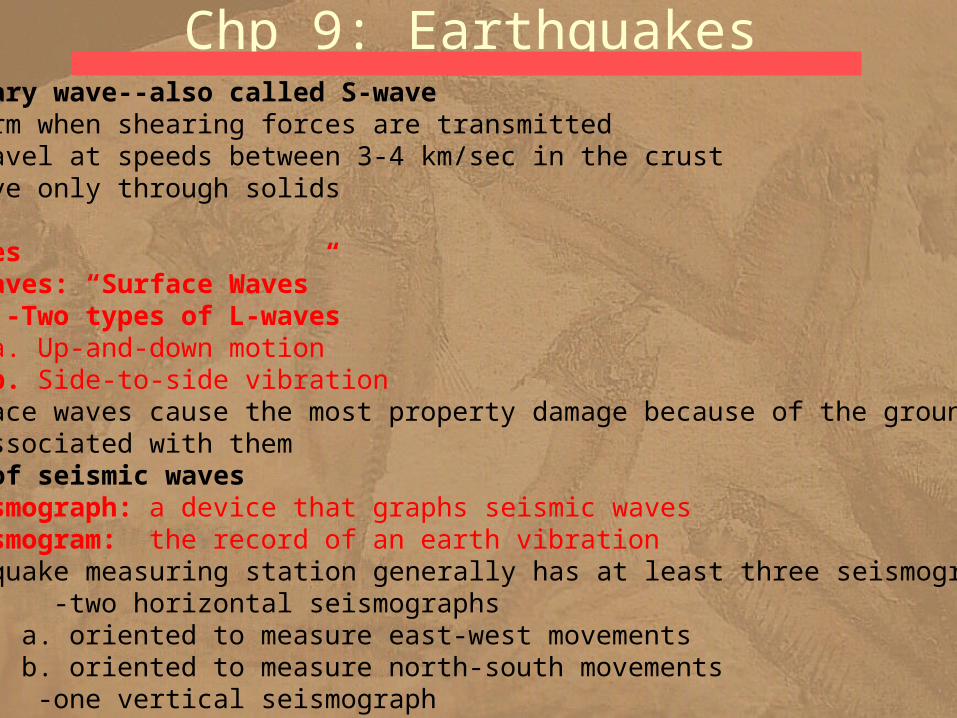
B. Surface waves 1. L-Waves: “Surface Waves”
-Two types of L-waves a. Up-and-down motion b. Side-to-side vibration
Surface waves cause the most property damage because of the ground motion associated with them
C. Measurement of seismic waves -seismograph: a device that graphs seismic waves -seismogram: the record of an earth vibration An earthquake measuring station generally has at least three seismographs
-two horizontal seismographs a. oriented to measure east-west movements b. oriented to measure north-south movements
-one vertical seismograph
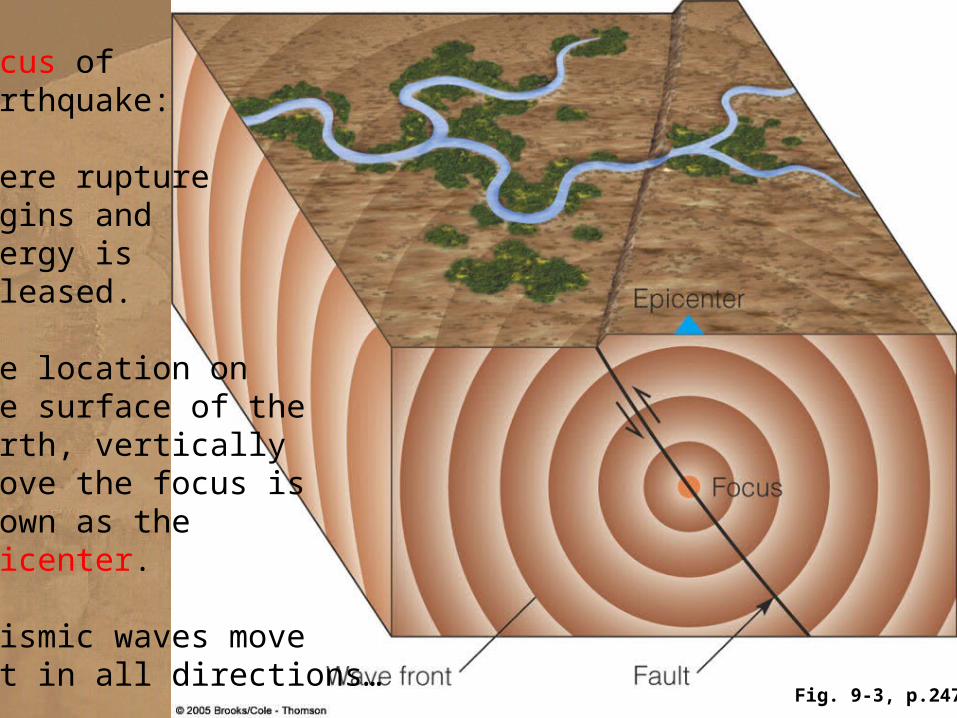
Fig. 9-3, p.247
Focus ofearthquake:
Where rupturebegins and energy isreleased.
The location onthe surface of the earth, verticallyabove the focus isknown as the Epicenter.
Seismic waves moveout in all directions…
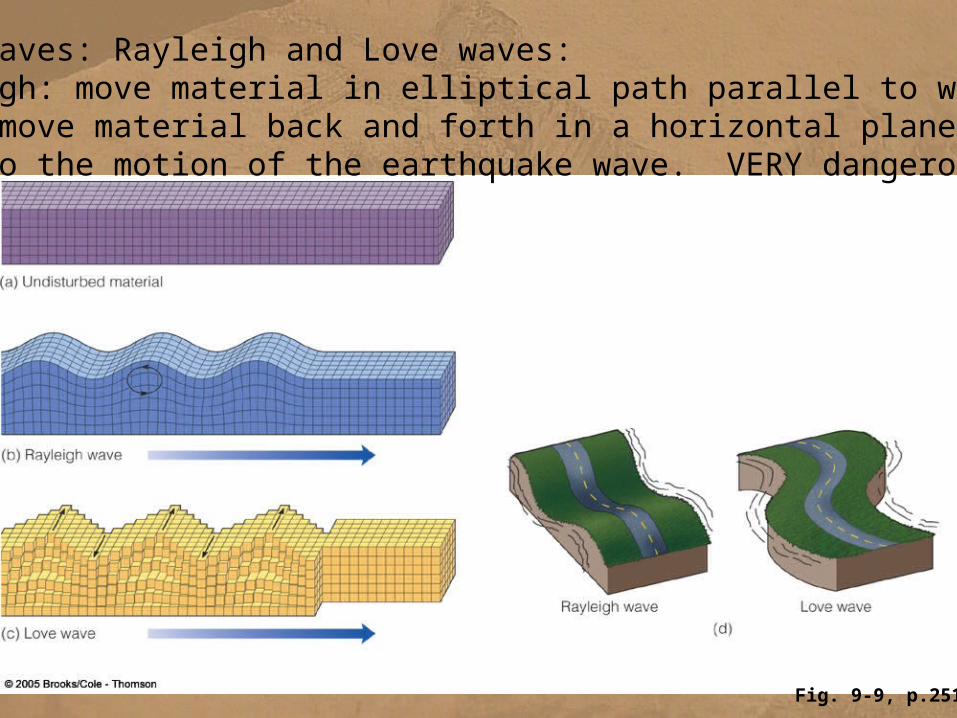
Fig. 9-9, p.251
Types of S waves: Rayleigh and Love waves: a. Rayleigh: move material in elliptical path parallel to wave direction b. Love: move material back and forth in a horizontal plane, perpendic- ular to the motion of the earthquake wave. VERY dangerous to homes
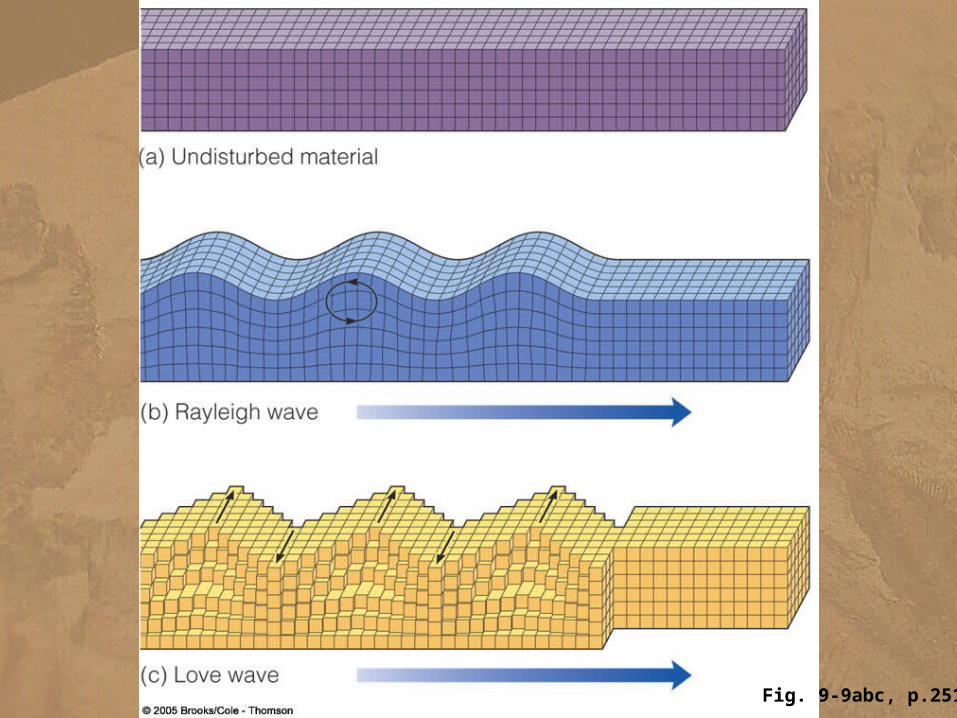
Fig. 9-9abc, p.251
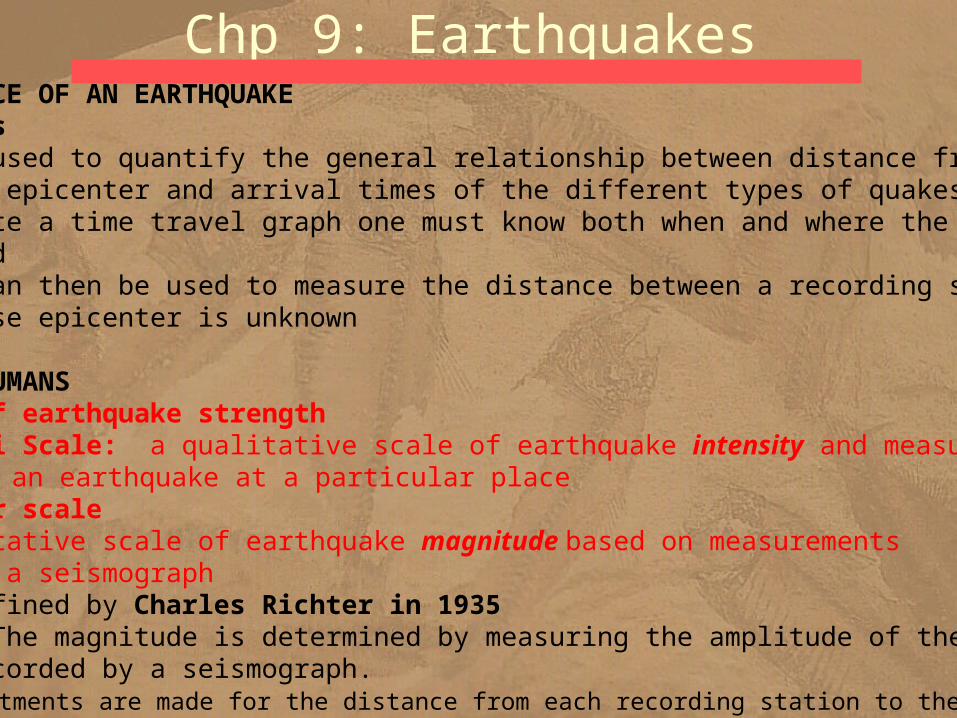
Chp 9: EarthquakesLOCATING THE SOURCE OF AN EARTHQUAKETime-travel Curves
1. Graphs used to quantify the general relationship between distance from an earthquake epicenter and arrival times of the different types of quakes 2. to create a time travel graph one must know both when and where the earthquake occurred 3. graph can then be used to measure the distance between a recording station and an earthquake whose epicenter is unknown
EARTHQUAKES AND HUMANSA. Measurements of earthquake strength
1. Mercalli Scale: a qualitative scale of earthquake intensity and measures the effects of an earthquake at a particular place 2. Richter scale
a. A quantitative scale of earthquake magnitude based on measurements made by a seismographb. first refined by Charles Richter in 1935
c. The magnitude is determined by measuring the amplitude of the largest wave recorded by a seismograph. Adjustments are made for the distance from each recording station to the earthquake
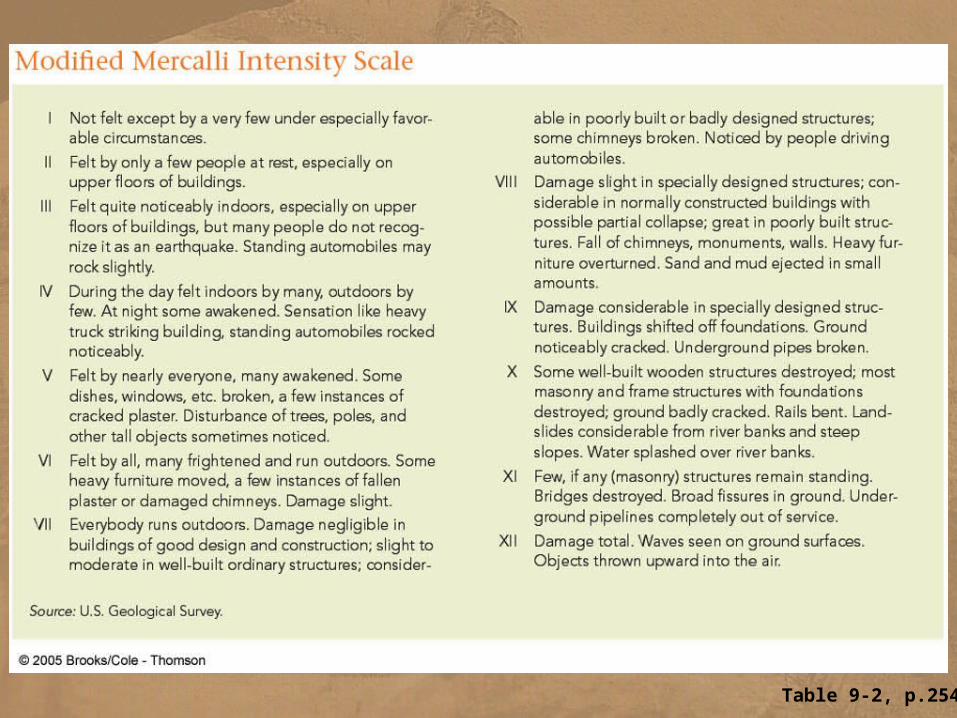
Table 9-2, p.254
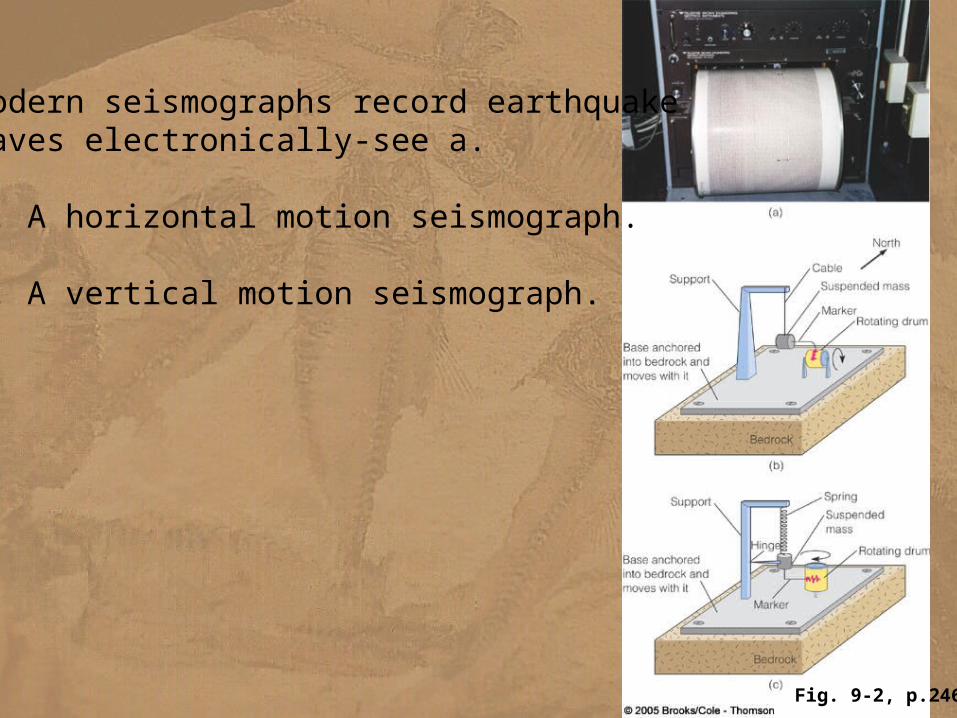
Fig. 9-2, p.246
Modern seismographs record earthquakewaves electronically-see a.
b. A horizontal motion seismograph.
c. A vertical motion seismograph.
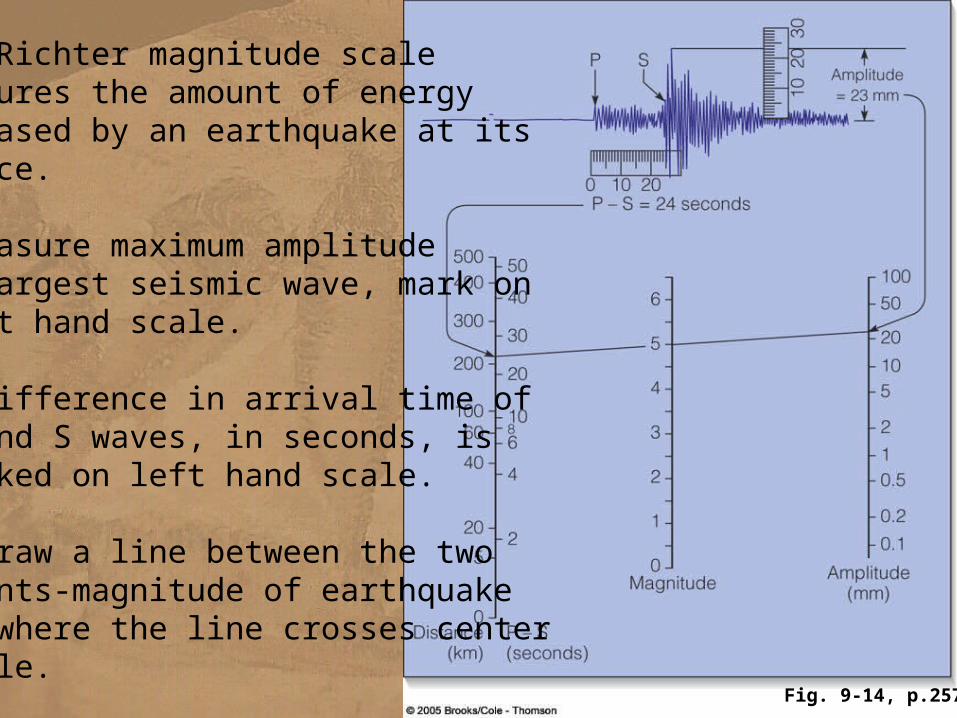
Fig. 9-14, p.257
The Richter magnitude scalemeasures the amount of energyreleased by an earthquake at itssource.
1.Measure maximum amplitudeof largest seismic wave, mark onright hand scale.
2. Difference in arrival time of P and S waves, in seconds, is marked on left hand scale.
3. Draw a line between the two points-magnitude of earthquake is where the line crosses center scale.
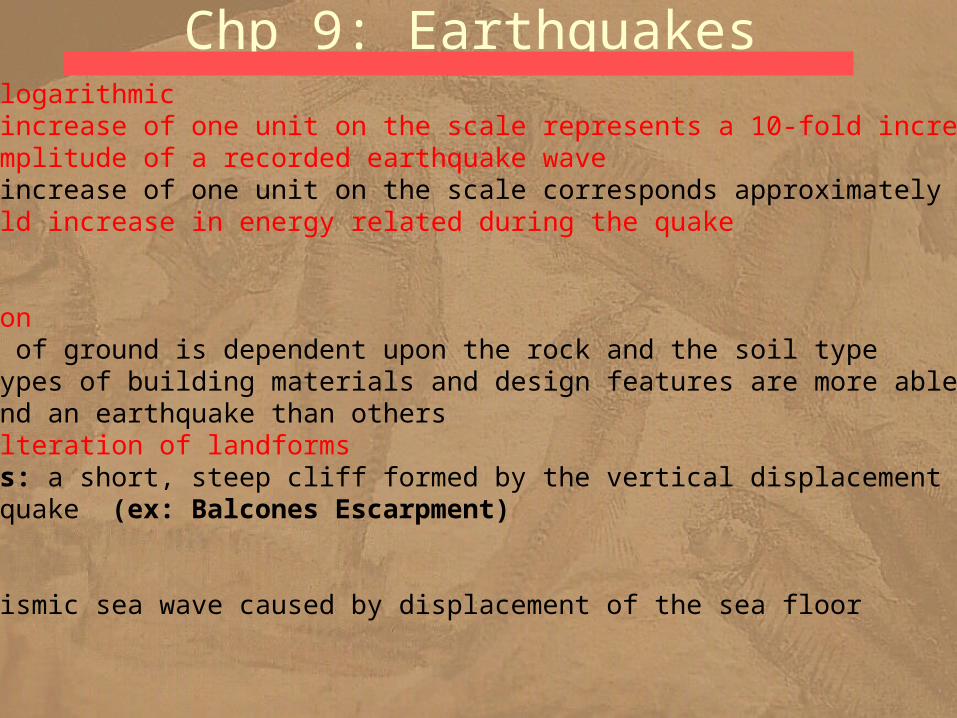
Chp 9: Earthquakes d. Scale is logarithmic
1.An increase of one unit on the scale represents a 10-fold increase in the amplitude of a recorded earthquake wave 2.An increase of one unit on the scale corresponds approximately to a 30-fold increase in energy related during the quake
B. Earthquake Damage 1. Ground motion
-Motion of ground is dependent upon the rock and the soil type - Some types of building materials and design features are more able to withstand an earthquake than others
2. Permanent alteration of landforms Scarps: a short, steep cliff formed by the vertical displacement of land by an earthquake (ex: Balcones Escarpment)
3. Fire 4. Landslides 5. Tsunamis: Seismic sea wave caused by displacement of the sea floor
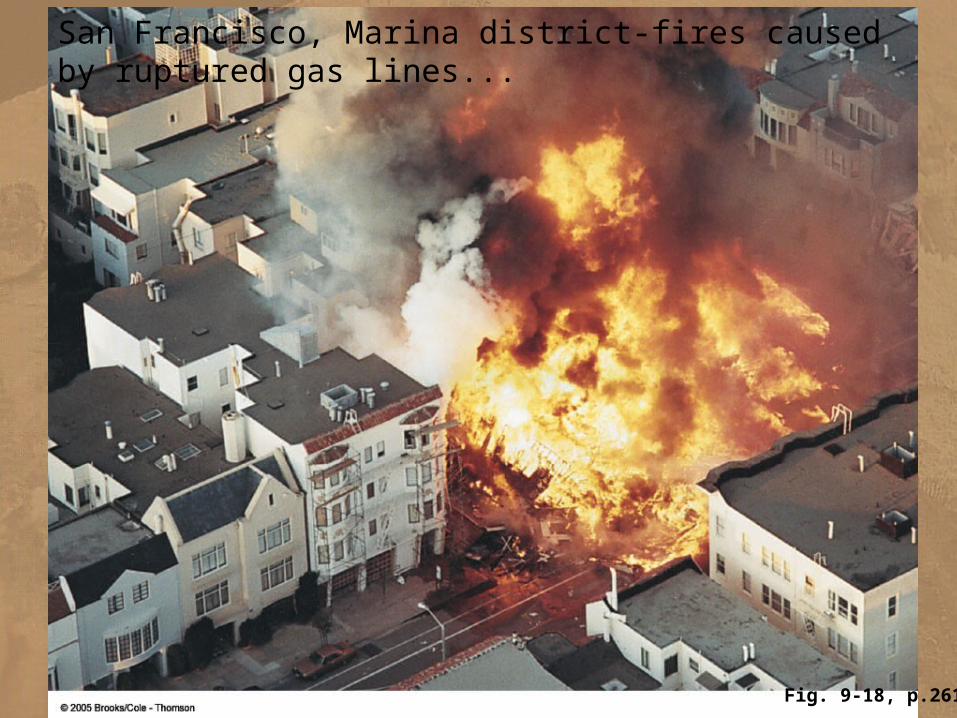
San Francisco, Marina district-fires caused by ruptured gas lines...
Fig. 9-18, p.261
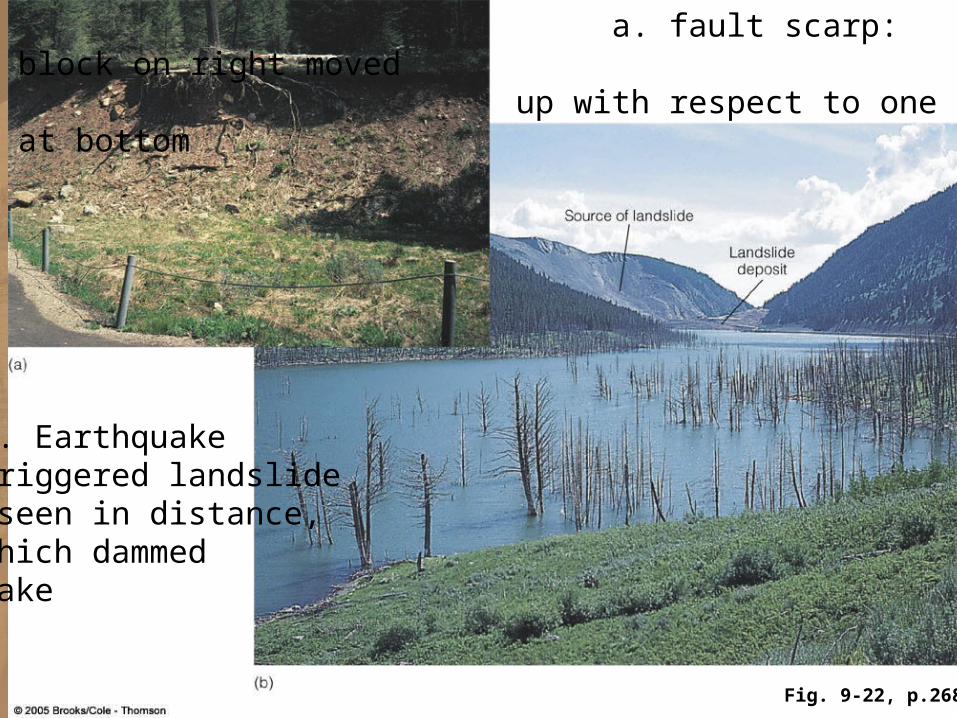
a. fault scarp: block on right moved up with respect to one at bottom
Fig. 9-22, p.268
b. Earthquake triggered landslide,seen in distance,which dammed lake
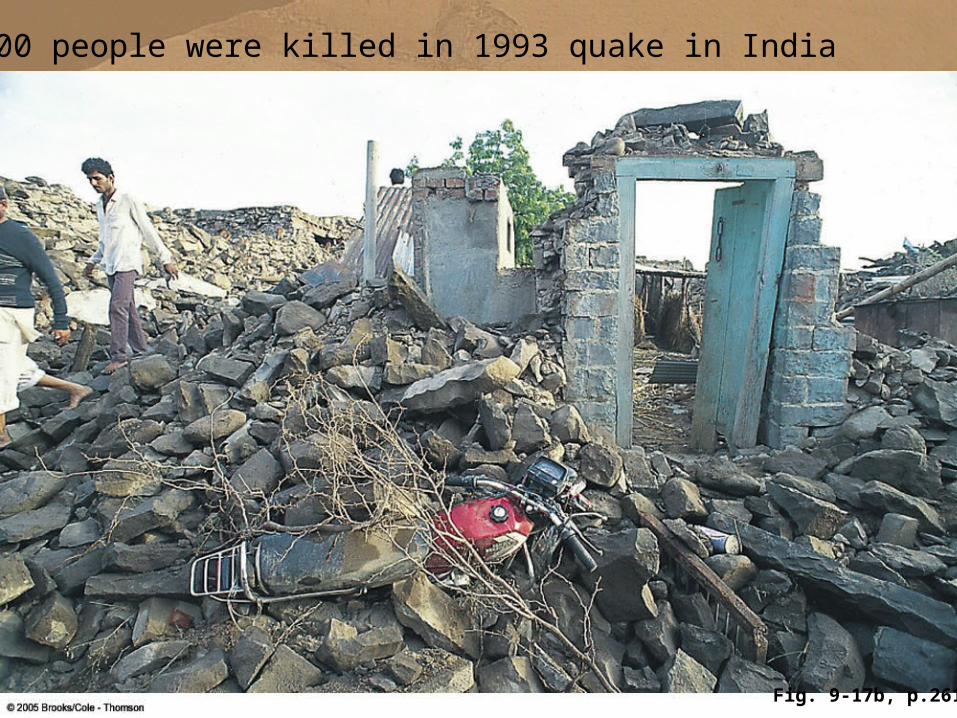
Fig. 9-17b, p.261
30,000 people were killed in 1993 quake in India

Earthquake damage in Pacific: Kobe Japan; Oakland, Ca; Northridge
Fig. 9-6, p.249

Fig. 9-19, p.264
Tsunami crashes into street in Hilo, Hawaii in 1946-caused byEarthquake in Aleutian Islands….159 people died in Hilo
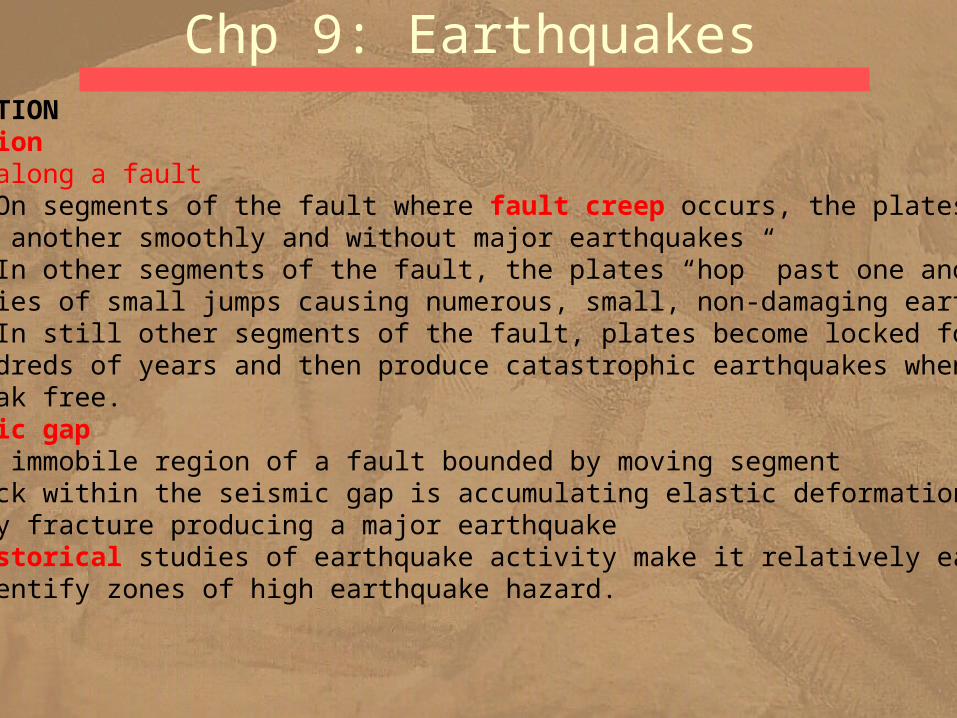
Chp 9: EarthquakesEARTHQUAKE PREDICTIONLong-Term Prediction 1. Motion along a fault
a. On segments of the fault where fault creep occurs, the plates slip past one another smoothly and without major earthquakes b. In other segments of the fault, the plates “hop” past one another in a series of small jumps causing numerous, small, non-damaging earthquakes c. In still other segments of the fault, plates become locked for tens to hundreds of years and then produce catastrophic earthquakes when they break free.
2. Seismic gap a. An immobile region of a fault bounded by moving segment b. Rock within the seismic gap is accumulating elastic deformation and will
eventually fracture producing a major earthquake 3. Historical studies of earthquake activity make it relatively easy to identify zones of high earthquake hazard.
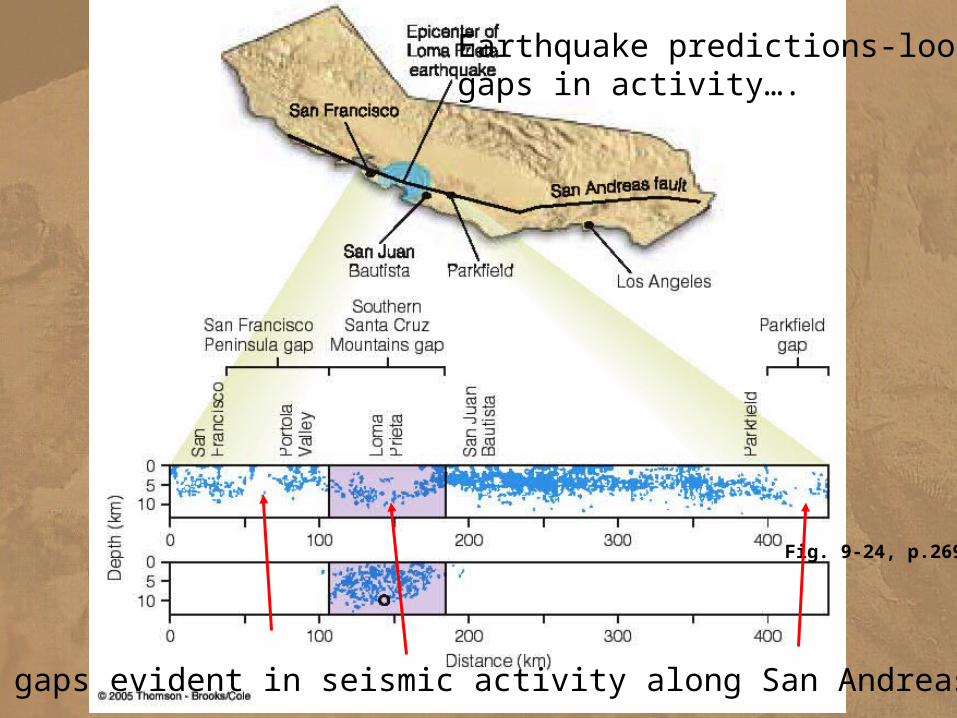
Fig. 9-24, p.269
3 gaps evident in seismic activity along San Andreas fault
Earthquake predictions-look forgaps in activity….
Chp 9: EarthquakesB. Short-Term Prediction
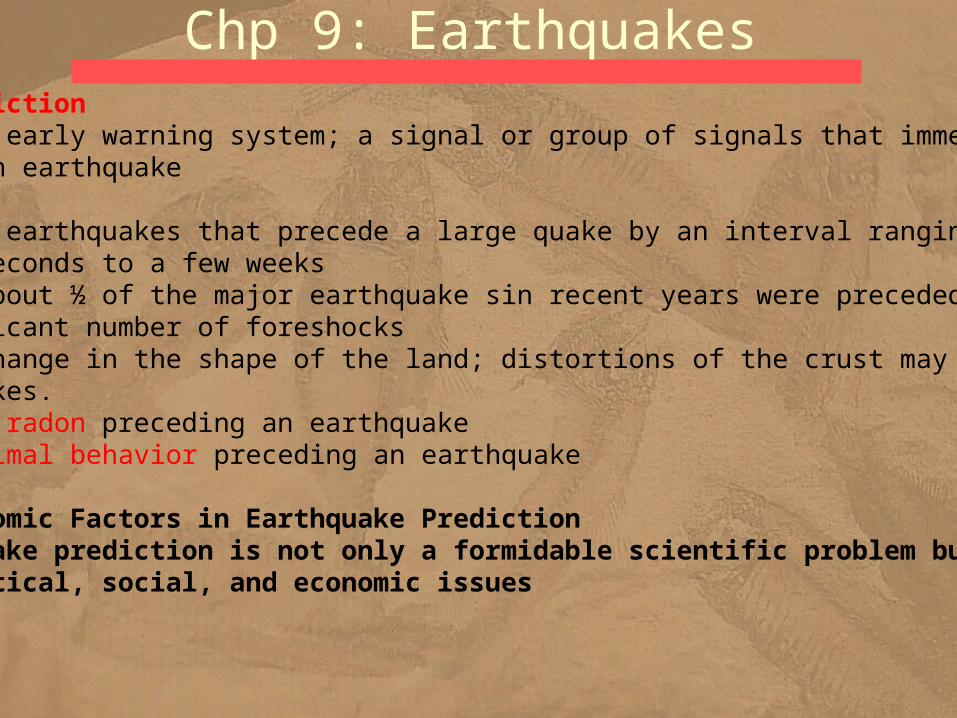
1. A reliable early warning system; a signal or group of signals that immediately precedes an earthquake 2. Foreshocks
-Small earthquakes that precede a large quake by an interval ranging from a few seconds to a few weeks -Only about ½ of the major earthquake sin recent years were preceded by a significant number of foreshocks
-Measure change in the shape of the land; distortions of the crust may precede major earthquakes. 3. release of radon preceding an earthquake 4. strange animal behavior preceding an earthquake
C. Social and Economic Factors in Earthquake PredictionShort-term earthquake prediction is not only a formidable scientific problem but it also involves political, social, and economic issues
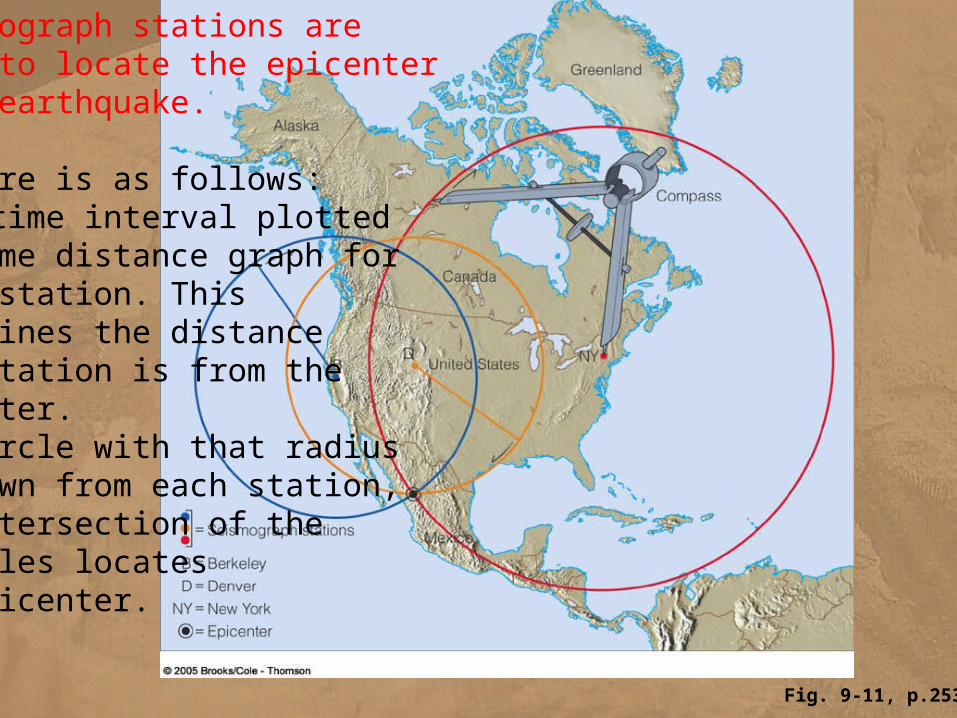
Fig. 9-11, p.253
3 seismograph stations areneeded to locate the epicenterof any earthquake.
Procedure is as follows:1. P-S time interval plotted on time distance graph for each station. This determines the distance each station is from the epicenter.2. A circle with that radius is drawn from each station, the intersection of the 3 circles locates the epicenter.
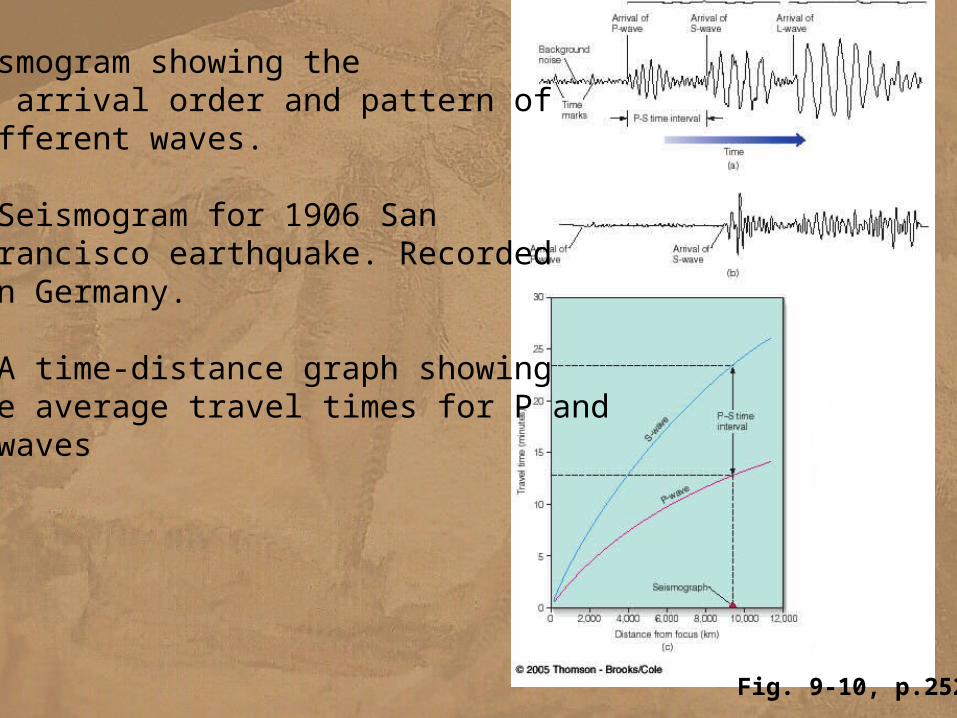
Fig. 9-10, p.252
Seismogram showing the a. arrival order and pattern of different waves.
b. Seismogram for 1906 San Francisco earthquake. Recorded in Germany.
c. A time-distance graph showing the average travel times for P and S waves
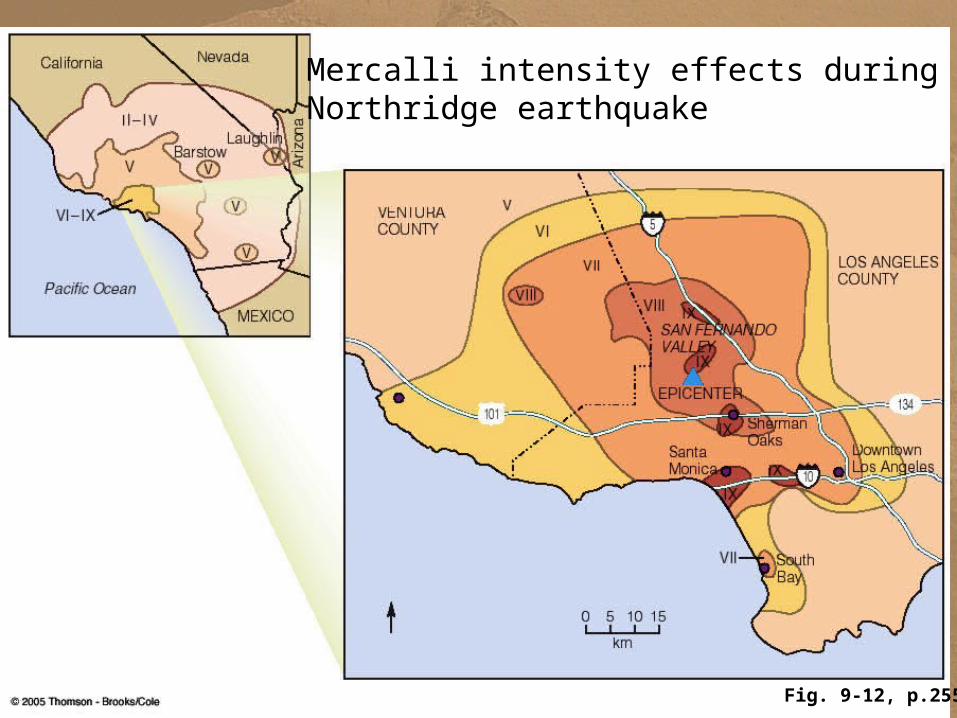
Fig. 9-12, p.255
Mercalli intensity effects during Northridge earthquake
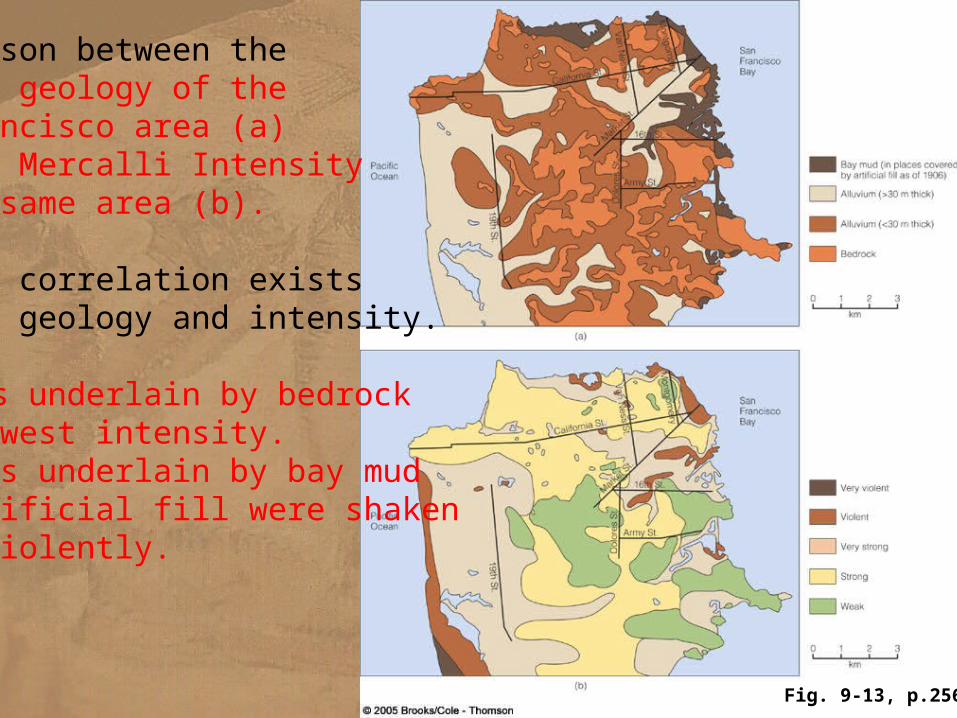
Fig. 9-13, p.256
Comparison between thegeneral geology of theSan Francisco area (a) and the Mercalli Intensitymap of same area (b).
A close correlation existsbetween geology and intensity.
a. Areas underlain by bedrock had lowest intensity.b. Areas underlain by bay mud or artificial fill were shaken most violently.
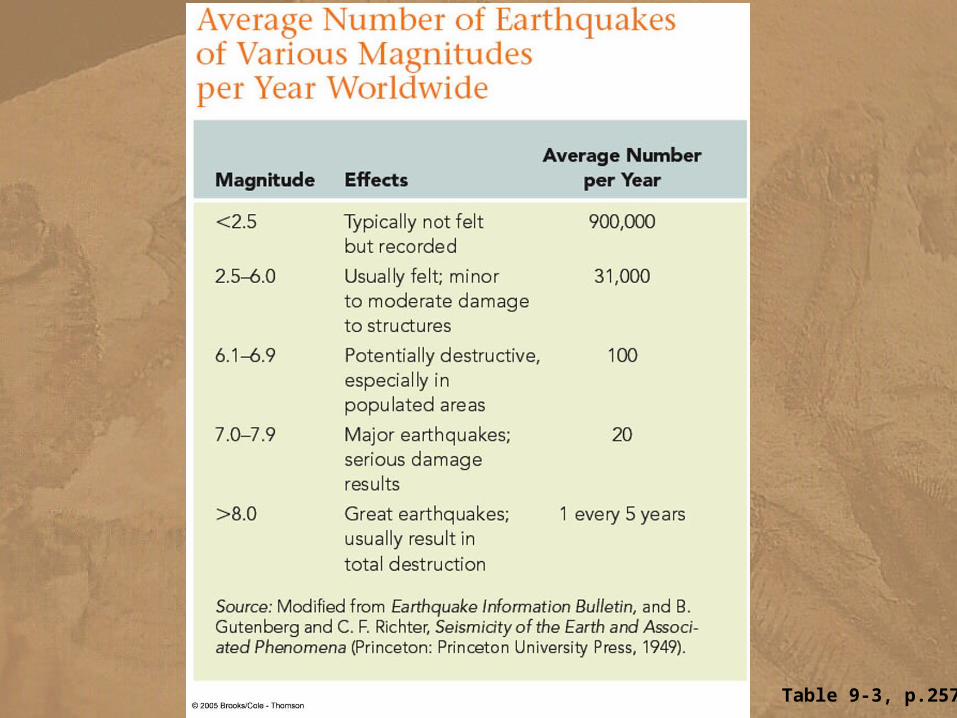
Table 9-3, p.257
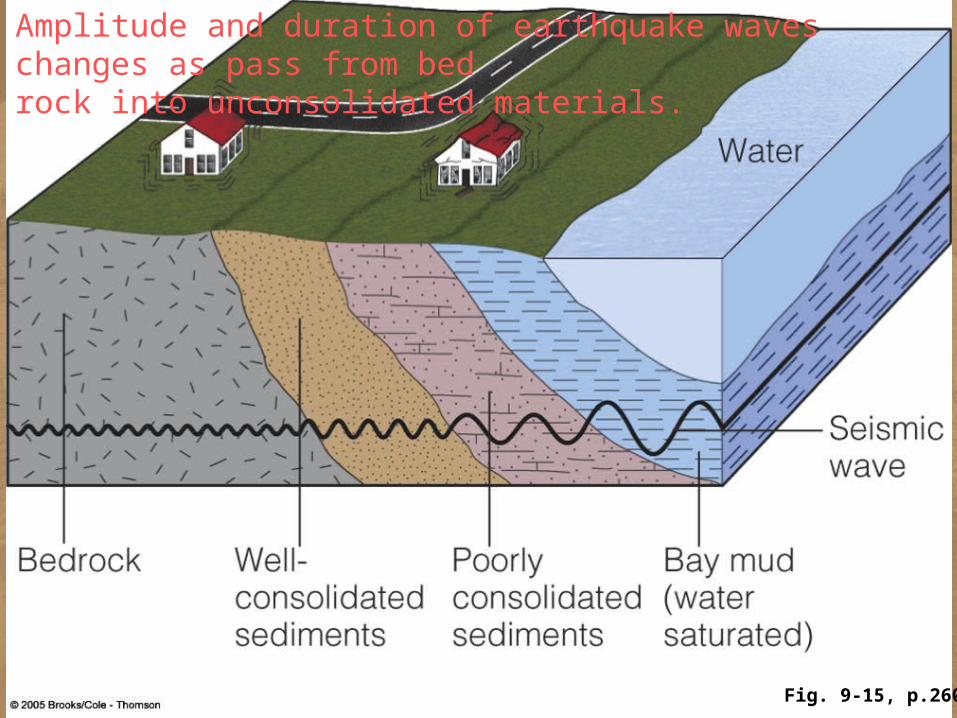
Amplitude and duration of earthquake waves changes as pass from bedrock into unconsolidated materials.
Fig. 9-15, p.260

p.259
Things you can do to strengthen your home-attach to foundation…..
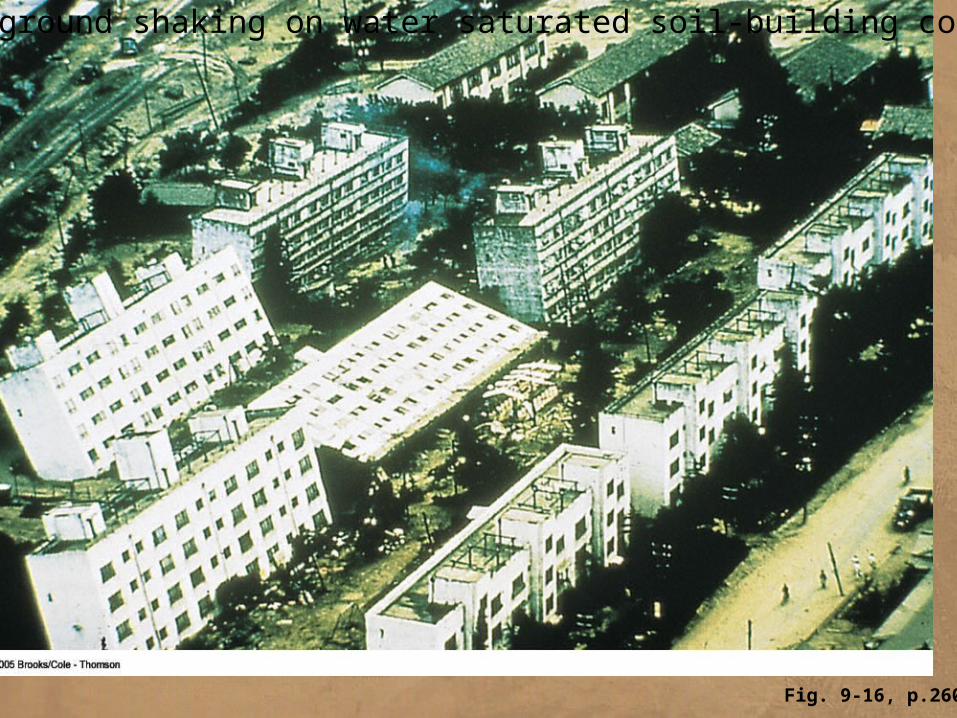
Fig. 9-16, p.260
Effects of ground shaking on water saturated soil-building collapse, Japan
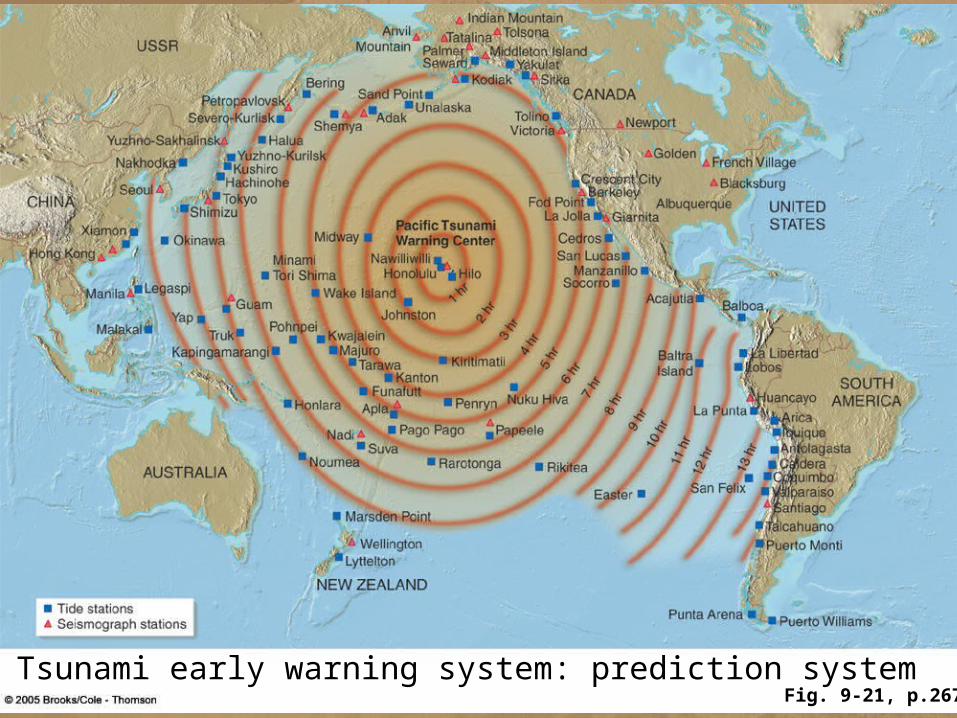
Fig. 9-21, p.267
Pacific Tsunami early warning system: prediction system
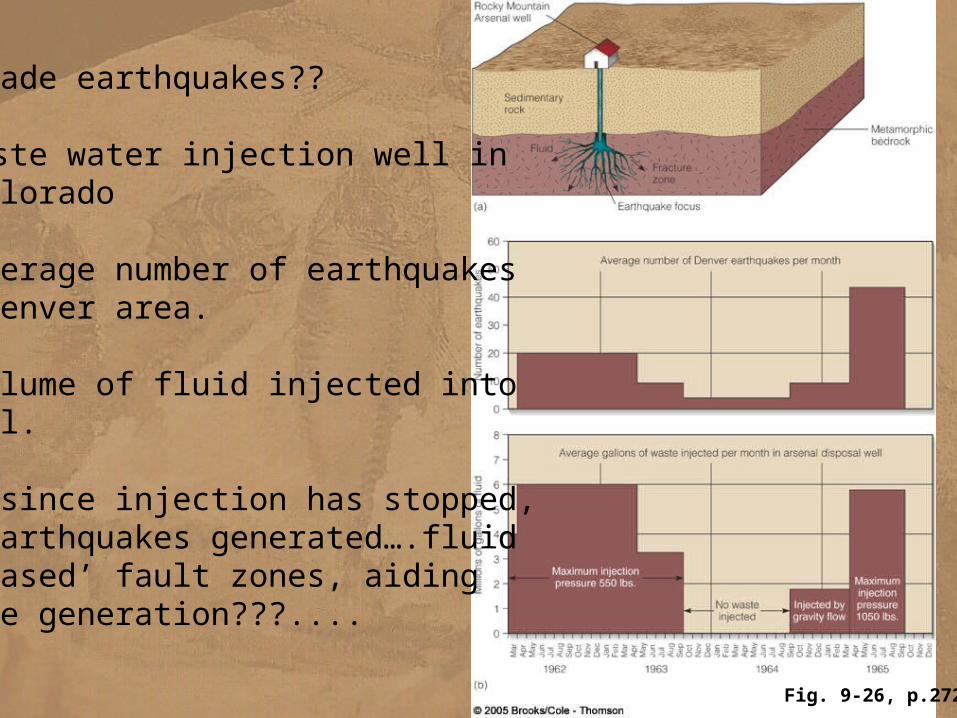
Fig. 9-26, p.272
Man-made earthquakes??
a. Waste water injection well in Colorado
b. Average number of earthquakes in Denver area.
c. Volume of fluid injected into well.
Note-since injection has stopped, no earthquakes generated….fluid ‘greased’ fault zones, aiding quake generation???....
Chp 9: EarthquakesSTUDING THE INTERIOR OF THE EARTHA. Seismic Tomography 1. Geologists use seismic waves to study the interior of the Eart 2. Properties of waves
a. In a uniform homogeneous medium, a wave radiates velocity b.The velocity of a seismic wave depends on the nature of the material that travels through; i.e. its rigidity and density c. When waves pass form one material to another, they refract (bend) d. P-waves are compressional waves and travel through all media—gases, liquids, and solids—whereas S-waves are only transmitted through solids.
3. In a uniform and homogeneous Earth waves will radiate form the focus of an earthquake in concentric spheres and travel uniformly through the planet. Uniform propagation of waves is not observed
B. Discovery of the core 1. Shadow Zone a. No direct waves are defected beyond 105 degrees from the focus b. Caused by a discontinuity deep in the interior of the Earth c. The shadow zone exists because of refraction of the p-waves at the mantle-core boundary and the failure of s-waves to pass through
Chp 9: Earthquakes2. The failure of s-waves to pass through the outer core, and the refraction of p-waves shows that the core is composed of an inner solid sphere surrounded by an outer liquid sphere
C. Discovery of the Crust-Mantle BoundaryMohorovicic Discontinuity (Moho): the boundary between the crust and the mantle was first identified as the boundary between different types of rock that transmit waves at different velocities. THE EARTH’S INTERIORSeismic Tomography: The study of the Earth’s interior indirectly by studying the action of seismic waves.This information was discovered by seismic interpretation A. The Crust 1. The outer shell of the Earth 2. Oceanic crust
-7-10 km thick -p-waves travel through oceanic crust (basaltic composition) at 7 km/sec
3. Continental crust -20-70 km thick -p-waves travel through continental crust (granitic composition) at 6km/sec
Chp 10: Earth’s Interior
Chp 9: Earthquakes
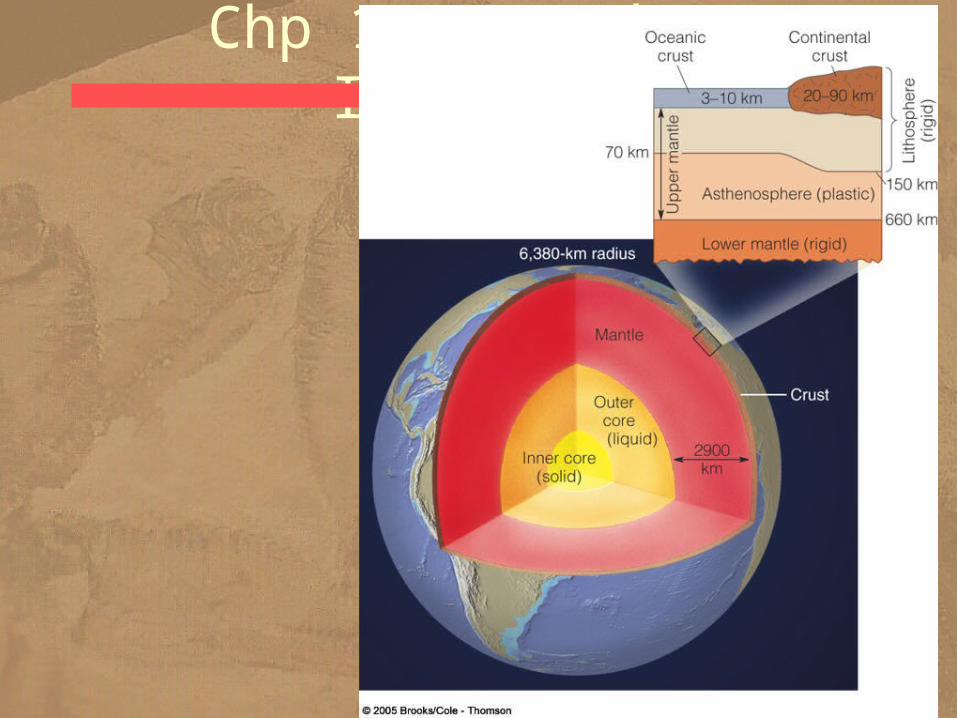
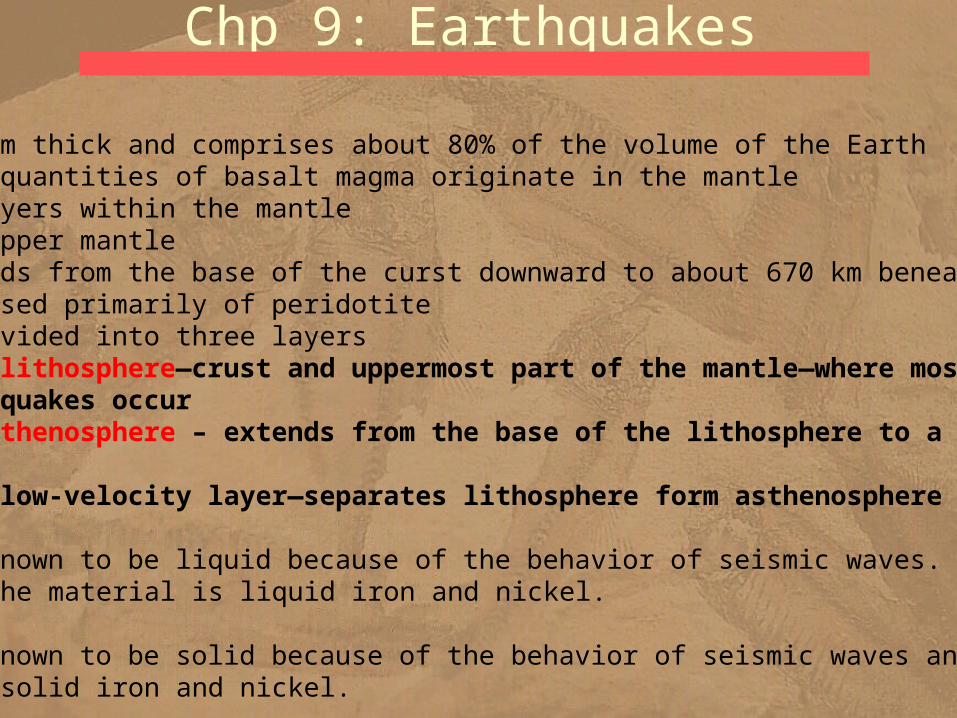
B. The Mantle 1. 2900 km thick and comprises about 80% of the volume of the Earth 2. Large quantities of basalt magma originate in the mantle 3. The layers within the mantle
a.Upper mantle --Extends from the base of the curst downward to about 670 km beneath the surface --composed primarily of peridotite -- subdivided into three layers 1. lithosphere—crust and uppermost part of the mantle—where most earthquakes occur 2. asthenosphere – extends from the base of the lithosphere to a depth of 350 km 3. low-velocity layer—separates lithosphere form asthenosphere
C. Outer Core – known to be liquid because of the behavior of seismic waves. It is speculated that the material is liquid iron and nickel.
D. Inner Core – known to be solid because of the behavior of seismic waves and is thought to be solid iron and nickel.
Chp 9: Earthquakes: Summary
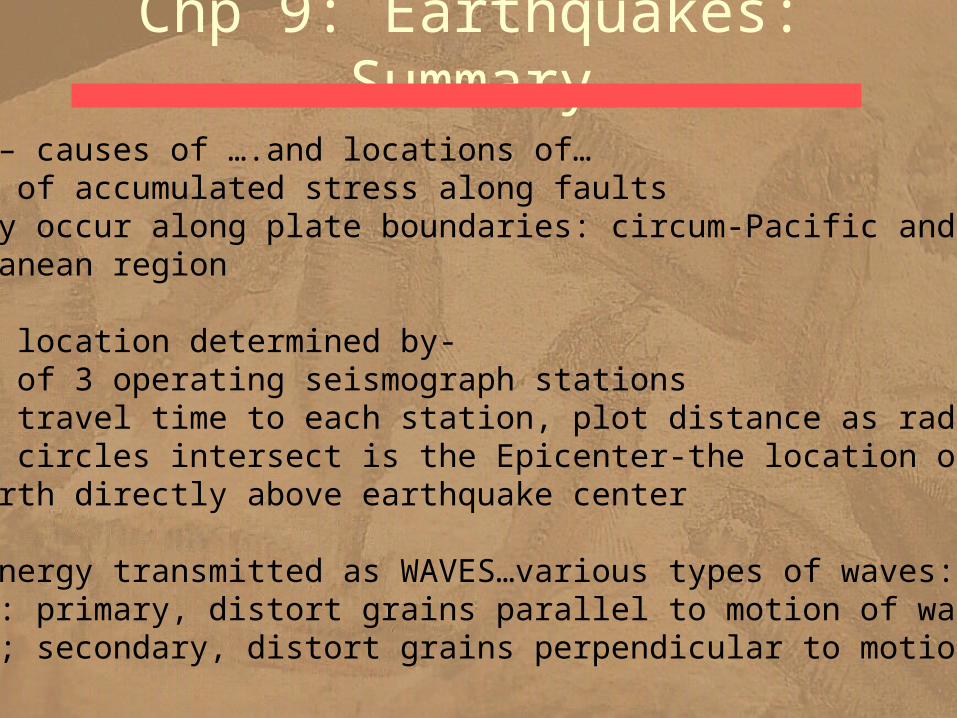
Earthquakes – causes of ….and locations of… a. release of accumulated stress along faults b. commonly occur along plate boundaries: circum-Pacific and Mediterranean region
Earthquakes: location determined by- a. minimum of 3 operating seismograph stations b. measure travel time to each station, plot distance as radius of circle c. where 3 circles intersect is the Epicenter-the location on the surface of the Earth directly above earthquake center
Earthquake energy transmitted as WAVES…various types of waves: a. P waves: primary, distort grains parallel to motion of wave b. S waves; secondary, distort grains perpendicular to motion of wave

Fig. 9-5, p.248
Tonga volcanic arc, Pacific O: focal depth increases in well-defined Zone that defines subducting oceanic plate…called Benioff Zone….
Subducting oceanic plate…
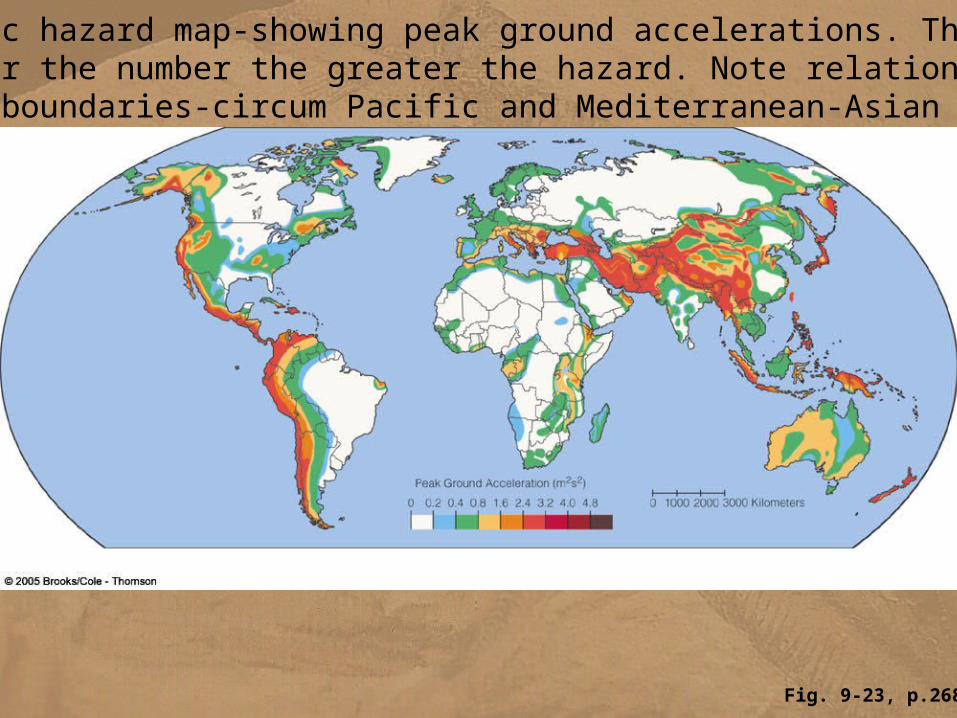
Fig. 9-23, p.268
Seismic hazard map-showing peak ground accelerations. The higher the number the greater the hazard. Note relationship withplate boundaries-circum Pacific and Mediterranean-Asian
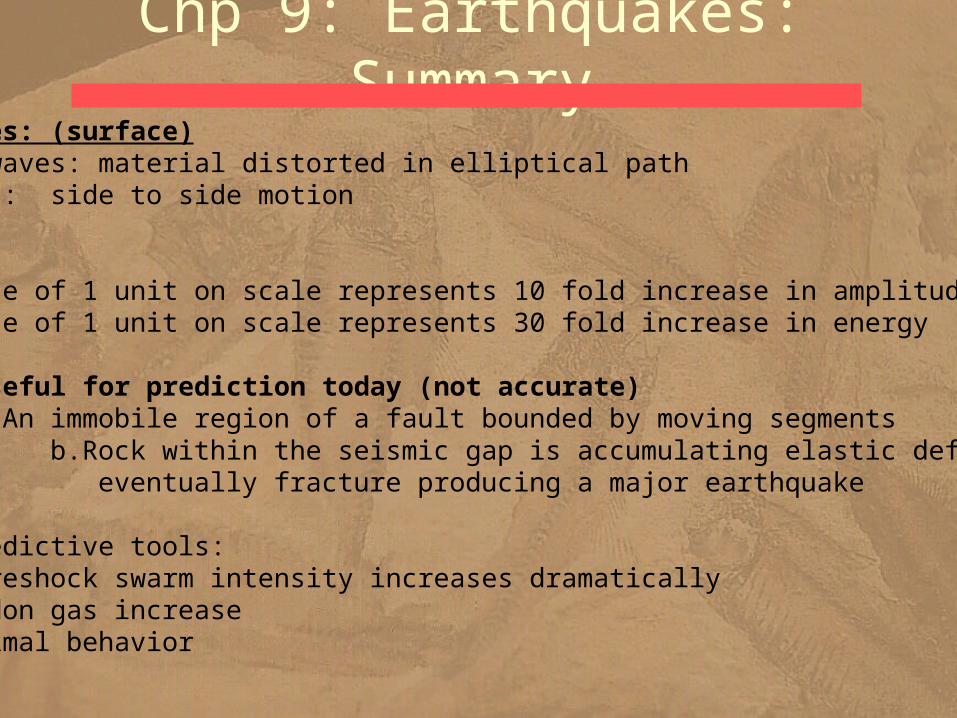
Chp 9: Earthquakes: SummaryTypes of S waves: (surface) a. Rayleigh waves: material distorted in elliptical path b. Love waves: side to side motion
Richter Scale: a. an increase of 1 unit on scale represents 10 fold increase in amplitude b. an increase of 1 unit on scale represents 30 fold increase in energy
Seismic gap: useful for prediction today (not accurate) a. An immobile region of a fault bounded by moving segments
b.Rock within the seismic gap is accumulating elastic deformation and will eventually fracture producing a major earthquake
Other predictive tools: a. foreshock swarm intensity increases dramatically b. radon gas increase c. animal behavior

Chp 9: Earthquakes: SummaryPropogation of seismic waves from earthquakes has greatly aided our understanding of composition of interior of Earth:
A. The Crust 1. The outer shell of the Earth 2. Oceanic crust
-7-10 km thick -p-waves travel through oceanic crust (basaltic composition) at 7 km/sec
3. Continental crust -20-70 km thick -p-waves travel through continental crust (granitic composition) at 6km/sec
B. The Mantle 1. 2900 km thick and comprises about 80% of the volume of the Earth 2. Large quantities of basalt magma originate in the mantle 3. The layers within the mantle
Chp 9: Earthquakes: Summary
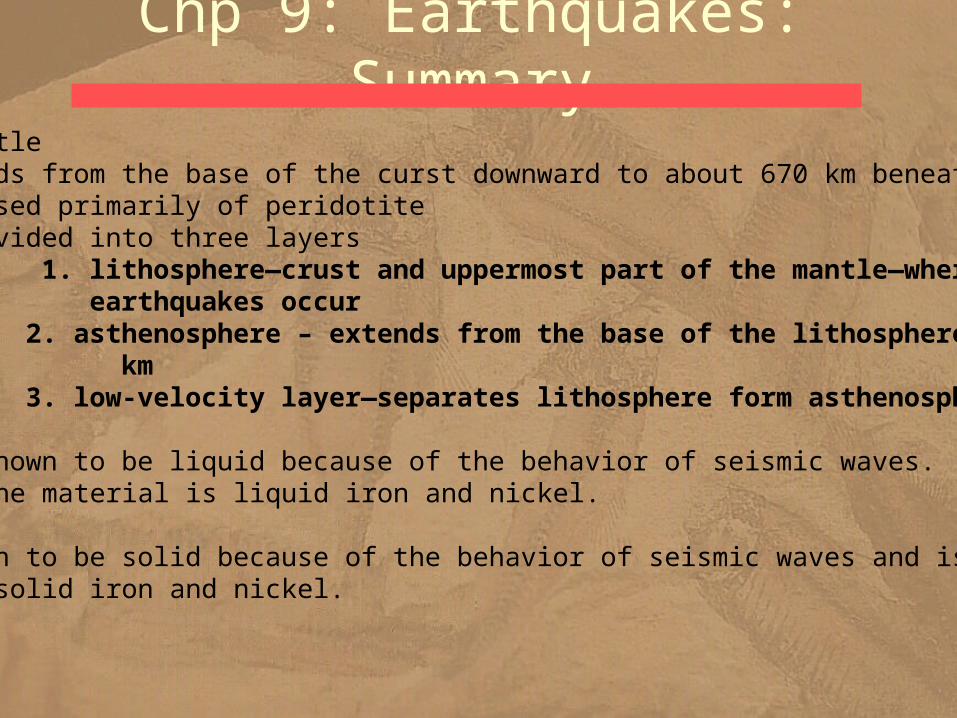
a.Upper mantle --Extends from the base of the curst downward to about 670 km beneath the surface --composed primarily of peridotite -- subdivided into three layers
1. lithosphere—crust and uppermost part of the mantle—where most earthquakes occur 2. asthenosphere – extends from the base of the lithosphere to a depth of 350 km 3. low-velocity layer—separates lithosphere form asthenosphere
C. Outer Core – known to be liquid because of the behavior of seismic waves. It is speculated that the material is liquid iron and nickel.
Inner Core – known to be solid because of the behavior of seismic waves and is thought to be solid iron and nickel.

Chp 10: Earth’s Interior
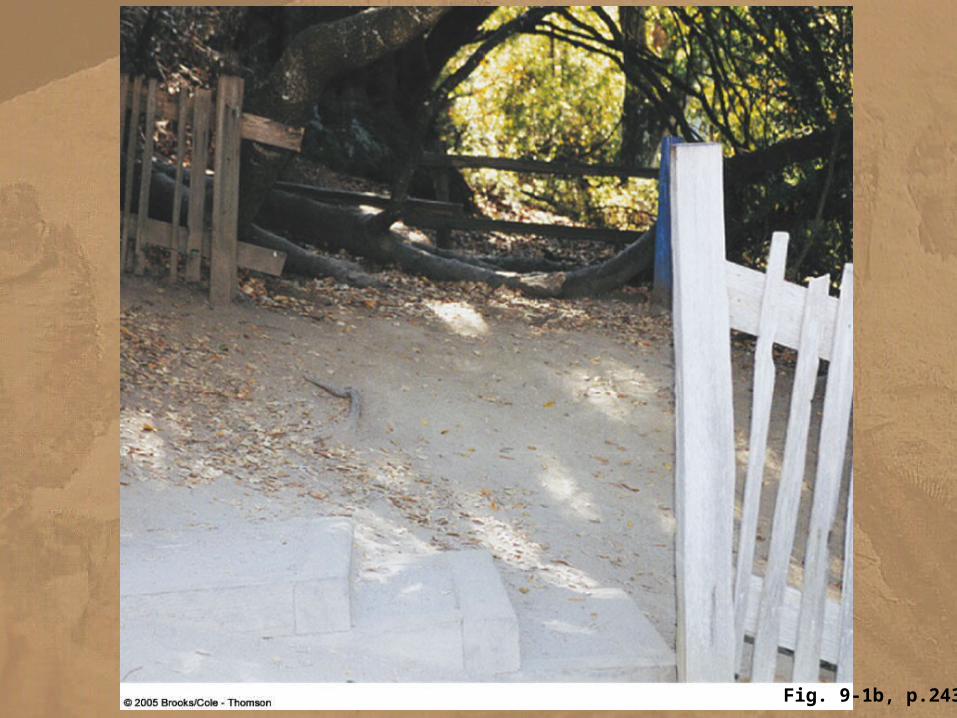
Fig. 9-1b, p.243
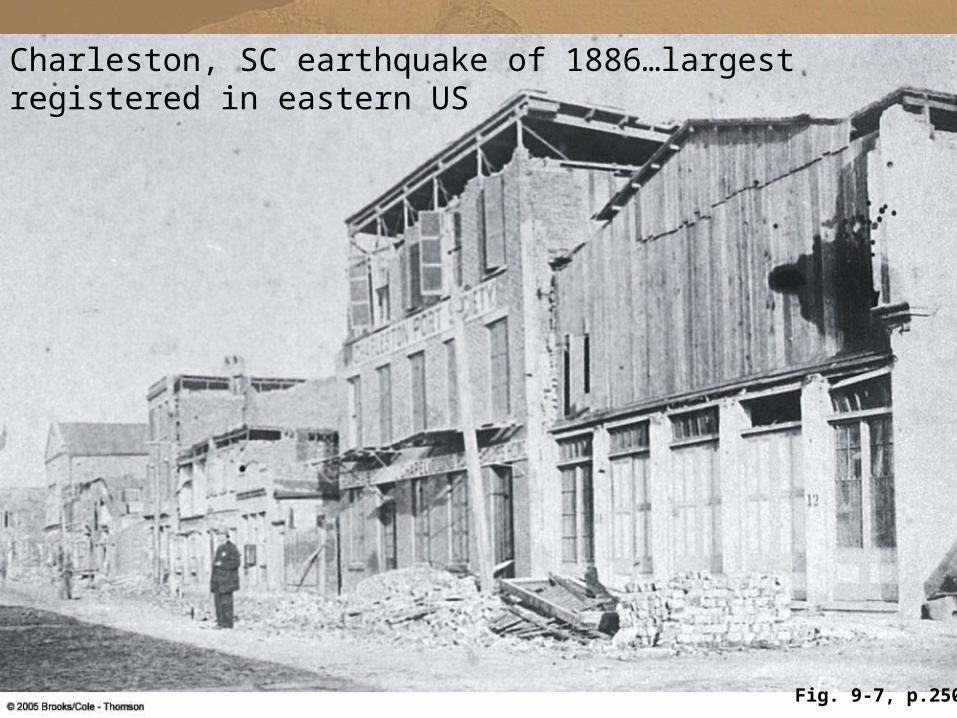
Charleston, SC earthquake of 1886…largest registered in eastern US
Fig. 9-7, p.250
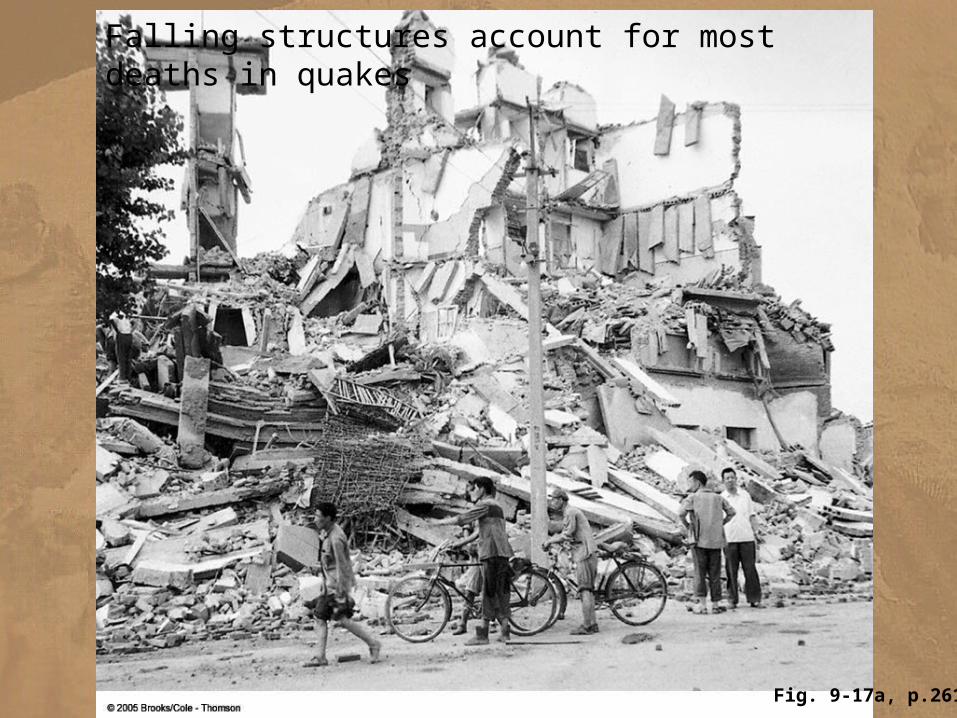
Falling structures account for most deaths in quakes
Fig. 9-17a, p.261
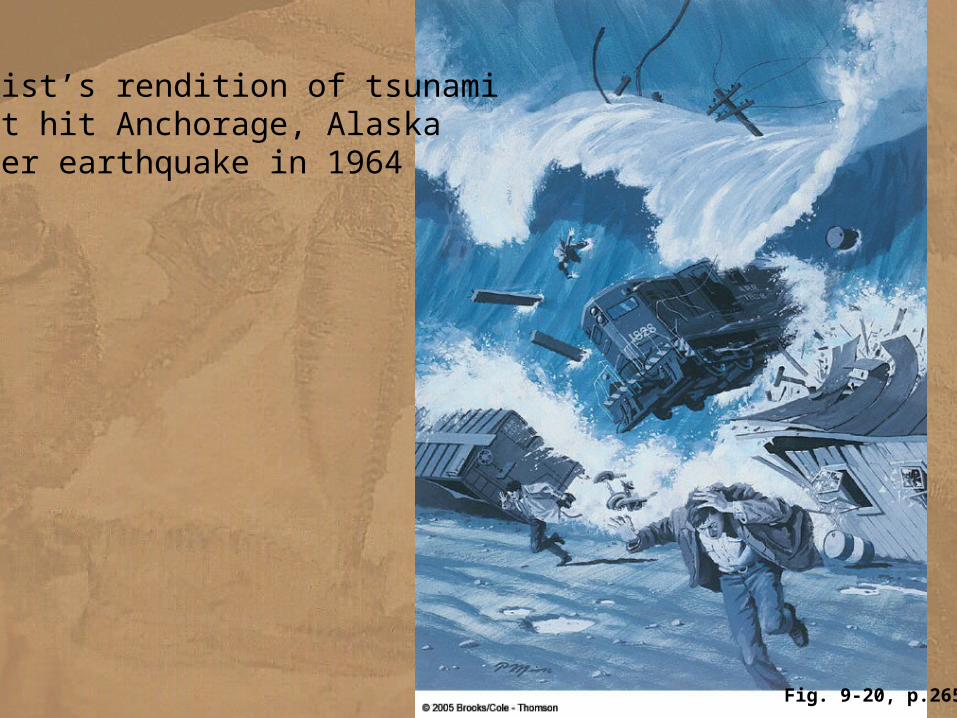
Fig. 9-20, p.265
Artist’s rendition of tsunamithat hit Anchorage, Alaskaafter earthquake in 1964

Fig. 9-25, p.270
Earthquake monitoring and prediction: dilatancy=cracking
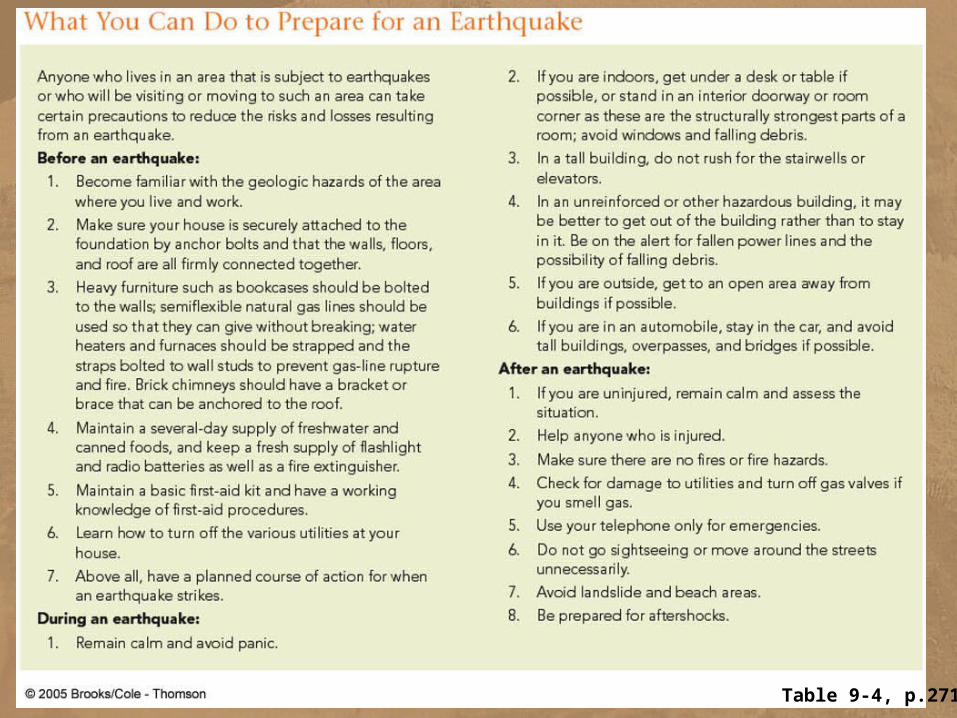
Table 9-4, p.271
p.244
p.245

Fig. 9-1a, p.243
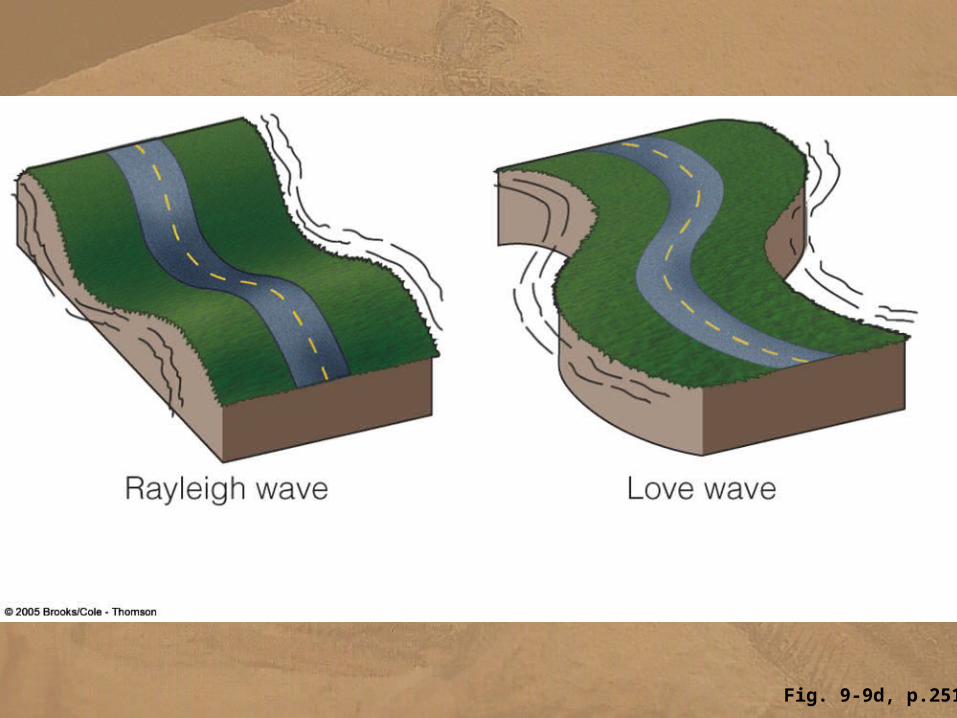
Fig. 9-9d, p.251