Absence of superconductivity in NbB - arXiv · Absence of superconductivity in NbB F. Abud,1, ......
7
arXiv:1708.08570v1 [cond-mat.supr-con] 29 Aug 2017 Absence of superconductivity in NbB F. Abud, 1, ∗ L. E. Correa, 2 I. R. Souza Filho, 2 A. J. S. Machado, 2 M. S. Torikachvili, 3 and R. F. Jardim 1 1 Instituto de F´ ısica, Universidade de S˜ao Paulo, Rua do Mat˜ao, 1371, 05508-090, S˜ao Paulo, SP, Brazil 2 Escola de Engenharia de Lorena, Universidade de S˜ao Paulo, Caixa Postal 116, 12600-970, Lorena, SP, Brazil 3 Department of Physics, San Diego State University, San Diego, California 92182-1233, USA (Dated: March 23, 2018) A systematic study of the superconducting properties in a series of arc-melted Nb-B samples close to the 1:1 composition was carried out. Powder X-ray diffraction (XRD) shows that all samples are both non-stoichiometric, and comprising of two crystal phases: a majority orthorhombic NbB-type phase, and traces of a minor body-centered cubic Nb-rich phase Nbss with stoichiometry close to Nb0.98B0.02 . The emergence of superconductivity near Tc ∼ 9.0 K was inferred from magnetization data in chunk and powder samples. However, the very small superconducting volume fractions are inconsistent with superconductivity arising from the major NbB phase. On the other hand, micro- graphs of selected samples clearly show that the minority Nbss forms a three-dimensional network of filaments that meander around the grains of the majority phase, forming a percolation path. Here we report the superconductivity of the Nbss phase, and argue that the low superconducting volume fraction of non-stoichiometric NbB and zero resistance are due to the filaments of the minority phase. The electronic contribution to the entropy of the superconducting state, yielded from an analysis using the alpha model for single-band systems, indicates that the Sommerfeld constant of the arc-melted samples is close to the values found in non-superconducting NbB. Micrograph, XRD, and bulk measurements of magnetization, electrical resistivity, and specific heat suggest that the superconducting state in the NbB samples bearing some Nbss minority phase is due to the latter. I. INTRODUCTION Superconductivity in borides has been widely stud- ied for over six decades. 1–3 The more recent discov- ery of superconductivity in MgB 2 , 4 with superconduct- ing critical temperature T c ∼ 40 K renewed the inter- est in boron compounds, and provided the impetus be- hind the review of the properties of a large number of transition-metal boride. 5–8 Frequently these studies indi- cated that the phase purity, non-stoichiometric composi- tions, and the presence of interstitial defects are impor- tant parameters in determining the physical properties in these materials. 9 In this framework, the emergence of superconductivity in several borides such as TaB 2 , NbB 2 , and ZrB 2 has generated some controversy. 10–13 Further- more, a reported T c ∼ 8.25 K in NbB, 14 was the highest amongst (TM)B compounds (TM = transition metal). The potential for applications, and perhaps a starting point for the search for higher T c materials were iden- tified as far back as 1952. 2 Despite the large number of studies addressing the properties of the monoboride com- pounds, detailed studies of the superconducting proper- ties of NbB are still lacking. Previous studies of superconductivity in NbB may be regarded as controversial. First, the value of T c has been reported in a broad range of temperature, ranging form 6K 1 to 8.25 K. 2 Secondly, other studies argued that su- perconductivity is absent down to 1.1 K 15 or even 0.42 K. 11 Besides these discrepancies, low-temperature spe- cific heat data in NbB showed no evidence of supercon- ductivity down to 1.5 K. 16 The lack of any features in the specific heat consistent with superconductivity down to 1.5 K, raises the question of whether the supercon- ductivity identified by electrical transport and magnetic susceptibility is a bulk phenomenon. 16 The NbB phase crystallizes in the orthorhombic sym- metry, space group Cmcm (no. 63) Pearson symbol oC8, with lattice parameters a = 3.298, b = 8.724, and c = 3.166 ˚ A. 17 The boron sites are arranged in chains along the c -axis, and located at the center of the faces of octa- hedra formed by Nb atoms. In addition to these struc- tural features, little attention had been paid to more spe- cific properties of the superconducting state in NbB, and a detailed picture is lacking. A number of different methods have been used for the synthesis of NbB: (i) arc melting; 2,17 (ii) solid state reaction; 16,18,19 and (iii) combustion synthesis. 20 Regard- less of the method, niobium-rich solid solutions, Nb ss , and elemental Nb are commonly identified as extra phases. 18,20,21 These Nb-rich solid solutions are known superconducting materials. 22 The partial substitution of B for Nb, the B presence in interstitial sites, and disor- der, may all contribute to a drop in T c . 22 Consequently, samples of NbB usually contain extra phases, making it difficult to discern precisely whether superconductivity is inherent to the NbB phase or not. Within this context, we carried out a systematic study of the superconducting properties of arc-melted NbB samples. The study was conducted in a set of twenty NbB specimens with chemical compositions in the vicin- ity of 1:1. The samples were then characterized by powder XRD, scanning electron microscopy (SEM), and measurements of magnetization, electrical resistivity, and heat capacity. Very small amounts of Nb ss were detected
Transcript of Absence of superconductivity in NbB - arXiv · Absence of superconductivity in NbB F. Abud,1, ......

arX
iv:1
708.
0857
0v1
[co
nd-m
at.s
upr-
con]
29
Aug
201
7
Absence of superconductivity in NbB
F. Abud,1, ∗ L. E. Correa,2 I. R. Souza Filho,2 A. J. S. Machado,2 M. S. Torikachvili,3 and R. F. Jardim1
1Instituto de Fısica, Universidade de Sao Paulo,
Rua do Matao, 1371, 05508-090, Sao Paulo, SP, Brazil2Escola de Engenharia de Lorena, Universidade de Sao Paulo,
Caixa Postal 116, 12600-970, Lorena, SP, Brazil3Department of Physics, San Diego State University, San Diego, California 92182-1233, USA
(Dated: March 23, 2018)
A systematic study of the superconducting properties in a series of arc-melted Nb-B samples closeto the 1:1 composition was carried out. Powder X-ray diffraction (XRD) shows that all samples areboth non-stoichiometric, and comprising of two crystal phases: a majority orthorhombic NbB-typephase, and traces of a minor body-centered cubic Nb-rich phase Nbss with stoichiometry close toNb0.98B0.02. The emergence of superconductivity near Tc ∼ 9.0 K was inferred from magnetizationdata in chunk and powder samples. However, the very small superconducting volume fractions areinconsistent with superconductivity arising from the major NbB phase. On the other hand, micro-graphs of selected samples clearly show that the minority Nbss forms a three-dimensional networkof filaments that meander around the grains of the majority phase, forming a percolation path. Herewe report the superconductivity of the Nbss phase, and argue that the low superconducting volumefraction of non-stoichiometric NbB and zero resistance are due to the filaments of the minorityphase. The electronic contribution to the entropy of the superconducting state, yielded from ananalysis using the alpha model for single-band systems, indicates that the Sommerfeld constant ofthe arc-melted samples is close to the values found in non-superconducting NbB. Micrograph, XRD,and bulk measurements of magnetization, electrical resistivity, and specific heat suggest that thesuperconducting state in the NbB samples bearing some Nbss minority phase is due to the latter.
I. INTRODUCTION
Superconductivity in borides has been widely stud-ied for over six decades.1–3 The more recent discov-ery of superconductivity in MgB2,
4 with superconduct-ing critical temperature Tc ∼ 40 K renewed the inter-est in boron compounds, and provided the impetus be-hind the review of the properties of a large number oftransition-metal boride.5–8 Frequently these studies indi-cated that the phase purity, non-stoichiometric composi-tions, and the presence of interstitial defects are impor-tant parameters in determining the physical propertiesin these materials.9 In this framework, the emergence ofsuperconductivity in several borides such as TaB2, NbB2,and ZrB2 has generated some controversy.10–13 Further-more, a reported Tc ∼ 8.25 K in NbB,14 was the highestamongst (TM)B compounds (TM = transition metal).The potential for applications, and perhaps a startingpoint for the search for higher Tc materials were iden-tified as far back as 1952.2 Despite the large number ofstudies addressing the properties of the monoboride com-pounds, detailed studies of the superconducting proper-ties of NbB are still lacking.
Previous studies of superconductivity in NbB may beregarded as controversial. First, the value of Tc has beenreported in a broad range of temperature, ranging form6 K1 to 8.25 K.2 Secondly, other studies argued that su-perconductivity is absent down to 1.1 K15 or even 0.42K.11 Besides these discrepancies, low-temperature spe-cific heat data in NbB showed no evidence of supercon-ductivity down to 1.5 K.16 The lack of any features inthe specific heat consistent with superconductivity down
to 1.5 K, raises the question of whether the supercon-ductivity identified by electrical transport and magneticsusceptibility is a bulk phenomenon.16
The NbB phase crystallizes in the orthorhombic sym-metry, space group Cmcm (no. 63) Pearson symbol oC8,with lattice parameters a = 3.298, b = 8.724, and c =3.166 A.17 The boron sites are arranged in chains alongthe c-axis, and located at the center of the faces of octa-hedra formed by Nb atoms. In addition to these struc-tural features, little attention had been paid to more spe-cific properties of the superconducting state in NbB, anda detailed picture is lacking.
A number of different methods have been used forthe synthesis of NbB: (i) arc melting;2,17 (ii) solid statereaction;16,18,19 and (iii) combustion synthesis.20 Regard-less of the method, niobium-rich solid solutions, Nbss,and elemental Nb are commonly identified as extraphases.18,20,21 These Nb-rich solid solutions are knownsuperconducting materials.22 The partial substitution ofB for Nb, the B presence in interstitial sites, and disor-der, may all contribute to a drop in Tc.
22 Consequently,samples of NbB usually contain extra phases, making itdifficult to discern precisely whether superconductivity isinherent to the NbB phase or not.
Within this context, we carried out a systematic studyof the superconducting properties of arc-melted NbBsamples. The study was conducted in a set of twentyNbB specimens with chemical compositions in the vicin-ity of 1:1. The samples were then characterized bypowder XRD, scanning electron microscopy (SEM), andmeasurements of magnetization, electrical resistivity, andheat capacity. Very small amounts of Nbss were detected

2
both by XRD and SEM imaging. Together with the mea-surements of the physical properties, this study shedssome light on the controversial superconductivity in NbB.
II. EXPERIMENTAL
Twenty NbB polycrystalline samples with compositionclose to 1:1 were prepared by arc melting in a Ti-getteredUHP argon atmosphere. The starting materials for the∼ 1 gram samples were high purity Nb (99.99 at.%)foil, and flakes of natural boron (99.5 at.%; 10B/11B∼ 20/80 %) in atomic ratios close to 1:1. Two sam-ples were synthesized using isotopically enriched 10B and11B, with chemical purities of 99.75 and 99.5 at.%, re-spectively, and isotopic purities > 99 %. In order toavoid losses due to typical mini-explosions of B, the Bflakes were first wrapped in the Nb foil, and the wrapswere heated up slowly until the materials reacted fully.The resulting buttons were turned over and remelted atleast four times in order to promote homogeneity. Allsamples presented small weight losses of ∼ 1 wt.% afterthe melting process. If all losses were due to B, this wouldtranslate into a B atomic deficiency of about 10 %. In theset of samples discussed here no boron excess was addedto compensate for the mass loss during the melting, asperformed in other studies.11,18 In order to promote andtest for homogeneity, selected samples were annealed for∼ 35 days at 1100 ◦ C in evacuated quartz ampoules.In order to verify the phase composition of our sam-
ples and calculate the lattice parameters we took XRDpowder scans using a Bruker D8-Discover diffractome-ter. The measurements were performed at room tem-perature using CuKα radiation in the 15 ≤ 2θ ≤ 90◦
range with a 0.05◦ step size, and 2 s counting time. Ri-etveld refinements of the XRD data were performed withFULLPROF.23 Qualitative microstructural analysis wasconducted using a LEO 1430 VP SEM (Zeiss) operatingin the backscattered electrons mode, with 15 kV electronbeam.Magnetic susceptibility measurements, χ = M/H,
taken on parallelepiped-shaped and powder samples,were performed using a Quantum Design superconduct-ing quantum interference device (SQUID) magnetometer.The values of Tc and superconducting volume fraction(SVF) were taken from the measurements of χ. For themeasurements of Tc and χ the samples were first cooledto 1.8 K in zero field, a field was applied, and the χ vs Tdata was recorded upon warming to ∼ 15 K (ZFC) andcooling down again to 1.8 K (FC).The temperature and magnetic field dependence
of the electrical resistivity ρ(T,H) were obtained insmall rectangular pieces with approximate dimension of2 x 5 x 0.5 mm3, using a 4-probe technique, in a Quan-tum Design Dynacool Physical Property MeasurementSystem (PPMS), operating in the T and H ranges of 1.8- 300 K and 0 - 9 T, respectively. Specific heat Cp(T,H)data in the 0.05 to 300 K range were collected with the
0.01
0.1
1 38 390.02
0.04
0.06
*
Data - NbB#1 Calculated Difference NbB Peak position
Inte
nsity
(Nor
mal
ized
)
2 (°)
NbB#1 NbB#8 NbB#2 NbB#9 NbB#3
(151
)(021
)
(111
)
(040
)
(041
)
(110
)
(020
)
20 30 40 50 60 70 80
FIG. 1. Typical normalized XRD θ - 2θ scans for as-castNbB (NbB#1). The red line represents a Rietveld refinementobtained with FULLPROF, and the difference plots is shownat the bottom. The reflection corresponding to the minorityphase Nbss solid solution is indicated with an asterisk. Theinset displays an expanded view of XRD scans for five differentsamples near 2θ ∼ 38.5 ◦, the most intense reflection for Nbss.
PPMS as well, with the measurements below 2 K beingtaken with a mating dilution refrigerator. A summaryof the nominal compositions, boron isotope, heat treat-ment, identified phases, and Tc values is shown in TableI.
III. RESULTS AND DISCUSSION
A typical example of powder XRD scans for nearly allsamples of this study is displayed in Fig. 1. The datashown is from an as-cast NbB sample (NbB#1), in whichwe had the lowest mass loss upon melting (∼ 0.5 wt. %).A careful inspection of the diagram indicates that themost prominent diffraction peaks can be indexed usingan orthorhombic structure with space group Cmcm (no.63, Pearson symbol oC8).17 The calculated XRD matchesclosely the experimental pattern, as well as the scansfound in the literature. The calculated lattice parametersyielded by the Rietveld refinement a = 3.296, b = 8.722,and c = 3.165 A, are in excellent agreement with theliterature.17 Similar lattice parameters were found in allNbB samples studied in this work.Although the mass loss measured in all NbB samples
was rather small, it can be correlated to the appearanceof a low-intensity Bragg reflection near 2θ ∼ 38.5 ◦ (in-dicated with an asterisk in Fig. 1). This impurity phasereflection occurs in a 2θ value very close to the (110)reflection of elemental Nb, suggesting the presence of aNb-rich phase, possibly a solid solution. The correlationbetween the mass loss and the appearance of the (110) re-flection indicate the presence of a Nb-rich Nbss phase co-existing with the majority NbB phase, consistently withthe Nb-B phase diagram.24
3
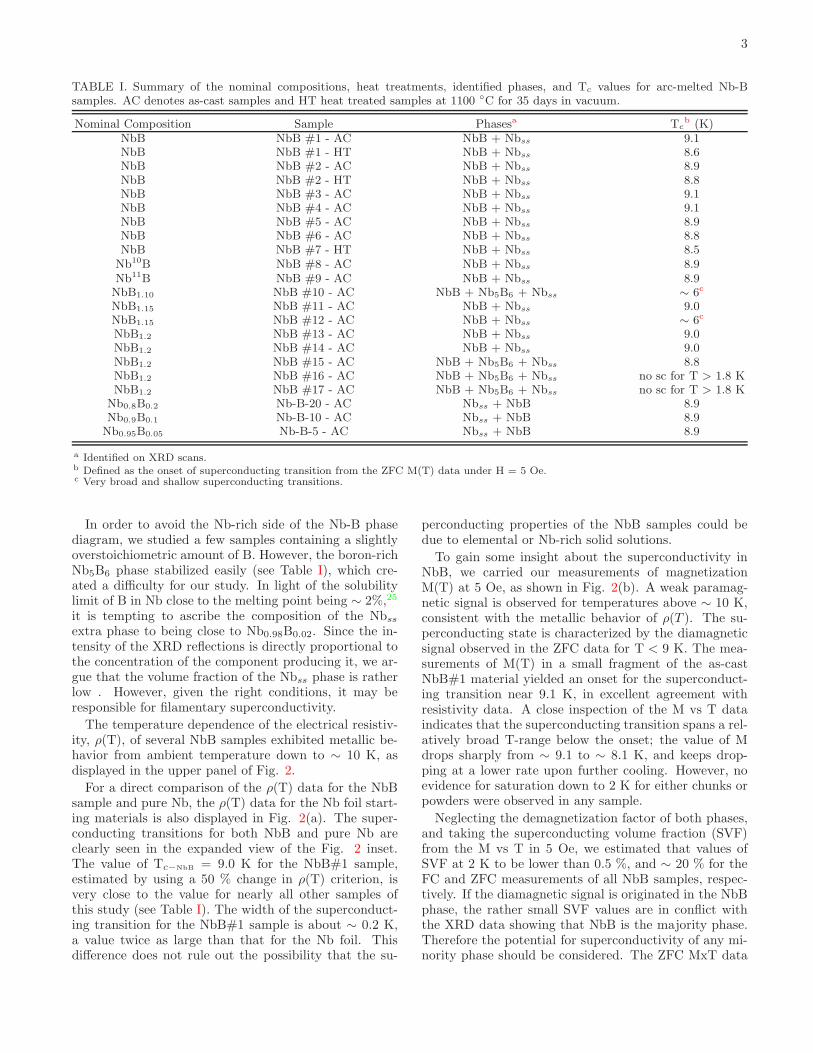
TABLE I. Summary of the nominal compositions, heat treatments, identified phases, and Tc values for arc-melted Nb-Bsamples. AC denotes as-cast samples and HT heat treated samples at 1100 ◦C for 35 days in vacuum.
Nominal Composition Sample Phasesa Tcb (K)
NbB NbB #1 - AC NbB + Nbss 9.1NbB NbB #1 - HT NbB + Nbss 8.6NbB NbB #2 - AC NbB + Nbss 8.9NbB NbB #2 - HT NbB + Nbss 8.8NbB NbB #3 - AC NbB + Nbss 9.1NbB NbB #4 - AC NbB + Nbss 9.1NbB NbB #5 - AC NbB + Nbss 8.9NbB NbB #6 - AC NbB + Nbss 8.8NbB NbB #7 - HT NbB + Nbss 8.5Nb10B NbB #8 - AC NbB + Nbss 8.9Nb11B NbB #9 - AC NbB + Nbss 8.9NbB1.10 NbB #10 - AC NbB + Nb5B6 + Nbss ∼ 6c
NbB1.15 NbB #11 - AC NbB + Nbss 9.0NbB1.15 NbB #12 - AC NbB + Nbss ∼ 6c
NbB1.2 NbB #13 - AC NbB + Nbss 9.0NbB1.2 NbB #14 - AC NbB + Nbss 9.0NbB1.2 NbB #15 - AC NbB + Nb5B6 + Nbss 8.8NbB1.2 NbB #16 - AC NbB + Nb5B6 + Nbss no sc for T > 1.8 KNbB1.2 NbB #17 - AC NbB + Nb5B6 + Nbss no sc for T > 1.8 K
Nb0.8B0.2 Nb-B-20 - AC Nbss + NbB 8.9Nb0.9B0.1 Nb-B-10 - AC Nbss + NbB 8.9Nb0.95B0.05 Nb-B-5 - AC Nbss + NbB 8.9
a Identified on XRD scans.b Defined as the onset of superconducting transition from the ZFC M(T) data under H = 5 Oe.c Very broad and shallow superconducting transitions.
In order to avoid the Nb-rich side of the Nb-B phasediagram, we studied a few samples containing a slightlyoverstoichiometric amount of B. However, the boron-richNb5B6 phase stabilized easily (see Table I), which cre-ated a difficulty for our study. In light of the solubilitylimit of B in Nb close to the melting point being ∼ 2%,25
it is tempting to ascribe the composition of the Nbssextra phase to being close to Nb0.98B0.02. Since the in-tensity of the XRD reflections is directly proportional tothe concentration of the component producing it, we ar-gue that the volume fraction of the Nbss phase is ratherlow . However, given the right conditions, it may beresponsible for filamentary superconductivity.
The temperature dependence of the electrical resistiv-ity, ρ(T), of several NbB samples exhibited metallic be-havior from ambient temperature down to ∼ 10 K, asdisplayed in the upper panel of Fig. 2.
For a direct comparison of the ρ(T) data for the NbBsample and pure Nb, the ρ(T) data for the Nb foil start-ing materials is also displayed in Fig. 2(a). The super-conducting transitions for both NbB and pure Nb areclearly seen in the expanded view of the Fig. 2 inset.The value of Tc−NbB = 9.0 K for the NbB#1 sample,estimated by using a 50 % change in ρ(T) criterion, isvery close to the value for nearly all other samples ofthis study (see Table I). The width of the superconduct-ing transition for the NbB#1 sample is about ∼ 0.2 K,a value twice as large than that for the Nb foil. Thisdifference does not rule out the possibility that the su-
perconducting properties of the NbB samples could bedue to elemental or Nb-rich solid solutions.
To gain some insight about the superconductivity inNbB, we carried our measurements of magnetizationM(T) at 5 Oe, as shown in Fig. 2(b). A weak paramag-netic signal is observed for temperatures above ∼ 10 K,consistent with the metallic behavior of ρ(T ). The su-perconducting state is characterized by the diamagneticsignal observed in the ZFC data for T < 9 K. The mea-surements of M(T) in a small fragment of the as-castNbB#1 material yielded an onset for the superconduct-ing transition near 9.1 K, in excellent agreement withresistivity data. A close inspection of the M vs T dataindicates that the superconducting transition spans a rel-atively broad T-range below the onset; the value of Mdrops sharply from ∼ 9.1 to ∼ 8.1 K, and keeps drop-ping at a lower rate upon further cooling. However, noevidence for saturation down to 2 K for either chunks orpowders were observed in any sample.
Neglecting the demagnetization factor of both phases,and taking the superconducting volume fraction (SVF)from the M vs T in 5 Oe, we estimated that values ofSVF at 2 K to be lower than 0.5 %, and ∼ 20 % for theFC and ZFC measurements of all NbB samples, respec-tively. If the diamagnetic signal is originated in the NbBphase, the rather small SVF values are in conflict withthe XRD data showing that NbB is the majority phase.Therefore the potential for superconductivity of any mi-nority phase should be considered. The ZFC MxT data

4
0 100 200 3000
5
10
15
20
3 6 9 12
-1.5
-1.0
-0.5
0.0
Nb NbB#1
( c
m)
T (K)
(a)9.0 9.5
0.0
0.5
1.0
FC Chunk
ZFC Chunk
NbB#1 5 Oe
M (1
0-1 e
mu/
g)
T (K)
(b)
3 6 9 12
-1
0
1 NbB#1 5 Oe
(c)
M (1
0-3 e
mu/
g)
ZFC Powder
FC Powder
FIG. 2. (a) Temperature dependence of the electrical resis-tivity ρ(T) for NbB (NbB#1), and the Nb foil material usedas the starting material. The monotonic decrease of ρ(T)with temperature indicates metallic behavior for both sam-ples. The superconducting transition region is exhibited inthe inset of the figure. Field-cooled (FC) and zero-field cooled(ZFC) magnetization M(T) curves for an as-cast chunk (blacksymbols in (b)), and its powder (red symbols in (c)) of NbB(NbB#1) under an external dc magnetic field of 5 Oe.
of Figs. 2(b) and 2(c) show that the diamagnetic signalfor the large fragment of NbB is at least 2 orders of mag-nitude larger than for the powder, which gives credenceto the conjecture that superconductivity could be origi-nated in a minority phase. The percolation paths thatsupport the screening currents of the ZFC data in thefragment lead to an overestimation of the SVF. Disrup-tion of the percolation by grinding leads to more realisticestimates of the SVF, which in turn is more consistentwith minority phase superconductivity. We also acknowl-edge that a consideration of the XRD data with the su-perconductivity in the NbB samples leads to a conflict.First, the SVFs are rather low, and therefore inconsistentwith arising from the majority phase as revealed in theXRD. However, ρ(T) drops to zero below Tc, suggesting
200 �m
c) NbB#2 d) NbB#2
a) NbB#1 b) NbB#1
Nbss
60 �m
60 �m
60 �m
FIG. 3. Micrograph images for two NbB samples; upper andlower panels are for NbB#1, and NbB#2 samples, respec-tively. The red arrows point to white areas, which are identi-fied with the Nbss solid solution. The grayish areas are fromthe majority NbB phase.
that either the majority phase is superconducting, or thata minority phase is both superconducting and provide apercolation path.
In order to sort out whether the superconductivity inthese polycrystalline NbB samples is in anyway relatedto the minority phases, we carried out detailed study ofthe microstructure. Displayed in Fig. 3 are surface mi-crographs of samples NbB#1 and NbB#2. The imagesclearly show the presence of two phases: NbB and Nbss,as indicated in Table I. Since the image was built fromthe backscattered electrons, the lighter regions suggest ahigher mean atomic number, and are associated with theNbss minority phase. The darker regions are associatedwith the NbB 1:1 majority phase. Filaments of the Nbssminority phase coalesce on the grain boundaries, form-ing an interconnected network, as observed elsewhere.21
These filaments enclose large grains of the NbB matrix,forming loops or clusters with typical dimensions exceed-ing 10 µm. The micromorphology of the arc-melted NbBsamples can now be used to address the problem of thelow SVF.
Let’s assume first that the superconductivity in the

5
NbB samples arises from the Nbss minority phase, witha morphology similar to a three-dimensional network ofsuperconducting filaments. This assumption is consis-tent with several experimental findings in the arc-meltedNbB samples:(i) the wide superconducting transition; (ii)the zero ρ(T) below Tc due percolation through the fila-ments and linkage through the proximity effect;26,27 (iii)the very low SVF; and (iv) the suppression of the dia-magnetic signal below Tc by 2 orders of magnitude uponpowdering the samples, presumably disrupting the fila-ment network.28 Upon fast cooling from the melt the Nb-rich solid solution phase is rapidly segregated to the edgeof the grains where the filaments are formed. Thereforethe filaments are quite susceptible to disorder, compo-sition range, thinning, bottlenecking, and disruptions incontinuity, leading to a variance in Tc and to a broadsuperconducting transition. As indicated in the micro-graphs of Fig. 3, the filaments have a large variance inthickness and display many interruptions; therefore prox-imity effect superconducting tunneling cannot be ruledout.
Specific heat Cp(T) measurements near Tc can providea quantitative mean for testing the validity of our SFVargument. The electronic contribution to the specificheat Cele/γT for two samples (NbB#2 and Nb0.95B0.05)is displayed in Fig. 4. The first point addressed here isthe emergence of a jump at T/Tc = 1 for both samples,consistent with the onset of superconductivity. The dis-continuity at T/Tc = 1 is much less pronounced in theNbB#2 sample, suggesting that its SVF should be muchsmaller than for Nb0.95B0.05, a composition close to whatwe expect for the intergranular filaments.
To further evaluate the quantitative importance of theCp(T) data, we’ll start by assuming that the specificheat of the lattice Clatt is well described by the De-bye model Clatt = β3T
3 + β5T5 at low temperatures.
The electronic contribution to Cp(T), Cele = γnT, isapproximated by the free-electron model and thereforeCp = Cele + Clatt is used to describe the normal statedata.5 In order to suppress the superconducting transi-tion from the background data, measurements of Cp(T)in the NbB#2 sample were carried out both in H = 0and 1 T. The latter is sufficient to lower Tc below 4 K.The extrapolation of the Cp(T) data from the normalphase to low temperatures yields a Sommerfeld constantγn = 1.52 mJ/mol K2, as shown (blue line) in Fig. 4(b).This value is close to the γNbB = 1.39 mJ/mol K2 re-ported for a non-superconducting NbB in Ref. 16. Onthe other hand, specific heat Cp(T) measurements forNb0.95B0.05 yielded γn = 7.44 mJ/mol K2, fairly close tothe reported value of 7.80 mJ/mol K2 for pure niobium,29
as shown in Fig. 4(c).
To make a direct comparison with the predictions ofthe BCS theory, the values of Cele/T ratio were normal-ized by the Sommerfeld constant γn, and plotted as afunction of the reduced temperature T/Tc in the Fig.4(a). The discontinuity in the specific heat at Tc for theNbB#2 sample ∆Cele/γnTc = 0.18, corresponds to only
0.0 0.5 1.00
1
2
(a)
Cele/T = 0 + dSBCSsc (T)/dT
NbB#2 Nb0.95B0.05
Cel
e/nT
T/Tc
0 40 801
2
3
(b)C
p/T (m
J/m
ol K
2 )
T2 (K2)
NbB#2
0 40 800
10
20
30
(c)
T2 (K2)
Nb0.95B0.05
FIG. 4. (a) Reduced temperature T/Tc dependence ofthe Cele/γnTc ratio. The fit to the single-band model de-scribed in the text is represented by the red line in the mainpanel.(b) and (c) display Cp/T vs T2 for samples NbB#2and Nb0.95B0.05, respectively. The blue lines are extrapola-tions from the normal state data, and their values at T2 = 0were taken as the Sommerfeld coefficients γn.
∼ 12% of the expected 1.43 value for the BCS theory, as-suming weak-coupling limit. On the other hand, a valuemuch closer to the BCS value of 1.43 was obtained forthe Nb0.95B0.05 sample (∆Cele/γnTc ∼ 1.73), consistentwith nearly full SVF. Neglecting an anisotropic gap sce-nario, the small value of ∆Cele/γnTc = 0.18 suggests thatthe SVF of the NbB#2 specimen is rather small, consis-tently with the low SVF found from the magnetizationmeasurements. We also mention that the discontinuityat Tc in the specific heat of the NbB#2 sample was thelargest among all the NbB specimens studied.
The upper panel of Fig. 4 shows that Cele/γnT forthe NbB#2 sample assumes a very large and nearlyconstant value (∼ 0.9) in the limit towards T → 0.This feature is commonly found in non-superconductingtransition metal elements and metallic alloys, but quitedifferent from the exponential decrease predicted inisotropic BCS theory.30 The unexpected large valuesof Cele/γnT for NbB suggests either a partial gappingof the Fermi surface, or perhaps that NbB is non-superconducting at all. Motivated by this puzzlingresult, we carried out a study of the behavior of the

6
electronic entropy in the superconducting state, usinga model of independent fermions (alpha model) asproposed elsewhere.31 This model has been success-fully applied in multi-band and noncentrosymmetricsuperconducting materials.32–34 For a single-band caseand in close analogy with the BCS theory, the entropyof the superconducting state SBCS
sc is related to itselectronic contribution Cele by the following equation:31
Cele
T= γ0 +
dSBCSsc
dT,
SBCSsc = −γnTc
6α
π2
∫
∞
0
flnf + (1 − f)ln(1− f)dy.
(1)
where γ0 is a residual electronic contribution, f(E)is the Fermi-Dirac function with quasiparticle energiesE = ∆0
√
y2 + δ(T )2, y is the single-particle energyin the normal state, and δ(T ) is the temperaturedependence of the superconducting gap. The tem-perature dependence of an isotropic s-wave BCS gapδ(T ) = 1.76 tanh{1.82[1.018(Tc/T − 1)]0.51} was utilizedhere as an approximation for the numerical solution ofthe BCS gap equation in the weak-coupling limit.35 Theparameter α = ∆0/kBTc is adjustable and closely re-lated to the superconducting coupling strength, whichmay assume values higher than predicted by the BCSweak-coupling limit α = 1.76.
The theoretical fits based on the alpha model are rep-resented by the solid (red) lines in Fig. 4(a), and showexcellent agreement with the experimental data. Forthe NbB#2 sample, a value of α ∼ 1.92 was then ob-tained, corresponding to a superconducting gap energy∆NbB
0 ∼1.44 meV . This value of ∆0 is slightly lower butin good agreement with the∼ 1.54 and∼ 1.52meV foundin our Nb and Nb0.95B0.05 samples, respectively. Thevalue of the superconducting energy gap of Nb obtainedfrom tunneling and heat capacity measurements,36,37 arein the 1.42 ≤ ∆Nb
0 ≤ 1.60 meV range, supporting thenotion that the superconductivity in some NbB samplesis due to the Nbss impurity phase.
The metallic component of the NbB#2 sample is alsoof interest and it may be explored using the results of thefitting procedure discussed above. The residual compo-nent γ0 (see Eq. 1) is associated with the metallic phaseand has been used as an adjustable parameter in the fit-ting. The γ0 ∼ 1.38 mJ/mol K2 value obtained from thefitting is close to the γn extrapolated from normal statespecific heat (γn ∼ 1.52 mJ/mol K2), suggesting that∼ 10% of the NbB sample is out of the stoichiometry.In fact, when γ0 obtained from the fitting procedure isassumed to be the Sommerfeld constant for the metallic
NbB phase, a much better agreement with the previouslypublished data is achieved; a γNbB ∼ 1.39 mJ/mol K2
value was reported for non-superconducting NbB.16 Forcomparison purposes, applying the fitting procedure fromthe alpha model to Nb0.95B0.05 yielded a residual com-ponent γ0 as small as ∼ 0.6 mJ/mol K2, a value corre-sponding to only ∼ 8% of its γn, but in line with a samplewith nearly 100% superconducting volume fraction.
IV. CONCLUSIONS
A systematic study in twenty arc-melted samples ofNbB with stoichiometry close to 1:1 revealed supercon-ductivity with Tc ∼ 9 K in all of them. The arc-meltedsamples had weight losses lower than ∼ 1 wt.%, whichperhaps was enough to allow the formation of at leastone additional phase, a Nb-rich solid solution Nbss prob-ably with composition close to Nb0.98B0.02. The presenceof this minority phase was verified by powder XRD andSEM micrographs, which revealed the formation of a per-colative path. Our measurements of SVF, electrical resis-tivity, and specific heat lead to a solid understanding thatthe superconductivity is associated not with the majorityNbB phase but rather with the filaments of the minoritysolid solution Nbss. In this context, the morphology ofthe Nbss phase seen in the micrographs, clearly showingthe percolation paths, is consistent with the zero elec-trical resistivity state, even if this phase can be barelydetected in XRD scans. The absence of superconductiv-ity in the NbB phase, as discussed here, is consistent withtwo previous studies,11,16 further indicating that the syn-thesis method plays a crucial role on whether the sampleswill bear some Nbss filaments and superconduct, or beimpurity free and not exhibit superconductivity. In sum-mary, the findings in arc-melted NbB samples suggestgreat difficulty in avoiding the formation of a minorityNb-rich Nbss solid solution using this technique. A closeinspection of the superconducting properties, XRD, andmicrographs, suggest that the source of superconductiv-ity is the percolative network of the Nb-rich Nbss solidsolutions that accumulate around the grain boundaries.
V. ACKNOWLEDGMENTS
R.F.J. and A.J.S.M. gratefully acknowledge ZacharyFisk for his hospitality at University of California, Irvine,where part of this work was done, and for enlighteningdiscussions. We also have benefited from fruitful discus-sions with G. C. Coelho and C. A. Nunes. This workwas supported by Brazil’s agencies FAPESP (GrantsNo. 2013/07296-2, 2014/12401-2, and 2014/19245-6) andCNPq (Grants No. 444712/2014-3 and 306006/2015-4).
∗ [email protected] 1 J. K. Hulm and B. T. Matthias,Phys. Rev. 82, 273 (1951).

7
2 B. T. Matthias and J. K. Hulm,Phys. Rev. 87, 799 (1952).
3 G. F. Hardy and J. K. Hulm, Phys. Rev. 93, 1004 (1954).4 J. Nagamatsu, N. Nakagawa, T. Muranaka, Y. Zenitani,and J. Akimitsu, Nature 410, 63 (2001).
5 R. Lortz, Y. Wang, U. Tutsch, S. Abe, C. Meingast,P. Popovich, W. Knafo, N. Shitsevalova, Y. B. Paderno,and A. Junod, Phys. Rev. B 73, 024512 (2006).
6 A. Kawano, Y. Mizuta, H. Takagiwa, T. Muranaka, andJ. Akimitsu, J. Phys. Soc. Jpn. 72, 1724 (2003).
7 M. Kayhan, E. Hildebrandt, M. Frotscher,A. Senyshyn, K. Hofmann, L. Alff, and B. Albert,Solid State Sci. 14, 1656 (2012).
8 H. Gou, N. Dubrovinskaia, E. Bykova, A. A. Tsirlin,D. Kasinathan, W. Schnelle, A. Richter, M. Merlini,M. Hanfland, A. M. Abakumov, D. Batuk, G. Van Tende-loo, Y. Nakajima, A. N. Kolmogorov, and L. Dubrovinsky,Phys. Rev. Lett. 111, 157002 (2013).
9 C. Buzea and T. Yamashita,Supercond. Sci. Technol. 14, R115 (2001).
10 A. S. Cooper, E. Corenzwit, L. D. Longinotti,B. T. Matthias, and W. H. Zachariasen,Proc. Natl. Acad. Sci. U.S.A 67, 313 (1970).
11 L. Leyarovska and E. Leyarovski,J. Less-Common Met. 67, 249 (1979).
12 V. A. Gasparov, N. S. Sidorov, I. Zver’kova, and M. P.Kulakov, JETP Lett. 73, 532 (2001).
13 H. Rosner, W. E. Pickett, S.-L. Drechsler, A. Handstein,G. Behr, G. Fuchs, K. Nenkov, K.-H. Muller, and H. Es-chrig, Phys. Rev. B 64, 144516 (2001).
14 G. Akopov, M. T. Yeung, and R. B. Kaner,Adv. Mater. 29, 1604506 (2017).
15 J. M. Vandenberg, B. T. Matthias, E. Corenzwit, andH. Barz, Mat.Res. Bull. 10, 889 (1975).
16 Y. S. Tyan, L. E. Toth, and Y. A. Chang,J. Phys. Chem. Solids 30, 785 (1969).
17 L. H. Andersson and R. Kiessling,Acta Chem. Scand. 4, 160 (1950).
18 L. E. O. Brewer, S. D. L., T. D. H., and D. C. H.,J. Am. Ceram. Soc. 34, 173 (1951).
19 T. Matsudaira, H. Itoh, S. Naka, and H. Hamamoto,J. Less-Common Met. 155, 207 (1989).
20 C. Yeh and W. Chen, J. Alloy. Compd. 420, 111 (2006).21 L. A. Borges, G. C. Coelho, C. A. Nunes, and P. A. Suzuki,
J. Phase Equilib. 24, 140 (2003).22 W. Desorbo, Phys. Rev. 132, 107 (1963).23 J. Rodrıguez-Carvajal, Physica B 192, 55 (1993).24 H. Okamoto, J. Phase Equilib. Diffus. 31, 208 (2010).25 Z. H. Tang, M. J. Kramer, and M. Akinc,
Intermetallics 16, 255 (2008).26 A. Y. Kasumov, O. V. Kononenko, V. N. Matveev, T. B.
Borsenko, V. A. Tulin, E. E. Vdovin, and I. I. Khodos,Phys. Rev. Lett. 77, 3029 (1996).
27 K. K. Likharev, Rev. Mod. Phys. 51, 101 (1979).28 See, for instance, C. I. Sathish, H. L. Feng, Y. Shi, and
K. Yamaura, J. Phys. Soc. Jpn. 82, 074703 (2013).29 H. A. Leupold and H. A. Boorse,
Phys. Rev. 134, A1322 (1964).30 J. Bardeen, L. N. Cooper, and J. R. Schrieffer,
Phys. Rev. 108, 1175 (1957).31 H. Padamsee, J. E. Neighbor, and C. A. Shiffman,
J. Low Temp. Phys. 12, 387 (1973).32 Y. J. Jo, J. Zhou, Z. H. Sung, P. J. Lee, and D. C. Lar-
balestier, APL Materials 2, 106101 (2014).33 F. Bouquet, R. A. Fisher, N. E. Phillips, D. G. Hinks, and
J. D. Jorgensen, Phys. Rev. Lett. 87, 047001 (2001).34 C. Cirillo, R. Fittipaldi, M. Smidman, G. Carapella, C. At-
tanasio, A. Vecchione, R. P. Singh, M. R. Lees, G. Balakr-ishnan, and M. Cuoco, Phys. Rev. B 91, 134508 (2015).
35 A. Carrington and F. Manzano,Physica C 385, 205 (2003).
36 S. Bose, P. Raychaudhuri, R. Banerjee, P. Vasa, andP. Ayyub, Phys. Rev. Lett. 95, 147003 (2005).
37 M. L. Macvicar and R. M. Rose,J. App. Phys. 39, 1721 (1968).