ABS Developments in Spatial Data Jacky Hodges … · Jacky Hodges Tasmanian Regional Director ....
34
ABS Developments in Spatial Data Jacky Hodges Tasmanian Regional Director
-
Upload
duongtuong -
Category
Documents
-
view
214 -
download
1
Transcript of ABS Developments in Spatial Data Jacky Hodges … · Jacky Hodges Tasmanian Regional Director ....
ABS Developments in Spatial Data
Jacky Hodges
Tasmanian Regional Director

Growing Demand
• All areas of the community are expecting information in a spatial context
– Google Maps has made ‘spatial information a commodity’
• Spatial technology also now a commodity
– Available on desktop, mobile devices etc
• Broad understanding of the value of spatially enabling information
Building Spatial Infrastructures
• Spatial Infrastructures- high on government agendas
– APS200 Location Project- Aus Govt
– Victorian Government Spatial Information Strategy
– NSW- SIX
– WA- Landgate
– Tasmania- Land Information System Tasmania (LIST)

Why does the ABS care about spatial data?
• Australia’s national statistical agency;
• ABS is already playing a role in spatially enabling information
– PSMA Australia Ltd may not have been established without ABS Census mapping requirements
• ABS bringing social, economic and environment data together in new ways.

Geospatial capability has existed for many years, and is now being applied more widely.
Some examples.
• Population Census
• New geography standard - ASGS
• Land Account
ABS History
But can the ABS be effective through ‘traditional’ spatial activities?
Benefits of a spatial infrastructure well understood
• Used for many purposes, including providing context for
other information
ABS investigating a Statistical Spatial Framework
• Providing the statistical equivalent of topography, roads,
rivers and administrative boundaries
• Providing a statistical context ‘layer’
• Enabling access to authoritative spatially enabled statistics
• Adding value to other agencies’ data through a statistical
context

A Statistical Spatial Framework
A statistical framework will provide another series of layers on top of the existing (or developing) topographic based spatial infrastructure

Benefits of a Framework
• Existing demand
• Meeting a broader user community
• Provide a location-based method of discovering and accessing ABS data
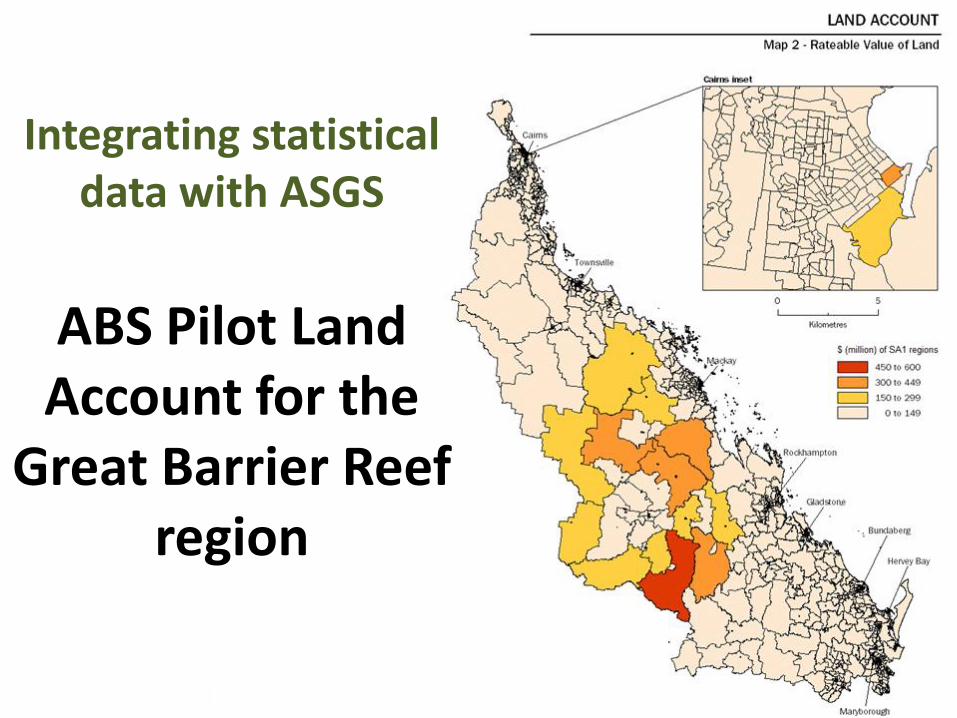
Integrating statistical
data with ASGS
ABS Pilot Land Account for the
Great Barrier Reef region

What is a Land Account?
Measures the change in the Land and its attributes resulting from the impact of human and natural activity
Measures the links between
• The economic activities undertaken on the Land
• Expenditures undertaken to protect the environment and manage natural resources
• The Land assets in both physical and monetary terms

A National Land Account could be used to inform debate on:
• Population settlement
• Sustainable production of goods and services
• Understanding the costs and benefits of different land management systems
• Understanding the productive capacity of land
• Measuring the health of the environment
• Understanding the economic, environmental and social costs and benefits of economic activities occurring on the land
• Measuring the potential social and economic impact of a disaster

Great Barrier Reef: 3,005 Statistical Area 1 regions
It all starts here

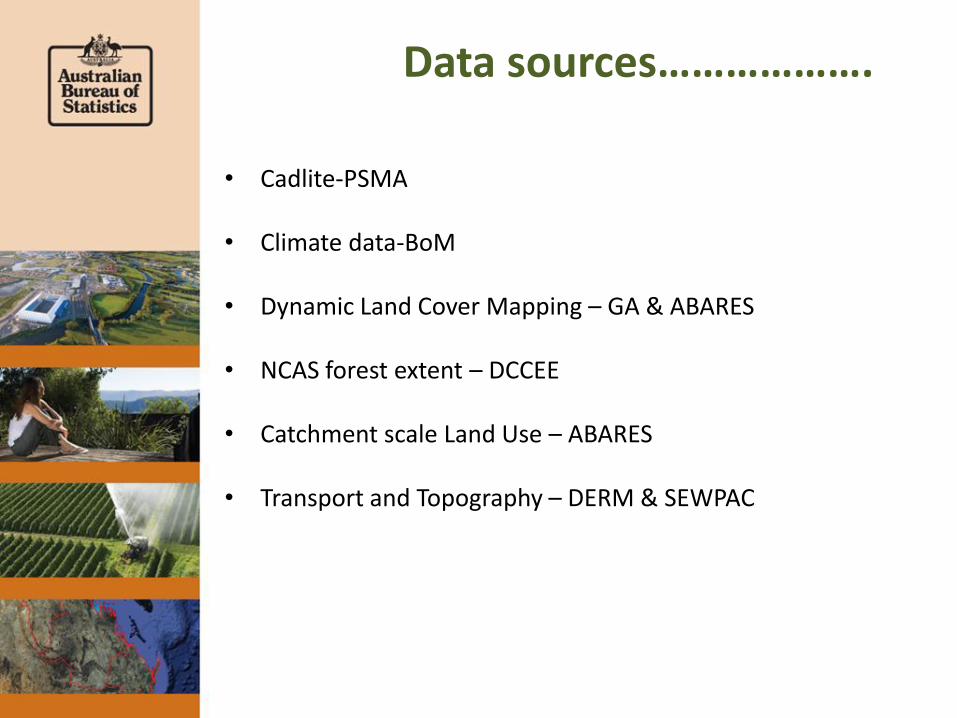
Data sources……………….
• Cadlite-PSMA
• Climate data-BoM
• Dynamic Land Cover Mapping – GA & ABARES
• NCAS forest extent – DCCEE
• Catchment scale Land Use – ABARES
• Transport and Topography – DERM & SEWPAC

Our main data source • Data from the Valuer General
– Lot and plan number (or equivalent)
– CAD PID
– Property ID
– Property location (address: street, locality , shire, LGA )
– Property value [land value, capital value]($)
– 3 digit land use code
– Property size (ha)
– Owner’s name
– ABN (if applicable)
– Foreign ownership code (if applicable)
– Native title
– Land Zone identifier
– Copy of meta data to identify any additional data requirement

Integrating ABS data
• Population Census
• Agricultural Census
• Land Management Practices in the GBR region
• Water Use on Australian Farms
• Water Account, Australia
• Business Register

Issues
• Location information for multi-state businesses
• Data for different periods rather than a point of time
• Consistency across State Information i.e land use categories
• Need cooperation of all Valuer’s General to produce “National Account”

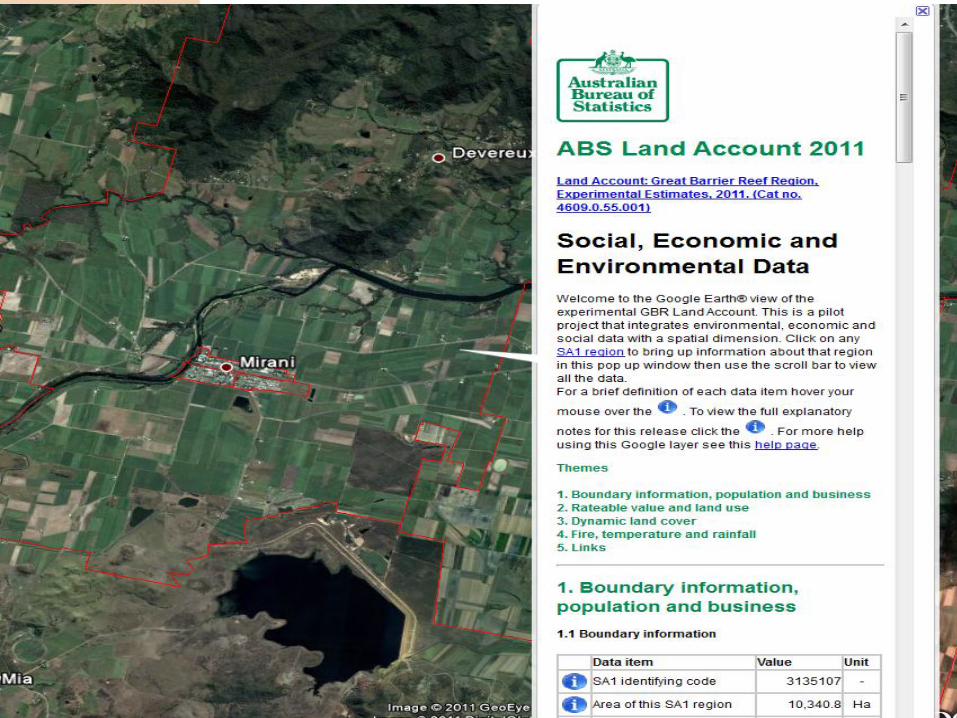
Outputs
• Statistical Tables at NRM level in line with the SEEA framework
• An interactive Google Earth® image that shows SA1 level information for:
– Boundary information, population and business
– Rateable land value and land use
– Dynamic land cover
– Fire, temperature and rainfall
• An ESRI® geodatabase file and a MAPINFO file that can be used in GIS
• Supporting text delimited file

SA1 demonstration


2.0 metre storm tide
2.5 metre storm tide
3.0 metre storm tide
CAIRNS CBD 02/02/2011


Estimated impact of 1.0 m sea rise by 2100
Airport
Town centre

abs.gov.au
Contacts
• Jacky Hodges [email protected]
• Mark Lound [email protected]
• Ben Searle [email protected]
• Alister Nairn [email protected]

Mesh Blocks: Bellerive

Statistical Area 1 (SA1): Bellerive
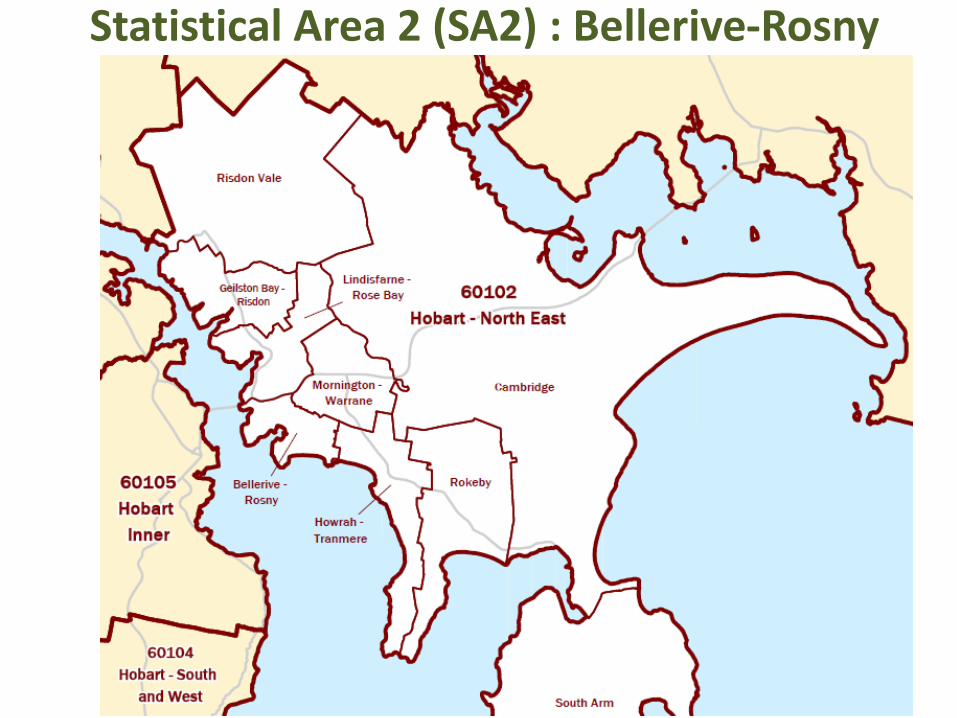
Statistical Area 2 (SA2) : Bellerive-Rosny

Statistical Areas 3 (SA3) and 4 (SA4): Hobart