About the Organisations - PreventionWeb.net · Study team for the Ratu Watershed Tribhuvan...
116
-
Upload
hoangkhuong -
Category
Documents
-
view
213 -
download
0
Transcript of About the Organisations - PreventionWeb.net · Study team for the Ratu Watershed Tribhuvan...

About the Organisations
The International Centre for Integrated Mountain Development (ICIMOD) is an independent‘Mountain Learning and Knowledge Centre’ serving the eight countries of the Hindu Kush-Himalayas – Afghanistan , Bangladesh , Bhutan , China , India , Myanmar ,Nepal , and Pakistan – and the global mountain community. Founded in 1983, ICIMOD isbased in Kathmandu, Nepal, and brings together a partnership of regional member countries,partner institutions, and donors with a commitment for development action to secure a betterfuture for the people and environment of the extended Himalayan region. ICIMOD’s activities aresupported by its core programme donors: the governments of Austria, Denmark, Germany,Netherlands, Norway, Switzerland, and its regional member countries, along with over thirtyproject co–financing donors. The primary objective of the Centre is to promote the developmentof an economically and environmentally sound mountain ecosystem and to improve the livingstandards of mountain populations.
The International Hydrological Programme (IHP) is UNESCO’s cooperative programme in waterresearch, water resources management, education, and capacity-building, and the only broadly-based science programme of the UN system in this area. In existence for over 30 years now, IHPis committed to developing the science of hydrology at the service of society. Its primary aim isto draw together scientists worldwide in order to establish the scientific and technological basesfor the rational management of water resources with respect to water quantity and quality.
The Hindu Kush-Himalayan Flow Regimes from International Experimental and Network Dataproject (HKH-FRIEND), is a regional network for hydrological research and data exchange. It is oneof the eight research groups in the International FRIEND Project under UNESCO's InternationalHydrological Programme (IHP). The project evolved through a series of regional consultationsinitiated jointly by UNESCO, ICIMOD, and regional countries since 1989 and was formallyestablished in 1996. ICIMOD has provided the Secretariat for HKH-FRIEND since its inception andalso houses its Regional Hydrological Data Centre (RHDC). HKH-FRIEND works throughcollaboration and partnerships – national, regional, and international – and has received financialsupport from UNESCO/IHP; the German IHP/OHP National Committee; World MeteorologicalOrganization (WMO); Federal Institute of Hydrology, Germany; Department for InternationalDevelopment (DFID) and Centre for Ecology and Hydrology (CEH), UK; and ICIMOD.
The data and information exchange will facilitate research on the hydrology and water resourcesof the Hindu Kush-Himalayan region and contribute towards improved management of waterresources, such as flood forecasting, climate change impacts on water resources, hydropowerdevelopment, and assessment of fresh water resources, and contribute towards sustainabledevelopment of water resources for poverty alleviation in the region.

Editors
Narendra R. KhanalCentral Department of Geography, Tribhuvan University, Kirtipur, Kathmandu, Nepal
Mandira ShresthaInternational Centre for Integrated Mountain Development, Khumaltar, Lalitpur, Nepal
Motilal GhimireCentral Department of Geography, Tribhuvan University, Kirtipur, Kathmandu, Nepal
International Centre for Integrated Mountain Development (ICIMOD)Kathmandu, Nepal
March 2007
Preparing for Flood DisasterMapping and Assessing Hazard in the Ratu Watershed, Nepal
Copyright © 2007International Centre for Integrated Mountain Development (ICIMOD)United Nations International Scientific and Cultural Organization (UNESCO) All rights reserved
Published by theInternational Centre for Integrated Mountain DevelopmentG.P.O. Box 3226Kathmandu, NepalandUnited Nations Educational Scientific and Cultural Organization (UNESCO)UNESCO HouseB-5/29, Safdarjung EnclaveNew Delhi-110029, India
ISBN 978–92–9115–018–2
Photo credit: Women involved in flood disaster preparedness in the Ratu Khola– Mandira Shrestha
Editorial TeamGreta M. Rana (Consultant Editor)Joyce M. Mendez (Editor)A. Beatrice Murray (Senior Editor)Dharma R. Maharjan (Technical Support and Layout Design)
Printed and bound in Nepal byHill Side Press (P) Ltd. Kathmandu
ReproductionThis publication may be reproduced in whole or in part and in any form for educational ornon-profit purposes without special permission from the copyright holder, providedacknowledgement of the source is made. ICIMOD and UNESCO would appreciate receivinga copy of any publication that uses this publication as a source.
No use of this publication may be made for resale or for any other commercial purposewhatsoever without prior permission in writing from ICIMOD or UNESCO.
NoteThe designations employed, the presentation of material, and the views andinterpretations in this publication are those of the author(s). They are not attributable toICIMOD or UNESCO and do not imply the expression of any opinion whatsoever concerningthe legal status of any country, territory, city or area of its authorities, or concerning thedelimitation of its frontiers or boundaries, or the endorsement of any product.

Study team for the Ratu Watershed
Tribhuvan University
Professor. Khadga Bahadur Thapa, Central Department ofHydrology and Meteorology: CoordinatorDr. Narendra Raj Khanal, Central Department of GeographyDr. Narendra Shakya, Institute of EngineeringMr. Motilal Ghimire, Central Department of Geography
International Centre for Integrated Mountain Development
Ms. Mandira Shrestha, Coordinator
Technical team for field investigations
Mr. Deepak PoudelMr. Rishi Kesh RijalMr. Chitra Prasad AcharyaMr. Purna Bahadur ThapaMr. Yadav SubediMr. Ripendra AwalMr. Ram Krishna Regmi
v
Contents
Foreword ixAcknowledgements xiExecutive Summary xiiAcronyms and Abbreviations xv
Chapter 1: Flood Hazard, Risk and Vulnerability in Nepal:the Physical and Socioeconomic Environment 1
Introduction 3Physical and Socioeconomic Environment of Nepal 3Types, Magnitude, and Frequency of Natural Disasters in Nepal 8Floods 10Vulnerabilty 15Mapping and Past Assessment Efforts 21ICIMOD’s Activities 23
Chapter 2: Mapping Flood Hazard and Risk in a VulnerableTerai Region: The Ratu Watershed 25
Introduction 27Objectives 27The Study Area 28Methodology 42Results 52
Chapter 3: Preparing for Disaster, Reducing Risk, BuildingResilience: Study Results and Recommendations 69
Introduction 71Methodology 71Results 74Vulnerability 81
Chapter 4: The Larger Picture 93Conclusions 95Recommendations 96
Bibliography 99
vi
List of FiguresFigure 1.1: Nepal administrative divisions and ecological regions 4Figure 1.2: Nepal physiographic regions and drainage network 5Figure 1.3: Physiographic regions vis-à-vis major geological formations of the Nepal 5
HimalayaFigure 1.4: Nepal distribution of mean annual rainfall 7Figure 1.5: Loss of life from different natural disasters in Nepal, 1983-2005 9Figure 1.6: Families affected by different natural disasters in Nepal, 1983-2005 9Figure 1.7: Estimated amount of property lost, 1983-2005 10Figure 1.8: Annual loss of life and property from landslides, floods, and avalanches 13Figure 1.9: Frequency of flood and landslide hazards and impact by district 14Figure 2.1: Map of the study area 29Figure 2.2: General geomorphology of the Ratu Khola Basin 30Figure 2.3: Topographic profile of the basin along a north-south cross-section 31Figure 2.4: Mean monthly temperature recorded at Jaleshwar, 1969-1996 32Figure 2.5: Mean monthly rainfall recorded at Jaleshwar, 1969-1996 33Figure 2.6: Mean monthly rainfall recorded at Tulsi, 1956-1996 33Figure 2.7: Longitudinal profile of the Ratu Khola and Jangha Khola 34Figure 2.8: River network traced from aerial photos and imagery at different periods 35Figure 2.9: A closer view of the river channel network, 1954-1999 36Figure 2.10: Channel width of the Ratu Khola measured at different cross-sections 36Figure 2.11: Land use and land cover types, 1996 39Figure 2.12: Population density by VDC 40Figure 2.13: Level of income by VDC 40Figure 2.14: Percentage of landless and marginal farm households by VDC 40Figure 2.15: Percentage of food-deficit households by VDC 40Figure 2.16: Samples of aerial photographs used for mapping 44Figure 2.17: Image interpretation using FCC, 432, and 751 45Figure 2.18: Delineation of flood-prone areas by local people during group discussion 46Figure 2.19: Flood-hazard mapping scheme adopting geomorphic approach 47Figure 2.20: Vulnerability and risk-mapping scheme 48Figure 2.21: One-dimentional floodplain analysis using HEC-RAS,GIS, and HEC-GeoRAS 50Figure 2.22: Process flow diagram for using HEC Geo RAS 51Figure 2.23: Flood-affected areas, 1978/79 aerial photos 53Figure 2.24: Flood-affected areas, 1992 aerial photos 54Figure 2.25: Flood-affected areas, 1999 Landsat TM imagery 55Figure 2.26: Terrain unit map 56Figure 2.27: Old river channel courses 58Figure 2.28: Moist areas and marshes 60Figure 2.29: Potential areas of river-bank cutting 61Figure 2.30: Composite flood-hazard map 62Figure 2.31: House units and built-up areas at risk from flood hazard 63Figure 2.32: Theoretical inundation due to flow intervention by a structure at the
Indo-Nepal border 64Figure 2.33: Vulnerability and risk maps 65Figure 2.34: Two-year return flood with 50 and 100% flow 66Figure 2.35: Five-year return flood with 50 and 100% flow 66Figure 2.36: Flood-hazard maps: social and geomorphic approach 67Figure 3.1: Location of areas selected for the micro-level study 73Figure 3.2: Loss of life and property from flood hazards, 1961-2003 79Figure 3.3: Households with food sufficiency 83Figure 3.4: Money spent on various emergency measures 84Figure 3.5: Contributions made by various agencies/institutions for mitigation measures 85Figure 3.6: Flooded area versus water depth for different flood discharges 87
vii
Figure 3.7: Discharge flooded depth and area 88Figure 3.8: Evacuation route on hazard map for 160m3/s discharge 90Figure 3.9: Evacuation route on hazard map for 180m3/s discharge 90Figure 3.10: Evacuation route on hazard map for 507.52m3/s discharge 91Figure 3.11: Evacuation route on hazard map for 1016.37m3/s discharge 91
List of TablesTable 1.1: Average annual loss of life and property from natural disasters, 1983-2005 8Table 1.2: Losses from floods, landslides, and avalanches, 1983-2005 12Table 1.3: Losses from floods and landslides by ecological region, 1992-2001 14Table 1.4: Socioeconomic indicators of Nepal and other countries in South Asia 18Table 2.1: Maximum rainfall at Tulsi and Jaleshwar with various return periods 34Table 2.2: Peak discharge at various sites along the Ratu Khola 37Table 2.3: Area under different land-use and land-cover types 38Table 2.4: Colour composites and individual bands of the LANDSAT Thematic
Mapper and land features 45Table 2.5: Areas by flood-hazard types 59Table 3.1: Frequency of different natural hazards and their recurrence intervals 75Table 3.2: Annual loss of life caused by different hazards 75Table 3.3: Annual loss of property caused by different hazards 76Table 3.4: Annual household income and losses among households in flood-prone areas 77Table 3.5: Annual loss of life and property caused by flood hazards 78Table 3.6: Average annual losses and damage 79Table 3.7: Number of households exposed to water-induced disasters 80Table 3.8: Land use in areas susceptible to flooding 81Table 3.9: Percentage of households with different levels of vulnerability 82Table 3.10: Area, production, and yield in the hazard-prone area 83Table 3.11: Estimated cost of proposed emergency measures 86Table 3.12: Estimated cost of proposed mitigation measures 86Table 3.13: Rainfall events producing flood events 87Table 3.14: Classification of relief routes, distance, and shelter areas for different localities 89
ix
Foreword
The devastating impacts of floods on local Himalayan communities as well asdownstream residents has been an enduring concern for both ICIMOD andUNESCO as well as our partners. Riverine and flashfloods cause more damage tolives, livelihoods, and infrastructure annually than any other natural calamities inthe Himalayan region. This has led both ICIMOD and UNESCO to encourageregional collaboration in the study and sharing of mitigation measures on floodsas well as river systems and the interaction between the mountain and plains thatthese rivers induce. One of the platforms that we have created to forge regionalcooperation in the region is the HKH FRIEND. Since its inception in March 1996,HKH-FRIEND has been contributing to improve the understanding of the regionalwater resources and their behaviours in the HKH region.
The advancement in computer-aided and space-based technology such asgeographic information systems (GIS) and remote sensing (RS) has proved veryuseful in studying and mapping the flood-hazards and developing measures thatcan be useful to the local communities as well.
This study documents the use of flood-hazard mapping as a way of helpingcommunities to devise plans that would help them develop warning and responsesystems. This allows communities to prepare a management plan that will boosttheir resilience to mitigate damages and salvage their livelihoods to the extentpossible. This is especially critical for the women and poor within thesecommunities who are the ones to suffer the greatest and the ones with the leastability to recover their meager assts.
This study and flood-hazard mapping of the Ratu Khola watershed in Nepal seeksto encourage others to undertake similar work. The results obtained were ofdirect use to the communities concerned. More importantly, they illustrate anapproach that can be used more widely.
This study has been published at a time when the HKH FRIEND has been putthrough an evaluation and efforts are underway to revamp and reorganise thisregional set up.
ICIMOD and UNESCO-New Delhi were pleased to work together in this importantproject. We hope the study will not only save lives and livelihoods in Ratu Kholabut also provide a basis for replication throughout the Himalayan region.
J. Gabriel Campbell Minja YangDirector General Director and Representative ICIMOD UNESCO-New Delhi

xi
Acknowledgements
We express our sincere gratitude to UNESCO for providing us with both financialand programme support to carry out this work. Special thanks go to the MENRISDivision of ICIMOD for providing the satellite imagery. We would also like toacknowledge the help of the Department of Survey, Ministry of Land Reform andManagement, Government of Nepal in providing aerial photographs andtopographic maps, and the Forest Research and Survey Centre, Forest SurveyDivision, Government of Nepal for providing aerial photographs from 1953/54.Thanks are also due to the Department of Hydrology and Meteorology, GoN, formaking available climate data recorded at meteorological stations located withinand near areas of the Ratu Watershed.
We would like to thank Bhanu Neupane, Regional Programme Specialist ofUNESCO, for his comments and support. We would also like to express our sinceregratitude to Suresh Raj Chalise and Richard Heggen, who accompanied us in thefield study and provided valuable guidance and suggestions. Thanks are also dueto Mr. Pradeep Man Dangol of ICIMOD who helped in various capacities in theaccomplishment of this study, and Xu Jianchu whose encouragment and guidancehelped to make this publication possible. The valuable inputs of the PublicationsUnit is gratefully acknowledged, especially Greta M. Rana, Consultant Editor, JoyceM. Mendez, who oversaw preparation of the publication, Dharma R. Maharjan,who did the design and layout, and Asha K. Thaku, who helped modify many ofthe figures and maps. Last but not least, our heartfelt gratitude goes to all thelocal people who participated in the group discussions and provided us withvaluable insights and information.
The Study Team

Executive Summary
Flood hazards, their impact, and the resilience of communities have beenassessed here on three spatial scales – national at macro-level, watershed atmeso-level, and village development committee/municipality at micro-level. Atnational level, the impacts from different environmental hazards have beenassessed, whereas at watershed level the focus was on hazard, risk, andvulnerability mapping. The Ratu Watershed in the Central Terai (Mahottari andDhanusa districts) was selected for mapping. At micro-level, the focus was onenhancing the resilience of local people to cope with and recover from floodhazard. Rajbas in the upstream area and Jaleshwar municipality in thedownstream area were selected for micro-level activities. The study wascoordinated by the International Centre for Integrated Mountain Development(ICIMOD) with support from the United Nations Education, Scientific and CulturalOrganization (UNESCO), New Delhi, India.
Floods occur repeatedly in Nepal and cause tremendous losses in terms ofproperty and life, particularly in the lowland areas of the country. Hence, theyconstitute the main hazard. Floods that cause substantial devastation in Nepal aretriggered by five different mechanisms: continuous rainfall and cloudbursts, glaciallake outbursts, landslide dam outbursts, failure of infrastructure, and sheetflooding or inundation as a result of excessive rain, bank overflow, or obstructionto the flow from infrastructural development. Nearly 77% of the total lossescaused by water-induced disasters – floods, landslides, and avalanches – occur inthe Terai region where the main water-induced disasters are floods. An extremelyrugged, diverse, and dynamic mountain landscape; the fact that the country islandlocked; inaccessibility; dispersed human settlements; and a high rate ofterritorial mobility among the population are the main causes of extreme physicaland locational vulnerability to floods and landslide disasters. Moreover, socio-economic conditions characterised by a poor human development profile, low levelof economic growth, mass poverty, and a great disparity in the distribution ofproductive assets and income, in addition to inadequate provision of services andlack of political stability, commitment, and accountability, increase thevulnerability to natural disasters and constrain appropriate response andaugmentation of resilience to disasters.
Flood-hazard, risk, and vulnerability mapping in the Ratu Watershed was carriedout through three different approaches: a geomorphic approach using ageographical information system (GIS) and remote sensing (RS), measurement ofrainfall-runoff processes using the Hydrological Engineering Corporation's RiverSystem Analysis (HEC-RAS) model, and social flood hazard mapping based onlocal experiences. The main sources of information were maps, aerialphotographs, selected imagery, household survey and group discussions, field
xii
xiii
observations, and published and unpublished documents. GIS-based softwares,such as ArcView, the Integrated Land and Water Information System (ILWIS), andthe Hydrological Engineering Corporation's River System Analysis [U.S.ArmyCorps] (HEC-RAS and HEC-GeoRas) were used for data processing and analysis.
Flood risk and vulnerability maps prepared for the Ratu Watershed show thatnearly 18% of the area is in the high-risk category. Inundation-hazard maps showthat a large part of the area in the south, near the Nepal-India border, is subjectto extensive inundation even by floods in the two-year return category. Acomparison of hazard maps prepared based on the three different approachesshows that GIS and RS are useful for mapping the flood hazard, risk, andvulnerability of a large area at watershed level.
Flooding, cutting of river banks, and shifting channels, are the most frequentlyoccurring water-induced disasters in the lowland area of the Ratu Watershed. Onaverage, nearly 8% of the total annual household income is lost as a result offloods. Nearly 61% of the households in the watershed are exposed to floodhazards, among them, 21% of the households are situated in high-hazard areas.
The risk of flooding and its associated processes, such as a rise in the river bed,cutting of river banks, and shifting channels, in the Ratu Watershed is great.Moreover, the risk of inundation has increased over recent years because of addedinfrastructure such as roads and bridges. This is the case not only in Nepal butalso in the nearby border area in India.
Responses to flood hazards are confined to rescue and relief during flooding andsome mitigation measures such as construction of dams, spurs, retaining walls,plantation, and drainage management. These activities are insufficient, on the onehand, and, on the other, there are no activities or programmes on floodpreparedness. People in the locality realise the importance of incorporatingcomponents of watershed conservation and drainage management through properland-use guidelines, income-generating activities, community-based early warningsystems, and awareness creation in plans for watershed conservation. They alsorealise the need for a local institutional network to design and implement suchactivities.
An attempt was made to develop a community-based early warning system andidentify safe evacuation routes and areas safe for shelter in order to improve thelocal capacity to respond and manage flood hazards during the second phase ofthe project. In this context, people were trained to read and record precipitationand discharge in upstream areas; and discussions took place on the use of mapsof safe evacuation routes and shelters in downstream areas. The benefits of theseefforts have yet to be realised through organising and networking to establish anearly warning system and by creating awareness.
xiv
This publication is a summary of a detailed study on flood-risk and vulnerabilitymapping of the Ratu Khola using GIS methods. It is divided into four chapters.Chapter One describes the biophysical and socioeconomic characteristics ofNepal, discusses the types, frequency, and magnitude of losses from differenttypes of natural disaster and their spatial concentration with special reference toflood disasters, and assesses the vulnerability to flood hazards in the country.Chapter Two describes flood-hazard and risk mapping in the Ratu Watershed. Thischapter provides details of the project area and the methodology for and resultsof hazard, risk, and vulnerability mapping. Chapter Three gives an account of theassessment carried out on response and resilience in the context of hazard, risk,and vulnerability in the Ratu Watershed. Chapter Four covers the main findings,conclusions, and recommendations.
xv
Acronyms and Abbreviations
AV-RAS Arc View Extension for River Analysis System
DPI dots per inch
DTM digital terrain model
DWIDP Department of Water Induced Disaster Prevention
FCC false colour composite
HEC-RAS Hydrological Engineering Corporation, River System Analysis, USArmy Corps
IHP International Hydrological Programme
ILWIS Integrated Land and Water Information System
LRMP Land Resources Mapping Project
JICA Japan International Cooperation Agency
MBT Main Boundary Thrust
MCT Main Central Thrust
RGB red green blue
RMS root mean square
TM thematic mapper
TIN triangular irregular network
UNDRO United Nation’s Disaster Relief Organization
WECS Water and Energy Commission Secretariat
WMO World Meteorological Organization
3D three-dimensional
Currency EquivalentUS $ 1 = NRs 73.69 (as of 10 September 2006)

Chapter 1
Flood Hazard, Risk and
Vulnerability in Nepal:
the Physical and Socioeconomic
Environment
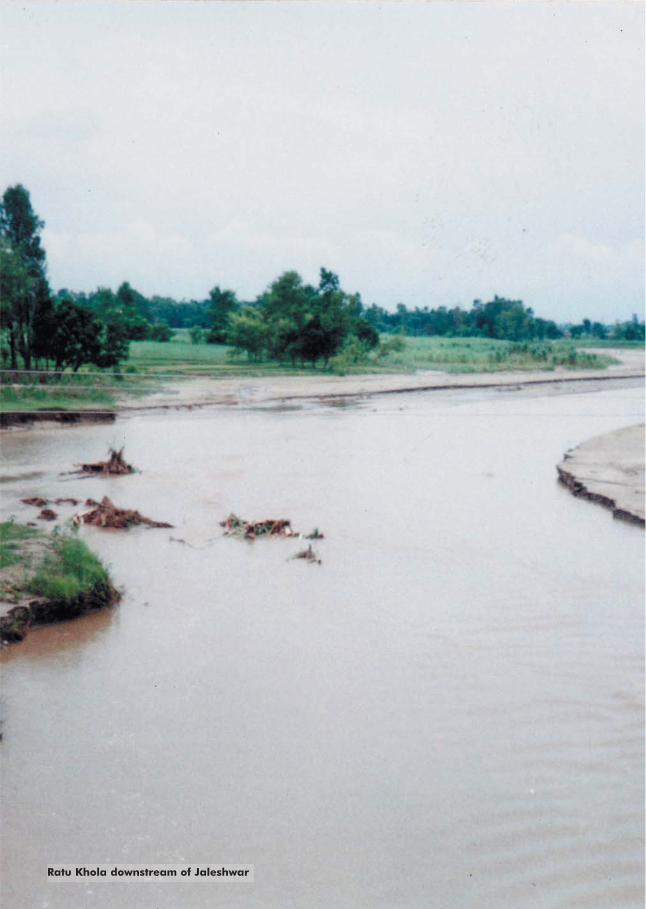
Ratu Khola downstream of Jaleshwar
IntroductionFloods causing loss of life and property are an annual phenomenon in Nepal. Acombination of highly concentrated monsoon precipitation, high relief, steepmountain topography, and deep and narrow river valleys with frequent mass-wasting phenomena renders the country susceptible to flood hazards anddisasters. Each year many people are killed and made homeless by floods. Privateand public property and expensive and often vital infrastructure are damaged. Asa consequence, the overall development of the country has been severely affectedby repeated flooding.
In the context of recent global warming phenomena, a consequent increase in theintensity of extreme precipitation events, and the dynamics of glacial lakes in highmountain areas, the probability of potentially damaging floods occurring is likelyto increase. The risk that is the expected degree of loss from flood hazard is alsolikely to increase. The encroachment of areas susceptible to floods to establishhuman settlements and to carry out infrastructural development in the recent pasthas increased the exposure of these areas to flood hazards. In the past, before theeradication of malaria in 1956, almost all the river valleys, including areas of theDun or Inner Terai where the threat of floods is high, were prone to malaria.People used to shuttle between the mountain ridges during the summer monsoonand the lowland areas during winter in order to avoid malaria. This also helped toavoid or reduce the impact of floods. After the eradication of malaria, investmentin development of human settlements, other infrastructure, and agriculture inlowland areas increased tremendously and, consequently, so did exposure to floodhazards.
Vulnerability to flood disasters is great. Nepal is a least-developed, landlocked,and mountainous country with limited access to socioeconomic infrastructure andservice facilities. Inaccessibility, a low level of human development, and masspoverty are prominent reasons for the poor capacity to anticipate, cope with,resist, and recover from and adapt to different types of hazards, floods beingamong them. In addition, a high population growth rate, among other factors, hasled to increasing poverty. As a result, vulnerability to flood hazards is likely toincrease unless effective flood mitigation and management activities areimplemented. An understanding of the types, frequency, and magnitude of floodevents causing harm to life and property; the extent of loss and damage fromsuch events; and their spatial concentration is necessary in order to developappropriate mitigation and management strategies to reduce risk and vulnerabilityto flood hazards.
Physical and Socioeconomic Environment of NepalNepal lies in the middle of the Hindu Kush-Himalayan region. Geographically it islocated between 80° 4’ to 88° 12’ east longitude and 26° 22’ to 30° 27’ northlatitude, covering an area of 147,181 sq. km. The country is divided into 75administrative districts classified into three ecological regions – the Mountains,the Hills, and the Terai (Figure 1.1). The topography is extremely rugged withelevations ranging from 60m in the south to 8,848m in the north within a shortdistance of about 160 km. Different mountain chains extend from east to west. In
Chapter 1: Flood Hazard, Risk and Vulnerability in Nepal 3
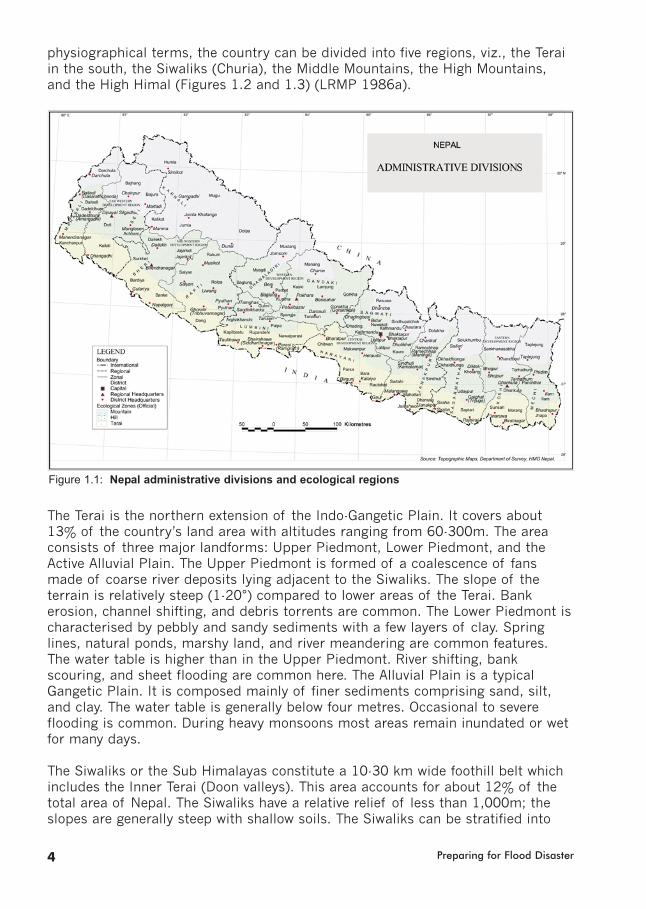
physiographical terms, the country can be divided into five regions, viz., the Teraiin the south, the Siwaliks (Churia), the Middle Mountains, the High Mountains,and the High Himal (Figures 1.2 and 1.3) (LRMP 1986a).
The Terai is the northern extension of the Indo-Gangetic Plain. It covers about13% of the country’s land area with altitudes ranging from 60-300m. The areaconsists of three major landforms: Upper Piedmont, Lower Piedmont, and theActive Alluvial Plain. The Upper Piedmont is formed of a coalescence of fansmade of coarse river deposits lying adjacent to the Siwaliks. The slope of theterrain is relatively steep (1-20°) compared to lower areas of the Terai. Bankerosion, channel shifting, and debris torrents are common. The Lower Piedmont ischaracterised by pebbly and sandy sediments with a few layers of clay. Springlines, natural ponds, marshy land, and river meandering are common features.The water table is higher than in the Upper Piedmont. River shifting, bankscouring, and sheet flooding are common here. The Alluvial Plain is a typicalGangetic Plain. It is composed mainly of finer sediments comprising sand, silt,and clay. The water table is generally below four metres. Occasional to severeflooding is common. During heavy monsoons most areas remain inundated or wetfor many days.
The Siwaliks or the Sub Himalayas constitute a 10-30 km wide foothill belt whichincludes the Inner Terai (Doon valleys). This area accounts for about 12% of thetotal area of Nepal. The Siwaliks have a relative relief of less than 1,000m; theslopes are generally steep with shallow soils. The Siwaliks can be stratified into
Preparing for Flood Disaster4
Figure 1.1: Nepal administrative divisions and ecological regions

three formations: the Lower Siwaliks, the Middle Siwaliks, and the Upper Siwaliks.The Lower Siwaliks consist of hard sandstone with conglomerates containingpebbles of clay and shale, whereas the Upper Siwaliks are composed of coarseconglomerates, sands, grits, and clay. Rivers are extremely flashy; large coarsesediment deposits in a dry river make up a large proportion of the river system.These rivers are extremely unstable and cause immense damage to lives andproperty every year.
The Middle Mountains, also known as the Lesser Himalaya, cover about 30% ofthe total area of Nepal. The total width ranges from 60-80 km. These mountains
Chapter 1: Flood Hazard, Risk and Vulnerability in Nepal 5
Figure 1.2: Nepal physiographic regions and drainage network Source: DWIDP
Figure 1.3: Physiographic regions vis-à-vis major geological formations of the Nepal HimalayaSource: DWIDP
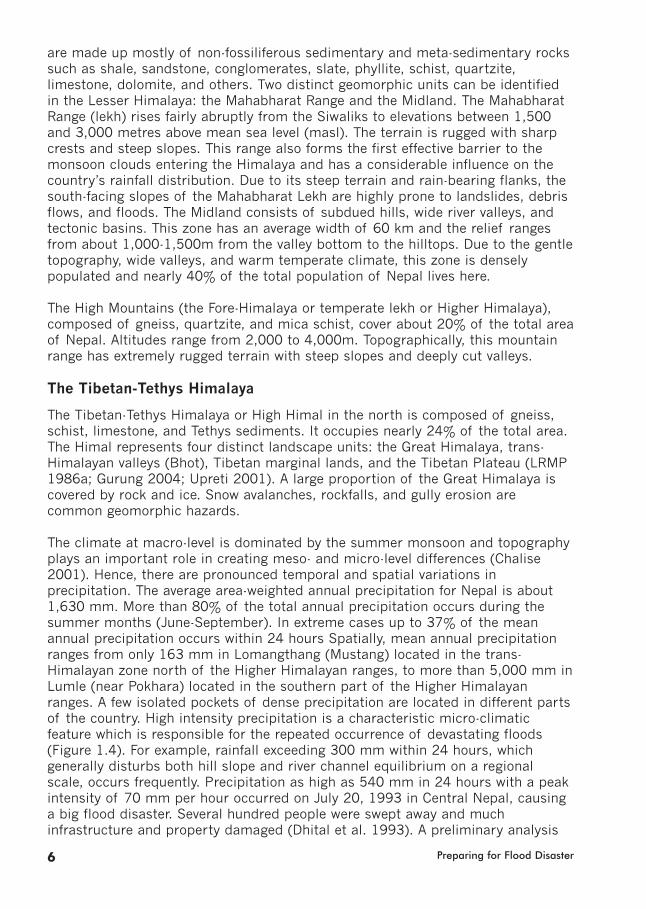
are made up mostly of non-fossiliferous sedimentary and meta-sedimentary rockssuch as shale, sandstone, conglomerates, slate, phyllite, schist, quartzite,limestone, dolomite, and others. Two distinct geomorphic units can be identifiedin the Lesser Himalaya: the Mahabharat Range and the Midland. The MahabharatRange (lekh) rises fairly abruptly from the Siwaliks to elevations between 1,500and 3,000 metres above mean sea level (masl). The terrain is rugged with sharpcrests and steep slopes. This range also forms the first effective barrier to themonsoon clouds entering the Himalaya and has a considerable influence on thecountry’s rainfall distribution. Due to its steep terrain and rain-bearing flanks, thesouth-facing slopes of the Mahabharat Lekh are highly prone to landslides, debrisflows, and floods. The Midland consists of subdued hills, wide river valleys, andtectonic basins. This zone has an average width of 60 km and the relief rangesfrom about 1,000-1,500m from the valley bottom to the hilltops. Due to the gentletopography, wide valleys, and warm temperate climate, this zone is denselypopulated and nearly 40% of the total population of Nepal lives here.
The High Mountains (the Fore-Himalaya or temperate lekh or Higher Himalaya),composed of gneiss, quartzite, and mica schist, cover about 20% of the total areaof Nepal. Altitudes range from 2,000 to 4,000m. Topographically, this mountainrange has extremely rugged terrain with steep slopes and deeply cut valleys.
The Tibetan-Tethys Himalaya
The Tibetan-Tethys Himalaya or High Himal in the north is composed of gneiss,schist, limestone, and Tethys sediments. It occupies nearly 24% of the total area.The Himal represents four distinct landscape units: the Great Himalaya, trans-Himalayan valleys (Bhot), Tibetan marginal lands, and the Tibetan Plateau (LRMP1986a; Gurung 2004; Upreti 2001). A large proportion of the Great Himalaya iscovered by rock and ice. Snow avalanches, rockfalls, and gully erosion arecommon geomorphic hazards.
The climate at macro-level is dominated by the summer monsoon and topographyplays an important role in creating meso- and micro-level differences (Chalise2001). Hence, there are pronounced temporal and spatial variations inprecipitation. The average area-weighted annual precipitation for Nepal is about1,630 mm. More than 80% of the total annual precipitation occurs during thesummer months (June-September). In extreme cases up to 37% of the meanannual precipitation occurs within 24 hours Spatially, mean annual precipitationranges from only 163 mm in Lomangthang (Mustang) located in the trans-Himalayan zone north of the Higher Himalayan ranges, to more than 5,000 mm inLumle (near Pokhara) located in the southern part of the Higher Himalayanranges. A few isolated pockets of dense precipitation are located in different partsof the country. High intensity precipitation is a characteristic micro-climaticfeature which is responsible for the repeated occurrence of devastating floods(Figure 1.4). For example, rainfall exceeding 300 mm within 24 hours, whichgenerally disturbs both hill slope and river channel equilibrium on a regionalscale, occurs frequently. Precipitation as high as 540 mm in 24 hours with a peakintensity of 70 mm per hour occurred on July 20, 1993 in Central Nepal, causinga big flood disaster. Several hundred people were swept away and muchinfrastructure and property damaged (Dhital et al. 1993). A preliminary analysis
Preparing for Flood Disaster6

of the frequency of extreme precipitation, with rainfall exceeding 100 mm within24 hours, occurring between 1971-1990 in the country, indicated an increasingtrend in such events in recent years (Chalise and Khanal 2001). This shows thatthe probability of occurrence of flood hazards has increased.
Nepal has a dense network of more than 6,000 rivers. Some of these riversoriginate in the relatively drier Tibetan Plateau in the People’s Republic of Chinato the north. These rivers are antecedent and have crossed high mountain rangesforming deep gorges and narrow river valleys. The total average annual runofffrom these river systems is estimated at about 225 billion cubic metres. The riversare characterised by high water and sediment discharge during summer. In thehydrological cycle, about 64% of all rainfall immediately drains as surface runoff.Inter annual variation in discharge is also very high. Based on temporal variationin water discharge these rivers can be divided into three types: snow-fed perennialrivers originating in the High Himal with low seasonal fluctuation in discharge;groundwater-fed intermittent rivers originating in the High Mountains and theMiddle Hills with wide seasonal fluctuation; and ephemeral or flashy rivers withvery high width-depth originating from the Siwalik (Churia) hills in the south. Riverchannels in the Inner Terai and the Terai regions are extremely unstable andvarious forms of channel shifting, such as avulsion, chute-off, neck-off, andmeander shift, are common.
According to the Population Census of 2001, Nepal had a total population of23.15 million. Nearly 7.3% of the population lives in the northern MountainRegion, 44.3% in the Middle Hills, and 48.4% in the Terai region (CBS 2002).Population density ranges from 33 persons per sq. km in the Mountain Region to167 persons per sq. km in the Middle Hills, and 330 persons per sq. km in the
Chapter 1: Flood Hazard, Risk and Vulnerability in Nepal 7
Figure 1.4: Nepal distribution of mean annual rainfall
Terai Region. The annual growth rate in population remained 2.25% between 1991and 2001. It is comparatively high (2.62%) in the Terai region. Family size israther large (5.4 persons) and the joint family system is common in many ruralareas. There is wide cultural diversity with more than 100 ethnic/caste groupshaving their own distinct language and culture. The overall literacy rate for thepopulation six years and above is still low at 54.1%; 65.5% for males and 42.8%for females.
Agriculture is the main source of income for the majority of people. More than80% of the workforce is engaged in agriculture. However, agriculture is stillsubsistence-oriented and characterised by low input use and low productivity.Employment in agriculture is mostly seasonal and many people (50%) areunderemployed. Nearly 8% of the total labour force is unemployed. Poverty iswidespread with around 38% of the population living below the poverty line. Morethan one-third of all households have temporary (kachhi) houses constructed withnon-durable materials like wooden matting, bamboo, straw/thatch, and mudwhich are highly susceptible to flooding. Sanitation is another important concernin rural areas. Only 47% of households have toilet facilities. Households withmodern means of communication such as radio and television, are few: 53.1%and 23.5%, respectively. Access to social services, such as schools, healthcentres, and modern means of transport, is very limited. It takes several days toreach the road from many rural settlements.
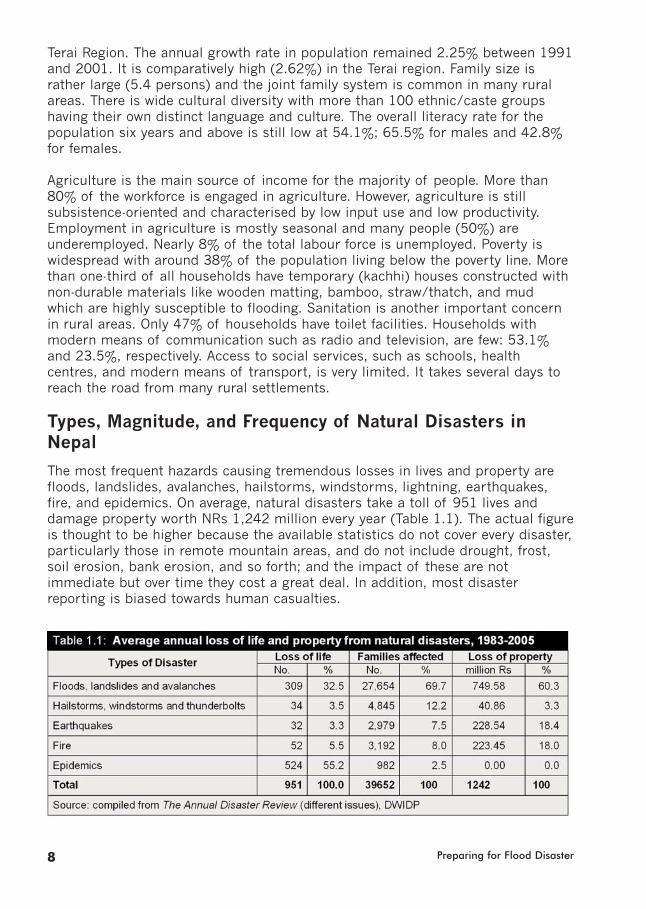
Types, Magnitude, and Frequency of Natural Disasters inNepalThe most frequent hazards causing tremendous losses in lives and property arefloods, landslides, avalanches, hailstorms, windstorms, lightning, earthquakes,fire, and epidemics. On average, natural disasters take a toll of 951 lives anddamage property worth NRs 1,242 million every year (Table 1.1). The actual figureis thought to be higher because the available statistics do not cover every disaster,particularly those in remote mountain areas, and do not include drought, frost,soil erosion, bank erosion, and so forth; and the impact of these are notimmediate but over time they cost a great deal. In addition, most disasterreporting is biased towards human casualties.
Preparing for Flood Disaster8
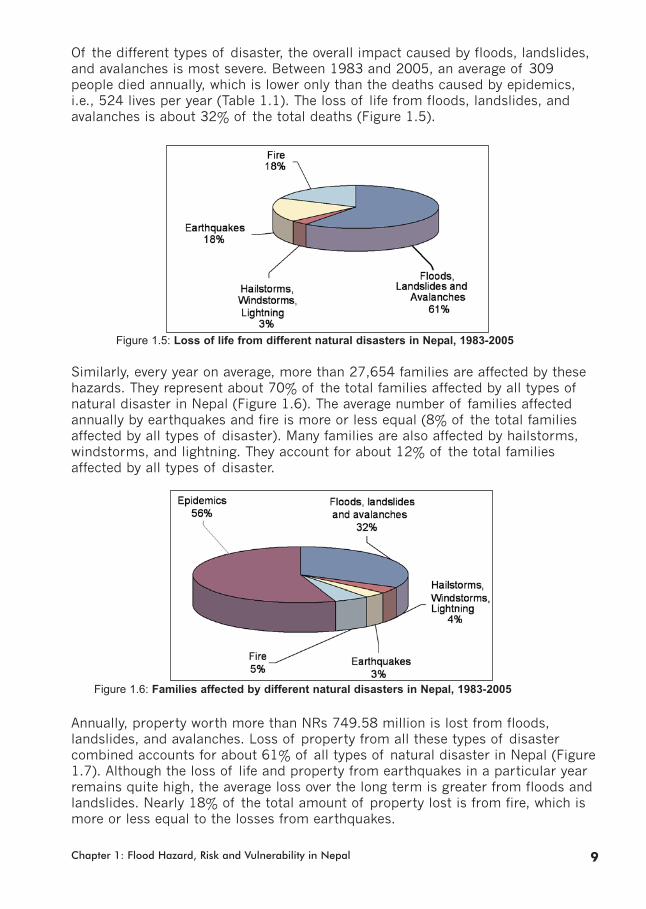
Of the different types of disaster, the overall impact caused by floods, landslides,and avalanches is most severe. Between 1983 and 2005, an average of 309people died annually, which is lower only than the deaths caused by epidemics,i.e., 524 lives per year (Table 1.1). The loss of life from floods, landslides, andavalanches is about 32% of the total deaths (Figure 1.5).
Similarly, every year on average, more than 27,654 families are affected by thesehazards. They represent about 70% of the total families affected by all types ofnatural disaster in Nepal (Figure 1.6). The average number of families affectedannually by earthquakes and fire is more or less equal (8% of the total familiesaffected by all types of disaster). Many families are also affected by hailstorms,windstorms, and lightning. They account for about 12% of the total familiesaffected by all types of disaster.
Annually, property worth more than NRs 749.58 million is lost from floods,landslides, and avalanches. Loss of property from all these types of disastercombined accounts for about 61% of all types of natural disaster in Nepal (Figure1.7). Although the loss of life and property from earthquakes in a particular yearremains quite high, the average loss over the long term is greater from floods andlandslides. Nearly 18% of the total amount of property lost is from fire, which ismore or less equal to the losses from earthquakes.
Chapter 1: Flood Hazard, Risk and Vulnerability in Nepal 9
Figure 1.5: Loss of life from different natural disasters in Nepal, 1983-2005
Figure 1.6: Families affected by different natural disasters in Nepal, 1983-2005

FloodsIn Nepal, devastating floods are triggered by different mechanisms which can beclassified into five major types: i) continuous rainfall and cloudburst, ii) glaciallake outburst floods (GLOFs), iii) landslide dam outburst floods (LDOFs), iv) floodstriggered by the failure of infrastructure, and v) sheet flooding or inundation inlowland areas due to an obstruction imposed against the flow (Dixit 2003; Khanal2005).
Continuous rainfall and cloudburst
Floods are common throughout the country in the latter stages of the summermonsoon when the land is saturated and surface runoff increases. Extremely highintensity precipitation in mountain areas cause landslides on mountain slopes anddebris flows and floods along the river valleys. Extreme precipitation eventsbetween 1948 and 1955 caused landslides and debris flows in mountain areasand, consequently, destructive floods on many rivers in lowland areas. The highestflood recorded occurred on the Kosi River in 1954 and was the result ofwidespread rainfall in its mountain catchment area (Dixit 2003). Livelihoodoptions for many families in mountain areas were threatened. As a response, thegovernment began resettlement programmes in the Inner Terai and Terai regionsin 1956 for severely affected families. At the same time, spontaneous large-scalemigration from the mountains to the Terai and from ridge to river valleys tookplace immediately after these events and concomitant implementation of amalaria eradication programme in the lowland areas (Khanal 2004).
In recent years, between 1981 and 1998, three events of extreme precipitationwith extensive damage have been reported (Chalise and Khanal 2002). Devastatingfloods associated with high intensity precipitation and consequent landslide anddebris flow activities in the mountain terrain occurred in Lele (Lalitpur district) onSeptember 30, 1981; in Kulekhani-Sindhuli area on July 19-20, 1993; and inSyangja district on August 27, 1998. In the 1993 event, the loss of life andproperty was not confined to the mountain areas where high-intensity precipitationhad taken place; hundreds of people were also swept away in downstream areasas far away as Rautahat and Sarlahi districts in the Terai.
Preparing for Flood Disaster10
Figure 1.7: Estimated amount of property lost, 1983-2005
Chapter 1: Flood Hazard, Risk and Vulnerability in Nepal 11
Glacial lake outburst floods (GLOFs)
Glacial lakes are common in the High Himal area of Nepal. A recent study showsthat there are 3,252 glacial lakes in Nepal (Mool et al. 2001). Altogether 21 GLOFevents were identified, of which 13 occurred in 34 years between 1964 and 1998.Out of 21 GLOFs identified, nine occurred in the Tibet Autonomous Region (China)affecting downstream areas along transboundary rivers like the Sunkoshi, Arun, andTrisuli in Nepal. A GLOF in 1981 damaged a hydropower plant and many housesalong the Sunkoshi River and a similar event in 1985 swept away three persons,one hydropower plant, 14 bridges, and 35 houses along the Dudhkoshi River.Nearly 26 glacial lakes are identified as potentially dangerous and much of theinfrastructure along the rivers originating from these lakes is at immediate risk.
Landslide dam outburst floods (LDOFs)
Formation of temporary lakes due to landslide damming is a commonphenomenon in high mountain areas where there are very narrow river channelsand steep mountain slopes. Eleven disastrous floods caused by breaching oflandslide dams have been reported in Nepal between 1967 and 1989 (Khanal1996). Budhigandaki River near Lukubesi in 1968, Sunkoshi River near Barhabisein 1982, Balephi Khola in Sindhupalchok in 1982, and Gyangphedi Khola inNuwakot in 1986 were dammed by landslides and resultant outburst floods sweptaway many people and damaged infrastructure, including human settlements.
Floods triggered by infrastructural failure
Floods triggered as a result of poor infrastructural design are also common inNepal. Eight floods from such causes have been reported. Failure of checkdamsand embankments in Butwal in 1981 led to 41 people, 120 houses, and onebridge being swept away. Similarly, 26 people and 880 houses were swept away bya flood triggered by the failure of a checkdam on the Rapti River in Chitwan in1990. In 1993, the Bagmati River was dammed for a few hours because ofblocking by tree logs at the Bagmati barrage and an outburst flood swept away816 people in Rautahat and Sarlahi districts. Larcha River was dammed by aboulder at the bridge over the highway in 1996 and an outburst flood swept away54 persons and damaged 22 houses.
Sheet flooding
Sheet flooding or inundations are common during the summer monsoon inlowland areas in the southern Terai region. The risk of such hazards has beenincreasing in recent years as a result of increasing development of infrastructuresuch as roads, culverts, and checkdams, and consequent obstruction in thenatural flow of surface runoff. Moreover, unilateral construction of roadsperpendicular to natural flow without sufficient drainage and construction ofbarrages, dams, afflux bunds, and dykes on the rivers near the border areabetween India and Nepal have also exacerbated flooding in Nepal (Bhusal 2004).More than 10 cases of such infrastructure-induced flood disasters have beenreported near the border area.
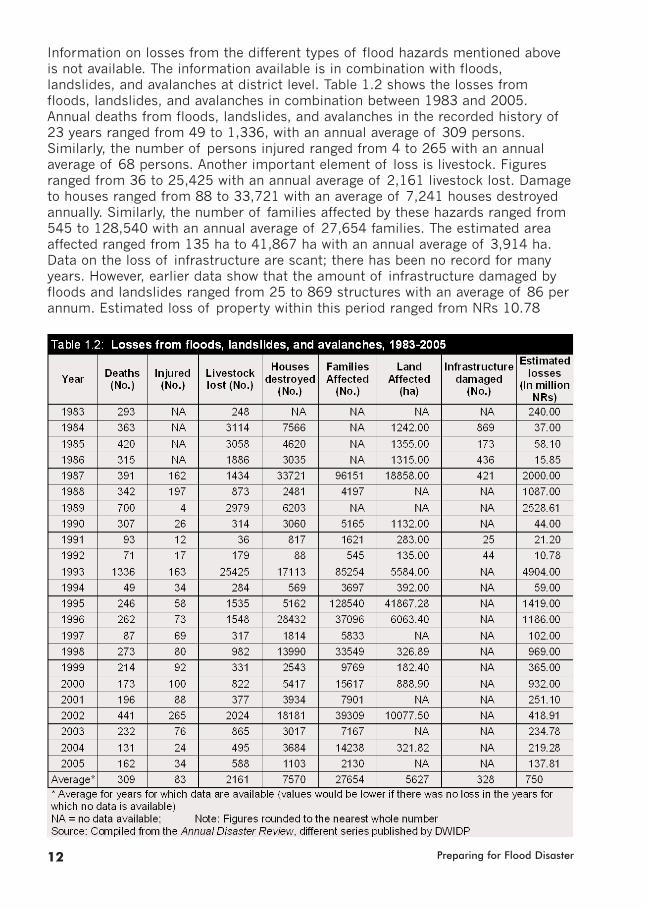
Information on losses from the different types of flood hazards mentioned aboveis not available. The information available is in combination with floods,landslides, and avalanches at district level. Table 1.2 shows the losses fromfloods, landslides, and avalanches in combination between 1983 and 2005.Annual deaths from floods, landslides, and avalanches in the recorded history of23 years ranged from 49 to 1,336, with an annual average of 309 persons.Similarly, the number of persons injured ranged from 4 to 265 with an annualaverage of 68 persons. Another important element of loss is livestock. Figuresranged from 36 to 25,425 with an annual average of 2,161 livestock lost. Damageto houses ranged from 88 to 33,721 with an average of 7,241 houses destroyedannually. Similarly, the number of families affected by these hazards ranged from545 to 128,540 with an annual average of 27,654 families. The estimated areaaffected ranged from 135 ha to 41,867 ha with an annual average of 3,914 ha.Data on the loss of infrastructure are scant; there has been no record for manyyears. However, earlier data show that the amount of infrastructure damaged byfloods and landslides ranged from 25 to 869 structures with an average of 86 perannum. Estimated loss of property within this period ranged from NRs 10.78
Preparing for Flood Disaster12
million to 4,904 million with an average of 750 million annually. On average, thelosses from floods and landslides are almost 0.6% of the GDP at current prices(2006), 3% of the total budget, 4.7% of total development expenditure, and14.9% of foreign loans.
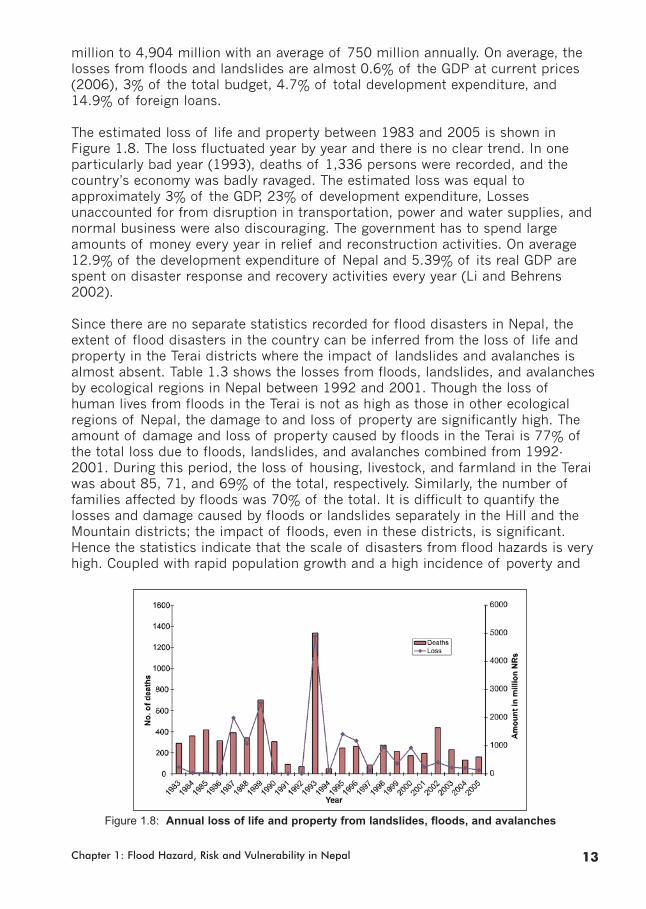
The estimated loss of life and property between 1983 and 2005 is shown inFigure 1.8. The loss fluctuated year by year and there is no clear trend. In oneparticularly bad year (1993), deaths of 1,336 persons were recorded, and thecountry’s economy was badly ravaged. The estimated loss was equal toapproximately 3% of the GDP, 23% of development expenditure, Lossesunaccounted for from disruption in transportation, power and water supplies, andnormal business were also discouraging. The government has to spend largeamounts of money every year in relief and reconstruction activities. On average12.9% of the development expenditure of Nepal and 5.39% of its real GDP arespent on disaster response and recovery activities every year (Li and Behrens2002).
Since there are no separate statistics recorded for flood disasters in Nepal, theextent of flood disasters in the country can be inferred from the loss of life andproperty in the Terai districts where the impact of landslides and avalanches isalmost absent. Table 1.3 shows the losses from floods, landslides, and avalanchesby ecological regions in Nepal between 1992 and 2001. Though the loss ofhuman lives from floods in the Terai is not as high as those in other ecologicalregions of Nepal, the damage to and loss of property are significantly high. Theamount of damage and loss of property caused by floods in the Terai is 77% ofthe total loss due to floods, landslides, and avalanches combined from 1992-2001. During this period, the loss of housing, livestock, and farmland in the Teraiwas about 85, 71, and 69% of the total, respectively. Similarly, the number offamilies affected by floods was 70% of the total. It is difficult to quantify thelosses and damage caused by floods or landslides separately in the Hill and theMountain districts; the impact of floods, even in these districts, is significant.Hence the statistics indicate that the scale of disasters from flood hazards is veryhigh. Coupled with rapid population growth and a high incidence of poverty and
Chapter 1: Flood Hazard, Risk and Vulnerability in Nepal 13
Figure 1.8: Annual loss of life and property from landslides, floods, and avalanches

landless and marginal farmers, the vulnerability in the Terai is high. Figure 1.9shows the frequency of floods and landslides by district, and the annual numberof deaths, families affected, and estimated losses from floods and landslides.Although the loss of life is comparatively low in the Terai districts where floods arethe major natural disasters, the extent of impact in terms of the number offamilies affected and loss estimated is very high. Districts located in the centralTerai, such as Rautahat, Sarlahi, Mahottari, and Dhanusa, are seriously affectedby floods. A comparison made by Khanal (2005) of the loss and damage between1970 and 1993-2002 shows that the central and eastern Terai have beenexperiencing increasing losses from water-induced disasters in the years after1992. Again in the central Terai, Rautahat, Sarlahi, Mahottari, Dhanusa, andSindhuli districts have been repeatedly and seriously affected by floods.
Preparing for Flood Disaster14
Figure 1.9: Frequency of flood and landslide hazards and impact by district Source: DWIDP

Chapter 1: Flood Hazard, Risk and Vulnerability in Nepal 15
VulnerabiltyVarious definitions of vulnerability have been provided in the context of naturalhazards and climate change (Varnes 1984; Blaikie et al. 1994; Twigg 1998;Kumar 1999; Kasperson 2001). From these definitions, vulnerability can be viewedfrom the perspective of the physical, spatial or locational, and socioeconomiccharacteristics of a region. Physical vulnerability could be referred to as a set ofphysical conditions or phenomena, such as geology, topography, climate, land useand land cover, and so forth, which renders a place and the people living theresusceptible to disaster. The technical capacity of the built-up environment tohandle the impact of a natural hazard is also a factor of physical vulnerability.Spatial vulnerability is closely related to physical vulnerability. The degree ofdanger or threat and the levels of exposure and resilience to threat are closelyassociated with location. Hence, spatial vulnerability is a function of location,exposure to hazards, and the physical performance of a structure, whereassocioeconomic vulnerability refers to the socioeconomic and political conditions inwhich people exposed to disaster are living. These vulnerabilities at national levelare briefly discussed below.
Physical and spatial vulnerability
Different factors are responsible for physical and spatial vulnerability to floodhazards in Nepal. These factors are discussed below.
Extremely dynamic landscapeNepal is situated in a high-energy environment because of its rugged relief, steepmountain slopes, active tectonics, highly concentrated precipitation, and intensehuman activities in landscapes associated with high growth and density of humanand livestock populations, along with a subsistence agricultural economy. As aresult, the rate and magnitude of occurrence and operation of geomorphicprocesses are high. Landslides, erosion, debris torrents in the hills, and rises inbed level due to excessive sediment loads in the rivers and the shifting of riverchannels in the Terai are typical geomorphic processes during the summer rainyseason. Both accumulation of snow as a result of the availability of moisture inthe atmosphere, and melting due to high temperatures, take place simultaneouslyduring summer. Snow avalanches, intense glacial erosion, and formation andoutburst of glacial lakes are common phenomena in the High Himal area. Inperiglacial areas, freezing and thawing of ground surfaces are common processesresulting in increased physical weathering and rupturing and dislocating of rockblocks leading to rockfall. These processes are responsible for the production ofhuge amounts of transported hill-slope materials and increased sediment loads inrivers. The highest global rate of sediment production has been reported forHimalayan river basins such as the Kosi, Narayani, and Karnali (2,000-5,000tonnes km–2 year–1). Similarly, rivers originating in the Siwaliks adjacent to theTerai region, such as the Tinau, Rapti, Bagmati, Kamala, and Lothar, carrydisproportionately huge sediment loads. Immense fans formed by Himalayanrivers in the foothills indicate a high degree of sediment production and transportin upstream areas due to intense mass-wasting. The frequent seismic events andexcessive rainfall make the terrain susceptible to erosion, landslides, debris flows,
channel shifting, and sedimentation, and these are responsible for excessivesediment loads in the rivers. This increases water levels in the rivers and risk andvulnerability to floods.
InaccessibilityAccess to infrastructural services such as transportation, communications, health,marketing, and other extension services like education, skills development, and soon, plays an important role in all stages of flood-hazard mitigation andmanagement: pre-disaster preparedness, during disaster evacuation and reliefactivities, and post-disaster rehabilitation and recovery. Nepal, being a landlockedcountry bordered by China in the north and India in the south, east, and west,does not have easy access to other countries via land and water transportation.This has created problems in the timely flow of goods and services, and the abilityto take advantage of cheaper means of transportation. Moreover, Nepal’s ruggedtopography has constrained the development of service infrastructure. Many areasare not yet connected by any modern means of transportation. The developmentof water and railway transportation in the country is insignificant. Even the roadnetwork is very poor. As of 2003 there was a total road length of 16,835 km outof which 28% was black topped, 27% gravelled, and 45% earthen (CBS 2005).The country’s road density is only 11.4 km for an area of 100 sq. km and 7.2 kmfor every 1,000 people. However, its development is not uniform in all regions. Outof 75 administrative districts, 16 districts located in the mountain region are notconnected by any type of road. Though the density of roads in terms of area inthe Terai districts, which are highly prone to flood hazards, is comparatively high,a large proportion of roads are earthen and most of them are closed during therainy season when flooding occurs. Improvements in accessibility throughdeveloping the road network is an essential prerequisite to reducing vulnerabilityto different types of hazard. Notwithstanding the absence of proper design, lackof road maintenance has increased vulnerability to landslides and floods. Poorlydesigned roads without regular maintenance have created serious problems in theform of landslides and erosion in mountain areas, and insufficient drainage alongthe roads has exacerbated inundation in the Terai.
Declining access to physical assetsAgriculture is the main economic activity in Nepal. Access to physical assets,particularly land and land-based resources, has declined and continues to declinewith population growth. The quality of resources has been deteriorating. Theresult has been encroachment on marginal lands prone to soil erosion, landslides,and floods. The land capability survey (LRMP 1986) shows that about 67% of theland is unsuited to cultivation and human settlement due to different biophysicalconditions. Geographical information systems (GIS) overlay analysis of the landutilisation and land capability map prepared by the Land Resources MappingProject (1986) and carried out by Kenting Earth Sciences and the Government ofNepal indicates that about 30% of all hill slope cultivation is carried out onunsuitable land, increasing vulnerability to erosion, landslides, and debris flows.About 21% of lowland cultivation lies in flood-prone areas.
Preparing for Flood Disaster16

Chapter 1: Flood Hazard, Risk and Vulnerability in Nepal 17
Widely-dispersed human settlements and migrationHuman settlements in mountain areas are widely dispersed and small in size. Inthe past, security issues from the perspective of avoidance of wars and diseases,as well as access to food, water, and energy, were considered important factors inthe development of human settlements. Hence, many permanent settlements,particularly in mountain areas, were developed on stable mountain slopes to avoidthe malaria in lowland areas. The size of settlements was determined by thecapacity of physical assets in the surrounding area to fulfil the needs of theencapsulated settlement and its population. However, the rapid growth inpopulation and increasing pressure on available resources, on the one hand, anderadication of malaria from lowland areas, on the other, led to the emergence andexpansion of human settlements in lower river valleys in the mountains, the InnerTerai, and the Terai. Both immigration from outside the country and in-migrationin the Nepal Terai from the hills and mountains remained high since the 1950s.Evidence of this can be seen from the increase in population in the Terai from35.2% in 1952/54 to 36.4% in 1961, 37.6% in 1971, 43.6% in 1981, 46.7% in1991, and 48.4% in 2001 (Pantha and Sharma 2003).
The rapid rate of population growth has led people to encroach on even marginalareas susceptible to flood hazards. Moreover, people who moved to new placeswith experience of different environmental conditions and processes in their placeof origin are less experienced in the type, frequency, and magnitude of floods intheir new destinations and thus, less capable of anticipating flood hazards andinvest unknowingly in hazard-prone areas. Along with the emergence andexpansion of settlements, other infrastructure also developed in nearby areas. Inthe absence of building codes and proper technical standards for built-upenvironments, the risk of and vulnerability to floods have been increasing.
Socioeconomic vulnerability
The scale and magnitude of impacts of natural hazards are not only determinedby physical vulnerability, they are derived from a combination of both physical andsocioeconomic vulnerability. Socioeconomic vulnerability is the extent to which anindividual, community, subgroup, structure, or geographical area is likely to bedamaged or disrupted by a disaster. In the words of Blaikie et al. (1994)vulnerability is the characteristic of a people or group in terms of its capacity toanticipate, cope with, resist, and recover from the impact of a natural disaster.Hence, it refers to coping capacity/actions and resilience of the people, society,and institutions of a nation. A brief overview of socioeconomic vulnerability isdiscussed in the following sections.
The coping capacity for and social resilience to natural disasters assessed interms of some key socioeconomic and infrastructural indicators presented inTable 1.4 indicate that these are among the low and lowest levels in the SouthAsian region. The causes of poor coping capacity are as follows.
Low human development indexNepal’s overall human development index ranking (based on 2000 data) is 142out of 173, lower than all our Asian neighbours except Bangladesh. Poverty has
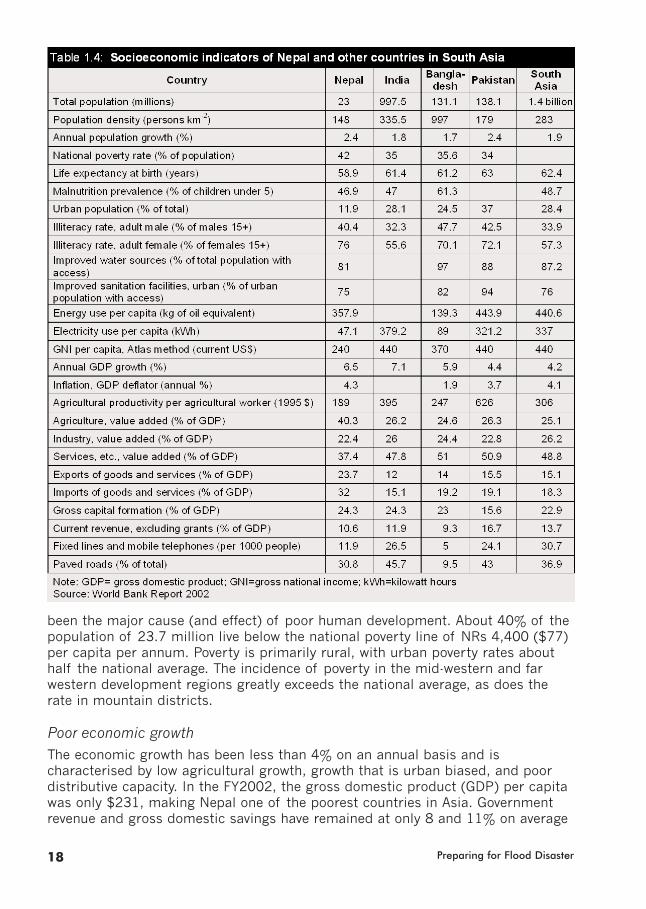
been the major cause (and effect) of poor human development. About 40% of thepopulation of 23.7 million live below the national poverty line of NRs 4,400 ($77)per capita per annum. Poverty is primarily rural, with urban poverty rates abouthalf the national average. The incidence of poverty in the mid-western and farwestern development regions greatly exceeds the national average, as does therate in mountain districts.
Poor economic growthThe economic growth has been less than 4% on an annual basis and ischaracterised by low agricultural growth, growth that is urban biased, and poordistributive capacity. In the FY2002, the gross domestic product (GDP) per capitawas only $231, making Nepal one of the poorest countries in Asia. Governmentrevenue and gross domestic savings have remained at only 8 and 11% on average
Preparing for Flood Disaster18
Chapter 1: Flood Hazard, Risk and Vulnerability in Nepal 19
of the GDP during the last decade. Low levels of revenue and savings limit theallocation of resources to social priority sectors, and thereby limit the capacity tocope with natural disasters
Disparity in productive assets and incomeOut of the total households in the country, nearly 78% are agriculturalhouseholds, cultivating land of at least 0.013 ha and about 2% are agriculturalhouseholds without land (CBS 2004). The average size of agricultural land held is0.83 ha and holding sizes have been decreasing. Small farmers operating lessthan 0.5 ha of land account for about 45% and they own only 13% of theagricultural land. Nearly 73% of households have less than one ha of land andown only 31% of the area. Similarly, the bottom 20% of households receive only5.3% of the national income while the top 10% have nearly 54%. Such widedisparity and skewed distribution in productive assets and income result in a poorcapacity to cope with disasters.
Heavy dependence on agriculture and its poor production potentialAgriculture is the principal economic sector, but its production has remainedstagnant or has only marginally increased: it is poorly diversified and largelydependent on variable monsoons. The value added per unit of agricultural landand agricultural worker is low compared to South Asian levels. Since most farmersare marginal and landless or have very small farms and have limited access totechnology or the formal credit sector, roads, and markets, the agriculturalreturns are very poor (Chettri 1996). Only 44% of the total cultivable land (18% ofthe land area) is irrigated, and the current irrigation system contributesapproximately 33% to the country’s current agricultural production. Even if allirrigable lands were irrigated, the total production would increase by only 50%(due to water inputs only) (WECS 2002).
Inadequate service provisionsAccess to safe drinking water, and health and sanitation is below South Asianstandards. The health service delivery system is inadequate in terms of bothquantity and quality of services. There is only one health centre including hospitalsand health posts per 186 sq. km, and one health centre has to serve nearly 29,000people. The ratio of doctors to population is 1:18,000 with a hospital bed ratio of1:4,000 (CBS 2005). According to the Nepal Living Standards Survey (2003/04),the percentage of households requiring travel times of more than 30 minutes is33% for health posts, 38% for hospitals, 66% for market centres, 46% for telephonebooths, and 66% for paved roads. In rural areas, the mean travel time to reachdifferent facilities is one hour and 16 minutes for health posts/hospitals, 2 hoursand 14 minutes for markets, 5 hours and 11 minutes for paved roads, 3 hours and12 minutes for bus stops, and 2 hours and 13 minutes for telephone booths (CBS2004a). The adult illiteracy rate for both males and females is high and is higher infemales, and overall the highest in South Asia, implying a low level of humanresource development. The electricity use per capita is much lower than South Asianlevels. This low level of social and physical infrastructure implies lowcoping/adaptive capacities in the event of disasters.
Increased population pressureUnder conditions of poor economic growth, the increase in the population growthrate has meant an increase in poverty level. The population has increased by2.25% annually over the last decade, which means the population might welldouble in the next few decades (CBS 2004). Since 1976, the absolute number ofpeople living below poverty level has doubled to the extent of nine million. Everyyear, about 200,000 people enter the labour force, and not a small fraction of thisis absorbed into the non-agricultural sector. As a result, pressure on farmland andforests has increased. At times, this has led to deforestation, intensifying the useof marginal land, and this has affected the environment adversely. This, in turn,has had devastating effects on the poor as they rely on marginal land (UNDP2001). Because of increasing poverty and its adverse effect on the environment,the vulnerability to natural disasters is likely to be high in the context of a poorcoping capacity.
Ineffective implementation of disaster management strategies, policies, andprogrammesGovernment activities until 1982 were mainly directed towards post-disasteractivities, viz., rescue, relief, and rehabilitation, only as voluntary social work (Chettriand Bhattarai 2001; Dixit 2003). The Natural Disaster Relief Act 1982 provided alegislative framework for disaster management in the country (MOL 1982). Severalamendments to the Act were made later. In the Act, provision for disastermanagement committees was made at the national and district levels in order toexpedite relief measures in an effective and coordinated manner. Although there wasan increase in the logistic and institutional capability for emergency response, it stilllacked a broad perspective of disaster and its management. In 1996, the NationalAction Plan on Disaster Management (MOHA 1996) was introduced to address themanifold issues of disaster such as disaster preparedness, early warning systems,disaster information systems, hazard and risk analysis, vulnerability and adaptationassessment, land-use planning, training, and simulation. The Local Self-GovernanceAct (MOL 1999) came into existence in 1999. It provided a legislative framework tocarry out disaster mitigation activities at the local level by mobilising localcommunities. The 9th and 10th plans (NPC 2002; 1998) also emphasisedprevention, mitigation, and reduction of natural disasters through advancedgeological, hydrological, and meteorological technology.
The National Water Plan (2002-2027) prepared by the Water and EnergyCommission (WECS 2005) outlined several activities for the mitigation andmanagement of water-induced disasters. These include formulation of policiesand programmes for better management of water-induced disasters,implementation of risk and vulnerability mapping and zoning work, preparationand implementation of a floodplains’ action plan, development of disasternetworking and information systems such as early warning systems, formulationand implementation of community-level disaster preparedness plans, andimplementation of relief and rehabilitation activities. It discusses approaches toriver basin planning and outlines some activities in this context (WECS 2005).
Preparing for Flood Disaster20
Chapter 1: Flood Hazard, Risk and Vulnerability in Nepal 21
Many institutions are involved in disaster mitigation and management activities.The Ministry of Home Affairs (MOHA) formulates and implements overall disastermanagement strategies, policies, and plans. Relief and rehabilitation activities arecarried out by the Ministry of Home Affairs, Nepal Red Cross Society, Royal NepalArmy, and local non-government organisations (NGOs). The Department of WaterInduced Disaster Prevention (DWIDP) is responsible for managing and mitigatingwater-induced disasters. Similarly, the Department of Hydrology and Meteorology(DHM), the Department of Soil Conservation and Watershed Management, theMinistry of Local Development, the Ministry of Population and Environment(MOPE), and many NGOs, intergovernmental organisations (IGOs), andinternational non-government organisations (INGOs) are involved in disastermitigation and management activities directly or indirectly; but there is poorcoordination in implementing activities among these institutions. Besides theseinstitutions, a special Inundation Committee has been formed under thejurisdiction of the Ministry of Water Resources to deal with the problems ofinundation caused by infrastructure constructed by India just downstream ofNepal. But this committee has yet to be effective in solving outstanding problemsof inundation in border areas.
In spite of these strategies, policies, guidelines, programmes, legislation, andinstitutional provisions, only a few goals have been achieved. The government’sdisaster-mitigation efforts until now have been confined to rescue operations andpost-disaster activities. The reasons for this may be lack of resources, lowtechnical and institutional capabilities, low level of public awareness, and lesseffective mechanisms and bad governance. Less effective legislation and actionplans clearly imply that the state’s disaster coping mechanisms are inefficient.
Mapping and Past Assessment Efforts Efforts have been made to map flood hazards, risks, and vulnerability, althoughthey are very limited in scope and scale. Attempts are made here to review thework carried out on flood hazard, risk, and vulnerability mapping. After thedevastating floods and landslides in 1993 in Kulekhani and its adjacent area,efforts were made to identify and map hazardous sites in that area. Hazardoussites in the Agra, Belkhu, and Malekhu Khola watersheds were mapped (DPTC andCDG 1994). Similarly, hazard maps of severely affected areas from the highintensity precipitation event in 1993 in the Kulekhani area (Miyajima and Thapa1995) and Sarlahi district (Lama 1995) were prepared. Probabilities of hazardswith different ratings were used to delineate areas with different levels of hazard –low, medium, and high in the Kulekhani area. The degree of damage in Sarlahidistrict and its vicinity was mapped. It highlighted the fact that the rising of riverbeds was one of the main causes of flooding in Sarlahi district in the Terai.
Hazard maps have been prepared for the Sun Koshi and Bhote Koshi catchmentsin central Nepal (ITECO 1996). The conclusion of this mapping exercise was thatdevelopment of human settlements in hazardous areas increases the risk offloods and landslides. Measures to reduce the impact of natural disasters in thesecatchments have also been suggested.

A map indicating the zone vulnerable to flood hazards along the Khando Khola inthe eastern Terai was prepared using GIS methodology (Sharma et al. 2003). Riskzoning was carried out for flood hazards with return periods of 10 and 50 yearsSimilarly, preliminary work for flood-risk mapping along the Tinau Khola(downstream from Butwal) and the Lakhandi Khola in Rupandehi district wascarried out by the Department of Hydrology and Meteorology in 1998. A one-dimensional intelligent drive array (IDA) method was used to determine floodlevels along river channels and river valley bottoms using seven river cross-sections surveyed for 42.5 km along the river. It highlighted the need to have asufficient number of cross sections and longitudinal profiles for better mappingand assessment of flood hazards and risks.
The Japan International Cooperation Agency (JICA) and the Department ofIrrigation (DoI) (1999ab) prepared a flood-hazard map of Lakhandei Khola basedon a field study carried out after the 1993 flood under ‘The Study on FloodMitigation Plan for Selected Rivers in the Terai Plain in Nepal’ [sic]. The study alsocarried out various analyses including a flood-flow analysis using an unsteady flowsimulation model. Flood-hazard maps were also prepared based on fieldinvestigations and personal interviews. The simulated result shows that, in manysites, the simulated water level goes far beyond the river cross-section and thiscould not represent the actual flood-water levels. These maps bear no relationshipto the hazard level, e.g., the return period of flooding and floodwater depth. Italso pointed out the need to prepare new flood hazard maps refining thoseprepared for the study (JICA/DoI 1999a). The study concluded that theapplication of numerical modelling tools and GIS can provide effective andefficient means of floodplain analysis and flood-risk assessment. This canfacilitate the transition from conventional flood-hazard mapping techniques basedon field investigations to a knowledge-based system for a more objective analysis.This can also provide a framework for a decision-support system and facilitate theevaluation of alternative strategies for flood management.
An attempt was made at floodplain analysis and flood-risk assessment along theBabai Khola, using GIS and numerical modelling tools such as HEC-RAS (Shrestha2000). Similarly, His Majesty’s Government of Nepal (HMG/N), Department ofWater Induced Disaster Prevention (DWIDP) and the Mountain Risk Engineering(MRE) Unit of Tribhuvan University (TU) (MRE 2003) prepared water-inducedhazard maps of a part of Rupandehi District. A flood-hazard map has beenprepared on the basis of field studies and numerical modelling.
The socio-technical aspect of flood-mitigation work in the Ratu Khola has beenstudied (R.S. Engineering Service 2000). The river basin was categorised intothree zones based on vulnerability. Structural and non-structural measures havebeen recommended.
In 2003, the UNDP Office for Coordination of Humanitarian Affairs (UNDP/OCHA)carried out one mapping and assessment exercise entitled ‘Multi-hazard Mappingand Vulnerability Assessment of Chitwan District’. This study attempted to identifysettlements located in disaster-prone areas; estimate the number of householdsand population in those settlements; assess the risk; discuss the major causes of
Preparing for Flood Disaster22
Chapter 1: Flood Hazard, Risk and Vulnerability in Nepal 23
disaster; and prepare maps showing different types and levels of hazard in thedistrict.
In addition to the flood-hazard and risk-mapping work in different parts of thecountry, several attempts have been made to review and analyse the issues offloods and their mitigation and management in Nepal. Khanal (1997) describesdifferent types of floods frequently occurring in the country and discusses causesbehind their increase and augmentation in the risk of flooding. The causes andextent of damage along with programmes recommended for managing floodsthrough rehabilitation and preparedness activities have been reviewed on the basisof the flood events of 1993 in Chitwan, Makwanpur, Rautahat, and Sarlahidistricts by the National Planning Commission (NPC 1994). Similarly, Chhetri andBhattarai (2001) have reviewed some of the past flood and landslide events;highlighted the main factors contributing to increased vulnerability to flooddisasters; and discussed flood-disaster management efforts – including policy,legislation, and institutional arrangements. The constraints to effective floodprevention and opportunities for technical exchange and collaborative work arealso discussed. Similarly, Dixit (2003) has discussed the nature of frequentlyoccurring floods and their impacts as well as responses in terms of mitigationand management; and he has highlighted the need for new approaches to floodmitigation and risk management.
ICIMOD’s ActivitiesOne of the goals of ICIMOD is to decrease the physical vulnerability withinwatershed and regional river basins and increase the evironmental security ofmountain peoples and the downstream poor. The Water, Hazards andEnvironmental Management (WHEM) Programme of ICIMOD contributes directlyto meeting this goal through its various programme activities. The overall goal ofWHEM is to share information and knowledge on water, hazard, and ecosystemhealth, and secure environmental services in the Hindu Kush-Himalayan (HKH)region through regional collaboration. The Programe has three action initiatives,(i) water and floods, (ii) climate change and response, and (iii) environmentalservices. The activities under water and floods include the identification ofmeasures to mitigate different types of natural hazard, particularly floods;promote skills and methodologies for natural hazard assessment; promoteregional cooperation; and improve public awareness about disaster preparedness.In the past, ICIMOD’s efforts were mainly concentrated on the publication oftechnical reviews on different issues related to water, e.g., flood hazard and risk(Carson 1985; Ives 1986; Bruijnzeel and Bremmer 1986). It also started to carryout case studies of extreme landslide and flood events occurring in the HKHregion (Dhital et al. 1993; Khanal 1999) and organise workshops and meetings toinitiate dialogue on better mitigation and management of flood disasters. ICIMOD,in collaboration with its regional member countries and the UNESCO InternationalHydrology Programme (UNESCO-IHP), was successful in launching the HKH-FRIEND (Flow Regimes for Experimental Network and Data) Project in 1996. ARegional Hydrological Data Centre (RHDC) has also been established to promotefree exchange of data for hydrological research. ICIMOD has also promoted aRegional Flood Initiative in collaboration with the World Meteorological
Organization (WMO) to promote regional cooperation in flood forecasting andsharing of data and information among regional member countries. Its aim is tobuild trust and confidence amongst the participating countries through regionaldialogues and to enable establishment of an operational flood information systemproviding reliable and timely flood forecasting and information to minimise theloss of lives and property in the Indus Ganges, Bramhaputra and Megne RiverBasins.
ICIMOD has carried out hazard and risk mapping and community risk andvulnerability assessment activities as a part of the Participatory DisasterManagement Programme (NEP/99/014) implemented by UNDP/Nepal (ICIMOD2002; 2002a). Its aim was to map hazards and risks in seven village developmentcommittees (VDCs) and one municipality in four districts of Nepal. Among them,two districts – Chitwan and Barida – lie in the Inner Terai and Terai regions wherethe main hazard is associated with floods and consequent changes in riverchannels. The relatively greater exposure of lives, buildings, land, crops, livestock,and infrastructure to water-induced disasters, on the one hand, and the loweroverall response and recovery capacity of local people in VDCs located in theInner Terai and Terai regions compared to VDCs located in the Hills, on the other,clearly indicate an increasing risk of flood hazards in the Inner Terai and Terairegions. It also shows that the application of GIS and remote sensing (RS)technology is very useful for flood-hazard and risk mapping. It concludes thatsuch hazard and risk maps provide a basis for formulating different interventionstrategies and programmes to reduce the adverse impacts of flood disasters
It was in this context that the study described in this publication was proposed withthe objectives of preparing flood-hazard, risk, and vulnerability maps andassessments at watershed level with the active participation of local people. Keepingin mind the increasing loss of property from floods and other water-induceddisasters in the central Terai region, Ratu Khola and its basin located in Mahottariand Dhanusa districts, were selected for flood-hazard, risk, and vulnerabilitymapping and assessment.
Preparing for Flood Disaster24
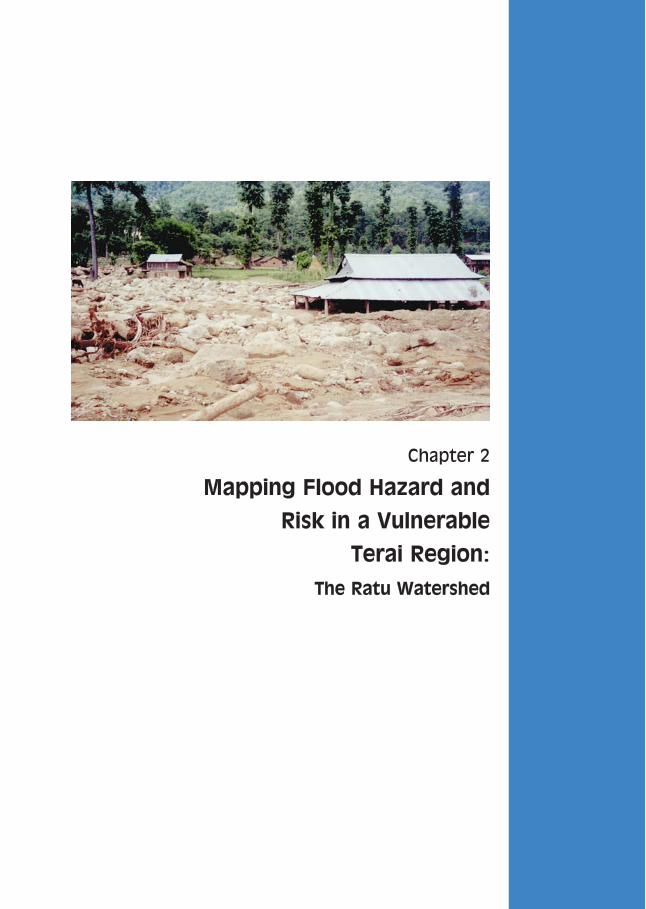
Chapter 2
Mapping Flood Hazard and
Risk in a Vulnerable
Terai Region:
The Ratu Watershed

Planted land on the banks of the Ratu Khola illustrates the risks floods pose to agriculture.

IntroductionThe extent of natural hazards, losses and damage caused by them, and vulnerabilityto them at national and district levels were discussed in Chapter One. There isevidence that losses caused by floods have been increasing in the country as awhole and that the Terai and Inner Terai regions are affected the most. Experienceshows that the adverse impact of flood disasters can be reduced substantially ifappropriate disaster-preparedness plans and mitigation measures are developed andimplemented. This chapter deals with the mapping and zoning of flood hazard, risk,and vulnerability in the Ratu Watershed. Hazard, risk, and vulnerability mapping andzoning are effective tools in this respect and provide a basis for devising appropriatepreparedness plans and mitigation measures. In this context Ratu watershed in theTerai Region, a region that has been frequently affected by floods, was selected for acase study in order to develop an appropriate methodology by focusing on the useof remote-sensing techniques and GIS tools for mapping flood hazards, risks, andvulnerability. Ratu is not a unique watershed, its biophysical and socioeconomicsettings are more or less similar to those of other rivers originating from the MiddleMountains and Siwaliks and draining the Terai physiographic region, which is proneto flooding, throughout the country. Hence it is expected that the findings of thisstudy will be applicable for the Terai region of Nepal and the adjacent plains of theHKH region as a whole, and useful for an attempting to reduce the risk of andvulnerability to flood disasters
This study was carried out by the International Centre for Integrated MountainDevelopment (ICIMOD), Kathmandu, Nepal, with support from the United NationsEducation, Scientific and Cultural Organisation (UNESCO), New Delhi, India.
A flood-hazard, risk, and vulnerability map provides easily understandableinformation on the extent of inundation and river instabilities such as channelshifting, bank cutting/erosion, overland flow, debris flow, and gully erosiontogether with the potential risk to human habitats, property, activities, and theenvironment. The ultimate goal of hazard, risk, and vulnerability mapping is tominimise damage from flood disasters by improving the response and resilience oflocal people to disasters of this kind.
ObjectivesThe main objective of this study was to prepare flood-hazard, risk, andvulnerability maps and to identify an appropriate disaster-preparedness plan andmitigation activities for the Ratu Watershed as a whole at pre-feasibility level. Thespecific objectives were as follows.• Assess the nature of floods in terms of type, magnitude, and recurrence
intervals and impacts in terms of losses.• Identify and delineate areas affected by floods and other water-related
disasters such as channel shifting, bank erosion in the past, and areassusceptible to the same in future.
• Assess and map the degree of risk, incorporating all the elements ofbiophysical, socioeconomic, and service infrastructure located in areassusceptible to floods with probable magnitude and recurrence intervals.
Chapter 2: Mapping Flood Hazard and Risk in a Vulnerable Terai Region 27
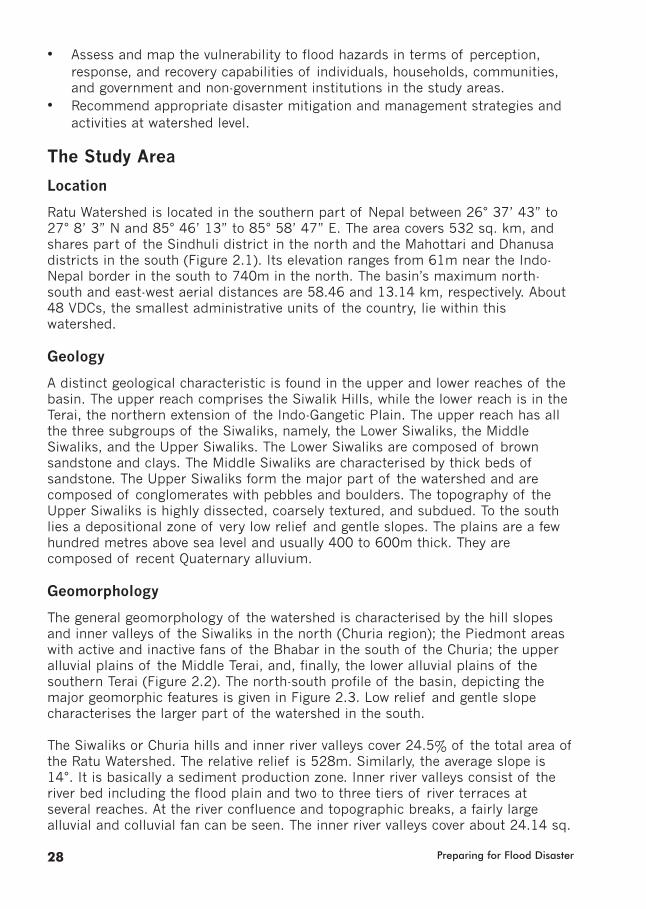
• Assess and map the vulnerability to flood hazards in terms of perception,response, and recovery capabilities of individuals, households, communities,and government and non-government institutions in the study areas.
• Recommend appropriate disaster mitigation and management strategies andactivities at watershed level.
The Study Area
Location
Ratu Watershed is located in the southern part of Nepal between 26° 37’ 43” to27° 8’ 3” N and 85° 46’ 13” to 85° 58’ 47” E. The area covers 532 sq. km, andshares part of the Sindhuli district in the north and the Mahottari and Dhanusadistricts in the south (Figure 2.1). Its elevation ranges from 61m near the Indo-Nepal border in the south to 740m in the north. The basin’s maximum north-south and east-west aerial distances are 58.46 and 13.14 km, respectively. About48 VDCs, the smallest administrative units of the country, lie within thiswatershed.
Geology
A distinct geological characteristic is found in the upper and lower reaches of thebasin. The upper reach comprises the Siwalik Hills, while the lower reach is in theTerai, the northern extension of the Indo-Gangetic Plain. The upper reach has allthe three subgroups of the Siwaliks, namely, the Lower Siwaliks, the MiddleSiwaliks, and the Upper Siwaliks. The Lower Siwaliks are composed of brownsandstone and clays. The Middle Siwaliks are characterised by thick beds ofsandstone. The Upper Siwaliks form the major part of the watershed and arecomposed of conglomerates with pebbles and boulders. The topography of theUpper Siwaliks is highly dissected, coarsely textured, and subdued. To the southlies a depositional zone of very low relief and gentle slopes. The plains are a fewhundred metres above sea level and usually 400 to 600m thick. They arecomposed of recent Quaternary alluvium.
Geomorphology
The general geomorphology of the watershed is characterised by the hill slopesand inner valleys of the Siwaliks in the north (Churia region); the Piedmont areaswith active and inactive fans of the Bhabar in the south of the Churia; the upperalluvial plains of the Middle Terai, and, finally, the lower alluvial plains of thesouthern Terai (Figure 2.2). The north-south profile of the basin, depicting themajor geomorphic features is given in Figure 2.3. Low relief and gentle slopecharacterises the larger part of the watershed in the south.
The Siwaliks or Churia hills and inner river valleys cover 24.5% of the total area ofthe Ratu Watershed. The relative relief is 528m. Similarly, the average slope is14°. It is basically a sediment production zone. Inner river valleys consist of theriver bed including the flood plain and two to three tiers of river terraces atseveral reaches. At the river confluence and topographic breaks, a fairly largealluvial and colluvial fan can be seen. The inner river valleys cover about 24.14 sq.
Preparing for Flood Disaster28
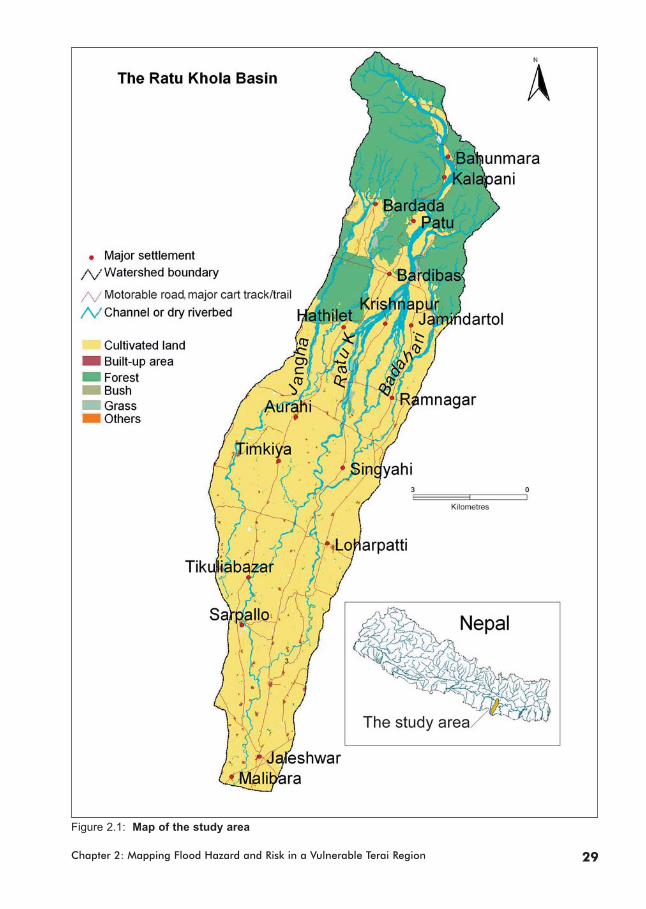
Chapter 2: Mapping Flood Hazard and Risk in a Vulnerable Terai Region 29
Figure 2.1: Map of the study area
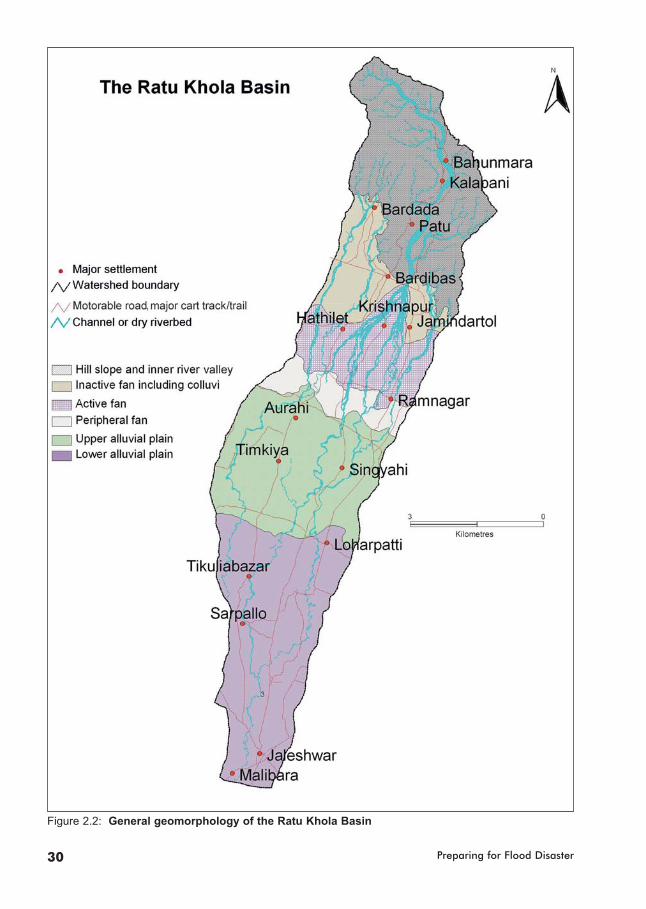
Preparing for Flood Disaster30
Figure 2.2: General geomorphology of the Ratu Khola Basin
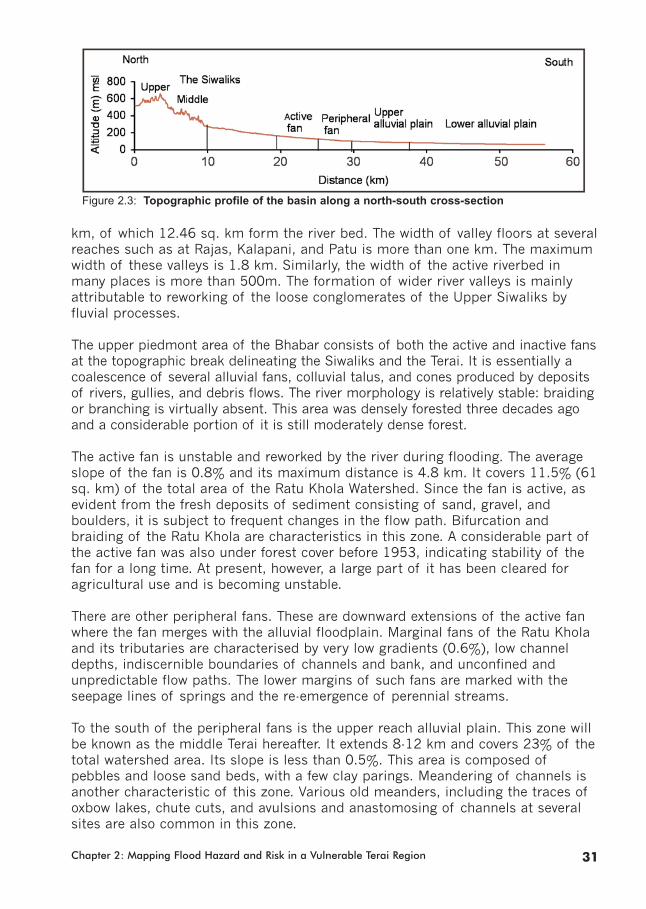
km, of which 12.46 sq. km form the river bed. The width of valley floors at severalreaches such as at Rajas, Kalapani, and Patu is more than one km. The maximumwidth of these valleys is 1.8 km. Similarly, the width of the active riverbed inmany places is more than 500m. The formation of wider river valleys is mainlyattributable to reworking of the loose conglomerates of the Upper Siwaliks byfluvial processes.
The upper piedmont area of the Bhabar consists of both the active and inactive fansat the topographic break delineating the Siwaliks and the Terai. It is essentially acoalescence of several alluvial fans, colluvial talus, and cones produced by depositsof rivers, gullies, and debris flows. The river morphology is relatively stable: braidingor branching is virtually absent. This area was densely forested three decades agoand a considerable portion of it is still moderately dense forest.
The active fan is unstable and reworked by the river during flooding. The averageslope of the fan is 0.8% and its maximum distance is 4.8 km. It covers 11.5% (61sq. km) of the total area of the Ratu Khola Watershed. Since the fan is active, asevident from the fresh deposits of sediment consisting of sand, gravel, andboulders, it is subject to frequent changes in the flow path. Bifurcation andbraiding of the Ratu Khola are characteristics in this zone. A considerable part ofthe active fan was also under forest cover before 1953, indicating stability of thefan for a long time. At present, however, a large part of it has been cleared foragricultural use and is becoming unstable.
There are other peripheral fans. These are downward extensions of the active fanwhere the fan merges with the alluvial floodplain. Marginal fans of the Ratu Kholaand its tributaries are characterised by very low gradients (0.6%), low channeldepths, indiscernible boundaries of channels and bank, and unconfined andunpredictable flow paths. The lower margins of such fans are marked with theseepage lines of springs and the re-emergence of perennial streams.
To the south of the peripheral fans is the upper reach alluvial plain. This zone willbe known as the middle Terai hereafter. It extends 8-12 km and covers 23% of thetotal watershed area. Its slope is less than 0.5%. This area is composed ofpebbles and loose sand beds, with a few clay parings. Meandering of channels isanother characteristic of this zone. Various old meanders, including the traces ofoxbow lakes, chute cuts, and avulsions and anastomosing of channels at severalsites are also common in this zone.
Chapter 2: Mapping Flood Hazard and Risk in a Vulnerable Terai Region 31
Figure 2.3: Topographic profile of the basin along a north-south cross-section
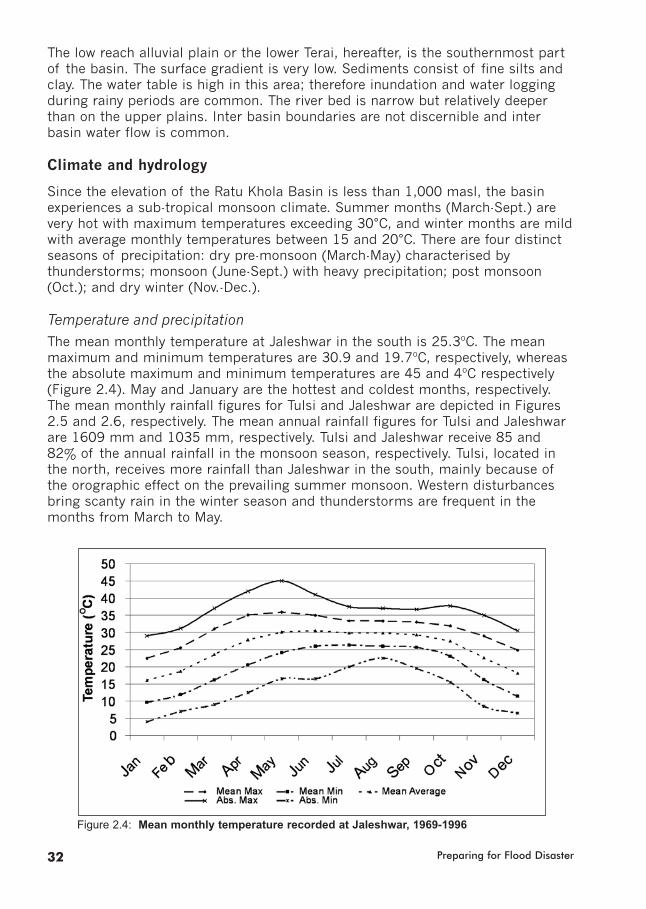
Preparing for Flood Disaster32
The low reach alluvial plain or the lower Terai, hereafter, is the southernmost partof the basin. The surface gradient is very low. Sediments consist of fine silts andclay. The water table is high in this area; therefore inundation and water loggingduring rainy periods are common. The river bed is narrow but relatively deeperthan on the upper plains. Inter basin boundaries are not discernible and interbasin water flow is common.
Climate and hydrology
Since the elevation of the Ratu Khola Basin is less than 1,000 masl, the basinexperiences a sub-tropical monsoon climate. Summer months (March-Sept.) arevery hot with maximum temperatures exceeding 30°C, and winter months are mildwith average monthly temperatures between 15 and 20°C. There are four distinctseasons of precipitation: dry pre-monsoon (March-May) characterised bythunderstorms; monsoon (June-Sept.) with heavy precipitation; post monsoon(Oct.); and dry winter (Nov.-Dec.).
Temperature and precipitationThe mean monthly temperature at Jaleshwar in the south is 25.3ºC. The meanmaximum and minimum temperatures are 30.9 and 19.7ºC, respectively, whereasthe absolute maximum and minimum temperatures are 45 and 4ºC respectively(Figure 2.4). May and January are the hottest and coldest months, respectively. The mean monthly rainfall figures for Tulsi and Jaleshwar are depicted in Figures2.5 and 2.6, respectively. The mean annual rainfall figures for Tulsi and Jaleshwarare 1609 mm and 1035 mm, respectively. Tulsi and Jaleshwar receive 85 and82% of the annual rainfall in the monsoon season, respectively. Tulsi, located inthe north, receives more rainfall than Jaleshwar in the south, mainly because ofthe orographic effect on the prevailing summer monsoon. Western disturbancesbring scanty rain in the winter season and thunderstorms are frequent in themonths from March to May.
Figure 2.4: Mean monthly temperature recorded at Jaleshwar, 1969-1996
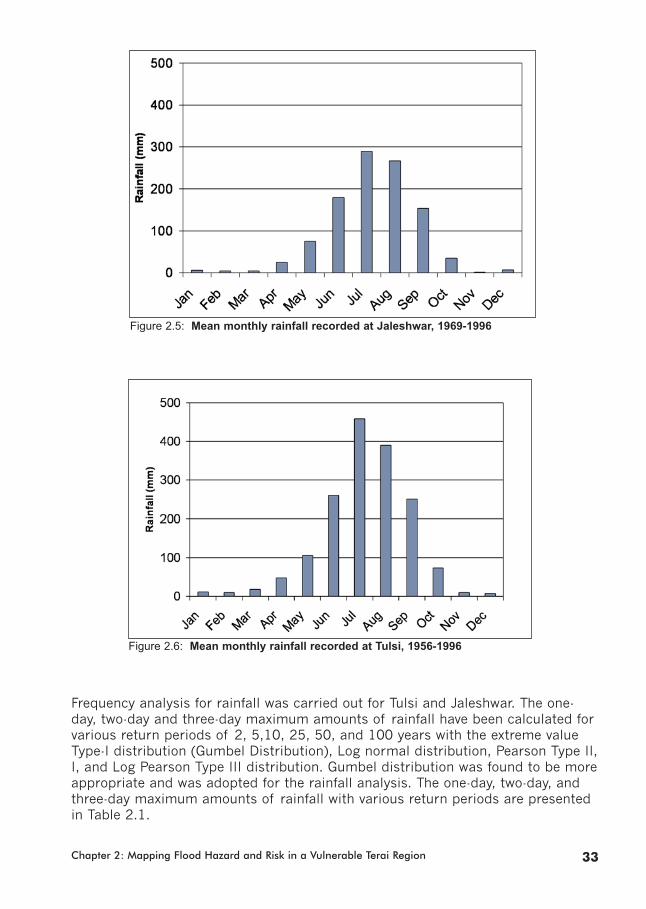
Chapter 2: Mapping Flood Hazard and Risk in a Vulnerable Terai Region 33
Frequency analysis for rainfall was carried out for Tulsi and Jaleshwar. The one-day, two-day and three-day maximum amounts of rainfall have been calculated forvarious return periods of 2, 5,10, 25, 50, and 100 years with the extreme valueType-I distribution (Gumbel Distribution), Log normal distribution, Pearson Type II,I, and Log Pearson Type III distribution. Gumbel distribution was found to be moreappropriate and was adopted for the rainfall analysis. The one-day, two-day, andthree-day maximum amounts of rainfall with various return periods are presentedin Table 2.1.
Figure 2.5: Mean monthly rainfall recorded at Jaleshwar, 1969-1996
Figure 2.6: Mean monthly rainfall recorded at Tulsi, 1956-1996
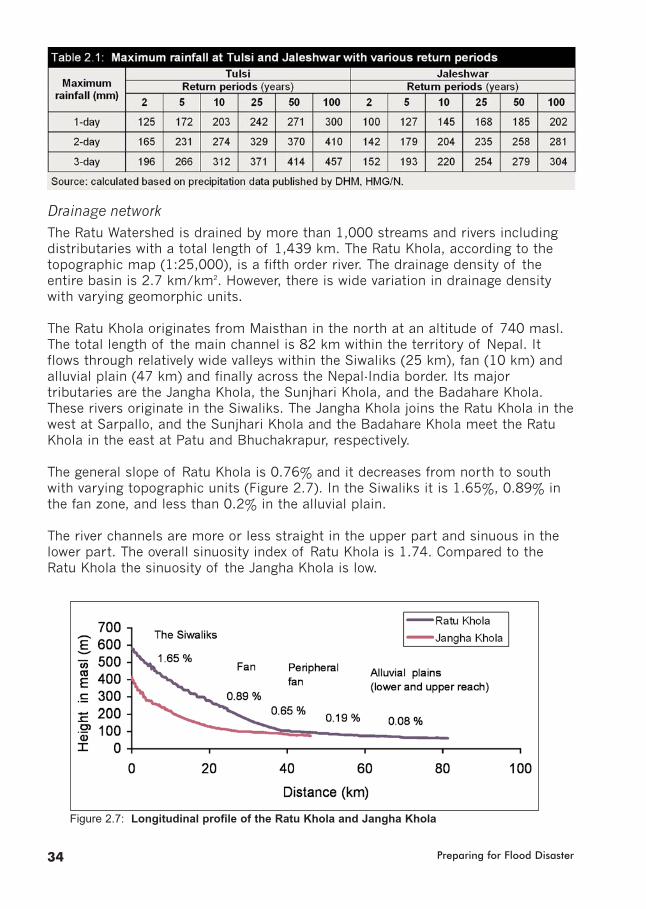
Preparing for Flood Disaster34
Drainage networkThe Ratu Watershed is drained by more than 1,000 streams and rivers includingdistributaries with a total length of 1,439 km. The Ratu Khola, according to thetopographic map (1:25,000), is a fifth order river. The drainage density of theentire basin is 2.7 km/km2. However, there is wide variation in drainage densitywith varying geomorphic units.
The Ratu Khola originates from Maisthan in the north at an altitude of 740 masl.The total length of the main channel is 82 km within the territory of Nepal. Itflows through relatively wide valleys within the Siwaliks (25 km), fan (10 km) andalluvial plain (47 km) and finally across the Nepal-India border. Its majortributaries are the Jangha Khola, the Sunjhari Khola, and the Badahare Khola.These rivers originate in the Siwaliks. The Jangha Khola joins the Ratu Khola in thewest at Sarpallo, and the Sunjhari Khola and the Badahare Khola meet the RatuKhola in the east at Patu and Bhuchakrapur, respectively.
The general slope of Ratu Khola is 0.76% and it decreases from north to southwith varying topographic units (Figure 2.7). In the Siwaliks it is 1.65%, 0.89% inthe fan zone, and less than 0.2% in the alluvial plain.
The river channels are more or less straight in the upper part and sinuous in thelower part. The overall sinuosity index of Ratu Khola is 1.74. Compared to theRatu Khola the sinuosity of the Jangha Khola is low.
Figure 2.7: Longitudinal profile of the Ratu Khola and Jangha Khola
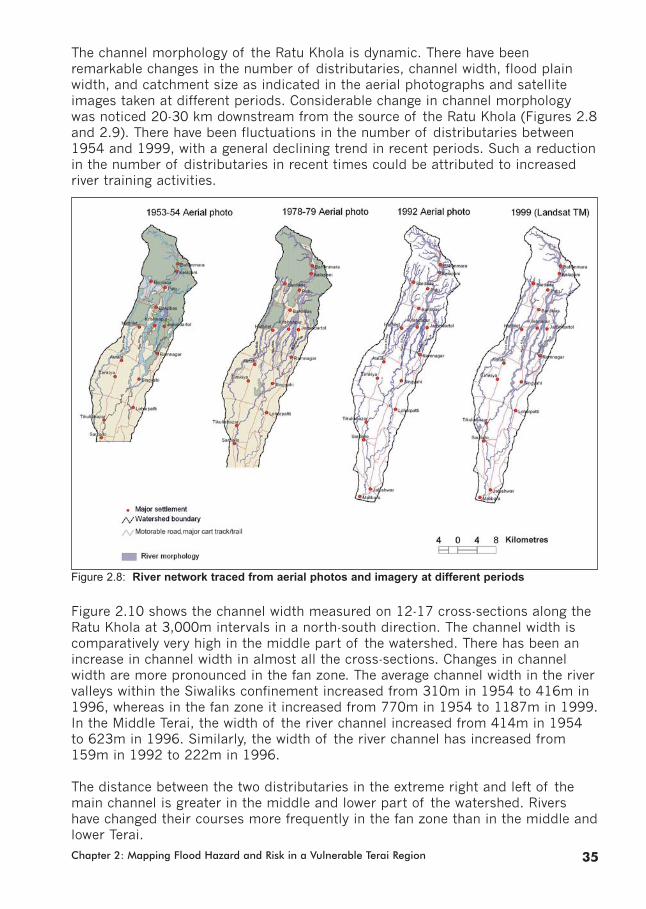
Chapter 2: Mapping Flood Hazard and Risk in a Vulnerable Terai Region 35
The channel morphology of the Ratu Khola is dynamic. There have beenremarkable changes in the number of distributaries, channel width, flood plainwidth, and catchment size as indicated in the aerial photographs and satelliteimages taken at different periods. Considerable change in channel morphologywas noticed 20-30 km downstream from the source of the Ratu Khola (Figures 2.8and 2.9). There have been fluctuations in the number of distributaries between1954 and 1999, with a general declining trend in recent periods. Such a reductionin the number of distributaries in recent times could be attributed to increasedriver training activities.
Figure 2.10 shows the channel width measured on 12-17 cross-sections along theRatu Khola at 3,000m intervals in a north-south direction. The channel width iscomparatively very high in the middle part of the watershed. There has been anincrease in channel width in almost all the cross-sections. Changes in channelwidth are more pronounced in the fan zone. The average channel width in the rivervalleys within the Siwaliks confinement increased from 310m in 1954 to 416m in1996, whereas in the fan zone it increased from 770m in 1954 to 1187m in 1999.In the Middle Terai, the width of the river channel increased from 414m in 1954to 623m in 1996. Similarly, the width of the river channel has increased from159m in 1992 to 222m in 1996.
The distance between the two distributaries in the extreme right and left of themain channel is greater in the middle and lower part of the watershed. Rivershave changed their courses more frequently in the fan zone than in the middle andlower Terai.
Figure 2.8: River network traced from aerial photos and imagery at different periods
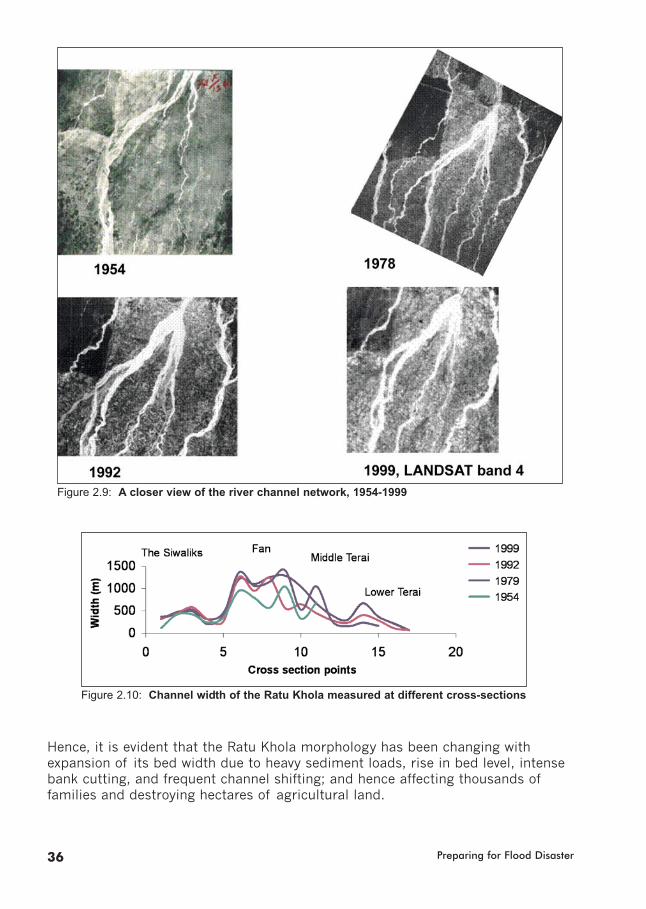
Preparing for Flood Disaster36
Hence, it is evident that the Ratu Khola morphology has been changing withexpansion of its bed width due to heavy sediment loads, rise in bed level, intensebank cutting, and frequent channel shifting; and hence affecting thousands offamilies and destroying hectares of agricultural land.
Figure 2.9: A closer view of the river channel network, 1954-1999
Figure 2.10: Channel width of the Ratu Khola measured at different cross-sections

Chapter 2: Mapping Flood Hazard and Risk in a Vulnerable Terai Region 37
DischargeThe Ratu Khola is not gauged. Therefore the peak discharges for various returnperiods have been calculated by empirical methods; the results are presented inTable 2.2. Bahunmara is located in the upper watershed with peak dischargesranging frm 92-287 m3/s. The Jaleshwar reach is in the lower Terai area wherefloods cause inundation over an extensive floodplain for a prolonged number ofdays.
Land use and land cover
About two-thirds of the basin is under cultivation. Only 4% of the total cultivatedland lies in the valley floor of the Ratu Khola and the Sunjhari Khola (Table 2.3and Figure 2.11). The remaining 96% lies in the fan and the alluvial plain. Forestsoccupy 124 sq. km, or 23% of the total watershed area. Of that,103 sq. km areon the hill slopes with the remaining forests situated on the inactive fan. Theactive fan zone has no forested area and the alluvial plain in the south has only2.91 sq. km of forest land.
A considerable portion (6.1%) of the basin area comprises bare ground withrecent sand and gravel deposits. The grass area located within and around theriver bed (old sand and gravel deposits) accounts for 1.6% of the total area. Thisis wasteland subjected to frequent flooding. A huge proportion of the sand andgravel is concentrated in the upper and middle reaches, i.e., the inner river valley(33.5%) and fan zone (55.5%).
Other land uses, such as built-up areas, orchards, and ponds, cover 3.3% of thetotal area. Built-up areas and ponds are concentrated on the alluvial plain. Housesare generally scattered on the fan and in the river valleys.

Preparing for Flood Disaster38
A change in land use and land cover could be seen by comparing the aerial photosfrom 1953-54 and those from 1992. In Bhabar, the area under forest cover haddecreased from 177 sq. km (including a few small patches of cultivated landamidst the forest in the fan region) to 124 sq. km, which is a decline of 30% inforest cover during the last 50 years. Most of the deforestation took place before1979. Settlements like Bhulke, Laminanda, Prasai, Lotagau, Rajbas, Upper Patu,Gumastatol, and Dhapsar in the valleys of the Ratu Khola, and its tributary theSunjhari Khola, did not exist before 1954. Similarly, the Bhaktipur area in theupper Jangha Khola catchment was under forest cover. There was moderatelydense to dense forest interspersed by patches of cultivated land around thesettlements located in the active fan area. These settlements are Lalgadh, Lalbhiti,Bandra, Bengadarbar, Jamindartol, Chaulikha, Krishnapur, and Krishnagar. Thesesettlements, with some houses and small patches of cultivated area, are recordedin the 1959 topographic maps.
Demography
There are 53,323 households with a total population of 310,994 and a density of584/km2. The density of population is generally higher in most of the VDCslocated in the middle and lower Terai than in the northern counterpart (Figure2.12). There are more than 60 ethnic/caste groups in the watershed. Most are ofTerai origin (80%). Households of people whose origin is in the hills account forabout 20%. The northern part (Bhabar and the Churia and Bhabar region) of thewatershed is inhabited mainly by people from the hills.
Nearly 7.4% of households migrated into the watershed after the 1950s. Thepercentage share of in-migrant households increases from 2.5% in the lower partto 6.5% in the middle and 22.2% in the upper part of the watershed. Largenumbers of people migrated from the hills and mountain regions and settled inthe northern areas. As a result, wide areas of forest were cleared for settlementsand agricultural use.
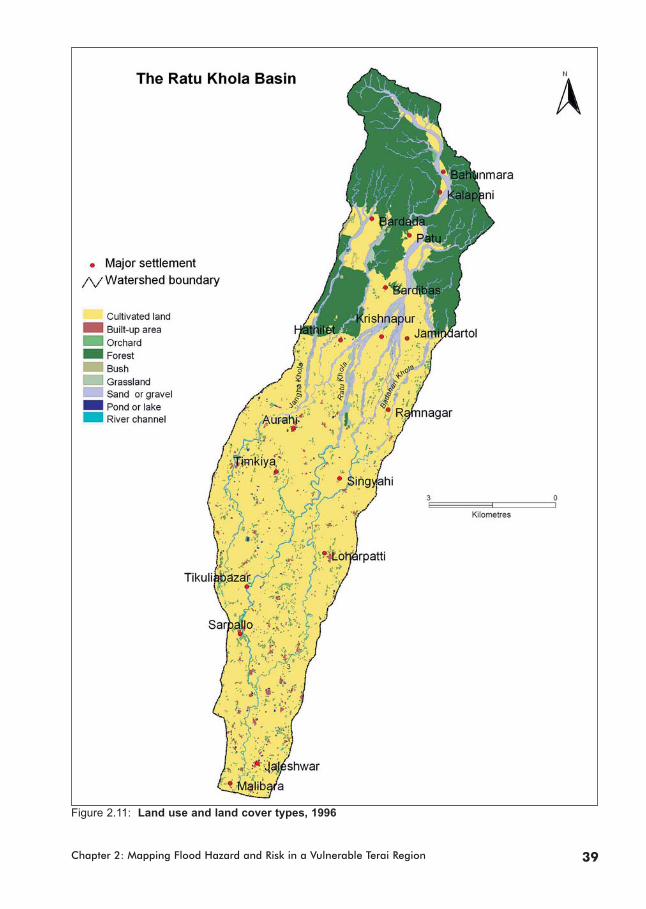
Chapter 2: Mapping Flood Hazard and Risk in a Vulnerable Terai Region 39
Figure 2.11: Land use and land cover types, 1996

Preparing for Flood Disaster40
Figure 2.12: Population density by VDC Figure 2.13: Level of income by VDC
Figure 2.14: Percentage of landless and
marginal farm households by VDC
Figure 2.15: Percentage of food-deficit
households by VDC
Chapter 2: Mapping Flood Hazard and Risk in a Vulnerable Terai Region 41
The literacy rate among males and females is 39% and 16%, respectively. Thesefigures are very low compared to the national average literacy rate (59.6%) andliteracy rate among females (48.3%). The average percentage of school-going boysand girls 6-16 years old is about 67% and 36%, respectively.
Economic activities
Agriculture, wage labour, trade and business, and services are the major sourcesof family income. The major source of income for 44% of households isagriculture, followed by wage labour (30%), trade and business (8%), services(6%), industry (3%), and others (9%).
Many families are poor. Nearly 16% of the families have annual incomes of lessthan Rs 20,000, less than Rs 3,448 per person per year. Similarly, 38% offamilies have annual incomes of Rs 20-40,000. Families having annual incomes ofRs 40-80,000, 80-100,000, and above 100,000 are 27%, 16%, and 3%,respectively. The income level by VDC is presented in Figure 2.13.
Nearly 21% of the families (11,241) are landless. Marginal farm households withfarm sizes of less than 0.5 ha comprise 38% (20,050) of the total households.The percentage of landless and marginal farm households by VDC is shown inFigure 2.14. Small farm households with landholdings of 0.5 to 2 ha comprise29%. Only 12% of households have landholdings above 2 ha. More than 22% offamilies are tenants who cultivate others’ land for their subsistence. Nearly 11% ofthe families rent out their land to other families.
Production and food sufficiency
The average household produces about 1.23 tonnes (t) of rice, 0.25t of wheat,and less than 0.05t of maize annually. Paddy comprises 22.5% of the totalagricultural production followed by wheat, potatoes, and maize. Millet, barley, andbuckwheat are also produced in small quantities. The main cash crop grown issugarcane; it accounts for 67% of the total agricultural production. Other cashcrops are mustard seed, groundnuts, linseed, and sesame. Vegetable crops likecauliflower, tomatoes, and cucumber are produced to a marketable scale.Leguminous crops such as soybean, black gram, red gram, grass peas, lentils,gram, peas, green gram, horse gram, and cow peas are also grown. Spice cropssuch as chilli, onions, garlic, ginger, turmeric, and coriander are also produced ona small scale. Mangoes, jackfruit, bananas, and papaya are the main fruitproducts. Lemon, guava, litchi, pineapple, pomegranate, and watermelon are alsogrown. A few households sell their agricultural products. Nearly 11% of the totalhouseholds sell food grain and 13% sell fruit.
The study area is food-deficit; only 12% of families have surplus food production.About 34% of the families produce barely enough food for three months. Familieshaving their own food for 3-6 months, 6-9 months, and 9-12 months account for23, 17, and 14%, respectively. However, the percentage of food-deficit householdsvaries by VDC (Figure 2.15).

Preparing for Flood Disaster42
Many households keep cattle, buffaloes, goats, and sheep. The average number ofcattle per household is two. Per household average number of buffaloes, goats,sheep, pigs, chickens, and ducks/pigeons is 0.7, 1.7, 0.01, 0.1, 2.2, and 0.4,respectively. About 14% of households sell livestock products.
Industry and Infrastructure
There are 851 industries of small to medium scale in the watershed. Rice millscomprise nearly 70% of the total number of industries; others include furnitureindustries (5.4%), sugar mills (9.2%), brick kilns (2.9%), saw mills (2.8%),cutting, netting and weaving (2.1%), cigar production (1.9%), and tile industries(1.8%), employing about 6,000. Out of these more than 48% are employed inbrick industries, 24.8% in sugar mills, 12.8% in rice mills, 4.7% in furnitureindustries, 3.1% in tile industries, and 2.1% in saw mills.
There are three colleges and higher secondary schools, 33 high schools, 29 lowersecondary schools, and 158 primary schools in the watershed. There are 43 sub-health posts, four health posts, three primary health care centres, and threehospitals. There are also eight ilaka post offices and 41 additional post offices.Service institutions such as agricultural institutions (12), veterinary posts (11),rural banks (13), commercial banks (4), cooperatives (15), nurseries (7), policestations (12), cinema halls (4), and market centres (18) are also located in thewatershed. Local level groups/institutions such as savings groups (39), forest usergroups (25), women’s groups (24), consumer groups (51), youth clubs (67),INGOs (15), and NGOs (35), are also established in different parts of thewatershed. However, only a few institutions are dealing with the management ofhazards and disasters.
One can reach every part of the watershed within two hours from the road head.The Bardibas-Sindhuli road connects VDCs located in the north. Almost all theVDCs are connected by earthen roads accessible by carts except during themonsoon period.
It is against this biophysical and socioeconomic background of the RatuWatershed that flood-hazard and risk mapping was carried out using the followingmethodology.
Methodology
Approaches
A hazard is defined as the probability of occurrence, within a specified period oftime and within a given area, of a potentially damaging phenomenon (Varnes1984 and UNDRO 1991). Hence, flood hazard is a flood event likely to occur in agiven time period within a given area, with the potential to harm or damage.Similarly, flood risk has been defined as the expected degree of loss due toflooding. The risk depends on the extent of the exposure of different elements inflood-susceptible areas and their vulnerability. In this sense, there is nosocioeconomic risk if there are no people and property to be affected. Similarly,vulnerability is the ability of the exposed elements to withstand or recover from

Chapter 2: Mapping Flood Hazard and Risk in a Vulnerable Terai Region 43
the flood hazard. It depends on the capability in terms of response and resilience.In other words, hazard is the probability of stress of a different magnitude,whereas vulnerability is the strength to withstand or recover and risk is theproduct of both the hazard and vulnerability.
Flood hazard is closely associated with the frequency and magnitude of a floodevent, on the one hand, and features of the terrain and its location on the other. Theareas most susceptible to flood hazards are those which are frequently flooded andunstable due to frequent changes in a river channel, its bed, and bank. Terrain unitslikely to be affected by flood hazards are topographic depressions, flood plains, andriver channels. These areas highly susceptible to flood hazard can be identified anddelineated through careful geomorphological mapping.
Another strategy frequently adopted for flood-hazard mapping is to establish therelationship between river discharge and channel capacity to hold dischargecontrolled by micro-topographic conditions. Inundation, due to overflow from thebank, commonly occurs when/where the discharge is higher than the channel’scapacity to hold it. The depth of inundation is also determined based on the volumeof discharge and micro-topographic variations along the river channel and itssurrounding areas. Similarly, areas with different degrees of susceptibility to floodhazards can also be identified and delineated based on the experiences of localpeople.
Ratu Khola is not gauged, so there are no measured time-series’ discharge data asin many rivers originating from the Siwaliks. This river is very wide and shallow,particularly in the middle and upper part of the basin. Inundation due to overflowfrom the bank, and channel shifting resulting in loss of life and property arecommon phenomena. Moreover, lowland areas with very high water tables, even ifthey are located far from the river channel, are easily inundated for a longerduration after every heavy precipitation event. It is in this context that these threedifferent approaches; viz., i) flood-hazard, risk, and vulnerability mapping basedon geomorphic concepts using GIS and remote sensing; ii) inundation-hazardmapping based on river discharge and micro-topographic variation using the HEC-RAS model; and iii) social flood-hazard mapping based on local people’sexperiences; were adopted for this study.
Sources of data
The information needed for hazard, risk, and vulnerability mapping wasobtained/derived from three different sources: i) maps, aerial photographs, andimagery; ii) field survey and group discussions; and iii) published and unpublisheddocuments.
Maps, aerial photographs, and imageryTopographic maps (Sheet nos: 2785-16A, 16B, 16C and 16D; 2685-04A, 04B, 04C,04D, and 08A on a scale of 1:25,000) compiled from 1:50,000 scale aerialphotography taken in 1992 and field verification carried out in 1995 and publishedin 1996 by the Survey Department, Government of Nepal, were used andinformation on topographic variation; drainage, land use and land cover; roads and

Preparing for Flood Disaster44
trails; house/building units; built-up areas, and other infrastructure were obtained. Aerial photographs taken in 1953-54, 1978-79, and 1992 were used for the study.The aerial photographs taken in 1953-54 were obtained from the Forest SurveyDivision, Forest Research and Survey Centre, Ministry of Forest and SoilConservation, HMG/Nepal. Similarly, aerial photographs taken in 1978-79 and1992 were obtained from the Topographical Survey Division, Survey Department,HMG/Nepal. Aerial photographs from 1953-54 cover only the Siwaliks and the fanzone of the basin which is 65% of the basin area, the only available photographsduring the period. Similarly, aerial photographs taken in 1979 do not cover thedownstream part of the lower Terai. The photographs cover only 80% of the basinarea. Samples of aerial photographs used for mapping are presented in Figure2.16. River morphology, old channels, flood-affected areas, river terraces, fans,floodplains of various flood levels, swamp areas, and forest cover were identifiedfrom these aerial photographs using interpretation keys developed based on tone,texture, shape, and association.
Satellite imagery from a Thematic Mapper (TM) with 30-metre resolution (path141 and row 41) taken on March 10, 1999, was obtained from the Forest SurveyDivision, Forest Research and Survey Centre, Ministry of Forest and SoilConservation, Government of Nepal. These digital images in individual spectralbands and various false colour composites (FCCs) were used to identify anddelineate different terrain features such as active and old river channels, activeand inactive fans, terraces, floodplains, flood-affected areas, moist areas, andareas under different land use and land cover. Tone, texture, colour, pattern,shape, and association of the images provided the basis for identifying thesefeatures (Figure 2.17). Before interpreting the images it was necessary to enhancetheir interpretability, for which filtering and contrast enhancement (stretching)
Figure 2.16: Samples of aerial photographs used for mapping

operations were applied using the Integrated Land and Water Information System(ILWIS) 3.0’s image-processing capability (ILWIS, 3.0). The features clearlydetected in different bands and colour composites are described in Table 2.4.Identified active fan and the fresh and active sediments relative to landform unitsin the Terai are also presented here.
Field survey and group discussionA field survey was carried out to verify features identified from aerial photographsand satellite images on the ground. Group discussions were carried out in eachVDC in the watershed (Figure 2.18). During group discussions, local stakeholderswere requested to prepare flood hazard maps based on their experiences andknowledge about frequently flooded areas, sites of river bank cutting, and channelshifting. Accordingly, areas of high, moderate, and low hazard were delineated onthe base map, i.e., topographic maps (1:25000), by local people. The high-hazard
Chapter 2: Mapping Flood Hazard and Risk in a Vulnerable Terai Region 45
Figure 2.17: Image interpretation using FCC, 432, and 751

Preparing for Flood Disaster46
area in the watershed delineated by the people was the area where flood eventscausing loss of life and property occurred frequently.
Published and unpublished documentsRainfall and river discharge data were obtained from the Department of Hydrologyand Meteorology (DHM), Government of Nepal in order to determine therelationship between rainfall and runoff.
Data-processing methods and analytical tools
Different data-processing methods and analytical tools were used to prepare flood-hazard, risk, and vulnerability maps of the Ratu Watershed. A brief description ofthe methods and tools used for the three different flood-hazard mappingapproaches mentioned above is given below.
Flood-hazard risk and vulnerability mapping using GIS and RS with ageomorphic approachA GIS was used to capture and analyse spatial data. Data capture in GIS wascarried out in two ways – screen digitisation, and digital image processing.
Topographic maps and aerial photos were scanned and entered into an ILWIS 3.0GIS environment by digitising these features onscreen. For that, scanned maps,aerial photos, and images were geo-referenced with respect to their geographicalposition on the specified projection system and parameters mentioned in thetopographic maps.
Figure 2.18: Delineation of flood-prone areas by local people during group discussion

Chapter 2: Mapping Flood Hazard and Risk in a Vulnerable Terai Region 47
Figure 2.19: Flood-hazard mapping scheme adopting geomorphic approach
Data source
GIS input
(Digitisation DEM
ANALYSIS)
Parameters
GIS overlays
Hazard type
River morphology
(Cumulative)
Flood affected
area (Cumulative)
Old
channels
Flood plains
Lower Middle Upper
Wet/moist
area
Sheet
flood
Sites of
debris flows Inundation Bank cut Others
Topographic map
Digital Elevation Model
Satellite imagery
1999
Aerial photo
1953/54 1979 1992
In addition, a digital elevation model (DEM) was prepared from the contour andspot heights and used for preparing a slope map, cross-section profile of theterrain, and river profile; and delineating potential sites for river-bank cutting,flood-prone areas, assuming a dam of a certain height at a given river reach. ADEM was also used to calculate the flooded area by incorporating it into the U.SArmy Corps’ Hydrological Engineering River System Analysis (HEC-RAS) flood-modelling software.
Information obtained from topographic map sheets, aerial photographs taken atdifferent periods, and satellite images was integrated into a GIS environment andanalysed. Terrain units with different features having different degrees of suscepti-bility to flood hazards were identified and delineated. These include frequentlyflooded areas, active and old river channels, floodplains (lower, middle, upper),topographic depressions (wet/moist area), gently sloping land with traces of freshsediment (sheet flooding), sites of debris flows, and river-bank cutting (Figure 2.19).
In addition, an infrastructure-induced inundation-hazard map was prepared for thelower Terai where inundation is a severe problem during prolonged monsoon rain.The delineation of the inundation area is based on the hypothetical construction ofa dam or a road one metre higher than the surface at the outlet of the Indo-Nepalborder. At about one km distance from this outlet inside Indian territory is a pavedroad which is about 1.5m higher than the surrounding area. This road is aligned inan east-west direction, roughly following the international border: flooding due tothis alignment is likely in Nepal. With reference to such infrastructure, the areaunder flooding has been delineated using DEM by means of iterative processes ofneighbourhood operations available in ILWIS 3.0 software.
The methods for identifying areas susceptible to flooding and its associatedhazard types are summarised in Figure 2.19. The cumulative area affected byflooding delineated in 1978-79, 1992 aerial photographs, and 1999 satelliteimages – including the river channels – are classified as high-hazard areas.Similarly, areas under inundation and potential sites for river-bank cutting and the
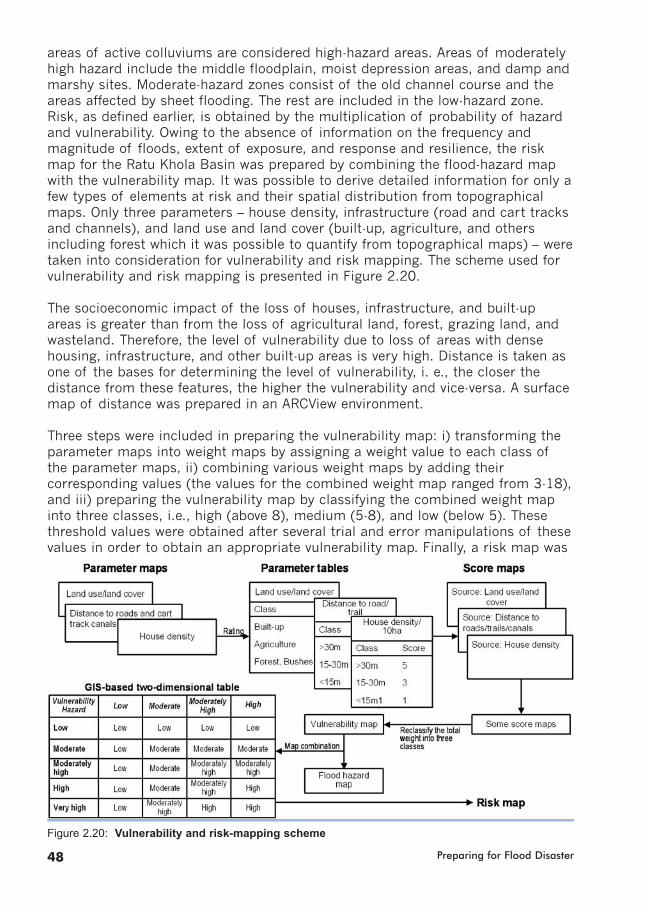
Preparing for Flood Disaster48
areas of active colluviums are considered high-hazard areas. Areas of moderatelyhigh hazard include the middle floodplain, moist depression areas, and damp andmarshy sites. Moderate-hazard zones consist of the old channel course and theareas affected by sheet flooding. The rest are included in the low-hazard zone. Risk, as defined earlier, is obtained by the multiplication of probability of hazardand vulnerability. Owing to the absence of information on the frequency andmagnitude of floods, extent of exposure, and response and resilience, the riskmap for the Ratu Khola Basin was prepared by combining the flood-hazard mapwith the vulnerability map. It was possible to derive detailed information for only afew types of elements at risk and their spatial distribution from topographicalmaps. Only three parameters – house density, infrastructure (road and cart tracksand channels), and land use and land cover (built-up, agriculture, and othersincluding forest which it was possible to quantify from topographical maps) – weretaken into consideration for vulnerability and risk mapping. The scheme used forvulnerability and risk mapping is presented in Figure 2.20.
The socioeconomic impact of the loss of houses, infrastructure, and built-upareas is greater than from the loss of agricultural land, forest, grazing land, andwasteland. Therefore, the level of vulnerability due to loss of areas with densehousing, infrastructure, and other built-up areas is very high. Distance is taken asone of the bases for determining the level of vulnerability, i. e., the closer thedistance from these features, the higher the vulnerability and vice-versa. A surfacemap of distance was prepared in an ARCView environment.
Three steps were included in preparing the vulnerability map: i) transforming theparameter maps into weight maps by assigning a weight value to each class ofthe parameter maps, ii) combining various weight maps by adding theircorresponding values (the values for the combined weight map ranged from 3-18),and iii) preparing the vulnerability map by classifying the combined weight mapinto three classes, i.e., high (above 8), medium (5-8), and low (below 5). Thesethreshold values were obtained after several trial and error manipulations of thesevalues in order to obtain an appropriate vulnerability map. Finally, a risk map was
Figure 2.20: Vulnerability and risk-mapping scheme
Chapter 2: Mapping Flood Hazard and Risk in a Vulnerable Terai Region 49
prepared by combining the hazard map with the vulnerability map using a GIS-based two-dimensional table (Figure 2.20)
Inundation-hazard mapping using the HEC-RAS model with rainfall and runoffsimulationThe extent and severity of damage from flooding are usually defined by waterdepth. Such an inundation analysis can be carried out effectively and efficiently byusing numerical modelling tools on a GIS platform. This also provides aframework for the decision-support system and facilitates evaluation ofalternatives for flood management.
For the numerical modelling, the whole catchment area was divided into threeportions, namely, Bahunmara in the north, Bardibas in the middle, and Jaleshwarin the south. The length of the Ratu Khola and the length and elevation of thecatchment were derived from the topographical maps (1:25,000). Since there areno recorded discharge data for the Ratu Khola, discharge were estimated based onrainfall and catchment characteristics. Frequency analysis of the maximum dailyrainfall recorded in meteorological stations located within the catchment andnearby areas was carried out to determine the return period of different amounts.Discharge for different return periods was estimated using various approachessuch as those of the Water and Energy Commission Secretariat (WECs), modifiedDicken’s, and Richardson’s methods. The results are presented in Table 2.2.
For this work, the HEC-RAS version 3.1 was used to calculate water-surfaceprofiles; ArcView GIS 3.1 was used for GIS data processing. The HEC-GeoRAS 3.1for ArcView GIS was used to provide the interface between the systems. HEC-GeoRAS is an ArcView GIS extension specifically designed to process geospatialdata for use with HEC-RAS. The extension allows users to create an HEC-RASimport file containing geometric attribute data from an existing digital terrainmodel (DTM) and complementary data sets. GeoRAS automates the extraction ofspatial parameters for HEC-RAS input, primarily the three-dimensional (3D)stream network and the 3D cross-section definition. Results exported from HEC-RAS are also processed in GeoRAS. The ArcView 3D Analyst extension is requiredto use GeoRAS.
The general procedure adopted for inundation modelling consists basically of fivesteps: i) preparation of DEM in ArcView GIS, ii) GeoRAS pre-processing to generate aHEC-RAS import file, iii) running of HEC-RAS to calculate water-surface profiles, iv)post-processing of HEC-RAS results and floodplain mapping, and v) flood-riskassessment. Figures 2.21 and 2.22 explain these procedures in flow diagrams.
An integrated DTM was prepared based on information derived from topographicalmaps (1:50,000). The sources of information and processes used for thepreparation of the DEM have been discussed earlier. Stream centreline, cross-sections, stream banks, and flow-path lines were defined to extract 3-D spatialdata from the triangular irregular network (TIN) to develop 3-D polylineZ themesfor GeoRAS pre-processing to generate a HEC-RAS import file. Geometric data ofriver cross-sections read from the HEC-RAS GIS were imported into HEC-RAS. Theimported geometric data consist of 393 cross-sections including reach lengths

Preparing for Flood Disaster50
Figure 2.21: One-dimensional floodplain analysis using HEC-RAS, GIS, and HEC-GeoRAS

Chapter 2: Mapping Flood Hazard and Risk in a Vulnerable Terai Region 51
Figure 2.22: Process flow diagram for using HEC Geo RAS
Preparing for Flood Disaster52
and bank stations. Manning’s ‘n’ coefficients are input. Steady flows were enteredfor various return periods. As no downstream boundary conditions in the form ofrating curve or observed water level were available, normal depth was used. HEC-RAS was executed for the sub-critical flow profile, output data were exported intoArcView GIS, and finally the inundation hazard map was prepared.
Social flood-hazard mapping involving local stakeholdersLocal stakeholders were requested to delineate areas with high, medium, and lowflood hazard probabilities on topographical maps (1:25,000) based on theirexperiences. This was solicited during group discussions in each VDC in the RatuWatershed. These maps were digitised and finally a flood-hazard map of the RatuWatershed was prepared.
ResultsThe results of flood-hazard, risk, and vulnerability mapping work in the RatuWatershed using the three different approaches are presented in the followingsection.
Flood hazard, risk, and vulnerability maps using a geomorphologicalapproach
Hazard mappingA series of maps delineating different features of the terrain with different levelsof susceptibility to flood hazards was prepared. These maps were combined and afinal map of flood hazards was prepared. Such terrain features and theirassociation with flood hazards are described below.
Flood plains frequently affected by floods
Areas frequently affected by floods were mapped based on interpretation of aerialphotos and satellite images from different periods and are presented in Figures2.23-2.25.
A terrain unit map depicting geomorphic features with different levels of floodsusceptibility, such as river channels, fans, floodplains, terraces, and hill slopesamongst others, was prepared by interpreting aerial photographs (Figure 2.26.)These geomorphic features signify the different degrees of flood hazards.Floodplains in the Patu, Kalapani, Bahunmara, and Rajbas areas in the northernpart of the watershed are subject to occasional flooding.
In the depositional zone, floodplains with three distinct topographic heights – thelower, the middle, and the upper – were identified. These floodplains generallybegin from the point of spring lines or re-emergence of the perennial channels.The lower floodplains lie in the vicinity of river channels. The lower floodplain hasan area of about 31.1 sq. km. This zone is subjected to normal flooding. In themiddle Terai, the maximum width of the lower floodplain is about 800 metres,and in the southernmost part of the basin it is up to 1,390m. The outer margin ofthe floodplains is generally cultivated or under grass cover. This zone is mostly
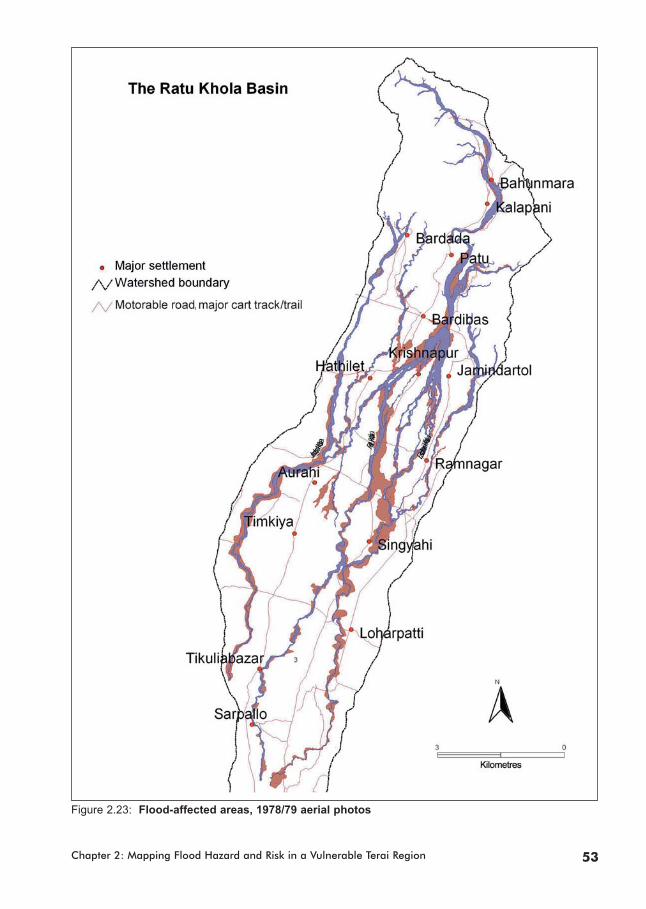
Chapter 2: Mapping Flood Hazard and Risk in a Vulnerable Terai Region 53
Figure 2.23: Flood-affected areas, 1978/79 aerial photos

Preparing for Flood Disaster54
Figure 2.24: Flood-affected areas, 1992 aerial photos

Chapter 2: Mapping Flood Hazard and Risk in a Vulnerable Terai Region 55
Figure 2.25: Flood-affected areas, 1999 Landsat TM imagery
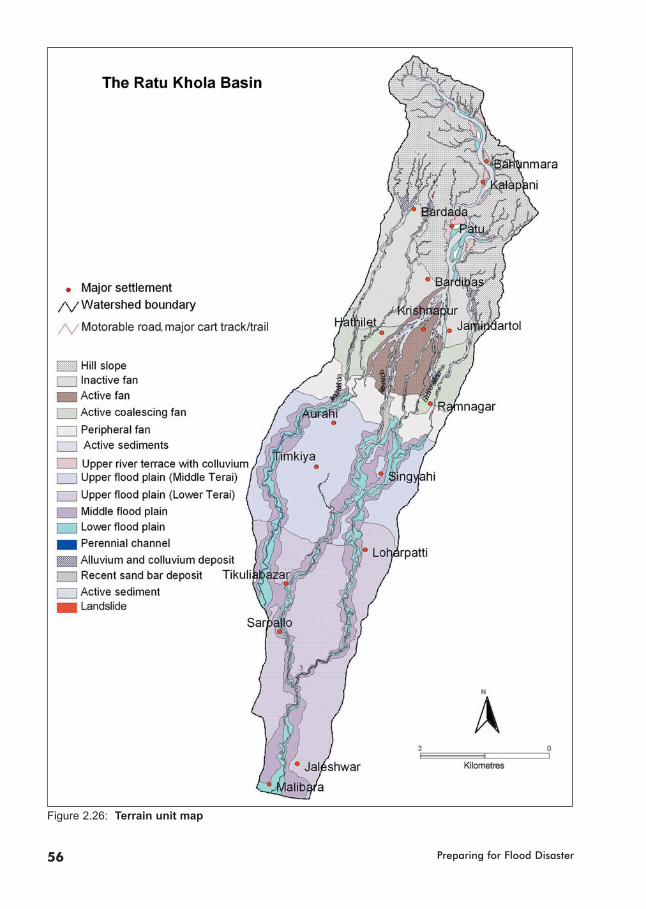
Preparing for Flood Disaster56
Figure 2.26: Terrain unit map

Chapter 2: Mapping Flood Hazard and Risk in a Vulnerable Terai Region 57
avoided for human settlement development. According to the topographical maps,only 174 (1.7%) building units are located in this area. About nine built-up areasare located in this floodplain: Suryahi, Malibara, Singhyahi, Gonarpura, Kolhuwa,Baidiyatol, Sripur Kalibara, and Kathundhar.
The middle floodplain is generally recognised by adjacent terraces with less brighttones and finer textures indicating finer and relatively stable sediments. This zoneintersperses with the upper floodplain characterising the zone of depression leftby the old channel. During high discharge, water overflows through thesedepressions. The zone has more extensive areas of river meandering.
The upper floodplain is generally the old riverbed areas and is represented byhigher relief and stable alluvium with fine silt content. The zone is a site forsettlements and may be affected by the channel shift due to a rise in the existingbed level upstream. This part is subjected to occasional sheet-flooding originatingfrom the upper catchments of the channels in or across the basin.
River channels
One of the most flooded land units is the river channel. River channels in this areaare wide and remain dry during winter and subject to frequent flooding during themonsoon. Several old channels of the recent or distant past are susceptible tooccasional flooding (Figure 2.27). Another common process associated with floodhazards in the watershed is inter-basin transfer of water due to channel shifting.
Several old channel courses detected in aerial photographs show that the Ratu Kholasystem has accommodated the water flow from Jangha Khola in the west and fromBighi Khola in the east in several instances in the past. Similarly, the traces of theold riverbed of the Jangha Khola and Marha Khola show that they formed commondrainage in the lower catchments in the past. Recently, since 1998, Jangha River hasdiverted from its original path to join the Ratu Khola system. Due to these changesin the river course there has been a fluctuation in the basin area contributing waterto the lower catchments. Water overflowing the banks during heavy monsoon rainover extensive parts of the lowermost catchment of the Ratu Khola can beattributed to water flowing in from the Jangha Khola to the Ratu Khola nearSarpallo. An interesting feature to note is that this old channel bed seems to beavoided for settlements as these areas are subjected to flooding or are damp formost part of the year. GIS overlay analysis shows that, in most cases, settlementsare located along the banks of these channels.
Gently sloping land with traces of fresh sediment from sheet flooding
Gently sloping lands are frequently affected by sheet flooding which is movingrain-borne or water overflow from banks that is not concentrated into definedchannels. In the aerial photo and imagery, areas with moderate to thin light greytones, indicating fresh sediments brought and deposited by running water, wereidentified and mapped (Figure 2.25). Sheet flooding has been the cause of interbasin flow of water between the Jangha and Maraha kholas in the west, andJangha and Ratu, and Bighi Khola and Ratu in the east. The cause of the floodingin the Jaleshwar municipality area is sheet flow from the Bighi Khola which is
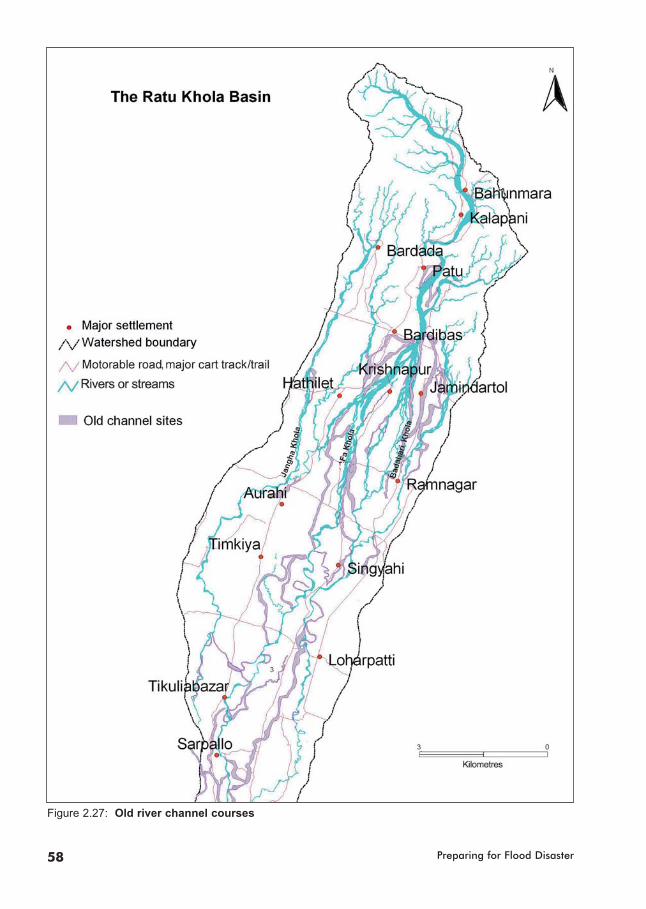
Preparing for Flood Disaster58
Figure 2.27: Old river channel courses
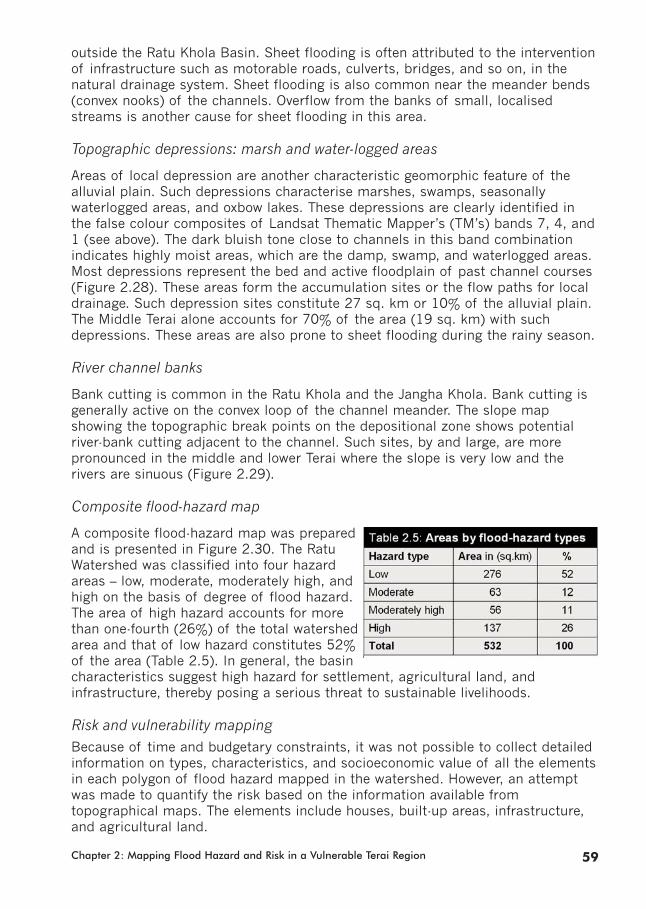
outside the Ratu Khola Basin. Sheet flooding is often attributed to the interventionof infrastructure such as motorable roads, culverts, bridges, and so on, in thenatural drainage system. Sheet flooding is also common near the meander bends(convex nooks) of the channels. Overflow from the banks of small, localisedstreams is another cause for sheet flooding in this area.
Topographic depressions: marsh and water-logged areas
Areas of local depression are another characteristic geomorphic feature of thealluvial plain. Such depressions characterise marshes, swamps, seasonallywaterlogged areas, and oxbow lakes. These depressions are clearly identified inthe false colour composites of Landsat Thematic Mapper’s (TM’s) bands 7, 4, and1 (see above). The dark bluish tone close to channels in this band combinationindicates highly moist areas, which are the damp, swamp, and waterlogged areas.Most depressions represent the bed and active floodplain of past channel courses(Figure 2.28). These areas form the accumulation sites or the flow paths for localdrainage. Such depression sites constitute 27 sq. km or 10% of the alluvial plain.The Middle Terai alone accounts for 70% of the area (19 sq. km) with suchdepressions. These areas are also prone to sheet flooding during the rainy season.
River channel banks
Bank cutting is common in the Ratu Khola and the Jangha Khola. Bank cutting isgenerally active on the convex loop of the channel meander. The slope mapshowing the topographic break points on the depositional zone shows potentialriver-bank cutting adjacent to the channel. Such sites, by and large, are morepronounced in the middle and lower Terai where the slope is very low and therivers are sinuous (Figure 2.29).
Composite flood-hazard map
A composite flood-hazard map was preparedand is presented in Figure 2.30. The RatuWatershed was classified into four hazardareas – low, moderate, moderately high, andhigh on the basis of degree of flood hazard.The area of high hazard accounts for morethan one-fourth (26%) of the total watershedarea and that of low hazard constitutes 52%of the area (Table 2.5). In general, the basincharacteristics suggest high hazard for settlement, agricultural land, andinfrastructure, thereby posing a serious threat to sustainable livelihoods.
Risk and vulnerability mappingBecause of time and budgetary constraints, it was not possible to collect detailedinformation on types, characteristics, and socioeconomic value of all the elementsin each polygon of flood hazard mapped in the watershed. However, an attemptwas made to quantify the risk based on the information available fromtopographical maps. The elements include houses, built-up areas, infrastructure,and agricultural land.
Chapter 2: Mapping Flood Hazard and Risk in a Vulnerable Terai Region 59
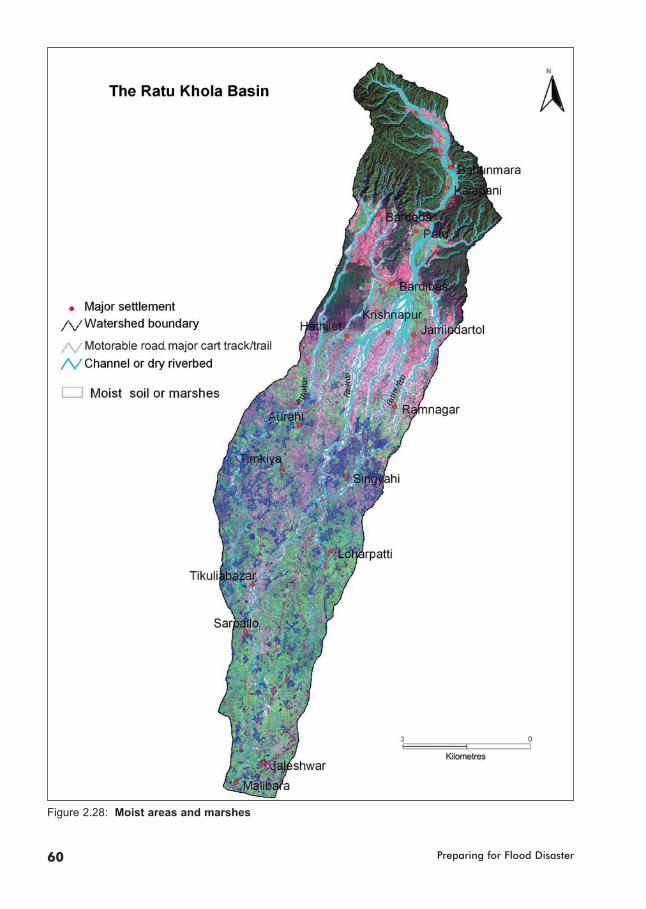
Preparing for Flood Disaster60
Figure 2.28: Moist areas and marshes

Chapter 2: Mapping Flood Hazard and Risk in a Vulnerable Terai Region 61
Figure 2.29: Potential areas of river-bank cutting (within 200m buffer)

Preparing for Flood Disaster62
Figure 2.30: Composite flood-hazard map

Chapter 2: Mapping Flood Hazard and Risk in a Vulnerable Terai Region 63
About 17% of house units lie in the high hazard zone, 8% in the moderately highhazard zone, and 60% in the low hazard zone (Figure 2.31). In the high hazardand moderately high hazard zones, 14% and 6% of the area, respectively, is builtup. Of the 144 polygons representing built-up areas in the Ratu Khola Basin, 61%are located in the low hazard zone.
Similarly, GIS overlay showed that about 25% (8,853 ha) of the total area ofcultivated land (including orchards) lies in the high-hazard zone, and about 15%in the moderately high hazard zone.
As a result of flooding, cultivated land often becomes wasteland, or it takes a longtime and is very expensive to reclaim for cultivation. In the middle and lower Terai,however, the damage caused to agricultural land is relatively less severe than thatto other valuable infrastructure, as the damage is mostly to standing crops andmay cause less damage to the land itself. It is often thought by the local peoplethat the fine silt accumulation during normal flooding adds fertility to the soil.But, quite recently, people have experienced the appearance of coarser materialsand decrease in the river depth, causing increased sedimentation problems andriver instability. The recent change in the course of the Jangha Khola in Sarpalloregion in the lower Terai has converted a large tract of arable land into river bedand wasteland.
Out of a total of 629 points where service infrastructure such as governmentoffices, schools, hospitals, health posts, public buildings, and temples are locatedin the watershed, about 101 points (16%) lie in the high-hazard zone.
Figure 2.31: House units (a) and built-up areas (b) at risk from flood hazard
a b

Preparing for Flood Disaster64
An attempt was made to assess flood risk induced by the construction of dams,spurs, and embankments of 0.5-1.0m for Ratu Khola on the Indo-Nepal border.DEM analysis shows that an assumed 0.5m or 1m high structure would induceinundation over an area of 9.6 or 16.5 sq. km, respectively. In the former case,about 10 built-up areas and more than 900 ha of cropland would be affected(Figure 2.32). In the latter case about 16 built-up areas and more than 1,500 haof cultivated land or orchard would be affected. The backwater effect wouldextend to 5.5 km for both cases.
Flood risk and vulnerability maps of the Ratu Watershed are presented in Figure2.33. Nearly 18% of the area is at high risk. These areas include the settlementzones in the high and moderately high hazard areas. Agricultural land in the highflood hazard zone can be considered moderate risk zones. This zone comprisesabout 11% of the basin area. The rest is at low risk.
Inundation-hazard mapping using the HEC-RAS model
An inundation-hazard map based on HEC-RAS results was prepared for the two-and five-year return flow of both a 50 and 100% discharge on the major channelof the Ratu Khola and is presented in Figures 2.34 and 2.35. The Ratu Kholasplits into two channels at the fan head. The east channel is the major channel interms of water flow. These maps show the inundation is extensive in the lowerTerai even in a flood having a two-year return period. The analysis also shows thatthe extent of inundated area is not significantly different in two- and five-yearreturn period flows. However, the difference in the depth of the flow seems to besignificant. Hence, the flood water is accommodated in the same floodplain.Considering the 25-, 50-, and 100-year return period flows, more extensiveinundation could be expected causing disaster of a large spatial scale in the lowerTerai where drainage is poor and the groundwater level is high.
Figure 2.32: Theoretical inundation due to flow intervention by a structure at the Indo-
Nepal border

Chapter 2: Mapping Flood Hazard and Risk in a Vulnerable Terai Region 65
Figure 2.33: Vulnerability (left) and risk maps (right)
Social flood-hazard mapping by local stakeholders
Flood-hazard maps drawn by local stakeholders with technical help from theresearch assistants during group discussions in each VDC in the Ratu Watershedwere digitised and are presented in Figure 2.36.
Comparative evaluation of flood-hazard maps
Figure 2.36 shows two flood-hazard maps: one prepared by local stakeholdersduring group discussions and another prepared using GIS and remote sensingwith a geomorphic approach. Though the hazard areas seem to be a littleexaggerated in the map prepared using GIS and RS, the sites are more or less thesame as in the map prepared by the local stakeholders. This shows that GIS andRS can be useful tools for mapping flood hazard, risk, and vulnerability for a largearea. Such maps can be improved and validated using local knowledge andexperience involving local stakeholders
It is evident that flood-hazard, risk, and vulnerability mapping at pre-feasibilitylevel can be carried out using secondary information from maps, aerialphotographs, satellite images, and published and unpublished documents. Thesemaps are useful for developing activities for flood control and management.However, an understanding of the level of socioeconomic vulnerability and theresponse and resilience of local people is necessary for effective implementationof such activities. It is in this context that an assessment of the flood hazard,risk, vulnerability, and response and resilience has been made in the next chapter.

Preparing for Flood Disaster66
Figure 2.35: Five-year return flood with 50 (left) and 100% (right) flow
Figure 2.34: Two-year return flood with 50 (left) and 100% (right) flow
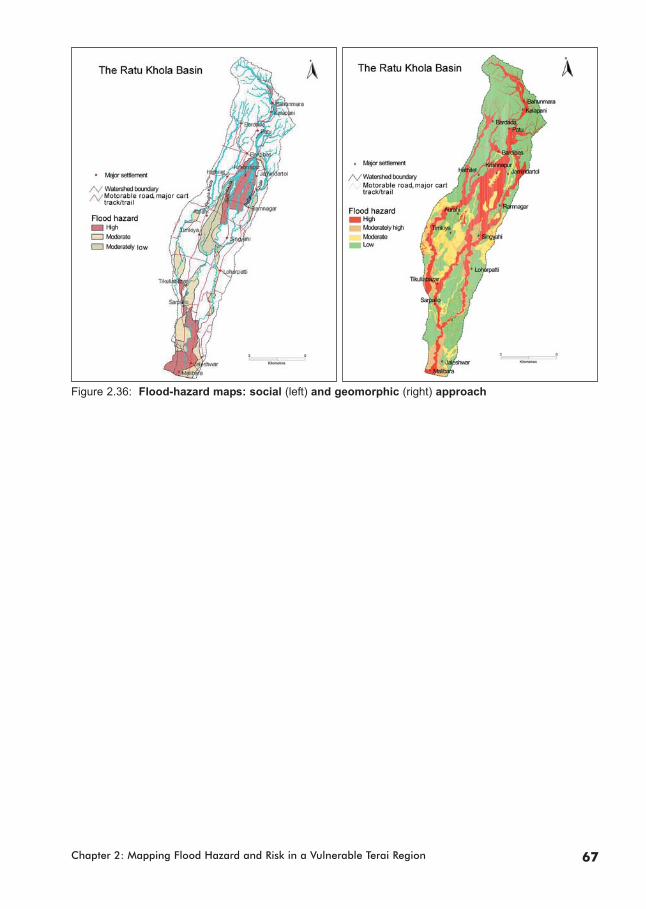
Chapter 2: Mapping Flood Hazard and Risk in a Vulnerable Terai Region 67
Figure 2.36: Flood-hazard maps: social (left) and geomorphic (right) approach

68
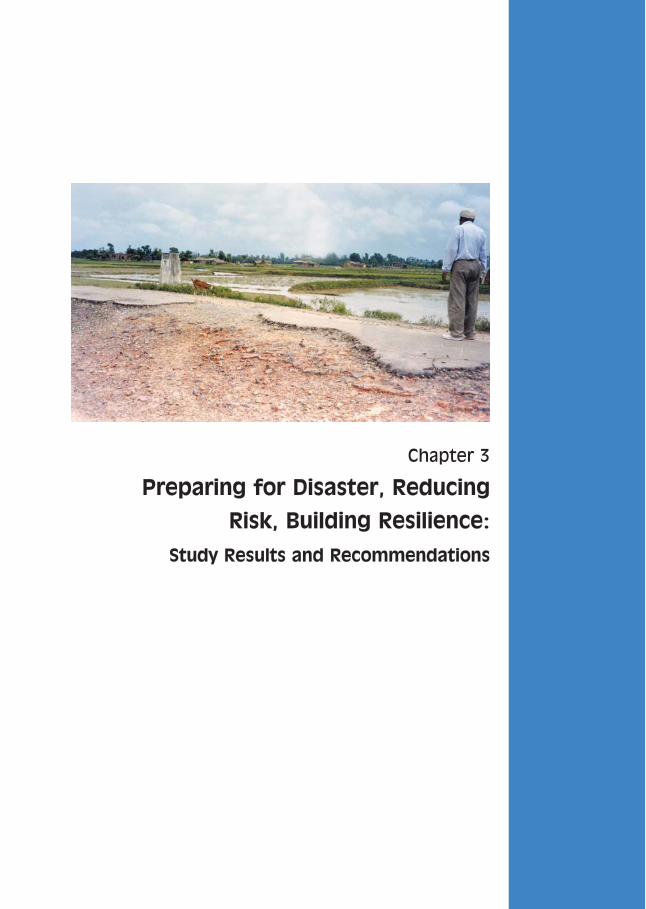
69
Chapter 3
Preparing for Disaster, Reducing
Risk, Building Resilience:
Study Results and Recommendations

Community members build gabion walls to prevent the Ratu Khola flooding their farms.

IntroductionThough the loss and damage from some natural hazards are high, in the long runfloods cause more damage and devastation than any other natural hazard.Although floods cannot be controlled, losses due to floods can be reduced to agreat extent by implementing a proper flood-management programme. A holisticflood-mitigation and management strategy, including pre-flood planning,operational flood management, and post-flood response, is necessary to reducethe loss. An understanding of the level of hazard, risk, vulnerability, and thecapabilities of local people to respond to disaster provides the basis fordeveloping holistic flood-mitigation and management strategies.
Building community capabilities to anticipate, cope with, resist, and recover fromthe impact is important for effective flood mitigation and management. Hazard,risk, and vulnerability mapping and zoning, awareness creation, early warningsystems, and preparedness planning are some of the important tools for buildinga disaster-resilient community. One of the steps in promoting communityresilience is to improve its emergency preparedness and capacity to respond. Thiscan be achieved through provision of an emergency population warning system,shelter, evacuation, stockpiling of supplies and equipment, and training ofemergency services.
The results of flood-hazard, risk, and vulnerability mapping in terms of location andlevel of exposure in the Ratu Watershed have been presented in Chapter 2. Anattempt is made in the following to assess hazard, risk, and vulnerability in the RatuWatershed. Socioeconomic vulnerability, focusing on the losses from floods andother water-induced disasters is also discussed. Local coping capacity was assessedin terms of the socioeconomic characteristics of the people exposed to floods andother water-induced disasters. People’s responses in terms of flood mitigation andmanagement in the past are also discussed and efforts aimed at promotingcommunity resilience are also briefly described in this chapter.
MethodologyAssessment of hazard, risk, and vulnerability in the Ratu Watershed was based onprimary data collected from the field from July to August 2003. Primary data,basically on past hazards, socioeconomic conditions, vulnerability, responsecapabilities, and efforts made by local people to mitigate floods and other water-induced disasters in the recent past, were collected during field work.
Information on the magnitude, recurrence intervals, and damage from differenttypes of disaster was collected through group discussions with the help ofstructured checklists. Local elders and knowledgeable people were consulted tocollect data from the past.
Socioeconomic data of all the VDCs located in the Ratu Watershed were collectedwith the help of a structured checklist prepared for this study. In order to assessthe response and recovery capabilities of individual households, information onthe perception of local people about flood hazards and efforts made to mitigatehazards at household level was collected through household surveys. Because of
Chapter 3: Preparing for Disaster, Reducing Risk, Building Resilience 71
time constraints, it was not possible to survey all the households in the basin sostratified random sampling was adopted. Stratification or zonation of areas wascarried out based on the expected level of hazard: high, medium, or low. Thirtyhouseholds from each hazard zone (high, medium, low) were selected at randomfor the survey. Households from different areas were chosen in such a way that allthe areas within the basin were represented.
In order to enhance community resilience and equip the communities withnecessary information, a micro-level study was carried out to identify anddelineate safe areas for evacuation routes and shelters in the downstream area,and training was given to local people on precipitation and river discharge stagereading in upstream areas. The methodology adopted to identify and delineatesafe areas for evacuation routes and shelters is discussed below.
The Jaleshwar municipality and its adjoining areas downstream from the RatuKhola were selected for detailed flood-hazard mapping with enhanced topographicmaps (Figure 3.1). For this, a detailed topographic survey was carried out with 20cm accuracy. After incorporating topographical information obtained from thedetailed field survey, a triangular irregular network (TIN) and contour map withintervals of 10 cm were generated. A cross-sectional survey was carried out alongthe river over a span of 3 km upstream near Gena Bathnaha to 2 km downstreamnear Dhabauli. Each cross-section contained topographical information covering200m right and left of the centre line of the river. Detailed information aboutexisting river-training work (mainly levées) and their present conditions, and otherfeatures such as roads, mule tracks, land use and land cover, was also collectedduring the field survey.
The water-surface profile was calculated using HEC-GeoRAS software. The step-wise procedure followed for HEC-GeoRAS during processing has been shown inFigures 2.20 and 2.21 in Chapter 2.
The relationship between rainfall and runoff was examined using the TANK model.Since the Ratu Basin has no observed discharge data, the calibrated parametersof the TANK model for the Bagmati Basin (Gauge stn. 586) was used on theassumption of similar catchment characteristics.
The rainfall of the basin was computed using rainfall data recorded at Tulsi (Stn.1191) and Gausala (Stn. 1122) on the basis of area weightage of their respectiveThiessen polygons. The area of the basin and its percentage weightage for therainfall for Jaleshwar gauging station were estimated.
The rainfall data for the years 1979, 1980, 1987, 1988, and 1989 recorded atTulsi and Gausala meteorological stations provided by the Department ofHydrology and Meteorology were used to simulate the corresponding discharge.The rainfall-runoff trends for wet season months (June-September) and theircorrelation coefficients (R2) were calculated using linear, polynomial power,exponential, and logarithmic functions. The corresponding regression equationhaving the highest ‘R2’ value was then used to forecast the discharge for differentrainfall events.
Preparing for Flood Disaster72
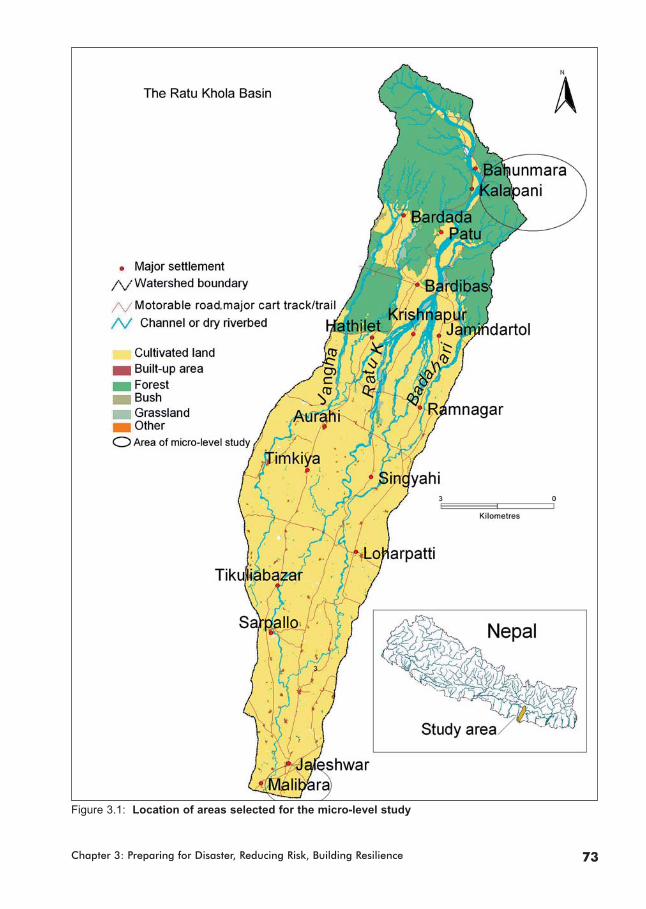
Chapter 3: Preparing for Disaster, Reducing Risk, Building Resilience 73
Figure 3.1: Location of areas selected for the micro-level study
Frequency analysis for rainfall was carried out. The one-, two-, and three-daymaximum rainfall was calculated for return periods of 2, 5,10, 25, 50, and 100years with Extreme Value Type-I distribution (Gumbel Distribution), the resultswere presented in Table 2.4 in Chapter 2.
Finally, a flood-hazard map was prepared based on the enhanced topographicinformation along with estimated flood peaks of a 2-, 5-, 10-, 25-, 50-, and 100-year return period using Dicken’s formula (Table 2.2 in Chapter 2) and variousflood events obtained from the regression equation having the highest ‘R2’ value.
Results The results of the assessment of flood hazards, risk, and vulnerability arepresented below. Attempts are also made to discuss the response and resilienceof the local people.
Loss and damage from different natural hazards
Different types of hazards occur in the watershed causing great loss of lives andproperty. These include landslides, debris flows, floods, riverbank cutting, river-channel shifting, droughts, earthquakes, fire, hailstorms, lightning, windstorms,cold waves, and disease and pests. Since many of the settlements are located inthe plains area of Bhabar and the Terai, direct losses from landslides and debrisflows are not reported. However, landslides and debris flows occur frequently inthe upstream areas in the Churia region triggering water-induced disasters suchas floods, bank cutting, channel shifting, and river-bed rise in densely inhabiteddownstream areas.
Thirty-four floods and 30 riverbank cutting events causing loss of property werereported in the watershed during the 42-year period between 1961 and 2003(Table 3.1). Floods occur almost every year causing loss of life and property in thewatershed. Seven events of river shifting in 37 years (every 5-6 years) and 18events of river-bed rise in 35 years (every two years) were reported. Only oneearthquake causing loss of life and property was reported from the watershedduring this period.
Fire is a common disaster in the watershed and occurs in one place or anotherevery year. Other climatic hazards that occur from time to time and cause loss oflife and property in the watershed include hailstorms, lightning, droughts and coldspells. A total of 16 hailstorms (one in 2-3 years), 20 lightning strikes (one in 2years), nine hailstorms (one in 5 years), 22 droughts (one in 2-3 years), five coldspells (every year), and 17 events of pest and disease (1-2 years) were reportedfrom the watershed.
Table 3.2 shows the annual loss of life from different hazards in the watershed.About 46 persons are killed annually because of different hazards. More than 41people die due to cold spells, followed by pests/diseases (2 persons), and floods(1 person). Lightning strikes, fire, and windstorms are also a cause of deathalmost every year.
Preparing for Flood Disaster74

Chapter 3: Preparing for Disaster, Reducing Risk, Building Resilience 75
Annual loss of property at the watershed level from different hazards is given inTable 3.3. A total of 273 animals are killed every year. About 323 houses, 1,830tof crops, 96 ha of land, and 11 different types of infrastructure are damagedannually from different disasters in the watershed. Floods account for more than41% of the total value of private and public assets damaged every year, followedby river-bank cutting (27.7%), cold spells (9.8%), fire (5%), riverbed rise (3%),droughts (2.8%), pests and diseases (1.1%), and wind storms (1%). Average perannum loss per household from these disasters is about Rs 550. Assets
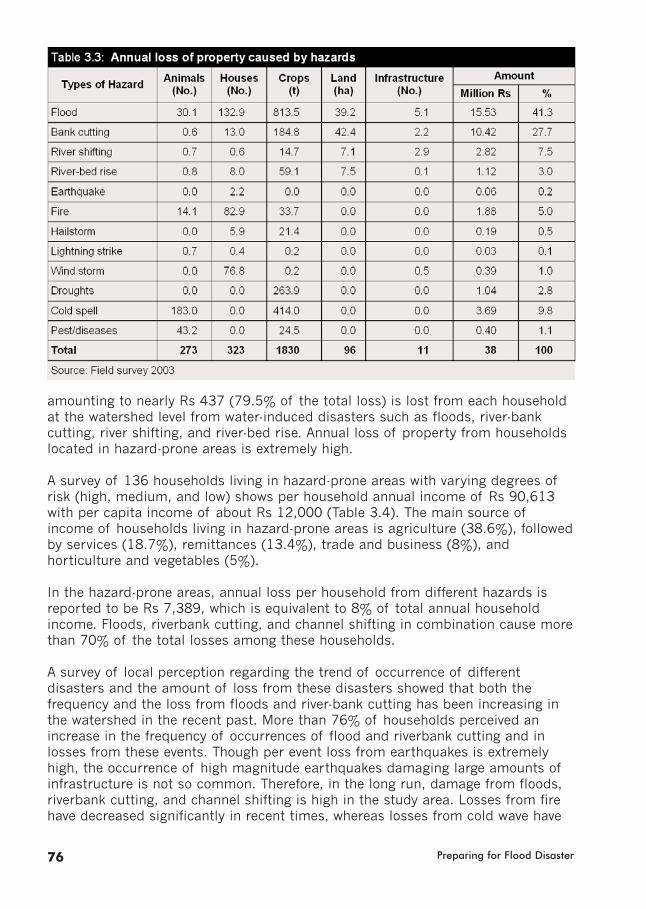
Preparing for Flood Disaster76
amounting to nearly Rs 437 (79.5% of the total loss) is lost from each householdat the watershed level from water-induced disasters such as floods, river-bankcutting, river shifting, and river-bed rise. Annual loss of property from householdslocated in hazard-prone areas is extremely high.
A survey of 136 households living in hazard-prone areas with varying degrees ofrisk (high, medium, and low) shows per household annual income of Rs 90,613with per capita income of about Rs 12,000 (Table 3.4). The main source ofincome of households living in hazard-prone areas is agriculture (38.6%), followedby services (18.7%), remittances (13.4%), trade and business (8%), andhorticulture and vegetables (5%).
In the hazard-prone areas, annual loss per household from different hazards isreported to be Rs 7,389, which is equivalent to 8% of total annual householdincome. Floods, riverbank cutting, and channel shifting in combination cause morethan 70% of the total losses among these households.
A survey of local perception regarding the trend of occurrence of differentdisasters and the amount of loss from these disasters showed that both thefrequency and the loss from floods and river-bank cutting has been increasing inthe watershed in the recent past. More than 76% of households perceived anincrease in the frequency of occurrences of flood and riverbank cutting and inlosses from these events. Though per event loss from earthquakes is extremelyhigh, the occurrence of high magnitude earthquakes damaging large amounts ofinfrastructure is not so common. Therefore, in the long run, damage from floods,riverbank cutting, and channel shifting is high in the study area. Losses from firehave decreased significantly in recent times, whereas losses from cold wave have

Chapter 3: Preparing for Disaster, Reducing Risk, Building Resilience 77
been increasing. The occurrence of and losses from droughts, hailstorms, pests,and diseases are more or less constant compared to the past. However, there isan increase in the occurrence of windstorms and the losses incurred from them.
Loss and damage from floods and other water-induced disasters
It is evident from the above discussion that the loss of property from water-induced disasters – floods, riverbank cutting, and river shifting – is extremely highcompared to loss as a result of other hazards occurring in the watershed. Boththe frequency of water-induced disasters and the losses from them have beenincreasing. Drastic changes in land use and land cover (deforestation), excavationof the river bed for construction materials such as gravel, and development ofinfrastructure (roads, culverts, bridges, buildings) without due consideration beinggiven to draining the natural flow of water are some of the reasons for an increasein the frequency and magnitude of flood and river-bank cutting in the watershed. A survey of 48 VDCs/municipalities in the watershed shows that on average 955ha of land are flooded every year in the watershed. Highly damaging floods interms of loss of human lives occurred in 1961, 1977, and 1997 (Table 3.5).However, the loss of assets was high in 1988, 1993, 1995, 1998, 2001, and 2002(Figure 3.2).
Flooding due to shifting of the river channel and rises in the river bed due tosiltation of sand and gravel along the river channel are also common in thewatershed. Seven events of river-channel shifting causing heavy loss of life andproperty have been reported in the watershed (Table 3.6).

Preparing for Flood Disaster78

Seventeen floods triggered by rises in the river bed causing loss of life andproperty were reported during the field work. On average, 7.5 ha of land, 59t ofagricultural crops, and eight houses were damaged amounting to Rs 1.12 millionannually from the flood triggered (Table 3.6).
River-bank cutting during flooding is another major cause of water-induceddisaster in the watershed. Table 3.6 shows the losses from river-bank cutting. In aspan of 42 years, 32 river-bank cutting events have been reported from thewatershed. Every year, about 42 ha of cultivated land, 185t of crops, 13 houses,and two different types of infrastructure are damaged due to river-bank cutting,and damages amount to Rs 10.42 million. The losses were comparatively high in1988, 1993, 1998, and 2002.
Chapter 3: Preparing for Disaster, Reducing Risk, Building Resilience 79
Figure 3.2: Loss of life and property from flood hazards, 1961-2003Source: Field survey 2003
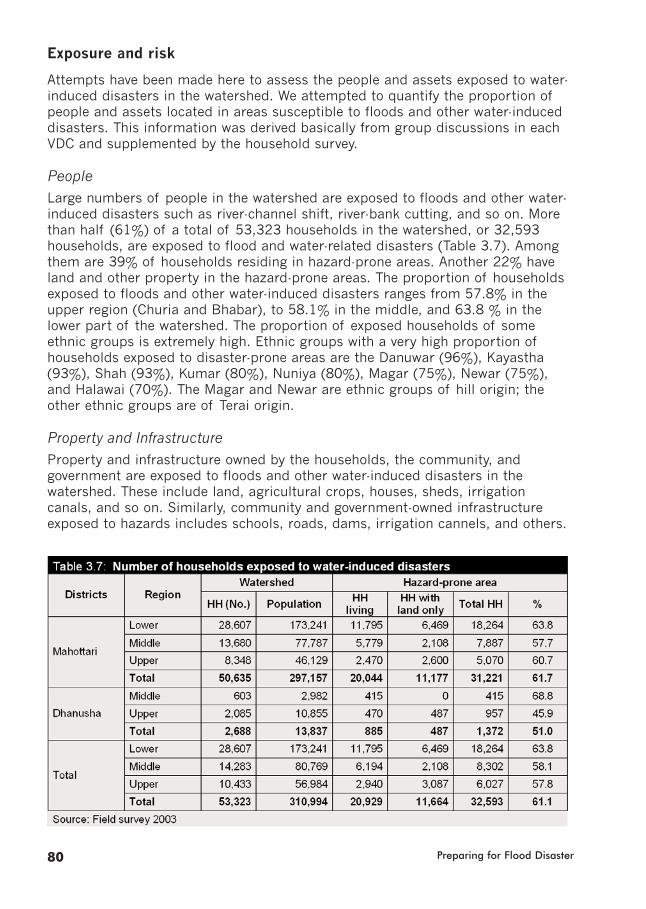
Exposure and risk
Attempts have been made here to assess the people and assets exposed to water-induced disasters in the watershed. We attempted to quantify the proportion ofpeople and assets located in areas susceptible to floods and other water-induceddisasters. This information was derived basically from group discussions in eachVDC and supplemented by the household survey.
PeopleLarge numbers of people in the watershed are exposed to floods and other water-induced disasters such as river-channel shift, river-bank cutting, and so on. Morethan half (61%) of a total of 53,323 households in the watershed, or 32,593households, are exposed to flood and water-related disasters (Table 3.7). Amongthem are 39% of households residing in hazard-prone areas. Another 22% haveland and other property in the hazard-prone areas. The proportion of householdsexposed to floods and other water-induced disasters ranges from 57.8% in theupper region (Churia and Bhabar), to 58.1% in the middle, and 63.8 % in thelower part of the watershed. The proportion of exposed households of someethnic groups is extremely high. Ethnic groups with a very high proportion ofhouseholds exposed to disaster-prone areas are the Danuwar (96%), Kayastha(93%), Shah (93%), Kumar (80%), Nuniya (80%), Magar (75%), Newar (75%),and Halawai (70%). The Magar and Newar are ethnic groups of hill origin; theother ethnic groups are of Terai origin.
Property and InfrastructureProperty and infrastructure owned by the households, the community, andgovernment are exposed to floods and other water-induced disasters in thewatershed. These include land, agricultural crops, houses, sheds, irrigationcanals, and so on. Similarly, community and government-owned infrastructureexposed to hazards includes schools, roads, dams, irrigation cannels, and others.
Preparing for Flood Disaster80
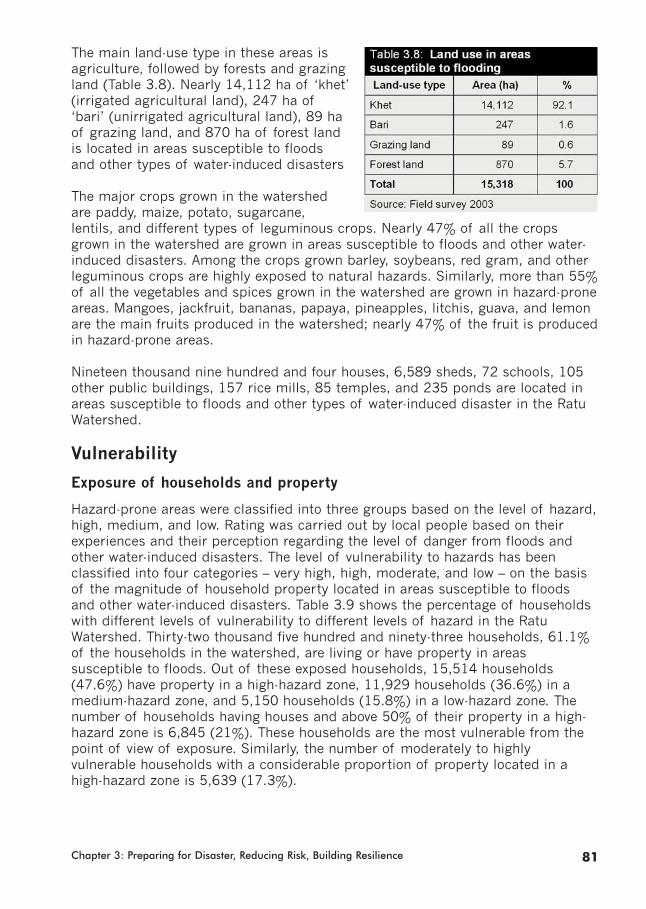
Chapter 3: Preparing for Disaster, Reducing Risk, Building Resilience 81
The main land-use type in these areas isagriculture, followed by forests and grazingland (Table 3.8). Nearly 14,112 ha of ‘khet’(irrigated agricultural land), 247 ha of‘bari’ (unirrigated agricultural land), 89 haof grazing land, and 870 ha of forest landis located in areas susceptible to floodsand other types of water-induced disasters
The major crops grown in the watershedare paddy, maize, potato, sugarcane,lentils, and different types of leguminous crops. Nearly 47% of all the cropsgrown in the watershed are grown in areas susceptible to floods and other water-induced disasters. Among the crops grown barley, soybeans, red gram, and otherleguminous crops are highly exposed to natural hazards. Similarly, more than 55%of all the vegetables and spices grown in the watershed are grown in hazard-proneareas. Mangoes, jackfruit, bananas, papaya, pineapples, litchis, guava, and lemonare the main fruits produced in the watershed; nearly 47% of the fruit is producedin hazard-prone areas.
Nineteen thousand nine hundred and four houses, 6,589 sheds, 72 schools, 105other public buildings, 157 rice mills, 85 temples, and 235 ponds are located inareas susceptible to floods and other types of water-induced disaster in the RatuWatershed.
Vulnerability
Exposure of households and property
Hazard-prone areas were classified into three groups based on the level of hazard,high, medium, and low. Rating was carried out by local people based on theirexperiences and their perception regarding the level of danger from floods andother water-induced disasters. The level of vulnerability to hazards has beenclassified into four categories – very high, high, moderate, and low – on the basisof the magnitude of household property located in areas susceptible to floodsand other water-induced disasters. Table 3.9 shows the percentage of householdswith different levels of vulnerability to different levels of hazard in the RatuWatershed. Thirty-two thousand five hundred and ninety-three households, 61.1%of the households in the watershed, are living or have property in areassusceptible to floods. Out of these exposed households, 15,514 households(47.6%) have property in a high-hazard zone, 11,929 households (36.6%) in amedium-hazard zone, and 5,150 households (15.8%) in a low-hazard zone. Thenumber of households having houses and above 50% of their property in a high-hazard zone is 6,845 (21%). These households are the most vulnerable from thepoint of view of exposure. Similarly, the number of moderately to highlyvulnerable households with a considerable proportion of property located in ahigh-hazard zone is 5,639 (17.3%).
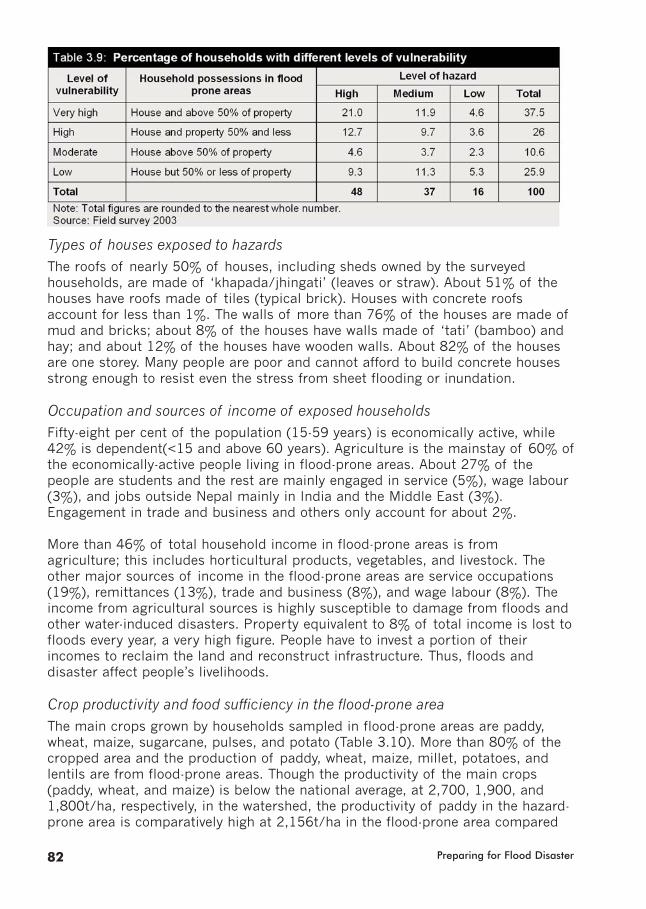
Preparing for Flood Disaster82
Types of houses exposed to hazardsThe roofs of nearly 50% of houses, including sheds owned by the surveyedhouseholds, are made of ‘khapada/jhingati’ (leaves or straw). About 51% of thehouses have roofs made of tiles (typical brick). Houses with concrete roofsaccount for less than 1%. The walls of more than 76% of the houses are made ofmud and bricks; about 8% of the houses have walls made of ‘tati’ (bamboo) andhay; and about 12% of the houses have wooden walls. About 82% of the housesare one storey. Many people are poor and cannot afford to build concrete housesstrong enough to resist even the stress from sheet flooding or inundation.
Occupation and sources of income of exposed householdsFifty-eight per cent of the population (15-59 years) is economically active, while42% is dependent(<15 and above 60 years). Agriculture is the mainstay of 60% ofthe economically-active people living in flood-prone areas. About 27% of thepeople are students and the rest are mainly engaged in service (5%), wage labour(3%), and jobs outside Nepal mainly in India and the Middle East (3%).Engagement in trade and business and others only account for about 2%.
More than 46% of total household income in flood-prone areas is fromagriculture; this includes horticultural products, vegetables, and livestock. Theother major sources of income in the flood-prone areas are service occupations(19%), remittances (13%), trade and business (8%), and wage labour (8%). Theincome from agricultural sources is highly susceptible to damage from floods andother water-induced disasters. Property equivalent to 8% of total income is lost tofloods every year, a very high figure. People have to invest a portion of theirincomes to reclaim the land and reconstruct infrastructure. Thus, floods anddisaster affect people’s livelihoods.
Crop productivity and food sufficiency in the flood-prone areaThe main crops grown by households sampled in flood-prone areas are paddy,wheat, maize, sugarcane, pulses, and potato (Table 3.10). More than 80% of thecropped area and the production of paddy, wheat, maize, millet, potatoes, andlentils are from flood-prone areas. Though the productivity of the main crops(paddy, wheat, and maize) is below the national average, at 2,700, 1,900, and1,800t/ha, respectively, in the watershed, the productivity of paddy in the hazard-prone area is comparatively high at 2,156t/ha in the flood-prone area compared
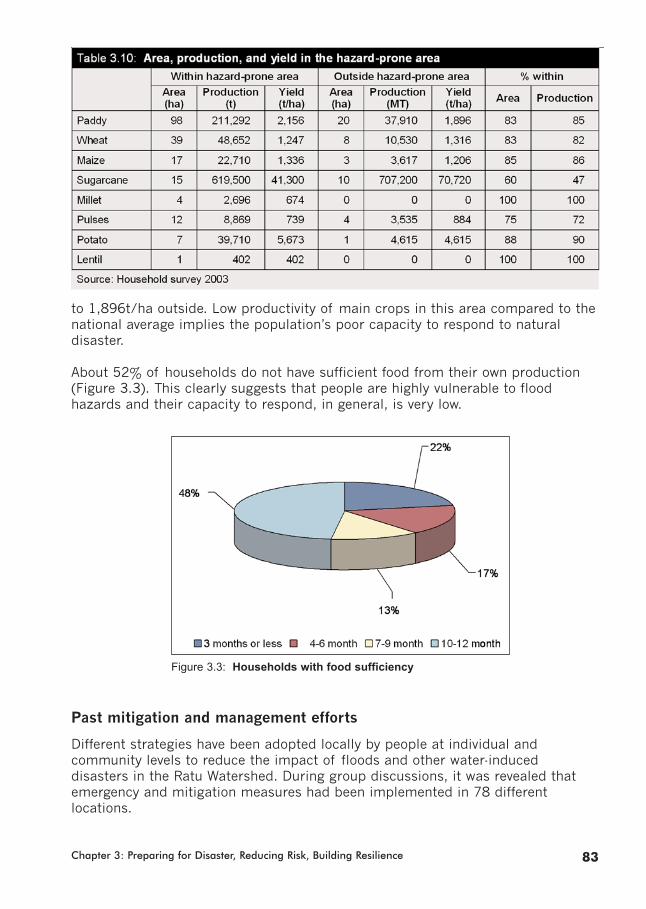
Chapter 3: Preparing for Disaster, Reducing Risk, Building Resilience 83
to 1,896t/ha outside. Low productivity of main crops in this area compared to thenational average implies the population’s poor capacity to respond to naturaldisaster.
About 52% of households do not have sufficient food from their own production(Figure 3.3). This clearly suggests that people are highly vulnerable to floodhazards and their capacity to respond, in general, is very low.
Past mitigation and management efforts
Different strategies have been adopted locally by people at individual andcommunity levels to reduce the impact of floods and other water-induceddisasters in the Ratu Watershed. During group discussions, it was revealed thatemergency and mitigation measures had been implemented in 78 differentlocations.
Figure 3.3: Households with food sufficiency
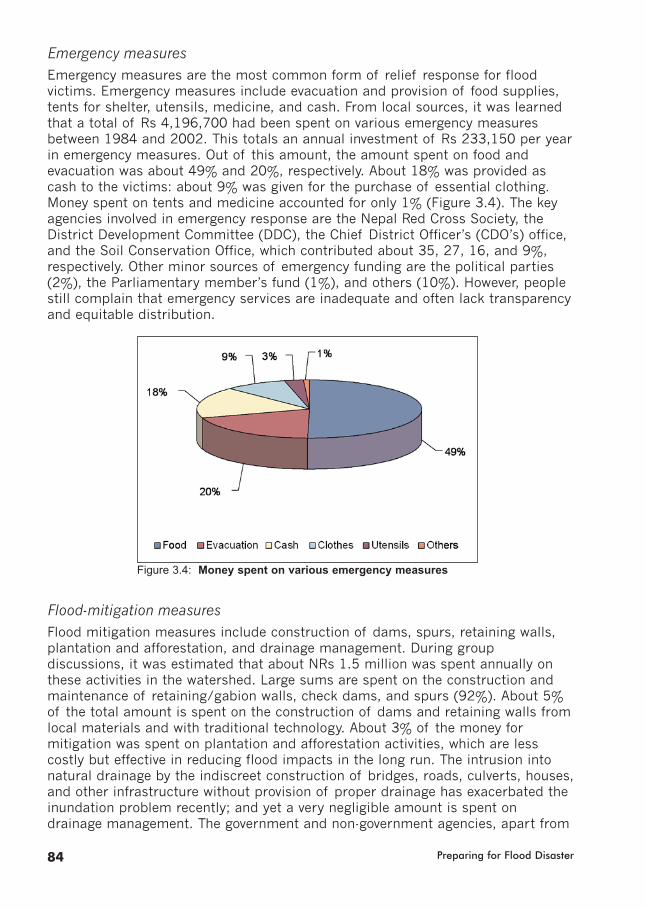
Emergency measuresEmergency measures are the most common form of relief response for floodvictims. Emergency measures include evacuation and provision of food supplies,tents for shelter, utensils, medicine, and cash. From local sources, it was learnedthat a total of Rs 4,196,700 had been spent on various emergency measuresbetween 1984 and 2002. This totals an annual investment of Rs 233,150 per yearin emergency measures. Out of this amount, the amount spent on food andevacuation was about 49% and 20%, respectively. About 18% was provided ascash to the victims: about 9% was given for the purchase of essential clothing.Money spent on tents and medicine accounted for only 1% (Figure 3.4). The keyagencies involved in emergency response are the Nepal Red Cross Society, theDistrict Development Committee (DDC), the Chief District Officer’s (CDO’s) office,and the Soil Conservation Office, which contributed about 35, 27, 16, and 9%,respectively. Other minor sources of emergency funding are the political parties(2%), the Parliamentary member’s fund (1%), and others (10%). However, peoplestill complain that emergency services are inadequate and often lack transparencyand equitable distribution.
Flood-mitigation measuresFlood mitigation measures include construction of dams, spurs, retaining walls,plantation and afforestation, and drainage management. During groupdiscussions, it was estimated that about NRs 1.5 million was spent annually onthese activities in the watershed. Large sums are spent on the construction andmaintenance of retaining/gabion walls, check dams, and spurs (92%). About 5%of the total amount is spent on the construction of dams and retaining walls fromlocal materials and with traditional technology. About 3% of the money formitigation was spent on plantation and afforestation activities, which are lesscostly but effective in reducing flood impacts in the long run. The intrusion intonatural drainage by the indiscreet construction of bridges, roads, culverts, houses,and other infrastructure without provision of proper drainage has exacerbated theinundation problem recently; and yet a very negligible amount is spent ondrainage management. The government and non-government agencies, apart from
Preparing for Flood Disaster84
Figure 3.4: Money spent on various emergency measures

Chapter 3: Preparing for Disaster, Reducing Risk, Building Resilience 85
the local community, involved in mitigation measures are the DDC, VDC, the WaterInduced Disaster Prevention Office, Soil Conservation Office, and District IrrigationOffice among government agencies; and the Nepal Red Cross Society, a non-government organisation, which has been contributing money for flood-mitigationmeasures (Figure 3.5). The Churia Watershed Conservation Project, incoordination with the District Soil Conservation and the District Forest Office, hasbeen engaged in watershed management through activities like afforestation andmicro-watershed management through erosion and gully controls in the uppercatchments.
Proposed future activities
People have perceived that a fragile basin, heavy and prolonged rain during themonsoon, unstable rivers, growing human occupancy and activities, anddevelopment of infrastructure without due consideration for proper drainage arethe main causes of increased flood disasters in the area. They have put forwardsome long-term and short-term flood mitigation proposals for the watershed. Thelong-term measures include six major components: i) river control throughpermanent structures such as check dams; afforestation along the river banks andcleaning of the river bed to increase the discharge capacity of the channel; ii)drainage management; iii) conservation of the Churia area through guided humanactivities; iv) awareness creation; v) improvement in livelihoods through increase inirrigation facilities and providing loans for off-farm employment opportunities; andvi) strengthening local institutions for disaster mitigation. The timely and effectiveshort-term measures recommended by the local people include: i) evacuation offlood-affected people and their portable property; ii) timely provision of tents,food, clothes, utensils, and medicine in a fair and equitable manner; iii) a food forwork scheme for the flood victims; iv) provision of shelter with service facilitieslike drinking water, toilets, and so on in safe localities for the refuge of victimsuntil they can renovate, rehabilitate, or reconstruct their own houses; v) provisionof seeds and fertiliser to the victims; and vi) promotion of a rotational fund and afeasible insurance scheme for people living in areas susceptible to flood hazards.
Figure 3.5: Contributions made by various agencies/institutions for mitigation measures
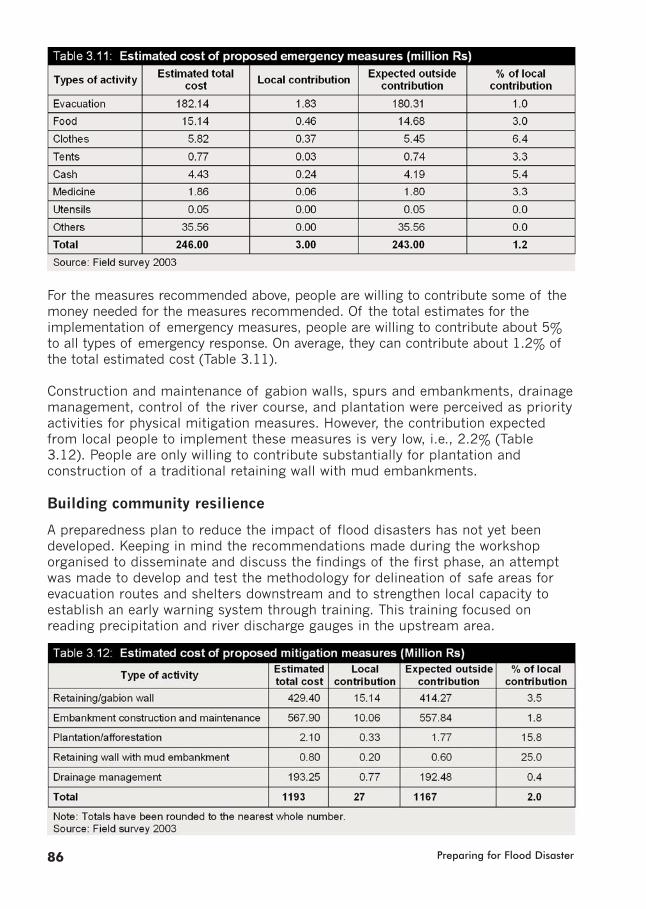
For the measures recommended above, people are willing to contribute some of themoney needed for the measures recommended. Of the total estimates for theimplementation of emergency measures, people are willing to contribute about 5%to all types of emergency response. On average, they can contribute about 1.2% ofthe total estimated cost (Table 3.11).
Construction and maintenance of gabion walls, spurs and embankments, drainagemanagement, control of the river course, and plantation were perceived as priorityactivities for physical mitigation measures. However, the contribution expectedfrom local people to implement these measures is very low, i.e., 2.2% (Table3.12). People are only willing to contribute substantially for plantation andconstruction of a traditional retaining wall with mud embankments.
Building community resilience
A preparedness plan to reduce the impact of flood disasters has not yet beendeveloped. Keeping in mind the recommendations made during the workshoporganised to disseminate and discuss the findings of the first phase, an attemptwas made to develop and test the methodology for delineation of safe areas forevacuation routes and shelters downstream and to strengthen local capacity toestablish an early warning system through training. This training focused onreading precipitation and river discharge gauges in the upstream area.
Preparing for Flood Disaster86
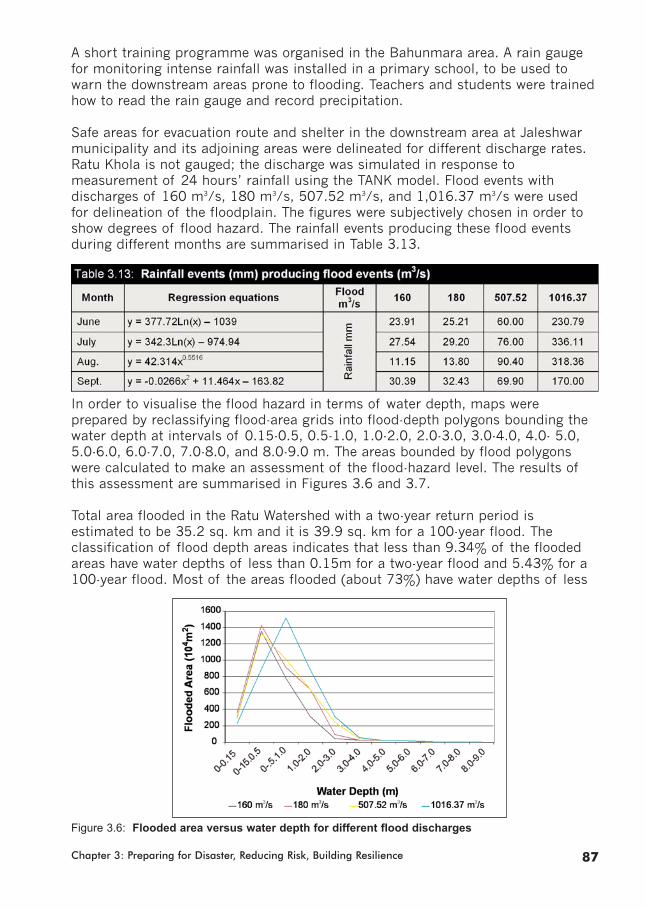
A short training programme was organised in the Bahunmara area. A rain gaugefor monitoring intense rainfall was installed in a primary school, to be used towarn the downstream areas prone to flooding. Teachers and students were trainedhow to read the rain gauge and record precipitation.
Safe areas for evacuation route and shelter in the downstream area at Jaleshwarmunicipality and its adjoining areas were delineated for different discharge rates.Ratu Khola is not gauged; the discharge was simulated in response tomeasurement of 24 hours’ rainfall using the TANK model. Flood events withdischarges of 160 m3/s, 180 m3/s, 507.52 m3/s, and 1,016.37 m3/s were usedfor delineation of the floodplain. The figures were subjectively chosen in order toshow degrees of flood hazard. The rainfall events producing these flood eventsduring different months are summarised in Table 3.13.
In order to visualise the flood hazard in terms of water depth, maps wereprepared by reclassifying flood-area grids into flood-depth polygons bounding thewater depth at intervals of 0.15-0.5, 0.5-1.0, 1.0-2.0, 2.0-3.0, 3.0-4.0, 4.0- 5.0,5.0-6.0, 6.0-7.0, 7.0-8.0, and 8.0-9.0 m. The areas bounded by flood polygonswere calculated to make an assessment of the flood-hazard level. The results ofthis assessment are summarised in Figures 3.6 and 3.7.
Total area flooded in the Ratu Watershed with a two-year return period isestimated to be 35.2 sq. km and it is 39.9 sq. km for a 100-year flood. Theclassification of flood depth areas indicates that less than 9.34% of the floodedareas have water depths of less than 0.15m for a two-year flood and 5.43% for a100-year flood. Most of the areas flooded (about 73%) have water depths of less
Chapter 3: Preparing for Disaster, Reducing Risk, Building Resilience 87
Figure 3.6: Flooded area versus water depth for different flood discharges

than 1m for a two-year flood and 65% for a 100-year flood. The areas under awater depth of more than 2m are quite small, although the area increasesconsiderably with an increase in the intensity of flooding.
This analysis shows that a flood event of 160m3/s does not inundate thesettlement of the study area. Floods of this size are responses to rainfall of 23.91mm, 27.54 mm, 11.15 mm, and 30.39 mm for the months of June, July, August,and September, respectively. Flood events of 180m3/s inundate the settlement ofthe study area. The flood event of 180m3/s is the response to the rainfall of 25.21mm, 29.20 mm, 13.80 mm, and 32.43 mm for the months of June, July, August,and September, respectively. Hence the study area should be warned if the dailyrainfall events exceed the value of 23.91 mm, 27.54 mm, 11.15 mm, and 30.39mm for the months June, July, August, and September, respectively.
Evacuation routes leading to shelter areas for people and their livestock from theflooded zone are traced out on the hazard map following the land with minimuminundation depth. As little as 15 cm of moving water can knock people off theirfeet (as per FEMA [1995a] recommendation), evacuation must be completedbefore water levels along the route exceed 15 cm. The routes and the distance tothe shelter areas for different localities are summarised in Table 3.14. Thecampus areas in Jaleshwar, Bakharibhath, and Bela and the western and easternparts of Bajrahi, Ramaul, and Ratwada have been identified as safe areas foremergency shelter. The levée and road mark the evacuation route for Bela,whereas for other localities only the road network marks the routes.
Besides the small area of Jaleshwar Bazaar, no shelter area is without flooding.Although maximum inundation (up to 2.14 m for a two-year flood) takes place inBakharibhath, Bela seems the most seriously affected as it floods up to 1.87 m(two-year flood) and evacuation primarily has to follow the levee which may bebreached during the period. Evacuation routes for different discharge conditionsare shown in Figures 3.8-3.11.
A stakeholders’ meeting was organised to disseminate and discuss the results of themapping exercise to identify safe areas for evacuation routes and shelter. The
Preparing for Flood Disaster88
Figure 3.7: Discharge, flooded depth, and area
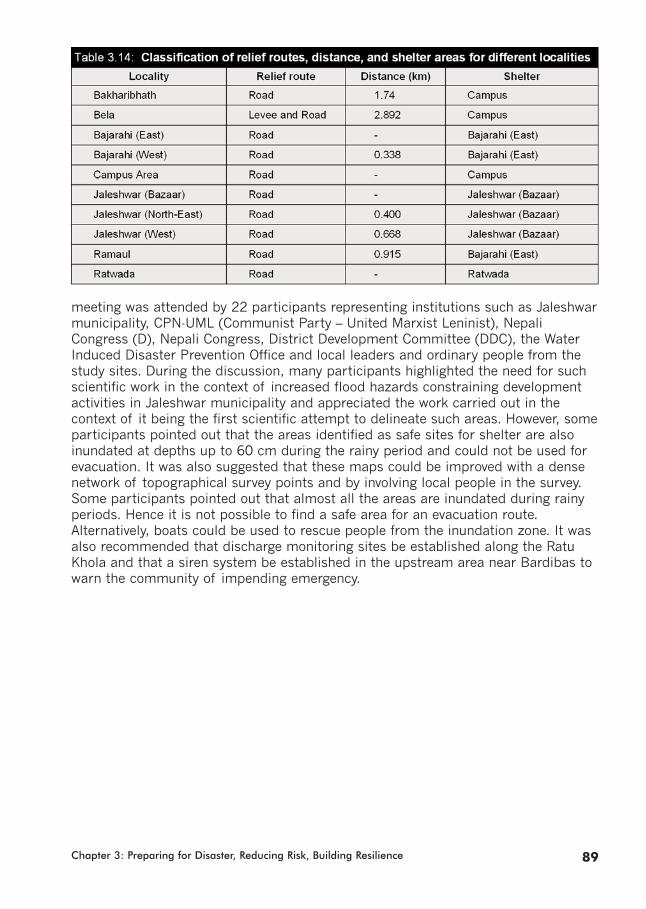
meeting was attended by 22 participants representing institutions such as Jaleshwarmunicipality, CPN-UML (Communist Party – United Marxist Leninist), NepaliCongress (D), Nepali Congress, District Development Committee (DDC), the WaterInduced Disaster Prevention Office and local leaders and ordinary people from thestudy sites. During the discussion, many participants highlighted the need for suchscientific work in the context of increased flood hazards constraining developmentactivities in Jaleshwar municipality and appreciated the work carried out in thecontext of it being the first scientific attempt to delineate such areas. However, someparticipants pointed out that the areas identified as safe sites for shelter are alsoinundated at depths up to 60 cm during the rainy period and could not be used forevacuation. It was also suggested that these maps could be improved with a densenetwork of topographical survey points and by involving local people in the survey.Some participants pointed out that almost all the areas are inundated during rainyperiods. Hence it is not possible to find a safe area for an evacuation route.Alternatively, boats could be used to rescue people from the inundation zone. It wasalso recommended that discharge monitoring sites be established along the RatuKhola and that a siren system be established in the upstream area near Bardibas towarn the community of impending emergency.
Chapter 3: Preparing for Disaster, Reducing Risk, Building Resilience 89

Preparing for Flood Disaster90
Figure 3.8: Evacuation route on hazard map for 160m3/s discharge
Figure 3.9: Evacuation route on hazard map for 180m3/s discharge
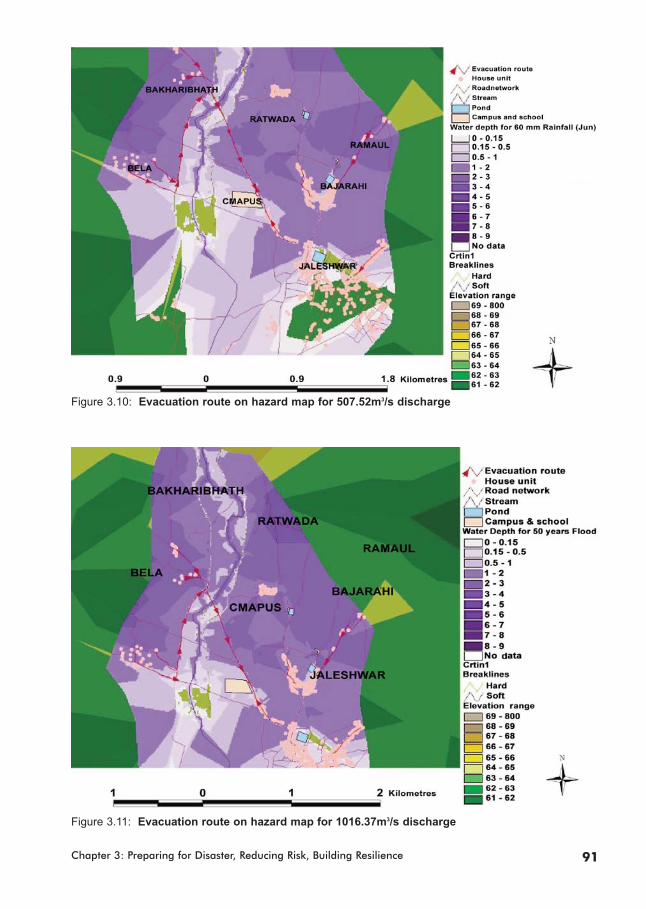
Chapter 3: Preparing for Disaster, Reducing Risk, Building Resilience 91
Figure 3.10: Evacuation route on hazard map for 507.52m3/s discharge
Figure 3.11: Evacuation route on hazard map for 1016.37m3/s discharge

Chapter 4
The Larger Picture
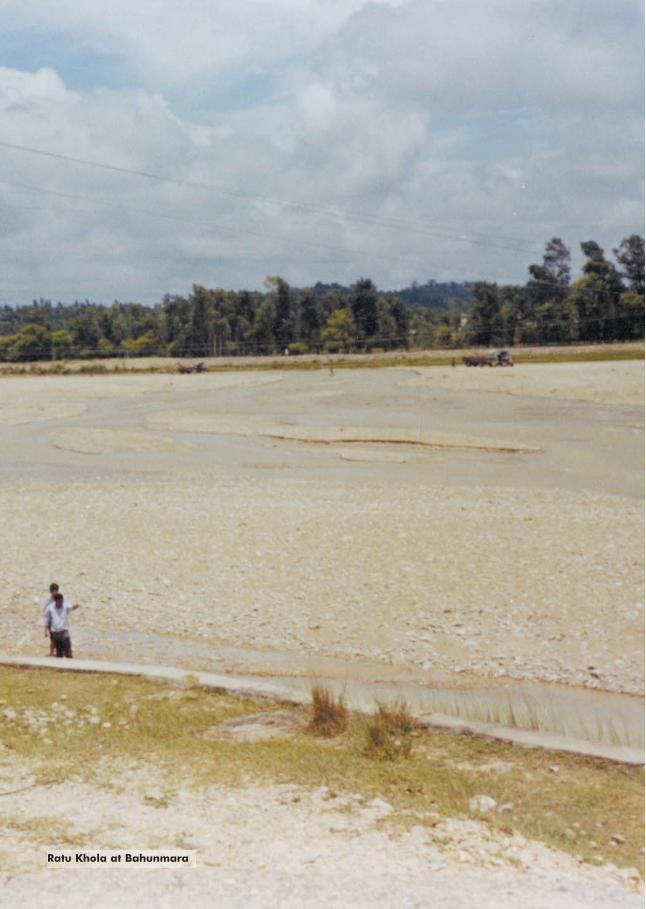
Ratu Khola at Bahunmara

ConclusionsThe main hazards repeatedly occurring and causing heavy losses in terms of livesand property in Nepal are floods, landslides, avalanches, hailstorms, windstorms,lightning strikes, earthquakes, fire, and epidemics. On an average, naturaldisasters take 951 lives and damage property worth NRs 1,242 million every year.Of these hazards, the overall impact caused by floods, landslides, and avalanchesis most severe. Between 1983 and 2005, on average, 309 people (32%) werekilled annually by water-induced disasters such as floods, landslides, andavalanches; this is second only to the deaths caused by epidemics, i.e., 524 livesper year. About 70% of the total families affected from all types of naturaldisaster in the country are affected by water-induced disasters. Loss of propertyfrom floods, landslides, and avalanches combined is about 61%.
On average the estimated losses from floods and landslides are almost 0.6% ofthe GDP at current prices (2006), 3% of the total budget, 4.7% of totaldevelopment expenditure, and 14.9% of foreign loans. Unaccounted losses fromdisruption in transportation, power, water supplies, and normal business fromsuch events were also discouraging. The government spends large amounts ofmoney every year in relief and reconstruction activities. On average, 12.9% of thedevelopment expenditure of Nepal and 5.39% of its real GDP are spent onresponse and recovery activities.
Devastating floods in Nepal are triggered by several different mechanisms: i)continuous rainfall and cloudbursts, ii) glacial lake outburst floods (GLOFs), iii)landslide dam outburst floods (LDOFs), iv) floods triggered by the failure ofinfrastructure, and v) sheet flooding or inundation in lowland areas due toexcessive rain, bank overflows, or obstructions imposed on the flow.
Among the three ecological regions: the Mountains, Hills, and the Terai, the Teraiis the most affected by flood hazards. Although loss of life is comparatively low inthe Terai districts where floods are the main natural disasters, the extent of thefloods’ impact in terms of the number of families affected and estimated lossesis very high. Nearly 77% of the total losses due to floods, landslides, andavalanches in combination from 1992-2001 were incurred in the Terai. During thisperiod, the loss of houses, livestock, and farmland in the Terai was about 85, 71,and 69% respectively. Families affected by floods in the Terai accounted for 70%of the total.
In the Terai, districts located in the central Terai, such as Rautahat, Sarlahi,Mahottari, and Dhanusa, are seriously affected by flood disasters. A comparisonof the losses and damage between 1970-1992 and 1993-2002 shows that thesedistricts have experienced increasing losses from water-induced disasters in theyears since 1993.
An extremely rugged, diverse, and dynamic landscape, landlockedness,inaccessibility, dispersed human settlements, and a high rate of human migrationhave been the causes for a high rate of physical and locational vulnerability. Nepallies in a high-energy environment with a dynamic landscape with high relief, steep
Chapter 4: The Larger Picture 95
mountain slopes, active tectonics, and highly concentrated precipitation, creatingconditions vulnerable to different types of geo-hydrological hazard such aslandslides and floods. Nepal does not have easy access to other countries via landand water. This constrains the timely flow of goods and services duringemergencies and means of transportation is expensive. Similarly, development ofinfrastructural services such as transportation, communication, health, marketing,and extension services such as education, skills development, and so on, whichplay an important role in all stages of flood-hazard mitigation and management;pre-disaster preparedness; during-disaster evacuation and relief activities; andpost-disaster rehabilitation and recovery activities, remain poor. Humansettlements are dispersed and territorial shifting is great as a result of humanmigration. Evidence of this is the extent of the population increase in the Teraifrom 35.2% of the total population in 1952/54 to to 48.4% in 2001. Such a rapidrate of migration and shifting of human settlements in the Terai have led toincreased vulnerability to flood hazards.
Nepal is not only highly vulnerable to water-induced hazards from the perspectiveof physical and locational conditions, but also from socioeconomic conditionsbecause of the low human development profile, poor economic growth, masspoverty, disparity in productive assets and income, heavy dependence onagriculture and its low production potential, inadequate service provision, and lackof political commitment and accountability. Its human development index is verylow. About 40% of the population live below the national poverty line. Economicgrowth has been less than 4%. The parcels of agricultural land are small. Smallfarmers operating less than 0.5 ha of land comprise about 45% and they ownonly 13% of the agricultural land. Similarly, the 20% of households at the lowesteconomic end receive only 5.3% of the national income. Access to safe drinkingwater, health facilities, and sanitation is poorer than South Asian standards.Government activities in disaster mitigation and management are mainly directedtowards post-disaster activities, viz., rescue, relief, and rehabilitation only. There isno coordination among institutions involved in disaster mitigation andmanagement, and there is a lack of integration among such activities.
The importance of flood-hazard, risk, and vulnerability mapping and assessmentin developing appropriate disaster-mitigation and management strategies andprogrammes to reduce the impacts of flood hazards has been realised and suchactivities have been incorporated into National Development Plans. Manygovernment institutions such as the Disaster Prevention Technical Centre (DPTC),Department of Hydrology and Meteorology (DHM), and the District IrrigationOffice (DIO), as well as NGOs and INGOs such as JICA, UNDP, and ICIMOD havebeen involved in such activities. However, so far, no substantial work has beencarried out in this field, hence the reason for this study.
RecommendationsFlooding is a natural process and its complete control is beyond the capability ofhuman efforts. However, the magnitude of flooding and its impact can be reducedto a certain extent through development and effective implementation of land-usezoning guidelines and building codes and standards. The problems of increasing
Preparing for Flood Disaster96
Chapter 4: The Larger Picture 97
risk and vulnerability are not associated with physical features only, but also withsocioeconomic conditions. Programmes well integrated with physical processesand socioeconomic developments are therefore needed. Watersheds are well-defined geophysical units in which the problems of flood hazards can be assessedand monitored properly. Attention should be given to integrated watersheddevelopment programmes in national development plans. Political commitmentand accountability in devising and implementing such programmes are essential.
The risk of flood hazards in the Ratu Watershed has been increasing. Since RatuKhola originates in the Siwaliks, there is no risk of GLOFs. (It should be noted thatthere is a risk of GLOFs in the Terai region, but this is confined to major riversoriginating from the high mountain region). However, the risk of flooding and itsassociated processes such as river-bed rise, bank cutting, and channel shifting isvery high. Another common feature in this watershed as in other areas of the Teraiis sheet flooding. The frequency and magnitude of sheet flooding and itsassociated risks have been increasing in recent years. The establishment ofinfrastructure, such as roads, perpendicular to the drainage paths havecontributed in large measure to this rise. All the major rivers in the Terai flow toIndia. So the development of infrastructure such as roads, barrages, dams, affluxbunds, and dykes downstream near the Nepal-India border increases flood riskand vulnerability in Nepal. This problem has been exacerbated by the constructionof a road near the Nepal-India border in this basin. This problem has beenrealised by the government and a special inundation committee with membersfrom Nepal and India has been established. Yet the committee has not so far beeneffective in solving the inundation problem in border areas. This problem shouldbe addressed by making the committee effective and exercising regionalcooperation by exchanging information and developing an early warning system.
The work in the Ratu Watershed clearly shows that flood-hazard, risk, andvulnerability mapping and zoning using GIS and remote sensing are economic interms of both time and money, and a useful tool for developing land-useguidelines in order to reduce the impact from flooding. Such work should also becarried out in other watersheds.
Flood-mitigation and management efforts in the past were confined to rescue andrelief work and structural measures such as construction and maintenance ofretaining/gabion walls, check dams, and spurs. Local people have realised theimportance of a preparedness plan incorporating components of watershedconservation and drainage management through proper land-use guidelines,income-generating activities, an early warning system, and creation of awareness.However, a local institutional network to devise and implement such programmesand dissemination of information should be established.
An attempt was made to establish an early warning system and identify safeevacuation routes and areas safe for shelter during the 2nd phase of this work.For this, people were trained to read and record precipitation in the upstream areaand discussions took place on the use of maps for delineating safe evacuationroutes and shelter areas. These efforts have yet to culminate in the establishmentof a local institutional network for early warning and creation of awareness in thecommunity, as recommended.

The capability of local people to respond to hazards and their resilience againstthem is poor in terms of physical assets, economic conditions, humandevelopment, and the technical capability of infrastructure. However, local peopleare willing to participate in and contribute to flood-hazard mitigation andmanagement. Efforts should be made to tap this sentiment through developingand strengthening local community-based institutions.
Preparing for Flood Disaster98
Bibliography 99
Bibliography(Not necessarily cited in the text but used during the study)
Batt, M.R. (1998) ‘Can Vulnerability be Understood?’ In Twigg, J.; Bhatt, M.R. (eds)Understanding Vulnerability – South Asia Perspectives, pp 68-77. London: InternationalTechnology Publications Ltd
Bhusal, J.K. (2004) ‘Consequences of River Training Structures: A Case of LaximpurBarrage and Afflux Bunds near Indo-Nepal Border’. In Journal of Hydrology andMeteorology, 1(1):1-5
Blaikie, P.; Cannon, T.; Davis, I.; Wisner, B. (1994) At Risk: Natural Hazards, People’sVulnerability, and Disasters. London and New York: Routledge
Bruijnzeeel, L.A.; Bremmer, C.N. (1989) Highland-Lowland Interaction in the GangesBrahmaputra River Basin: A Review of Published Literature, Occasional Paper No. 11.Kathmandu: ICIMOD
Carson, B. (1985) Erosion and Sedimentation Processes in the Nepalese Himalaya, OccasionalPaper No. 1. Kathmandu: ICIMOD
CBS (2004) Nepal Living Standard Survey, 2003/04: Statistical Report, Volume Two.Kathmandu: Central Bureau of Statistics, National Planning Commission Secretariat,Government of Nepal
CBS (2004a) Nepal Living Standard Survey, 2003/04: Statistical Report, Volume One.Kathmandu: Central Bureau of Statistics, National Planning Commission Secretariat,Government of Nepal
CBS (2005) Statistical Year Book of Nepal 2005. Kathmandu: Central Bureau of Statistics,National Planning Commission Secretariat, Government of Nepal
Chalise, S.R. (2001) ‘An Introduction to Climate, Hydrology and Landslide Hazards in theHindu Kush-Himalayan Region’. In Li Tianchi; Chalise, S.R; Upreti, B.N. (eds) LandslideHazard Mitigation in the Hindu Kush-Himalayas, pp 51-62. Kathmandu: ICIMOD
Chalise, S.R.; Khanal, N.R. (2001) ‘Rainfall and Related Natural Disasters in Nepal’. In LiTianchi; Chalise, S.R; Upreti, B.N. (eds) Landslide Hazard Mitigation in the Hindu Kush-Himalayas, pp 63-70. Kathmandu: ICIMOD
Chalise, S.R.; Khanal, N.R. (2002) ‘Recent Extreme Weather Events in the NepalHimalayas’. In Snorasson, A.; Finnsdottir, H.P.; Moss, M.E. (eds) The Extremes of theExtremes: Extraordinary Floods, Publication 271, pp141-146. Reykjavik (Iceland): IAHS
Chhetri, D. (1996) Some Aspects of Poverty in Nepal: Macro-analysis. Kathmandu: MIMAPProject, Agricultural Project Services’ Centre and International Development ResearchCentre
Chhetri, M.B.; Bhattarai, D. (2001) Mitigation and Management of Floods in Nepal.Kathmandu: Ministry of Home Affairs, HMG/Nepal
Dhital, M.; Khanal, N.; Thapa, K.B. (1993) The Role of Extreme Weather Events, MassMovements and Land-use Changes in Increasing Natural Hazards. Kathmandu: ICIMOD
DHM (1998) Flood Risk Mapping of Lakhandehi River. Kathmandu: Department of Hydrologyand Meteorology, Ministry of Science and Technology, HMG/Nepal
Preparing for Flood Disaster100
Dixit, A. (2003) ‘Floods and Vulnerability: Need to Rethink Flood Management’. In Mirza,M.M.; Dixit, A; Nishat, A. (eds) Flood Problem and Management in South Asiareprinted from Natural Hazard (28)1:155-179. Dordrecht/Boston/London: KluwerAcademic Publishers
DPTC; CDG (1994) Preliminary Survey of Debris Flow and Landslides in Agrakhola, Belkhu Kholaand Malekhu Khola. Kathmandu: Water Induced Disaster Prevention Technical Centre(DPTC) and Central Department of Geology, Tribhuvan University, Nepal
Federal Emergency Management Agency (1995a) Flood Insurance Study Guidelines andSpecifications for Study Contractors (FEMA 37), available at www.fema.gov/fhm
Federal Emergency Management Agency (1995b) Flood Hazard Mapping: Guidelines forDetermining Flood Hazards on Alluvial Fans, available at www.fema.gov/fhm
ICIMOD (2002) Hazard and Risk Mapping (Internal Report). Kathmandu: ParticipatoryDisaster Management Programme (Nep 99/014) and ICIMOD
ICIMOD (2002a) Community Risk and Vulnerability Assessment (Internal Report). Kathmandu:Participatory Disaster Management Programme (Nep 99/014) and ICIMOD
IIDS (2001) Flood Forecasting and Warning and Disaster Management. Kathmandu: Institute ofIntegrated Development Studies
ILWIS (1997) Users Guide, pp419-420. Enschede: ILWIS Department, International Institutefor Aerospace Survey and Earth Science
ITECO Engineering Ltd. (1996) Hazard Mitigation in Northern Sunkoshi and Bhotekoshi WaterCatchment Areas (HMWA), Central-Eastern Nepal: Final Report. Kathmandu: Nepal-Switzerland Cooperation Project, ITECO Engineering Ltd., Switzerland, ITECO Nepal(P) Ltd, and ICIMOD
Ives, J.D. (1986) Glacial Lake Outburst Floods and Risk Engineering in the Himalaya, OccasionalPaper No. 5. Kathmandu: ICIMOD
JICA/DoI (1999a) The Study on Flood Mitigation Plan for Selected Rivers in the Terai Plain in theKingdom of Nepal, Final Report Vol. 3 Supporting Report, A3: Flood MitigationPlan/Lakhandei River. Kathmandu: Department of Irrigation, Ministry of WaterResources, HMG/Nepal and Japan International Co-operation Agency (JICA)
JICA/DoI (1999b) The Study on Flood Mitigation Plan for Selected Rivers in the Terai Plain in theKingdom of Nepal, Final Report Vol. 4, Data Book. Kathmandu: Department of Irrigation,Ministry of Water Resources, HMG/Nepal and Japan International Co-operationAgency/JICA
Kasperson, R. (2001) Research and Assessment System for Sustainability, Framework forVulnerability. Palo Alto (California) National Academy of Science and Stanford HighWirePress
Khanal, N.R. (1997) Floods in Nepal. River Flood Disaster. pp 33-46. Koblenz: DeutschesIHP/OHP- National Kommitee
Khanal, N.R. (2004) ‘Floods in Mountain Watershed: A Case of Madi River, Central Nepal’.In Journal of Hydrology and Meteorology, 1(1):67-73
Khanal, N.R. (2005) ‘Water Induced Disasters: Case Studies from the Nepal Himalayas’. InHermann, A. (ed) Landschaftsokologie und Umweltforschung 48:179-188.
Khanal, N.R. (1996) Assessment of Natural Hazards in Nepal. Unpublished report submittedto the Research Division, Tribhuvan University, Kirtipur, Kathmandu, Nepal
Bibliography 101
Khanal, N.R. (1999) Study of Landslide and Flood Affected Areas in Syangja and RupandehiDistricts of Nepal. Unpublished report submitted to the Mountain Natural ResourcesDivision, ICIMOD, Kathmandu, Nepal
Kumar, S. (1999) ‘Disaster Management: Analysing Vulnerability’. In Proceedings of anInternational Conference on Disaster Management: Cooperative Networking in South AsiaI:170-180. New Delhi: Indira Gandhi National Open University
Lama, N.B. (1995) ‘Flood Hazard in Sarlahi District, July 1993, Nepal’. In Proceedings of anInternational Seminar on Water Induced Disaster (ISWID-1995), pp 211-219. Kathmandu:Water Induced Disaster Prevention Technical Centre (DPTC), Ministry of WaterResources, HMG/Nepal and Japan International Cooperation Agency (JICA)
Li Tianchi; Behrens, J. (2002) An Overview of Poverty, Vulnerability and Disaster Managementin Nepal. Kathmandu: ICIMOD
LRMP (1986) Land Capability Report. Kathmandu: Land Resources Mapping Project,Department of Survey, HMG/Nepal
Miyajima, S.; Thapa, T.B. (1995) ‘Preliminary Hazard map of Severely Affected Areas of1993 Disaster’. In Proceedings of an International Seminar on Water Induced Disaster(ISWID-1995), pp177-185. Kathmandu: Water Induced Disaster Prevention TechnicalCentre (DPTC), Ministry of Water Resources, HMG/Nepal and Japan InternationalCooperation Agency (JICA)
Mool, P.K.; Bajracharya, S.; Joshi, S.P. (2001) Inventory of Glaciers, Glacial Lakes and GlacialLake Outburst Floods: Monitoring and Early Warning System in the Hindu Kush-HimalayanRegion, Nepal. Kathmandu: ICIMOD
Mountain Risk Engineering Unit, Tribhuvan University (2003) Final Report on Preparation ofWater-Induced Hazard Maps of Part of Rupandehi District, Nepal. Kathmandu: Departmentof Water-Induced Disaster Prevention
NPC (1994) Report on Flood Rehabilitation Management Program. Kathmandu: FloodReconnaissance Team, National Planning Commission, HMG/Nepal
R.S. Engineering Service (2000) Preparation of Socio-Technical Plan for Flood Mitigation Work ofRato River, Mahottari. Kathmandu: R.S. Engineering Service
Sharma, K.P.; Adhikari, N.R.; Ghimire, P.K.; Chapagain, P.S. (2003) ‘GIS-Based Flood RiskZoning of the Khandu River Basin in the Terai Region of East Nepal’. In HimalayanJournal of Sciences, 1(2):103-106
Shrestha, R.R. (2000) Application of Geographic Information System and Numerical ModelingTools for Floodplain Analysis and Flood Risk Assessment of Babai River in Nepal, M.Sc.Thesis. Karlsruhe: Resources Engineering, University of Karlsruhe
Survey Department, His Majestys Government of Nepal (1996) Topographic maps of Nepal.Kathmandu: HMG/Nepal in cooperation with FINNIDA
Tate, E.C. (1999) Floodplain Mapping Using HEC-RAS and ArcView GIS, M.Sc. Thesis. Austin:University of Texas, Center for Research in Water Resources. Available athttp://www.ce.utexas.edu/centers/crwr/reports/online.html
Twigg, J. (1998) ‘Understanding Vulnerability: An Introduction’. In Twigg, J.; Bhatt, M.R.(eds) Understanding Vulnerability – South Asia Perspectives, pp 1-11. London:International Technology Publications Ltd
UNDP/OCHA (2003) Multi-hazard Mapping and Vulnerability Assessment of Chitwan District.Kathmandu: UNDP/Nepal

UNDP (2001) Nepal Human Development Report: Poverty Reduction Governance. Kathmandu:UNDP/Nepal
UNDRO (1991) Mitigation of Natural Disasters: Phenomena, Effects and Options (A Manual forPolicy Makers and Planners). New York: Office of the United Nations Disaster ReliefCoordinator, United Nations
USACE (2001) HEC-RAS River Analysis System, Hydraulic Reference Manual. Davis (California):Hydrological Engineering Center, US Army Corps of Engineers (USACE)
Varnes, D.J. (1984) ‘Landslide Hazard Zonation: A Review of Principles and Practices’. InNatural Hazards: An IAEG monograph. Paris: UNESCO
WECS (2005) National Water Plan (2002-2027). Kathmandu: Water and Energy CommissionSecretariat, Government of Nepal
WECS (2002) Water Resource Strategy of Nepal. Kathmandu: Water Energy CommissionSecretariat, Government of Nepal
Preparing for Flood Disaster102