ABOUT THE JOURNAL - PressAcademia · 2018-04-16 · i ABOUT THE JOURNAL Journal of Management,...
140
Transcript of ABOUT THE JOURNAL - PressAcademia · 2018-04-16 · i ABOUT THE JOURNAL Journal of Management,...


__________________________________________________________________________________ i
ABOUT THE JOURNAL Journal of Management, Marketing and Logistics (JMML) is a scientific, academic, peer-reviewed,
quarterly and open-access online journal. The journal publishes four issues a year. The issuing
months are March, June, September and December. The publication languages of the Journal are
English and Turkish. JMML aims to provide a research source for all practitioners, policy makers,
professionals and researchers working in the area of economics, finance, accounting and auditing.
The editor in chief of JMML invites all manuscripts that cover theoretical and/or applied researches
on topics related to the interest areas of the Journal.
Editor-in-Chief
Prof. Dilek Teker
JMML is currently indexed by
EconLit, EBSCO-Host, Ulrich’s Directiroy, ProQuest, Open J-Gate,
International Scientific Indexing (ISI), Directory of Research Journals Indexing (DRJI), International
Society for Research Activity(ISRA), InfoBaseIndex, Scientific Indexing Services (SIS), TUBITAK-
DergiPark, International Institute of Organized Research (I2OR)
Year: 2017 Volume: 4 Issue: 2
Journal of Management, Marketing and Logistics – (JMML), ISSN: 2148-6670, http://www.pressacademia.org/journals/jmml
CALL FOR PAPERS
The next issue of JMML will be published in September, 2017.
JMML welcomes manuscripts via e-mail.
E-mail: [email protected]
Web: www.pressacademia.org/journals/jmml
__________________________________________________________________________________ ii
EDITORIAL BOARD Mustafa Bekmezci, National Defence Ministry
Metin Canci, Okan University
Fahri Erenel, Istanbul Kemerburgaz University
Klaus Haberich, Franklin University
Chieh-Jen Huang, Providence University
Meltem Kiygi Calli, Okan University
Muge Klein, Turkish-German University
Gary S. Lynn, Stevens Institute of Technology
Selime Sezgin, Bilgi University
Semih Soran, Ozyigin University
Husniye Ors, Gazi University
Mehmet Tanyas, Maltepe University
Tugba Orten Tugrul, Izmir University of Economics
Nimet Uray, Istanbul Technical University
Nan-yu Wang, Ta Hwa University of Science and Technolgy
Fu-Yun Wang, Ta Hwa University of Science and Technology
Ugur Yozgat, Marmara University
REFEREES FOR THIS ISSUE Zafer Acar, Piri Reis University
Hande Erdogan Aktan, Akdeniz University
Gokhan Akyuz, Akdeniz University
Birdogan Baki, Karadeniz Technical University
Murat Baskak, Istanbul Technical University
Arzum Buyukkeklik, Nigde University
Gulcin Buyukozkan, Galatasaray University
Melten Kiygi Calli, Okan University
Bulent Catay, Sabanci University
Mustafa Gulmez, Akdeniz University
Ayca Gumusay, Istanbul Arel University
Fatih Koc, Kocaeli University
Batuhan Kocaoglu, Piri Reis University
Haluk Soyuer, Ege University
Selva Staub, Bandirma Onyedi Eylul University
Mehmet Tanyas, Maltepe University
Omer Baybars Tek, Izmir Yasar University
Omur Tosun, Akdeniz University
Mustafa Turhan, Okan University
Murat Tuzkaya, Yildiz Technical University
Journal of Management, Marketing and Logistics – (JMML), ISSN: 2148-6670, http://www.pressacademia.org/journals/jmml
Year: 2017 Volume: 4 Issue: 2

__________________________________________________________________________________ iii
CONTENT Title and Author/s Page
1. The determination of Turkish container ports performance with TOPSIS multiple criteria decision making method
Aynur Acer, Gozde Yanginlar…………………………………………………………………………………………………………………………... 67-75 DOI: 10.17261/Pressacademia.2017.452 JMML-V.4-ISS.2-2017(1)-p.67-75
2. An effective management tool: sales & operations planning (S&OP) and maturity model Batuhan Kocaoglu……………………………………………………………………………………………………………………………………………. 76-88 DOI: 10.17261/Pressacademia.2017.453 JMML-V.4-ISS.2-2017(2)-p.76-88
3. Multi-criteria decision analysis model for warehouse location in disaster logistics Aylin Ofluoglu, Birdogan Baki, Ilker Murat Ar………………………………………………………………………………………………….. 89-106
DOI: 10.17261/Pressacademia.2017.454 JMML-V.4-ISS.2-2017(3)-p.89-106
4. An artificial neural network approach for the logistics center location selection Burcu Kaya, Nursel Ozturk………………………………………………………………………………………………………………………………. 107-115
DOI: 10.17261/Pressacademia.2017.455 JMML-V.4-ISS.2-2017(4)-p.107-115
5. Green logistics practices in Turkey Esra Zengin, Ebru V. Ocalir Akunal………………………………………………………………………………………………………………….. 116-124
DOI: 10.17261/Pressacademia.2017.456 JMML-V.4-ISS.2-2017(5)-p.116-124
6. Understanding effects of innovative and collaborative approaches on supply chain performance Hakan Demir, Bulent Sezen……………………………………………………………………………………………………………………………… 125-142 DOI: 10.17261/Pressacademia.2017.457 JMML-V.4-ISS.2-2017(6)-p.125-142
7. A research on the impact of EWOM source credibility and personal innovativeness on online shopping intention in Turkish customers
Ilknur Bilgen, Farzaneh Soleimani Zoghi…………………………………………………………………………………………………………… 143-151 DOI: 10.17261/Pressacademia.2017.458 JMML-V.4-ISS.2-2017(7)-p.143-151
8. Comparison of the port authority's efficiency in Turkey Irmak Daldir, Omur Tosun………………………………………………………………………………………………………………………………… 152-158
DOI: 10.17261/Pressacademia.2017.459 JMML-V.4-ISS.2-2017(8)-p.152-158
9. Cold chain logistics for frozen food at tourism destinations Isilay Talay Degirmenci, Ismail Karayun, Oznur Ozdemir Akyildirim…………………………………………………………………. 159-167
DOI: 10.17261/Pressacademia.2017.460 JMML-V.4-ISS.2-2017(9)-p.159-167
Year: 2017 Volume: 4 Issue: 2
Journal of Management, Marketing and Logistics – (JMML), ISSN: 2148-6670, http://www.pressacademia.org/journals/jmml

__________________________________________________________________________________ iv
CONTENT Title and Author/s Page
10. Intelligent routing approach for the distributions regarding to the supply chain management of agricultural products and foods
Mehmet Karakoc…………………………………………………………………………………………………………………………………………… 168-177 DOI: 10.17261/Pressacademia.2017.461 JMML-V.4-ISS.2-2017(10)-p.168-177
11. Reverse logistics and application of ARAS method Nesrin Koc, Fahriye Uysal………………………………………………………………………………………………………………………………. 178-185 DOI: 10.17261/Pressacademia.2017.462 JMML-V.4-ISS.2-2017(11)-p.178-185
12. Prioritization of failure modes in food logistic process with a fuzzy approach Yelda Ayrim, Gulin Feryal Can………………………………………………………………………………………………………………………. 186-201
DOI: 10.17261/Pressacademia.2017.463 JMML-V.4-ISS.2-2017(12)-p.186-201
Journal of Management, Marketing and Logistics – (JMML), ISSN: 2148-6670, http://www.pressacademia.org/journals/jmml
Year: 2017 Volume: 4 Issue: 2

Journal of Management, Marketing and Logistics -JMML (2017), Vol.4(2), p.67-75 Acer, Yanginlar
_________________________________________________________________________________________________
DOI: 10.17261/Pressacademia.2017. 452 67
THE DETERMINATION OF TURKISH CONTAINER PORTS PERFORMANCE WITH TOPSIS MULTIPLE CRITERIA DECISION MAKING METHOD DOI: 10.17261/Pressacademia.2017.452 JMML- V.4-ISS.2-2017(1)-p.67-75
Aynur Acer
1, Gozde Yanginlar
2
1İstanbul Arel University, Istanbul, Turkey. [email protected] 2Beykent University, Istanbul, Turkey. [email protected]
_________________________________________________________________________________________________________________
To cite this document Acer, A and G. Yanginlar, (2017). The determınatıon of Turkısh container ports performance with TOPSIS multiple criteria decision making method. Journal of Management, Marketing and Logistics (JMML), V.4, Iss.2, p.67-75. Permemant link to this document: http://doi.org/10.17261/Pressacademia.2017.452 Copyright: Published by PressAcademia and limited licenced re-use rights only.
ABSTRACT Purpose- Ports have a leading role on affecting country and regional economy with the development of international trade. With the world
trading volume increasing day by day the performance of ports and terminals, which provide export, import, transit, local or regional
transportation services, must be examined regularly in order for their maximum capacity to be utilized. Furthermore, due to the high costs
of infrastructure and superstructure investments of container ports, long term plans and strategies are required. This study aims to
evaluate the performance of 20 container ports operating in Turkey by examining the performance criteria of container ports in the world.
Methodology- For this reason, when calculating the maximum capacity utilization of the ports, the main principle is to examine the
effective utilization of all the inputs using various methods. In this study, the performance of 20 container ports operating in Turkey, has
been analysed with the TOPSIS (Technique for Order Preference by Similarity to Ideal Solution) method, using non-financial data from
2015.
Findings- As a result of the analysis, the values that show the overall performance of the ports were converted into a single score with the
help of the TOPSIS method and port performances were evaluated by comparatively examining the results obtained. Mersin port, Ambarlı
Marport and Kumport derived first with the highest performance.
Conclusion- Port performance measurement has an important requirement for maritime transport. The high performance of container
ports improve the productivity of the production such as labour and capital.
Keywords: Container Ports, Multiple Criteria Decision Making, Performance, TOPSİS
JEL Codes: L9, P27, R41
1. INTRODUCTION
Container terminals have a profound important role in world maritime transportation systems in parallel with the development of international trade. Besides being a starting or ending point, container ports are also connection points. It also emphasizes the transfer function of container terminals, ensuring which container is transported accurately, timely and securely among different transportation vehicles. Container ports generally provide the transfer of containers between mainline vessels and feeder vessels or land/railways. Container terminals have three main functions such as container transport, storage and container handling. Container ports draw the attention one of the important indicators in determining the economic development levels of the countries as well as the fact that they allow the transport of the
Year: 2017 Volume: 4 Issue: 2
Journal of Management, Marketing and Logistics – (JMML), ISSN: 2148-6670, http://www.pressacademia.org/journals/jmml

Journal of Management, Marketing and Logistics -JMML (2017), Vol.4(2), p.67-75 Acer, Yanginlar
_________________________________________________________________________________________________
DOI: 10.17261/Pressacademia.2017. 452 68
increasing variety and quantities of goods by containers where loaded to the ship, evacuated from the ship and stored temporarily. The goods handling system which involves storage, transportation within port, loading and unloading activities is the heart of the activities at the ports. Container terminals are basically needed to the infrastructure and superstructure equipment’s of the port such as dock, mole, approach channel for providing load handling service. Despite of container handling in the world's ports began to spread in 1965, container handling in Turkey started to appear in 1985 (Ateş, 2010). The total number of handled containers in our ports increased from 48.644.314 in 2007 to 94.928.597 in 2016. Container transportation in Turkey has seen to be in incessant development in the last decade (DTGM, 2016). The pressures, which are reducing container handling costs and growing operational efficiency on ports, are increasing gradually.
Due to the increase in the number of handled containers in Turkey, container terminals have evaluated over time transforming into logistic base where value-added logistics activities are carried out. A problematic issue has occurred in the harbour operation process which affects directly or indirectly the international sea transportation. Inefficient operation of the dock winch will cause to increase their demurrage at the vessels' berth by affecting the speed of loading and unloading operations (Esmer, 2008). Therefore, it is aimed to increase the efficiency of container ports by using automatic stacking winches providing faster, more reliable service at container ports (Gharehgozli et al., 2017). Today, port harbours need to improve their operations and ensure cost efficiency so that they can maintain their presence in the competitive market and create customer satisfaction. Therefore, the selection of the best performing ports and the determination of the factors that will increase the efficiency are the basic principles in this process.
2. LITERATURE REVIEW
This study aims to evaluate the performance of 20 container ports operating in Turkey by examining the performance criteria of container ports in the world. While examining the literature, one can easily realize that the data envelopment method is used when the performances of container ports in the world are analyzed. By examining the performance of 20 container ports in Turkey through TOPSİS method, a difference can be made. The data obtained as a result of the research can also be used as a basis for this topic research in the future. The databases of Science Direct, Taylor & Francis, Emerald Group Publishing, Ibima Publishing and Ulakbim have been examined and the articles, especially the ones regarding the performance evaluation of container ports were selected among the ones published between 1981 and 2017 with the key words “multi-criteria decision-making method”, “container ports”, “performance” and “TOPSİS”.
The criteria used for measuring the performance of container ports in the relevant literature have been identified. In his study, Ateş (2010) suggests that the port performance was reviewed in two titles: port productivity and port production. Port efficiency clarifies the relationship between the input and output of the container terminal, port production explains the technical relationship between input and output of container terminal operators. In Collison’s study (1984), average waiting period, port schedule and port services capacity were selected as the selection criteria while Willingale (1981) signified the components such as cruise distance between ports, hinterland proximity, port infrastructure, tariffs and port usage. Estache et al. (2004) compared the performance of 11 container ports in Mexico between 1996 and 1999 according to port lengths and the number of employees, Alejandro and César (2009) analyzed the performance of seven container ports in Mexico according to storage area, port length, number of cranes between 2000 and 2007. Cheon et al. (2010) investigated the performance of the 98 container ports in the world between the years 1994 and 2004 based on the number of containers, the terminal area, the number of container cranes, the length of a ship's shoreline. Between the years 2003 and 2007, Yuen et al. (2013) evaluated 21 container terminals in China, South Korea and Singapore by using the variables “the number of terminal seaport” and “the length of terminal seaport”, “terminal area” and “the number of cranes”.
McCalla (1994) researched the effects of port facilities, transportation networks and container transportation routes on the efficiency of container ports. Song et al. (2014) sought out the performance of container ports in China for the period from 2006 to 2011 by means of the Malmquist productivity index. He emphasized that the main factor of increasing productivity at the ports is technological development. Additionally, the terminals in Yangtze Delta had the highest efficiency, while the southeastern coast had the lowest. Kim (2012) measured the efficiency of 19 container ports in Europe through the Promethee method. The results put forward that some precautions had to be taken for the efficient use of the cranes at the Rotterdam harbour and the working-hours of staff had to be reduced in GioiaTauro and Valencia ports. Rios et al. (2014) utilized hierarchical cluster analysis considering the criteria of container number, dock length, dock number, terminal tariffs, dock depth, average waiting time, average waiting time for cargo or unloading cargo. They determined that the Tecon terminal at Santos port is the best performing terminal. Wilmsmeier et al. (2013) measured the impact of the financial crisis on terminal efficiency by the Data Envelopment Analysis in 20 container ports in 10 countries between 2005 and 2011.

Journal of Management, Marketing and Logistics -JMML (2017), Vol.4(2), p.67-75 Acer, Yanginlar
_________________________________________________________________________________________________
DOI: 10.17261/Pressacademia.2017. 452 69
Table 1: Research Studies on Performance Criteria of Container Ports
Sequence of Number
Criteria Total Paper
1 Berth length 6 Rios and Sousa, (2014), Kim (2012), De Neufville and Tsunokawa (1981), Al-Eraqi et al., (2009), Guerrero and Rivera, (2009), Lozano, (2009)
2 Number of cranes 3 Rios and Sousa, (2014), Rios and Maçada (2006), Wanke et al., (2011)
3 Average wait time 2 Collison (1984), Rios and Sousa, (2014)
4 Number of equipment 3 Rios and Maçada (2006 ), Al-Eraqi et al., (2009), Lozano, (2009)
5 Number of yard gantries 2 Yuen et al., (2013), Wanke et al., (2011)
6 Port land area 2 Cheon et al., (2010), Yuen et al., (2013)
7 Number of cranes 10
Yuen et al., (2013), Alejandro and César (2009), Cheon et al., (2010), Rios and Maçada (2006 ), Kim (2012), De Neufville ve Tsunokawa (1981), Guerrero and Rivera, (2009), Lozano, (2009), Haralambides et al., (2010), Bottasso et al., (2011)
8 Length of docks 2 Estache et al., (2004), Alejandro and César (2009)
9 Number of employees 5 Estache et al., (2004), Rios and Maçada (2006), Guironnet et al., (2009), Haralambides et al., (2010), Bottasso et al., (2011)
10 Storage area 3 Alejandro and César (2009), Guerrero and Rivera, (2009), Lozano, (2009)
11 Terminal area 9
Cheon et al., (2010), Yuen et al., (2013), Mccalla (1994), Rios and Maçada (2006 ), Wanke et al. (2011), Kim (2012), Martin ( 2002), Al-Eraqi et al., (2009), Bottasso et al., (2011)
In Table 1, it is stated that the number of cranes, berth length, terminal area and the number of employees are influential in the performance criteria of the container ports in the literature. It is seen that the number of cranes is the most chosen criteria.
3. DATA AND METHODOLOGY
Multi-criteria decision-making methods are used to solve decision-making problems based on more than one criteria. The most common of these methods can be line up as Analytic Hierarchy Process (AHP), Fuzzy AHP, Topsis, Fuzzy Topsis, Electre, Point Factor Analysis (Eleren, 2007). In the literature, Data Envelopment Analysis (DEA) is mainly used to determine the performance and effectiveness of container ports and terminals. Although this study uses a method which is widely preferred in various economic researches, it differs from other studies in terms of the use of the TOPSIS method, which is not often found in national studies in assessing operational performance at container ports. The TOPSIS method, which was developed by Hwang and Yoon (1981), is a multi-criteria decision-making method (Ömürbek et al., 2015). This method is based on the assumption that the alternative solution point is the shortest distance between the positive-ideal solution and the farthest distance from the negative-ideal solution (Eleren and Karagül, 2008). The TOPSIS method is one of the multi-criteria decision-making methods that apply directly to the data and rank the alternatives by evaluating the ideal solution distance according to the specified criteria, maximum and minimum values. At the heart of the TOPSIS approach lies the
Journal of Management, Marketing and Logistics -JMML (2017), Vol.4(2), p.67-75 Acer, Yanginlar
_________________________________________________________________________________________________
DOI: 10.17261/Pressacademia.2017. 452 70
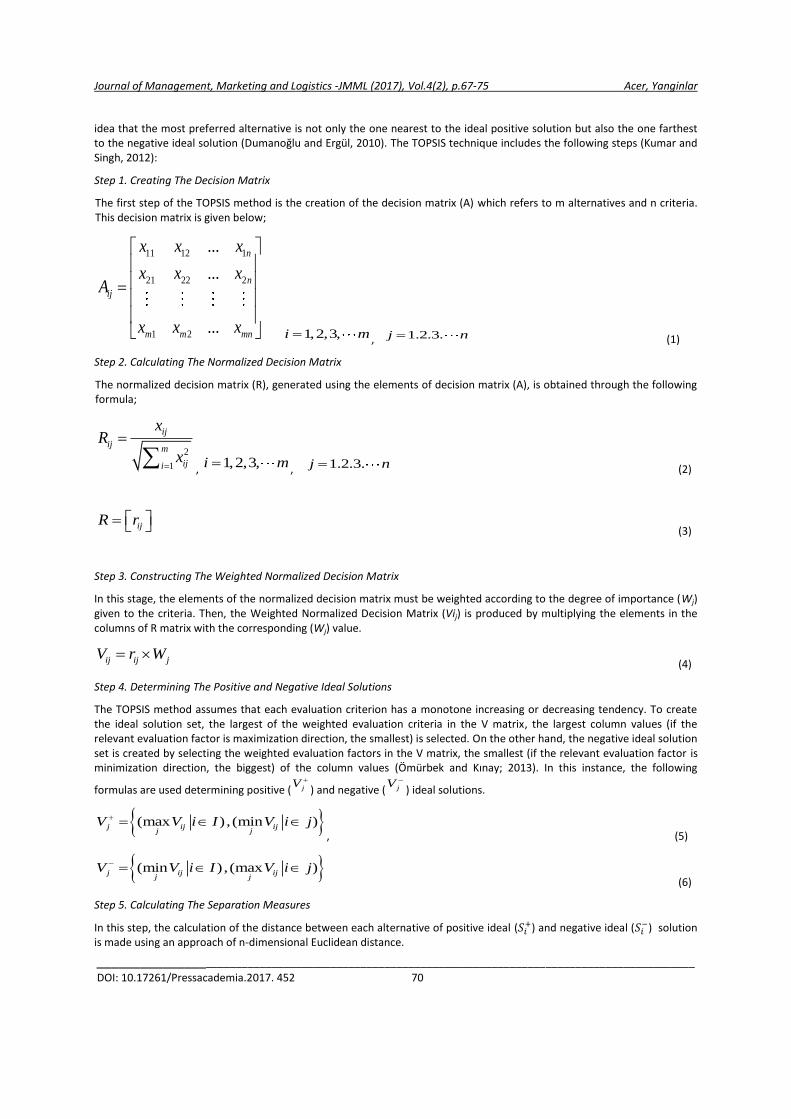
idea that the most preferred alternative is not only the one nearest to the ideal positive solution but also the one farthest to the negative ideal solution (Dumanoğlu and Ergül, 2010). The TOPSIS technique includes the following steps (Kumar and Singh, 2012):
Step 1. Creating The Decision Matrix
The first step of the TOPSIS method is the creation of the decision matrix (A) which refers to m alternatives and n criteria. This decision matrix is given below;
11 12 1
21 22 2
1 2
...
...
...
n
n
ij
m m mn
x x x
x x xA
x x x
1,2,3,i m , 1.2.3.j n (1)
Step 2. Calculating The Normalized Decision Matrix
The normalized decision matrix (R), generated using the elements of decision matrix (A), is obtained through the following formula;
2
1
ij
ijm
iji
xR
x
, 1,2,3,i m , 1.2.3.j n (2)
ijR r (3)
Step 3. Constructing The Weighted Normalized Decision Matrix
In this stage, the elements of the normalized decision matrix must be weighted according to the degree of importance (Wj) given to the criteria. Then, the Weighted Normalized Decision Matrix (Vij) is produced by multiplying the elements in the columns of R matrix with the corresponding (Wj) value.
ij ij jV r W (4)
Step 4. Determining The Positive and Negative Ideal Solutions
The TOPSIS method assumes that each evaluation criterion has a monotone increasing or decreasing tendency. To create the ideal solution set, the largest of the weighted evaluation criteria in the V matrix, the largest column values (if the relevant evaluation factor is maximization direction, the smallest) is selected. On the other hand, the negative ideal solution set is created by selecting the weighted evaluation factors in the V matrix, the smallest (if the relevant evaluation factor is minimization direction, the biggest) of the column values (Ömürbek and Kınay; 2013). In this instance, the following
formulas are used determining positive ( jV
) and negative ( jV
) ideal solutions.
(max ),(min )j ij ijjj
V V i I V i j , (5)
(min ),(max )j ij ijj j
V V i I V i j (6)
Step 5. Calculating The Separation Measures
In this step, the calculation of the distance between each alternative of positive ideal (𝑆𝑖+) and negative ideal (𝑆𝑖
−) solution is made using an approach of n-dimensional Euclidean distance.

Journal of Management, Marketing and Logistics -JMML (2017), Vol.4(2), p.67-75 Acer, Yanginlar
_________________________________________________________________________________________________
DOI: 10.17261/Pressacademia.2017. 452 71
The positive ideal distance measure: 2( )i ij iS V V , 1,2,3,i m and 1.2.3.j n (7)
The negative ideal distance measure:
2( )i ij jS V V , 1,2,3,i m and 1.2.3.j n (8)
Step 6. Calculating The Relative Closeness to Ideal Solution
The following formula is used in the calculation of the relative proximity to reach the ideal solution;
ii
i i
SC
S S
;
0 1iC , 1,2,3,i m (9)
Step 7. Relative Ranking of Each Alternative
In the last stage, the alternatives are arranged in terms of their scores according to calculated Ci values. The alternative with the highest score indicates the most ideal alternative.
4. FINDINGS AND DISCUSSIONS
The classifications in the literature and professional opinions are employed for the determination of decision variables which is effective in measuring the performance of container ports operating in Turkey.
4.1. Identifying the Problem
With multi-criteria decision making methods it is possible to evaluate the performances of ports with different structures by comparing them according to independent criteria using mathematical modeling. In this paper, the performance of container ports operating in Turkey was evaluated using the TOPSİS model according to the criteria specified.
4.2. Determination of Criteria and Alternatives
In determining the decision variables that are effective in performance measurement, the classifications in the literature and expert opinions were used. Seven decision variables that are container throughput, the number of containers, terminal handling capacity, the number of quay, quay length, terminal area and maximum draft were used for the year 2015. As the alternatives, there are 20 container ports operating in Turkey.
4.3. Obtaining Data
The data used in the study were obtained from TURKLIM, the related ports and sector reports. The measurement units and explanations of the criteria are given in Table 2.
Table 2: Performance Criteria for Container Terminals
Criteria Explanation Unit
Annual Container Throughput 20 foot(1 TEU) TE/ Annual
Number of Container 20 and 40 foot container Unit
Terminal Capacity of Handling For 20 foot Container TE/Annual
Number of Quay Container Terminal Quay Number Unit
Quay Length Container Terminal Quay length Kilometer
Terminal Area - Square meters
Maximum Draft - Meter
The decision matrix with a data set including the twenty container ports used as the alternative and seven criteria is shown in Table 3.

Journal of Management, Marketing and Logistics -JMML (2017), Vol.4(2), p.67-75 Acer, Yanginlar
_________________________________________________________________________________________________
DOI: 10.17261/Pressacademia.2017. 452 72
Table 3: Initial Decision Matrix
Container
Throughput
(TE)
Number of
Container
Handling
Capacity
Number of
Quay/Berth
Container
Terminal
Quay
Length
Terminal
Area
Maximum
Draft
1x 2x 3x 4x 5x 6x 7x
ASSAN 91203 58059 250000 1 340 69350 24
BORUSAN 225718 154510 400000 4 560 120000 14,5
ÇELEBİ BANDIRMA 18613 18458 40000 5 824 215569 11,5
ASYA PORT 129297 74986 250000 4 1330 300000 18
EGE GÜBRE 330252 217065 400000 5 697 155000 20
EVYAP 605385 393690 855000 4 1171 265000 16
GEMPORT 380511 253766 600000 8 1016 680000 36
KUMPORT 1170000 731250 2500000 5 2174 469000 16,5
ALPORT 18417 16779 350000 2 870 90000 12
LİMAK İSKENDERUN 144657 85502 1300000 4 920 900000 15,50
LİMAŞ 26622 13928 200000 2 240 60000 19
MARDAŞ 335576 208679 1300000 3 915 330000 16,5
MARPORT 1585419 1048447 2000000 7 1800 440000 16,5
MERSİN 1466199 923506 1800000 6 1475 1100000 14
NEMPORT 254311 170678 450000 6 820 140000 21,5
RODAPORT 91749 54821 180000 3 400 100000 12,3
SAMSUNPORT 56713 47764 184730 2 400 320000 10,5
YILPORT 374544 241831 600000 2 525 200000 25
TCDD ALSANCAK 656410 467344 1164917 4 933 635000 13
TCDD HAYDARPAŞA 121641 75511 654637 4 650 322503 12
GENERAL AVERAGE 404161,85 262828,7 773964,2 4,05 903 345571,1 17,22
4.4. Calculating the Criterion Weights
In practice, the weights of the selection criteria are given equal weights which is one of the decision-making methods in
case of uncertainty for all criteria
4.5. The Positive (V+
j) and Negative (V-j) Ideal Solutions Set
In Step 1, each value in the decision matrix is divided by the square root of the sum of the squares of the values in its column and thus the normalized decision matrix is obtained. The weighted standard decision matrix is established by multiplying this matrix with the weights of each criteria. At this stage, the maximum and minimum values in the column are selected for the positive ideal and the negative ideal solution sets. The solution sets obtained is given in Table 4.
Tablo 4: The Positive (V+j) and Negative (V
-j) Ideal Solutions
V+
j 0,0826 0,0843 0,0780 0,0578 0,0678 0,0791 0,0988
V-j 0,0010 0,0011 0,0012 0,0072 0,0075 0,0043 0,0222

Journal of Management, Marketing and Logistics -JMML (2017), Vol.4(2), p.67-75 Acer, Yanginlar
_________________________________________________________________________________________________
DOI: 10.17261/Pressacademia.2017. 452 73
4.6. Ranking of Alternatives by Ideal Solving
In this step, the positive and negative ideal solution distance values are determined by subtracting the positive ideal and the negative ideal values from the values in each column. The results obtained using the formulas in Step 5 and Step 6 are given in Table 5.
Tablo 5: Ranking of Alternatives
CONTAINER PORTS S S
iC RANKING
ASSAN 0,178 0,022 0,109 20
BORUSAN 0,167 0,031 0,158 15
ÇELEBİ BANDIRMA 0,178 0,036 0,168 14
ASYAPORT 0,161 0,047 0,225 13
EGE GÜBRE 0,154 0,045 0,228 12
EVYAP 0,133 0,065 0,326 8
GEMPORT 0,120 0,094 0,440 5
KUMPORT 0,086 0,136 0,611 3
ALPORT 0,179 0,024 0,118 19
LİMAK İSKENDERUN 0,139 0,080 0,366 7
LİMAŞ 0,180 0,027 0,130 18
MARDAŞ 0,139 0,059 0,298 9
MARPORT 0,074 0,151 0,672 2
MERSİN 0,069 0,151 0,687 1
NEMPORT 0,148 0,062 0,294 10
RODAPORT 0,174 0,028 0,140 17
SAMSUNPORT 0,172 0,028 0,140 16
YILPORT 0,143 0,084 0,371 6
TCDD İZMİR ALSANCAK 0,103 0,091 0,469 4
TCDD HAYDARPAŞA 0,150 0,060 0,287 11
As a result of ranking, Mersin port comes in first place with the highest score (0,687), Ambarlı Marport comes second (0,672) and Kumport comes third (0,611). This order is followed by the following container ports; İzmir Alsancak (0,469), Gemport (0,440) Yılport (0,371), Limak İskenderun (0,366), Evyap (0,326), Mardaş (0,298), Nemport (0,294), Haydarpaşa (0,287), Ege Gübre (0,228), Asyaport (0,225), Çelebi Bandırma (0,168), Borusan (0,158), Samsunport (0,140), Rodaport (0,140), Limaş (0,130), Alport (0,118) and Assan (0,109).
5. CONCLUSION
In maritime transport, container ports play an important role in the development of both national and international trade. With increasing trade volume, performance evaluation based on various mathematical methods is required for harbours in order to make optimum use of all inputs and to make long-term plans. The performance evaluation of a port can determine whether the functions of the port such as physical infrastructure, area, handling capacity, number of berths and length are being successfully used as well as its ability to become a competitive port by increasing the quality of its services. Port performance measurement is an important requirement for maritime transport. The low performance of container ports reduces the productivity of the basic factors of production such as labour and capital and thus causes the loss of customers and capital. Container terminal efficiency aims to use port inputs such as labour, equipment, ship, load and field effectively. And terminal efficiency measurement is the calculation of the efficiency of these resources.
This study evaluates the performance of container ports operating in Turkey using the TOPSIS method, which is one of the multi-criteria decision making methods. In the study, 20 container ports were selected as alternatives. Seven criteria were considered as the decision making variables: the number of the TEUs handled in 2015, the number of the containers handled, the handling capacity of container terminals, the number and length of container docks, terminal area and the maximum draft. When the results were evaluated using the TOPSİS method, Mersin port came first with the highest
Journal of Management, Marketing and Logistics -JMML (2017), Vol.4(2), p.67-75 Acer, Yanginlar
_________________________________________________________________________________________________
DOI: 10.17261/Pressacademia.2017. 452 74
performance. Mersin port, located in the south-east of Turkey with more than one hundred international ports, is an important gateway to the eastern Mediterranean. It plays an effective role in the South, Southeast and Eastern Anatolia economies and Turkish trade, as well as the domestic transit market of neighboring countries. Furthermore, the harbour has a wealth of possibilities and through these possibilities provides freight services for shipments such as containers, general, project, ro-ro, dry bulk and liquid bulk; loading and unloading services can also be provided to nearly 30 ships at the same time in the harbour which has a total of 21 berths. In second and third place are Ambarlı Marport and Kumport harbours, respectively. By increasing its port site and berth capacity the Marport container port has been transformed into a terminal where large container vessels that need deep water can be serviced and has thus become a terminal that offers efficient and effective port services. The ports of Limaş, Alport and Assan were the ports with the lowest performances. On the basis of this study, it is possible to evaluate the performance of the ports by taking into consideration other multi-criteria decision making methods and varied criteria.
ACKNOWLEDGEMENT
The authors wish to acknowledge TURKLIM and the aforementioned ports for their contribution by providing the data sets to support the research reported in this paper.
REFERENCES
Alejandro, G.C., César, T. (2009), “Mexico: Total Productivity Changes at The Principal Container Port”, CEPAL Rev. 99, pp.173–185.
Al-Eraqi, A. S., Khader, A. T., Mustafa, A. (2009), “DEA Malmquist Index Measurement in Middle East and East African Container Terminals”, International Journal Shipping and Transport Logistics, 1,3, pp. 249–259.
Ateş, A. ( 2010), “Türkiye Konteyner Terminallerinde Verimlilik Analizi”, Atatürk Universitesi Fen Bilimleri Enstitüsü Su Ürünleri Anabilimdalı, Doktora Tezi, Erzurum.
Bottasso, A., Conti, M., Ferrari, C. (2011), “Efficiency and productivity growth in a sample of Italian containers terminals”, International Journal of Transport Economics, 38, 2, pp. 107–122.
Cheon, S.H., Dowall, D.E., Song, D.W. (2010), “Evaluating impacts of institutional reforms on port efficiency changes: ownership, corporate structure, and total factor productivity changes of world container ports”, Transp. Res. Part E 46, pp.546–561.
Collison, F.M. (1984), “North to Alaska: Marketing in the Pacific Northwest-Central Alaska linear trade”, Marit. Policy Manage, 11, 2, pp. 99–112.
De Neufville, R., Tsunokawa, K. (1981), “Productivity and returns to scale of container ports”, Maritime Policy and Management, 8, 2, pp. 121–129.
Dumanoglu, S., Ergül, N. (2010), “IMKB'de Islem Gören Teknoloji Sirketlerinin Mali Performans Ölçümü”, Muhasebe Ve Finansman Dergisi, 48, pp.101-111.
DTGM (2016), https://atlantis.udhb.gov.tr/istatistik/istatistik_konteyner.aspx
Eleren, A. (2007), “Markaların Tüketici Tercih Kriterlerine Göre Analitik Hiyerarşi Süreci Yöntemi İle Değerlendirilmesi: Beyaz Eşya Sektöründe Bir Uygulama”, Yönetim Ve Ekonomi Dergisi, 14, 2, pp.47-64.
Eleren, A., & Karagül, M. (2008), “1986-2006 Türkiye Ekonomisinin Performans Değerlendirmesi”, Celal Bayar Üniversitesi İİ BF Yönetim Ve Ekonomi Dergisi, 15,1, pp.1-14.
Esmer, S. (2008), “Konteyner Terminallerinde Lojistik Süreçlerin Optimizasyonu ve Bir Simulasyon Modeli”, Dokuz Eylül Üniversitesi Sosyal Bilimler Enstitüsü Denizcilik İşletmeleri Yönetimi Anabilim Dalı, Doktora Tezi, İzmir.
Esmer, S., Zafer, E. (2008), “Türkiye’de Konteyner Limanlarının Geleceği”, Türkiye’nin Kıyı ve Deniz Alanları VII. Ulusal Kongresi, 27-30 Mayıs, Ankara, pp. 551-558.
Estache, A., Tovar, B., Trujillo, L. (2004), “Sources of efficiency gains in port reform: A DEA decomposition of a Malmquist TFP index for Mexico”, Utilities Policy, 12, pp. 221–230.
Gharehgozli , A.H., Vernooij, F.G., Zaerpour, N. (2017), “A simulation study of the performance of twin automated stacking cranes at a seaport container terminal”, European Journal of Operation Research, 9, pp.1-21.
Guerrero, C., & Rivera, C. (2009). “ Mexico: Total productivity changes at the principal container ports”, Cepal Review, 99, pp. 173–185.

Journal of Management, Marketing and Logistics -JMML (2017), Vol.4(2), p.67-75 Acer, Yanginlar
_________________________________________________________________________________________________
DOI: 10.17261/Pressacademia.2017. 452 75
Guironnet, J.P., Peypoch, N., Solonandrasana, B. (2009), “A note on productivity change in French and Italian seaports”,International Journal Shipping and Transport Logistics, 1,3, pp. 216–226.
Haralambides, H., Hussain, M., Barros, C. P., Peypoch, N. (2010), “A new approach and benchmarking seaport efficiency and technological change”, International Journal of Transport Economics, 3,1, pp. 77–96.
Kim, D. (2012), “A Comparison of efficiency with productivity criteria for European container ports’’, The Asian Journal of Shipping and Logistics, 28, 2, pp. 183-202.
Kumar, P., Singh, R.K. (2012), “A fuzzy AHP and TOPSIS methodology to evaluate 3PL in a supply chain”, Journal Of Modelling in Management, 7,3, pp.287-303.
Lozano, S. (2009), “Estimating productivity growth of Spanish ports using a non-radial, non-oriented Malmquist index’’, International Journal Shipping and Transport Logistics, 1, 3, pp. 227–248.
Mccalla, R.J. (1994), “Canadian container ports: how have they fared? How will they do? ” Maritime Policy Management, 21, 3, pp.207–217.
Ömürbek, N., Makas, Y., Ömürbek, V. (2015), “AHP ve TOPSIS Yöntemleri İle Kurumsal Proje Yönetim Yazılımı Seçimi’’, Süleyman Demirel Üniversitesi Sosyal Bilimler Enstitüsü Dergisi, 1, 21, pp.59-83.
Ömürbek, V., Kınay, Ö. G. B. (2013), “Havayolu Taşımacılığı Sektöründe TOPSIS Yöntemiyle Finansal Performans Değerlendirmesi ’’, Süleyman Demirel Üniversitesi İktisadi Ve İdari Bilimler Fakültesi Dergisi, 18(3).
Rios, L.R., Maçada, A.C.G., (2006), “ Analysing the relative efficiency of container terminals of Mercosur using DEA, Marit. Econ. Logist. 8, 4, pp.331–346.
Rios, C., Sousa, R. (2014), “ Cluster analysis of the competitiveness of container ports in Brazil ”, Transportation Research Part A, 69, pp. 423-443.
Songn, B., Cui, Y. (2014), “ Productivity changes in Chinese Container Terminals 2006–2011”, Transport Policy, 35, pp. 377-384.
Wanke, P.F., Barbastefano, R.G., Hijjar, M.F. (2011), “Determinants of efficiency at major Brazilian port terminals”, Transp. Rev. 31, 5, pp. 653–677.
Willingale, M.C. (1981), “ The port-routeing behaviour of short-sea ship operators; theory and practice”, Marit Policy Manage, 8, 2, pp. 109–120.
Wilmsmeier, G., Tovar, B., Sanchez R.J. (2013), “The evolution of container terminal productivity and efficiency under changing economic environments”, Research in Transportation Business & Management, 8, pp. 50-66.
Yuen, C.L., Zhang, A., Cheung, W. (2013), “Foreign participation and competition: a way to improve the container port efficiency in China? ”, Transp. Res. Part A 49, pp.220–231.

Journal of Management, Marketing and Logistics -JMML (2017), Vol.4(2), p.76-88 Kocaoglu
_________________________________________________________________________________________________
DOI: 10.17261/Pressacademia.2017. 453 76
AN EFFECTIVE MANAGEMENT TOOL: SALES & OPERATIONS PLANNING (S&OP) and MATURITY MODEL DOI: 10.17261/Pressacademia.2017.453 JMML- V.4-ISS.2-2017(2)-p.76-88 Batuhan Kocaoglu
1
1Piri Reis University, Department of Management Information Systems, Istanbul, Turkey. batuhan.kocaoglu @ gmail.com
To cite this document Kocaoglu, B., (2017). An effective management tool: sales & operations planning (S&OP) and maturity model. Journal of Management, Marketing and Logistics (JMML), V.4-ISS.2,p.76-88. Permemant link to this document: http://doi.org/10.17261/Pressacademia.2017.453 Copyright: Published by PressAcademia and limited licenced re-use rights only.
ABSTRACT Purpose – The center of the transformation of companies’ supply chain development is sales and operations planning (S&OP). Although
S&OP is emphasized in previous researches, the related resources and the literature are very limited. For this purpose, it is aimed to
develop a mixed framework for firms to analyze their S&OP processes and to monitor these processes within a maturity model.
Methodology - It has been researched how the S&OP maturity model can be used to determine the stages and the stage in which the firm
is located. Literature research was carried out and synthesized. By examining these studies, concepts are blended in terms of academic and
practitioner perspectives.
Findings - S&OP literature is limited, there is no Turkish resource about the maturity level. By way of existing S&OP models, a more
understandable collective model has been proposed. In addition, an efficiency evaluation checklist, which can be used with the maturity
model, is presented.
Conclusion - The recommended checklist shows how a company should develop the S&OP process and where it is weak; Maturity model is
useful for understanding the current state of the S&OP process as well as the appropriate next improvement steps. This will guide the
companies that are in the S&OP process.
Keywords: S&OP, sales and operations planning, maturity model, integrated business planning, ERP.
JEL Codes: O21, L21, D83
ETKİN BİR YÖNETİM ARACI: SATIŞ & OPERASYON PLANLAMA (S&OP) VE OLGUNLUK MODELİ ÖNERİSİ
ÖZET Amaç - Firmaların tedarik zincirlerini geliştirmelerindeki dönüşümün merkezi, satış ve operasyon planlamasıdır(S&OP). S&OP’nin önemi
araştırmalarda vurgulanmasına rağmen, ilgili kaynak ve literatür çok kısıtlıdır. Bu amaçla firmaların S&OP süreçlerini analiz etmesi, bu
süreçlerini bir olgunluk modeli çerçevesinde izlemesine yönelik karma bir yapı geliştirilmesi hedeflenmiştir.
Yöntem - S&OP olgunluk modelinin aşamaları ve firmanın bulunduğu aşamayı saptamak için, nasıl bir araç kullanılabileceği araştırılmıştır.
Literatür araştırması yapılıp, elde edilenler sentezlenmiştir. Bu konudaki çalışmalar incelenerek, kavramlar akademik ve uygulayıcı bakış
açısıyla harmanlanmıştır.
Bulgular - S&OP literatürü sınırlıdır, olgunluk seviyesiyle ilgili Türkçe kaynak yok denebilir. Mevcut S&OP modellerinden yola çıkılarak, daha
anlaşılabilir toplu bir model önerilmiştir. İlaveten, olgunluk modeli ile kullanılabilecek, bir etkinlik değerlendirme kontrol listesi sunulmuştur.
Sonuç – Önerilen kontrol listesi, bir şirketin S&OP sürecini nasıl geliştirmesi gerektiğini ve nerede zayıf olduğunu; olgunluk modeli S&OP
sürecinin mevcut durumunun yanında, uygun bir sonraki iyileştirme adımlarını anlaması için yararlıdır. Bu da, S&OP sürecinde olan
firmalara yol gösterecektir.
Anahtar Kelimeler: S&OP, satış ve operasyon planlama, olgunluk modeli, entegre iş planlama, ERP.
JEL Kodları: O21, L21, D83
Year: 2017 Volume: 4 Issue: 2
Journal of Management, Marketing and Logistics – (JMML), ISSN: 2148-6670, http://www.pressacademia.org/journals/jmml

Journal of Management, Marketing and Logistics -JMML (2017), Vol.4(2), p.76-88 Kocaoglu
_________________________________________________________________________________________________
DOI: 10.17261/Pressacademia.2017. 453 77
1. GİRİŞ
Günümüzün zorlu ekonomik ortamı tarafından baskı altına alınan çoğu firma, öncelikle tedarik zinciri maliyetinin sınırlandırılmasını amaçlayan, çok kısa vadeli ve savunma amaçlı tedarik zinciri stratejisi izlemektedir. Şirketler maliyet kısmına odaklanarak, kısa vadede hızlı fayda sağlayabilirken, tedarik zinciri süreçlerini yeni pazar dinamiklerine uyacak şekilde modernize etme fırsatını kaçırmaktadır.
Üreticiler, artık talep değişkenliği ve tedarik zinciri çevikliği arasındaki temel bağıntıyı anlamaya başlamıştır. Talep değişkenliği, üreticilerin doğru tahmin etme kabiliyetini etkilemektedir. Üreticilerin talep değişkenliği ile mücadele etmek için atması gereken ilk adım, tahmin hatalarını azaltmanın bir yolu olarak, talep planlamasını ve tahmin sürecini, geliştirmektedir.
Önde gelen üreticiler belli yol almış durumdadır. Tahminlerdeki kaçınılmaz ve beklenmedik değişiklikleri hızla yanıtlama yeteneğini geliştirmek, rekabet edebilirlik açısından oldukça önemlidir
Hem talep(demand) tarafındaki “tahmin”ler, hem de tedarik&arz(supply) tarafındaki “kısıtlama planlaması”ndan açısından, uzlaştırıcı yeteneği göz önüne alındığında, S&OP süreci firmalar için kritik bir role sahiptir. Sonuçta, S&OP, üreticilerin tedarik zincirini optimize etmelerine, güvenilirlik, yanıt verme ve çeviklikten faydalanmalarına yardımcı olmaktadır (Veronesi, 2013). S&OP süreci, hem kurum hem de departmanlar seviyesinde, operasyonel planlama yapabilme imkanı verir (Ventana Research, 2006).
2. LİTERATÜR TARAMASI VE KAVRAMLAR
2.1. S&OP (Satış ve Operasyon Planlama) Kavramı
Firmaların değişikliklere hızlı yanıt vermek üzere uyguladığı, satış ve operasyon planlama (S&OP) sürecinin önemi ortaya çıkmaya başlamıştır. 2013 yılında yapılan, 360 firmanın yanıtlarının dikkate alındığı bir araştırma sonucunda da, S&OP, işletme performansını etkileyen en önemli tedarik zinciri süreci olarak görüldüğü vurgulanmıştır (Veronesi, 2013). Şekil1’de gösterilmiştir.
Şekil 1: İşletme Performansını Etkileyen En Önemli Tedarik Zinciri Süreci Nedir (Veronesi, 2013)
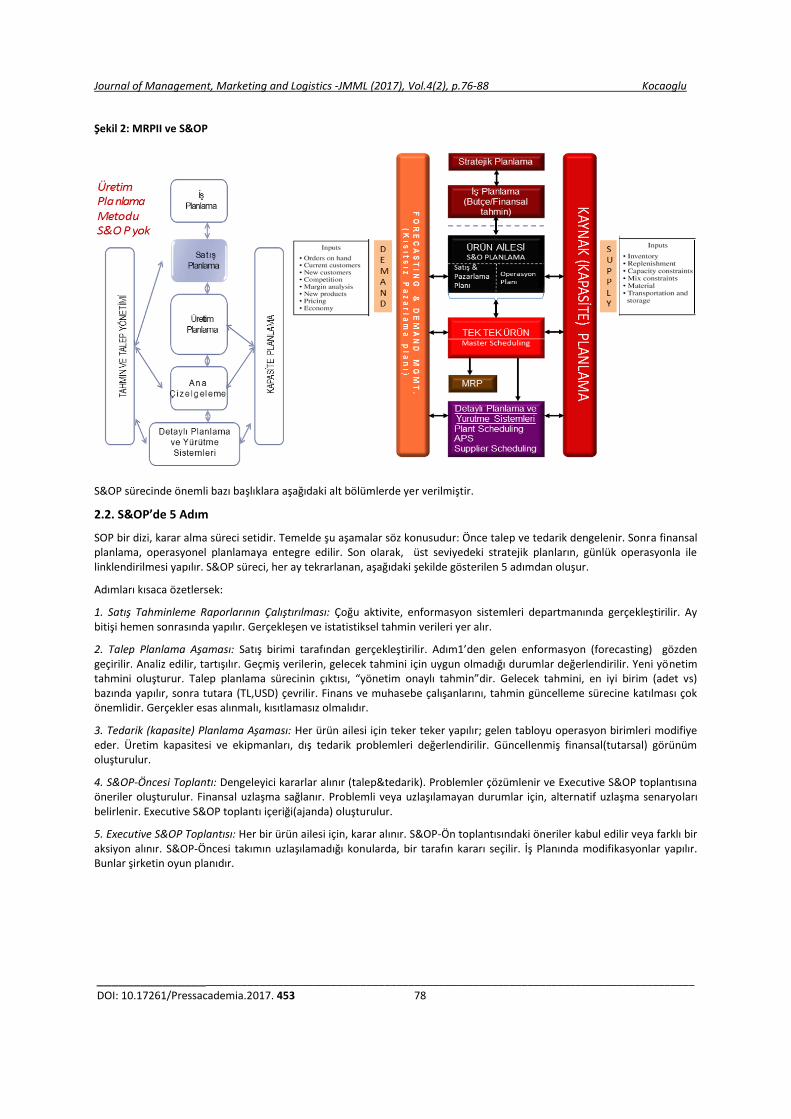
S&OP ürün ailesi bazında yapılan bir planlama sürecidir. Talep ve arzın dengelenmesi amaçlanır. Klasik genel planlama ve S&OP ile planlama yapısı (APICS, 2011) (Wallace, 1999) uyarlanarak aşağıda gösterilmiştir.
Journal of Management, Marketing and Logistics -JMML (2017), Vol.4(2), p.76-88 Kocaoglu
_________________________________________________________________________________________________
DOI: 10.17261/Pressacademia.2017. 453 78
Şekil 2: MRPII ve S&OP
S&OP sürecinde önemli bazı başlıklara aşağıdaki alt bölümlerde yer verilmiştir.
2.2. S&OP’de 5 Adım
SOP bir dizi, karar alma süreci setidir. Temelde şu aşamalar söz konusudur: Önce talep ve tedarik dengelenir. Sonra finansal planlama, operasyonel planlamaya entegre edilir. Son olarak, üst seviyedeki stratejik planların, günlük operasyonla ile linklendirilmesi yapılır. S&OP süreci, her ay tekrarlanan, aşağıdaki şekilde gösterilen 5 adımdan oluşur.
Adımları kısaca özetlersek:
1. Satış Tahminleme Raporlarının Çalıştırılması: Çoğu aktivite, enformasyon sistemleri departmanında gerçekleştirilir. Ay bitişi hemen sonrasında yapılır. Gerçekleşen ve istatistiksel tahmin verileri yer alır.
2. Talep Planlama Aşaması: Satış birimi tarafından gerçekleştirilir. Adım1’den gelen enformasyon (forecasting) gözden geçirilir. Analiz edilir, tartışılır. Geçmiş verilerin, gelecek tahmini için uygun olmadığı durumlar değerlendirilir. Yeni yönetim tahmini oluşturur. Talep planlama sürecinin çıktısı, “yönetim onaylı tahmin”dir. Gelecek tahmini, en iyi birim (adet vs) bazında yapılır, sonra tutara (TL,USD) çevrilir. Finans ve muhasebe çalışanlarını, tahmin güncelleme sürecine katılması çok önemlidir. Gerçekler esas alınmalı, kısıtlamasız olmalıdır.
3. Tedarik (kapasite) Planlama Aşaması: Her ürün ailesi için teker teker yapılır; gelen tabloyu operasyon birimleri modifiye eder. Üretim kapasitesi ve ekipmanları, dış tedarik problemleri değerlendirilir. Güncellenmiş finansal(tutarsal) görünüm oluşturulur.
4. S&OP-Öncesi Toplantı: Dengeleyici kararlar alınır (talep&tedarik). Problemler çözümlenir ve Executive S&OP toplantısına öneriler oluşturulur. Finansal uzlaşma sağlanır. Problemli veya uzlaşılamayan durumlar için, alternatif uzlaşma senaryoları belirlenir. Executive S&OP toplantı içeriği(ajanda) oluşturulur.
5. Executive S&OP Toplantısı: Her bir ürün ailesi için, karar alınır. S&OP-Ön toplantısındaki öneriler kabul edilir veya farklı bir aksiyon alınır. S&OP-Öncesi takımın uzlaşılamadığı konularda, bir tarafın kararı seçilir. İş Planında modifikasyonlar yapılır. Bunlar şirketin oyun planıdır.

Journal of Management, Marketing and Logistics -JMML (2017), Vol.4(2), p.76-88 Kocaoglu
_________________________________________________________________________________________________
DOI: 10.17261/Pressacademia.2017. 453 79
Şekil 3: Aylık S&OP (Satış ve Operasyon Planlama) Süreci (Wallace, 1999) (Wallace(b) & Stahl, 2014)
S&OP aylık bir süreçtir. Hem orta yönetim, hem de üst yönetimi ilgilendirir. Toplu ürün grupları ile yapılmaktadır, detayda değil. S&OP çalışması, tüm ilgili faktörleri bir sayfada, tabloda toplamaktadır. Üst yönetimler genelde bunu çok faydalı bulur, çünkü daha iyi kararlar almalarına yardımcı olmaktadır.
2.3. S&OP Hesap Tabloları
S&OP hesap tablolarında yer alan “gelecek planları” , uzlaşıyı içerir. “Gerçekleşen” rakamlar ise, bu planlara ne kadar iyi uyulduğunu gösterir. Çoğu firmada sadece bunları takip etmek bile, plan ve gerçekleşen arasındaki farkı azaltmaktadır. Gelecek için yapılan öngörü; yeni ve güncellenmiş tahminler yapılmasına, operasyon(üretim, satın alma) olanaklarının geliştirilmesine ve gereken yerlerin modifiye edilmesine olanak verir. Ayrıca bu tabloda her ürün ailesi için, talep ve tedarik stratejisi belirlenir, gösterilir. Buna uygun bazı sorular;
Bu ürün ailesi: MTS mi yoksa MTO mudur?
Bunun için, hedef müşteri hizmet seviyesi nesir?
MTS ise, hedef bitmiş ürün stok seviyesi (hedef müşteri hizmet seviyesi için) nedir?
MTO ise, hedef müşteri bekleyen siparişleri(backlogs) ne olmalıdır? (negatif stoktur ve önemlidir; müşterilerin ürünlerini ne kadar sürede teslim alacağını belirler.)
2.4. ERP Yatırımlarından Daha Fazla Verim Alabilme İmkânı
Genelde uygulamada gözden kaçırılan bir nokta vardır. ERP sistemi, tüm tek tek bireysel ürün kalemleri ile ilgilenmektedir, ürün aileleri ile değil. Çoğu firma, çok pahalı ERP yatırımları sonucunda hayal kırıklığı yaşamıştır. Bunun en büyük nedenlerinden biri, farklı bir göz ile baktığımızda, S&OP uygulamamalarıdır. Çünkü genelde, ERP yazılımları içinde S&OP modülü bulunmamaktadır. Bu yüzden, bu süreci kurmak, proje ekibi ve sistem danışmanlarının hedefinde bulunmaz. Genelde firma, implementasyondan sonra, ERP yazılımı ile baş başa kalır. Firmanın iyi süreçleri olsa da, tek tek bireysel ürünler ile uğraşılır. Ama ürün ailesi üzerinden, senede sadece bir kez geçilir. Bu durum yaşanılıyorsa, S&OP süreci uygulaması, ERP yatırımından daha fazla verimi almak için de, düşünülebilir. Firmada tam bir MRPII-ERP sisteminin olmaması, S&OP kullanılamaz demek değildir. S&OP, verileri ERP’den alsa da, tek başına da çalışabilir bir sistemdir. S&OP’ye geçmek için, tam kapsamlı bir ERP implementasyonunun bitmesi beklenmemelidir. S&OP implementasyonu bitince, ERP MRP daha da iyi çalışacaktır (Wallace, 1999). Çünkü S&OP ile, talep ve tedarik kısmı, ürün ailesi seviyesinde dengelemiş olacaktır.
2.5. Yükselen Trend: S&OP 2.0 (Entegre İş Planlaması)
Entegre İş Planlaması (IBP; Integrated Business Planning; Advanced S&OP) ise, yönetim ekibinin kuruluşun tüm işlevleri arasında odaklanmasını ve uyum sağlamasını sağlayan entegre bir iş yönetimi sürecidir (Palmatier, 2011).

Journal of Management, Marketing and Logistics -JMML (2017), Vol.4(2), p.76-88 Kocaoglu
_________________________________________________________________________________________________
DOI: 10.17261/Pressacademia.2017. 453 80
Tablo 1: Geleneksel S&OP ve Entegre İş Planlama Süreci (Viswanathan(b), 2009)
Alan S&OP 1.0 Entegre İş Planlama (S&OP 2.0)
İş Hedefi. Tedarik / talep dengelemesi
Sadece talebi eşleştirmek ve müşteri ihtiyaçlarını karşılamakla kalmaz. Birkaç plan alternatifi üzerinde düşünür ve iş yönlendiricilerini en iyi temsil eden birini seçer. Hedef, gelir ve kârdır.
Süreç Sert ve kuralcı Kurallar ve istisna esaslıdır
Teknoloji Zayıf ve entegre değil
Süreçleri iş akışları ile etkinleştirir(enables)
Sıklık Aylık veya üç aylık Birçok durumda aylıktır, ancak istisna durumlarını hızlı bir şekilde işleme yeteneği bulunur. Piyasa olaylarına, gerçek zamanlı ayarlamalara odaklanır
Kapsam İşletme odaklı Çapraz fonksiyonel ve müşteri odaklıdır
IBP üst yönetim tarafından koordine edilen bir süreçtir. Talep, tedarik, yeni ürün geliştirme, stratejik projeler ve finansal planlar ile sonuçlanması için, zaman-fazlı projeksiyonları revize edilir. Aylık bazda, 24 aylık bir zaman ufku için yapılır (Wallace, 1999). S&OP girişimleri, bir şirketin maliyet azaltma, gelir artırma, müşteri hizmetleri ve ürün farklılaştırması gibi ticari hedeflerini gerçekleştirmesine olanak tanımaktadır. Entegre İş Planlaması (S&OP 2.0) sürecin gelişmiş bir şeklidir. S&OP 1.0 ile S&OP 2.0 arasındaki en önemli farklar, Tablo 1'de gösterilmektedir.
2.6. S&OP Sürecindeki Firmaların Durumu
APICS’in yaptığı çalışmada, firmalarda S&OP’nin olgunluğunu keşfetmek için bir anket hazırlanmıştır. Ankette katılımcılardan, S&OP hakkında görüşleri alınmıştır. Rasgele seçilen yaklaşık 15.000 tedarik zinciri ve operasyon yönetimi uzmanı davet edilmiştir. S&OP'nin olgunluk seviyesi, kuruluşlar arasında değişmektedir. Katılımcılardan, çalıştıkları kuruluşu, en iyi tanımlayan ifadeyi seçmeleri istenmiştir (APICS, 2011).
Şekil 4: Firmaların S&OP’deki Olgunluk Durumu (APICS, 2011)
Bu çalışma sonucunda, Şekil 4’teki grafik oluşmuştur. Firmaların yarısına yakınının, konunun önemi hakkında bilgisi olduğu görülmektedir. Bu şekil, bize olgunluk seviyesi durumu hakkında bir fikir vermektedir. Peki bu olgunluk durumunu nasıl hesaplarız? Genelde çalışmalara baktığımızda, daha çok yöneticilerin kendi firmalarını hangi seviyede gördüğü üzerine odaklanıldığı görülmektedir.
3. VERİ VE METODOLOJİ
3.1. Çalışmanın Akışı
Giriş bilgileri verildikten sonra, problem tanımı yapılmıştır. S&OP konusunun, firmalar için oldukça önemli olduğu araştırmalarda vurgulanmasına rağmen, ilgili kaynak ve literatür çok kısıtlıdır. Bu çalışmada, özellikle S&OP “olgunluk modeli” konusu ile ilgili literatür araştırması yapılmıştır. Yapılan araştırma sonucu, konsolide bir olgunluk modeli ortaya çıkarılmış ve bir etkinlik soru listesi ile beraber sunulmuştur. Ortaya çıkan bu çalışma ile, Türkçe literatüre katkı sağlanması amaçlanmıştır. Çalışma akışı aşağıdaki şekilde özetlenmiştir.

Journal of Management, Marketing and Logistics -JMML (2017), Vol.4(2), p.76-88 Kocaoglu
_________________________________________________________________________________________________
DOI: 10.17261/Pressacademia.2017. 453 81
Şekil 5: Çalışmanın Akışı
3.2. Problem Tanımı
İlk olarak, firmalarda S&OP’nin uygulanmaması durumundaki duruma dikkat çekmek gereklidir. Uygulamada, firma seviyesinde, genel görünümünü yakalamada sorunlar göze çarpmaktadır. Bu sorunların bazıları: Departmanların kendi farklı bakış açıları; Excel’de birbirinden bağımsız yapılan planlar; Bunların konsolide edilmesi zorluğu gibi. Çoğu firmada, bir entegre planlama altyapısı bulunmamaktadır. Bunun yarattığı sorunlar ise: Bir departmanın kararının, diğerlerine etkisini anlayamamak; Bilgiye yavaş erişim, geciken kararlar; Finans ve müşterinin güvenemediği tahminler; Bütçe döneminde kabullerin sorgulanmaması ve görüşlerin güncellenmemesi, gözden geçirilmemesi; Üst yönetime gelir, kar ve stok seviyeleri ile ilgili gösterecek bilgi ve kabulleri gösteren, finansal bir bakışın olmaması gibi sayılabilir (Wallace, 1999).
S&OP üst düzey bir karar verme sürecidir. Doğru kullanılırsa, çok iyi bir araçtır. Önde gelen firmalar yol almış durumdadır. Günümüzde tedarik zinciri planlaması, giderek daha karmaşık tedarik ağları ve ürün portföyleri nedeniyle, üretim firmaları için zor bir görev haline gelmiştir. Şu anda, iş planlaması ve satış ve operasyon planlaması gibi fikir birliği süreçlerinde, çapraz işlevsel uyumun öneminin vurgulanması eğilimi vardır. Elbaum, şirketin S&OP olgunluk seviyesi ile, şirketin genel performansı arasında bir korelasyon bulunduğunu ve bu da kuruluşların S&OP olgunluğu için çaba sarf etmeye yönelik açık bir teşvik anlamına geldiğini iddia etmektedir (Elbaum, 2004).
Genel olarak, literatür S&OP’nin, geleneksel ayrıştırılmış planlamadan daha üstün olduğu sonucuna varmaktadır. Ancak, S&OP'nin kavramı ve potansiyel faydaları anlaşılması kolay olmasına rağmen, gerçekte operasyonel alanda gerçekleştirmek işletmelere zor gelmektedir (Grimson & Pyke, 2007). Buradaki konular öncellikle;
1) farkındalığın olması,
2) ardından uygulamaya başlamak ve implementasyon,
3) daha sonrasında bu işin neresindeyiz, yani durum ölçümü olmalıdır.
Durum ölçümü için de, bir ölçüm yöntemi ihtiyacı ortaya çıkmaktadır. Bu amaca uygun, bir olgunluk modeli kullanımı gereksinimi ortaya çıkmaktadır. Literatürde az sayıda önerilen S&OP implementasyon çerçevesi ve olgunluk modeli bulunmaktadır. Olgunluk düzeyleri bileşenleri, öncelikleri açısından farklılık göstermektedir. Dahası, yöneticiler için yeterli bilgi sunacak kadar net ve anlaşılır değildir. Olgunluk durumu çalışmalarına baktığımızda, daha çok yöneticilerin kendi firmalarını hangi seviyede gördüğü üzerine odaklanıldığı görülmektedir. Burada iki soru irdelenmelidir:
a) ortak ve kombine bir olgunluk modeli ,
b) olgunluk modeli seviyesini adresleyecek bir kontrol listesi.
3.3. Araştırma Soruları ve Yöntem
Bu araştırmanın amacını gerçekleştirmek için, ana araştırma soruları, doğrudan araştırma hedefine karşılık gelecek şekilde aşağıda formüle edilmiştir:
-S&OP olgunluk modelinin aşamaları nelerdir?
-Firmanın hangi aşamada olduğunu saptamak için, ne tip bir araç kullanabiliriz?
Bu amaçla literatür araştırması yapılıp, elde edilenler sentezlenmiştir. Bu konuda yapılan araştırmalar incelenerek, kavramlar akademik ve uygulayıcı bakış açısıyla harmanlanmıştır. Güncel araştırma raporları ve uzman makaleleri incelenmiştir.
Yöntem
Problem tanımı
-Etkin olmayan sistemler -Dağınık olgunluk modelleri
-Ölçümlenemeyen etkinlik
Literatür eksikliği
Literatür araştırması
Çözümler, Bulgular
S&OP Olgunluk Modeli
Etkinlik Kontrol Listesi Uzman görüşü
Giriş
Kavramlar
Sonuç Öneriler

Journal of Management, Marketing and Logistics -JMML (2017), Vol.4(2), p.76-88 Kocaoglu
_________________________________________________________________________________________________
DOI: 10.17261/Pressacademia.2017. 453 82
4. BULGULAR
4.1. Literatürdeki Durum: S&OP Olgunluk Modeli
S&OP konusu ile ilgili, fazla sayıda akademik kaynak bulunmamaktadır. Daha çok, danışmanlık firmalarının hazırladıkları raporlar ve az sayıda yabancı tez karşımıza çıkmaktadır. “Google” arama motorunda Türkçe -S&OP olgunluk modeli- anahtar kelime dizisi ile arama yapılmış, gelen 24 sayfa incelenmiştir. Arama sonucu gelen sayfalar akademik yayın olmayıp, içeriklerinde ise sadece genel S&OP kavramından kısaca bahsedilmiştir. Bir olgunluk seviyesi açıklaması bulunmamaktadır (Google, 2017). Bu durum, bu alanda Türkçe yayınların eksiği ortaya çıkmaktadır. Yabancı kaynaklar da taranmıştır. “Web Of Science” arama motorunda ise, -S&OP maturity model- kelime dizisi ile arama yapıldığında, yine az sayıda, 3 adet yabancı yayın (Wagner, Ullrich, & Transchel, 2014) (Goh & Eldridge, 2015) (Thome, Marcio, Scavarda, Fernandez, & Scavarda(b), 2012) karşımıza çıkmıştır (Web Of Science, 2017). Direkt S&OP olgunluk modelini inceleyen, yabancı akademik kaynak sayısı da oldukça sınırlı diyebiliriz. Bu çalışmada, danışmanlık firmalarının raporlarındaki modeller ve çerçeveler de sentezlenerek, literatür taramasından türetilen bilgilerle zenginleştirilmiştir. Olgunluk modeli seçenekleri benzerlikleri ve farkları ortaya çıkarılmaya çalışılmıştır.
İlk S&OP olgunluk modeli çalışmaları, belli bir sürece odaklanmıştır. Wing & Perry, 3 aşamalı bir model sunmuştur ve BT (Bilgi Teknolojisi) sistemlerine odaklanmıştır. 1.safha, en azından BT çözümlerinin organizasyon içinde a entegre bulunmasıdır. Safha 2 ve 3’e ilerledikçe tedarikçi ve müşterilerle işbirliği dahil olmaktadır. Yapı, sadece BT sistem desteği açısından bakmaktadır. Model, yazarın deneyimine dayanmakta ve emprik bir dayanak bulunmamaktadır (Wing & Perry, 2001).
Aberdeen Research firmasının 2004 yılındaki raporunda, farklı bir olgunluk modeli özetlemiştir (Elbaum, 2004). Bu, S&OP konusu ile ilgili 200’den fazla firmanın katıldığı bir anket çalışmasıdır. 3 safha vardır: 1-Ağır kalanlar; 2-Sektör ortalamasında olanlar; 3-Sınıfının en iyisi olanlar. Anket öz-değerlendirmeye(self-assesment) dayanmaktadır. Katılımcılardan, istenen 6 adet KPI(anahtar performans göstegesi) değeri için, formülasyonları verilmemiştir. Bu yüzden yoruma ve tutarsızlığa açıktır.
Diğer bir çalışmada (Lapide, 2005) ise, 4 safhalı bir model önerilmiştir. 4. Safha en ideal süreçtir. 4. Safha gerçekte ulaşılması zordur ve benchmark için amaç olmalıdır. 1-Marjinal; 2-Basit; 3-Klasik; 4-İdeal. İşletmeler, dağınık toplantılar, talebe bağlı olmayan planın ayrılması ve e-tabloların “çokluğu” ile başlar. Olay güdümlü toplantılar; Müşteriler ve tedarikçilerle uyumlu entegre planlama; İç BT sistemleri ile entegre gelişmiş S&OP yazılımını kullanımı gibi olaylar ile kademeli olarak hareket eder. 3 kategorisi vardır: a) Toplantılar, b) Süreçler; c) Teknoloji desteği. Yazar uygulama alanında kariyeri olsa da, pek çok akademik çalışmaya referans olmuştur. Model, yazarın profesyonel deneyimine dayanmıştır.
Ventana Research firmasının çalışmasında (Ventana Research, 2006), firmalar 4 safhalı bir model ile değerlendirilmiştir: 1-Taktiksel; 2-Gelişmiş; 3-Stratejik; 4-İnovatif. İlk aşamada planlama, arz ve talebi dengelemeye odaklanmaktadır. Gelişmiş aşamada, formal planlama ve inceleme toplantıları başlatılır. S&OP, operasyonel planlamayı kurumsal stratejik hedeflerle uyumlu hale getirmek için S&OP’yi kullandığında stratejik aşamaya ilerlemektedir. Performans yönetimi ve teşvikleri S&OP süreci ile uyumlu hale getirildiğinde, tamamen yenilikçi aşamada tam olgunluğa erişir. Dikkat çektikleri diğer konu, ne yazık ki, çoğu firmanın S&OP'nin tüm avantajlarından yararlanmadığıdır. Genellikle, eksik bazı parçalar vardır - ve bunlar yazılımdan daha fazlasını içermektedir. Ayrıca şirketler tarafından ele alınması gereken sorunlu başlıklar: a)İnsan, b)Süreç, c)Teknoloji ve d)Performans yönetimi olarak belirtilmiştir.
Grimson & Pyke’ın çalışması (Grimson & Pyke, 2007), akademik bir dergide yayınlamıştır. (Lapide, 2005) ve (Elbaum, 2004)’un çalışmalarını temel alarak bir olgunluk yapısı oluşturmuş ve farklı sektörlerden 15 firma ile test etmişlerdir. Sonuçtaki yapı 5 safhalıdır: 1-S&OP yok; 2-Reaktif(Tepki gösteren); 3-Standart; 4-Gelişmiş; 5.Proaktif(İnsiyatif sahibi) dir. Proaktif aşamada planlar ve yazılımlar, firmaya tamamen müşterek ve tedarikçilerle entegre edilmiştir. Bu aşamada, süreç verimliliği en iyi düzeye getirmeyi amaçlar ve performans ölçülür ve buna göre ödüllendirilir. Ara aşamalar reaktif, standart ve gelişmiş düzeydedir. Formal bir S&OP yapısı güçlendirilmiştir; Resmi toplantılar ve entegre yazılım bu ara aşamalarda oluşturulmuştur. Finansal fonksiyon, yeni ürün tanıtımı ve kısıtlı planlar S&OP kademelerine aşamalı olarak entegre edilmiştir. Organizasyonların kendisini değerlendirmesi için, her safhada 5 kategori sunmaktadır: a) Toplantılar & İşbirliği, b)Organizasyon, c)Ölçümler, d)BT, e)S&OP Plan Entegrasyonu. Her boyut, her safha için kriter içermektedir. Yazar, çalışmanın yapıldığı yılda, hiçbir firmanın 5. safhada yer almadığını belirmiştir.
Feng & D’amours, 2008 çalışmasında nümerik bir simülasyon çalışması yapmıştır. 3 farklı planı kıyaslamıştır: 1-Ayrık planlar; 2- Kısmi entegre planlar; 3. Tam entegre planlar. Bu 3 tip planlama yapısına uygunluk durumuna göre, olgunluk safhası değerlendirilmektedir. Vaka çalışması MTO (stoğa üretim) çalışan bir fabrikada yapılmıştır.
Aberdeen Research danışmanlık firmasının 2009 yılındaki raporunda (Viswanathan(b), 2009), Elbaum gibi geniş bir anket çalışması ve aynı 3 kategori söz konusu olmuştur (1-Ağır kalanlar; 2-Sektör ortalamasında olanlar; 3-Sınıfının en iyi olanlar). Ama farklı olarak, bu çalışmada 3 adet KPI söz konusudur: 1.Müşteri hizmet seviyesi, 2.Ortalama nakit çevrim süresi, 3.

Journal of Management, Marketing and Logistics -JMML (2017), Vol.4(2), p.76-88 Kocaoglu
_________________________________________________________________________________________________
DOI: 10.17261/Pressacademia.2017. 453 83
Ortalama tahmin tutarlılığı. Sonuçta cevaplayanların %18’i sınıfının en iyisi, %54’ü sektör ortalamasında, %28’i ağır kalan çıkmıştır. Elbaum’un çalışmasındaki gibi, net bir öz değerlendirme açıklaması yapılmamıştır. Safhalar arası boşluklar çok geniştir. Olgunluk seviyesini belirlemek için kullanılan KPI’lar arası bağlantı net değildir.
AMR Research danışmanlık firmasının 2009 yılındaki raporunda, 5 yıllık bir çalışma temel alınmıştır (Cecere, Barrett, & Mooraj, 2009). 80 firma ve S&OP danışmanları ile görüşmeler yapılmıştır. Olgunluk modeli 4 safha içermektedir: 1-Tepki gösteren: fonksiyonel, operasyonel seviye; 2-Ön gören: tedarik zinciri yönelimli, entegre operasyonel seviyede plan; 3-İş birliği yapan: iş yönelimli, finans tabanlı, senaryo tabanlı, yürütme ile ilişkili; 4-Orkestra şefi: değer zinciri yönelimli, kar tabanlı, strateji ile güçlü ilişkilendirilmiş. Bunlar 4 kategori temeli üzerindedir: a)S&OP dengesi, b)Hedef, c)Sahibiyet, d)Metrikler. Firmaların %67’sinin, Safha 1 veya 2 de bulunduğunu açıklamışlardır. Araçlardan ERP/APO/Excel’in yetersiz kaldığı, olgunluk seviyesi arttıkça amaca odaklı S&OP araçlarının gerekliliği vurgulanmıştır.
Aberdeen Research firması 2010 yılında, 196 firmayı kapsayan, olgunluk sınıfı çerçevesini oluşturmak üzere bir çalışma yayınlamıştır. Bu çalışmada yine seviyeler: 1-Ağır kalanlar; 2-Sektör ortalamasında olanlar; 3-Sınıfının en iyisi olanlar şeklindedir. Firmaları performans açısından gruplamak için 4 adet KPI kullanmıştır: 1)Tahmin doğruluğu (ürün ailesi düzeyinde ortalama tahmini doğruluk), 2)Müşterilere teslim edilen mükemmel siparişler (tam ve zamanında), 3)Ödemeden-nakite çevrim süresi (bir tedarikçiye ödediğimiz andan bir müşteriden nakit toplamak zamanımıza kadar olan süre), 4)Brüt kar marjında değişim (yüzde olarak) (Viswanathan, 2010).
Nexview Consulting firmasının tanıttığı yapıda (Tinker, 2011), safhalar: 0-Gecikmiş (S&OP yok); 1-Temel; 2-Fonksiyonel; 3-Olgunlaşan; 4-Liderlik eden şeklinde sıralamıştır. Burada ilaveten 5 boyuttan bahsedilmiştir: a) Dizayn, b)Teknoloji, c) İçerik, d) Davranışlar, e) Sonuçlar.
Akademik bir dergide yayınlanan 2012 yılındaki çalışmada S&OP üzerine bir literatür çalışması yapılmıştır (Thome, Marcio, Scavarda, Fernandez, & Scavarda(b), 2012).
2013 yılında yine Aberdeen Grup firması tarafından, daha geniş bir anket sonucu, bir çalışma daha yayınlanmıştır (Ball, 2013). Bu arada (Elbaum, 2004) ve (Viswanathan(b), 2009) çalışmalarındaki aynı 3 safha kullanılmıştır: 1-Ağır kalanlar; 2-Sektör ortalamasında olanlar; 3-Sınıfının en iyisi olanlar. Ayrıca (Viswanathan(b), 2009) ile aynı KPI’lar kullanılmıştır.
Gartner firması, şu an AMR Research firmasını almıştır. Gartner, bu modeli yeni versiyonu ile değiştirmiştir. (Tohamy, Tarafdar, Kohler, & Pukkila, 2013). 5 safha yer almaktadır: 1-Tepki gösteren; 2-Öngören; 3-Entegre; 4-İş birliği yapan; 5-Orkestra Şefi. İlaveten yeni model, 6 alt kategori içermektedir.
ICT firmasının 2013 yılındaki çalışmasında, 5 Olgunluk seviyesi bulunmaktadır (Veronesi, 2013): 1-S&OP yok: Süreç formal değildir ve insanların deneyimlerine ve bir dizi elektronik tabloya dayanır. 2-Temel: Süreç temelinde, aylık ya da az sıklıkta yapılan formal bir executive S&OP yürütme toplantısı aracılığıyla yürütülür. 3-Entegre: Süreç, bir dizi hazırlık toplantısı ve resmi bir aylık S&OP Executive toplantısı tarafından desteklenmektedir. Toplantılar, farklı kaynaklardan ve BT araçlarından alınan bilgilerle hazırlanır: satış, pazarlama, üretim ve finans. 4-Genişletilmiş; 5- İleri seviye: Süreç, şirketin dört duvarının ötesine uzanan, tedarikçilerden ve müşterilerden talep ve arz sinyallerini toplayan, işbirliğini zorlayan ortak bir süreçtir. Bu 5 olgunluk seviyesi ise, 4 temel faktöre dayandırmıştır: 1. S&OP’nin iş performansındaki etkisi (yüksek performans, yüksek olgunluk demek), 2. S&OP süreç takvimi (firmaları S&OP sürecini ne kadar sıklıkta planladıklarına bakar. Yüksek saat, yüksek olgunluktur), 3. Destekçi BT aracı (spesifik bir S&OP uygulaması mı yoksa, pek çok uygulama mı, ayrık tablolar mı olduğuna bakar. Yüksek değer, yüksek olgunluktur). 4. S&OP veri toplama ve planlama süresi (S&OP için gerekli verileri toplamak için harcanan süre ve konsensüsü plan oluşturmak için geçen süredir. Düşük bir planlama çevrim süresi, yüksek olgunluktur) (Veronesi, 2013)
2014 yılında yapılan diğer bir çalışmada (Wagner, Ullrich, & Transchel, 2014), kapsamlı bir S&OP olgunluk modeli geliştirmek için, görüşme verileri kullanılmıştır. Seviyeler: 0-Gelişmemiş: hiçbir planlama işlemi olmayan ve gelen emirleri reaktif bir şekilde karşılamaya çalışan şirketlere verilir; 1-Temel Düzey; 2-Reaktif; 3-Tutarlı; 4-Entegre; 5-Proaktif’tir. Seviye 5, öngörülebilir bir gelecekte bir organizasyonun elde edebileceği en üst düzeydir. Seviye 4’e kadar, süreç performansı firmanın iç kesiminde artmaktadır; 5. Seviyede organizasyonlar, işbirliği ve uyum çabalarını genişletir. Görüşme verileri çözümlenerek, firmaların olgunluk seviyelerini değerlendirmek için dört boyut belirlenmiştir. a)Süreç Etkinliği: formallik derecesi, kapsam, işbirliği, b)Süreç Verimliliği: enformasyon hazırlama ve paylaşımı, toplantı verimliliği, KPI’lar ölçütler, c) İnsan ve Organizasyon: roller sorumluluklar ve organizasyon yapısı, bilgi uzlaşma ve üst yönetim sponsorluğu, d) Bilgi Teknolojileri: sistem ve fonksiyonları, entegrasyon derecesi, ana veri(master data).
Yapılan diğer bir çalışmada BT odaklı kategoriler karşımıza çıkmaktadır. Bunlar: 1-Excel tabanlı planlama: Temel MRP &Geleneksel yazılımlar; 2-Excel& Finansal planlama çözümleri: Standart ERP, Veri ambarı; 3-APS çözümleri +Finansal Planlama Çözümleri + Standart ERP+ BI/Excel; 4-Gelişmiş Senaryo Planlama Çözümleri. Çoğu firmanın 2. İle 3. Safha arasında olduğunu belirtilmektedir (Cecere(b) & Chimni, 2014).

Journal of Management, Marketing and Logistics -JMML (2017), Vol.4(2), p.76-88 Kocaoglu
_________________________________________________________________________________________________
DOI: 10.17261/Pressacademia.2017. 453 84
Bu araştırmanın sonuçları doğrultusundaki aşağıdaki öneriler ortaya çıkmıştır.
4.2. S&OP’de Denetleme ve Önerilen Tablo: S&OP Etkinlik Kontrol Listesi
S&OP implementasyonu ve sürekli gelişimi için, S&OP’nin etkinliğini ölçmek gereklidir (Grimson & Pyke, 2007) (Lapide, 2005). Ölçütler KPI’ler Adım 1'de yer almalı ve sonraki adımlarda gözden geçirilmelidir. Tedbirler, endüstri, süreç ve ürün grubuna göre değişebilir. Sheldon metriklerin, sürecin başarısı ve yönetimi için en önemli etkenlerinden biri olduğunu iddia etmektedir (Sheldon, 2006). Metriklerden bazıları: İş planlama tutarlılığı, talep planlama tutarlılığı ve operasyon tutarlılığı.
Lapide (2004) şu gibi metrikleri önermektedir; Temel tahminlerden ve bütçeden sapma, aynı şekilde satış, pazarlama ve operasyon planlarına uyum. Ayrıca, sırasıyla arz ve arz tarafı performansının normal metrikleri de geçerli olabilir. Operasyonlar için yaygın olarak kullanılan metrik örnekleri: Eldeki envanter, eskimiş envanter, stok çıkışı, kalite ve kapasite kullanımı. Satış ve pazarlamaya ilişkin bazı metrikler: Üst düzey satış büyümesi, pazar payı, tahmin tutarlılığı ve baz tahminden sapma gibi (Grimson & Pyke, 2007). S&OP sürecinin iyileştirilmesini sağlamak için, S&OP süreci için ilgili metrikleri ve arzu edilen değeri tanımlamak çok önemlidir. Metrikler, planlama sistemi tasarımına dayalı olarak farklı şirketler arasında farklılık gösterebilir.
Firmalar için önemli bir sorun, kurulan S&OP sisteminin denetlenmesi ve sürekli iyileşmenin sağlanmasıdır. Bunun için belli dönemlerde denetimler yapılmalıdır. İlaveten olgunluk seviyesini tespit etmek için de, formal bazı soruların kullanılması yardımcı olabilir. Literatüre baktığımızda belirsiz kalan şey, olgunluk seviyesini veya etkinliği belirleyen soruların net olmayışıdır. Daha farklı şekilde; S&OP efficiency list, World class checklist, Assessment checklist, Process adherence checklist gibi kelime gruplarıyla arama yapıldığında, az sayıda soru listesi kaynağına ulaşmak mümkün olabilmektedir.
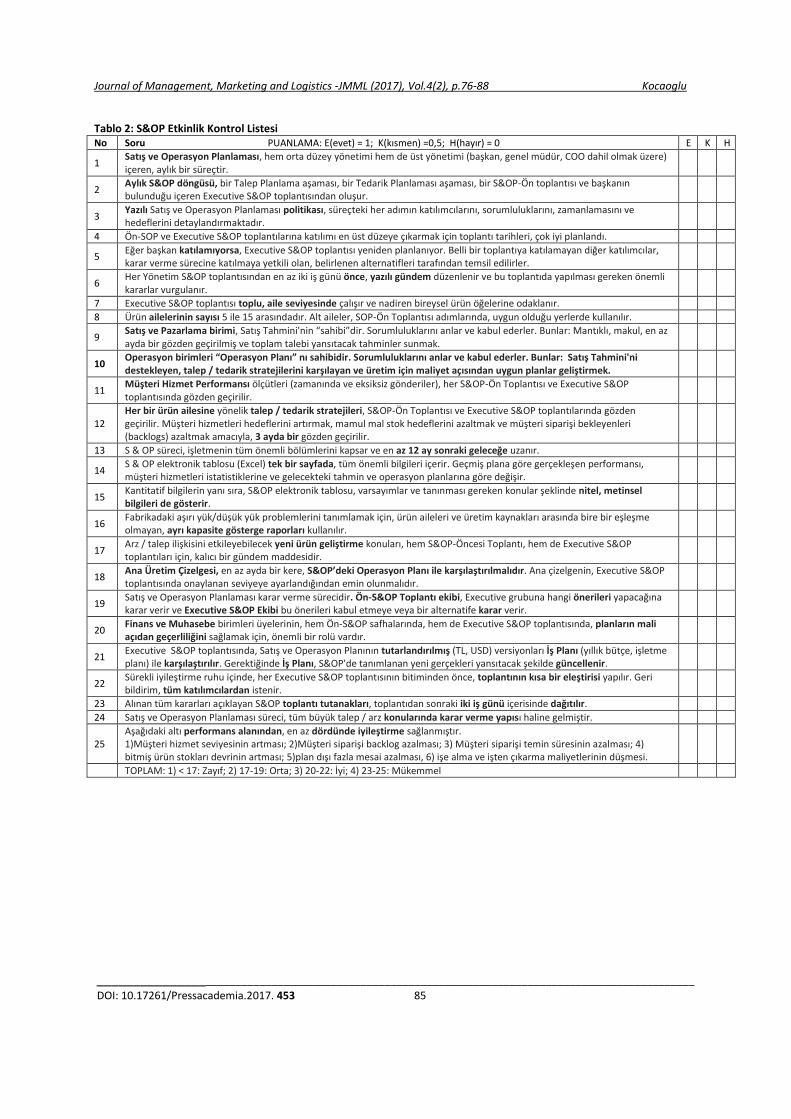
Olgunluk seviyesinin belirlenmesinde yardımcı olmak amacıyla, bu çalışmada (Wallace, 1999) tarafından hazırlanan çalışma uyarlanarak, Türkçeleştirilerek Tablo 2’de sunulmuştur. Bu süreçte ilerleyecek araştırmacılar ve uygulayıcılar için uygun bir başlangıç noktası olabilir. Elde edilen toplam puana göre bir gruplama yapılabilir. Yukarıdaki tablo esas alınarak, sorulara ağırlık verilebilir. Bu şekilde ağırlıklı bir puanlama elde edilecek çalışma da yapılabilir.
Journal of Management, Marketing and Logistics -JMML (2017), Vol.4(2), p.76-88 Kocaoglu
_________________________________________________________________________________________________
DOI: 10.17261/Pressacademia.2017. 453 85
Tablo 2: S&OP Etkinlik Kontrol Listesi No Soru PUANLAMA: E(evet) = 1; K(kısmen) =0,5; H(hayır) = 0 E K H
1 Satış ve Operasyon Planlaması, hem orta düzey yönetimi hem de üst yönetimi (başkan, genel müdür, COO dahil olmak üzere) içeren, aylık bir süreçtir.
2 Aylık S&OP döngüsü, bir Talep Planlama aşaması, bir Tedarik Planlaması aşaması, bir S&OP-Ön toplantısı ve başkanın bulunduğu içeren Executive S&OP toplantısından oluşur.
3 Yazılı Satış ve Operasyon Planlaması politikası, süreçteki her adımın katılımcılarını, sorumluluklarını, zamanlamasını ve hedeflerini detaylandırmaktadır.
4 Ön-SOP ve Executive S&OP toplantılarına katılımı en üst düzeye çıkarmak için toplantı tarihleri, çok iyi planlandı.
5 Eğer başkan katılamıyorsa, Executive S&OP toplantısı yeniden planlanıyor. Belli bir toplantıya katılamayan diğer katılımcılar, karar verme sürecine katılmaya yetkili olan, belirlenen alternatifleri tarafından temsil edilirler.
6 Her Yönetim S&OP toplantısından en az iki iş günü önce, yazılı gündem düzenlenir ve bu toplantıda yapılması gereken önemli kararlar vurgulanır.
7 Executive S&OP toplantısı toplu, aile seviyesinde çalışır ve nadiren bireysel ürün öğelerine odaklanır.
8 Ürün ailelerinin sayısı 5 ile 15 arasındadır. Alt aileler, SOP-Ön Toplantısı adımlarında, uygun olduğu yerlerde kullanılır.
9 Satış ve Pazarlama birimi, Satış Tahmini'nin “sahibi”dir. Sorumluluklarını anlar ve kabul ederler. Bunlar: Mantıklı, makul, en az ayda bir gözden geçirilmiş ve toplam talebi yansıtacak tahminler sunmak.
10 Operasyon birimleri “Operasyon Planı” nı sahibidir. Sorumluluklarını anlar ve kabul ederler. Bunlar: Satış Tahmini'ni destekleyen, talep / tedarik stratejilerini karşılayan ve üretim için maliyet açısından uygun planlar geliştirmek.
11 Müşteri Hizmet Performansı ölçütleri (zamanında ve eksiksiz gönderiler), her S&OP-Ön Toplantısı ve Executive S&OP toplantısında gözden geçirilir.
12 Her bir ürün ailesine yönelik talep / tedarik stratejileri, S&OP-Ön Toplantısı ve Executive S&OP toplantılarında gözden geçirilir. Müşteri hizmetleri hedeflerini artırmak, mamul mal stok hedeflerini azaltmak ve müşteri siparişi bekleyenleri (backlogs) azaltmak amacıyla, 3 ayda bir gözden geçirilir.
13 S & OP süreci, işletmenin tüm önemli bölümlerini kapsar ve en az 12 ay sonraki geleceğe uzanır.
14 S & OP elektronik tablosu (Excel) tek bir sayfada, tüm önemli bilgileri içerir. Geçmiş plana göre gerçekleşen performansı, müşteri hizmetleri istatistiklerine ve gelecekteki tahmin ve operasyon planlarına göre değişir.
15 Kantitatif bilgilerin yanı sıra, S&OP elektronik tablosu, varsayımlar ve tanınması gereken konular şeklinde nitel, metinsel bilgileri de gösterir.
16 Fabrikadaki aşırı yük/düşük yük problemlerini tanımlamak için, ürün aileleri ve üretim kaynakları arasında bire bir eşleşme olmayan, ayrı kapasite gösterge raporları kullanılır.
17 Arz / talep ilişkisini etkileyebilecek yeni ürün geliştirme konuları, hem S&OP-Öncesi Toplantı, hem de Executive S&OP toplantıları için, kalıcı bir gündem maddesidir.
18 Ana Üretim Çizelgesi, en az ayda bir kere, S&OP’deki Operasyon Planı ile karşılaştırılmalıdır. Ana çizelgenin, Executive S&OP toplantısında onaylanan seviyeye ayarlandığından emin olunmalıdır.
19 Satış ve Operasyon Planlaması karar verme sürecidir. Ön-S&OP Toplantı ekibi, Executive grubuna hangi önerileri yapacağına karar verir ve Executive S&OP Ekibi bu önerileri kabul etmeye veya bir alternatife karar verir.
20 Finans ve Muhasebe birimleri üyelerinin, hem Ön-S&OP safhalarında, hem de Executive S&OP toplantısında, planların mali açıdan geçerliliğini sağlamak için, önemli bir rolü vardır.
21 Executive S&OP toplantısında, Satış ve Operasyon Planının tutarlandırılmış (TL, USD) versiyonları İş Planı (yıllık bütçe, işletme planı) ile karşılaştırılır. Gerektiğinde İş Planı, S&OP'de tanımlanan yeni gerçekleri yansıtacak şekilde güncellenir.
22 Sürekli iyileştirme ruhu içinde, her Executive S&OP toplantısının bitiminden önce, toplantının kısa bir eleştirisi yapılır. Geri bildirim, tüm katılımcılardan istenir.
23 Alınan tüm kararları açıklayan S&OP toplantı tutanakları, toplantıdan sonraki iki iş günü içerisinde dağıtılır.
24 Satış ve Operasyon Planlaması süreci, tüm büyük talep / arz konularında karar verme yapısı haline gelmiştir.
25 Aşağıdaki altı performans alanından, en az dördünde iyileştirme sağlanmıştır. 1)Müşteri hizmet seviyesinin artması; 2)Müşteri siparişi backlog azalması; 3) Müşteri siparişi temin süresinin azalması; 4) bitmiş ürün stokları devrinin artması; 5)plan dışı fazla mesai azalması, 6) işe alma ve işten çıkarma maliyetlerinin düşmesi.
TOPLAM: 1) < 17: Zayıf; 2) 17-19: Orta; 3) 20-22: İyi; 4) 23-25: Mükemmel

Journal of Management, Marketing and Logistics -JMML (2017), Vol.4(2), p.76-88 Kocaoglu
_________________________________________________________________________________________________
DOI: 10.17261/Pressacademia.2017. 453 86
4.3. Olgunluk Modeli Önerisi
Aşağıda diğer çalışmalar ve ihtiyaçlar göz önüne alınarak, bir olgunluk modeli önerisi özetlenmiştir.
Tablo 3: S&OP Olgunluk Modeli
Seviyeler→ 0 1 2 3 4
Boyutlar↓ S&OP yok Reaktif, Temeli var Ortalama, İç Entegre İyi, İdeal İleri
Davranış -Deneyimsel -Tepki gösteren -Ön gören -İş birliği yapan -İşbirliğini yöneten
Yönelim - - -Tedarik zinciri yönelimli
-İş yönelimli -Değer zinciri yönelimli,
Süreç seviye -Formal değil. -Fonksiyonel, operasyonel
-Plan entegre operasyonel
-Finans ve senaryo tabanlı, -Yürütme ile ilişkili;
-Kar tabanlı, -Strateji ile ilişkilendirilmiş
S&OP plan dengesi
-Talebe bağlı olmayan planlar
-Ayrık talep planları -Tedarik planları ile talep planları dengelenmemiş.
-Tedarik ve talep planları dengeli.
-Talep ve tedarik planları uyumlu. -Yeni ürün tanıtımı, bütçe denetlenebilir veriler.
-Talep ve tedarik planları, içte ve dışta dengelidir.
S&OP plan entegrasyonu
- - -Talep planlarında uzlaşma.
-Sınırlı sayıda tedarikçi ve müşteri ile işbirliği.
-Çoğu tedarikçi ve müşteri ile işbirliği, genişleyen uyum
Toplantı & S&OP süreci
-Informal. -Yok. -Üç ayda bir veya yıllık, dağınık
-Formal -Executive toplantı. -3 ayda 1 -Düzenli takvim. -Katılım düzensiz.
-Formal. -Ön toplantılar. -Executive Toplantı -Aylık -Katılım %100
-Olay-yönelimli toplantılar. Bir dengesizlik tespiti veya değişiklik istediğinde gerçekleşir. -Aylık
-Aylık veya haftalık
BT
-BT desteği yok -tamamen manuel süreç -e-tablolar “çok”
-Ayrı talep planlama ve ayrı fabrika APS yazılımları.
-Birkaç ayrı uygulama -Talep planlama ve tedarik planlama uygulamaları entegre.
-Biriktirerek toplu işlemler -Entegre bir S&OP BT uygulaması
-S&OP optimizasyon yazılımı ile entegre -ERP, muhasebe ve tahminleme yazılımlarıyla tam entegre arayüz
Veri toplama ve planlama süresi
- -Çok sayıda tabloyu manuel konsolidasyon
-Dış enformasyon, sürece manuel getiriliyor.
-İç talep&tedarik plan ve yazılımları, dış işbirlikçi müşteri&tedarikçi yazımlarıyla entegre
-Gerçek zamanlı, denetlenebilir veriler. -Müşteri talep ve arz sinyallerini toplar
BT Aracı -Farklı tablolar
-Sadece çalışma tabloları -Excel tabanlı planlama: Temel MRP &Geleneksel yazılımlar
-Excel& Finansal planlama çözümleri: Standart ERP, Veri ambarı
-İleri seviye bir S&OP platformu. -APS çözümleri + Finansal Planlama Çözümleri + Standart ERP+ BI/Excel
-Gelişmiş senaryo planlama çözümleri
KPI’lara etkisi -Yetersiz etki -Etkisi sınırlı -Etkisi iyi -Etkisi çok iyi -Etkisi mükemmel
Metrikler (tüm safhalar)
-Yok
1) Operasyon planlarının, satış planlarını ne ölçüde karşıladığı (ürün ailesi düzeyinde); 2)Müşteri hizmet seviyesinin artması; 3)Müşterilere teslim edilen mükemmel siparişler (tam ve zamanında); 4)Müşteri sipariş backlog azalması; 5) Müşteri siparişi temin süresinin azalması; 6) bitmiş ürün stokları devrinin artması; 7) Plan dışı fazla mesai azalması; 8) İşe alma ve işten çıkarma maliyetlerinin düşmesi; 9)Ödemeden nakite çevrim süresi
Metrikler (safhalarda eklenen +)
- +Satışların, tahminlerin tutarlılığı ile değerlendirilmesi
+Yeni ürün bildirimi +S&OP etkinliği
+Firma karlılığı değişimi %
Performans değerleme
- -Süreç verimliliği amaçlanır, performans ölçülür, ödüllendirilir
-Performans yönetimi ve teşvikler, S&OP süreci ile uyumlu hale getirilir
S&OP’nin bir süreç olduğu göz önüne alındığında, farklı organizasyonların olgunluk düzeyleri farklı olabilir. 3. ve 4. seviyelerdeki firmalar, daha önceki bölümde açıklanan entegre iş planlama uygulaması yapısına daha yatkın denebilir.

Journal of Management, Marketing and Logistics -JMML (2017), Vol.4(2), p.76-88 Kocaoglu
_________________________________________________________________________________________________
DOI: 10.17261/Pressacademia.2017. 453 87
5. SONUÇ
S&OP kavramı, 1970’lerin sonunda ABD’li işletme danışmanı Oliver Wight tarafından birçok firmada alınan dersler ve denemeler sonrasında sektörde tanıtılmıştır. APICS, Operasyon Yönetimi Derneği gibi kuruluşlar, firmalardaki deneyimlerini paylaşmaya başlamış ve böylece süreç gelişmeye devam etmiştir (Sheldon, 2006). S&OP süreci, arz ve talebi dengelemek amacı olan bir iş süreci olarak tanımlanmıştır.
S&OP etkinlik kontrol listesi, bir şirketin S&OP sürecini nasıl geliştirmesi gerektiğini, nerede zayıf olduğunu; S&OP olgunluk modeli S&OP sürecinin mevcut durumunun yanı sıra, uygun bir sonraki iyileştirme adımlarını anlamak için yararlıdır.
Araştırmanın kuvvetli yönleri: Literatürde S&OP olgunluk modeli ilgili yayınlar oldukça az sayıdadır. S&OP araştırmalarındaki literatür, henüz analiz için olgunlaşmamış gibi gözükmektedir. Özellikle S&OP olgunluk seviyesi ile ilgili Türkçe kaynak yok denebilir. Mevcut literatür harmanlanarak başlangıç olması için, bu çalışma ile bir kaynak oluşturulmuştur. Mevcut S&OP modellerinden yola çıkılarak, daha anlaşılabilir toplu bir model önerilmiştir. İlaveten, olgunluk modeli ile kullanılabilecek bir etkinlik değerlendirme kontrol listesi sunulmuştur. Bu da, S&OP sürecinde olan firmalara yol gösterecektir. Ayrıca bu soru listesi, akademik anket ve performans değerlendirme çalışmalarında temel olarak kullanılabilir. Nümerik sonuçlar almaya odaklıdır.
Araştırmanın zayıf yönleri: Olgunluk modelleri ve liste soruları, ağırlıkla danışmanlık firmalarının raporlarına dayanmaktadır. Bu kısım bilimsellik kısmını zayıflatmaktadır. Ama diğer yandan, uygulanabilirlik açısında bir artı değer olarak düşünülebilir. Ve bundan sonraki bilimsel araştırmalara yön gösterebilir.
S&OP süreci yeni bir şey değildir ve bugün büyük ölçekli bazı kuruluşlar bunu yapmaktadır. Bununla birlikte, mevcut S&OP süreçleri için, olgunluk seviyesi değerlendirmesi halen gelişmemiştir ve sonuç olarak iş performansı üzerindeki etkisi incelenmelidir.
Sonraki çalışmalar için öneriler:
- Gelişmekte olan S&OP sürecinin, iş performansı üzerindeki etkisini tam olarak değerlendirmek için, S&OP olgunluk modelinin her bir seviyesi, bir dizi tedarik zinciri metriki ile ölçülebilir. Metrikler ve sektörün kabul ettiği ortalama hedef değerleri tespit edilmeli ve ölçümleme yapılmalı, sonuçlar karşılaştırılmalıdır. Böylece tedarik zinciri KPI değeri ile olgunluk seviyesi uyumu karşılaştırılabilir, yorumlanabilir.
- Bu çalışmalar ile yüksek olgunluk seviyesi durumunda, yüksek toplam tedarik zinciri performans puanı elde edilmesi beklenmedir. Bu durum incelenmelidir. Uygun ve aksi durumların sebepleri irdelenmelidir.
- Elde edilen puan ile kıyaslama yapılabilir. Kıyaslama firmanın farklı dönemleri arasında, diğer zincir şirketleri ile veya sınıfının en iyisi firmalarla yapılabilir.
- S&OP etkinlik ölçüm kontrol listesi geliştirilebilir. Tablodaki, sorulara ağırlık verilebilir. Bu şekilde ağırlıklı bir puanlama elde edilecek çalışma da yapılabilir.
- Ayrıca düşük puan durumunda, eksik açık yönlerin (GAP) giderilmesi için metodolojik öneriler geliştirilebilir. Soru listesi sonuçta, genel toplam bir puan vermektedir. Bunun olgunluk seviyesi ile eşleşmesi veya ağırlıklandırılması yapılabilir.
Bu çalışmada sunulan sonuçlar ve öneriler, hem araştırmacılar hem de uygulayıcılar için geçerlidir.
KAYNAKLAR
APICS. (2011). “2011 Sales and operations planning practices and challenges”, https://www.apics.org/docs/default-source/default-document-library/apics-2011-sales-and-operations-planning-practices-and-challenges.pdf?sfvrsn=2 adresinden alınmıştır
Ball, B. (2013). “S&OP non-negotiable as a process”, Aberdeen Group.
Cecere(b), L., & Chimni, J. (2014). “Changing mental models: The evolution of S&OP”, Kinaxis Inc.: https://www.kinaxis.com/Global/resources/slide-decks/WebcastPresentation-Changing%20Mental%20Models.pdf adresinden alınmıştır
Cecere, L., Barrett, J., & Mooraj, H. (2009). “Sales and operations planning: Transformation from tradition”, AMR Research Report, May 2009. AMR Research Inc.
Elbaum, S. D. (2004).” The sales and operations planning benchmark report: Leveraging S&OP for competitive advantage”, Aberdeen Group.
Feng, Y., & D’amours, S. (2008). “The value of sales and operations planning in oriented strand board industry with make-to-order manufacturing system: Cross functional integration under deterministic demand and spot market recourse”, International Journal of Production Economics, vol. 115, no. 1, pp. 189-209.

Journal of Management, Marketing and Logistics -JMML (2017), Vol.4(2), p.76-88 Kocaoglu
_________________________________________________________________________________________________
DOI: 10.17261/Pressacademia.2017. 453 88
Goh, S. H., & Eldridge, S. (2015). “New product introduction and supplier integration in sales and operations planning evidence from the Asia Pacific region”, International Journal Of Physical Distribution & Logistics Management, vol. 45, no. 9-10, pp. 861-886.
Google. (2017, 02 28). http://www.googgle.com adresinden alınmıştır
Grimson, J. A., & Pyke, D. F. (2007). “Sales and operations planning: An exploratory study and framework”, The International Journal of Logistics Management, vol. 18, no. 3, pp. 322-346.
Lapide, L. (2005). “Sales and operations planning part III: A diagnostic model”, Journal of Business Forecasting, vol. 24, no. 1, pp. 13- 16.
Palmatier, G. (2011). “An executive level synopsis integrated business planning (Advanced sales & operations planning)”, Oliver Wight Americas.
Sheldon, D. (2006). World Class Sales & Operations Planning: A Guide to Successful Implementation and Robust Execution. Ft Lunderdale, FL: J. Ross Publishing.
Thome, T., Marcio, A., Scavarda, L. F., Fernandez, N. S., & Scavarda(b), A. J. (2012). “Sales and operations planning: A research synthesis”, International Journal of Production Economics, vol. 138, no. 1, pp. 1-13.
Tinker, E. J. (2011, 04 12). “Excellence in S&OP : tips and traps when implementing”, Nexview Consulting. APICS North Shore Chapter: http://www.apics-northshore.org/pdm/presentations/Excellence_in_S&OP_Nexview.pdf adresinden alınmıştır
Tohamy, N., Tarafdar, D., Kohler, J., & Pukkila, M. (2013).” Introducing the five-stage sales and operations planning maturity model for supply chain leaders”, Gartner.
Ventana Research. (2006). “Sales and operations planning: measuring maturity and opportunity for operational performance management”, San Mateo, CA, USA.
Veronesi, P. M. (2013). “The journey toward next -generation S&OP in the manufacturing industry”, IDC.
Viswanathan(b), N. (2009). “Sales and operations planning solutions AXIS”, Q3 2009, Aberdeen Group, Inc.
Viswanathan, N. (2010). “Sales and operations planning strategies for managing complexity within global supply chains”, Aberdeen, July.
Wagner, S. M., Ullrich, K. K., & Transchel, S. (2014). “The game plan for aligning the organization”, Business Horizons, Mar-Apr, vol. 57, no. 2, pp. 189-201.
Wallace(b), & Stahl. (2014). Sales & Operations Planning: The Executive's Guide. Ohio: Steelwedge Software.
Wallace, T. (1999). Sales & Operations Planning: The How-to Handbook. Ohio: T.F.Wallace & Company.
Web Of Science. (2017, 02 28). www.webofknowledge.com/ adresinden alınmıştır
Wing, L., & Perry, G. (2001). “Toward twenty-first-century pharmaceutical sales and operations planning”, Pharmaceutical Technology, pp. 20–26.

Journal of Management, Marketing and Logistics -JMML (2017), Vol.4(2), p.89-106 Ofluoglu,Baki, Ar
_________________________________________________________________________________________________
DOI: 10.17261/Pressacademia.2017.454 89
MULTI-CRITERIA DECISION ANALYSIS MODEL FOR WAREHOUSE LOCATION IN DISASTER LOGISTICS DOI: 10.17261/Pressacademia.2017.454
JMML- V.4-ISS.2-2017(3)-p.89-106
Aylin Ofluoglu
1, Birdogan Baki
2, İlker Murat Ar
3
1 Karadeniz Technical University. Trabzon, Turkey. [email protected] 2 Karadeniz Technical University. Trabzon, Turkey. [email protected] 3 Karadeniz Technical University. Trabzon, Turkey. [email protected]
To cite this document Ofluoglu, A., B. Baki and I.M. Ar, (2017). Multi-criteria decision analysis model for warehouse location in disaster logistics. Journal of Management, Marketing and Logistics (JMML), V.4, Iss.2, p.89-106. Permemant link to this document: http://doi.org/10.17261/Pressacademia.2017.454 Copyright: Published by PressAcademia and limited licenced re-use rights only.
ABSTRACT Purpose- Optimum location of warehouses for disaster logistics increases the performance of humanitarian logistics, so that all the needs
of beneficiaries can be delivered in a short time. In this paper, a multi-criteria decision analysis model is designed to decide the best
warehouse location in disaster logistics in Trabzon, Turkey.
Methodology- Entropy is used to determine the important weights of the criteria. The SAW, TOPSIS and VIKOR methods are utilized to rank
the warehouse location alternatives. The ranking results are also combined by the Borda Count method to obtain a final ranking. The
robustness of the model is examined by the sensitivity analysis.
Findings- According to the results of the analysis, the disaster situation of the land, land size, and the distance of settlement were
determined as the three most important criteria. Sensitivity analysis also proved the robustness of the model.
Conclusion- The results are consistent with the expectations of the decision makers and seem to support their decisions. For future
studies, the results can be compared using fuzzy techniques.
Keywords: Disaster logistics, warehouse location decision, multicriteria decision making techniques.
JEL Codes: C44, L81, Q54
AFET DEPO YERİ SEÇİMİ İÇİN ÇOK KRİTERLİ KARAR ANALİZİ MODELİ
ÖZET Amaç- Afet lojistiği kapsamında depoların en uygun yerlere kurulması, insani yardım lojistiğinin performansını artırarak afetzedeler için gerekli tüm malzemelerin kısa bir sürede ihtiyaç yerlerine ulaştırılmasını sağlamaktadır. Bu çalışmada, Trabzon’da afet lojistiği kapsamında en uygun depo yerinin belirlenmesi amacıyla bir çok kriterli karar analizi modeli tasarlanmıştır. Yöntem- Bu model kapsamında ilk olarak Entropi Tekniği yardımıyla kriter ağırlıkları hesaplanmış ve ardından alternatif depo yerleri, çok kriterli karar verme teknikleri olan SAW, TOPSIS ve VIKOR kullanılarak sıralanmıştır. Elde edilen sonuçlar, Borda Sayım yöntemi kullanılarak bütünleşik bir sıralama elde edilmiştir. Ayrıca, son aşamada gerçekleştirilen duyarlılık analizi ile modelinin uygunluğu incelenmiştir. Bulgular- Analiz sonuçlarına göre arazinin afetselliği, arazi büyüklüğü ve yerleşim yerine uzaklık kriterleri en önemli üç kriter olarak tespit edilmiştir. Ayrıca, duyarlılık analizi ile de modelin uygunluğu ortaya konmuştur. Sonuç- Çalışmada elde edilen sonuçların karar vericilerin beklentileri ile örtüştüğü ve kararlarını desteklediği görülmektedir. Sonuçlar, gelecekte çalışmalarda bulanık yöntemler kullanılarak elde edilecek sonuçlar ile karşılaştırılabilir. Anahtar Kelimeler: Afet lojistiği, depo yer seçimi, çok kriterli karar verme teknikleri. JEL Kodları: C44, L81, Q54
Year: 2017 Volume: 4 Issue: 2
Journal of Management, Marketing and Logistics – (JMML), ISSN: 2148-6670, http://www.pressacademia.org/journals/jmml

Journal of Management, Marketing and Logistics -JMML (2017), Vol.4(2), p.89-106 Ofluoglu,Baki, Ar
_________________________________________________________________________________________________
DOI: 10.17261/Pressacademia.2017.454 90
1.GİRİŞ
Son yıllarda gerçekleşen afetlerin sayısı giderek artmakta ve birçok insan bu afetlerden etkilenmektedir. 2015 yılında doğa kaynaklı afetlerdeki can kaybı 19.241 olarak saptanmıştır (Ersoy, 2016:21). EM-DAT (Emergency Event Database: Acil Durum Veritabanı) verilerine göre son 20 yıllık dönemde (1995-2015) dünyada meydana gelen afet sayısı 13.947 iken, afetlerden toplam etkilenen insan sayısı ise yaklaşık 4,4 milyar olup, yaşanan afetler sonucunda 2,3 Trilyon Dolar’lık zarar ortaya çıkmıştır (EMDAT, 2016).
Afet terimi bir sistemi bir bütün olarak etkileyen, onun önceliklerini ve amaçlarını tehdit eden karmaşa durumu olarak açıklanmaktadır (Van Wassenhove, 2006:476). Dünya Sağlık Örgütü (WHO) afeti; zarar, yıkım, ekolojik bozulma, insan kayıpları, insan acıları ve etkilenen topluluk veya alandan gelen olağanüstü yardım talebine destek verecek yeterli ölçekteki sağlık hizmetlerinde bozulmalara sebep olan olaylar şeklinde ifade etmektedir (Safeer vd. 2014:2248). Van Wassenhove (2006:476) afetleri; ani başlayan doğal (deprem, hortum, kasırga), yavaş gelişen doğal (kıtlık, kuraklık and açlık), insan kaynaklı ani başlayan (terör saldırıları, kimyasal sızıntı) ve insan kaynaklı yavaş gelişen (politik kriz, mülteci krizi) şeklinde sınıflandırmıştır.
İnsan kaynaklı ya da doğal oluşan afetlerin yönetiminden sorumlu afet yönetimi ise; afet faaliyetlerine ilişkin azaltma, hazırlık, müdahale ve iyileşme süreçlerinden sorumludur (Ahmadi vd. 2015:145). Azaltma süreci, felaketi ortadan kaldırmak ya da etkilerini azaltmak amacıyla uzun dönemli çabaları; hazırlık süreci, afetten önce ana dağıtım merkezlerinin sayısı ve kuruluş yeri kararları gibi stratejik karar ve prosedürleri; müdahale süreci afetten sonra etkilenen alanlara yardım malzemelerinin dağıtımını ve iyileşme süreci ise etkilenen alanların öncelikli yerlerin kamu ya da sivil toplum kuruluşları tarafından yenilenmesini içermektedir (Ahmadi vd. 2015:145).
Rapor edilen afetlerin sayısı gittikçe artmakta ve afet lojistiği büyük ölçekli yaşanan olağanüstü hallerde gerekli yardım malzemelerinin (yiyecek, su, ilaç, çadır ve tedarikler) hızlıca ulaştırılmasında önemli rol oynamakta ve sonuç olarak insan kayıplarının ve acılarının en aza indirilmesi amaçlanmaktadır (Balcık ve Beamon, 2008:101). Bu açıdan bakıldığında afet lojistiği “savunmasız insanların acılarını azaltmak amacıyla üretim noktasından tüketim noktasına kadar yiyecek, malzeme ve ilgili bilginin etkin, uygun maliyetli akış ve depolanmasının planlanması, yürütülmesi ve kontrol edilmesi süreci” olarak ifade edilmektedir (Thomas ve Kopczak, 2005:2).
Afet lojistiği; ilgili faaliyetlerin etkin bir şekilde yürütülmesi, afetler sonucu oluşan ya da oluşacak olan zararların en aza indirilmesi noktasında önemli bir rol oynamaktadır. İnsani yardım için depoların en uygun yerlerde kurulmuş olmaları, etkin filo yönetiminin yürütülmesini ve nakliye mesafesinin azalmasını sağlayarak afet lojistiğinin performansını artırmaktadır. Bunun sonucunda da yiyecek, su, ilaç, çadır ve afetzedeler için gerekli tüm malzemeler kısa bir sürede ihtiyaç yerlerine ulaştırılabilmekte ve malzemelerin tükenmesi ya da yetersiz kalması sorunu büyük ölçüde aşılabilmektedir (Kandel vd. 2011:289). Belirlenen tüm bu hedeflere ulaşılabilmesi ve çalışmaların etkin bir şekilde yürütülmesi ancak doğru depo yeri seçimi ile mümkün olmaktadır.
Depo yeri seçimi, birbiriyle çelişen çok sayıda kriteri bünyesinde barındıran Çok Kriterli Karar Verme (ÇKKV) problemidir. Bu çalışmada insani yardım lojistiği kapsamında depo kuruluş yeri seçimi problemi için ÇKKV teknikleri kullanılarak bir model önerilmesi amaçlanmıştır. İlgili literatür incelendiğinde; insani yardım lojistiği kapsamında depo kuruluş yeri seçimi problemi için ÇKKV tekniklerinin kullanıldığı sınırlı sayıda çalışma bulunduğu görülmüştür.
Çalışma kapsamında kriter ağırlıklarını belirlemek amacıyla öznel ağırlıklandırma yöntemleri olan AHP ve Delphi gibi yöntemlerin aksine, hesaplamaları eldeki verilere göre yapan (Çakır ve Perçin, 2013:79) nesnel ağırlıklandırma yöntemlerinden Entropi Ağırlık Yöntemi kullanılmıştır. Depo kuruluş yeri alternatiflerinin sıralanması amacıyla ise SAW, TOPSIS, VIKOR yöntemleri kullanılmıştır. Daha sonra sonuçlar karşılaştırılarak yöntemler arasında farklılık olup olmadığı ortaya konulmaya çalışılmıştır. Her yöntemin sonuçları birbirinden farklı olabileceğinden hareketle bütünleşik bir sıralama elde etmek amacıyla olan Borda Sayım yöntemi kullanılmıştır.
Çalışmanın ilerleyen bölümünde ilk olarak depo kuruluş yeri seçimi ile ilgili yaklaşımları ve depo kuruluş yeri seçim kriterlerini içeren literatür araştırması yer almaktadır. Ardından üçüncü bölümde Entropi Ağırlık Yöntemi, SAW, TOPSIS, VIKOR ve Borda Sayım yöntemleri anlatılmıştır. Daha sonraki bölümde, Trabzon’da afet lojistiği kapsamında depo kuruluş yeri seçimi problemi ile ilgili gerçekleştirilen uygulamaya ilişkin bulgular verilmektedir. Çalışmanın son bölümünde ise bulgulara dayalı sonuçlar ve gelecekte konuyla ilgili yapılacak çalışmalar vurgulanmaktadır.
2.LİTERATÜR ARAŞTIRMASI
Son zamanlarda araştırmacılar ve uygulayıcılar afet lojistiği konusuna oldukça ilgi göstermektedir. Afet lojistiği alanında (Roh vd., 2015) tarafından yapılan sınıflandırmadan hareketle; tahliye (Hadiguna vd. 2014; Na ve Banerjee, 2015), stoğun önceden konumlandırılması (Lee vd. 2014; Opit ve Nakade, 2016), kuruluş yeri seçimi (Salman ve Yücel, 2015; Verma ve

Journal of Management, Marketing and Logistics -JMML (2017), Vol.4(2), p.89-106 Ofluoglu,Baki, Ar
_________________________________________________________________________________________________
DOI: 10.17261/Pressacademia.2017.454 91
Gaukler, 2015), yardım dağıtımı (Ahmadi vd. 2015; Fikar vd. 2016) ve afetzedelerin taşınması (Safeer vd. 2014; Na ve Banerjee, 2015) ile ilgili konularda çalışmalar bulunmaktadır.
2.1.Depo Kuruluş Yeri Kriterleri
Depo kuruluş yeri kararları dağıtım ağı tasarımında en önemli kararlardan biri olup, nitel ve nicel çok sayıda kriteri içermektedir. Literatürde depo kuruluş yeri seçim problemi için belirlenen birçok kriter bulunmaktadır (Roh vd. 2015). Bu kriterleri; Korpela ve Tuominen (1996) güvenilirlik, esneklik ve stratejik uygunluğu olarak belirlerken Alberto (2000) çevresel faktörler, maliyet, yaşam kalitesi, yerel güdüler, müşterilere tedarikte zaman güvenilirliği, müşteri taleplerine yanıt esnekliği ve müşterilerle bütünleşme olarak ifade etmiştir. Demirel vd. (2010) çalışmalarında Türkiye’de depo seçimi için maliyet, işgücü özellikleri, altyapı, pazarlar ve makro çevreyi kriter olarak ele almıştır. Kapasite, maliyet ve müşteri kriterleri temel alınarak Özcan vd. (2011)’nin çalışmalarında birim fiyat, stok tutma kapasitesi, pazara ortalama uzaklık, ana tedarikçilere ortalama uzaklık ve hareket esnekliği değerlendirme kriteri olarak belirlenmiştir.
Dağıtım/lojistik merkez kriterlerinin ele alındığı Awasthi vd. (2011) nin çalışmasında; kabul görme, güvenlik, çoklu ulaşım yollarına bağlantı, maliyetler, çevresel etki, müşterilere yakınlık, tedarikçilere yakınlık, kaynak uygunluğu, taşıma yönetmeliklerine uygunluk, gelişme olasılığı ve hizmet kalitesi dikkate alınırken Sarkis ve Sundarraj (2002) bu kriterleri maliyet, kabul görme, zaman, mevzuat, risk, işgücü ve stratejik faktörler olarak sıralanmıştır. Öte yandan, konuya lojistik merkez seçimi açısından bakıldığında Kayikci (2010) ekonomik büyüklük, ulusal istikrar, intermodal işlem ve yönetim, uluslararası pazar konumu ve çevresel etki faktörlerini kriter olarak belirlemiştir. Li vd. (2011b) ise hava durumu ve arazi yapısı, su tedariği, elektrik tedariği, katı atıkların ortadan kaldırılması, iletişim, trafik, arazi alanı, arazi şekli, arazinin çevredeki ana yollara bağlantısı, arazi bedeli, yük taşıma ve temel inşa yatırımı kriterlerini ele almıştır.
2.2.Afet Lojistiği Depo Kuruluş Yeri Kriterleri
Hong ve Xiaohua (2011) çok amaçlı acil durum lojistik merkez kuruluş yeri seçim problemi için çevresel, ekonomik, sosyal ve teknik faktörleri göz önünde bulundurmuştur. Roh vd. (2013) insani yardım için depoların önceden konumlandırılması problemi için konum, lojistik, ulusal istikrar, maliyet ve işbirliğinden oluşan ana kriterleri ve ilgili alt kriterleri dikkate almıştır. Ağdaş vd. (2014) çalışmalarında afetzedelere ulaşım süresini, sel riski derecesini, ulaşım imkânını, bölge afet deposuna uzaklığı ve toplam maliyeti birer kriter olarak değerlendirmiştir. Roh vd. (2015) ise kriter olarak; uzaklık, güvenlik, büro imkanları ve depo imkanlarını mikro seviyede, kurulum için uygunluk, ulusal istikrar, maliyet, işbirliği ve lojistik kriterlerini ise makro seviyede ele almıştır. Peker vd. (2016) ise konum, altyapı ve işbirliğini ana kriter olarak belirlemiştir. Bu çalışmalar genel olarak incelendiğinde; afetin türüne ve oluşturacağı olası hasarlara göre depo kuruluş yeri seçim kriterlerinin farklılaştığı görülmektedir. Bununla birlikte konum (ulaşım), maliyet ve altyapı sık kullanılan kriterler olarak dikkat çekmektedir.
2.3. Afet Lojistiği Depo Kuruluş Yeri Seçim Yöntemleri
Literatür incelendiğinde afet lojistiği kapsamında depo kuruluş yeri yaklaşımları ile ilgili çalışmalar Tablo 1’de ortaya
konmuştur.
2.4.Çalışmanın Katkısı
Doğu Karadeniz Bölgesinde yaşanan doğal afetlerin çoğunluğunu heyelan ve su baskınlarının oluşturduğu ve olay sayılarına göre illere bakıldığında bu afet türlerinin en çok Trabzon’da olduğu görülmektedir (TRABZON AFAD, 2016). Trabzon’un hem afet riski taşıyan önemli bir bölgede olması hem de Afet ve Acil Durum Yönetim Başkanlığı (AFAD) tarafından bölgedeki beş il (Trabzon, Rize, Artvin, Gümüşhane, Bayburt) için depo yeri olarak belirlenmesi, Trabzon’da afet lojistiği kapsamında bir depo kurulmasını gereklilik hale getirmiştir. Öte yandan, literatürde insani yardım lojistiği kapsamında ön hazırlık aşamasının önemine ve önceden konumlandırılmış depoların varlığına olan ihtiyaca vurgu yapan birçok çalışma mevcutken, kuruluş kararı ile ilgili sınırlı sayıda çalışma bulunmaktadır (Roh vd. 2015:617). Tablo 1’de de görüldüğü gibi Roh vd. (2013) tarafından yapılan çalışma sadece kriter ağırlıklarının belirlendiği çalışmadır. Yine aynı tablodan Hong ve Xiaohua (2011), Turgut vd. (2011), Roh vd. (2015) ve Peker vd. (2016) afet depo yeri seçiminde Çok Kriterli Karar Verme yaklaşımlarının kullanıldığı çalışmalar olduğu görülebilir. Bu çalışmanın literatüre en önemli katkısı, afet lojistiği kapsamında depo kuruluş yeri seçiminde birden fazla çok kriterli karar verme tekniklerinin sonuçlarının karşılaştırıldığı ve bütünleşik bir sonucun elde edildiği ilk çalışma olmasıdır. Ayrıca, bu çalışmanın diğer bir katkısı da kriter ağırlıklarını elde etmek amacıyla öznel ağırlıklandırma tekniği olan AHP yerine nesnel ağırlıklandırma yöntemi Entropi tekniğinin kullanılmasıdır.

Journal of Management, Marketing and Logistics -JMML (2017), Vol.4(2), p.89-106 Ofluoglu,Baki, Ar
_________________________________________________________________________________________________
DOI: 10.17261/Pressacademia.2017.454 92
Tablo 1: Afet Lojistiği Kapsamında Depo Kuruluş Yeri Seçiminde Kullanılan Yöntemler
Yazar (Yıl) Çalışmanın İçeriği Kullanılan Yöntem
Dekle vd. (2005) Afet iyileştirme merkezi yerleri bulmak, tavsiye etmek ve kabul ettirmek amacıyla iki aşamalı kapsama yer modeli yaklaşımının sunulması
Tamsayılı matematiksel programlama
Balcık ve Beamon (2008) Bir insani yardım ağındaki dağıtım merkezlerinin sayısına, yerlerine, afetlerden etkilenen insanlara yardım etmek amacıyla her bir dağıtım merkezinde stoklanması gereken yardım miktarına karar verilmesi
Karma tamsayılı matematiksel programlama
Ukkusuri ve Yushimito (2008)
Afetlerde tedariklerin önceden konumlandırılması amacıyla kuruluş yeri problemi için bir model geliştirilmesi
En güvenilir yol (most reliable path) ve tam sayılı matematiksel programlama
Campbell ve Jones (2011) Felaket hazırlık sürecinde tedariklerin önceden konumlandırılacağı yerlerin seçim ve ne kadar konumlandırılacağı kararlarının belirlenmesi
Maliyet modeli
Gatignon vd. (2010) Yaşanan büyük bir deprem için üç bölgesel lojistik birim kurarak Uluslararası bir yardım kuruluşunun merkezileşme olmadığı bu durumdan nasıl etkilendiğinin sonuçlarının analiz edilmesi
İnsani yardım lojistiği yazılımı (Humanitarian Logistics Software - HLS)
Mete ve Zabinsky (2010) Afet yönetiminde ilaç tedariklerinin depolanma yeri ve dağıtım probleminin ele alınması
Stokastik programlama modeli
Rawls ve Turnquist (2010) Değişik türdeki acil durum tedariklerinin ne miktarda ve nerede önceden konumlandırılacağına karar verilmesi
İki aşamalı stokastik karma tamsayılı programlama ve Lagrangian L-shaped (LLSM) sezgiseli
Hong ve Xiaohua (2011) Çok amaçlı acil durum lojistik merkez kuruluş yeri seçim probleminin çevresel, ekonomik ve teknik faktörler göz önünde bulundurularak ele alınması
AHP bazlı çok amaçlı bir model
Kandel vd. (2011) Önceden konumlandırılması gereken tedarikler için merkezi bir insani yardım lojistik deposu kuruluş yeri seçim probleminin ele alınması
Matematiksel model
Turgut vd. (2011) Afet lojistik merkez kuruluş yeri karar destek sistemi geliştirilmesi
AHP ve bulanık AHP
Lin vd. (2012) Lojistik etkinliği iyileştirmek amacıyla afetten etkilenen alanın çevresinde geçici depoların kuruluş yeri probleminin ele alınması
İki aşamalı sezgisel algoritma (Decomposition and Assignment Heuristic)
Gözaydın ve Can (2013) Deprem yardım istasyonları için lojistik merkezi yer seçimi
P-Medyan ve maksimum kapsama alanı
Roh vd. (2013) İnsani yardım amacıyla depoların önceden konumlandırılması problemi için kriterlerin ve ağırlıklarının belirlenmesi
AHP
Nahleh vd. (2013) Afet bölgesindeki afetzedeler için gerekli yardım ekiplerinin ve yardım malzemelerinin en yakın bölgesel depodan tedarik edilebilmesi için tam zamanında ve seferberlik sistemini birleştiren bir kuruluş yeri modelinin geliştirilmesi
Ağırlık merkezi yöntemi
Ağdaş vd. (2014) Bir afet dağıtım merkezi için en uygun yer seçimi probleminin ele alınması
Stokastik çok kriterli kabul edilebilirlik analizi (Stochastic Multi-Criteria Acceptability Analysis) (SMAA-2)
Rat ve Gutjahr (2014) Afet yardımında depo yerleşim ve rotalama probleminin ele alınması
Karma tamsayılı matematiksel programlama ve komşu arama sezgisel algoritması
Akgün vd. (2015) Talebi karşılamak için güvenilir bir kuruluş yeri seçiminin sağlanması amacıyla talep noktasının
Hata ağacı analizi yöntemi ve doğrusal tamsayılı programlama

Journal of Management, Marketing and Logistics -JMML (2017), Vol.4(2), p.89-106 Ofluoglu,Baki, Ar
_________________________________________________________________________________________________
DOI: 10.17261/Pressacademia.2017.454 93
afetten zarar görme riskini en aza indiren bir optimizasyon modeli önerilmesi
Roh vd. (2015) İnsani yardım organizasyonları için depoların bölgesel ve yerel olarak konumlandırılması
AHP ve bulanık TOPSIS
Verma ve Gaukler (2015) Acil durum tedariklerinin önceden stoklanması için gerekli uygun yerlerin belirlenmesi
Matematiksel model ve stokastik programlama
Peker vd. (2016) Afet lojistiği kapsamında dağıtım merkezi kuruluş yeri karar kriterlerinin belirlenmesi ve alternatiflerin sıralanması
AHP ve VIKOR
Aslan ve Yıldız (2016) Afetlerde yaralı toplanma merkezlerinin belirlenmesi P-medyan ve Genetik algoritma
Saeidian vd. (2016) Yardım merkezleri için en uygun kuruluş yerini belirlemek ve malların dağılımını yapmak amacıyla kullanılan metasezgisel yöntemlerin sonuçlarının karşılaştırılması
Genetik Algoritma ve Arı Kolonisi Algoritmasını
Tofighi vd. (2016) Çoklu depo merkezleri, yerel dağıtım merkezleri kuruluş yerleri ve yardım dağıtım probleminin ele alınması
İki aşamalı senaryo temelli olabilirlikli-stokastik programlama (Scenario-Based Possibilistic-Stochastic Programming - SBPSP)
3.ÇALIŞMADA KULLANILAN YÖNTEMLER
3.1. Entropi Ağırlık Yöntemi
İlk olarak 1865 yılında Rudolph Clausius tarafından termodinamikte düzensizlik ölçüsü olarak açıklanan Entropi kavramı (Zhang vd. 2011:444), 1948’de Claude E. Shannon tarafından bilgi entropisi kavramı olarak geliştirilmiştir (Karaatlı, 2016:66). Bilgideki belirsizlik ölçüsü olarak ifade edilen bilgi entropisi kavramı olasılık teorisi kullanılarak formüle edilmektedir (Shemshadi vd. 2011:12161). İnsan kaynaklı hataları ortadan kaldıran ve gerçeği yansıtan nesnel ağırlıklandırma yöntemlerinden olan, eldeki verinin sağladığı yararlı bilginin miktarını ölçmede kullanılan Entropi Ağırlık yönteminde entropi değeri küçüldükçe düzensizlik derecesi de küçülmektedir (Wu vd. 2011:5163; Li vd. 2011a:2087). Entropi Ağırlık yönteminin uygulama adımları aşağıdaki gibidir (Shemshadi vd. 2011:12162; Zhang vd. 2011:444; Malekian ve Azarnivand, 2016:413-414):
1.Aşama: Başlangıç Karar Matrisinin Oluşturulması
m tane karar alternatifi ve n tane değerlendirme kriterine sahip olan çok kriterli karar problemi için başlangıç karar matrisi oluşturulur.
𝑋𝑚×𝑛 =
𝑋11 𝑋12 ⋯ 𝑋1𝑗
𝑋21 𝑋22 ⋯ 𝑋2𝑗⋮⋮
𝑋𝑖1 𝑋𝑖2 ⋯ 𝑋𝑖𝑗
2.Aşama: Başlangıç Karar Matrisinin Normalize Edilmesi
Normalizasyon işleminde kriterlerin fayda (1) ya da maliyet (2) yönlü olmasına göre aşağıdaki formüller uygulanır:
𝑃𝑖𝑗 = 𝑋𝑖𝑗− 𝑋𝑗
𝑚𝑖𝑛
𝑋𝑗𝑚𝑎𝑥− 𝑋𝑗
𝑚𝑖𝑛 i = 1,…..,m; j = 1,…..,n (1)
𝑃𝑖𝑗 = 𝑋𝑗
𝑚𝑎𝑥− 𝑋𝑖𝑗
𝑋𝑗𝑚𝑎𝑥−𝑋𝑗
𝑚𝑖𝑛 i = 1,…..,m; j = 1,…..,n (2)
Başlangıç matrisi normalize edildikten sonra 𝑅 = [𝑟𝑖𝑗]𝑚×𝑛
matrisinde gösterilerek eşitlik (3)’ten faydalanılmaktadır.
𝑃𝑖𝑗 = 𝑟𝑖𝑗
∑ 𝑟𝑖𝑗𝑚𝑖=1
(3)
3.Aşama: Entropi Değerininin Hesaplanması
Entropi değeri (𝐸𝑗), aşağıdaki eşitlik (4) yardımıyla hesaplanmaktadır:
𝐸𝑗 = −𝑘 ∑ 𝑃𝑖𝑗𝑙𝑛(𝑃𝑖𝑗)𝑚𝑖=1 (4)
Burada k değeri, 𝑘 = (𝑙𝑛(𝑚))−1
formülü ile hesaplanmaktadır.

Journal of Management, Marketing and Logistics -JMML (2017), Vol.4(2), p.89-106 Ofluoglu,Baki, Ar
_________________________________________________________________________________________________
DOI: 10.17261/Pressacademia.2017.454 94
4.Aşama: Farklılaşma Derecesinin Hesaplanması
Entropi değerinin farklılaşma derecesi (𝑑𝑗)hesaplanmaktadır (5):
𝑑𝑗 = 1 − 𝐸𝑗 , ∀𝑗 (5)
5.Aşama: Entropi Ağırlığının Hesaplanması
Her bir kriterin nesnel ağırlığı (𝑊𝑗), aşağıdaki eşitliğe (6) göre tanımlanmaktadır:
𝑊𝑗 =𝑑𝑗
∑ 𝑑𝑗𝑛𝑗=1
, ∀𝑗 (6)
3.2. SAW Matematiksel basitliği sebebiyle en çok bilinen ve kullanılan ÇKKV tekniklerinden biri olan SAW (Simple Additive Weighting: Basit Toplamlı Ağırlıklandırma) yönteminde nihai sonuç, kriter değerlerinin ağırlıklandırılmış toplamlarıdır (Wang vd. 2016:29). Literatürde Ağırlıklı Toplam Model (Weighted Sum Model) ya da Skorlama Yöntemi (Scoring Method) olarak da bilinmektedir (Karami, 2011:7). İlk olarak portföy seçim probleminde 1954 yılında Churchman ve Ackoff tarafından kullanılan (Tzeng ve Huang, 2011:55) SAW yönteminin adımları aşağıdaki şekildedir (Tzeng ve Huang, 2011:56; Wang vd. 2016:29): 1.Adım: Başlangıç Karar Matrisinin Normalize Edilmesi m tane karar alternatifi ve n tane değerlendirme kriterinden oluşan çok kriterli karar probleminde başlangıç karar matrisi (𝑋𝑚×𝑛) oluşturulduktan sonra normalizasyon işlemi, fayda (7) ve maliyet (8) kriterleri için sırasıyla aşağıdaki formüller yardımıyla yapılmaktadır:
𝑟𝑖𝑗 =𝑋𝑖𝑗
𝑚𝑎𝑥𝑖𝑋𝑖𝑗 i = 1,…..,m; j = 1,…..,n (7)
𝑟𝑖𝑗 =𝑚𝑖𝑛𝑖𝑋𝑖𝑗
𝑋𝑖𝑗 i = 1,…..,m; j = 1,…..,n (8)
2.Adım: Alternatiflerin Tercih Değerlerinin Hesaplanması
Kriter ağırlıklarının (𝑊𝑗), normalize edilmiş karar matrisindeki tüm satır vektörleriyle çarpılıp toplamının alınmasıyla (9)
alternatiflerin tercih değerleri (𝑉𝑖) hesaplanmakta ve en yüksek (𝑉𝑖)değerine sahip olan alternatif en iyi alternatif olarak ele alınmaktadır. 𝑉𝑖 = ∑ 𝑤𝑗𝑟𝑖𝑗
𝑛𝑗=1 i=1,……,m
(9) 3.3. TOPSIS
Çok kriterli karar verme tekniklerinden biri olan ve alternatifleri sıralamak amacıyla sıklıkla kullanılan TOPSIS (Technique for Order Preference by Similarity to Ideal Solution) yöntemi, Hwang and Yoon (1981) tarafından geliştirilmiştir (Li vd. 2011b:7905). Yöntemde, pozitif ve negatif ideal çözümler hesaplanarak ideal çözümle arasındaki yakınlığa göre alternatifler sıralanmaktadır. Pozitif ideal çözüm fayda kriterini maksimize edip maliyet kriterini minimize ederken; negatif ideal çözüm maliyet kriterini maksimize edip fayda kriterini minimize etmektedir (Li vd. 2011b:7905). Yöntemin uygulama adımları şu şekildedir (Kumar ve Singh, 2012:295):
1.Adım: Başlangıç Karar Matrisinin Oluşturulması m tane karar alternatifi ve n tane değerlendirme kriterine sahip olan çok kriterli karar problemi için başlangıç karar matrisi oluşturulur.
𝑋𝑚×𝑛 =
𝑋11 𝑋12 ⋯ 𝑋1𝑗
𝑋21 𝑋22 ⋯ 𝑋2𝑗⋮⋮
𝑋𝑖1 𝑋𝑖2 ⋯ 𝑋𝑖𝑗
2.Adım: Başlangıç Karar Matrisinin Normalize Edilmesi
Normalizasyon işlemi, aşağıdaki formül (10) aracılığıyla gerçekleştirilmektedir:
𝑟𝑖𝑗 =𝑋𝑖𝑗
√∑ 𝑋𝑖𝑗2𝑚
𝑘=1
(10)
3.Adım: Ağırlıklandırılmış Normalize Karar Matrisi
Normalize edilmiş karar matrisi ile kriter ağırlıkları (𝑊𝑗) çarpılarak (11) ağırlıklandırılmış normalize karar matrisi (𝑉𝑖𝑗)elde
edilmektedir.

Journal of Management, Marketing and Logistics -JMML (2017), Vol.4(2), p.89-106 Ofluoglu,Baki, Ar
_________________________________________________________________________________________________
DOI: 10.17261/Pressacademia.2017.454 95
𝑉𝑖𝑗 = 𝑟 × 𝑊𝑗 (11)
4.Adım: Pozitif ve Negatif İdeal Referans Noktalarının Hesaplanması
Ağırlıklandırılmış normalize karar matrisinde (𝑉𝑖𝑗) her sütundaki maksimum ve minimum değerler bulunarak pozitif (𝑉𝑗+)
(12) ve negatif (𝑉𝑗−) (13) ideal referans noktaları hesaplanır.
𝑉𝑗+ = {(max 𝑉𝑖𝑗 , 𝑖 ∈ 𝐼), (min 𝑉𝑖𝑗 , 𝑖 ∈ 𝑗)} (12)
𝑉𝑗− = {(min 𝑉𝑖𝑗 , 𝑖 ∈ 𝐼), (max 𝑉𝑖𝑗 , 𝑖 ∈ 𝑗)} (13)
I, fayda yönlü kriterleri; j ise maliyet yönlü kriterleri ifade etmektedir. 5.Adım: Pozitif Ideal ve Negatif Ideal Çözüme Olan Uzaklıkların Hesaplanması
Her bir alternatifin pozitif ideal ve negatif ideal çözüme olan uzaklıklarının hesaplanması için n-boyutlu Öklid uzaklığı kullanılır. Hesaplamalar aşağıdaki (14) ve (15) gibi yapılmaktadır.
𝑆𝑖+ = √∑ (𝑉𝑖𝑗 − 𝑉𝑗
+)2𝑛
𝑗=1 , i = 1,2,.…..,m (14)
𝑆𝑖− = √∑ (𝑉𝑖𝑗 − 𝑉𝑗
−)2𝑛
𝑗=1 , i = 1,2,.…..,m (15)
6.Adım: İdeal Referans Noktasına Olan Yakınlığın Hesaplanması
Son aşamada, hesaplanan 𝑅𝐶𝑖 değerlerine (16) göre sıralama elde edilmektedir. En yüksek 𝑅𝐶𝑖 değeri en ideal alternatifi ifade etmektedir.
𝑅𝐶𝑖 =𝑆𝑖
−
𝑆𝑖−+𝑆𝑖
+ (16)
3.4. VIKOR
1998 yılında Opricovic tarafından geliştirilen VIKOR (Vise Kriterijumska Optimizacija I Kompromisno Resenje) yöntemi, birbiriyle çelişen kriterler bulunduğunda alternatifler arasında sıralama ve seçim yapılmasını sağlamakta ve ideale en yakın çözüm sunmaktadır (Opricovic ve Tzeng, 2004:447). VIKOR yönteminin adımları aşağıdaki gibidir (Opricovic ve Tzeng, 2004:447-448; Opricovic ve Tzeng, 2007:515-516; Görener, 2011:102):
1.Adım: Başlangıç karar matrisindeki en iyi (fi*) ve en kötü (fi-) değerler belirlenir (17 ve 18):
Eğer i kriteri fayda yönlü ise ise, i= 1, 2, …,n için; 𝑓𝑖
∗ = 𝑚𝑎𝑥𝑗𝑓𝑖𝑗; 𝑓𝑖− = 𝑚𝑖𝑛𝑗𝑓𝑖𝑗 (17)
Eğer i kriteri maliyet yönlü ise ise, i= 1, 2, …,n için; 𝑓𝑖
∗ = 𝑚𝑖𝑛𝑗𝑓𝑖𝑗; 𝑓𝑖− = 𝑚𝑎𝑥𝑗𝑓𝑖𝑗 (18)
2.Adım: Her bir alternatif için 𝑆𝑗(19) ve 𝑅𝑗(20) değerleri hesaplanır.
𝑆𝑗 = ∑(𝑓𝑖
∗−𝑓𝑖𝑗)𝑤𝑖
(𝑓𝑖∗−𝑓𝑖)
𝑛𝑖=1 (19)
𝑅𝑗 = 𝑚𝑎𝑥 [(𝑓𝑖
∗−𝑓𝑖𝑗)𝑤𝑖
(𝑓𝑖∗−𝑓𝑖)
] (20)
𝑊𝑗 , kriter ağırlıklarını ifade etmektedir.
3.Adım: Her bir alternatif için aşağıdaki formül yardımıyla 𝑄𝑗değerleri (21) hesaplanır.
𝑄𝑗 =𝑣(𝑆𝑗−𝑆∗)
𝑆−−𝑆∗ +(1−𝑣)(𝑅𝑗−𝑅∗)
𝑅−−𝑅∗ (21)
𝑆∗ ve 𝑅∗ minimum 𝑆𝑗 ve 𝑅𝑗 değerlerini, 𝑆−ve 𝑅−maksimum 𝑆𝑗 ve 𝑅𝑗 değerlerini göstermektedir. Kullanılan formüldeki v
değeri maksimum grup faydası stratejisi için ağırlık olarak ifade edilirken, (1-v) değeri ise bireysel pişmanlık için ağırlık olarak ifade edilmektedir. Literatürde ‘‘v’’ değeri genel olarak 0,5 alınmaktadır.
4.Adım: Her bir alternatif için hesaplanan 𝑆𝑗, 𝑅𝑗 ve 𝑄𝑗 değerleri küçükten büyüğe olacak şekilde sıralanır.
Son aşamada en küçük 𝑄𝑗 değerine sahip alternatifin en iyi alternatif olup olmadığının belirlenmesi için aşağıdaki iki koşulun
sağlanıp sağlanmadığı kontrol edilmelidir:
1.Koşul: Kabul edilebilir avantaj: En iyi ve en yakın alternatif arasında belirgin bir farklılık olduğunun (22) kanıtlanmasıdır.
𝑄(𝐴2) − 𝑄(𝐴1) ≥ 𝐷𝑄 (22)
DQ değeri, J alternatif sayısı olmak üzere (1/(1-J)) ile hesaplanmaktadır.

Journal of Management, Marketing and Logistics -JMML (2017), Vol.4(2), p.89-106 Ofluoglu,Baki, Ar
_________________________________________________________________________________________________
DOI: 10.17261/Pressacademia.2017.454 96
2.Koşul: Kabul Edilebilir İstikrar Koşulu: Qj sıralamasına göre birinci sırada yer alan alternatifin 𝑆𝑗 ve/veya 𝑅𝑗 sıralamalarında
da aynı sırada yer almasını ifade eder.
1. koşul şartının sağlanamadığı durumda 𝐴1, 𝐴2, ⋯ , 𝐴𝑚 alternatifleri dikkate alınarak eşitsizlik 𝑄(𝐴𝑚) − 𝑄(𝐴′) < 𝐷𝑄 şeklinde ifade edilir. Eğer 2.koşul sağlanmıyor ise 𝐴1ve 𝐴2 alternatifleri uzlaşık çözüm kümesinde yer almaktadır.
3.5. Borda Sayım Yöntemi
‘n‘adet alternatifin bulunduğu bir ortamda seçmenlerin en fazla tercih ettikleri alternatife n-1 puan, en az tercih ettikleri alternatife de 0 puan verdikleri sosyal seçim fonksiyonlarından Borda Sayım yönteminde adaylar seçmenlerin öncelik sıraları dikkate alınarak sıralanmaktadır (Hiltunen vd., 2008:119). Borda Sayım yöntemi aynı zamanda bu çalışmada olduğu gibi bütünleşik bir sıralama elde etmek amacıyla kullanılan veri birleştirme yöntemlerindendir (Çakır ve Perçin, 2013:452).
4.UYGULAMA
Bilindiği gibi yer seçimi problemi bölge, yer ve arazi seçimi olmak üzere üç aşamalı bir süreçtir. Söz konusu problemde, Afet ve Acil Durum Yönetim Başkanlığı (AFAD) Trabzon ilini bölgedeki beş il (Trabzon, Rize, Artvin, Gümüşhane, Bayburt) için yer olarak belirlemiştir. Dolayısıyla, bölge ve yer seçimi AFAD tarafından önceden yapılmış (Bölge Doğu Karadeniz, yer Trabzon olarak belirlenmiştir) ve sonuç olarak problem arazi seçimine dönüşmüştür. Bu noktada çalışmada izlenen uygulama adımları Şekil 1’de gösterilmiş olup, her aşamada ilgili kuruluşun yöneticileriyle işbirliği halinde çalışılmıştır.
4.1. Problemin Belirlenmesi
Çalışmada, AFAD tarafından Doğu Karadeniz Bölgesi’ndeki beş il (Trabzon, Rize, Artvin, Gümüşhane, Bayburt) için yer olarak belirlenen Trabzon’da afet lojistiği kapsamında depo kuruluş yeri seçim problemi ele alınmıştr.
4.2. Kuruluş Yeri Seçim Kriterlerinin Belirlenmesi
Kuruluş yeri seçimi için çalışmada kullanılan değerlendirme kriterleri, literatürde yer alan çalışmalar ile AFAD’da çalışan uzmanların görüşleri dikkate alınarak oluşturulmuştur. Bu kapsamda belirlenen 11 adet kritere ilişkin bilgiler Tablo 2’de yer almaktadır. Buna göre; yerleşim yerine uzaklık (K1), arazi büyüklüğü (K5) ve arazinin afetselliği (K7) fayda yönlü kriterler olarak ele alınırken; hava limanına yakınlık (K2), limana yakınlık (K3), karayoluna yakınlık (K4), arazi maliyeti (K6), arazinin jeolojik yapısı (K8), elektrik bağlantısına uzaklık (K9), su bağlantısına uzaklık (K10) ve kanalizasyon bağlantısına uzaklık (K11) maliyet yönlü kriterler olarak ele alınmıştır.
4.3. Alternatiflerin Belirlenmesi
Trabzon ili için afet lojistiği kapsamında depo yer seçimi problemi için 8 adet arazi/alternatif (A1, A2, A3, A4, A5, A6, A7, A8) dört uzman (Trabzon AFAD Yönetim Başkanlığında yönetici konumunda üç, Trabzon Büyükşehir Belediyesi İmar ve Şehircilik Dairesi Başkanlığında yönetici konumunda bir) tarafından belirlenmiş ve tüm araziler yerinde görülmüştür. Çalışma kapsamında belirlenen depo kuruluş yeri alternatifleri Şekil 2’de gösterilmektedir. Ayrıca, haritada liman ve havalimanının yerleri de görülmektedir.
4.4. Verilerin Elde Edilmesi
Belirlenen alternatiflerin her birinin 11 kriter için gerekli bilgileri veri setini oluşturmaktadır. Bu noktada uygulamada kullanılan veriler, Trabzon Afet ve Acil Durum Yönetim Başkanlığından elde edilmiş olup Tablo 3’te gösterilmektedir.

Journal of Management, Marketing and Logistics -JMML (2017), Vol.4(2), p.89-106 Ofluoglu,Baki, Ar
_________________________________________________________________________________________________
DOI: 10.17261/Pressacademia.2017.454 97
Şekil 1: Uygulama Adımları
Şekil 2: Depo Kuruluş Yeri Alternatifleri
Problemin Belirlenmesi
Kriterlerin Belirlenmesi
Alternatiflerin Belirlenmesi
Verilerin Elde Edilmesi
Kriter ağırlıklarının Belirlenmesi
Alternatiflerin Sıralanması
Bütünleşik Sıralama Elde Edilmesi
Duyarlılık Analizi
AFAD, Yerel
Yönetim
Literatür
Araştırması
AFAD
TOPSIS VIKOR SAW
Entropi
Ağırlık
Yöntemi
Borda Sayım
Yöntemi

Journal of Management, Marketing and Logistics -JMML (2017), Vol.4(2), p.89-106 Ofluoglu,Baki, Ar
_________________________________________________________________________________________________
DOI: 10.17261/Pressacademia.2017.454 98
Tablo 2: Kuruluş Yeri Seçim Kriterleri
Kriterler Açıklama Birim
Yerleşim yerine uzaklık (K1)a,b,c
Depo yerinin şehir merkezine uzaklığı Kilometre Havalimanına yakınlık (K2)
d,e,f Depo yerinin havalimanına yakınlığı Kilometre
Limana yakınlık (K3) d,e,f
Depo yerinin limana yakınlığı Kilometre Karayoluna yakınlık (K4)
e,f,g Depo yerinin karayoluna yakınlığı Kilometre
Arazi büyüklüğü (K5)a Depo kurulacak arazinin büyüklüğü Metrekare
Arazi maliyeti (K6)d,e,g
Arazi düzenleme maliyeti Milyon TL Arazinin afetselliği (K7)
f Depo yerinin doğal afet riski derecesi Risk düzeyi
*
Arazinin jeolojik yapısı (K8)a Arazinin topografik eğimi Derece
Elektrik bağlantısına uzaklık (K9)a Elektrik bağlantısına olan uzaklık Kilometre
Su bağlantısına uzaklık (K10)a Su bağlantısına olan uzaklık Kilometre
Kanalizasyon bağlantısına uzaklık (K11)a Kanalizasyon bağlantısına olan uzaklık Kilometre
(a) Li vd. (2011b), (b) Roh vd. (2013), (c) Roh vd. (2015), (d) Alberto (2000), (e) Awasthi vd. (2011), (f) Peker vd. (2016), (g) Roh vd. (2013). * 1 (Risk ≥ %80), 2 (%60≤ Risk<%79), 3 (%40≤ Risk<%59), 4 (%20≤ Risk<%39), 5 (Risk<%20) (Ağdaş vd., 2014)
Tablo 3: Uygulamada Kullanılan Veriler
K1 K2 K3 K4 K5 K6 K7 K8 K9 K10 K11
A1 18 17 19 0,1 14.353 5,2 5 5 0,002 0,002 0,002
A2 8,5 3,3 5,6 0,02 47.280 5,0 5 7,5 0,002 0,002 0,002
A3 3,5 22 24 3 10.198 5,4 4 30 0,06 0,06 1,5
A4 9 22 20,4 0,02 16.748 5,2 4 10 0,002 0,002 0,002
A5 2,5 50 52 0,5 28.000 5,3 4 25 0,1 0,1 1
A6 7 62 60 7 13.200 5,4 5 20 0,05 8 8
A7 7 7 6 0,75 28.200 5,6 4 40 0,25 0,25 1
A8 12 12 11 0,45 22.800 5,4 4 30 0,3 0,3 0,9
4.5. Kriter Ağırlıklarının Hesaplanması
Değerlendirme kriterlerinin ağırlıklarının belirlenmesi amacıyla nesnel ağırlıklandırma yöntemlerinden olan Entropi Ağırlık Yöntemi kullanılarak Tablo 4’te yer alan kriter ağırlıkları elde edilmiştir (Uygulama aşamaları Ek 1’de verilmiştir).
Tablo 4: Kriter Ağırlıkları
Kriter K1 K2 K3 K4 K5 K6 K7 K8 K9 K10 K11
Ağırlık 0,102 0,062 0,068 0,045 0,128 0,067 0,303 0,074 0,067 0,041 0,042
4.6. Alternatiflerin Sıralanması
Altenatiflerin sıralanması amacıyla kullanılan SAW, TOPSIS ve VIKOR sonuçları Tablo 5’te ve söz konusu tekniklerin uygulama aşamaları sırasıyla Ek 2, Ek 3 ve Ek 4’te görülmektedir.
4.7. Bütünleşik Sıra Elde Edilmesi
Uygulama kapsamında her yöntemin sonuçları birbirinden farklı olabileceğinden bütünleşik bir sıralama elde etmek amacıyla Borda Sayım yöntemi kullanılmıştır (Tablo 5).

Journal of Management, Marketing and Logistics -JMML (2017), Vol.4(2), p.89-106 Ofluoglu,Baki, Ar
_________________________________________________________________________________________________
DOI: 10.17261/Pressacademia.2017.454 99
Tablo 5: Uygulama Sonuçları
SAW TOPSIS VIKOR BORDA
Değeri Sıralama Değeri Sıralama Değeri Sıra Değeri Sıralama
A1 0,77373 2 0,53416 2 0,18355 2 18 2
A2 0,92137 1 0,74798 1 0,00000 1 21 1
A3 0,39344 8 0,06723 8 1,00000 8 0 8
A4 0,66332 3 0,42979 3 0,86872 4 14 3
A5 0,42571 7 0,21024 6 0,98342 7 4 7
A6 0,47137 6 0,20285 7 0,48041 3 8 6
A7 0,52270 4 0,36068 4 0,95792 6 10 4
A8 0,50120 5 0,31694 5 0,92867 5 9 5
Tablo 5’e bakıldığında kullanılan tüm yöntemlerde A2 ve A1 alternatiflerinin birinci ve ikinci, A3 alternatifinin ise son sırada yer aldığı görülmektedir. Diğer alternatiflerin sıralamalarında farklılıklar olabileceğinden hareketle bütünleşik bir sıralama elde etmek amacıyla kullanılan Borda Sayım yönteminin sonuçlarına göre A2 alternatifi birinci sırada yer almakta, A1 ve A4 alternatifleri ikinci ve üçüncü sırada yer almaktadır. A3 alternatifi ise son sırada bulunmaktadır.
4.8. Duyarlılık Analizi
Uygulama kapsamında kriterlerin önem ağırlıkları değiştiğinde alternatiflerde meydana gelen sıralama farklılıklarını görmek amacıyla duyarlılık analizi yapılmıştır. Duyarlılık analizi için üç farklı senaryo değerlendirilmiştir. Senaryo 1 (S1)’de uygulama kapsamında ele alınan onbir kriter için eşit kriter ağırlıkları (0,091) kullanılmıştır. Senaryo 2 (S2) için Entropi Ağırlık yöntemi ile elde edilen Tablo 4’te görülen kriter ağırlıklarından arazinin afetselliği (K7) kriterine ait olan maksimum kriter ağırlığı (0,303) ile su bağlantısına uzaklık (K10) kriterine ait olan minimum kriter ağırlığı (0,041) yer değiştirilmiştir. Senaryo 3 (S3)’te ise Entropi Ağırlık yöntemiyle elde edilen su bağlantısına uzaklık (K10) kriterine ait olan minimum kriter ağırlığı (0,041) kendi kriter ağırlığı kadar arttırılarak eşitlik (23)’ten faydalanılarak yeni kriter ağırlıkları elde edilmiştir (Alinezhad ve Amini, 2011:27). Mevcut durum (MD) ve farklı üç senaryoya (S1, S2 ve S3) ait değerlendirme kriterlerinin ağırlıkları Tablo 6’da verilmiştir.
𝑊′𝑗 = {𝑊𝑗 + ∆𝑝 𝑗 = 𝑝
1− 𝑊′𝑝
1− 𝑊𝑝× 𝑊𝑗 𝑗 ≠ 𝑝, 𝑗 = 1,2, … , 𝑘
(23)
Tablo 6: Duyarlılık Analizi İçin Kriter Ağırlıkları
K1 K2 K3 K4 K5 K6 K7 K8 K9 K10 K11
Kri
ter
Ağı
rlık
ları
MD 0,102 0,062 0,068 0,045 0,128 0,067 0,303 0,074 0,067 0,041 0,042
S1 0,091 0,091 0,091 0,091 0,091 0,091 0,091 0,091 0,091 0,091 0,091
S2 0,102 0,062 0,068 0,045 0,128 0,067 0,041 0,074 0,067 0,303 0,042
S3 0,098 0,06 0,065 0,043 0,122 0,064 0,29 0,071 0,064 0,083 0,04
Entropi Ağırlık yöntemi kullanılarak kriter ağırlıklarının hesaplandığı mevcut durum (MD) ile farklı kriter ağırlıklarının ele alındığı üç senaryoya ait SAW, TOPSIS, VIKOR ve Borda Sayım yöntemlerine göre sıralama sonuçları Şekil 3’te verilmiştir. Buna göre, SAW, TOPSIS, VIKOR açısından mevcut durum (MD) ve duyarlılık analizinde ele alınan senaryolar (S1, S2, S3) karşılaştırıldığında A2 alternatifi tümünde birinci sırada, A1 alternatifi ikinci sırada, A3 alternatifi ise son sırada yer almaktadır. Bütünleşik bir sıralamanın elde edildiği Borda Sayım yönteminde mevcut durum farklı senaryolar ile karşılaştırıldığında ilk beşte (A2, A1, A4, A7, A8) ve sonda (A3) yer alan alternatiflerin sıralamasında değişiklik olmadığı görülmüştür. Yani, sonuçların değişmediği ve kurulan modelin geçerli olduğu söylenebilir.

Journal of Management, Marketing and Logistics -JMML (2017), Vol.4(2), p.89-106 Ofluoglu,Baki, Ar
_________________________________________________________________________________________________
DOI: 10.17261/Pressacademia.2017.454 100
Şekil 3: Duyarlılık Analizi Sonuçları
5. SONUÇ
Son yıllarda doğal ya da insan kaynaklı yaşanan afetlerin sayısı ve şiddeti gittikçe artmaktadır. Bu nedenle büyük ölçekli yaşanan olağanüstü hal durumlarında gerekli yardım malzemelerinin hızlı bir şekilde (yiyecek, su, ilaç, çadır vb.) ulaştırılmasını amaçlayan afet lojistiği giderek daha da önem kazanmaktadır. Afet lojistiğinin etkin bir şekilde yürütülmesinde depoların en uygun yerlerde kurulmuş olmaları önemli rol oynamaktadır. Bu çalışma kapsamında Trabzon ili için afet lojistiği depo kuruluş yeri seçimi problemi, birbiriyle çelişen çok sayıda kriteri bünyesinde barındıran Çok Kriterli Karar Verme (ÇKKV) problemi olarak ele alınmış ve çok kriterli bir model tasarlanmıştır. Bu modelde ilk olarak Entropi Ağırlık yöntemi kullanılarak kriter ağırlıkları hesaplanmıştır. Ardından alternatif depo yerleri, ÇKKV teknikleri olan SAW, TOPSIS ve VIKOR kullanılarak sıralanmış elde edilen sonuçlar Borda Sayım yöntemi kullanılarak birleştirilerek bütünleşik bir sıralama elde edilmiştir. Ayrıca, yapılan duyarlılık analiziyle modelin geçerliliği test edilmiştir.
Çalışma kapsamında geliştirilen modelde birden fazla ÇKKV tekniği kullanıldığından analiz sonuçlarını karşılaştırma imkânı bulunmuş, böylelikle çok kriterli seçim modelinin geçerliliği ve güvenilirliği test edilmiştir. Farklı yöntemler farklı sonuçlar verebildiğinden bütünleşik tek bir sıralama elde etmek amacıyla da Borda Sayım yöntemi kullanılmıştır. Ayrıca, yapılan duyarlılık analizi sonuçları modelin geçerli olduğunu ortaya koymuştur. Sonuç olarak, modelin tutarlı ve güvenilir bir model olduğu ortaya konmuştur.
Analiz sonuçlarına göre arazinin afetselliği, arazi büyüklüğü ve yerleşim yerine uzaklık kriterleri en önemli üç kriter olarak tespit edilmiştir. Heyelan açısından Trabzon’un %62’sini yüksek riskli ve riskli alanlar oluşturmaktadır (TRABZON AFAD, 2016). Ayrıca, Trabzon’un sel ve su taşkınları açısından da ilk sırada yer alması nedeniyle (TRABZON AFAD, 2016) arazinin afetselliği kriterinin ilk sırada çıktığı değerlendirilmektedir. Alternatiflerin sıralanması amacıyla kullanılan farklı ÇKKV teknikleri (SAW, TOPSIS, VIKOR) sonuçlarına göre A2 alternatifi ilk, A1 alternatifi ikinci, A3 alternatifi ise son sırada yer almıştır. Borda Sayım yöntemiyle elde edilen
Şekil 3(a): SAW Sonuçları Şekil 3(b): TOPSIS Sonuçları
Şekil 3(c): VIKOR Sonuçları Şekil 3(d): BORDA Sonuçları
0
1
2
3
4
5
6
7
8
9
A1 A2 A3 A4 A5 A6 A7 A8
MD
S1
S2
S3
0
1
2
3
4
5
6
7
8
9
A1 A2 A3 A4 A5 A6 A7 A8
MD
S1
S2
S3
0
1
2
3
4
5
6
7
8
9
A1 A2 A3 A4 A5 A6 A7 A8
MD
S1
S2
S3
0
1
2
3
4
5
6
7
8
9
A1 A2 A3 A4 A5 A6 A7 A8
MD
S1
S2
S3

Journal of Management, Marketing and Logistics -JMML (2017), Vol.4(2), p.89-106 Ofluoglu,Baki, Ar
_________________________________________________________________________________________________
DOI: 10.17261/Pressacademia.2017.454 101
sonuçlara göre de A2 alternatifi birinci sırada ve A3 alternatifi son sırada yer almaktadır. Bu sonucun elde edilmesinde de afetsellik, arazi büyüklüğü, maliyet ve ana arter yollara uzaklık kriterlerinin etkili olduğu düşünülmektedir. Elde edilen sıralama sonuçları yönetimsel açıdan değerlendirildiğinde A2 alternatifi birinci sırada yer almasına rağmen yerleşim yerine yakın olması sebebiyle AFAD yöneticileri tarafından tercih edilmemektedir. Onun yerine, ikinci ve üçüncü sırada çıkan A1 ve A4 alternatifleri ön plana çıkarılmaktadır. Öte yandan, çalışmada elde edilen bu sonuçlar da karar vericilerin beklentileri ile örtüşmekte olup kararlarını desteklediği görülmektedir. İnsan yargıları belirsiz olduğundan ve kesin sayısal bir değerle ifade edilemediğinden dolayı birçok durumda gerçek durumu modellemek zordur. Bu noktadan hareketle gelecek çalışmalar için, bulanık ÇKKV teknikleri kullanılarak sonuçlar karşılaştırılabilir.
TEŞEKKÜR Trabzon İl Afet ve Acil Durum Müdürlüğü ile Trabzon Büyükşehir Belediyesi İmar ve Şehircilik Dairesi Başkanlığı yöneticilerine katkılarından dolayı teşekkür ederiz.
KAYNAKLAR
Ahmadi, M., Seifi, A. ve Tootooni, B.2015, “A humanitarian logistics model for disaster relief operation considering network failure and standard relief time: A case study on San Francisco district”, Transportation Research Part E, 75, pp.145-163.
Ağdaş, M., Bali, Ö. ve Ballı, H.2014, “Afet Lojistiği Kapsamında Dağıtım Merkezi İçin Yer Seçimi: SMAA-2 Tekniği ile Bir Uygulama”, Beykoz Akademi Dergisi, 2(1), pp. 75-95.
Akgün, İ., Gümüşbuğa, F. ve Tansel, B.2015, “Risk based facility location by using fault tree analysis in disaster management”, Omega, 52, pp. 168-179.
Alberto, P. 2000, “The logistics of industrial location decisions: An application of the analytical hierarchy process methodology”, International Journal of Logistics: Research and Application, 3(3), pp. 273-289.
Alinezhad, A. ve Amini, A.2011, “Sensitivity Analysis of TOPSIS Technique: The Results of Change in the Weight of One Attribute on the Final Ranking of Alternatives”, Journal of Optimization in Industrial Engineering, 7, pp. 23-28.
Aslan, H.M., ve Yıldız, M.S.2016, “Yapay zekâ Optimizasyon Yöntemi İle Yaralı Toplama Merkezlerinin Konuşlandırılması”, Bartın Üniversitesi İİBF Dergisi, 7(14), pp. 165-188.
Awasthi, A., Chauhan, S.S. ve Goyal, S.K. 2011, “A multi-criteria decision making approach for location planning for urban distribution centers under uncertainty”, Mathematical and Computer Modelling, 53, pp. 98-109.
Balcık, B. ve Beamon, B.M.2008, “Facility location in humanitarian relief”, International Journal of Logistics: Research and Applications, 11(2), pp. 101-121.
Campbell, A.M. ve Jones, P.C.2011, “Prepositioning supplies in preparation for disasters”, European Journal of Operational Research, 209, pp. 156-165.
Çakır, S. ve Perçin, S. 2013, “AB Ülkeleri’nde Bütünleşik Entropi Ağırlık-TOPSIS Yöntemiyle AR-GE Performansının Ölçülmesi”, Uludağ Üniversitesi İktisadi ve İdari Bilimler Fakültesi Dergisi, 32(1), pp. 77-95.
Çakır, S. ve Perçin, S. 2013, “Çok Kriterli Karar Verme Teknikleriyle Lojistik Firmalarında Performans Ölçümü”, Ege Akademik Bakış, 13(4), pp. 449-459.
Dekle, J., Lavieri, M.S., Martin, E., Emir-Farinas, H. ve Francis, R.L.2005, “A Florida County Locates Disaster Recovery Centers”, Interfaces, 35( 2), pp. 133-139.
Demirel, T., Demirel, N.Ç. ve Kahraman, C.2010 “Multi-criteria warehouse location selection using Choquet integral”, Expert Systems with Applications, 37, pp. 3943-3952.
EMDAT. 2016, http://www.emdat.be/advanced_search/index.html, (24.06.2016).
Ersoy, Ş.2016, “2015 Yılının Doğa Kaynaklı Afetleri ‘Dünya ve Türkiye’”, TMMOB Jeoloji Mühendisleri Odası Yayınları, Ankara.
Fikar, C., Gronalt, M. ve Hirsch, P.2016, “A decision support system for coordinated disaster relief distribution”, Expert Systems with Applications, 57, pp. 104-116.
Gatignon, A., Van Wassenhove, L.N. ve Charles, A.2010, “The Yogyakarta earthquake: Humanitarian relief through IFRC’s decentralized supply chain”, International Journal of Production Economics, 126, pp. 102-110.
Görener, A.2011, “Bütünleşik ANP-VIKOR Yaklaşımıile ERP Yazılımı Seçimi”, Havacılık ve Uzay Teknolojileri Dergisi, 5(1), pp. 97-110.
Gözaydın, O. ve Can, T.2013, “Deprem Yardım İstasyonları İçin Lojistik Merkezi Seçimi: Türkiye Örneği”, Havacılık ve Uzay Teknolojileri Dergisi, 6(2),pp. 17-31.

Journal of Management, Marketing and Logistics -JMML (2017), Vol.4(2), p.89-106 Ofluoglu,Baki, Ar
_________________________________________________________________________________________________
DOI: 10.17261/Pressacademia.2017.454 102
Hadiguna, R.A., Kamil, I., Delati, A. ve Reed, R.2014, “Implementing a web-based decision support system for disaster logistics: A case study of an evacuation location assessment for Indonesia”, International Journal of Disaster Risk Reduction, 9, pp. 38-47.
Hiltunen, V., Kangas, J. ve Pykäläinen, J.2008, “Voting methods in strategic forest planning - Experiences from Metsähallitus”, Forest Policy and Economics, 10, pp. 117-127.
Hong, L. ve Xiaohua, Z.2011, “Study on location selection of multi-objective emergency logistics center based on AHP”, Procedia Engineering, 15, pp. 2128-2132.
Kandel, C. Abidi, H. ve Klumpp, M.2011, “Humanitarian Logistics Depot Location Model”, The 2011 European Simulation and Modelling Conference, Conference Proceedings October 24-26, 2011 at University of Mino, Guimaraes, Portugal, pp. 288-293.
Karaatlı, M.2016, “Entropi-Gri İlişkisel Analiz Yöntemleri ile Bütünleşik Bir Yaklaşım: Turizm Sektöründe Uygulama”, Süleyman Demirel Üniversitesi İktisadi ve İdari Bilimler Fakültesi Dergisi, 21(1), pp. 63-77.
Karami, A.2011, “Utilization And Comparison Of Multi Attribute Decision Making Techniques To Rank Bayesian Network Options”, Master Thesis, Skövde-Sweden, University of Skövde, School of Humanities and Informatics.
Kayikci, Y.2010, “A conceptual model for intermodal freight logistics centre location decisions”, Procedia Social and Behavioral Sciences, 2, pp. 6297-6311.
Korpela, J. ve Tuominen, M.1996, “A decision aid in warehouse site selection”, International Journal of Production Economics, 45, pp. 169-180.
Kumar, P. ve Singh, R.K.2012, “A fuzzy AHP and TOPSIS methodology to evaluate 3PL in a supply chain”, Journal of Modelling in Management, 7(3), pp. 287-303.
Lee, W.-S., Kim,B.S. ve Opit, P.F.2014, “A stock pre-positioning model to maximize the total expected relief demand of disaster areas”, Industrial Engineering and Management Systems, 13(3), pp. 297-303.
Li, X., Wang, K., Liu, L. ve Xin, J.2011a, “Application of the Entropy Weight and TOPSIS Method in Safety Evaluation of Coal Mines”, Procedia Engineering, 26, pp. 2085-2091.
Li, Y. Liu, X. ve Chen, Y.2011b, “Selection of logistics center location using Axiomatic Fuzzy Set and TOPSIS methodology in logistics management”, Expert Systems with Applications, 38, pp. 7901-7908.
Lin, Y.H., Batta, R., Rogerson, P.A., Blatt, A. ve Flanigan, M.2012, “Location of temporary depots to facilitate relief operations after an earthquake”, Socio-Economic Planning Sciences, 46, pp. 112-123.
Malekian, A. ve Azarnivand, A.2016, “Application of Integrated Shannon’s Entropy and VIKOR Techniques in Prioritization of Flood Risk in the Shemshak Watershed, Iran”, Water Resources Management, 30, pp.409-425.
Mete, H.O. ve Zabinsky, Z.B. 2010, “Stochastic optimization of medical supply location and distribution in disaster management”, International Journal of Production Economics, 126, pp. 76-84.
Na, H.S. ve Banerjee, A.,2015, “A disaster evacuation network model for transporting multiple priority evacuees”, IIE Transactions, 47(11), pp. 1287-1299.
Nahleh, Y.A., Kumar, A. ve Daver, F.2013, “Facility Location Problem in Emergency Logistic”, International Journal of Mechanical, Aerospace, Industrial, Mechatronic and Manufacturing Engineering, 7(10), pp. 2113-2118.
Opit, P.F. ve Nakade, K.2016, “Emergency response model of stock-prepositioning with transportation constraints”, IEEE International Conference on Industrial Engineering and Engineering Management, pp.239-243.
Opricovic, S. ve Tzeng, G.H.2004, “Compromise solution by MCDM methods: A comparative analysis of VIKOR and TOPSIS”, European Journal of Operational Research, 156, pp. 445-455.
Opricovic, S. ve Tzeng, G.H.2007, “Extended VIKOR Method in Comparison with Other Outranking Methods”, European Journal of Operational Research, 178, pp. 514-529.
Özcan, T., Çelebi, N. ve Esnaf, Ş.2011, “Comparative analysis of multi-criteria decision making methodologie and implementation of a warehouse location selection problem”, Expert Systems with Applications, 38, pp. 9773-9779.
Peker, İ., Korucuk, S., Ulutaş, Ş., Sayın Okatan, B. ve Yaşar, F.2016, “Afet Lojistiği Kapsamında En Uygun Dağıtım Merkez Yerinin AHS-VIKOR Bütünleşik Yöntemi İle Belirlenmesi: Erzincan İli Örneği”, Yönetim ve Ekonomi Araştırmaları Dergisi, 14(1), pp. 82-103.
Rat, S. ve Gutjahr, W.J.2014, “A math-heuristic for the warehouse location–routing problem in disaster relief”, Computers & Operations Research, 42, pp. 25-39.
Rawls, C.G. ve Turnquist, M.A.2010, “Pre-positioning of emergency supplies for disaster response”, Transportation Research Part B, 44, pp. 521-534.
Roh, S.Y., Jang, H.M. ve Han, C.H.2013, “Warehouse Location Decision Factors in Humanitarian Relief Logistics”, The
Asian Journal of Shipping and Logistics, 29(1), pp. 103-120.

Journal of Management, Marketing and Logistics -JMML (2017), Vol.4(2), p.89-106 Ofluoglu,Baki, Ar
_________________________________________________________________________________________________
DOI: 10.17261/Pressacademia.2017.454 103
Roh, S., Pettit, S., Harris, I. ve Beresford, A.2015, “The pre-positioning of warehouses at regional and local levels for a humanitarian relief organisation”, International Journal of Production Economics, 170, pp. 616-628.
Saeidian, B., Mesgari, M.S. ve Ghodousi, M.2016, “Evaluation and comparison of Genetic Algorithm and Bees Algorithm for location–allocation of earthquake relief centers”, International Journal of Disaster Risk Reduction, 15,pp. 94-107.
Safeer, M., Anbuudayasankar, S.P., Balkumar, K. ve Ganesh, K.2014, “Analyzing transportation and distribution in emergency humanitarian logistics”, Procedia Engineering, 97, pp. 2248-2258.
Salman, F.S. ve Yücel, E.2015, “Emergency facility location under random network damage: Insights from the Istanbul case”, Computers &Operations Research, 62, pp. 266-281
Sarkis, J., Sundarraj, R.P.2002, “Hub Location At Digital Equipment Corporation: A Comprehensive Analysis of Qualitative And Quantitative Factors”, European Journal of Operational Research, 137, pp. 336-347.
Shemshadi, A., Shirazi, H., Toreihi, M. ve Tarokh, M.J. 2011, “A fuzzy VIKOR method for supplier selection based on entropy measure for objective weighting”, Expert Systems with Applications, 38, pp. 12160-12167.
Thomas, A. ve Kopczak, L.2005, “From Logistics to Supply Chain Management: the Path forward in the Humanitarian Sector”, Fritz Institute, San Francisco.
Tofighi, S., Torabi, S.A. ve Mansouri, S.A.2016, “ Humanitarian logistics network design under mixed uncertainty”, European Journal of Operational Research, 250, pp. 239-250.
Turgut, B.T., Taş, G., Herekoğlu, A., Tozan, H. ve Vayvay, O.2011, “A fuzzy AHP based decision support system for disaster center location selection and a case study for Istanbul”, Disaster Prevention and Management, 20(5), pp. 499-520.
Tzeng, G.H. ve Huang, J.J.2011, “Multiple Attribute Decision Making: Methods and Applications”, CRC Press, Taylor & Francis Group, A Chapman&Hall.
Ukkusuri, S. ve Yushimito, W. 2008, “Location routing approach for the humanitarian prepositioning problem” Transportation Research Record, 2089, pp. 18-25.
TRABZON AFAD 2016, http://www.trabzonafad.gov.tr/admin/files/1-Afet%20sunum2015-20160111-141433.pdf, (29.06.2016).
Van Wassenhove, L.V. 2006, “Blackett Memorial Lecture Humanitarian aid logistics: supply chain management in high gear”, Journal of the Operational Research Society, 57, pp. 475-489.
Verma, A. ve Gaukler, V.M. 2015 “Pre-positioning disaster response facilities at safe locations: An evaluation of deterministic and stochastic modeling approaches”, Computers &Operations Research, 62, pp. 197-209.
Wang, P., Zhu, Z. ve Wang, Y. 2016, “A novel hybrid MCDM model combining the SAW, TOPSIS and GRA methods based on experimental design”, Information Sciences, 345, pp. 27-45.
Wu, Z., Sun, J., Liang, L. ve Zha, Y. 2011, “Determination of Weights For Ultimate Cross Efficiency Using Shannon Entropy”, Expert Systems with Applications, 38, pp. 5162-5165.
Zhang, H., Gu, C.L., Gu, L.W. ve Zhang, Y. 2011. “The evaluation of tourism destination competitiveness by TOPSIS& information entropy - A case in the Yangtze River Delta of China”, Tourism Management, 32, pp. 443-451.

Journal of Management, Marketing and Logistics -JMML (2017), Vol.4(2), p.89-106 Ofluoglu,Baki, Ar
_________________________________________________________________________________________________
DOI: 10.17261/Pressacademia.2017.454 104
Ek 1: Entropi Ağırlık Tekniği Aşamaları
Başlangıç Karar Matrisi
K1 K2 K3 K4 K5 K6 K7 K8 K9 K10 K11
A1 18,000 17,000 19,000 0,100 14353,710 5,200 5,000 5,000 0,002 0,002 0,002
A2 8,500 3,300 5,600 0,020 47280,360 5,000 5,000 7,500 0,002 0,002 0,002
A3 3,500 22,000 24,000 3,000 10198,810 5,400 4,000 30,000 0,060 0,060 1,500
A4 9,000 22,700 20,400 0,020 16748,170 5,200 4,000 10,000 0,002 0,002 0,002
A5 2,500 50,000 52,000 0,500 28000,000 5,300 4,000 25,000 0,100 0,100 1,000
A6 7,000 62,000 60,000 7,000 13200,000 5,400 5,000 20,000 0,050 8,000 8,000
A7 7,000 7,000 6,000 0,750 28200,000 5,600 4,000 40,000 0,250 0,250 1,000
A8 12,000 12,000 11,000 0,450 22800,000 5,400 4,000 30,000 0,300 0,300 0,900
Max 18,000 62,000 60,000 7,000 47280,360 5,600 5,000 40,000 0,300 8,000 8,000
Min 2,500 3,300 5,600 0,020 10198,810 5,000 4,000 5,000 0,002 0,002 0,002
Normalize Karar Matrisi
Pij K1 K2 K3 K4 K5 K6 K7 K8 K9 K10 K11
A1 1,000 0,767 0,754 0,989 0,112 0,667 1,000 1,000 1,000 1,000 1,000
A2 0,387 1,000 1,000 1,000 1,000 1,000 1,000 0,929 1,000 1,000 1,000
A3 0,065 0,681 0,662 0,573 0,000 0,333 0,000 0,286 0,805 0,993 0,813
A4 0,419 0,670 0,728 1,000 0,177 0,667 0,000 0,857 1,000 1,000 1,000
A5 0,000 0,204 0,147 0,931 0,480 0,500 0,000 0,429 0,671 0,988 0,875
A6 0,290 0,000 0,000 0,000 0,081 0,333 1,000 0,571 0,839 0,000 0,000
A7 0,290 0,937 0,993 0,895 0,485 0,000 0,000 0,000 0,168 0,969 0,875
A8 0,613 0,852 0,901 0,938 0,340 0,333 0,000 0,286 0,000 0,963 0,888
Rij K1 K2 K3 K4 K5 K6 K7 K8 K9 K10 K11
A1 0,326 0,150 0,145 0,156 0,042 0,174 0,333 0,230 0,182 0,145 0,155
A2 0,126 0,196 0,193 0,158 0,374 0,261 0,333 0,213 0,182 0,145 0,155
A3 0,021 0,133 0,128 0,091 0,000 0,087 0,000 0,066 0,147 0,144 0,126
A4 0,137 0,131 0,140 0,158 0,066 0,174 0,000 0,197 0,182 0,145 0,155
A5 0,000 0,040 0,028 0,147 0,179 0,130 0,000 0,098 0,122 0,143 0,136
A6 0,095 0,000 0,000 0,000 0,030 0,087 0,333 0,131 0,153 0,000 0,000
A7 0,095 0,183 0,191 0,142 0,181 0,000 0,000 0,000 0,031 0,140 0,136
A8 0,200 0,167 0,174 0,148 0,127 0,087 0,000 0,066 0,000 0,139 0,138
Entropi Değerinin Hesaplanması
K1 K2 K3 K4 K5 K6 K7 K8 K9 K10 K11
A1 -0,365 -0,285 -0,280 -0,290 -0,133 -0,304 -0,366 -0,338 -0,310 -0,280 -0,289
A2 -0,261 -0,319 -0,317 -0,292 -0,368 -0,351 -0,366 -0,329 -0,310 -0,280 -0,289
A3 -0,081 -0,269 -0,263 -0,218 0,000 -0,212 0,000 -0,179 -0,282 -0,279 -0,261
A4 -0,272 -0,266 -0,276 -0,292 -0,179 -0,304 0,000 -0,320 -0,310 -0,280 -0,289
A5 0,000 -0,129 -0,101 -0,282 -0,308 -0,266 0,000 -0,228 -0,257 -0,278 -0,271
A6 -0,223 0,000 0,000 0,000 -0,106 -0,212 -0,366 -0,266 -0,287 0,000 0,000
A7 -0,223 -0,311 -0,317 -0,277 -0,310 0,000 0,000 0,000 -0,107 -0,275 -0,271
A8 -0,322 -0,299 -0,304 -0,283 -0,262 -0,212 0,000 -0,179 0,000 -0,275 -0,273
Toplam -1,749 -1,877 -1,858 -1,933 -1,666 -1,862 -1,099 -1,839 -1,864 -1,946 -1,943
Hj 0,841 0,903 0,893 0,929 0,801 0,895 0,528 0,884 0,896 0,936 0,934
1-Hj 0,159 0,097 0,107 0,071 0,199 0,105 0,472 0,116 0,104 0,064 0,066

Journal of Management, Marketing and Logistics -JMML (2017), Vol.4(2), p.89-106 Ofluoglu,Baki, Ar
_________________________________________________________________________________________________
DOI: 10.17261/Pressacademia.2017.454 105
Ek 2. SAW Aşamaları
Normalize Karar Matrisi
K1 K2 K3 K4 K5 K6 K7 K8 K9 K10 K11
A1 1,00000 0,19412 0,29474 0,20000 0,30359 0,96154 1,00000 1,00000 1,00000 1,00000 1,00000
A2 0,47222 1,00000 1,00000 1,00000 1,00000 1,00000 1,00000 0,66667 1,00000 1,00000 1,00000
A3 0,19444 0,15000 0,23333 0,00667 0,21571 0,92593 0,80000 0,16667 0,03333 0,03333 0,00133
A4 0,50000 0,14537 0,27451 1,00000 0,35423 0,96154 0,80000 0,50000 1,00000 1,00000 1,00000
A5 0,13889 0,06600 0,10769 0,04000 0,59221 0,94340 0,80000 0,20000 0,02000 0,02000 0,00200
A6 0,38889 0,05323 0,09333 0,00286 0,27919 0,92593 1,00000 0,25000 0,04000 0,00025 0,00025
A7 0,38889 0,47143 0,93333 0,02667 0,59644 0,89286 0,80000 0,12500 0,00800 0,00800 0,00200
A8 0,66667 0,27500 0,50909 0,04444 0,48223 0,92593 0,80000 0,16667 0,00667 0,00667 0,00222
Ağırlıklandırılmış Normalize Karar Matrisi
K1 K2 K3 K4 K5 K6 K7 K8 K9 K10 K11
A1 0,10211 0,01212 0,02015 0,00907 0,03873 0,06460 0,30275 0,07423 0,06657 0,04125 0,04215
A2 0,04822 0,06246 0,06838 0,04534 0,12758 0,06719 0,30275 0,04949 0,06657 0,04125 0,04215
A3 0,01985 0,00937 0,01596 0,00030 0,02752 0,06221 0,24220 0,01237 0,00222 0,00138 0,00006
A4 0,05105 0,00908 0,01877 0,04534 0,04519 0,06460 0,24220 0,03711 0,06657 0,04125 0,04215
A5 0,01418 0,00412 0,00736 0,00181 0,07555 0,06339 0,24220 0,01485 0,00133 0,00083 0,00008
A6 0,03971 0,00332 0,00638 0,00013 0,03562 0,06221 0,30275 0,01856 0,00266 0,00001 0,00001
A7 0,03971 0,02945 0,06382 0,00121 0,07609 0,05999 0,24220 0,00928 0,00053 0,00033 0,00008
A8 0,06807 0,01718 0,03481 0,00202 0,06152 0,06221 0,24220 0,01237 0,00044 0,00028 0,00009
Ek 3: TOPSIS Aşamaları
Normalize Karar Matrisi
K1 K2 K3 K4 K5 K6 K7 K8 K9 K10 K11
A1 0,6627 0,1649 0,1916 0,1399 0,2010 0,3606 0,4016 0,7316 0,5770 0,5772 0,5773
A2 0,3129 0,8493 0,6499 0,6994 0,6621 0,3751 0,4016 0,4878 0,5770 0,5772 0,5773
A3 0,1289 0,1274 0,1517 0,0047 0,1428 0,3473 0,3213 0,1219 0,0192 0,0192 0,0008
A4 0,3314 0,1235 0,1784 0,6994 0,2345 0,3606 0,3213 0,3658 0,5770 0,5772 0,5773
A5 0,0920 0,0561 0,0700 0,0280 0,3921 0,3538 0,3213 0,1463 0,0115 0,0115 0,0012
A6 0,2577 0,0452 0,0607 0,0020 0,1848 0,3473 0,4016 0,1829 0,0231 0,0001 0,0001
A7 0,2577 0,4004 0,6066 0,0187 0,3949 0,3349 0,3213 0,0915 0,0046 0,0046 0,0012
A8 0,4418 0,2336 0,3309 0,0311 0,3193 0,3473 0,3213 0,1219 0,0038 0,0038 0,0013
Ağırlıklandırılmış Normalize Karar Matrisi
K1 K2 K3 K4 K5 K6 K7 K8 K9 K10 K11
A1 0,0677 0,0103 0,0131 0,0063 0,0256 0,0242 0,1216 0,0543 0,0384 0,0238 0,0243
A2 0,0320 0,0530 0,0444 0,0317 0,0845 0,0252 0,1216 0,0362 0,0384 0,0238 0,0243
A3 0,0132 0,0080 0,0104 0,0002 0,0182 0,0233 0,0973 0,0091 0,0013 0,0008 0,0000
A4 0,0338 0,0077 0,0122 0,0317 0,0299 0,0242 0,0973 0,0272 0,0384 0,0238 0,0243
A5 0,0094 0,0035 0,0048 0,0013 0,0500 0,0238 0,0973 0,0109 0,0008 0,0005 0,0000
A6 0,0263 0,0028 0,0041 0,0001 0,0236 0,0233 0,1216 0,0136 0,0015 0,0000 0,0000
A7 0,0263 0,0250 0,0415 0,0008 0,0504 0,0225 0,0973 0,0068 0,0003 0,0002 0,0000
A8 0,0451 0,0146 0,0226 0,0014 0,0407 0,0233 0,0973 0,0091 0,0003 0,0002 0,0001
Pozitif İdeal (A
+) ve Negatif İdeal (A
-) Çözüm Değerleri
K1 K2 K3 K4 K5 K6 K7 K8 K9 K10 K11
A+ 0,0677 0,0530 0,0444 0,0317 0,0845 0,0252 0,1216 0,0543 0,0384 0,0238 0,0243
A- 0,0094 0,0028 0,0041 0,0001 0,0182 0,0225 0,0973 0,0068 0,0003 0,0000 0,0000

Journal of Management, Marketing and Logistics -JMML (2017), Vol.4(2), p.89-106 Ofluoglu,Baki, Ar
_________________________________________________________________________________________________
DOI: 10.17261/Pressacademia.2017.454 106
Pozitif İdeal (S*) ve Negatif İdeal (S
-) Ayrım Ölçüleri
A1 A2 A3 A4 A5 A6 A7 A8
S+ 0,083157 0,040039 0,129184 0,092439 0,120699 0,121425 0,100379 0,102677
S- 0,095353 0,118836 0,009311 0,069674 0,032131 0,030898 0,05663 0,047641
C* 0,53416 0,747982 0,067232 0,429789 0,210239 0,202846 0,36068 0,316936
Ek 4: VIKOR Aşamaları
Kriter Fonksiyonlarının En Iyi (f*) ve En Kötü (f
-) Değerleri
K1 K2 K3 K4 K5 K6 K7 K8 K9 K10 K11
f∗ 18,000 3,300 5,600 0,020 47280,360 5,000 5,000 5,000 0,002 0,002 0,002
f- 2,500 62,000 60,000 7,000 10198,810 5,600 4,000 40,000 0,300 8,000 8,000
S ve R Değerlerinin Hesaplanması
A1 0,000 0,015 0,017 0,001 0,113 0,022 0,000 0,000 0,000 0,000 0,000
A2 0,063 0,000 0,000 0,000 0,000 0,000 0,000 0,005 0,000 0,000 0,000
A3 0,096 0,020 0,023 0,019 0,128 0,045 0,303 0,053 0,013 0,000 0,008
A4 0,059 0,021 0,019 0,000 0,105 0,022 0,303 0,011 0,000 0,000 0,000
A5 0,102 0,050 0,058 0,003 0,066 0,034 0,303 0,042 0,022 0,001 0,005
A6 0,072 0,062 0,068 0,045 0,117 0,045 0,000 0,032 0,011 0,041 0,042
A7 0,072 0,004 0,001 0,005 0,066 0,067 0,303 0,074 0,055 0,001 0,005
A8 0,040 0,009 0,007 0,003 0,084 0,045 0,303 0,053 0,067 0,002 0,005
Q Değerlerinin Hesaplanması
A1 A2 A3 A4 A5 A6 A7 A8
S 0,168 0,068 0,707 0,539 0,686 0,537 0,653 0,616
R 0,113 0,063 0,303 0,303 0,303 0,117 0,303 0,303
Q 0,184 0,000 1,000 0,869 0,983 0,480 0,958 0,929
Smin(S*) Smax(S-) Rmin(R*) Rmax(R
-)
0,0679 0,7072 0,0626 0,3028

Journal of Management, Marketing and Logistics -JMML (2017), Vol.4.(2), p.107-115 Kaya, Ozturk
_________________________________________________________________________________________________
DOI: 10.17261/Pressacademia.2017.455 107
AN ARTIFICIAL NEURAL NETWORK APPROACH FOR THE LOGISTICS CENTER LOCATION SELECTION
DOI: 10.17261/Pressacademia.2017.455 JMML- V.4-ISS.2-2017(4)-p.107-115 Burcu Kaya
1, Nursel Ozturk
2
1 Uludag University, Industrial Engineering Department, Bursa, Turkey. [email protected] 2 Uludag University, Industrial Engineering Department, Bursa, Turkey. [email protected]
To cite this document Kaya, B. and N. Ozturk, (2017). An artificial neural network approach for the logistics center location selection. Journal of Management, Marketing and Logistics (JMML), V.4,Iss.2,p.107-115. Permemant link to this document: http://doi.org/10.17261/Pressacademia.2017.455 Copyright: Published by PressAcademia and limited licenced re-use rights only.
ABSTRACT Purpose- The importance of the city freight transport is crucial when the sustainable development of the city is considered. City logistics come up against the environmental problems such as traffic congestion, air and noise pollution. The importance of the analyzing and controlling the city logistics activities is evident, considering the effects on the big cities that have a considerable population, a developed industry, and considerable logistics activities. The location selection decision of the logistics center is crucial in terms of the efficient design of the network. The aim of this study is to develop a system that intended to help decision makers decide the feasibility of the potential location for the logistics centers by entering the input values for the parameters of the location. Methodology- In this study, the factors such as accessibility, costs, land feasibility, socio-economic and environmental factors is considering as the critical factors in selecting the most suitable logistics center location. An artificial neural network approach is proposed for the location selection problem of the logistics centers. Findings- The findings indicate that the parameter associated with the socio-economic and environmental impact is crucial on logistics center location decision. The output values of the neural network is compared with the real values of the logistics center located in Turkey. The test results indicate that the artificial neural network gives feasible outputs by entering the input values that are not include in the training datasets. Conclusion- The factors affecting logistics center location decision are socio-economic and environmental, accessibility, land feasibility and costs, respectively. As a result of this study, the developed neural network is not only help the decision makers to choose the feasible logistics center location through the alternatives but also decide the feasibility of any location by entering the value of the input parameters.
Keywords: Logistics center, artificial neural network, location selection. JEL Codes: C45, C63, L90
LOJİSTİK MERKEZ YER SEÇİMİ İÇİN BİR YAPAY SİNİR AĞI YAKLAŞIMI
ÖZET Amaç- Hızla büyümekte olan şehirlerin sürdürülebilir olarak gelişmesinde kentsel yük taşımacılığının önemi büyüktür. Kentsel lojistik; trafik sıkışıklıkları, hava ve gürültü kirliliği gibi çevresel etkilerin yarattığı sorunlar ile karşı karşıyadır. Kentsel nüfus yüzdesinin yüksek olduğu, sanayisinin gelişmiş ve lojistik faaliyetlerinin yoğun olarak gerçekleştiği büyük şehirlerde, kentsel lojistiğin şehre ve yaşam alanlarına olan etkileri göz önüne alındığında kentsel yük taşımacılığının analiz ve kontrol edilmesinin önemi ön plana çıkmaktadır. Kentsel lojistik planlama aktivitelerinin içerisinde lojistik merkezlerin kurulması ve lojistik ağında konumlandırılması, ağda etkin ve verimli bir yapılanmanın gerçekleştirilmesi açısından büyük önem taşır. Bu çalışmanın amacı, potansiyel lojistik merkez konumlarına ait parametrelerin giriş değerleri girildiğinde, lojistik merkez için uygun olup olmadığı kararına destek olabilecek bir sistem oluşturmaktır. Yöntem- Bu çalışmada; en uygun lojistik merkez yerinin belirlenmesi probleminde; ulaşım kolaylığı, maliyet, arazi uygunluğu, sosyo-ekonomik ve çevresel faktörler göz önünde bulundurulmuştur. Lojistik merkez yer seçimi problemi için bir yapay sinir ağı yaklaşımı önerilmiştir. Bulgular- Sosyo-ekonomik ve çevresel etki ile ilgili parametrenin, lojistik merkez yer seçimi kararını en çok etkiyen faktör olduğu gözlemlenmiştir. Türkiye’de kurulan lojistik merkezler ile ilgili gerçek değerler ile ağın verdiği çıktı değerleri karşılaştırılmıştır. Yapay sinir ağı eğitim verileri içinde olmayan yeni girdi değerleri girilerek yapılan testlerde gerçek değere yakın çıktılar verebildiği görülmüştür.
Year: 2017 Volume: 4 Issue: 2
Journal of Management, Marketing and Logistics – (JMML), ISSN: 2148-6670, http://www.pressacademia.org/journals/jmml

Journal of Management, Marketing and Logistics -JMML (2017), Vol.4.(2), p.107-115 Kaya, Ozturk
_________________________________________________________________________________________________
DOI: 10.17261/Pressacademia.2017.455 108
Sonuç- Lojistik merkez yer seçimi kararında önemli olan parametreler sırası ile sosyo-ekonomik ve çevresel, ulaşım kolaylığı, arazi uygunluğu ve maliyet çıkmıştır. Bu çalışma sonucu elde edilen yapay sinir ağı, sadece belirli sayıdaki alternatif arasından seçim yapmayıp, düşünülebilecek her yer için giriş değerleri girildiğinde, o yerin lojistik merkez olarak uygun olup olmadığına karar verebilecek niteliktedir.
Anahtar Kelimeler: Lojistik merkez, yapay sinir ağları, yer seçim problemi. JEL Kodları: C45, C63, L90
1. GİRİŞ
Günümüzde, dünya nüfusunun büyük çoğunluğu kentsel alanlarda yaşamaktadır. Kentsel alanlarda yaşayan nüfus, Birleşmiş Milletler (BM) (2014) tarafından yapılan Dünya Popülasyonu İncelemesi (DPİ) analizine göre toplam dünya nüfusunun yaklaşık %54’ü kadardır. Bu sayının 1950 yılında yaklaşık %30’larda iken 2050 yılında %66’lara çıkması öngörülmektedir. Hızla büyümekte olan şehirlerin sürdürülebilir olarak gelişmesinde kentsel lojistiğin önemi büyüktür. Kentsel lojistik trafik sıkışıklıkları, hava ve gürültü kirliliği gibi çevresel etkiler ile karşı karşıyadır. Kentsel lojistikte, birçok farklı tipte taşımacılık yöntemi ile birçok farklı noktadan gelen araçlardan, daha çevre dostu ve şehir içi manevra kabiliyeti daha yüksek olan küçük araçlara yük aktarımın gerçekleştirildiği lojistik merkezleri, trafik sıkışıklığı, enerji tüketimi ve çevresel diğer olumsuz etkilerin azaltılmasını sağlar. Bu terminallerin yer seçimi hem stratejik, hem taktiksel, hem de operasyonel düzeyde değerlendirilmesi gereken oldukça önemli bir karardır (Benjelloun ve Crainic, 2009). Kentsel lojistiğin etkin ve verimli bir şekilde planlanması için gereklilik olduğu düşünülen lojistik merkezlerin kentsel lojistik ağında konumlandırılması problemi literatürde birçok kaynakta araştırılmıştır. Lojistik merkezlerin yerleri belirlenirken arazi büyüklüğü, genişleme olanakları, altyapısı, fiziksel şartları; arazi, inşaat, kullanma, kamulaştırma maliyetleri; üretim ve tüketim merkezlerine, liman, havaalanı, demiryolu ve otoyollara yakınlık; kentsel trafiğe ve ekonomik yaşama etkisi gibi sosyo-ekonomik ve çevresel faktörler ön plana çıkmaktadır (Tanyaş ve Arıkan 2013). Bu merkezlerin yer seçimi probleminin çözümünde sıklıkla ele alınan ölçütler arasında ulaşım kolaylığı, maliyet, arazi uygunluğu yer alırken, yerleşim alanlarına olan sosyo-ekonomik ve çevresel etkileri literatürde nispeten daha az incelenmiştir.
Lojistik merkez yer seçimi problemine literatürde çeşitli çözüm yaklaşımları geliştirilmiştir. Lin (2012) lojistik merkez yer seçimi probleminin kendine has bazı özelliklerinden dolayı analitik yöntemler kullanılarak çözülmesinin zor olduğunun altını çizmiştir. Bu zorluk, problemde birçok parametrenin bir arada dikkate alınması gerekliliği ve oldukça fazla kısıttan oluşmasından kaynaklanmaktadır. Kayıkçı (2010); Pamucar vd., (2016) de lojistik merkez yer seçimi probleminin analitik yöntemler kullanılarak çözülmesinin oldukça zor olduğunu ve literatürde çoğunlukla çok kriterli karar verme teknikleri kullanıldığını belirtmişlerdir.
Lin (2012) tarafından bu problemin analitik hiyerarşi süreci (AHS) gibi niteliksel ve niceliksel özellikleri bir arada barındıran metotlar ile çözülmesinde bazı parametrelerin ağırlıklarını belirlemenin tutarlılığı sağlamak açısından yarattığı zorluğa dikkat çekilmiştir. Lin (2012) sinirsel ağ yöntemi ile ağırlıkların hesaplanmasının bilimsel açıdan daha doğru ve gerçeğe yakın sonuçlar verdiğini belirtmiş olup bulanık sinirsel ağlardan faydalanarak bir yer seçim problemi ele almıştır. Literatürde lojistik merkez yer seçimi problemi için yapay sinir ağı (YSA) yöntemini öneren bazı çalışmalar mevcuttur (Yuziang vd., 2009; Hua ve Liang, 2009; Li ve Liu, 2011). Yasanur (2010) lojistik merkez yer seçim problemine bulanık analitik ağ süreci (AAS) yöntemi ile YSA yapısını birleştirerek bir çözüm yaklaşımı geliştirmiş olup, Önden vd. (2016) ise lojistik yer seçimi problemini bulanık AAS yöntemi ile ele almışlardır. Problem için yapay sinir ağlarını öneren çalışmalara daha az rastlanmıştır (Kayıkçı, 2010; Pamucar vd., 2016).
Bu çalışmada, kentsel lojistik faaliyetlerinin verimli ve etkin bir şekilde gerçekleştirilmesi için il çevresine konumlandırılacak olan lojistik merkezlerin yer seçimi problemine sürdürülebilir bir yaklaşım geliştirilmesi amaçlanmıştır. Lojistik merkezlerin yer seçimi probleminde, literatürde ele alınan bazı önemli ölçütlerin yanı sıra sosyo-ekonomik ve çevresel etkiler de göz önünde bulundurulmuştur.
Tasarlanan YSA, giriş değerlerinin farklı olacağı çeşitli kentlere ait lojistik merkez yeri seçimi problemlerinde karar vericilere destek olabilecek niteliktedir.
2. LİTERATÜR TARAMASI
Kent içine, dışına yük aktarma, taşıma ve kent içi lojistik faaliyetlerinin toplamı kentsel lojistik olarak adlandırılmaktadır. 1970’lerde kentsel yük taşımacılığı hakkında trafik düzenlemeleri ile ilgili yoğun faaliyetler yapılsa da 1975-1980 yılları

Journal of Management, Marketing and Logistics -JMML (2017), Vol.4.(2), p.107-115 Kaya, Ozturk
_________________________________________________________________________________________________
DOI: 10.17261/Pressacademia.2017.455 109
arasında çalışmalardaki yoğunluk azalmıştır (Crainic ve Storchi, 2009). Benjelloun ve Crainic (2009) çalışmasında trafik ve park etme ile ilgili düzenlemelerin kentsel yük taşımacılığı için gerekli olduğu fakat yeterli olmadığının ve yeni stratejiler geliştirilmesinin kaçınılmaz olduğunu belirtmiştir. Kentsel alanlarda çeşitli boyutlarda olan yük taşıma araçlarının hareket sayılarının fazla olması, çoğu aracın kapasitesinin verimli kullanılamaması gibi sorunların varlığı, trafik ve park etme düzenlemeleri ile çözülemez hal almıştır (Benjelloun ve Crainic, 2009). Trafik yoğunluğunun artması, trafik sıkışıklığı ile ilgili problemlerin artması, trafik düzenlemelerinin bu problemlere yetersiz kalması ve halkın baskısı sonucu 1990’larda bu konu hakkındaki araştırmalara yoğunluk verilmiştir (Crainic ve Storchi, 2009; Benjelloun ve Crainic, 2009). Taniguchi vd. (2001) tarafından “kentsel alanlarda lojistik ve taşıma faaliyetlerinin ileri bilgi sistemleri desteği ile trafik sıkışıklığı, trafik güvenliği, enerji tasarrufu gibi faktörleri göz önünde bulundurarak optimize edilmesi” olarak tanımlanan kentsel lojistik kavramı son yıllarda birçok araştırmaya konu olmuştur. Kentsel nüfus yüzdesinin yüksek olduğu büyük şehirlerde, kentsel lojistiğin çevresel, sosyal ve ekonomik etkileri düşünüldüğünde yük taşımacılık faaliyetlerinin incelenmesi, kontrol edilmesi ve planlanması önem taşımaktadır.
Kentsel lojistik taşıma sistemi stratejik, taktik ve operasyonel seviyede planlama gerektirir (Benjelloun ve Crainic, 2009). Planlama aktivitelerinin içerisinde lojistik merkezlerin kurulması ve lojistik ağında konumlandırılması büyük önem taşır. Lojistik merkezler, toplama, depolama, ayrıştırma, dağıtım ve taşıma gibi faaliyetler konusunda hizmet vererek taşımacılık sistemleri arasındaki akışın planlanması ve tüm lojistik faaliyetlerinin koordinasyonunun sağlanmasına katkıda bulunur. Farklı alanlarda faaliyet gösteren lojistik hizmet sağlayıcıların bir araya gelmesi, ortak giderlerin paylaşılması ve lojistik maliyetlerin azaltılmasının yanında, çevresel etkilerin en aza indirilmesi açısından lojistik köyler büyük önem taşımaktadır (Tanyaş ve Arıkan, 2013). Lojistik merkezleri, lojistik terminalleri, yük terminalleri, lojistik köy, lojistik platformlar, lojistik merkezler, şehir lojistik terminalleri gibi literatürde çeşitli tanımlamalarla yer almış olup, birçok çalışmaya konu olmuştur.
Literatürde lojistik merkezlerin yer seçimi için göz önünde bulundurulması gereken faktörler çeşitlilik göstermektedir. Lojistik merkez yer seçimi problemi ile ilgili 2008-2016 yılları arasında yapılan çalışmalar incelenmiş olup, faktörlerin çalışmalarda ele alınma sıklıkları sırası ile: ulaşım kolaylığı, maliyet, arazi uygunluğu faktörleri olarak saptanmıştır. Sosyo-ekonomik ve çevresel faktörlere nispeten daha az rastlanmıştır. Lojistik merkez yer seçim problemi ile ilgili taranan çalışmalarda ele alınan faktörler ulaşım kolaylığı, maliyet, arazi uygunluğu ve sosyo-ekonomik, çevresel faktörler olmak üzere dört ana grupta toplanmıştır. Ulaşım kolaylığı, havaalanı, karayolu, liman ve demiryollarına, şehir merkezine, üretim ve tüketim merkezlerine, sanayi bölgelerine, serbest bölgelere, bölgedeki diğer illere yakınlık gibi faktörler bu grup altında incelenmiştir. Özellikle havaalanına ve karayoluna yakınlık lojistik merkez yer seçiminde önemlidir (Bamyacı, 2008; Eryürek 2010; Arıkan 2012; Can, 2012; Elgün, 2012; Görgül, 2012; Peker, 2012; Demiroğlu, 2014; Elevli, 2014; Önder vd., 2014; Önden vd., 2015; Özceylan vd., 2016; Önden vd., 2016; Perker vd., 2016). Havaalanı ve karayoluna yakınlığın yanında, limanlara ve demiryollarına yakınlık da önemli kriterler arasında yerini almaktadır (Bamyacı, 2008; Can, 2012; Elgün, 2012; Peker, 2012; Önder vd., 2014; Önden vd., 2016; Özceylan vd., 2016). Literatürde lojistik merkez yer seçimi kapsamında çeşitli ulaşım modlarına olan yakınlık faktörü literatürde sıklıkla ele alınırken, üretim ve tüketim merkezlerine yakınlık (Bamyacı, 2008; Eryürek, 2010; Kayıkçı, 2010; Elgün, 2012; Peker vd., 2016) gibi faktörler nispeten daha az incelenmiştir. Ulaşılabilirlik faktöründen sonra literatürde sıklıkla geçen bir diğer faktör ise maliyettir. Arsa maliyeti lojistik merkez yer seçim problemi için kritik bir faktördür (Hua ve Qi-Hong, 2009; Eryürek, 2010; Arıkan, 2012; Elevli, 2014; Önder vd., 2014; Rao vd., 2015; Özceylan vd., 2016; Peker vd., 2016). Arsa maliyeti yanında, inşaat, yol, su, elektrik, doğalgaz, arazi ve çevre düzenleme, güvenlik gibi faaliyetlerin oluşturduğu maliyetler, bir diğer deyişle yatırım maliyeti (Hua ve Qi-Hong, 2009; Can, 2012; Peker, 2012; Sürmeli, 2013; Peker vd., 2016), işletme maliyeti (Bamyacı, 2008; Hua ve Qi-Hong, 2009; Eryürek, 2010; Sürmeli, 2013; Peker vd., 2016) gibi maliyet kalemleri de lojistik merkez yer seçimi için kritiktir. Lojistik merkez yer seçimi için önemli bir diğer faktör grubu ise arazi özellikleridir. Arazinin bulunduğu zemin yapısının uygunluğu (Bamyacı, 2008; Eryürek, 2010; Arıkan, 2012; Can, 2012; Elgün, 2012; Peker, 2012; Elevli, 2014; Özceylan vd., 2016; Peker vd., 2016), arazi büyüklüğü (Bamyacı, 2008; Eryürek, 2010; Elgün, 2012; Görgülü, 2012; Peker, 2012; Önder vd., 2014; Peker vd., 2016), arazinin genişleme olanağı (Sürmeli, 2008; Arıkan, 2012; Can, 2012; Elgün, 2012; Peker, 2012; Özceylan vd., 2016; Peker vd., 2016) gibi özellikleri de önem taşımaktadır.
Lojistik merkez yer seçimi için 2008-2016 yılları arasında incelenen literatürde nispeten daha az yer verilen ve bu çalışmada da dahil edilen bir diğer faktör grubu sosyo-ekonomik ve çevresel etkilerdir. Kentsel lojistik kapsamında, kent çevresine konumlandırılacak lojistik merkezlerin ekonomik yaşama etkisi (Bamyacı, 2008; Kayıkçı, 2010; Peker, 2012; Önder vd., 2014; Zak ve Weglinski, 2014; Peker vd., 2016), işsizlik ve kariyer gelişimine etkisi (Zak ve Weglinski, 2014), ikamet edenlere olan sosyal etkileri (Rao vd., 2015), nedenlerinde hava kirliliğinin payı büyük olan hastalık sayısında artma (Pamucar vd., 2016); kaza sayısı açısından güvenliğe etkisi (Zak ve Weglinski, 2014) gibi sosyo-ekonomik etkileri; trafik sıkışıklığı (Bamyacı, 2008; Kayıkçı, 2010; İnaç, 2012; Peker, 2012; Rao vd., 2015; Peker vd., 2016), çevreye yaydığı gaz emisyonu (Kayıkçı, 2010; Pamucar vd., 2016), oluşturduğu gürültü miktarı (Zak ve Weglinski, 2014; Pamucar vd., 2016) gibi çevresel etkileri bu çalışma kapsamında sosyo-ekonomik ve çevresel etkiler faktör grubu altında ele alınmıştır.

Journal of Management, Marketing and Logistics -JMML (2017), Vol.4.(2), p.107-115 Kaya, Ozturk
_________________________________________________________________________________________________
DOI: 10.17261/Pressacademia.2017.455 110
Lojistik merkez yer seçim problemine literatürde çeşitli çok kriterli karar verme yöntemleri ile çözüm arayışına gidilmiştir. Analitik hiyerarşi süreci (AHS) (Bamyacı, 2008; Eryürek; 2010; Arıkan, 2012; Can, 2012; Elgün, 2012; Görgülü, 2012; İnaç, 2012; Demiroğlu, 2014), bulanık analitik hiyerarşi süreci (B-AHS) (Kayıkçı, 2010; Önden vd., 2016), analitik ağ süreci (AAS) (Peker, 2012), VlseKriterijumska Optimizacija I Kompromisno Resenje (VIKOR) (Önder vd., 2014), Technique For Order Preference By Similarity To An Ideal Solution (TOPSIS) (Can, 2012; Rao vd., 2015; Özceylan vd, 2016), PROMETHEE (Elevli, 2014), The Elimination and Choice Translating Reality (ELECTRE) (Can, 2012; Zak, J. ve Weglinski, S., 2014) gibi çok kriterli karar verme teknikleri kullanılmıştır. Literatürde, nispeten daha az çalışmada yapay sinir ağlarından (Hua ve Qi-Hong, 2009; Kayıkçı, 2010; Pamucar vd., 2016) faydalanılmıştır.
Sonuç olarak, literatürde lojistik merkez yer seçiminde ulaşım modlarına yakınlık, maliyet, arazi uygunluğu gibi faktörler sıklıkla ele alınırken, sosyo-ekonomik ve çevresel etkiler ile ilgili faktörlere nispeten daha az rastlanmıştır. Lojistik merkez yer seçimi probleminde kullanılan yöntemlerde ise, literatürde sıklıkla çok kriterli karar verme teknikleri ele alınmış olup, YSA yöntemi ile lojistik merkez yer seçimi yapan çalışmalara son yıllarda ve nispeten daha az sıklıkla rastlanmıştır.
Bu çalışmada önerilen YSA ile, lojistik merkez yer seçim probleminde sosyo-ekonomik ve çevresel etkiler de ele alınmıştır. Önerilen YSA, literatürdeki çoğu çalışmadan farklı olarak, sadece belirli sayıdaki alternatif arasından lojistik merkez yeri seçimi yapmayıp, düşünülebilecek her yer için giriş değerleri girildiğinde, lojistik merkez olarak uygun/uygun değil sonucunu vererek karar vericilere destek olabilecek niteliktedir.
3. YAPAY SİNİR AĞLARI YÖNTEMİ
Yapay sinir ağları (YSA), insan beyninin çalışma prensibinden esinlenerek geliştirilmiş bilgi işleme sistemleridir (Hua ve Qi-Hong, 2009). Paralel dağılmış yapısı, öğrenme ve genelleme kabiliyeti gibi özellikleri YSA’yı çeşitli alanlarda oldukça sıklıkla kullanılan bir yöntem haline getirmiştir. YSA’nın öğrenme sürecinde kullanılan yönteme öğrenme algoritması denir (Haykin, 2008). YSA’da çok katmanlı geri yayılımlı ağ yapısı literatürde en çok kullanılan yapıdır (Hua ve Qi-Hong, 2009). Dış dünyadan gelen girdileri alan girdi katmanı, girdi katmanından gelen bilgileri işleyerek bir sonraki katmana aktaran gizli katman ve gizli katmandan gelen bilgileri işleyerek ağa verilen girdilere karşılık ağın ürettiği çıkışları belirleyerek dış dünyaya gönderen çıktı katmanlarından oluşur (Haykin, 2008). Ağ öğrenme kuralı Delta Öğrenme Kuralının genelleştirilmiş halidir.
Çalışmada kullanılan YSA’nın temel prensibi aşağıdaki gibidir: 𝑘 adet örnekten oluşan eğitim veri seti 𝑋 = [𝑋𝑘1, 𝑋𝑘2, … , 𝑋𝑘𝑁]
𝑇 olarak seçilir. Bu set içinde her örnek için girdilerin yanında, girdiler için ağın üretmesi gereken çıktılar belirlenmiştir. Gerçek çıktı 𝑦𝑘 iken beklenen çıktı 𝑑𝑘 olarak belirlenir. İleri yönde sinyal gönderilerek gizli katman çıktısı ve aktivasyon fonksiyonu çıktısı oluşturulur. Genelleştirilmiş Delta Kuralı, ileri doğru ve geri doğru hesaplama adımlarından oluşmaktadır. Yapay sinir ağına sunulan her bir girdi için ağ tarafından üretilen çıktı ağın beklenen çıktıları ile karşılaştırılır. Bunların arasındaki fark hata olarak kabul edilir. Öğrenmede amaç bu hatanın azaltılmasıdır. Bununla birlikte ağın ezberlemesinden kaçınılmalıdır. Hata aşağıdaki formül aracılığı ile bulunabilir.
𝐸𝑃 = 1/2∑ (𝑑𝑘 − 𝑦𝑘)2𝑛
𝑘=1 (1)
4. LOJİSTİK MERKEZ YER SEÇİMİ İÇİN YAPAY SİNİR AĞI YAKLAŞIMI
Lojistik merkez yer seçimi problemi için literatürde çoğunlukla çok kriterli karar verme teknikleri uygulanmıştır. Bu çalışmada ise, öğrenme ve genelleme yapabilme yeteneği, karmaşıklığın üstesinden gelebilmesi, değişik alanlardaki birçok karar verme probleminde başarıyla uygulanabilmesi (Aksoy ve Öztürk, 2011) gibi özellikleri nedeniyle YSA kullanımı tercih edilmiştir. Çalışmada çok katmanlı ağ yapısı ve geriye yayılma algoritması kullanılmıştır.
Lojistik merkez yer seçimi için oluşturulan YSA sistemi aşağıdaki adımları içermektedir:
Adım 1: YSA girdi ve çıktı parametrelerinin seçimi
Adım 2: YSA eğitim veri setinin belirlenmesi
Adım 3: YSA eğitimi
Adım 4: YSA’nın test edilmesi ve değerlendirilmesi
Adım 1: Girdi ve Çıktı Parametrelerinin Seçimi
YSA modelinin oluşturulması girdi ve çıktı parametrelerinin, eğitim algoritmasının ve gizli katman yapısının belirlenmesi süreçlerinden oluşmaktadır. YSA’nın girdisi, lojistik merkez yer seçimi için belirlenen kriterler olacaktır. Lojistik merkezlerin yer seçimi için kriterlerin belirlenmesi aşamasında 2008-2016 yılları arasında yapılan 21 adet çalışma incelenmiştir.

Journal of Management, Marketing and Logistics -JMML (2017), Vol.4.(2), p.107-115 Kaya, Ozturk
_________________________________________________________________________________________________
DOI: 10.17261/Pressacademia.2017.455 111
Problemin çözümü için çalışmalarda kullanılan kriterler ulaşım kolaylığı, maliyet, arazi uygunluğu ve sosyo-ekonomik-çevresel olmak üzere dört ana başlık altında toplanmıştır. Her grup altında yer alan alt kriterler dikkate alınarak çalışmalarda ilgili kriter grubuna yer verilme sıklık yüzdeleri hesaplanmıştır. Taranan çalışmalarda ulaşım kolaylığı, maliyet, arazi uygunluğu ve sosyo-ekonomik-çevresel etkiler kriterlerine yer verilme sıklığı yüzdeleri Tablo 1’de özetlenmiştir. Bu çalışmada bu dört ana kriter lojistik merkez yer seçiminde dikkate alınmıştır. Diğer bir deyişle, ulaşım kolaylığı, maliyet, arazi uygunluğu ve sosyo-ekonomik-çevresel olmak üzere bu dört kriter, tasarlanan YSA’nın girdisi olarak belirlenmiştir. Taranan makalelerde en az sıklıkta yer verilen sosyo-ekonomik ve çevresel kriterler, bu çalışma kapsamında önerilen YSA modelinde ele alınmıştır.
Ulaşım kolaylığı (𝐹1); denizyolu, demiryolu, havayolu ve diğer illere ulaşım şartları faktörleri göz önüne alınarak değerlendirilmiştir. Arazinin inşaat ve taşıma açısından uygunluğu, büyüklüğü, genişleme potansiyeli ve ilde arazi bulunabilirliği, arazi (𝐹2) faktörü altında ele alınmıştır. Maliyet (𝐹3) faktörü değerlendirilirken arazinin satın alma ve işletme maliyeti göz önünde bulundurulmuştur. Ekonomik yaşama etki, ikamet edenlere olumsuz sosyolojik etkileri, gürültü, görüntü ve hava kirliliği ve trafiğe etkisi sosyo-ekonomik ve çevresel etkiler faktörü (𝐹4) altında ele alınmıştır.
Tablo 1: Lojistik Merkez Yer Seçim Kriterlerine ve Alt Kriterlere Çalışmalarda Yer Verilme Sıklığı
Sıra No Kriterler Sıklık
1 Ulaşım Kolaylığı %86
1.1 1.2 1.3 1.4
Havayolu ulaşım şartları Denizyolu ulaşım şartları Demiryolu ulaşım şartları Diğer illere ulaşım şartları
%62 %48 %43 %33
2 Maliyet %86
2.1 2.2
Arazi satın alma maliyeti İşletme maliyeti
%57 %29
3 Arazi Uygunluğu %67
3.1 3.2 3.3 3.4
Arazi yapısı Arazi büyüklüğü Genişleme potansiyeli Arazi bulunabilirliği
%48 %43 %43 %10
4 Sosyo-Ekonomik ve Çevresel %43
4.1 4.2 4.3 4.4
Ekonomik yaşama katkısı Trafiğe etkisi İkamet edenlere olumsuz sosyolojik etkileri Gürültü, görüntü ve hava kirliliği
%29 %29 %10 %10
YSA çıktı katmanı bir adet nörondan oluşmaktadır. Çıktı, lojistik merkez yer seçimi için değerlendirilen konumun uygun olup olmadığını belirtir.
Adım 2: YSA Eğitim Veri Setinin Belirlenmesi
Türkiye’de lojistik merkez yer seçimi problemi ile ilgili yapılan araştırmalar incelenmiştir. AHS, ELECTRE ve TOPSIS (Can, 2012), F-PROMETHEE (Elevli, 2014), AHS (Eryürek, 2010; Arıkan, 2012; Elgün, 2012; Görgülü, 2012) ve AAS (Peker, 2012) yöntemleri uygulanarak lojistik merkez yer seçimi yapılan çalışmalardaki verilerden yararlanarak YSA eğitimi için veri seti oluşturulmuştur. 45 adet veri YSA’nın eğtitimi için kullanılmıştır. Bunlarda 38 tanesi eğitim, 7 tanesi doğrulama için seçilmiştir. Veri seti 1-5 Likert ölçeğine göre düzenlenmiştir. Parametrelere verilen puanların sırası ile açıklamaları verilmiştir: Ulaşım kolaylığı, maliyet, arazi uygunluğu ve sosyo-ekonomik-çevresel faktörlerin değerlendirmesinde 1 en kötü sonucu, 5 ise en iyi sonucu ifade etmektedir. En kötü ve en iyi arasındaki diğer durumlar 1 ile 5 arasındadır. Çıktıda ise, uygun konumlar için değer 1, uygun olmayan konumlar için değer 0 olarak belirlenmiştir.
Adım 3: YSA Eğitimi
Eğitim aşamasında YSA, eğitim kümesini kullanarak, eğitim sonrasında kullanıcı tarafından verilecek girişler için doğru cevaplar üretebilmeyi öğrenmektedir (Aksoy ve Öztürk, 2011). Bu çalışmada YSA Eğitimi için EasyNN-plus deneme sürümü kullanılmış olup, gizli katman, gizli katmandaki nöron sayıları, öğrenme oranı ve momentum için deneyler yapılmıştır. Deneyler sonucu oluşturulan YSA’ya ait gizli katman ve gizli katman nöron sayıları Tablo 2’de, öğrenme parametreleri Tablo 3’deki gibi elde edilmiştir.

Journal of Management, Marketing and Logistics -JMML (2017), Vol.4.(2), p.107-115 Kaya, Ozturk
_________________________________________________________________________________________________
DOI: 10.17261/Pressacademia.2017.455 112
Tablo 2: YSA Katman ve Nöron Sayıları
Girdi Katmanı Nöron Sayısı 4 Çıktı Katmanı Nöron Sayısı 1
Gizli Katman Sayısı 1 Gizli Katman Nöron Sayısı 3
Eğitim Veri Sayısı 38 Doğrulama Veri Sayısı 7
Tablo 3: YSA Parametreleri
Momentum 0,7
Öğrenme Oranı 0,5
Çevrim Sayısı 201
Hata Oranı <0,01
Lojistik merkez yer seçimi için deneyler sonucu elde edilen YSA’nın genel yapısı Şekil 1’deki gibidir. Ağın eğitim grafiği Şekil 2’de verilmiştir.
Şekil 1: Lojistik Merkez Yer Seçimi için YSA’nın Genel Yapısı
Şekil 2: YSA Eğitim Grafiği
Adım 4: YSA’nın Test Edilmesi ve Değerlendirilmesi
Ağın eğitiminin ardından, eğitim verileri içinde olmayan ve Türkiye’de kurulan lojistik merkezlerin uygunluğunun gerçek değerleri ile ağın verdiği çıktı değerleri karşılaştırılmıştır. İki test örneği olarak; TCDD tarafından Türkiye’de lojistik merkez kurulması uygun bulunan illerden (URL1: www.tcdd.gov.tr) birinin parametreleri ile uygun bulunan iller dışında kalan illerden birinin parametreleri test verisi olarak kullanılmıştır. Birinci test örneğinde; Ulaşım Kolaylığı:4, Maliyet:4, Arazi Uygunluğu: 3, Sosyo-Ekonomik-Çevresel: 3, Uygunluğunun Gerçek Değeri:1’dir. İkinci test örneğinde; Ulaşım Kolaylığı: 2, Maliyet: 3, Arazi Uygunluğu: 2, Sosyo-Ekonomik-Çevresel: 3, Uygunluğunun Gerçek Değeri:0’dır. Şekil 3 ve Şekil 4’te de görüldüğü üzere, YSA eğitim verileri içinde olmayan yeni girdi değerleri girildiğinde gerçek değere yakın çıktılar verebilmektedir.
Girdi Katmanı Gizli Katman Çıktı Katmanı Ulaşım Kolaylığı
Maliyet
Arazi Uygunluğu
Sosyo-Ekonomik-
Çevresel
Uygun/Uygun Değil
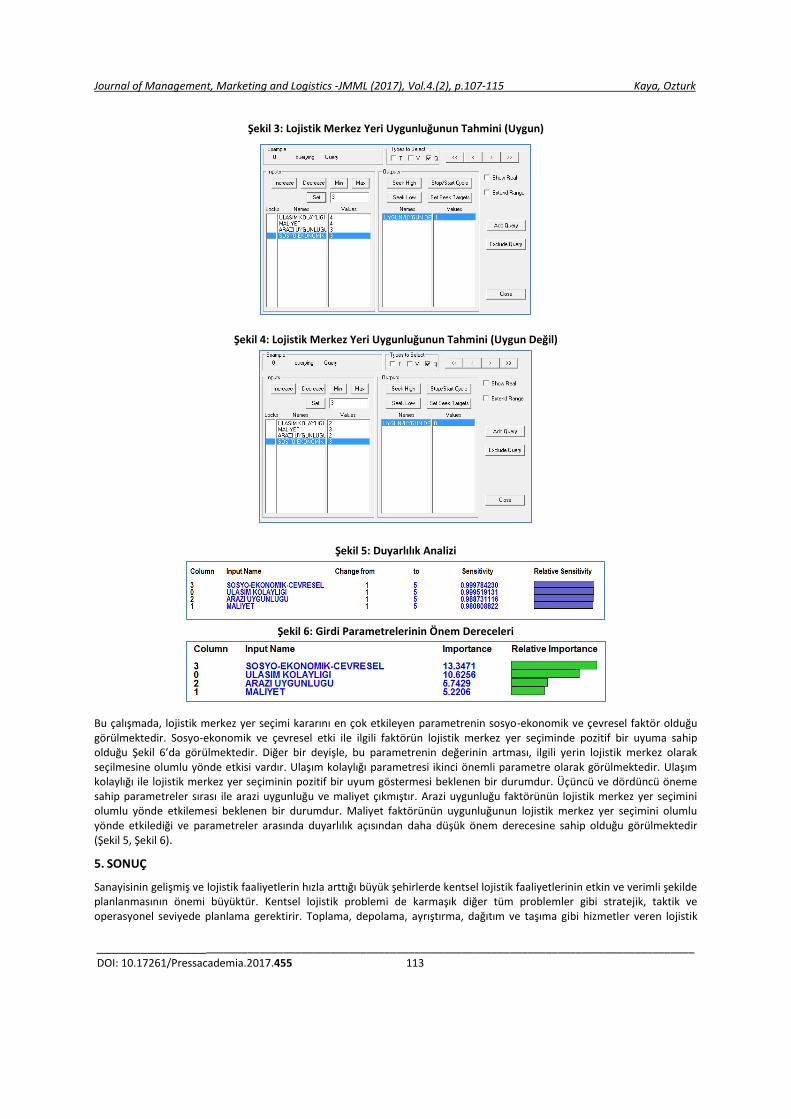
Journal of Management, Marketing and Logistics -JMML (2017), Vol.4.(2), p.107-115 Kaya, Ozturk
_________________________________________________________________________________________________
DOI: 10.17261/Pressacademia.2017.455 113
Şekil 3: Lojistik Merkez Yeri Uygunluğunun Tahmini (Uygun)
Şekil 4: Lojistik Merkez Yeri Uygunluğunun Tahmini (Uygun Değil)
Şekil 5: Duyarlılık Analizi
Şekil 6: Girdi Parametrelerinin Önem Dereceleri
Bu çalışmada, lojistik merkez yer seçimi kararını en çok etkileyen parametrenin sosyo-ekonomik ve çevresel faktör olduğu görülmektedir. Sosyo-ekonomik ve çevresel etki ile ilgili faktörün lojistik merkez yer seçiminde pozitif bir uyuma sahip olduğu Şekil 6’da görülmektedir. Diğer bir deyişle, bu parametrenin değerinin artması, ilgili yerin lojistik merkez olarak seçilmesine olumlu yönde etkisi vardır. Ulaşım kolaylığı parametresi ikinci önemli parametre olarak görülmektedir. Ulaşım kolaylığı ile lojistik merkez yer seçiminin pozitif bir uyum göstermesi beklenen bir durumdur. Üçüncü ve dördüncü öneme sahip parametreler sırası ile arazi uygunluğu ve maliyet çıkmıştır. Arazi uygunluğu faktörünün lojistik merkez yer seçimini olumlu yönde etkilemesi beklenen bir durumdur. Maliyet faktörünün uygunluğunun lojistik merkez yer seçimini olumlu yönde etkilediği ve parametreler arasında duyarlılık açısından daha düşük önem derecesine sahip olduğu görülmektedir (Şekil 5, Şekil 6).
5. SONUÇ
Sanayisinin gelişmiş ve lojistik faaliyetlerin hızla arttığı büyük şehirlerde kentsel lojistik faaliyetlerinin etkin ve verimli şekilde planlanmasının önemi büyüktür. Kentsel lojistik problemi de karmaşık diğer tüm problemler gibi stratejik, taktik ve operasyonel seviyede planlama gerektirir. Toplama, depolama, ayrıştırma, dağıtım ve taşıma gibi hizmetler veren lojistik

Journal of Management, Marketing and Logistics -JMML (2017), Vol.4.(2), p.107-115 Kaya, Ozturk
_________________________________________________________________________________________________
DOI: 10.17261/Pressacademia.2017.455 114
merkezlerin kurulması ve lojistik ağında en uygun şekilde konumlandırılması, taşımacılık sistemleri arasındaki akışın planlanmasına ve tüm lojistik faaliyetlerinin koordinasyonunun sağlanmasına katkıda bulunur. Lojistik merkezler, farklı alanlarda faaliyet gösteren lojistik hizmet sağlayıcıların bir araya gelmesi, ortak giderlerin paylaşılması ve lojistik maliyetlerin azaltılmasının yanı sıra, çevresel zararlı etkilerin en aza indirilmesi açısından önem taşımaktadır.
Bu çalışmada, uygun lojistik merkez yer seçimi probleminde; ulaşım kolaylığı, maliyet ve arazi uygunluğu gibi faktörlerin yanı sıra literatürde nispeten daha az sıklıkla karşılaşılan ve sürdürülebilirlik için önemli olan sosyo-ekonomik ve çevresel faktörler de göz önünde bulundurulmuştur. Bu probleme, literatürde daha çok, çeşitli çok kriterli karar verme yöntemleri ile çözüm arayışına gidilirken, bu çalışmada, kentsel lojistik planlama aktiviteleri kapsamında lojistik merkezlerin lojistik ağında konumlandırılması için bir YSA yaklaşımı önerilmiştir. Önerilen YSA yaklaşımında hesaplanan kriter ağırlıklarına bakıldığında, lojistik merkezlerin konumlandırılması probleminde sosyo-ekonomik ve çevresel kriterler grubunun yeri oldukça önemlidir. Bu çalışmada elde edilen YSA, literatürdeki çoğu çalışmadan farklı olarak, sadece belirli sayıdaki alternatif arasından lojistik merkez yeri seçimi yapmayıp, düşünülebilecek her yer için giriş değerleri girildiğinde, lojistik merkez olarak uygun/uygun değil sonucunu vererek karar vericilere destek olabilecek niteliktedir
Gelecek çalışmalarda, bu çalışma kapsamında önerilen YSA modelinde ele alınmış ve ana gruplar düzeyinde bırakılmış olan ulaşım kolaylığı, maliyet, arazi uygunluğu ve sosyo-ekonomik-çevresel faktörlerinin alt kriterlerinin daha detaylı dikkate alınılması düşünülmektedir. Havaalanı, karayolu, liman ve demiryollarına, şehir merkezine, üretim ve tüketim merkezlerine, sanayi bölgelerine, serbest bölgelere, bölgedeki diğer illere yakınlık gibi faktörler ulaşım kolaylığı grubu altında incelenebilir. Arsa maliyeti, inşaat, yol, su, elektrik, doğalgaz, arazi ve çevre düzenleme, güvenlik gibi faaliyetlerin oluşturduğu maliyetler bir diğer deyişle yatırım maliyeti, işletme maliyeti gibi maliyet kalemleri maliyet ana grubu altında ele alınabilir. Zemin yapısının uygunluğu, arazi büyüklüğü, arazinin genişleme olanağı gibi özellikler de arazi uygunluğu ana faktörü altında ele alınabilir. Lojistik merkezlerin ekonomik yaşama etkisi, işsizlik ve kariyer gelişimine etkisi, ikamet edenlere olan sosyal etkileri; nedenlerinde hava kirliliğinin payı büyük olan hastalık sayısında artma, kaza sayısı açısından güvenliğe etkisi gibi sosyo-ekonomik etkileri; trafik sıkışıklığı, çevreye yaydığı gaz emisyonu, oluşturduğu gürültü miktarı gibi çevresel etkileri bu çalışma kapsamında sosyo-ekonomik ve çevresel etkiler faktör grubu altında ele alınmıştır. İleriki çalışmalarda bu alt kriterlere daha detaylı yer verilmesi düşünülmektedir.
KAYNAKLAR
Aksoy, A., Öztürk, N. 2011, “Supplier selection and performance evaluation in just-in-time production environments”, Expert Systems with Applications, vol. 38, pp. 6351-6359.
Arıkan, F. 2012, “Lojistik Köyler ve Bir Uygulama”, Bahçeşehir Üniversitesi Fen Bilimleri Enstitüsü Kentsel Sistemler ve Ulaştırma Yönetimi, Yüksek Lisans Tezi, İstanbul.
Bamyacı, M. 2008, “Modern Lojistik Yönetimi: Organize Lojistik Bölgeleri için Bir Yer Seçimi Modeli”, İstanbul Üniversitesi Fen Bilimleri Enstitüsü Deniz Ulaştırma İşletme Mühendisliği Anabilim Dalı, Doktora Tezi, İstanbul.
Benjelloun, A., Crainic T.G. 2009, “Trends, Challenges, and Perspectives In City Logistics”, Buletinul AGIR, no. 4, pp. 45-51.
Can, A. M. 2012, “Çok Kriterli Karar Verme Teknikleri ile Samsun Lojistik Köyü Yerinin Belirlenmesi”, Erciyes Üniversitesi Fen Bilimleri Enstitüsü Endüstri Mühendisliği Anabilim Dalı, Yüksek Lisans Tezi, Kayseri.
Crainic, T.G., Ricciardi, N., Storchi, G. 2009, “Models for evaluating and planning city logistics systems”, Transportation Science, vol. 43, pp. 432-454.
Demiroğlu, Ş., Eleren, A. 2014, Küresel lojistik köyleri ve Türkiye’de kurulması planlanan lojistik köy bölgelerinin ÇKKV yöntemleriyle belirlenmesi”, Dumlupınar Üniversitesi Sosyal Bilimler Dergisi, sayı 42, s. 189-202.
EasyNN-plus Help, The user interface manual.
Elevli, B. 2014, “Logistics freight center locations decision by using Fuzzy- PROMETHEE”, Transport, vol. 29, pp. 412-418.
Elgün, M. N. 2011, “Uluslararası Taşıma Ve Ticarette Lojistik Köylerin Sağladığı Rekabet Avantajları: Bir Model Önerisi”, Afyon Kocatepe Üniversitesi Sosyal Bilimleri Enstitüsü Işletme Ana Bilim Dalı, Doktora Tezi, Afyonkarahisar.
Eryürük, S. H. 2010, “Tekstil ve Konfeksiyon Sektörleri Arasında Etkin Lojistik Faaliyetlerinin Gerçekleştirilmesi Amacıyla Bir Lojistik Merkez Yer Seçimi Ve Tasarımı”, İstanbul Teknik Üniversitesi Fen Bilimleri Enstitüsü Tekstil Mühendisliği Ana Bilim Dalı, Doktora Tezi, İstanbul.
Görgülü, H. 2012, “Lojistik Köyler ve Konya Uygulaması”, Bahçeşehir Üniversitesi Fen Bilimleri Enstitüsü Kentsel Sistemler ve Ulaştırma Yönetimi, Yüksek Lisans Tezi, İstanbul.

Journal of Management, Marketing and Logistics -JMML (2017), Vol.4.(2), p.107-115 Kaya, Ozturk
_________________________________________________________________________________________________
DOI: 10.17261/Pressacademia.2017.455 115
Haykin, S. 2008, “Neural Networks and Learning Machines”, 3rd Edition, Prentice Hall.
Hua, J., Qi-hong., L. 2009, “Study on logistics center location judgement based on Aritificial Neural Networks”, First International Workshop on Education Technology and Computer Science, pp. 346-348.
İnaç, H. 2012, “İstanbul’un Kentsel Lojistik Analizi ve Çözüm Önerilerinin AHP ile Değerlendirilmesi”, Bahçeşehir Üniversitesi Fen Bilimleri Enstitüsü Kentsel Sistemler ve Ulaştırma Yönetimi, Yüksek Lisans Tezi, İstanbul.
Li, Y., Liu, Y. 2011, “The Application of Fuzzy Neural Network in Distribution Center Location”, International Conference on Energy Systems and Electrical Power, no: 13, 6458-6463.
Lin, J. 2012, “The application of logistic center location based on Fuzzy BP Neural Network” Service Systems and Service Management, 9th International Conference.
Önden, İ., Eldemir, F., Çancı, M. 2015, “Logistics center concept and location decision criteria”, Sigma Journal Engineering and Natural Sciences, vol. 33, pp. 325-340.
Önden, İ., Acar, A. Z., Eldemir, F. 2016, “Evaluation of the logistics center locations using a multi-criteria spatial approach”, Transport, Article in press, pp. 1-13.
Önder, E., Yıldırım, B. F. 2014, “VIKOR method for ranking logistic villages In Turkey”, Yönetim ve Ekonomi Araştırmaları Dergisi, sayı 23, s. 293-314.
Özceylan, E., Erbaş, M., Tolon, M., Kabak, M., Durgut, T. 2016, “Evaluation of freight villages: A GIS-based multi-criteria decision analysis”, Computers In Industry, vol. 76, pp. 38-52.
Pamucar, D., Vasin L., Atanaskovic, P., & Milicic, M. 2016, “Planning the city logistic terminal location by applying the green p-median model and type-2 Neurofuzzy Network”, Computational Intelligence and Neuroscience, vol. 2016, pp. 1-15.
Peker, İ. 2012, “Analitik Ağ Süreci yöntemiyle lojistik merkez yer seçimi: Trabzon örneği”, Karadeniz Teknik Üniversitesi İşletme Ana Bilim Dalı, Doktora Tezi, Trabzon.
Peker, İ., Baki, B., Tanyaş, M., Ar, İ. M. 2016, “Logistics center site selection by ANP/BOCR analysis: A case study of Turkey”, Journal of Intelligent & Fuzzy Systems, vol. 30, pp. 2383–2396.
Rao, C., Goh, M., Zhao, Y., Zheng, J. 2015, “Location selection of city logistics centers under sustainability”, Transportation Research, vol. 36, pp. 29-44.
Sürmeli, G. 2013, “Lojistik Merkezi Seçimine Yönelik Bulanık Çok Ölçütlü Karar Verme Modeli: Doğu Anadolu Bölgesi için bir uygulama”, Yıldız Teknik Üniversitesi Fen Bilimleri Enstitüsü Endüstri Mühendisliği Ana Bilim Dalı Sistem Mühendisliği, Yüksek Lisans Tezi, İstanbul.
Taniguchi, E., Thompson, R. G., Yamada, T., Duin, R. V. 2001, “City Logistics, Network Modelling and Intelligent Transport Systems”, Elsevier, Pergamon, Oxford, 252 pp.
Tanyaş, M., Arıkan, F. 2013, “Bursa İli Lojistik Merkez Ön Fizibilite Raporu”, T.C. Kalkınma Bakanlığı ve Bursa Eskişehir Bilecik Kalkınma Ajansı, Bursa.
Villamizar, A. F. M., Torres, J. R. M., Padilla, N., H. 2014, “Mathematical programming modeling and resolution of the location-routing problem in urban logistics”, Ing. Univ. Bogotá, Colombia, vol. 18, pp. 271-289.
Kayıkçı, Y. 2010, “A conceptual model for intermodal freight logistics centre location decisions”, Procedia Social and Behavioral Sciences, vol. 2, pp. 6297–6311.
URL 1, www.tcdd.gov.tr.
Yuxiang, S., Qing, C., Zhenhua, W. 2009, “Logistics distribution center location evaluation based on Genetic Algorithm and Fuzzy Neural Network”, Computational Intelligence and Intelligent Systems, vol. 51, pp. 305-312.
Zak, J., Weglinski, S. 2014, “The selection of the logistics center location based on MCDM/A methodology”, Transportation Research Procedia, vol. 3, pp. 555-564.

Journal of Management, Marketing and Logistics -JMML (2017), Vol.4(2),p.116-124 Zengin, Akunal
_________________________________________________________________________________________________
DOI: 10.17261/Pressacademia.2017.456 116
GREEN LOGISTICS PRACTICES IN TURKEY DOI: 10.17261/Pressacademia.2017.456 JMML- V.4-ISS.2-2017(5)-p.116-124 Esra Zengin
1, Ebru V. Ocalir Akunal
2
1Gazi University, Ankara, Turkey. [email protected] 2Gazi University, Ankara, Turkey. [email protected] _________________________________________________________________________________________________________________
To cite this document Zengin, E. and E.V.O.Akunal, (2017). Green logistics practices in Turkey. Journal of Management, Marketing and Logistics (JMML), V.4, Iss.2, p.116-124. Permemant link to this document: http://doi.org/10.17261/Pressacademia.2017.456 Copyright: Published by PressAcademia and limited licenced re-use rights only.
ABSTRACT Purpose- Since the beginning of the 1990’s, researches on using environmentally friendly technologies in logistic practices to mitigate the
damage to environment have begun. A new application area, green logistic, has emerged which takes environmental and social factors into
consideration, which is interested with the goods that are produced and distributed in a sustainable manner, and that aims to minimize
energy consumption in logistics activities, minimize wastes and manage operations. This study aims to present the green logistics practices
in Turkey.
Methodology- The indicators table was prepared with datas from literature review, face-to-face interviews with firms in the scope of the
research field and questionnaire with questions about activities. Face-to-face and phone calls with company officials, sustainability reports
from the green logistics sector, and articles and news on the internet related to the subject were utilized.
Findings- It is determined that logistics companies in Turkey adopt green logistics indicators.
Conclusion- The study reveals that green logistics applications are seen in Turkey and companies are trying to enrich their business policies
with a green point of view and that green logistics will provide competitive advantages in terms of logistics companies in the coming years.
Keywords: Green logistics, reverse logistics, sustainable logistics, supply chain, supply chain management
JEL Codes: M10, Q54, R41
TÜRKİYE’DE YEŞİL LOJİSTİK UYGULAMALARI
ÖZET Amaç -1990’lı yılların başlarında lojistik uygulamalarında çevre dostu teknolojilerin kullanılarak, çevreye verilen zararın en aza indirgenmesi
konusunda araştırmalar yapılmaya başlanmıştır. “Yelil Lojistik” adı verilen ve çevresel ve sosyal faktörleri göz önünde bulundurarak
sürdürülebilir yolda üretilen ve dağıtılan mallar ile ilgilenen ve farklı dağıtım stratjilerinin çevresel etkilerinin ölçülmesini, lojistik
faaliytetlerde enerji kullanımını azaltmayı, atıkların azaltılmasını ve işleyişinin yönetimini amaçlayan yeni bir uygulama alanı ortaya çıkmıştır.
Bu çalışma, Türkiye’de Yeşil lojistik uygulamalarını ortaya koymayı amaçlamaktadır.
Yöntem- Çalışmada literatür taramasından, firmalar ile saha araştırması kapsamında yüzyüze görüşmelerden ve faaliyetlere ilişkin soruların
yer aldığı anket sunumundan elde edilen veriler ile göstergeler tablosu hazırlanmıştır. Firma yetkilileri ile yüzyüze ve telefon görüşmeleri,
yeşil lojistik sektörüne ait sürdürülebilirlik raporları ve konuyla ilgili internette olan makale ve haberlerden yararlanılmıştır.
Bulgular- Türkiye’deki lojistik firmaların yeşil lojistik göstergelerini benimsedikleri tespit edilmiştir.
Sonuç- Çalışma ile Türkiye’de yeşil lojistik uygulamaların görüldüğü ve işletme politikalarının yeşil bakış açısı ile zenginleştirmeye çalıştıkları
ve gelecek yıllarda lojistik firmalar açısından rekabet ortamında avantajlar sağlayacağı ortaya çıkmıştır.
Anahtar Kelimeler: Yeşil lojistik, tersine lojistik, sürdürülebilir lojistik, tedarik zinciri, tedarik zinciri yönetimi
JEL Kodları: M10, Q54, R41
Year: 2017 Volume: 4 Issue: 2
Journal of Management, Marketing and Logistics – (JMML), ISSN: 2148-6670, http://www.pressacademia.org/journals/jmml

Journal of Management, Marketing and Logistics -JMML (2017), Vol.4(2),p.116-124 Zengin, Akunal
_________________________________________________________________________________________________
DOI: 10.17261/Pressacademia.2017.456 117
1. GİRİŞ
1980’lerin sonlarında ulaşım sektörüne girmeyi başaran “yeşil” kavramı, ulaşım sistemlerinin yarattığı çevresel problemler konusunda farkındalık oluşmasını sağlamıştır. 1990’lı yılların başlarında lojistik uygulamalarında çevre dostu teknolojilerin kullanılarak, çevreye verilen zararın en aza indirgenmesi konusunda araştırmalar yapılmaya başlanmıştır. Ulaştırma sektörü çevresel bozulmaya önemli bir katkıda bulunmaktadır.Dünya genelinde toplam sera gazı emisyonunun yaklaşık %24’ü lojistik faaliyetlerden kaynaklanmaktadır. Yeşil kelimesi, 1980’lerin sonlarında ve 1990’ların başlarında ulaşım sektöründe bir slogan haline gelmiştir. Asit yağmurları, küresel ısınma gibi kamusal sorunlar ile birlikte çevresel problemlerin farkındalığı giderek artmıştır. Dünya Çevre ve Kalkınma Komisyonu Raporu (1987), siyasi ve ekonomik alanlarda yeşil konular üzerine önemli destekler vermiştir (Banister ve ark, 1993). 1990’ların başlarında, çevrenin lojistik sektöre nasıl dahil edilebileceği konusunda çalışmalar ve raporlar hazırlanmıştır.
Yeşil kavramı, lojistik ile entegre edilmiş ve ortaya “yeşil lojistik” adlı çevresel ve sosyal faktörleri göz önünde bulundurarak sürdürülebilir yolda üretilen ve dağıtılan mallar ile ilgilenen ve farklı dağıtım stratejilerinin çevresel etkilerinin ölçülmesini, lojistik faaliyetlerde enerji kullanımını azaltmayı, atıkların azaltılmasını ve işleyişinin yönetimini amaçlayan yeni bir uygulama alanı çıkmıştır.
Türkiye’de pek çok firma tarafından lojistik faaliyetlerin tamamına ya da bir kısmına ‘yeşil’ çözümler eklenerek sürdürülebilir ilkeler doğrultusunda çevreyle dost birtakım politikalar üretilmektedir. Yabancı yazında yaklaşık on yıl öncesine ait yeşil lojistik konusu ile ilgili yayınlara ulaşılabilirken, ülkemizde bu konuda araştırmaların henüz çok yeni olduğu görülmektedir.
Bu çalışmanın amacı, Türkiye’de yeşil lojistik uygulamalarını incelemek ve göstergelerini araştırarak Türkiye’deki firmaların yeşil lojistiği faaliyetlerine ne kadar ve nasıl dahil ettiği, yeşil lojistik göstergeleri, yeşil lojistik firmalarının yer seçimleri ve gerekli yasal mevzuatın nasıl olması gerektiği ile ilgili kapsamlı öneriler ortaya koymaktır.
Çalışmada yöntem olarak öncelikle detaylı bir literatür taraması yapılması benimsenmiştir. Konunun teorik temelleri oluşturulduktan sonra, yeşil lojistiğin göstergeleri, literatür taraması ve dünya örnekleri araştırılarak özetlenmiştir. Saha araştırmasının birinci aşamasında belirlenen yeşil lojistik göstergelerinin, Türkiye’de yeşil lojistik uygulamalarına geçtikleri iddiasındaki firmalar tarafından ne derece benimsendiği araştırılmış, sonuçlar tablolar halinde sunulmuştur. Saha araştırmasının ikinci aşamasında ise, yeşil lojistiğin bileşenlerinden olan tersine lojistik uygulamasını benimseyen bir firmada derinlemesine yapılan araştırmanın sonuçları sunulmaktadır. Çalışma, bulguların değerlendirilmesi ile sonuçlanmaktadır.
2. LİTERATÜR TARAMASI
Yeşil lojistik, paketleme, atık yönetimi ve ulaşım odaklı işleyen yük dağıtım faaliyetlerinin çevre ve enerji ayak izini azaltan tedarik zinciri yönetim uygulamaları olarak tanımlanmaktadır (Seroka, 2014). Tedarik zinciri ne kadar ‘yeşil’ ise lojistik faaliyetleri de o kadar çevresel ve sürdürülebilir olarak karşımıza çıkmaktadır. Lojistik, tedarik zinciri boyunca ürünleri taşımak için gerekli tüm aktivitelerin entegre edilmiş yönetimidir. “Yeşil lojistik” ise, sosyal ve çevresel faktörleri de göz önünde bulundurarak sürdürülebilir bir şekilde üretilen ve dağıtılan mallar ile ilişkilidir.
Gelecekteki lojistiğin temeli, yeşil lojistiğe dayanmaktadır. Lojistik amaçlar, lojistik politikaların ekonomik etkileri ile ilişkilendirilmemektedir; ancak çevre kirliliği ve toplum üzerindeki etkileri göz önünde tutulmaktadır. Yeşil lojistik faaliyetleri; farklı dağıtım stratejilerinin çevresel etkilerinin ölçülmesini, lojistik faaliyetlerde enerji kullanımının azaltılmasını, atıkların azaltılmasını ve arıtılmasını içermektedir. Son yıllarda insan faaliyetlerinin ve lojistik aktivitelerin dünya üzerindeki çevresel etkileri ile ilgili kavramlar giderek artmış ve bunların, uzun dönemde sürdürülebilir olmadığı ortaya atılmıştır. Pek çok organizasyon ve işletme, karbon ayak izlerini ölçmeye başlamış ve faaliyetlerinin çevresel etkilerini görebilmiştir. Emisyonların ve diğer çevresel ölçümlerin azaltılması, hükümetlerin de politikalarında yer bulmuştur. Firmaların ve hükümetlerin yeşil lojistiğe olan ilgisi giderek artmıştır (Tao, 2001).
Yeşil lojistiğin kurulum modeli yedi bileşenden oluşmaktadır (Tao, 2001):
Yeşil Tedarik Zinciri: Çevresel yönetim stratejileri geliştirmek için nüfus, kaynak ve çevresel gereksinimlerin karşılanması olarak tanımlanmaktadır. Yeşil tedarik zinciri yönetimi, çevresel problemlerin çözümündeki en etkili yollardan biridir. Yeşil tedarik zinciri yönetimi, sürdürülebilir kalkınma teorisini temel alarak geliştirilmiştir.
Yeşil Üretim Lojistiği: Yeşil üretim lojistiği, doğru zamanda ve doğru kalitede doğru ürün ile beslenen çalışma istasyonu ve makinenin olmasını sağlamaktır.
Yeşil Ulaşım Lojistiği: Yeşil ulaşım lojistiğinin amacı, ulaşımda enerji tüketimini azaltmak, atık malzemeleri azaltmak ve karayolunda ulaşım aracı doluluğunu azaltmaktır.
Yeşil Paketleme: Atıkların artması, sürdürülebilir kalkınmayı etkilemektedir ve ambalaj atıkları, katı atıkların önemli bir kısmını oluşturmaktadır. Yeşil paketleme, yasalar, yönetmelikler ve dönüşüm sistemleri ile ambalaj atıklarını azaltabilecek bazı önlemlerin ortaya konulmasını içermektedir.

Journal of Management, Marketing and Logistics -JMML (2017), Vol.4(2),p.116-124 Zengin, Akunal
_________________________________________________________________________________________________
DOI: 10.17261/Pressacademia.2017.456 118
Yeşil Dağıtım Süreci: Yeşil dağıtım süreci, iki önemli boyutu içermektedir. Birincisi, kaynak kullanımında verimliliği artırmak için firma ölçeklerine bağlı olarak profesyonel işlem süreçlerine odaklanarak tüketici sürecini değiştirmektir. İkincisi ise tüketicilerin atıkları tarafından oluşan çevre kirliliğini azaltmak için işlenmiş hurda malzemelerinin toplanmasıdır.
Yeşil Dağıtım Lojistiği: Yeşil dağıtım lojistiği, alıcının pazar koşulları altında büyük bir önem arz etmektedir. Bu yalnızca, depolama, sınıflandırma, ambalajlama, taşıma şeklinde değildir; aynı zamanda daha iyi bir hizmet sağlayarak müşterilerin güvenini kazanmayı da sağlamaktadır.
Atık Malzeme Lojistiği: Kaynakların, çevrenin, toplumun ve ekonominin sürdürülebilir gelişmesi için gerekli olan atık malzeme lojistiğine çok fazla dikkat çekilmesi gerekmektedir. Atık malzeme lojistiğinin önemi, giderek daha fazla dikkat çekmektedir. Atık malzeme yönetiminde fayda-denge prensibi, kontrol prensibi ve sistem prensibi önemli bir yer almalıdır.
Yeşil tedarik zincirinin bileşenleri; yeşil satın alma, yeşil üretim, yeşil pazarlama, yeşil paketleme (ambalajlama) ve tersine lojistiktir.
Yeşil satın alma, tedarik zincirindeki en önemli faaliyetlerden birisidir. Üretim sırasında kullanılacak hammaddenin geri dönüşümünün mümkün olması ve kullanım ömrünü tamamladıktan sonra toprakta kolaylıkla çözünebilen olması gibi çevresel hassasiyetler göz önünde bulundurularak seçilmesi, yeşil satın alma sürecidir. Çevresel hassasiyetler, yalnızca hammadde seçiminde değil; aynı zamanda kullanılacak teknoloji seçilirken de dikkate alınmaktadır.
Yeşil üretim, ürünün tasarım aşamasından itibaren çevresel etkileri düşük, verimliliği yüksek girdilerin kullanılması ve kullanım sonrası atık ve kirlilik ortaya çıkarmaması gibi olanakların değerlendirilmesi sürecidir. Yeşil üretim süreci, iki aşamalı olarak ele alınmaktadır (İnce, 2013):
- Ürün yaklaşımı: Çevresel hassasiyeti yüksek ürünlerin geliştirilmesi - Süreç yaklaşımı: Ürün imalatında ve diğer işlem basamaklarında enerji kullanımının ve atık oluşumunun azaltılarak
geliştirilmesi
Yeşil pazarlama, malların dağıtımı sırasında oluşan atık miktarını minimize etmeyi amaçlamaktadır. Yeşil paketleme ve yeşil lojistikten meydana gelmektedir. Ekolojik ya da sürdürülebilir pazarlama olarak da adlandırılan yeşil pazarlama, 1990ların başında önem kazanmıştır. Amerikan Pazarlama Derneği yeşil pazarlamayı, “Kirlilik üzerine yapılan pazarlama çalışmalarını, enerji tüketimiyle ilgili konuları ve yenilenemeyen kaynakların tüketiminin olumlu ve olumsuz yanlarını inceleyen bilim dalı” olarak tanımlamış ve bir bilim dalı olduğunu ifade etmiştir. En genel tanımıyla yeşil pazarlama, doğa dostu ürünlerin üretilerek fiyatlandırılması ve dağıtılmasının yanı sıra kullanım sonrasını da kapsayan pazarlama faaliyeti olarak tanımlanmaktadır.
Yeşil paketleme (ambalajlama), çevreye etkisi minimum olan paketleme malzemelerinin kullanılarak ürünün herhangi bir zarara uğramadan taşıma işlemlerinin gerçekleştirilmesini amaçlamaktadır.
Tersine lojistik, ürünlerin geri dönüşü, değişim, tadilat / yenileme, yeniden pazarlama ve bertarafı olarak tanımlanmaktadır. Üreticiden tüketiciye giden malların herhangi bir nedenle geri dönüşü ya da kullanılan ürünün üretici tarafından yeniden alınarak geri dönüşümünün planlanması, uygulanması ve kontrol edilmesidir. Herhangi bir soru nedeniyle müşteri tarafından kabul görmeyen ve geri iade edilen ürünün yenilenmesi ile malzeme ve teknoloji kullanımının minimize edilmesi ile kullanım ömrü dolan ürünün geri dönüşüm ile üreticiye yeni hammadde temini sağlaması bakımından tersine lojistik, yeşil lojistikte önemli bir bileşen olarak karşımıza çıkmaktadır. Yeşil lojistik birden fazla boyuta sahiptir; ancak firmalar tek bir boyutu ile bile yeşil lojistiği faaliyetler sürecine dahil etmektedir. Örneğin; bir firma malzeme ambalajlama miktarını azaltarak paketleme aşamasında yeşil lojistiği kullanırken diğer bir firma ise taşımada alternatif enerjileri kullanarak dağıtım aşamasına yeşil lojistiği dahil edebilmektedir. Her iki durumda da bir yeşil lojistik stratejisi, tedarik zinciri sürecine uygulanmaktadır. Bu bileşenlerden tersine lojistik, en bilinen ve neredeyse yeşil lojistik ile eş anlamlı olarak kullanılacak kadar yaygınlaşmış bir süreçtir. Bu nedenle, bu çalışmada bir saha çalışması ile birlikte derinlemesine incelenmesinde fayda görülmüştür.
2.1. Tersine Lojistik
Yeşil lojistikle tersine lojistik genellikle aynı anlamda kullanılmaktadır; ancak içerik ve amaç bakımından farklılıklar göstermektedir. Yeşil lojistikte çevresel kaygılar ön plana çıkarken tersine lojistikte ekonomik kaygılar temel stratejiyi oluşturmaktadır. Tersine lojistik, işletme maliyetlerini azaltmak ve satılan ya da kullanılan malın değerini artırmak gibi iki amaca hizmet etmektedir. Yeşil lojistik ise lojistiğin çevresel zararlarını minimize etmenin yollarını aramaktadır. Bu kapsamda yeşil lojistik, enerji verimliliğine, emisyon salınımının azalmasına, geri dönüşüme ve yeniden kullanıma odaklanmaktadır. Tüm firmaların amacı para kazanmaktır ve firma imajına önem vermektedir. Yeşil lojistik faaliyetleri de işletme maliyetlerini asgari düzeyde tutarak çevreyle dost malzeme seçeneklerinden yararlanarak para kazanma amacı gütmektedir. Tersine lojistikte mal ve ürünler tüketiciden tedarik zincirinin ilk aşamasına doğru dönmelidir. Tersine

Journal of Management, Marketing and Logistics -JMML (2017), Vol.4(2),p.116-124 Zengin, Akunal
_________________________________________________________________________________________________
DOI: 10.17261/Pressacademia.2017.456 119
lojistikte tüketici tarafından kullanılan ürün, geri dönüşüm yoluyla tekrar üreticiye gitmelidir. Böylelikle tersine lojistikte atık azalışı söz konusudur. Tam bu noktada tersine lojistiğin tedarik zincirine yeşil lojistik dahil edilmektedir. Yeşil lojistik, “lojistiğin ekolojik etkilerini anlama ve minimize etme” tanımından hareketle ekolojik lojistik olarak da adlandırılmaktadır (Rogers ve Tibben-Lembke, 1998).
Yeşil lojistik, işletmelere rekabete dayalı bir avantaj sağlamaktadır. Toplumdaki çevresel duyarlılık arttıkça işletmeler de yeşile doğru yol almaya başlamaktadır. Böylelikle trafik sıkışıklığının, kirliliğin ve sera gazı emisyonunun azaltılması, ulaşım maliyetlerini korunması ve sosyal uyum sağlanmaktadır. Tersine lojistik, geri dönen üründen kaynaklanan maliyet kaybını, malzemeleri yeniden kullanma yoluyla telafi ederek tamamen paraya odaklanırken yeşil lojistik firma imajına odaklanarak geri dönüşüm ve yeniden kullanımla birlikte tedarik zincirinin her aşamasında çevre dostu faaliyetlerin yer almasını önemsemektedir.
Tersine lojistiğin, gelişmiş müşteri memnuniyeti, azalan kaynak yatırım düzeyleri, depolama ve dağıtım maliyetlerinde azalma gibi doğrudan faydaları olduğuna inanılmaktadır. Tersine lojistiğin en iyi şekilde işlendiği bir firmanın, daha çok para kazanacağı söylenmektedir. Yeniden üretim, onarım, yeniden yapılandırılma ve geri dönüşüm ile ürünlerin geri kazanımı, karlı iş fırsatları yaratabilmektedir. Özellikle ölçek ekonomilerinden yararlanmak isteyen firmalar tersine lojistiği benimsemiştir. Tersine lojistik, aynı zamanda müşteri hizmetini ve memnuniyetini de etkilemektedir. Liberal geri kazanım politikaları, pek çok firmada standart bir pazarlama uygulaması olarak karşımıza çıkmaktadır (Autry ve ark, 2001).Tersine lojistikte müşteriden geri alınan mallar, depolara alındıktan sonra döngüsel artıklık denetimi (CRC) için toplanmaktadır. Burada ayrıştırma ya da yeniden oluşturulmasına karar verme sürecine giren mallar, nihai kararın ardından ilgili noktaya taşınmaktadır. Tersine lojistik, günümüzde pek çok ulusal ya da uluslararası firmalar tarafından işletme politikalarında yer almaktadır.
2.2. Yeşil Lojistik Göstergeleri
Bir işletmenin faaliyetlerinin yeşil lojistik kapsamına alınıp alınamayacağına ilişkin göstergeler ortaya konmaktadır. Seroka (2014)’e göre yeşil lojistik göstergelerini ürün tasarımcısı ve tedarikçi arasındaki işbirliğine, müşterilerle çevresel işbirliğine, yasal mevzuata, yeşil tasarıma ve tersine lojistiğe bağlarken Lopes ve arkadaşları (2010) bu göstergeleri, çevresel yönetim sisteminin sertifikasyonuna, enerji tüketimini azaltmaya ve yenilenebilir enerji kullanımına, ürün tasarımında yeşil bilinçle hareket edilerek ürün ve ambalajın geri dönüşüme çevre dostu ve koordine edilmiş ulaşıma dayandırmaktadır. Evangelista ve arkadaşları (2012) yaptıkları araştırmada yeşil lojistik göstergelerine yasal mevzuatın ve yük taşımacılığına yönelik eylemlerin de eklendiği görülmektedir. Wichaisri ve Sopadang (2014) ise atık oranını minimize etmeye yönelik faaliyetlerin, intermodal taşımacılık sistemlerinin, yük taşımacılığına yönelik faaliyetlerin ve organizasyon yapısının çevre konusunda bilinçlendirilmesin de yeşil lojistik göstergeleri arasında yer aldığını ortaya koymuştur. Tersine lojistiğin önemini vurgulayan Confente ve Ruso (2009), ürün ve ambalajın geri dönüşebilir olmasının ve lojistik uygulamalar için sınırlı alanlar oluşturulmasının yeşil lojistik uygulamalarını ifade eden göstergeler olduğunu savunmuştur.Gross ve arkadaşları (2013), yük taşımacılığına yönelik eylemler üzerinde dururken Kim ve Han (2011), hem yük taşımacılığına hem de depolamaya yönelik eylemlerin yeşil lojistik göstergeleri arasında olduğunu ortaya koymuştur. Ayrıca yasal mevzuatın yeşil lojistiğin olmazsa olmazlarından olduğunu ve işletmeler tarafından sürdürülebilirlik raporlarının hazırlanması gerektiğini belirtmiştir. Zhang ve Zhao (2012), atıkların işletme bünyesinde bertaraf edilmesinin önemini ortaya koyarak yük taşımacılığına yönelik olarak da önlemler alınması gerektiğini ifade etmektedir. Jaller ve arkadaşları (2015), yasal mevzuatın yanı sıra çevre dostu araçların ve intermodal taşımacılık sistemlerinin kullanılmasını, yük dağıtım sırasında meydana gelebilecek trafik sıkışıklığını önleme çalışmalarını yeşil lojistik göstergeleri olarak ortaya koymuştur. Hu ve Hsu (2010) tarafından Tayvan’daki firmalar üzerinden yapılan bir araştırma sonucunda yeşil tedarik zinciri uygulaması tedarikçi yönetimi, ürün geri dönüşümü, kuruluş ilişkisi ve kullanım süresi yönetimi olmak üzere dört boyutta ele alınmıştır. Diobat ve Govindan de (2011) yeşil tedarik zinciri yönetiminin göstergelerini tanımlamıştır.
Sürdürülebilir kalkınma göstergeleri ile benzerlik gösteren ve literatür taramalarından ve dünya örneklerinden yararlanılarak ortaya konulan bu göstergelere ilişkin genel değerlendirme Ek 1’de yer almaktadır.
Yeşil lojistik göstergelerinin en önemli amacı, tedarik zincirindeki her bir faaliyetin çevreye verdiği zararları minimize etmektir. Bu göstergeler, yalnızca işletmeler tarafından ortaya konmamakta; devletler tarafından alınan önlemler de göstergeleri zenginleştirmekte ve yeşil lojistiğin uygulanması için zorunlu bir ortam oluşturmaktadır.
Dünyada yeşil lojistik kapsamında uygulanan her türlü adım da göstergeler tablosunda yer almaktadır. Bu kapsamda Almanya, Avusturya, Danimarka, Fransa, Hollanda, İngiltere, İsveç, İtalya, İspanya, Rusya, ABD, Kanada ve Japonya gibi ülkelerde yeşil ve sürdürülebilir lojistik için mekânsal olarak alınan önlemler incelenerek göstergeler tablosuna eklenmiştir. Yenilenebilir enerji kullanımı, enerji tüketimini azaltmaya yönelik önlemler, karbon ayak izini azaltmaya yönelik önlemler, hammadde seçiminde çevresel hassasiyetlerin göz önünde bulundurulması, yeşil tasarım uygulamaları, ISO 14001 sertifikasının varlığı ve tersine lojistik uygulamaları incelenen ülkelerde ortak göstergeler olarak karşımıza çıkmaktadır. Ayrıca her bir ülkede özel olarak alınan önlemler de göstergeler tablosuna eklenmiştir.

Journal of Management, Marketing and Logistics -JMML (2017), Vol.4(2),p.116-124 Zengin, Akunal
_________________________________________________________________________________________________
DOI: 10.17261/Pressacademia.2017.456 120
Dünyada yeşil lojistik uygulamaları ile ilgili uygulanan politikalara bakıldığında her ülkenin fiziksel konumuna uygun olarak bir yeşil bakış açısı ile lojistik sistemleri oluşturduğu görülmektedir. Ayrıca bu politikalar, devlet tarafından yürürlüğe konulmaları bakımından zorunluluk konusunda hem toplum hem de işletmeler açısından bir baskı yaratmakta; böylelikle sürdürülebilirlik kapsamında çevresel ve ekonomik politikalar zorunlu kılınmaktadır.
Yeşil lojistikle yalnızca ekonomik değil; aynı zamanda çevresel ve sosyal boyutunda önem kazanması ile sürdürülebilir kalkınmanın sosyal, ekonomik ve çevresel boyutları yeşil lojistiğe uyarlanabilmektedir. Çevreye dost malzemelerle geri dönüşebilir olarak üretilen ürün ve ambalajlar, taşıma sırasında sera gazı emisyonunu azaltmaya yönelik önlemler, enerji verimliliğini artırma çalışmaları ve oluşan atığın üretici tarafından toplanılarak bertaraf edilme çalışmaları yeşil lojistik faaliyetleri kapsamında değerlendirilmektedir. Tüm bu faaliyetler, sürdürülebilir kalkınma açısından önem teşkil etmektedir.
3. VERİ VE YÖNTEM
Çalışmanın temel soruları ‘Türkiye’de yeşil lojistik uygulamalarının iyi örnekleri var mıdır?, Yeşil lojistik uygulaması yaptığını iddia eden firmaların uygulamaları nelerdir?, Türkiye’de firmaların yeşil lojistik uygulamalarını benimsemelerinin ardındaki sebepler nelerdir?, Türkiye’de yeşil lojistik uygulamalarının sonuçları nasıl değerlendirilmektedir?’ şeklindedir. Çalışmada literatür taraması, firmalar ile saha araştırması kapsamında yüzyüze görüşme ve faaliyetlere ilişkin soruların yer aldığı anket sunularak elde edilen veriler ile göstergeler tablosu hazırlanmıştır. Firma yetkilileri ile yüzyüze ve telefon görüşmeleri, yeşil lojistik sektörüne ait sürdürülebilirlik raporları ve konuyla ilgili internette olan makale ve haberlerden yararlanılmıştır.
4. BULGULAR VE TARTIŞMA
Ulaşım sistemlerinin çevreye verdiği zararların farkına varılması ile birlikte daha çevresel ve daha ekonomik bir kavram olarak karşımıza çıkan yeşil lojistik, değişen dünyada pek çok ülkede uygulamaya konulmuş ve sürdürülebilir kalkınma bağlamında olumlu sonuçlar elde edildiği görülmüştür. Lojistiğin küresel pazarda öneminin artması ile Türkiye’de de lojistiğe dair yenilikler takip edilmektedir. Türkiye’de de yeni bir kavram olarak karşımıza çıkan yeşil lojistik, sektörün önde gelen firmalarının gündemlerinde yer edinmeye başlanmış ve uygulamaya konulmuştur.
Yeşil lojistiğin dünya genelinde artan önemine bağlı olarak ortaya çıkan yeni bir rekabet ortamı, Türkiye’deki firmaların politikalarını ‘yeşilleştirmeye’ doğru yönlendirmiş; böylelikle yeşil lojistik uygulamaları görülmeye başlanmıştır.
Türkiye’de yeşil lojistik uygulamalarının olduğu firmalarda en belirgin özelliğin, faaliyetlerin maliyet ve emisyon oranını azaltmaya yönelik faaliyetlerin işletme politikasında yer aldığı görülmektedir. Ayrıca organizasyon yapılarını yeşil bakış açısıyla zenginleştirilmeye çalışmaları, sosyal boyutu olarak da yeşil lojistiği ele aldıklarını göstermektedir. Bu kapsamda Türkiye’deki firmaların yeşil lojistik ile ilgili olarak aldıkları önlemler ve uygulamaya koydukları faaliyetler, ekonomik, çevresel ve toplumsal etkiler arasında bir denge sağlamaktadır.
Türkiye’de faaliyet gösteren firmaların yeşil lojistik kapsamında yaptıkları uygulamalar, yeşil lojistik göstergeleri tablosunda (Ek 2) detaylı olarak ele alınarak mevcut durum ortaya konulmuştur. Tabloda görüldüğü üzere Türkiye’deki firmalarda yaygın olarak uygulanan faaliyetler, yasal mevzuata bağlı olarak yapılan enerji tüketimini, emisyon oranını ve karbon ayak izini azaltmaya yönelik önlemler, çevre dostu araçların kullanılması, intermodal taşımacılık sistemlerinin kullanılması, tersine lojistik uygulamaları ve atık oranını minimize etmeye yönelik çalışmalar olarak karşımıza çıkmaktadır. Ayrıca çevresel yönetim sertifikasyonuna önem veren firmaların yanı sıra sürdürülebilirlik raporları hazırlamayı işletme politikası haline getiren firmalar de yer almaktadır. Yapılan araştırma ile Türkiye’de atıkları işletme bünyesinde bertarafı etmeye yönelik önlemler alan firmalar bulunmaktadır. Öte yandan lojistik uygulamalar için sınırlı alanlar oluşturma (restriction zones), düşük emisyon bölgelerinin (low emisson zones) belirlenmesi, koordine edilmiş ulaşım sistemleri, dağıtım sırasına su yüzeyinin kullanılması ve yenilenebilir enerji kullanımı gibi göstergelere ilişkin Türkiye’de herhangi bir faaliyet bulunmamaktadır.
Türkiye’de sürdürülebilirlik kapsamında yük taşımacılığına ve depolamaya yönelik önlemler alan firmalar da bulunmaktadır. Araç yükleme faaliyetlerini geliştirmeye çalışan ve trafik sıkışıklığını engellemeye çalışan firmalar de Türkiye’de yer almaktadır. Yeşil tedarik zinciri yönetiminin en önemli bileşenlerinden biri olan müşterilerle işbirliği ve koordinasyonu sağlamaya yönelik eylemler de firmaların politikalarında yer almaktadır; ayrıca organizasyon yapısının çevresel bilinç ile hareket etmesini sağlayacak adımlar da firmalar tarafından atılmaktadır. Yeşil lojistik faaliyetleri Türkiye’deki firmalar tarafından yeni bir rekabet konusu olarak karşımıza çıkmaktadır. Firmalar, küresel rekabet ortamında tutunabilmek ve işletme maliyetlerini azaltmak için yeşil lojistik uygulamalarını yürürlüğe koymaktadır. Bu uygulamalar ile hem maliyetlerini azaltmakta hem de sürdürülebilir kalkınmaya katkı sağlamaktadır.
4.1.Türkiye’de Bir Tersine Lojistik Uygulaması
Saha araştırmasında tersine lojistiğe önem veren bir akü üretim firması derinlemesine incelenmiştir. Türkiye’de akülerin geri dönüşümü ile ilgili yasal mevzuat şu şekildedir:

Journal of Management, Marketing and Logistics -JMML (2017), Vol.4(2),p.116-124 Zengin, Akunal
_________________________________________________________________________________________________
DOI: 10.17261/Pressacademia.2017.456 121
2004 yılında yayınlanan ve 2005 yılında yürürlüğe giren APAK Yönetmeliği (Atık Pil ve Akümülatörlerin Kontrolü Yönetmeliği)’ne göre atık pil ve akümülatörlerin geri kazanılması bir zorunluluktur. Ayrıca, yönetmelikte “Pil ve akümülatör üretenler ile piyasaya sürenler, atık pil ve akümülatörlerin toplanması, taşınması ve bertarafını sağlamak ve bu amaçla yapılacak harcamaları karşılamakla yükümlüdürler.” ibaresi yer almaktadır. Yeni akü alan araç ya da tesis sahibi, kullanım ömrü tükenen yani hurdaya çıkan aküyü ücretsiz olarak satıcıya vermek zorundadır. Atık aküler Atık Pil ve Akümülatörlerin Kontrolü Yönetmeliği’nin 12. Maddesine göre bölge temsilcileri tarafından oluşturulan geçici depolarda veya aynı yönetmeliğin 18. Maddesine göre valilikler tarafından lisanslandırılan atık akü geçici depolama alanlarında kayıtları tutularak en fazla 90 gün bekletilir. Bu süreç tamamlandığında atık aküler Ulusal Atık Taşıma Formları (UATF) doldurularak lisanlı araçlarla, çevre lisanslı geri kazanım tesislerine gönderilir. Çevre lisanslı geri kazanım veya geri dönüşüm tesisine gelen atık akü taşıma araçları gerekli kontroller yapıldıktan sonra beraberinde getirdikleri ulusal Atık Taşıma Formlarını tesis yetkilisine onaylatarak atık teslimini yaparlar.
Saha araştırmasında elde edilen bulgular şu şekildedir:
Yeşil lojistiği politikası olarak benimseyen firma, özellikle tersine lojistik üzerine yoğunlaşmıştır.
Firma, yıllık 5.000.000 akü üretim kapasitesine sahiptir.
Firma, patenti kendisine ait akıllı aküler üretmektedir.
Kendi ürettiği ve bayilerine taşıdığı aküleri, kullanım ömrü tamamlanıp atık olarak adlandırıldıkları evrede de bayilerinden alarak geri kazanımını sağladıktan sonra yeniden tüketiciye sunmaktadır. Böylelikle kullanılan bir malın, tüketiciden üreticiye hareketi sağlanarak tersine lojistik aşamaları ortaya konmaktadır.
Firma, yurt içindeki bayilerine her hafta bildirimde bulunarak ara bayilerdeki atık akünün, ana bayilerde toplanmasını sağlamaktadır.
Lisanslı araçlarla ana bayilerde toplanan atık aküler, yine lisanslı araçlarla Eskişehir’deki merkezde toplanmaktadır.
Bir araç ile yaklaşık 18-40 ton atık akü taşınabilmektedir.
Atık aküler, geri kazanım işleminden sonra ilgili bayilere satışa sunulmak üzere gönderilmektedir.
Firma tarafından üç atık aküye karşılık bir yeni akü verilmektedir.
Firma bu şekilde hem üretim maliyetinde tasarrufa giderek ekonomik kar elde etmekte hem de sosyal sorumluluk bilinciyle hareket ederek çevresel sürdürülebilirliğe katkı sağlamaktadır.
5. SONUÇ
Yeşil lojistik uygulamaları dünyada hızla kabul görmekte ve yaygınlaşmaktadır. Yeşil lojistik uygulamaları çeşitli şekillerde ve farklı göstergelere uygun olarak gerçekleşebilmektedir. Literatür taraması ve yeşil lojistik uygulaması yapan ülke örneklerinin incelenmesi sonucu özetle şu bulgulara ulaşılmıştır: Tersine lojistik, yeşil lojistiğin oldukça yaygın kullanılan bir bileşenidir.
Çevresel yönetim sistemi sertifikasyonunun varlığı, tedarikçilerle çevresel işbirliğine yönelik çalışmalar, ürün tasarımcılarıyla tedarikçiler arasında işbirliğine yönelik çalışmalar, hammadde seçiminde çevresel hassasiyetlerin varlığı, atık oranını minimize etmeye yönelik çalışmalar, atıkların işletme bünyesinde bertaraf edilmesine yönelik önlemler, sürdürülebilirlik raporlarının hazırlanması, müşterilerle çevresel işbirliği, intermodal taşımacılık sistemlerinin kullanılması, organizasyon yapısının çevre konusunda bilinçlendirilmesi, yük taşımacılığına yönelik eylemler ve depolamaya yönelik eylemler, sadece literatürde yer alıp uygulama örneklerinde rastlanmayan göstergelerdir.
Düşük emisyon bölgelerinin (low emission zones) belirlenmesi, dağıtım sırasında su yüzeyinin kullanılması ve e-şehir lojistiği uygulamaları ise sadece uygulama örneklerinde karşımıza çıkmış, literatürde göstergeler arasında sayılmamışlardır. Enerji tüketimini azaltmaya yönelik önlemler, emisyon oranını azaltmaya yönelik önlemler vekarbon ayak izini azaltmaya yönelik önlemler literatürde adı en sık geçen göstergelerdir. Yenilenebilir enerji kullanımı, enerji tüketimini azaltmaya yönelik önlemler, emisyon oranını azaltmaya yönelik önlemler, karbon ayak izini azaltmaya yönelik önlemler, yeşil tasarım uygulamaları, ISO 14001 sertifikasının varlığı, tersine lojistik uygulamaları ve düşük emisyon bölgelerinin (low emission zones) belirlenmesi, dünya örneklerinde en çok kullanılan yeşil lojistik uygulamalarıdır. Türkiye’de yeşil lojistik uygulaması yaptığını iddia eden firmalar üzerinde yapılan araştırmada, bu göstergelerin hangilerinin dikkate alındığı araştırılmış ve şu bulgulara ulaşılmıştır:
Lojistik uygulamalar için sınırlı alanlar oluşturma (restriction zones), düşük emisyon bölgelerinin (low emisson zones) belirlenmesi, koordine edilmiş ulaşım sistemleri ve ve yenilenebilir enerji göstergelere ilişkin Türkiye’de herhangi bir faaliyet bulunmamaktadır. Yasal mevzuatın varlığı, enerji tüketimini azaltmaya yönelik önlemler, emisyon oranını azaltmaya yönelik önlemler ve karbon ayak izini azaltmaya yönelik önlemler, en çok rastlanan yeşil lojistik uygulaması göstergeleridir.
Yeşil lojistik göstergelerinden ürün tasarımcılarıyla tedarikçiler arasında işbirliğine yönelik çalışmalar, hammadde seçiminde çevresel hassasiyetlerin varlığı, trafik sıkışıklığını önleme çalışmaları, araç yükleme faaliyetlerine yönelik çalışmalar ve e-şehir lojistiği uygulamaları gibi tek bir göstergeyi benimseyen firmalar dahi Türkiye’de yeşil lojistik uygulamasında bulunduklarını

Journal of Management, Marketing and Logistics -JMML (2017), Vol.4(2),p.116-124 Zengin, Akunal
_________________________________________________________________________________________________
DOI: 10.17261/Pressacademia.2017.456 122
ilan etmek ve firmalarını böyle tanıtmak istemektedir. Bu bulgular, literatür ve dünya örneklerinde yeşil lojistik uygulamalarından göstergelerin ne olması gerektiği konusunda tamamıyla bir uyum olmadığı, ancak bu konuda ilginin arttığını göstermektedir. Bu göstergelerin büyük bölümünün Türkiye’de faaliyet gösteren firmalar tarafından bilindiği ve bir kısmının da benimsendiği anlaşılmaktadır. Yeşil lojistik yaklaşımını benimseyen firmaların gerek dünya genelinde gerekse Türkiye’de önümüzdeki yıllarda yaygınlaşacağı beklenmektedir.
Bu bildiri, Yeşil Lojistik Göstergeleri ve Türkiye’de Yeşil Lojistik Uygulamaları adlı yüksek lisans tez çalışmasına dayanmaktadır.
KAYNAKLAR
Autry, C., Daugherty, P., Richey, G. (2001), “The Challenge of Reverse Logistics in Catalog Retailing”, International Journal of Physical Distribution & Logistics Management, 31, pp.26-37.
Babic, D., Jaramaz, D., Bajor, I. (2013),”Urban Forestry As A Function of Green Logistics”, Faculty of Traffic and Transport Science, Croatia.
Banister, D., Button, K. (1993), Transport, the Environment and Sustainable Development, 1st Edition, Routledge, London.
Birleşmiş Milletler Dünya Çevre Kalkınma Komisyonu Raporu, 1987.
Confente, I., Russo, I. (2009), “Green Logistics in Italy: new challenge for sustainable development”, 12th International QMOD and Toulon- Verona Conference, International Conference on Quality and Service Sciences (ICQSS), Aug. 27-29, 2009, Verona, Italy.
Denisa, M., Zdenka, M. (2015), “Perception of implementation processes of green logistics in SMEsin Slovakia”, 4th World Conference on Business, Economics and Management, WCBEM, April 30 – May 2, 2015, Ephesus, Turkey.
Evangelista, P., Huge-Brodin, M., Isaksson, K., Sweeney, E. (2012), “A Case Study Investigation on Purchasing Green Transport and Logistics Services”, National Institute for Transport and Logistics, Dublin, Ireland.
Gross, W., Zesch, F., Gelau, T., Hayden, C., Bötel, M., Brock, M. (2013), Costs and Benefits of Green Logistics, 4flow Supply Chain Management Study, Berlin, Gerrmany.
Hickford, A.J. (2007), Developing innovative and more sustainable approaches to reverse logistics and the collection, recycling and disposal of waste products from urban centres, Literature Review, Transportation Research Group.
İnce, M.E. (2013), Yeşil Tedarik Zinciri Yaklaşımı ve Örnekleri, Konya Ticaret Odası, Konya.
Jaller, M., Sánchez, S., Green, J., Fandiño, M. (2015), “Quantifying the impacts of sustainable city logistics measures in theMexico City Metropolitan Area”, The 9th International Conference on City Logistics, Tenerife, Canary Islands (Spain), June 17-19, 2015, Transportation Research Procedia, 12, pp.613-626.
Kim, S., T., Han, C., H., (2011), “Measuring Environmental Logistics Practices”, The Asian Journal of Shipping and Logistics, 27(2), pp. 237-258.
Lopes, C.P., Akabane, G., Soares, W.L., Barreto, R.M. (2010), “Toyota Motor European (TME) Sustainable Logistics: An Example to Brazil”, POMS 21st Annual Conference, May 7-10, 2010, Vancouver, Canada.
Rogers,D. S.& Tibben-Lembke,R. S. (1999). Going backwards: Reverse logistics trends and practices,The University of Nevada, Reno Center for Logistics Management, Pittsburgh, PA, Reverse Logistics Executive Council.
Seroka, O. (2014), “The development of green logistics for implementation sustainable development strategy in companies”, 1st International Conference Green Cities 2014, May 19-21, 2014, Szczecin, Polska, pp.302-309.
Tao, J. (2001), Researches on Establishment Model of Green Logistics System, Zhongyuan University of Technology, China.
Wichaisri, S., Sopadang, A. (2014), Sustainable Logistics System: A Framework and Case Study, Department of Industrial Engineering, Faculty of Engineering, Chiang Mai University, Chiang Mai, Thailand.
Zhang, G., Zhao, Z. (2012), “Green Packaging Management of Logistics Enterprises”, 2012 International Conference on Applied Physics and Industrial Engineering, Physics Procedia 24, pp.900-905.
EKLER
Ek 1: Yeşil Lojistik Göstergelerine İlişkin Genel Değerlendirme
Ek 2: Türkiye’de Faaliyet Gösteren Firmaların Yeşil Lojistik Uygulamaları

Journal of Management, Marketing and Logistics -JMML (2017), Vol.4(2),p.116-124 Zengin, Akunal
_________________________________________________________________________________________________
DOI: 10.17261/Pressacademia.2017.456 123

Journal of Management, Marketing and Logistics -JMML (2017), Vol.4(2),p.116-124 Zengin, Akunal
_________________________________________________________________________________________________
DOI: 10.17261/Pressacademia.2017.456 124
Ek 2: Türkiye’de Faaliyet Gösteren Firmaların Yeşil Lojistik Uygulamaları

Journal of Management, Marketing and Logistics -JMML (2017), Vol.4(2), p.125-142 Demir, Sezen
_________________________________________________________________________________________________
DOI: 10.17261/Pressacademia.2017.457 125
UNDERSTANDING EFFECTS OF INNOVATIVE AND COLLABORATIVE APPROACHES ON SUPPLY CHAIN
PERFORMANCE
DOI: 10.17261/Pressacademia.2017.457
JMML- V.4-ISS.2-2017(6)-p.125-142
Hakan Demir1, Bülent Sezen
2
1 Gebze Technical University, Kocaeli, Turkey. [email protected] 2 Gebze Technical University, Kocaeli, Turkey. [email protected]
To cite this document Demir, H. and Sezen B. (2017). Understanding effects of innovative and collaborative approaches on supply chain performance. Journal of Management, Marketing and Logistics (JMML), V.4, Iss.2, p.125-142. Permemant link to this document: http://doi.org/10.17261/Pressacademia.2017.457 Copyright: Published by PressAcademia and limited licenced re-use rights only.
ABSTRACT Purpose- Main goal of this paper is to perform an exploratory and empirical research on the interactions of collaboration and innovation
elements that are presented in the literature; co-creation, service dominant logic, open innovation, negative entropy and entrepreneurship
orientation. Moreover, this study aims to examine the effects of these elements on supply chain performance attributes (reliability,
responsiveness, flexibility, costs and asset management).
Methodology- In order to understand the effects of innovative and collaborative dynamics on supply chain performance, prominent
logistics service providers and firms with officially approved R&D departments were surveyed.
Findings- This study provides evidence on strong relationships between supply chain performance and co-creation, SDL, and open
innovation. One of the findings that grabs our attention is the remarkable effect of negative entropy on co-creation, SDL and open
innovation. Moreover, according to results, negative entropy has the highest individual effect on supply chain performance in comparison
with other collaboration and innovation elements.
Conclusion- This paper highlights the importance of innovative and collaborative dynamics in supply chain performance measurements. This research also provides evidence to supply chain performance literature by suggesting negative entropy as a powerful instrument of integration and preservation in supply chains.
Keywords: Supply chain performance, co-creation, open innovation, service-dominant logic, entrepreneurship orientation, negative
entropy.
JEL Codes: M11, M19, L14, L25
1. INTRODUCTION
Businesses are today characterized by interlinked value creation processes between customers, firms and other actors. This interactive business reality puts pressure on firms to reconsider and improve their procedures to serve their customers in better ways (Karpen&Bove, 2008). As for supply chains, the situation is not different. Madhani (2012) argues that the pressure on organizations prompt them to find new ways to create and deliver value to customers through supply chain management (SCM). Simatupang and Sridharan (2002) state that the main goal of a supply chain should eliminate sources which prevent members from obtaining optimum profit by delivering value to end customers, and this goal can be achieved through effectively collaborated supply chains.
Performance measurement systems are vital for evaluating the extent of success in today’s competitive business environment. In this paper, performance measurement system of SCOR model introduced by Supply Chain Council (SCC) in 1996 is used to study the effects of collaboration dynamics. SCOR model is a cross-functional framework which integrates
Year: 2017 Volume:4 Issue: 2
Journal of Management, Marketing and Logistics – (JMML), ISSN: 2148-6670, http://www.pressacademia.org/journals/jmml

Journal of Management, Marketing and Logistics -JMML (2017), Vol.4(2), p.125-142 Demir, Sezen
_________________________________________________________________________________________________
DOI: 10.17261/Pressacademia.2017.457 126
business processes via performance measurement. Its standard framework provides easy communication and it is a useful tool for the top management to achieve firms’ desired performance. SCOR utilizes five fundamental supply chain performance attributes: reliability, responsiveness, flexibility, costs and asset management (Jothimani&Sarmah, 2014).
Brief descriptions of these performance attributes are given below (Stephens, 2001).
Reliability: Supply chain performance in delivering the correct product, in the correct quantity, to the correct place and customer, at the correct time, in the correct condition, with the correct documentation. Responsiveness: The velocity at which the supply chain respond to the customers’ needs. Flexibility: The agility of a supply chain in adapting to market changes to preserve or improve competitive advantage. Costs: The costs performance management regarding supply chain operations. Assets: The effectiveness in usage of an organizations’ assets to support demand satisfaction.
Beyond single organizations, supply chains now compete with each other to find new ways in delivering better value through better collaboration. There is a consensus which implies the performance improvement of supply chains through collaboration and innovation (Seifert, 2003; Bigliardi et al. 2010; Lin et al. 2010; Ramanathan et al., 2011; Liao&Kuo, 2014). Thus, it can be inferred from the literature that collaboration and innovation elements positively affects supply chain perfomance. Those elements that used in this research are entrepreneurial orientation, negative entropy, co-creation, service-dominant logic (SDL) and open innovation. Succint explanations of these notions are given in the following paragraphs.
Strategic orientation literature brought out a new concept “entrepreneurial orientation” (EO) as one of the components of strategic orientations (market, learning, service and entrepreneurial) (Zhou et al. 2005). EO has become a major subject of the entrepreneurship and strategic management literature (Covin et al. 2006; Anderson et al. 2009). In this context, entrepreneurial strategy making processes are considered as a path in fulfilling firms' organizational purposes and creating competitive advantage (Rauch et al. 2009). Within the context of supply chains, entrepreneurial orientation prompts supply chain actors to innovate through collaboration.
Negative entropy is an important capability which provides compulsory collaboration and innovative steps for firms. It is an important value for an organization in preventing infollution and creating open, interactive environments for supply chain actors. In open social systems, organizations can convert their entropy into negative entropy by importing resources from the environment and decelerate their dissolution or termination processes (Kast&Rosenzweig, 1974).
The interaction between customers and firms has become the stimulus for the creation and extraction of value. The transformation of the business environment strongly focuses on co-creating value with customers. (Prahalad&Ramaswamy, 2004). Markets rapidly shift from value-adding to value co-creation, value-delivering to value propositions and products to experiences (Dong et al. 2008).
Service dominant logic was introduced to literature by Vargo&Lusch (2004). It basically offers an alternative view to goods-dominant logic in a way which integrates market actors and final customers for a collaborative, system-based value creation. (Vargo et al. 2008). Previous studies confirm and emphasize the importance of this integration (Karpen&Bove, 2008; Merz et al. 2009; Nam&Lee, 2010).
The idea of open innovation, which was presented by Chesbrough (2003), defines a system that corporate innovation activities are executed in an interactive open environment rather than the traditional vertically integrated model (West et al. 2014). The central idea behind open innovation is that enterprises ought not to rely on their own research entirely and attenuate their scope, but instead they should import external inventions, knowledge, processes and contributors into development processes and joint research (Užienė, 2015).
In this study, we investigated effects of those dynamics on the supply chain performance, interactions between them and individual effect of each variable on supply chain performance. This paper is composed of five sections. After the introduction, the theoretical background of the proposed model is presented. Afterwards, information on sample and measurement instrument is given in the research methodology section. In the fourth section, results are demonstrated including demographic dispersion. In the discussion and conclusion section, research implications are discussed and final remarks about the limitations and future research are made.
2. LITERATURE REVIEW AND HYPOTHESIS
Entrepreneurial firms adopt an aggressive and proactive focus on innovations to encounter intimate customer needs (Atuahene-Gima&Ko, 2001). Additionally, entrepreneurial firms lead the efforts to change the institutional environment by infusing new rules, routines, and values into social structures (Battilana et al. 2009).

Journal of Management, Marketing and Logistics -JMML (2017), Vol.4(2), p.125-142 Demir, Sezen
_________________________________________________________________________________________________
DOI: 10.17261/Pressacademia.2017.457 127
Entrepreneurial orientation involves experimentation with promising new technologies, a willingness to seize new product–market opportunities and a predisposition to undertake risky ventures (Lumpkin&Dess, 1996; Kreiser et al. 2002). Lumpkin and Dess (1996) also state that entrepreneurial orientation closely relates to aspects in the innovation literature.
Chen et al. (2012) give evidence on entrepreneurial orientations which positively and simultaneously affect two types of core organizational value-creating capabilities: exploitative and exploratory capabilities. Further, Zhou et al. (2005) found that EO is positively related to innovations. Prior research has also accentuated EO as a fundamental antecedent for achieving innovation success (Zhou et al. 2005; Lisboa et al. 2011) and for capturing firm performance (Rauch et al. 2009).
SDL requires continuous monitoring between the company’s customers and resources. Lamberti and Paladino (2013) argue that a possible link may be established between SDL and EO, because of its interactive nature (Lumpkin&Dess, 1996). Through SDL, Lamberti and Paladino (2013) also point to customers’ active participation in value creation (Vargo&Lusch, 2004). Placing customer centricity and SDL in the bottom, firms construct strategies through their interaction with the customer and additionally through the empowerment of employees in the use of interface resources (Galbraith, 2005). These are the key elements for both SDL and entrepreneurship orientation. Thereby, the relation between SDL and EO stands in their interactive, resource focused and participative nature. Customer centricity and co-creative approach to value generation and the focus on resources in unison enable a firm to create value for both the customer and the firm (Lamberti&Paladino, 2013).
Callaway and Dobrzykowski (2009) accentuate service-oriented entrepreneurship as a good application of SDL. In their paper, it is argued that SDL centered view of entrepreneurship may be useful in unlocking new opportunities previously left out by conventional goods dominant view. Read et al. (2009) and Sarasvathy (2008) integrate the concepts of entrepreneurship and SDL by describing the cognitive science-based logic of entrepreneurial expertise as “effectuation”. Effectual entrepreneurs focus on intangible resources, the co-creation of value (Vargo&Lusch, 2004; Read et al. 2009; Callaway&Dobrzykowski, 2009).
H1: Entrepreneurship Orientation positively affects Co-Creation. H2: Entrepreneurship Orientation positively affects SDL. H3: Entrepreneurship Orientation positively affects Open Innovation.
Entropy is a tendency where properties of a system become increasingly unreliable in predicting the final state of a system that is subject to some process. In contrast, negative entropy (also known as “negentropy”) is a force that seeks to stabilize a system into a steady and predictable state (Grinberg, 2007). Schneider and Somers (2006) describe the cycle of entropy and negative entropy as the leading force of disorganization or death. In order to survive, negative entropy is acquired by storing energy from the environment.
In a closed system, the change in entropy must always be positive. However, in open biological or social systems, entropy can be attenuated and may even be transformed into negative entropy because, the system imports resources from its environment (Kast&Rosenzweig, 1974). In fact, open systems, such as managerial or social organizations, can survive indefinitely because they interact with their environment to achieve negative entropy by importing more energy than they export (Peery, 1975). In order to comprehend the study further system theory should be explained. A particular system which imports inputs from its external environment uses these inputs through its processes to transform them into outputs, and finally exports to its external environments. Natural, human, and financial resources are all fundamental organizational inputs. Organizational throughput processes include research and development, production, distribution, marketing and administration. Organizational outputs include products, services by-products and even waste (Starik&Rands, 1995).
As one of the characteristics of an open system proposed by Katz and Kahn (1978), negative entropy prompts social organizations to improve their survival position and to acquire in their reserves a convenient margin of operation. Following these crucial facts about negative entropy, we propose that negative entropy in open system theory can also be an essential driver of complex system such as a supply chain.
During the hypothesis development we chose this vital element, negative entropy, as an independent variable and conclude that even an exploratory research might yield satisfactory results, since negative entropy is about preserving and improving. We adapted the scale developed by Gok (2014), corrected items and their wordings to reflect supply chain preservation and performance concepts. Consequently, it is proposed that negative entropy which sustains a supply chain is positively and closely related with co-creation, SDL and open innovation.
H4: Negative Entropy positively affects Co-Creation. H5: Negative Entropy positively affects SDL. H6: Negative Entropy positively affects Open Innovation.

Journal of Management, Marketing and Logistics -JMML (2017), Vol.4(2), p.125-142 Demir, Sezen
_________________________________________________________________________________________________
DOI: 10.17261/Pressacademia.2017.457 128
Cooperative value creation can be defined as the processes in which the capabilities of partners are combined so that the competitive abilities of either the hybrid or one or more partners is improved (Borys and Jemison, 1989). In the traditional process of value creation, consumers were kept outside the firm. Value creation processes had occurred especially inside the firm and outside of the markets. (Prahalad&Ramaswamy, 2004). During this traditional phase of value creation, consumers were always considered as reductionists. However, multifaceted co-creation, -as enabled by the internet and other instruments-, has made consumers a subject worthy of investigation in an integrated chain of production (Zwass, 2010).
By supplying customers with goods, services and information, the supplier is fundamentally a value creator. Co-creation opportunities that suppliers possess can present strategic options for value creation (Payne et al. 2008). Grönroos (2008) argues that by producing value-supporting resources the firm actually facilitates value creation. By interacting with its customers’ processes, firm becomes a value facilitator and the co-creator of the value. During the interactions caused by co-creation, both parties are active in a learning process and influence each others’ actions and perceptions (Ballantyne, 2004; Ballantyne&Varey, 2006). Value cannot be distributed or delivered by firms but rather its actualization can only be supported and facilitated (Vargo&Lusch 2004). Further, Mascarenhas et al. (2004) suggest that customers should be involved at all stages of value chain, through customer-value-chain involvement (CVCI) model.
However, in the area of supply chain relationships where customers are defined as the next member of supply chain, these relationships are transformed into B2B partnership-like nature as a result of co-creation. Goffin et al. (2006) point to several important literature implications of these relationships; advantages including better quality, lower costs and reliable delivery. Instead of competing, members of a supply chain can expand the value as well as their share from the pie through the co-creation processes as shown in Figure 1.
Figure 1: Co-Creation in Supply Chain (Dyer, 2000)
Bowersox et al. (2002:590) put emphasis on the unity of the whole supply chain and stress that supply chain members must have shared responsibility for achieving value-creation process. Firms must carefully consider their visions, strategies, and operational capabilities while selecting partners. If these members could become partners of the supply chain, also entitled as a value chain, (Flint&Mentzer, 2006) through spreading the risks and rewards, they would reduce duplication, redundancy and other kind of disruptions, and maintain cooperative value creation.
Following the literature about value co-creation and empirical study of Lin et al. (2010) on Taiwanese high-tech companies which operate global supply chains, we believe and propose that supply chain performance is positively influenced by value co-creation.
H7: Value Co-Creation positively affects Supply Chain Performance.
In 2004, Vargo and Lusch (2004) introduced SDL to academic and managerial community. Their theory became a game changer in marketing discipline. SDL broadens the perspective of exchange and value creation and implies that all social and economic actors engaged in an exchange (e.g., firms, customers, etc.) are service-providing, value-creating enterprises (Vargo&Lusch, 2004).
SDL is an alternative to goods-dominant (G-D) logic and allows managers to view and understand a business better through a service-based lens (Lusch et al. 2006). From the Goods-Dominant Logic perspective, services are just add-ons for goods.

Journal of Management, Marketing and Logistics -JMML (2017), Vol.4(2), p.125-142 Demir, Sezen
_________________________________________________________________________________________________
DOI: 10.17261/Pressacademia.2017.457 129
On the other hand, service-dominant logic views service, instead of goods, as the focus of economic and social exchange. Goods are just appliances for service provision from SDL perspective.
In SDL theory, market actors collaborate and interact with the capabilities and competencies of the other parties that render service. SDL forms the basis for a collaborative, system-based view of value creation, which includes other market actors and final customers (Vargo et al. 2008). Therefore, SDL integrates the secular distinction between services and goods in terms of benefit provision for the whole system (Vargo&Lusch, 2004). This integration draws its power from coherently explaining and unifying the service role of interacting partners and involved mediators such as goods (Karpen&Bove, 2008).
The SDL stresses on the joint value creation of firms and customers (Finney et al. 2011). According to Lusch (2011), SDL replaces the supply chain with a network concept that is referred to as a service ecosystem. In a service ecosystem actors make value propositions to each other for adding or delivering value via information technologies. Lusch (2011) proposes robust implications on the expansion of a service ecosystem consistent with principles of SDL through information technologies. On one hand, knowledge -as the most fundamental operant resource for competitive advantage- is an essential source for implementing SDL (Lusch et al. 2007). On the other hand, information is considered as the most significant part in supply chain relations as Gunasekaran and Ngai (2004) view information technologies as a nerve system for SCM that enables actors to more intellectually respond to each other. SDL approach actually inspired us to reconsider our conceptual model. Because of the highly integrated system offered by SDL, it became the nucleus of the research structure for explaining the supply chain relationships. With all that said, we believe that supply chain relations and performance are closely correlated with service dominant logic.
H8: SDL positively affects Supply Chain Performance.
Innovation offers a significant driving force and a unique opportunity to address mounting economic pressure, diminishing resources, and environmental challenges. Open innovation, on the other hand, describes how firms innovate through interacting with external organizations. Open innovation was proposed by Chesbrough (2003) but was recently defined as the use of purposive inflows and outflows of knowledge to accelerate internal innovation and expand the markets for external use of innovation (Chesbrough, 2012). In other words, boundaries between firms and their surrounding environments are rapidly becoming invisible which allows innovations to expand and improve (Van Lancker et al. 2016).
Chesbrough (2003) state that internal innovation strategy is reaching its limits and firms now seek new ways to engage in open innovation. They spryly pursue opportunities to collaborate with suppliers, customers and even their direct competitors (Inauen&Schenker-Wick, 2011). Embracing the fact that all brilliant R&D personnel is not working for them, organizations now view partnerships as opportunities to acquire new technologies, further use these relationships to absorb skills and diffuse new knowledge (Hamel et al. 1989). According to Pilav-Velić & Marjanovic (2016), open innovation paves internal and external paths to markets for firms, boosting their value creation and innovation performance in return.
Literature suggests that open innovation is essential for firms in gaining competitive advantage in terms of innovation (Saguy and Sirotinskaya, 2014; Traitler and Saguy, 2009). Yet undoubtedly, open innovation paradigm still poses a number of challenges regarding the identification of several relationships. We believe that supply chain performance improvement is one of these challenges that organizations should circumvent. According to Handfield et al. (1999), integration of suppliers in collaborative innovations can provide significant benefits, which include achieving reduced cost at product development, reduced time spent and decreased risk of failure. Additionally, several studies on the subject state that supplier-customer joint innovations can allow them to achieve higher supply chain performance (Shamah&Elsawaby, 2014; Fawcett et al., 2012; Bigliardi et al. 2010; Ulrich&Ellison, 2005). In their empirical study, Azadegan&Dooley (2010) provide evidence on the positive effects of innovativeness of the supplier on the performance of the manufacturer. In light of these studies, we posit open innovation as a collaborative effort which firms ought to implement in improving their supply chain performance.
H9: Open Innovation positively affects Supply Chain Performance.

Journal of Management, Marketing and Logistics -JMML (2017), Vol.4(2), p.125-142 Demir, Sezen
_________________________________________________________________________________________________
DOI: 10.17261/Pressacademia.2017.457 130
Figure 2: Conceptual Framework
3. DATA AND METHODOLOGY
3.1. Sample and Data Collection
While designating the target population, firms with R&D departments and logistics service providers and that reserve the highest budget to these R&D departments were chosen. As cooperation and innovation notions are the baselines of this research, companies with high-budget allocated R&D departments are evaluated to fit better to these baselines. While acquiring the target population two official firm lists are used. The first list is approved by Turkish Ministry of Science, Industry and Technology shows 233 R&D centers from 216 companies. The second list was officially acquired from Turkish Exporters’ Assembly, which shows 250 firms that reserve the highest budget to their R&D departments. 375 companies were pooled from the two lists mentioned. Additionally, 15 leading logistics service provider companies in the sector with substantial capacity were added. In total, 390 firms were designated as the target population to which questionnaire was applied via face-to-face interviews, e-mail or an online-survey.
In total, 174 firms responded with 180 samples, resulting in a high response rate of %45. After discarding the five incomplete and improperly responded surveys from three firms and excluding multiple responses from four firms, 171 observations remained and were subjected to analysis. Hair et al. (2010:635) state that minimum 150 sample size is needed for models with less than seven constructs and communalities higher than 0.5. Our structure has six constructs with communality values varying between 0.523 and 0.843. As a result, 171 observations in this study will be adequate.
On the other hand, sample is subjected to wave analysis to ensure that non-response bias is not an issue in this research (Lewis et al. 2013; Halbesleben&Whitman, 2013). Data gathered from early 50 and late 50 responders were tested with t-test. Results show no significant difference between the groups, meaning that sample is not contaminated with non-response bias. As items measured with the data were taken from the same source (Avolio et al. 1991), the sample was tested with Harman’s single factor test (Harman, 1976) in order to make sure that the data is free from common method variance. If common method bias is present, single factor will emerge from factor analysis of all the items (Podsakoff&Organ, 1986). The unrotated factor solution showed that no single factor explains the majority of the variance and the first factor accounted for 28% out of the 68.3% explained variance. Consequently, results suggest that common method bias will not be a problem in this study.
3.2. Measurement Instrument and Measures
In order to gather data from the sample group, two-section questionnaire was used as a measurement instrument. First part of the survey requires personal information of the responder. Second part involves the items regarding the scales of this study. Participants were required to answer to the first five constructs’ items according to the supply chain their firm operates in via 5-likert scale ranging from, “1-strongly disagree” to “5-strongly agree”. For the dependent construct “supply chain performance”, participants answered item questions considering their firms’ performance in following 5-likert scale: 1 for “strongly dissatisfying” and 5 for “strongly satisfying”.
Scales used as independent and mediating variables were adapted to research needs or were directly taken from previous studies of Jiang et al. (2014), Dibrell&Moeller (2011), Lin et al. (2010) and doctoral thesis of Gok (2014). One question is

Journal of Management, Marketing and Logistics -JMML (2017), Vol.4(2), p.125-142 Demir, Sezen
_________________________________________________________________________________________________
DOI: 10.17261/Pressacademia.2017.457 131
excluded from the “SDL” scale after preliminary test results to prevent disruptions and sixth question is added to summarize the notion.
Mediating variable “Open Innovation” is developed by the authors of this study in order to specifically measure organizations’ tendency to practice innovation beyond their own boundaries. During the scale creation, we benefited from the study of Chesbrough (2003) who originated open innovation, and studies of Pilav-Velić & Marjanovic (2016), Yamazaki et al. (2012) and Lichtenthaler (2008) which mainly examine open innovation through a practice aspect.
In order to reach and determine the metrics of supply chain performance, contemporary Supply Chain Operations Reference (SCOR) model is taken as the basis while preparing the dependent variable. Although some authors add profitability and effectiveness into composure (Bolstorff, 2002), Supply Chain Performance measurement mainly falls into five performance attributes which are reliability, responsiveness, flexibility, costs and assets (Stephens, 2000; Theeranuphattana&Tang, 2007; Kocaoğlu et al. 2013; Jothimani&Sarmah, 2014; Sillanpää, 2015). These characteristics supply chains can be analyzed and evaluated against other supply chains with competing strategies (Najmi&Makui, 2012). Hence, we developed items that address these five attributes the best. 45 items and six scales with their factor loadings, means and standard deviations are shown in Appendix 1.
4. FINDINGS AND DISCUSSIONS
4.1. Sample Characteristics
According to the characteristics of the sample shown in Appendix 2, 76% of the participants are male and 81.9% are aged between 26 and 45. Respondents who work as an engineer, specialist, chief or low-level manager compose 91.5% of the total sample. 93% of the participants have a bachelors or masters degree and 88.2% have a managerial role.
Along with the characteristics stated, survey also requested information from participants about the firm they are working for. There are several issues that need to be underscored. 67.8% of the respondents are working in a facility which hosts more than 250 personnel and %74.3 work in a firm that has been operating for more than 20 years. Additionally, 75% of the participants state that they work in a manufacturing firm. Detailed information on sample characteristics of the sample is shown in Appendix 2.
4.2. Validity and Reliability
Discriminant and convergent validity analysis were conducted to test the validity of variables. Internal consistencies of measures were examined with composite reliability and cronbach alpha values. All tests were conducted on Warppls 5.0 and outcomes are shown in Table 1.
As for reliability, Cronbach’s alpha (CRA) and composite reliability (CR) values equal to or higher than 0.7 are considered adequate (Hair et al., 2010:123; Bagozzi&Yi, 1988). According to reliability test results shown in Table 1, CR and CRA values are over 0.7 for all the variables indicating reliability of the study.
In order to assess convergent validity, average variance extracted values were examined. Henseler et al. (2009) state that 0.5 is the threshold value for average variance extracted(AVE). Table 1 depicts that all variables’ AVE values except supply chain performance’ are higher than 0.5. Although it is lower than the threshold value, it was included in the structure because it meets the other requirements of validity and reliability tests as well as its contributions to the research. For the evaluation of discriminant validity, the Fornell&Larcker criterion was used. In order to achieve discriminant validity, square root of AVE value for each construct ought to be higher than all of its correlations with other constructs (Fornell&Larcker, 1981). Table 1 depicts that in all cases, square roots of AVEs are higher. Thereby, it can be concluded that there is discriminant validity between all the constructs.
Table 1: Reliability and Validity Tests
Variable Cronbach
Alpha Composite Reliability
AVE Correlation Between Variables and Square Root of AVEs
E.O. N.E. C.C. S-D L. O.I. S.C.P.
E.O. .863 .908 .711 .843
N.E. .861 .893 .546 .348 .739
C.C. .784 .853 .537 .243 .507 .733
S-D L. .812 .865 .517 .233 .521 .385 .719
O.I. .851 .900 .691 .275 .354 .391 .320 .831
S.C.P. .926 .935 .432 .311 .558 .330 .435 .287 .657
Note: Numbers shown in bold are Square Root of Average Variance Extracted of each item.

Journal of Management, Marketing and Logistics -JMML (2017), Vol.4(2), p.125-142 Demir, Sezen
_________________________________________________________________________________________________
DOI: 10.17261/Pressacademia.2017.457 132
Reliability and validity reflect the trustworthiness and quality of a qualitative research (Golafshani, 2003). In our study, all the reliability and validity test results returned favorable values for the research.
4.3. Structural Model Test Results
Structural equation was solved with partial least square (PLS) method via Warppls 5.0 statistical program (Kock, 2015). PLS operates on a principal component analysis basis, aimed at explaining the alterations in constructs in a particular model. PLS has the advantage of predicting all individual element loads and path coefficients and also prevents from incoherent and biased parameter predictions (Chin, 1998). Overall fit results presented by program are shown in Table 2.
Table 2: Overall Fit Results
Fit Definitions Results Acceptable Range Reference
Average path coefficient (APC) 0.267**
Average adjusted R-squared (AARS) 0.249**
Average block VIF (AVIF) 1.135 acceptable if <= 5, ideally <= 3.3 (Hair et al., 2010) Average full collinearity VIF (AFVIF) 1.493 acceptable if <= 5, ideally <= 3.3 (Hair et al., 2010) Tenenhaus GoF (GoF) 0.385 small >= 0.1, medium >= 0.25, large >= 0.36 (Wetzels et al. 2009) Note: “**” indicates %01 significance
Quality indices implicate that model is fit. Average path coefficient and average adjusted R-square values are significant under 0.01 level. Multi-collinearity can be an issue if VIF values are higher than 3 (Cenfetelli&Bassellier, 2009; Hair et al., 2010:200). Average block and average full collinearity VIF values are under the threshold value of 3. Furthermore, according to WarpPls full collinearity VIF outputs, each variables’ VIF values are below 3 and ranging between 1.196 and 1.972, meaning that constructs are free of multi-collinearity. The Goodness-of-Fit is an index for validating the PLS model globally (Tenenhaus et al., 2005). In this study, Gof index returned 0.385 value indicating excellent model fit.
Coefficient results returned from structural equation modeling test are demonstrated in Table 3. According to the results, all the hypothesis except H1 and H2 are accepted. H1 and H2 hypotheses are rejected because the relationships they represent have beta coefficients lower than %10 significance. Negative entropy has remarkable impacts on co-creation, SDL and Open Innovation with 0.51, 0.51 and 0.33 beta coefficient values, respectively. Furthermore, SDL, with a meaningful beta coefficient of 0.33, has a dominant effect on supply chain performance compared to its counterparts.
Table 3: Results of the SEM
Direction of Effect Beta Coefficient Hypothesis
Entrepreneurship Orientation → Co-Creation (H1) 0.09* Rejected
Entrepreneurship Orientation → SDL (H2) 0.08* Rejected
Entrepreneurship Orientation → Open Innovation (H3) 0.22*** Supported
Negative Entropy → Co-Creation (H4) 0.51*** Supported
Negative Entropy → SDL (H5) 0.51*** Supported
Negative Entropy → Open Innovation (H6) 0.33*** Supported
Co-Creation → Supply Chain Performance (H7) 0.19*** Supported
SDL → Supply Chain Performance (H8) 0.33*** Supported
Open Innovation → Supply Chain Performance (H9) 0.14** Supported
Note: Path coefficients with “***” indicate %01 significance, “**” %05 significance and “*” %10 significance. In addition to structural equation modeling presented above, effects of innovative and collaborative dynamics on five key performance metrics of SCOR were individually measured in order to acquire more intrinsic understanding on the matter. In Figure 3, individual effects of Entrepreneurship Orientation, Negative Entropy, Co-Creation, SDL and Open Innovation on SCOR elements can be seen. Results acquired will be discussed in the next section.

Journal of Management, Marketing and Logistics -JMML (2017), Vol.4(2), p.125-142 Demir, Sezen
_________________________________________________________________________________________________
DOI: 10.17261/Pressacademia.2017.457 133
Figure 3: Individual Effects on SCOR Elements
4.4. Discussions
Supply chains reach their intended goal if they are closely coordinated as a whole (Waters, 2010:4) and innovation becomes their routine (Christopher, 2011:212). In 1996, Supply Chain Council (SCC) introduced a performance measurement model termed as SCOR to observe this coordination and proposed five performance metrics. This paper does an exploratory research on several collaboration and innovation elements and their effects on these supply chain performance metrics: reliability, responsiveness, flexibility, costs and asset management. Results show that supply chain performance is abundantly affected by these collaboration and innovation dynamics.
The effect values of Co-creation, SDL and open innovation on supply chain performance are as follows: 0.19, 0.33 and 0.14, respectively. Co-creation effect (β=0.19, p<%0.01) on supply chain performance derived from structural equation is congruent with Lin et al. (2010) in which 0.21 beta coefficient was acquired from the research made on Taiwanese high-tech firms. Another study by Ren et al. (2015) also points to a strong effect towards partnership quality. Work of Ren et al. (2015) is beneficial to mention at this point because, supply chain members are actually partners rather than suppliers or customers. SDL also returned a significant beta coefficient value (β=0.33, p<%0.01). Comparing to the other elements used in the model, SDL represents a dominant antecedent of supply chain performance. In our notion, what makes SDL stand out lies in its long-term usage and its easily deductive and measurable nature. Another explanation for SDL’s precedence might be that firms perceive customer satisfaction as an essential aspect of continuity of their existence. Conversely, open innovation has a relatively less impact on supply chain performance (β=0.14, p<%05). We believe the main reason for this result is that open innovation has not found itself adequate application areas among the organizations. In addition, firms may perceive open innovation as perfection rather than a prerequisite. Our study has similar results compared to the work of Bigliardi et al. (2010) who made research on Italian food machinery industry. According to the results, H7, H8 and H9 hypotheses are accepted.
In this study, interactions between negative entropy, entrepreneurship orientation and co-creation, SDL, open innovation were examined as well. According to structural equation modeling results, entrepreneurship orientation has beta coefficient values of 0.09, 0.08 and 0.22 for co-creation, SDL and open innovation, respectively. H1 and H2 hypotheses are rejected because entrepreneurship orientation had no significant effect on co-creation and SDL. On the contrary, but not surprisingly, H3 hypothesis is accepted for its significant effect of 0.22 (p<%0.01). From these results it can be deduced that entrepreneurship orientation is focused on innovation rather than collaboration. Last but not least, negative entropy returned enormous coefficient results from structural equation calculations. All less than 0.01 significance level, 0.51 for co-creation, 0.51 for SDL and 0.33 for open innovation are the coefficients of negative entropy. Co-creation, SDL and open innovation are concepts that intertwined with partners, concerning self-renewal. Because negative entropy is about environmental interaction and self-renewal, showing robust relation of negative entropy to these concepts is an ineluctable result.
Lastly, individual and detailed effects of innovative and collaborative dynamics on supply chain performance attributes were examined. Couple of implications arise from the derivations shown in Figure 3. First and the foremost issue is the outstanding impact of Negative Entropy on Supply Chain Performance attributes. According to the results, organizations that embrace this concept will undoubtedly operate their supply chains efficiently. Second issue is that why SDL stands out for flexibility, responsiveness, reliability and not for assets, costs. Assets and costs are rather internal performance issues which firms resolve without disruptions from environment. But flexibility, responsiveness and reliability performance
0
0,1
0,2
0,3
0,4
0,5
0,6
Reliability Responsiveness Flexibility Costs Assets
EO
NE
CC
SDL
OI

Journal of Management, Marketing and Logistics -JMML (2017), Vol.4(2), p.125-142 Demir, Sezen
_________________________________________________________________________________________________
DOI: 10.17261/Pressacademia.2017.457 134
metrics are mostly external issues which firms often interactively, innovatively or collaboratively address. We contend that this may be the reason why SDL’s effects vary in that manner. Another implication is that the open innovation has a lower impact comparing to other items. The reason for this low result might be that it is rather a new concept in industry and commerce environments, and that the members of the supply chain are often hesitant to utilize open innovation due to security concerns.
5. CONCLUSION
Fundamental motivation of this paper is to discover how innovative collaboration dynamics affect supply chain performance. We implemented the questionnaire on an exclusively-selected sample, in order to acquire best results. Co-creation, SDL, entrepreneurship orientation and negative entropy scales were taken and adapted from the literature. Open innovation and supply chain performance scales were developed by researchers.
The model proposed in this paper and results derived from calculations provide several academic and managerial implications. First of all, this study approaches negative entropy as a vital element in supply chain operations. Besides, this paper contributes to literature by presenting a framework in which several innovation and collaboration dynamics are connected to supply chain performance unlike any other previous research. By bringing these concepts together, this research paves a new direction for empirical research on supply chain performance. According to structural equation results, co-creation and SDL have substantial impact, open innovation has medium impact on supply chain performance. An interesting finding is the superior influence of negative entropy on these dynamics. We believe that these concepts, negative entropy in particular, are important candidates of future supply chain performance studies.
As stated in the first two sections, innovation and collaboration are crucial for supply chains. This study confirms their importance congruently both with its findings and with a relatively high response rate of %45, prompting organizations to apply innovation and collaboration in daily supply chain operations. We assert that supply chains paying attention to innovation and collaboration will improve in performance. We hope that this paper will be helpful for both academicians and practitioners in improving and extending their work further.
On the other hand this paper has some limitations. First of all, this research was applied on a sample which is comprehensive but limited to organizations with R&D departments. The main reason behind this exclusive sample selection is the thought that these organizations could more accurately perceive the notions presented in this study. However, the model proposed in this study can also be applied to firms without R&D departments which are successful in their sectors with significant market share.
Secondly, during the composition of the model, we used entrepreneurship orientation, negative entropy, co-creation, SDL and open innovation concepts. However, innovative and collaborative concepts such as, network governance (Verwaal&Hesselmans, 2004), new product development (Nambisan, 2002) and long-term relationship orientation (Ganesan, 1994) can also be used in future studies to improve our level understanding in supply chain performance. Additionally, taking significant effect of negative entropy on supply chain performance metrics into consideration, this conspicuous concept, should used in future studies about supply chain, would provide further organizational level of understanding.
In this paper supply chain performance is examined and measured through SCOR attributes. Nonetheless, literature provides a number of supply chain performance measurement methods which can also be used (Torabizadeh, 2014). On the other hand, additional research can be made with the concepts we studied on sustainable supply chain performance (Varsei, 2014).
REFERENCES
Anderson, B.S., Covin, J.G. and Slevin, D.P., (2009). Understanding the relationship between entrepreneurial orientation and strategic learning capability: an empirical investigation. Strategic Entrepreneurship Journal. 3(3). pp.218-240.
Atuahene-Gima, K., and Ko, A. (2001). An empirical investigation of the effect of market orientation and entrepreneurship orientation alignment on product innovation. Organization science. 12(1). pp.54-74.
Avolio, B.J., Yammarino, F.J., Bass, B.M. (1991). Identifying Common Methods Variance with Data Collected From a Single Source: an Unresolved Sticky Issue. Journal of Management. 17(3). pp.571-587.
Azadegan, A. and Dooley, K.J., (2010). Supplier innovativeness, organizational learning styles and manufacturer performance: An empirical assessment. Journal of Operations Management. 28(6). pp.488-505.

Journal of Management, Marketing and Logistics -JMML (2017), Vol.4(2), p.125-142 Demir, Sezen
_________________________________________________________________________________________________
DOI: 10.17261/Pressacademia.2017.457 135
Bagozzi, Richard P. and Yi, Youjae. (1988). On the Evaluation of Structural Equation Models. Journal of Academy of Marketing Science. 16(1). pp.74-94.
Ballantyne, D. (2004). Dialogue and its role in the development of relationship specific knowledge. Journal of Business & Industrial Marketing. 19(2). pp.114-123.
Ballantyne, D., and Varey, R. J. (2006). Creating value-in-use through marketing interaction: the exchange logic of relating, communicating and knowing. Marketing theory. 6(3). pp.335-348.
Bigliardi, B., Bottani, E. and Galati, F., (2010). Open innovation and supply chain management in food machinery supply chain: a case study. International Journal of Engineering. Science and Technology. 2(6). pp.244-255.
Bolstorff, P., (2002). How does SCOR measure up. Supply Chain Technology News, pp.22-25.
Borys, B. and Jemison, D.B. (1989). Hybrid agreements as strategic alliances: theoretical issues in organizational combinations. Academy of Management Review. 14(2). pp.234-49.
Bowersox, D. J., Closs, D. J., and Cooper, M. B. (2002). Supply chain logistics management. 2nd Edition. New York, NY: McGraw-Hill.
Battilana, J., Leca, B., and Boxenbaum, E. (2009). How actors change institutions: Towards a theory of institutional entrepreneurship. The Academy of Management Annals. 3(1). pp.65-107.
Callaway, S. K. and Dobrzykowski, D. D. (2009). Service-oriented entrepreneurship: service-dominant logic in green design and healthcare. Service Science. 1(4). pp.225-240.
Cenfetelli, R.T. and Bassellier, G. (2009). Interpretation of Formative Measurement in Information Systems Research. Mis Quarterly. 33(4). pp.689-707.
Chen, Y.C., Li, P.C. and Evans, K.R. (2012). Effects of interaction and entrepreneurial orientation on organizational performance: Insights into market driven and market driving. Industrial Marketing Management. 41(6). pp.1019-1034.
Chesbrough H.W. (2003). The era of open innovation. MIT Sloan Manag. Rev. 44 (3). pp. 35-38.
Chesbrough, H.W. (2012). Open innovation: Where we've been and where we're going. Research Technology Management. 55(4). pp.20-27.
Chin, W.W., (1998). The partial least squares approach to structural equation modeling. Modern methods for business research. 295(2). pp.295-336.
Christopher, M. (2011). Logistics & supply chain management. Fourth Edition. Pearson Education Ltd.
Covin, J.G., Green, K.M. and Slevin, D.P. (2006). Strategic process effects on the entrepreneurial orientation–sales growth rate relationship. Entrepreneurship theory and practice. 30(1). pp.57-81.
Dong, B., Evans, K.R. and Zou, S., (2008). The effects of customer participation in co-created service recovery. Journal of the Academy of Marketing Science. 36(1). pp.123-137.
Dibrell, C. and Moeller, M., (2011). The Impact of a Service-Dominant Focus Strategy and Stewardship Culture on Organizational Innovativeness in Family-Owned Businesses. Journal of Family Business Strategy. 2(1). pp.43-51.
Dyer, J. H. (2000). Collaborative advantage: Winning through extended enterprise supplier networks. Oxford University Press.
Fawcett, S.E., Jones, S.L. and Fawcett, A.M. (2012). Supply chain trust: The catalyst for collaborative innovation. Business Horizons. 55(2). pp.163-178.
Finney, R. Z., Spake, D. F., and Finney, T. G. (2011). Lost in transition? The human influence on marketing's emerging service-dominant logic. Journal of Management and Marketing Research. 6. pp.1-16.
Flint, D. J., and Mentzer, J. T. (2006). Striving for integrated value chain management given a service-dominant logic for marketing. In R. F. Lusch & S. L. Vargo (Eds). The service dominant logic of marketing: Dialog, debate and directions. pp. 139-149.
Fornell, C. and Larcker, D.F. (1981). Evaluating Structural Equation Models with Unobservable Variables and Measurement Error. Journal of Marketing Research. 18(1). pp.39-50.
Galbraith, J. (2005). Designing the Customer-Centric Organizations. San Francisco.
Ganesan, S. (1994). Determinants of long-term orientation in buyer-seller relationships. the Journal of Marketing. 58(2). pp.1-19.
Goffin, K., Lemke, F., and Szwejczewski, M. (2006). An exploratory study of ‘close’supplier–manufacturer relationships. Journal of operations management. 24(2). pp.189-209.
Gok, Tarkan. (2014). A Practice About the Effects of Innovative and Negative Entropic Strategies on Corporate Identity. Halic University, Doctoral Thesis.
Golafshani, Nahid, (2003). Understanding Reliability and Validity in Qualitative Research. The Qualitative Report. 8(4). pp.597–607.

Journal of Management, Marketing and Logistics -JMML (2017), Vol.4(2), p.125-142 Demir, Sezen
_________________________________________________________________________________________________
DOI: 10.17261/Pressacademia.2017.457 136
Grinberg, S. (2007). Pedagogical Risk and Governmentality: Shanty Towns in Argentina in the 21st Century. In trabajo presentado en Risk and Rationalities Conference, Economic & Social Research Council. pp. 29-30.
Grönroos, C. (2008). Adopting a service business logic in relational business-to-business marketing: value creation, interaction and joint value co-creation. In Otago forum. 2(9). pp.268-287.
Gunasekaran, A., and Ngai, E. W. (2004). Information systems in supply chain integration and management. European Journal of Operational Research. 159(2). pp.269-295.
Halbesleben, J. R. and Whitman, M. V. (2013). Evaluating Survey Quality in Health Services Research: a Decision Framework for Assessing Nonresponse Bias. Health services research. 48(3). pp.913-930.
Hair, Joseph F. Jr., Black, William C., Babin, Barry J. and Anderson, Rolph E. (2010). Multivariate Data Analysis. 7th Edition. Pearson Education. New Jersey.
Hamel, G., Doz, Y., and Prahalad, C. (1989). Collaborate with your competitors. Harvard business review. 67(1). pp.133-139.
Handfield, R.B., Ragatz, G.L., Petersen, K.J. and Monczka, R.M., (1999). Involving suppliers in new product development. California management review. 42(1). pp.59-82.
Harman, H. H. (1976). Modern factor analysis. Chicago, IL: University of Chicago Press.
Henseler, J., Ringle, C. M. and Sinkovics, R. R. (2009). The Use of Partial Least Squares Path Modeling in International marketing. Advances in İnternational Marketing. 20(1). pp.277–319.
Inauen, M., and Schenker-Wicki, A. (2011). The impact of outside-in open innovation on innovation performance. European Journal of Innovation Management. 14(4). pp.496-520.
Jiang, X., Yang, Y., Pei, Y.L. and Wang, G., (2014). Entrepreneurial orientation, strategic alliances, and firm performance: Inside the black box. Long Range Planning. 49(1). pp. 103-116.
Jothimani, D. and Sarmah, S.P., (2014). Supply chain performance measurement for third party logistics. Benchmarking: An International Journal, 21(6), pp.944-963.
Karpen, I. O., and Bove, L. L. (2008). Linking SD logic and marketing practice: Toward a strategic service orientation. In Otago Forum. 2(9). pp. 214-237.
Kast, R. E., and Rosenzweig, J. E. (1974). Organization and management. New York.
Katz, D. and Kahn. R. L. (1978). The social psychology of organizations. 2nd Edition. New York: Wiley.
Kocaoğlu, B., Gülsün, B. and Tanyaş, M., (2013). A SCOR based approach for measuring a benchmarkable supply chain performance. Journal of Intelligent Manufacturing. 24(1). pp.113-132.
Kock, N. (2015). WarpPLS 5.0 User Manual. Laredo. Texas: ScriptWarp Systems.
Kreiser, P. M., Marino, L. D., and Weaver, K. M. (2002). Assessing the psychometric properties of the entrepreneurial orientation scale: A multi-country analysis. Entrepreneurship Theory and Practice. 26(4). pp71-94.
Lamberti, L., and Paladino, A. (2013). Moving forward with service dominant logic: Exploring the strategic orientations of a service-centred view of the firm. International Journal of Business Science and Applied Management. 8(1). pp.1-15.
Lewis, E.F., Hardy, M. and Snaith, B. (2013). An Analysis of Survey Reporting in the Imaging Professions: is the Issue of Non-Response Bias Being Adequately Addressed? Radiography. 19(3). pp.240-245.
Liao, S. H., and Kuo, F. I. (2014). The study of relationships between the collaboration for supply chain, supply chain capabilities and firm performance: A case of the Taiwan׳ s TFT-LCD industry. International Journal of Production Economics. 156. pp.295-304.
Lichtenthaler, U., (2008). Open innovation in practice: an analysis of strategic approaches to technology transactions. IEEE Transactions on engineering management. 55(1). pp.148-157.
Lin, Y., Wang, Y. and Yu, C., (2010). Investigating the drivers of the innovation in channel integration and supply chain performance: A strategy orientated perspective. International Journal of Production Economics. 127(2). pp. 320-332.
Lisboa, A., Skarmeas, D., and Lages, C. (2011). Entrepreneurial orientation, exploitative and explorative capabilities, and performance outcomes in export markets: A resource based approach. Industrial Marketing Management. 40(8). pp.1274-1284.
Lumpkin, G. T., and Dess, G. G. (1996). Clarifying the entrepreneurial orientation construct and linking it to performance. Academy of Management Review. 21(1). pp.135–172.
Lumpkin, G. T., and Dess, G. G. (2001). Linking two dimensions of entrepreneurial orientation to firm performance: The moderating role of environment and industry life cycle. Journal of business venturing. 16(5). pp.429-451.

Journal of Management, Marketing and Logistics -JMML (2017), Vol.4(2), p.125-142 Demir, Sezen
_________________________________________________________________________________________________
DOI: 10.17261/Pressacademia.2017.457 137
Lusch, R. F., Vargo, S. L., and Malter, A. J. (2006). Taking a leadership role in global marketing management. Organizational Dynamics. 35(3). pp.264-278.
Lusch, R. F., Vargo, S. L., and O’Brien, M. (2007). Competing through service: Insights from service-dominant logic. Journal of retailing. 83(1). pp.5-18.
Lusch, R. F. (2011). Reframing supply chain management: a service‐dominant logic perspective. Journal of Supply Chain Management. 47(1). pp.14-18.
Madhani, P. M. (2012). Value creation through integration of supply chain management and marketing strategy. The IUP Journal of Business Strategy. 9(1). pp.7-26.
Mascarenhas, O. A., Kesavan, R., and Bernacchi, M. (2004). Customer value-chain involvement for co-creating customer delight. Journal of consumer marketing. 21(7). pp.486-496.
Merz, M. A., He, Y., and Vargo, S. L. (2009). The evolving brand logic: a service-dominant logic perspective. Journal of the Academy of Marketing Science. 37(3). pp.328-344.
Najmi, A. and Makui, A., (2012). A conceptual model for measuring supply chain's performance. Production Planning & Control. 23(9). pp.694-706.
Nam, K., and Lee, N. H. (2010). Typology of Service Innovation from Service-Dominant Logic Perspective. J. UCS. 16(13). pp.1761-1775. Nambisan, S. (2002). Designing virtual customer environments for new product development: Toward a theory. Academy of Management Review. 27(3). pp.392-413.
Payne, A. F., Storbacka, K., and Frow, P. (2008). Managing the co-creation of value. Journal of the academy of marketing science. 36(1). pp.83-96.
Peery, N. S. (1975). General systems theory approaches to organizations: Some problems in application. Journal of Management Studies. 12(3). pp266-275.
Pilav-Velić, A., and Marjanovic, O. (2016). Integrating open innovation and business process innovation: Insights from a large-scale study on a transition economy. Information & Management. 53(3). pp.398-408.
Podsakoff, P.M. and Organ, D.W., (1986). Self-reports in organizational research: Problems and prospects. Journal of management, 12(4), pp.531-544.
Prahalad, C. K., and Ramaswamy, V. (2004). Co‐creation experiences: The next practice in value creation. Journal of interactive marketing. 18(3). pp.5-14.
Ramanathan, U., Gunasekaran, A. and Subramanian, N., (2011). Supply chain collaboration performance metrics: a conceptual framework. Benchmarking: An International Journal. 18(6). pp.856-872.
Rauch, A., Wiklund, J., Lumpkin, G. T. T., and Frese, M. (2009). Entrepreneurial orientation and business performance: An assessment of past research and suggestions for the future. Entrepreneurship: Theory and Practice. 33(3). pp.761-787.
Read, S., N. Dew, S. Sarasvathy, M. Song and R. Wiltbank. (2009). Marketing Under Uncertainty: The Logic of an Effectual Approach. Journal of Marketing. 73(3). pp.1-18.
Ren, S. J., Hu, C., Ngai, E. W. T., and Zhou, M. (2015). An empirical analysis of inter-organisational value co-creation in a supply chain: a process perspective. Production Planning & Control. 26(12). pp.969-980.
Runyan, R., Droge, C. and Swinney, J., (2008). Entrepreneurial orientation versus small business orientation: what are their relationships to firm performance?. Journal of Small Business Management. 46(4). pp.567-588.
Saguy, I. S., and Sirotinskaya, V. (2014). Challenges in exploiting open innovation's full potential in the food industry with a focus on small and medium enterprises (SMEs). Trends in Food Science & Technology. 38(2). pp.136-148.
Sarasvathy, S. (2008). Effectuation: Elements of Entrepreneurial Expertise, Edward Elgar Publishing, Cheltenham, UK.
Schneider, M., and Somers, M. (2006). Organizations as complex adaptive systems: Implications of complexity theory for leadership research. The Leadership Quarterly. 17(4). pp.351-365.
Seifert, D. (2003). Collaborative planning, forecasting, and replenishment: How to create a supply chain advantage. AMACOM Div American Mgmt Assn. New York.
Shamah, R.A. and Elsawaby, S.M., (2014). Trust as a nucleus key for open innovation. Journal of Business and Retail Management Research. 9(1). pp.110-128.
Shane, S., and Venkataraman, S. (2000). The promise of entrepreneurship as a field of research. Academy of Management Review. 25(1). pp217-226.
Sillanpää, I., (2015). Empirical study of measuring supply chain performance. Benchmarking: An International Journal. 22(2). pp.290-308.

Journal of Management, Marketing and Logistics -JMML (2017), Vol.4(2), p.125-142 Demir, Sezen
_________________________________________________________________________________________________
DOI: 10.17261/Pressacademia.2017.457 138
Simatupang, T.M. and Sridharan, R., (2002). The collaborative supply chain. The International Journal of Logistics Management. 13(1). pp.15-30.
Starik, M., and Rands, G. P. (1995). Weaving an integrated web: Multilevel and multisystem perspectives of ecologically sustainable organizations. Academy of Management Review. 20(4). pp.908-935.
Stephens, S., (2000). The Supply Chain Council and the Supply Chain Operations Reference (SCOR) model: Integrating processes, performance measurements, technology and best practice. Logistics Spectrum. 34(3). pp.16-18.
Stephens, S. (2001). Supply chain operations reference model version 5.0: a new tool to improve supply chain efficiency and achieve best practice. Information Systems Frontiers. 3(4). pp.471-476.
Tenenhaus, M., Vinzi, V. E., Chatelin, Y. M., and Lauro, C. (2005). PLS path modeling. Computational statistics & data analysis. 48(1). pp.159-205. Theeranuphattana, A. and Tang, J.C., (2007). A conceptual model of performance measurement for supply chains: Alternative considerations. Journal of Manufacturing Technology Management. 19(1). pp.125-148.
Torabizadeh, M. E., Noordin, M. Y., and Awaluddin, M. S. (2014). Performance Measurement System for Sustainable Supply Chain Management. Advanced Materials Research. 845. pp.516-520.
Traitler, H., Watzke, H. J. and Saguy I. S. (2011). Reinventing R&D in an open innovation ecosystem. Journal of food science. 76(2). pp.R62-R68.
Ulrich, K. T., and Ellison, D. J. (2005). Beyond make-buy: Internalization and integration of design and production. Production and Operations Management. 14(3). pp.315-330.
Užienė, L. (2015). Open Innovation, Knowledge Flows and Intellectual Capital. Procedia-Social and Behavioral Sciences. 213. pp.1057-1062.
Van Lancker, J., Wauters, E., and Van Huylenbroeck, G. (2016). Managing innovation in the bioeconomy: An open innovation perspective. Biomass and Bioenergy. 90. pp.60-69.
Vargo, S., F. Lusch. (2004). Evolving to a New Dominant Logic for Marketing. Journal of Marketing. 68(1). pp.1-17.
Vargo, S. L., Maglio, P. P., and Akaka, M. A. (2008). On value and value co-creation: A service systems and service logic perspective. European management journal. 26(3). pp.145-152.
Varsei, M., Soosay, C., Fahimnia, B., and Sarkis, J. (2014). Framing sustainability performance of supply chains with multidimensional indicators. Supply Chain Management: An International Journal. 19(3). pp.242-257.
Waters, D. (2010). Global Logistics: New Directions In Supply Chain Management. 6th Edition. Kogan Page.
Verwaal, E., and Hesselmans, M. (2004). Drivers of Supply Network Governance: An Explorative Study of the Dutch Chemical Industry. European Management Journal. 22(4). pp.442-451.
West, J., Salter, A., Vanhaverbeke, W., and Chesbrough, H. (2014). Open innovation: The next decade. Research Policy. 43(5). pp.805-811.
Wetzels, M., Odekerken-Schroder, G. and Van Oppen, C. (2009). Using PLS Path Modeling for Assessing Hierarchical Construct Models: Guidelines and Empirical Illustration. MIS Quarterly. 33(1). pp.177-196.
Yamazaki, K., Capatina, A., Bouzaabia, R. and Kocoglu, I., (2012). Cross-Cultural Issues Related to Open Innovation in High-Tech Companies from Japan, Romania, Tunisia and Turkey. Revista de Management Comparat International. 13(4). pp.561-573.
Zehir, C., Can, E. and Karaboga, T. (2015). Linking Entrepreneurial Orientation to Firm Performance: The Role of Differentiation Strategy and Innovation Performance. Procedia-Social and Behavioral Sciences. 210. pp.358-367.
Zhou, K. Z., Yim, C. K., and Tse, D. K. (2005). The effects of strategic orientations on technology- and market-based breakthrough innovations. Journal of Marketing. 69(2). pp.42-60.
Zwass, V. (2010). Co-creation: Toward a taxonomy and an integrated research perspective. International Journal of Electronic Commerce. 15(1). pp.11-48.

Journal of Management, Marketing and Logistics -JMML (2017), Vol.4(2), p.125-142 Demir, Sezen
_________________________________________________________________________________________________
DOI: 10.17261/Pressacademia.2017.457 139
Appendix 1 Measures and Items Construct and Measurement Item Factor Loadings Reference
Entrepreneurship Orientation X=3.69 σ=0.85 Jiang et al. 2014 Under uncertainty, our company always adopts an adventurous and active attitude.
.774
Our company strongly prefers high-risk projects (with chances of very high return).
.779
Our company always takes bold, wide-ranging strategic actions rather than making minor tactical changes.
.833
When confronted with decisions involving uncertainty, our company always adopts a bold posture to maximize the probability of exploiting opportunities.
.881
Negative Entropy X=4.01 σ=0.59 Gok, 2014 In our supply chain, there is a positive and efficient structure that prevents dissolution.
.705
In our supply chain, knowledge is deemed valuable and there are necessary systems to protect it.
.791
There are effective strategies deployed in order to preserve our supply chain. .724
In our supply chain, technical and technological assets are protected supremely.
.584
In our supply chain, elements that would cause disorder are removed. .639
In our supply chain, processes are taken under control by creating standard operational procedures.
.684
Systems are developed to restore supply chain balance and stability that can be disrupted time to time.
.637
Co-Creation X=4.04 σ=0.45 Lin et al. 2010 We execute co-creation processes with other supply chain members. .720
Ideas conveyed from other members of supply chain encourage us in value co-creation.
.713
We plan the value presented to customers with other members of supply chain together.
.721
As members of supply chain, we utilize multiple channels in acquiring customer information.
.646
Other supply chain members concur with us on co-creating the value. .593
Service Dominant Logic X=4.20 σ=0.55 Dibrell&Moeller, Our business objectives are driven primarily by customer satisfaction. .690 2011 We constantly monitor our level of commitment and orientation to serving customers’ needs.
.730
We give close attention to after-sales service. .767
We measure customer satisfaction systematically and frequently. .608
Our business strategies are driven by our beliefs about how we can create greater value for customers.
.589
We not only present products to our customers but also services integrated with them.
.634
Open Innovation X=3.73 σ=0.77 Developed by We innovate new products and services with other members of our supply chain.
.780 Researchers
We include our retailers and suppliers to our innovation processes. .818
We do not limit innovation activities to company boundaries, and carry out with other supply chain members.
.796
We develop special products and services with our supply chain members to our customers.
.759
Supply Chain Performance X=4.08 σ=0.49
Developed by Delivering right order to right customers .764 Researchers Delivering orders to customers at right place .812
Delivering orders to customers at right quantity .783
Delivering orders to customers at the requested time .619

Journal of Management, Marketing and Logistics -JMML (2017), Vol.4(2), p.125-142 Demir, Sezen
_________________________________________________________________________________________________
DOI: 10.17261/Pressacademia.2017.457 140
Delivering orders to customers at the requested quality .699
Responding to customer-designated supply time .697
Responding to customer-designated delivery locations .672
Responding rapidly to customers given orders .669 Flexibility for customer-oriented products or services .784 Flexibility for over-volumed customer orders .805 Flexibility for additional customer-requested delivery locations .714 Cost savings in firm’s production expenditures .781 Cost savings in firm’s procurement expenditures .815 Cost savings in firm’s logistics expenditures .835 Cost savings in firm’s supply chain management expenditures .801 Improvements in cash conversion cycle .815 Improvements in return-on-assets ratio .798
Improvements in capacity usage .653 Improvements in inventory turnover .676
Note: All factor loadings are acquired from SPSS with varimax rotation method.
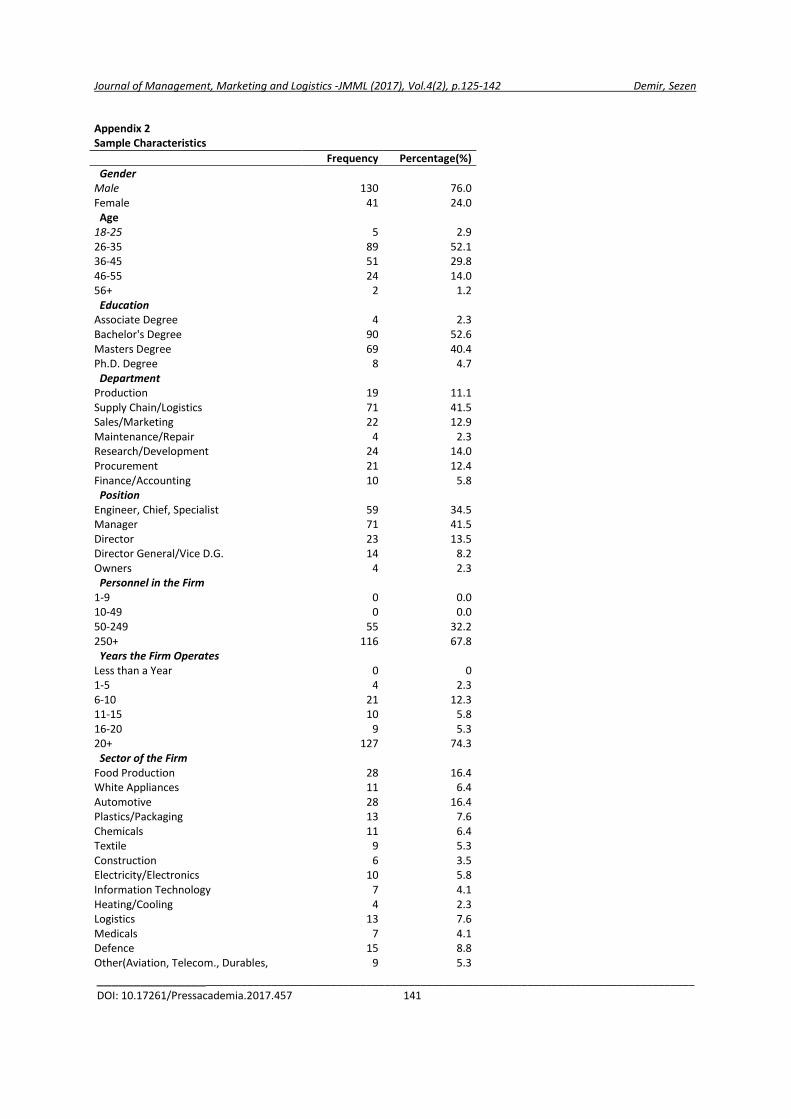
Journal of Management, Marketing and Logistics -JMML (2017), Vol.4(2), p.125-142 Demir, Sezen
_________________________________________________________________________________________________
DOI: 10.17261/Pressacademia.2017.457 141
Appendix 2 Sample Characteristics
Frequency Percentage(%)
Gender Male 130 76.0 Female 41 24.0 Age
18-25 5 2.9 26-35 89 52.1 36-45 51 29.8 46-55 24 14.0 56+ 2 1.2 Education
Associate Degree 4 2.3 Bachelor's Degree 90 52.6 Masters Degree 69 40.4 Ph.D. Degree 8 4.7 Department
Production 19 11.1 Supply Chain/Logistics 71 41.5 Sales/Marketing 22 12.9 Maintenance/Repair 4 2.3 Research/Development 24 14.0 Procurement 21 12.4 Finance/Accounting 10 5.8 Position
Engineer, Chief, Specialist 59 34.5 Manager 71 41.5 Director 23 13.5 Director General/Vice D.G. 14 8.2 Owners 4 2.3 Personnel in the Firm 1-9 0 0.0 10-49 0 0.0 50-249 55 32.2 250+ 116 67.8 Years the Firm Operates Less than a Year 0 0 1-5 4 2.3 6-10 21 12.3 11-15 10 5.8 16-20 9 5.3 20+ 127 74.3 Sector of the Firm Food Production 28 16.4 White Appliances 11 6.4 Automotive 28 16.4 Plastics/Packaging 13 7.6 Chemicals 11 6.4 Textile 9 5.3 Construction 6 3.5 Electricity/Electronics 10 5.8 Information Technology 7 4.1 Heating/Cooling 4 2.3 Logistics 13 7.6 Medicals 7 4.1 Defence 15 8.8 Other(Aviation, Telecom., Durables, 9 5.3

Journal of Management, Marketing and Logistics -JMML (2017), Vol.4(2), p.125-142 Demir, Sezen
_________________________________________________________________________________________________
DOI: 10.17261/Pressacademia.2017.457 142
Forest Products) Position of the Firm in Supply Chain Retailer 5 2.9 Distributer/Wholesaler 7 4.1 Manufacturer 128 74.9 First Tier Supplier 10 5.8 Second Tier Supplier 8 4.7 Logistics Service Provider 13 7.6 Total 171 100

Journal of Management, Marketing and Logistics -JMML (2017), Vol.4(2), p.143-151 Bilgen, Zoghi
_________________________________________________________________________________________________
DOI: 10.17261/Pressacademia.2017.458 143
A RESEARCH ON THE IMPACT OF EWOM SOURCE CREDIBILITY AND PERSONAL INNOVATIVENESS ON ONLINE SHOPPING INTENTION IN TURKISH CUSTOMERS DOI: 10.17261/Pressacademia.2017.458 JMML- V.4-ISS.2-2017(7)-p.143-151 Ilknur Bilgen
1, Farzaneh Soleimani Zoghi
2
1Hakkari University, 30000, Hakkari, Turkey. [email protected] 2SRH University of Applied Sciences Berlin, Ernst-Reuter-Platz 10, 10587 Berlin, Germany. [email protected]
To cite this document Bilgen, I. and F.S. Zoghi, (2017). A research on the impact of eWOM source credibility and personal innovativeness on online shopping intention in Turkish customers. Journal of Management, Marketing and Logistics (JMML), V.4, Iss.2, p.143-151. Permemant link to this document: http://doi.org/10.17261/Pressacademia.2017.458 Copyright: Published by PressAcademia and limited licenced re-use rights only.
ABSTRACT Purpose - The aim of this study is to determine the relationship between eWOM credibility, which consisted of expertness, trustworthiness, objectivity and homophily, and perceived customer risk during the purchase process. Moreover, in order to get an indication of customer behavior, the effect of personal innovativeness and customer perceived risk on online shopping intention has been investigated. Turkish customers’ concern about online purchasing and their risk perception level enhances the importance of the research while there isn’t any research observed in this area before. Methodology - Data is gathered by survey as a quantitative method. Population of the research contains individuals that buy goods and services online in Turkey. Convenience sampling is used and the sample size is 280. Analysis methods used in this research are descriptive statistics, exploratory factor analysis and structural equation model test. Findings- Results of current survey indicate that, personal innovativeness has a positive effect on online purchase intention, however, risk perception affects it negatively. Furthermore, eWOM and personal innovativeness reduces customer perceived risk. Conclusion- Although many factors affect online purchase intention, personal innovativeness, eWOM credibility and customer perceived risk are among the most important factors. The results of current study clearly support all hypotheses. Developing tools to make online purchase more secure and creating a positive eWom among customers decrease customers’ perceived risk and increase online buying intention among Turkish customers.
Keywords: Customer perceived risk, eWOM credibility, personal innovativeness, online shopping intention. JEL Codes: M30, M31, M39
1. INTRODUCTION
Internet usage and online retailing in Turkey is emerging very fast. As many other topics, purchase process is also adapted to electronic platform. An increasing number of consumers use more than one channel in shopping. Customers want themselves to be satisfied during the whole process. They go online and offline (brick and mortar) stores and compare the price before shopping. This strong competition in the retail sector lead both online and offline retailers to choose an effective pricing strategy. Furthermore, customers search for information about products or services mostly on websites and social media. Online social networks have turned into an essential part of customer’s daily purchase decision making process. Electronic word-of-mouth (eWOM) has a significant impact on customers’ choices because it gives goods and services online suppositions (Litvin and et al. 2008). People tend to search other customers comments and reviews about the products and services on the internet to reduce uncertainty and perceived risks. On the other hand people that share their comments and reviews on the internet have their own reasons. For example vacationers which have been defined as people who read use and post information on internet during their holiday choice process have different motivation for contributing to review sites; they are looking for impressing others based on the financial consequence of their own experience (win or lose), they want to help either customers to have better decision or companies because of their good
Year: 2017 Volume: 4 Issue: 2
Journal of Management, Marketing and Logistics – (JMML), ISSN: 2148-6670, http://www.pressacademia.org/journals/jmml

Journal of Management, Marketing and Logistics -JMML (2017), Vol.4(2), p.143-151 Bilgen, Zoghi
_________________________________________________________________________________________________
DOI: 10.17261/Pressacademia.2017.458 144
service and finally they want to share their holiday experience with others and empower customer voice (Bronner and Hoog, 2011).
The current research seeks to determine the relationship between eWOM credibility and perceived customer risk during the purchase process. eWOM credibility refers to the expertness, trustworthiness, objectivity and homophily that shape the trust on receivers. Reliable sources seem to reduce Customer Perceived Risk. Moreover, in order to get an indication of customer behavior, the effect of Customer Innovativeness and Customer Perceived Risk on Online Shopping Intention has been investigated.
2. LITERATURE REVIEW
In current section we will review current theoretical knowledge and substantive findings about our topic by looking at the most relevant literature on different social sciences and consumer behavior. Customer Perceived Risk, eWOM Credibility, Customer Innovativeness and Online Shopping Intention will be the highlights of the review.
2.1 Customer Perceived Risk
Risk and risk taking are crucial concepts in the social sciences. There is a critical difference between risk and perceived risk. Risk or objective risk is based on the outcomes of alternatives and their probabilities. In lottery and card games, for example, risk can be objectively calculated, based on known possible outcomes and their probabilities (Das and Teng, 2001). On the other hand, perceived risk or subjective risk refers to customer’s estimate of objective risk (Dowling 1986; Fischhoff 1985). So customers may have different estimates of risk in different situations. Dealing with risky situation, risk perception appears to be an integral part of people’s cognitive processes (Sitkin and Pablo, 1992).
Risk and risk perception are acknowledged as critical in buying decision-making process. Risk perception provides a particularly revealing perspective for studying online retailing. We use the term risk perception to refer to those ambiguities, as perceived by online customers about the future events that may negatively impact on the performance of the products bought online. Researchers have established that consumers’ perception of risk is central to their evaluation and purchase behaviors (Dowling and Staelin, 1994; Dowling, 1986). In consumer behavior literature, risk perception has been defined as the expectation of losses associated with purchase of goods or services and it has a restrainer function in purchase behavior (Peter and Ryan, 1976). Bauer (1960) introduced the concept of clients’ perceived risk for the first time.
There are many factors that affect the impact of perceived risk on online purchase behavior such as frequency of purchase, level of involvement in the purchase decision and satisfaction with previous purchase experience (Pires et al., 2004). Lutz and Reilly (1974) suggested that word-of-mouth is a crucial information source for reducing risk perception. Due to technology developments face to face traditional word-of-mouth has been changed into electronic word-of-mouth and its impact has been grown as well. Source credibility which refers to how much receivers trust on source information and its effect on risk perception has been examined in several researches (Hussain et al, 2016). However, in few studies e-WOM source credibility and online shopping intention have been examined. Current study focuses on the effect of expertness, trustworthiness, objectivity and homophile as e-WOM source credibility and customer innovativeness on customers’ risk perception and online shopping intention in Turkey.
2.2 E-WOM Credibility
Word-of-mouth refers to exchange of information among customers. Since it is a customer generated source of information, it affects customer’s product choice significantly. E-WOM, however, has been defined as “any positive or negative statement made by potential, actual, or former customers about a product or company, which is made available to a multitude of people and institutions via the internet” (Hennig-Thurau et al, 2004). The influence of e-WOM in building powerful brands and developing brand loyalty make it for marketers an interesting topic to focus on. Viral marketing and Buzz marketing, for example, are many companies’ substantial efforts to encourage unpaid peer-to-peer communications and positive e-WOM among customers.
The emergence of social media and online social networking trends facilitate development of user generated online contents such as blogs and pages. Therefore, consumers have more control over their media behavior and play an active role in their purchase decision making process (Riegner, 2007). The wide range of online social interactions among customers has created an intensive informational environment where customers can easily and quickly disseminate their experiments, recommendations and opinions (Chu S. and Kim Y., 2011).
There are several antecedents concerning to e-WOM effect; direction of messages, either positive or negative, affects reader’s (customer) trust on the message. Customers rely on e-WOM messages that have almost the same direction. The higher degree of consensus in e-WOM messages represents higher degree of agreement among customers regarding to the product or service that has been purchased online. Customer related factors such as prior knowledge about the product

Journal of Management, Marketing and Logistics -JMML (2017), Vol.4(2), p.143-151 Bilgen, Zoghi
_________________________________________________________________________________________________
DOI: 10.17261/Pressacademia.2017.458 145
also influence word-of-mouth effect. Customers tend to elaborate their information as their knowledge on the product or service is increased (Doh and Hwang, 2009). Moreover, characteristic of social ties, tie strength and perceptual affinity have positive influence on WOM behaviors, interests and awareness of recipients. (De Bruyn and Lilien, 2008).
Source credibility can be examined from four different dimensions; expertness, trustworthiness, objectivity and homophile. Expertness refers to helpful information, knowledge, believe, and experience which signify the source credibility. Information, website reputation and reviewers are indicators of a credible source; Website is a platform for e-WOM distribution, comments of previous customers influence new customers’ decision making process and create reputation for the website and increase the trustworthiness of provided information. The impact of customer generated opinions help to clarify truthfulness and deceptiveness of the message (Pan and Chiou, 2011). Objectivity refers to the reviewers’ emotions, unusual events and biasness. Written comments or reviews might reduce risk perception and affect truthfulness positively. Homophile refers to the quality of inter relationship. It decrease vulnerability and strengths well beings of personal correspondence (Hussain et al, 2016). Therefore;
Hypothesis 1: There is a negative relationship between eWOM Credibility and Customer Perceived Risk
2.3 Personal Innovativeness
Research on individual adoption of technology drives its roots from Technology Acceptance Model (TAM) (Davis, 1989) that explains perceived usefulness and usage intentions in terms of social influence and cognitive instrumental process. According to TAM an individual’s behavior intention to use technology is based on two beliefs; perceived usefulness which has been defined as the extent to which a person believes that the use of technology will enhance his or her job performance. Perceived ease of use, however, has been defined as the extent to which a person believes that using the technology will be easy and effortless. Three interrelated social forces that affect individuals to adopt or reject a new technology have been reflected by the model; subjective norm, voluntariness and image. Subjective norm has been defined as individual’s perception of his or her most important people’s thoughts about doing or not doing something. Voluntariness has been defined as the extent to which adoption perception is perceived as non-mandatory by potential adopters. Image has been defined as the degree to which using innovation is perceived to enhance individuals’ status in his/her social network (Venkatesh and Davis, 2000).
Perceived ease of use has a prominent role in adoption of innovations (Davis, 1989). Arnould et al. (2004) defined innovation resistance as “a preference for existing, familiar product and behaviors over novel ones”. Hirschman (1980) defined innovators as “novelty seekers”. According to the author “innovators need a smaller cognitive effort to comprehend the new product concept and have a higher competence to evaluate alternative products and select the superior one”. Innovativeness could be applied generally or for a specific domain such as technology innovativeness. According to Goldsmith (2000) general innovativeness, online buying-specific innovativeness and role of customer innovativeness involvement with the internet can predict frequency and intent to buy online in future. Thakur and Srivastava (2014) revealed customer innovativeness as a key construct which improve the intention of online retail adoption directly and by its effective role in reducing consumers’ risk perception in using internet channels for making physical goods’ purchase.
Innovations and new products encompass different type of risk perception which enhances costumer’s resistance to adoption. Online shopping as an innovative way of traditional retailing is associated with various risk perceptions such as performance risk, time risk, social risk, privacy risk and security risk. Performance risk perception refers to product performance relative to customer expectation. Customers hesitate to buy a product shown online (Kim and Forsythe, 2010) and they are afraid of difficulty of returning or exchanging products bought online (Tong, 2010). Time risk perception refers to the time of learning of how to buy on a certain e-retailing web site, the time to wait for it to respond and the additional cognitive effort expended in search process (Kunze and Li-Wei, 2007; Littler and Melanthiou, 2006). Information search is a way for better purchasing decision making to reduce the perceived risk (Hussain and et al, 2016). Social risk perception explains the potential loss of status in a person’s social network because of adopting an untrendy product or service (Featherman and Pavlou, 2003). Security risk perception refers to the perception about security of means of payment. Customers tend to increase online shopping if they feel that their credit card number and other sensitive information are safe. Privacy risk perception refers to unwanted disclosure of customer’s private information or misusing this information by the company collecting it. As already mentioned various shopping risk perceptions influence the selection of shopping channels and act as barrier in online transactions (Thakur and Srivastava , 2015). Therefore;
Hypothesis 2: Personal innovativeness has a favorable influence on online shopping intention
Hypothesis 3: Personal innovativeness reduces online buying risk perception

Journal of Management, Marketing and Logistics -JMML (2017), Vol.4(2), p.143-151 Bilgen, Zoghi
_________________________________________________________________________________________________
DOI: 10.17261/Pressacademia.2017.458 146
2.4 Online Shopping Intention
According to Theory of Planned behavior (TPB) behavioral intention is the most influential predictor of behavior. Behavioral intention has been defined as a person’s intention to perform different behaviors (Ajzen and Fishbein, 1977). There is correlation between behavioral intention and actual behavior (Engel et al., 1986; Sheppard et al., 1988; Venkatesh et al., 2003) therefore; measuring intention to shop online can give acceptable indication of consumer’s actual behavior (Thakur and Srivastava, 2015). When customers are contemplating a repeated purchase decision it could be considered as evidence of some kind of intention or desire to make the purchase. In online purchasing being familiar with online commerce will lead to a higher degree of involvement in the purchase process (San et al., 2011).
Internet users have been classified as internet shoppers and internet browsers. Internet browsers simply browse online for products or services but do not make any purchase. Internet shoppers, however, purchase products and services online (Forsythe and Shi, 2003).
Risk is a particularly important aspect of online shopping. Risk perception in online shopping is expectation of loss in a given electronic transaction (Kim and Forsythe, 2010). Perceived risk related to internet transactions is a key factor that must be addressed in e-commerce because it has been found to have a significant influence on the behavioral intentions to use online services such as online banking (Thakur and Srivastava , 2015). Researches indicate that customers tend to avoid purchasing goods or services on internet when they perceive various types of risks associated to internet behavior purchase. Therefore;
Hypothesis 4: Consumer perceived risk in online retailing negatively influences online shopping intention
3. DATA AND METHODOLOGY
A descriptive research is designed in order to determine the relationship between eWOM credibility and perceived customer risk during the purchase process. Data has been gathered by conducting survey as a quantitative method. The survey consists of three parts; in the first part, participants have been asked to determine their online purchase behavior by answering to questions such as their earlier online purchase experience, their online buying frequency and the item(s) that they have already bought from internet. In the second part, eWOM credibility, personal innovativeness, perceived risk and online purchase intention have been measured by 28 questions. Scales used in this research have been adopted from literature (Table 1). Last part of the survey is about participants’ descriptive information such as age, gender, marital status, education level, employment status and income per month.
Table 1: Scales Used in the Research
Scale Reference
eWOM Credibility Hussain et al. (2017)
Perceived Customer Risk
Bauer (1960), Cox and Cox (2001), Cox, Cox and Zimet (2006), Cox (1967), Dowling and Staelin (1964), Roselius (1971)
Online Shopping Intention
(Ajzen and Fishbein, 1977)
Personal Innovativeness
Agarwal and Prasad (1998)
Population of the research contains individuals that buy goods and services online in Turkey. A sample of 280 university students in Turkey has been selected by Convenience sampling method. All variables have been measured by 5 item Likert scale.
4. FINDINGS AND DISCUSSIONS
The first part of the data has been analyzed by looking at frequency of introduction and demographic items. As seen on Table 2, all respondents have already had online buying experience. Results indicate that majority of participants (81.7 percent) occasionally purchase goods and services online, so online buying frequency is not high and intense among Turkish customers. Results also show that the most online bought products or services are Transport-Tickets (40.7 percent), Books (28.9 percent) and Cosmetics (13.2 percent). Entertainment tickets and cloths are less favorable items for online purchasing.

Journal of Management, Marketing and Logistics -JMML (2017), Vol.4(2), p.143-151 Bilgen, Zoghi
_________________________________________________________________________________________________
DOI: 10.17261/Pressacademia.2017.458 147
Table 2: Introduction Items
Frequency %
Have you ever shopped online before?
Yes No
280 0
100 0
Online buying frequency
Daily Several times per week Once a week Fortnightly Occasionally
1 9
15 26
229
0.4 3.2 5.4 9.3
81.7
Mostly online bought products
Books Transport-Tickets Entertainment-Tickets Clothes Cosmetics Others
81 114 13 9
37 26
28.9 40.7 4.6 3.2
13.2 9.4
In current survey, all of the respondents are students between 18 and 30 years old. 52.9 percent of the respondents are female and 47.1 percent of them are male. Almost all of the participants are single (99.6 percent) and 91.4 percent of them earn less than 2000 TL per month. Education level of more than 50 percent of respondents is high school, 39.3 percent have Bachelor degree and 2.5 percent have MBA. Descriptive statistics of this survey can be seen on Table 3:
Table 3: Descriptive Statistics
Frequency %
Age Group 18-30 280 100
Gender Female Male
148 132
52.9 47.1
Marital Status Married Single
1 279
0.4 99.6
Education Level High School BA MBA
163 110
7
58.2 39.3 2.5
Employment Status
Student 280 100
Income per Month
0-2000 TLs 2001-4000 TLs 4001-6000 TLs 6001-8000 TLs 8001-10000 TLs 10001 TLs+…
256 19 2 2 0 1
91.4 6.8 0.7 0.7 0
0.4
N= 280
In order to analyze the second part of the data, exploratory factor analysis, confirmatory factor analysis, measurement model test and structural Equation model test have been conducted. Exploratory factor analyses results are summarized on Table 4.

Journal of Management, Marketing and Logistics -JMML (2017), Vol.4(2), p.143-151 Bilgen, Zoghi
_________________________________________________________________________________________________
DOI: 10.17261/Pressacademia.2017.458 148
Table 4: EFA Results
Variable Kaiser-Meyer-Olkin
Measure of Sampling Adequacy
Bartlett's Test of Sphericity
Significance
Number of Factors
Name of the Factors
Number of Items
Personal Innovativeness
0.829 0.001 1 Personal Innovativeness
6
eWOM Credibility
0.892 0.001 4
Expertness Trustworthiness Objectivity Homophily
3 3 3 4
Perceived Risk 0.842 0.001 1 Perceived Risk 5
Online Purchase Intention
0.714 0.001 1 Online Purchase Intention
3
To assess measurement reliability and validity of the final model, confirmatory factor analysis has been carried out for all the latent constructs. The fit indices show a good fit between model and observed data (Chi-square/Degree of Freedom= 2.113, RMSEA= 0.063, GFI= 0.847, AGFI= 0.816, IFI= 0.888, CFI= 0.886).
Figure 1: Structural Model
*Chi-square/Degree of Freedom= 2.113, RMSEA= 0.063, GFI= 0.847, AGFI= 0.816, IFI= 0.888, CFI= 0.886
The structural model and corresponding hypothesis have been tested (Figure 1). The results clearly support all hypotheses (Table 5).

Journal of Management, Marketing and Logistics -JMML (2017), Vol.4(2), p.143-151 Bilgen, Zoghi
_________________________________________________________________________________________________
DOI: 10.17261/Pressacademia.2017.458 149
Table 5: Hypotheses
Hypothesis Path Coefficient
Result
Hypothesis 1: There is a negative relationship between eWOM Credibility and Customer Perceived Risk
-0.03 Supported
Hypothesis 2: Personal innovativeness has a favorable influence on online shopping intention
0.40 Supported
Hypothesis 3: Personal innovativeness reduces online buying risk perception -0.22 Supported Hypothesis 4: Consumer perceived risk in online retailing negatively influences online shopping intention
-0.21 Supported
5. CONCLUSION
There are many factors affecting online purchase intention. Personal innovativeness, eWOM credibility and customer perceived risk seem to be some of the most important ones. Innovative people tend to purchase online more. Adding to this, it can be effective on purchase intention via perceived risk. eWOM credibility also can influence perceived customer risk and online purchase intention.
People hesitate over online purchasing because of some factors. Firstly, online shopping is growing newly in Turkey, so consumers can think that it isn’t a reliable way. This situation ends with perceiving online shopping as risky. Consumers have questions about paying online; especially they aren’t willing to share their payment information. Recently some guarantee methods such as 3D have been developed to reduce these risk perceptions. Moreover, delivery of goods or services which has been bought online is a huge problem in online shopping in Turkey. Most of the consumers worry if their products will be delivered on time without any defect. Cooperating with reliable cargo firms could be an effective way for online retailers in order to reduce the risk perceptions about delivery.
Innovative people tend to be calm about online purchasing, while they like to try new purchasing methods earlier. Therefore, their risk perceptions are lower. This situation increases the intention about purchasing online.
In today’s electronically connected world, electronic factors are shaping consumer behavior. People want to comfort themselves about online purchasing by reading others customers’ comments and reviews. Before an individual make a decision to purchase a good or service online, he/she firstly check out other customers’ opinion in the internet. Nowadays, comments and reviews on social media such as Youtube, Facebook, Twitter, Instagram, Snapchat and etc. are the most important source of information for customers. They provide significant and useful information about products’ quality and performance.
In conclusion, firms have to get good feedbacks on the electronic platforms. In order to achieve this, they work really hard. They provide their products free to the influencers or opinion leaders, they spend more for social ads, and sometimes they make agreements with the influencers. However it mustn’t be forgotten that being honest in this process is essential. It is thought that firms aren’t able to make any difference about personal innovativeness but they can play role by different promotion strategies.
This research is focused on the Turkish customers. This is the main limitation of this research. In further studies different cultures can be examined. eWOM and perceived customer risk were studied only on 18 to 30 years old student groups. Different age groups also can be studied later. Furthermore, online purchase behavior of married individuals and families might be interesting as well. Finally any significant association between income and online buying behavior can be investigated.

Journal of Management, Marketing and Logistics -JMML (2017), Vol.4(2), p.143-151 Bilgen, Zoghi
_________________________________________________________________________________________________
DOI: 10.17261/Pressacademia.2017.458 150
REFERENCES
Agarwal, R. & Prasad, J. 1998 “A Conceptual and Operational Definition of Personal Innovativeness in the Domain of Information Technology”, Information Systems Research, Vol.9, No.5, pp. 204-215.
Arnould, E., Price, L. & Zinkhan, G. 2004, “Consumers”, 2nd ed., McGraw-Hill/Irwin, New York, NY.
Ajzen, I. & Fishbein, M. 1977, “Attitude-behavior relations: A theoretical analysis and review of empirical research”, Psychological Bulletin, Vol. 84 No. 5, pp. 888-918.
Bauer, R. A. 1960, “Consumer behavior as risk taking”, In Dynamic marketing for a changing world, Vol. 398.
Bronner, F. & de Hoog, R. 2011, “Vacationers and eWOM: who posts, and why, where, and what?”, Journal of Travel Research, 50(1), 15-26.
Chu S. & Kim Y. 2011, “Determinants of consumer engagement in electronic word-of-mouth (eWOM) in social networking sites“, International Journal Of Advertising ,Vol. 30 , Iss. 1.
Cox, Anthony D., Dena Cox, and Gregory Zimet. 2006, “Understanding Consumer Responses to Product RiskInformation,” Journal of Marketing, 70 (1), 79-91.
Cox, Dena and Anthony D. Cox. 2001, “Communicating the Consequences of Early Detection:€ The Role ofEvidence and Framing,” Journal of Marketing, 65 (July), 91-103.
Cox, Donald F. ed. 1967, “Risk Taking and Information Handling in Consumer Behavior”, Boston, MA: Harvard University Press.
Das, T. K., & Teng, B. 2001a, “Trust, control, and risk in strategic alliances: An integrated framework”, Organization Studies, 22, 251-283.
De Bruyn, A. & Gary L. L. 2008, “A Multi-Stage Model of Word-of-Mouth Influence through Viral Marketing”, International Journal of
Research in Marketing, 25, 151-163.
Davis, F. D. 1989, “Perceived Usefulness, Perceived Ease of Use, And User Acceptance of information technology”, MIS Quarterly, 13, 3; ABI/INFORM Global, pg. 319.
Doh S. J. & Hwang J. S. 2009, “How consumers evaluate eWOM messages”, Cyber Psychology & Behavior, Vol. 12, No. 2, 193-201.
Dowling, G. R. 1986, “Perceived Risk: The concept and its measurement”, Psychology and Marketing, 3: 193-210
Dowling, G.R. & Staelin, R. 1994, “A model of perceived risk and intended risk-handling activity”, Journal of Consumer Research, Vol. 21, No. 1, pp. 119-134.
Engel, J.F., Blackwell, R.D. & Miniard, P.W. 1986, “Consumer Behavior”, The Dryden Press, Chicago, IL.
Featherman, M.S. & Pavlou, P.A. 2003, “Predicting e-services adoption: a perceived risk facets perspective”, International Journal of Human-Computer Studies, Vol. 59 No. 4, pp. 451-474.
Fischhoff, B. 1985, “Managing Risk Perceptions”. Issues in Science and Technology, 2/1: 83-96.
Fornell, C. & Larcker, D. F. 1981, “Evaluating structural equation models with unobservable variables and measurement error”, Journal of Marketing Research, Vol. 18 No. 1, pp. 39-50.
Forsythe, S. M. & Shi B. 2003, “Consumer patronage and risk perceptions in Internet shopping“, Journal of Business Research, 56 , 867–875.
Goldsmith, R.E. 2000, “Identifying wine innovators: a test of the domain specific innovativeness scale using known groups”, International Journal of Wine Marketing, Vol. 12 No. 2, pp. 37-46.
Hennig-Thurau, T. , Gwinner K. P., Walsh G. & Gremler D. D. 2004, “Electronic Word-of-Mouth via Consumer-Opinion Platforms: What Motivates Consumers to Articulate Themselves on the Internet?”Journal of Interactive Marketing, 18 (1), 38-52.
Hirschman, E.C. 1980, “Innovativeness, novelty seeking, and consumer creativity”, Journal of Consumer Research, Vol. 7 No. 3, pp. 283-295.
Hussain S., Ahmed W., Muhammad Sohail Jafar R. & Rabnawaz A., 2017. “eWOM source credibility, perceived risk and food product customer's information adoption”, Computers in Human Behavior, V. 66 , pp. 96-102.
Kim, J. & Forsythe, S. 2010, “Factors affecting adoption of product virtualization technology for online consumer electronics shopping”, International Journal of Retail & Distribution Management, Vol. 38 No. 3, pp. 190-204.
Kunze, O. & Li-Wei, M. 2007, “Consumer adoption of online music services”, International Journal of Retail & Distribution Management, Vol. 35 No. 11, pp. 862-877.
Litvin, S. W., Goldsmith, R. E. & Pan, B. 2008, “Electronic word-of-mouth in hospitality and tourism management”. Tourism Management, 29, 458- 468.
Littler, D. & Melanthiou, D. 2006, “Consumer perceptions of risk and uncertainty and the implications for behavior towards innovative retail services: the case of internet banking”, Journal of Retailing and Consumer Services, Vol. 13 No. 6, pp. 431-443.

Journal of Management, Marketing and Logistics -JMML (2017), Vol.4(2), p.143-151 Bilgen, Zoghi
_________________________________________________________________________________________________
DOI: 10.17261/Pressacademia.2017.458 151
Lutz, R. J., & Reilly, P. J. 1974, “An exploration of the effects of perceived social and performance risk on consumer information acquisition”, Advances in Consumer Research, 1, 393- 405.
Pan, L.-Y. & Chiou, J.-S. 2011, “How much can you trust online information? Cues for perceived trustworthiness of consumer-generated online information”, Journal of Interactive Marketing, 25, 67-74.
Peter, J.P. & Ryan, M.J. 1976, “An investigation of perceived risk at the brand level”, Journal of Marketing Research, Vol. 2 No. 13, pp. 184-188.
Pires, G., Stanton, J. & Eckford, A. 2004, "Influences on the Perceived Risk of Purchasing Online", Journal of Consumer Behaviour, Vol. 4, No. 2: 118-131.
Reingen, P. H. & Kernan B. J. 1986, “Analysis of Referral Networks in Marketing: Methods and Illustration” Journal of Marketing Research, 23 (4), 370-378.
San Martin, S., Camarero, C., Herna´ndez, C. & Valls, Ll. (2009), “Risk, drivers and impediments to online shopping in Spain and Japan”, Journal of Euromarketing, Vol. 18 No. 1, pp. 47-64.
Sheppard, B.H., Hartwick, J. & Warshaw, P.R. 1988, “the theory of reasoned action: a meta-analysis of past research with recommendations for modifications and future research”, Journal of Consumer Research, Vol. 15 No. 3, pp. 325-343.
Sitkin, S. B. & Pablo, A. L. 1992, “ Reconceptualizing the determinants of risk behavior”. Academy of Management Review, 17, 9-38.
San Martín Carmen S. & San José, C. R. 2011,"Dual effect of perceived risk on cross national e-commerce", Internet Research, Vol. 21 Iss 1 pp. 46 – 66.
Thakur R. & Srivastava M. 2015,"A study on the impact of consumer risk perception and innovativeness on online shopping in India" International Journal of Retail & Distribution Management, Vol. 43 No. 2.
Tong, X. 2010, “A cross-national investigation of an extended technology acceptance model in the online shopping context”, International Journal of Retail & Distribution Management, Vol. 38 No. 10, pp. 742-759.
Venkatesh V., Morris, M. G., Davis, G. B., Davis & F. D., 2003, “User acceptance of information technology: Toward a unified view”, MIS Quarterly, Vol. 27 No. 3, pp. 425-478.

Journal of Management, Marketing and Logistics -JMML (2017), Vol.4(2), p.152-158 Daldir, Tosun
_________________________________________________________________________________________________
DOI: 10.17261/Pressacademia.2017.459 152
COMPARISON OF THE PORT AUTHORITY'S EFFICIENCY IN TURKEY DOI: 10.17261/Pressacademia.2017.459 JMML- V.4-ISS.2-2017(8)-p.152-158
Irmak Daldır
1, Omur Tosun
2
Akdeniz University, Antalya, Turkey. [email protected] Akdeniz University, Antalya, Turkey. [email protected]
_______________________________________________________________________________________________________________________
To cite this document Daldir I and O.Tosun, (2017). Comparison of the port authority's efficiency in Turkey. Journal of Management, Marketing and Logistics (JMML), V.4, Iss.2, p.152-158. Permemant link to this document: http://doi.org/10.17261/Pressacademia.2017.459 Copyright: Published by PressAcademia and limited licenced re-use rights only.
ABSTRACT Purpose- The ports, which are a gateway to international trade, directly affects the country's economy, so their efficiency has vital role for all
countries. With the scarce resources, effective usage of inputs become important. Input factors like terminal area or number of docks are hard to
improve or if possible are very cost-oriented. Therefore, using this limited factors to their maximum capacity becomes one of the main problem in
port management.
Methodology- In order to increase ports efficiency, firstly their actual performances should be determined. With respect to this aspect, in this study
port authority’s efficiencies are compared with data envelopment analysis.
Findings- Ambarlı and İzmir port authorities are found as the most efficient and İskenderun is found as least efficient one.
Conclusion: Performance measurement is the first step to improve performance. In this study, port authority’s efficiency is compared and results
are shared.
Keywords: Efficiency, seaport, productivity, data envelopment analysis.
JEL Codes: C44, L25, M10
1. INTRODUCTION
Nowadays, negativeness of globalization began to discussed as well as its benefits, but it can be still described as an important factor for world economy. Economic growth’s lowest levels are observed after the economic crisis in 2016 (Berksoy, 2016). Expectations for 2017 are more optimistic and 2.7% economic growth was predicted by the World Bank (The World Bank, 2017). Economic stagnation and crises can sometimes lead to be a warning to companies to review their processes and reduce their wastes. The firms which are able to use this situation for their benefit and strengthen their infrastructure could make use of economic distress as an advantage. A firm which uses airline for their goods transport instead of well-conceived transport plans, could need cut down expenses during economic distress and could benefit from it such as preferring maritime transport with better coordinated planning. If it is asked why maritime transport, answer is quite simple: it costs twenty times less than airline transport, seven times less than road transportation, and three times less than railway transport (MÜSİAD, 2015). In addition to its cost benefits, it must be remembered that the environmental concerns should be taken into consideration. Today, it is even observed that firms could bear higher costs to invest sustainable systems. According to International Maritime Organization (IMO) 2.2% of total carbon emission is produced by maritime transport and their aim is to halve carbon emission by 2050 (MÜSİAD, 2015).
With the effect of these advantages 75-80% of the world trade is carried with maritime transport (UTİKAD, 2016) (Koçak, 2012). But the real development that everyone can accept as a revolution in maritime transport is the usage of containers. Containers that have not even been heard before 1960 have now become an important part of maritime trade (Reefke, 2010). If they had not begun to be used, the world would not be "as productive" (Lewis, 2013). From 1968 to today, the daily size of container ships grew by about 1200% (World Shipping Council, 2016). It is thought that this increase is mainly due to the increase in demand and the benefit of economies of scale.
Year: 2017 Volume: 4 Issue: 2
Journal of Management, Marketing and Logistics – (JMML), ISSN: 2148-6670, http://www.pressacademia.org/journals/jmml

Journal of Management, Marketing and Logistics -JMML (2017), Vol.4(2), p.152-158 Daldir, Tosun
_________________________________________________________________________________________________
DOI: 10.17261/Pressacademia.2017.459 153
At the management of the increasing demand of container transport important tasks wait for ports where a vital node for maritime transport is. In the following sections, first the methods used to measure the activity at the ports will be examined and it is followed by data envelope analysis (DEA) method and the container port based performance comparison of the provincial port authorities.
2. LITERATURE REVIEW
The concepts of efficiency and productivity, in some cases can lead to the ambiguity for researchers because of their similarity. Productivity is often defined as a ratio between the volume of the output and the input. The more outputs can be generated with inputs, the more efficient it is.
On the other way, the effectiveness is all about the outputs and tries to answer how much the economic goals are achieved. The relationship between these two concepts is whereas fully effective use of resources means productivity (Suiçmez, 2014).
Dowd and Leschine (1990) summarized the factors that affect productivity and productivity elements in container ports. Accordingly, the elements of terminal operations are introduced and the factors affecting their efficiency are explained (Table 1).
Table 1: Factors Affecting Container Terminals and Productivity Measurements
Terminal Operation Factors
Factors affecting productivity
Container Area Area, Format, Layout, Warehouse Handling Method, Load Density, Waiting Time Crane Crane characteristics, Operators' ability, Training, Cargo availability, Distortions, Terminal
support defects Gateway Operating hours of operation, Degree of automation, Vessel accessibility, Number of lanes Dock Ship schedule, Number of berths, Number of crane Staff Number of job shifts, Work and safety rules, Personnel capabilities, Training and
motivation, Ship characteristics Source: Dowd & Leshine, 1990
Efficiency measurement methods are divided into parametric and nonparametric methods. Parametric methods: stochastic frontier analysis, distribution free analysis, and thick frontier approach. Non parametric methods are free disposal hull and data envelopment approaches (Çağlar & Oral, 2011).
A bibliometric study on the transport is done by Cavaignac and Petiot (2016). This study is based on this literature. They have summarized data envelopment at seaport studies based on most cited articles. The study by Tongzon (2001) is the most cited one. In this study constant returns to scale was used. Inputs were selected as number of cranes, number of docks for container shipment, number of trailers, waiting time and number of staff. Handled container on the basis of Twenty-foot Equivalent Unit (TEU) and operating time were selected as output. At the second study again constant returns to scale was used this time by Roll and Haynuth (1993). In Roll and Haynuth (1993), constant return to scale approach is used with inputs as number of staff, capital and type of load whereas amount of load, number of ships, customer satisfaction and service level as outputs. Culliane et al. (2006) compares stochastic frontier approach and DEA to measure the technical efficiency of container ports. They used terminal length and area, number of quayside gantry, number of yard gantry and number of straddle carrier as inputs and container throughput for the output. Martinez-Budria et al. (1999) used variable return to scale approach in DEA. Labor expenditures, depreciation charges and other expenditures for input whereas total cargo moved through the docks and revenue are used for the outputs of the model. Culliane et al. (2004) included their study quay length, terminal area, number of deck, number of quay gantry cranes, and the number of straddle carriers as inputs and throughput (TEU) as output. Barros and Athanassiou (2004) used DEA to measure effectiveness of Greek and Portuguese ports. In this study both constant return to scale (CRS) and variable return scale (VRS) are used. Number of work force and capital are used as inputs and total handled load as TEU and number of ships are used as outputs. The next study on the list is studied by Turner et al. (2004). In this study North American ports effectiveness is measured at 1984-1997. Single output is used which is total load based on TEU and quay length, terminal area and number of crane are the inputs. Valentine and Gray (2001) are used constant return to scale DEA based on total quay length and container quay length as inputs and TEU based handled container and ton based total amount of load as outputs. The following study is done by Cullinane, Song and Wang (2005) with both DEA and free disposal hull. Quay length, terminal area, the number of cranes on the berth and on the terminal, the number of gantry cranes and the number of containers handled on a TEU basis are the data at the study. The las study on the list is done by Park and De (2004) with both VRS and CRS. Berth capacity and ton based load capacity are inputs total ton based load, number of vessels, and customer satisfaction are outputs.
3.DATA ENVELOPMENT ANALYSIS
Data Envelopment Analysis (DEA) is a non-parametric method based on linear programming approach that calculates the relative efficiency of multiple decision-making units (DMU). Main advantage of non-parametric methods is it can handle multiple inputs and outputs. In general DEA models can be classified as input oriented and output oriented. Input-oriented model focuses on the minimization of inputs and calculates the degree to which each DMU can reduce the quantities of utilized inputs with fixed outputs.

Journal of Management, Marketing and Logistics -JMML (2017), Vol.4(2), p.152-158 Daldir, Tosun
_________________________________________________________________________________________________
DOI: 10.17261/Pressacademia.2017.459 154
On the other hand, the output-oriented model calculates efficiency as the percentage increase in outputs that is feasible by a given available quantity of inputs. This decision should base on the nature of the application. If the decision makers control on the inputs are relatively small or even non exist then output-oriented models can be used; whereas if one cannot control the outputs then input-oriented models should be used (Özden, 2008; Tosun & Aktan, 2010). (Özden, 2008).
The basic DEA model developed by Charnes, Cooper and Rhodes (CCR) has the assumption of constant returns to scale (CRS) for inputs and outputs. In this model, when the inputs have changed the outputs must change with the same ration. Banker, Charnes and Cooper developed the BCC model which take into the variable returns to scale (VRS). In VRS, model evaluates the increasing, constant or decreasing returns to scale would affect the DMU efficiency (Tektüfekçi, 2010; Taşköprü & Erpolat, 2016; Mostafa, 2009).
4. FINDINGS AND DISCUSSIONS
Different studies used different inputs and outputs to measure the port efficiency, which can be seen in literature survey and Table 1. Right variables must be selected to ensure the appropriateness of the study. In this study terminal area, number of docks and maximum handling capacity (year/TEU) for inputs; yearly container throughput for the output. Data is obtained through each harbors’ web page or their managers. All the data is based on 2016 statistics. Trabzonport harbor cannot be reached in the data gathering process, therefore it’s omitted in the study.
In DEA, necessity condition is there should be adequate DMUs. Although different opinions can be seen in literature, Vassiloplu and Giokas (1990) suggested that at least three times of the sum of inputs and outputs should be used in an application. In this study 12 DMUs are used, therefore.
Table 2: Data Set Inputs & Output
Inputs Output
Port Authority Terminal Area Number of Quay for Container Handling
Container Handling Capacity (TEU)
Total Container Throughput (TEU)
Aliağa (DMU1) 88300 7 1630000 641845 Ambarlı (DMU2) 942115 11 4450000 2780168 Antalya (DMU3) 166800 2 500000 172064 Bandırma (DMU4) 268348 4 50000 11289 Gemlik (DMU5) 1250453 16 1670000 693164 İskenderun (DMU6) 1140000 7 3250000 375034 İzmir (DMU7) 343420 6 655000 110332 Kocaeli (DMU8) 902000 10 549000 679905 Mersin (DMU9) 1535000 16 2555000 1143008 Samsun (DMU10) 112000 13 2600000 1406400 Tekirdağ (DMU11) 445000 3 250000 52106
In Table 2 the data as inputs and output is given in summary based on port authorities in other words as decision making units (DMU).

Journal of Management, Marketing and Logistics -JMML (2017), Vol.4(2), p.152-158 Daldir, Tosun
_________________________________________________________________________________________________
DOI: 10.17261/Pressacademia.2017.459 155
Table 3: Detailed Dataset of Turkish Container Ports Input and Output Variables
Terminal Area (𝒎𝟐)
Number of Docks
Capacity (year/TEU) Container Throughput
Aliağa Port Authority
Egegaz 283000 2 680000
641845 Nemport 88300 2 450000
Petkim 169024 3 500000
Ambarlı Port Authority
Akçansa 40000 2 100000
2780168 Mardaş 330000 2 1300000
Kumport 402115 5 2100000
Marport 170000 2 950000
Antalya Port Authority
Port Akdeniz 166800 2 500000 172064
Bandırma Port Authority
Çelebi 268348 4 50000 11289
Gemlik Port Authority
Borusan 360000 2 400000
693164 Yılfert 15853 2 500000
Rodaport 219600 4 170000
Gemport 655000 8 600000
İskenderun Port Authority
Assan Port 140000 2 250000 375034
Limak Port 1000000 5 3000000
İstanbul Port Authority
Haydarpaşa 343420 6 655000 110332
İzmir Port Authority
Alsancak 902000 10 549000 679905
Kocaeli Port Authority
Evyap 265000 4 855000
1143008 Limaş 120000 2 200000
Safiport Derince 450000 4 1500000
Gemport 700000 6 1200000
Mersin Port Authority
Mersin International Port
112000 13 2600000 1406400
Samsun Port Authority
Samsunport 445000 3 250000 52106
Tekirdağ Port Authority
Tekirdağ Liman İşletmesi 118563 5 152000 680271
Asyaport 300000 2 2500000
In table 3 detailed data is shared to show inputs of ports by one by one before we get the port authority sum. WinDEAP program is used for the analysis. The inputs used in the harbors are mostly high value equipment or instruments, so it’s nearly impossible to change the amount of them. For this reason, output-oriented model is selected. Also to analyze the effects of the scale economics, variable return to scale approach is used. Therefore, in the study harbor authority’s relative efficiencies are measured. For each input variable, the sum of the individual harbors is used for the input of the corresponding harbor authority.
Table 4: Summary Statistics of the Variables
Min Max Average Standard deviation
Terminal Area (𝒎𝟐) 88300 1535000 634333,25 137017,57
Number of Quay 2 16 8,5 1,31 Capacity 50000 4450000 1734250 382661,35 Container Throughput 11289 2780168 728798,8 214779,3

Journal of Management, Marketing and Logistics -JMML (2017), Vol.4(2), p.152-158 Daldir, Tosun
_________________________________________________________________________________________________
DOI: 10.17261/Pressacademia.2017.459 156
In table 4 summary statistics of inputs and output is listed, where minimum and maximum, average and standard deviation of data set is shown.
Table 5: Port Authority’s Effectiveness at 2016
Harbour Management
Constant Return to Scale
Variable Return to Scale
Scale Efficiency Return to Scale Summary of Peers
Aliağa 0,793 1 0,793 Increase 0 Ambarlı 1 1 1 - 4 Antalya 0,508 1 0.508 Increase 3 Bandırma 0,182 1 0.508 Increase 1 Gemlik 0,485 0,540 0,899 Decrease 0 İskenderun 0,212 0,231 0,916 Increase 0 İstanbul 0,222 0,277 0,800 Increase 0 İzmir 1 1 1 - 4 Kocaeli 0,579 0,649 0,892 Decrease 0 Mersin 1 1 1 - 1 Samsun 0,209 1 0,209 Increase 0 Tekirdağ 0,406 0,425 0,955 Increase 0 Ortalama 0,550 0,425 0,763
In table 5 it can be seen that Ambarlı, İzmir and Mersin harbors are fully efficient in constant return to scale, whereas Aliağa, Ambarlı, Antalya, Bandırma, İzmir, Mersin and Samsun harbors have full efficiency in variable return to scale. Scale efficiency is defined as the ratio of CRS to VRS. It is the expression of whether a DMU is operating at its optimal size. It’s the indicator of the relation between economics of scale and efficiency (Behioğlu & Özcan, 2009). With increase in the return to scale, an increase in scale of the DMU reflects the technical efficiency progress. On the other hand, if a DMU has decrease in the return to scale, decrease in its scale means technical efficiency increase. From 11 DMUs, Antalya, Ambarlı and İzmir are the most taken as reference.
Table 6: Reference Set of Port Authorities
Port Authority The Port Authorities that should be imitated and rates
Aliağa Aliağa Ambarlı Ambarlı Antalya Antalya Bandırma Bandırma Gemlik İzmir (0,713) Ambarlı (0,287) İskenderun Ambarlı (0,556) Antalya (0,444) İstanbul Mersin (0,150) İzmir (0,199) Bandırma(0,378) Antalya(0,273) İzmir İzmir Kocaeli İzmir (0,486) Ambarlı (0,514) Mersin Mersin Samsun Samsun Tekirdağ Ambarlı (0,545) İzmir(0,012) Antalya (0,443)
In table 6, reference set for each harbor authority is given. Since Aliağa, Ambarlı, Antalya and Bandırma fully effective their references are their themselves. Others have different reference port authorities and the rate of imitation to be fully effective.
Tablo 7: Expected Outputs According to VRS Output Oriented Analysis
Port Authority Real Output: Total Handled
Container (TEU) Expected Amount to Be Fully
Effective Percentage Change
Aliağa 641845 641845 - Ambarlı 2780168 2780168 - Antalya 172064 172064 - Bandırma 11289 11289 - Gemlik 693164 1283441 46 İskenderun 375034 1621011 77 İstanbul 110332 397790,5 72 İzmir 679905 679905 - Kocaeli 1143008 1759917 35

Journal of Management, Marketing and Logistics -JMML (2017), Vol.4(2), p.152-158 Daldir, Tosun
_________________________________________________________________________________________________
DOI: 10.17261/Pressacademia.2017.459 157
Mersin 1406400 1406400 - Samsun 52106 52106 - Tekirdağ 680271 1598815 57
In Table 7, the improvements for the non-efficient DMUs are given. Actual output, desired output for being fully efficient and the relative change is seen in the table. It’s seen that İskenderun port authority is the least efficient among the 12 DMUs. They should have been handled 1.621.011 TEU with their inputs, which is 77% higher than their actual performance.
5. CONCLUSION
Although, it is very important to measure the efficiency, enlightening the inefficiency sources should also be important to effectively utilize the rare resources. Therefore, using DEA is a simple tool to measure the efficiency in port authorities as a managerial tool to evaluate their performance. Classification results can be used for the inefficient ports’ managers for better using their resources, and in this way, these ports’ are able to give better service to their customers. In addition, administrations can use these results to see whether the dedicated resources are used in proper ways. Perhaps the main limitation of this study is the selection of input and output variables. A comprehensive literature research is done for this purpose, but it should be known that selecting different variables can affect the efficiency scores of DMUs.
In recent years with the privatization of ports, ports activities, investments, and objectives has altered. Nowadays most ports open new quays and invest cranes to increase their capacity. Most probably 2017 input data would be higher than 2016’s data. In this study port authority’s efficiency in 2016 is compared by the analysis of data envelopment analysis. With respect to literature review determined inputs were terminal area, number of quays, maximum capacity of ports and the output was total container throughput. Results show that Ambarlı and İzmir port authority are the most efficient and the most referenced ones.
Future studies can compare the activities of oversea ports which are at similar geographical location like all ports at Aegean Sea. In addition to container throughput output, container turnover rate, customer satisfaction, and service level can be used as outputs to improve results as often mentioned in literature.
REFERENCES
Baysal, M. E., Uygur, M., & Toklu, B. (2004). Veri Zarflama Analizi ile TCDD limanlarinda bir etkinlik ölçümü çalışması. Gazi Üniv. Müh. Mim. Fak. Der., 19(4), 437-442.
Behioğlu, S., & Özcan, G. (2009). Veri Zarflama Analizi ve Bankacılık Sektöründe Bir Uygulama. Süleyman Demirel Üniversitesi İktisadi ve İdari Bilimler Fakültesi Dergisi, 14(3), 301-326.
Berksoy, T. (2016, Aralık 27). 2016 Yılında Küresel Ekonomi. Dünya: http://www.dunya.com/kose-yazisi/2016-yilinda-kuresel-ekonomi/343270 adresinden alındı
Cavaignac, L., & Petiot, R. (2016). A quarter century of Data Envelopment Analysis applied to the transport sector: A bibliometric analysis. Socio-Economic Planning Sciences, 1-13.
Cullinane, K., Song, D. W., & Wang, T. (2005). The Application of Mathematical Programming Approaches to Estimating Container Port Production Efficiency. Journal of Productivity Analysis, 24(1), 73-92.
Cullinane, K., Song, D. W., Ji, P., & Wang, T. F. (2004). An Application of DEA Windows Analysis to Container Port Production. Review of network Economics, 3(2), 184-206.
Cullinane, K., Wang, T. F., Song, D. W., & Ji, P. (2006). The Technical Efficiency of Container Ports: Comparing Data Envelopment Analysis and Stochastic Frontier Analysis. Transportation Research Part A: Policy and Practice, 354-374.
Çağlar, V., & Oral, E. Z. (2011, Kasım 20-23). Liman Verimlilik ve Etkinlik Ölçme Yöntemlerinin Analizi. 7. Kıyı Mühendisliği Sempozyumu , s. 665-676.
Dowd, T. J., & Leshine, T. M. (1990). Container terminal productivity: a perspective. Maritime Policy & Management: The flagship journal of international shipping and port research, 17(2), 107-112.
Ekodialog. (2017). Verimlilik Nedir, Verimlilik Çeşitleri ve Verimlilik Ölçümü. Özgün Ekonomi ve Makale Arşivi: http://www.ekodialog.com/Konular/Verimlilik_nedir.html adresinden alındı
Koçak, İ. H. (2012). Dünyada ve Türkiye'de Ekonomik Gelişmeler ve Deniz Ticaretine Yansımları. Ankara: T.C. Ulaştırma Denizcilik ve Haberleşme Bakanlığı Deniz Ticareti Genel Müdürlüğü.
Lewis, O. (2013, Ocak 26). Container Investment. http://containerinvestment.info/the-important-role-of-shipping-containers-in-the-economy/ adresinden alındı

Journal of Management, Marketing and Logistics -JMML (2017), Vol.4(2), p.152-158 Daldir, Tosun
_________________________________________________________________________________________________
DOI: 10.17261/Pressacademia.2017.459 158
Martinez-Budria, E., Diaz-Armas, R., Navarro-Ibanez, M., & Ravelo-Mesa, T. (1999). A study of the efficiency of Spanish Port Authorities using Data Envelopment Analysis. International Journal of Transport Economics/Rivista internazionale di economia dei trasporti, 237-253.
MÜSİAD. (2015). Lojistik Sektöründe Sürdürülebilirlik. İstanbul: Müsiad.
Özden, Ü. H. (2008). Veri zarflama analizi (VZA) ile Türkiye’deki vakıf üniversitelerinin etkinliğinin ölçülmesi. Istanbul University Journal of the School of Business, 37(2), 167-185.
Park, R. K., & De, P. (2004). An Alternative Approach to Efficiency Measurement of Seaports. Maritime Economics & Logistics, 6(1), 53-69.
Reefke, H. (2010). Simulation of conteiner traffic flows at a metropolitan seeport. Advanced Manufacturing and Sustainable Logistics, 420-431.
Suiçmez, H. (2014). Verimlilik ve Etkinlik Terimleri (Tarihsel Bakış). Mülkiye, 169-183.
Taşköprü, V., & Erpolat, S. (2016, Mart). Klasik Veri Zarflama Analizi ile Kategorik Veri Zarflama Analizi Modellerinin Enerji Verimliliği ÜZerinde Karşılaştırmalı İncelenmesi. Yüksek Lisans Tezi. İstanbul: T.C. Mimar Sinan Güzel Sanatlar Üniversitesi Fen Bilimleri Enstitüsü.
Tektüfekçi, F. (2010). İMKB'ye Kayıtlı Halka Açık Teknoloji Şirketlerinde Finansal Etkinliğin Veri Zarflama Analizi (VZA) ile Değerlendirilmesi. Organizasyon ve Yönetim Bilimleri Dergisi, 2(2), 69-77.
The World Bank. (2017, Ocak 10). The World Bank. Zayıf Yatırım Düzeyine Rağmen Küresel Büyüme Yüzde 2,7’ye Yaklaşıyor: http://www.worldbank.org/tr/news/press-release/2017/01/10/global-growth-edges-up-to-2-7-percent-despite-weak-investment adresinden alındı
Tongzon, J. (2001). Efficiency measurement of selected Australian and other international ports using data envelopment analysis. Transportation Research Part A: Policy and Practice, 107-122.
Tosun, Ö., & Aktan, H. E. (2010). SSK Hastanelerinin Sağlık Bakanlığı'na Devrinin Hastane Verimlilikeri Üzerine Etkileri. Tisk Akademi, 113-129.
Turner, H., Windle, R., & Dresner, M. (2004). North American Containerport Productivity: 1984–1997. Transportation Research Part E: Logistics and Transportation Review, 40(4), 339-356.
UTİKAD. (2016, Mayıs 24). Gündem. UTIKAD: http://www.utikad.org.tr/haberler/?id=13545 adresinden alındı
Vassiloglou, M., & Giokas, D. (1990). A Study of The Relative Efficiency of Bank Branches: An Application of Data Envelopment Analysis. Journal of Operational Research Society, 41(7), 591-597.
World Shipping Council. (2016). Container Ship Design. About the industry: http://www.worldshipping.org/about-the-industry/liner-ships/container-ship-design adresinden alındı

Journal of Management, Marketing and Logistics -JMML (2017), Vol.4(2), p.159-167 Degirmenci, et al.
_________________________________________________________________________________________________
DOI: 10.17261/Pressacademia.2017.460 159
COLD CHAIN LOGISTICS FOR FROZEN FOOD AT TOURISM DESTINATIONS DOI: 10.17261/Pressacademia.2017.460 JMML- V.4-ISS.2-2017(9)-p.159-167 Isilay Talay Degirmenci
1, Ismail Karayun
2, Oznur Ozdemir Akyildirim
3
1Antalya International University, Department of Business Administration, Antalya, Turkey. [email protected] 2Akdeniz University, Department of International Trade and Logistics, Antalya, Turkey. [email protected] 3Akdeniz University, Department of Business Administration, Antalya, Turkey. [email protected]
To cite this document Degirmenci, Talay I, Ismail K and Ozdemir-Akyildirim Oznur, (2017). Cold chain logistics for frozen food at tourism destinations. Journal of Management, Marketing and Logistics (JMML), V.4, Iss.2, p.159-167. Permemant link to this document: http://doi.org/10.17261/Pressacademia.2017.460 Copyright: Published by PressAcademia and limited licenced re-use rights only.
ABSTRACT Purpose- The purpose of this paper is to explore possible distribution system models of cold chain logistics for frozen food producers serving
to tourism enterprises.
Methodology- The data were collected through multiple case study method. The firms interviewed were chosen from the most visited
touristic destination in Turkey, Antalya. These firms differed in size and the types of products.
Findings- We have observed significant differences in cold chains for tourism and 3PL-oriented retail sectors. The firms serving to tourism
sector generally choose not to use 3PLs due to issues on food safety/quality despite the advantages in investment costs.
Conclusion- We conclude that the reasons for the reluctance of the producers to work with 3PL providers was the very hot weather and
frequent stops made at hospitality facilities which leave the cold chain prone to temperature changes and product damage as well as the
high demand during peak seasons which lead to urgent order requests nonconforming to 3PL service schedules.
Keywords: Frozen foods, cold chain, logistics management, tourism destinations, 3PL.
JEL Codes: R41, R42, C89
1. INTRODUCTION
The term “cold chain” is used for the special logistics chain required to transport frozen food sensitive to temperature changes during transportation. The cold chain can be described as "cold storage, cold transport and similar operations carried out in order to ensure food quality and compliance with safety criteria during transportation from the producer to the consumer” (Tanyaş, 2013). Cold chain logistics has been used for many years, to preserve the nutritional value of food until reaching the consumers without the need for chemical additives; and the use of cold chain logistics have also become widespread due to the increase in energy efficiency provided by technological improvements. As an indicator of this trend, the number of countries that have signed the ATP Convention, which was signed in Geneva by only 7 countries in 1970 and known as the Agreement on the International Carriage of Perishable Foodstuffs and on the Special Equipment to be used for such Carriage, today reached 52 (Tarhan, 2013). In an effort to control the cold supply chain and prevent chain breakage, it attempts to define international standards for the improvement of all processes (storage, packaging, loading, transportation, etc.) that must be completed from the production of perishable food until delivery to the customer.
In regions with high demand for food and delicacies, the need for cold chains is also increasing. For example, in regions where tourism has developed, tasty food is also of great importance for customer satisfaction. Moreover, some facilities provide food from different cuisines to appeal to their customers’ traditional tastes. In order to meet these requirements, hospitality firms outsource most of the food they will present to their customers as frozen food, and often they do only
Year: 2017 Volume: 4 Issue: 2
Journal of Management, Marketing and Logistics – (JMML), ISSN: 2148-6670, http://www.pressacademia.org/journals/jmml

Journal of Management, Marketing and Logistics -JMML (2017), Vol.4(2), p.159-167 Degirmenci, et al.
_________________________________________________________________________________________________
DOI: 10.17261/Pressacademia.2017.460 160
cooking or heating in their own facilities. With these practices, tourism enterprises can also reduce personnel employment, which is one of the important cost items.
Failure to keep the temperature of the food during the logistics process, or breakage of the cold chain, is a huge risk for both the supplier and the buyer. It will reduce the economic value of the products or make the products completely unusable. Loss of economic value or making products unusable is a huge financial burden for producers. For the tourism business, which is the buyer side, this means that the orders can not be met on time or that the products received are not of sufficient quality, which will put the businesses in trouble during serving their customers. This will reduce customer satisfaction, which is very important for the tourism sector. For these reasons, the potential problems in the cold chain logistics should be thoroughly explored, and the determination of the distribution models which can solve these problems is necessary for both the frozen food producers and one of their important buyers, the tourism industry.
In this paper, problems encountered in the management of cold chain logistics by frozen food producers serving tourism enterprises will be examined and possible distribution models for frozen food will be determined; moreover, the efficiency of these models in different situations will be discussed. To our knowledge, there are not any studies analyzing cold chain logistics specifically at tourism destinations. While delivering frozen products to tourism enterprises; serious problems in ensuring food safety may be encountered such as failure to meet the transportation conditions of the products because of the breakage of the cold chain due to the intermittent weather conditions and proximity of the delivery points (hotels and other tourism facilities located next to each other). Our research questions can be summarized as below:
First, in order to determine the situation in practice; through multiple case studies, we will determine how the logistics processes are carried out while the frozen food producers deliver their products to their customers in the tourism sector. In other words, the process steps and potential problems will be classified in the current situation by determining which logistics processes are executed and financed by which chain partners (logistics service providers, producer firms, customers, etc.).
Then, distribution models that can be used during the transportation of frozen food products to tourism customers will be determined and examined.
The selected distribution models will be compared based on different criteria (efficiency, flexibility, product responsiveness, product quality, process quality (Aramyan et al., 2007)) and a framework will be set out as to which distribution model is more advantageous in terms of each criteria for the producers.
In addition, the factors that lead frozen food producers to or away from outsourcing in logistics will be identified and the benefits / losses that can be encountered by outsourcing in this line of business will be determined.
2. LITERATURE REVIEW
Based on our research questions we will summarize the previous literature on: design and analysis of cold chain logistics, performance evaluation of logistics systems, and outsourcing decisions in logistics. To our knowledge, we have not observed a research study focusing on cold chain logistics of frozen foods in tourism sector; however, especially in regions with dense populations and high demand on pre-prepared food, we see that cold chain logistics has gained attention from the researchers.
The research efforts on cold chain logistics concentrate on designing either the overall supply chain or different aspects of it to minimize costs. Zhang et al. (2003) used the tabu search algorithm to minimize costs of placement and plant-warehouse allocation for a retail frozen food supply chain operating in central and local warehouses. Montanari (2008), Sun et al. (2009), Golnar et al. (2013), and references in the review by Chen et al. (2011) focus on designing a tracking/safety controlling system with the lowest cost. The food safety/quality factor was also emphasized in other researches on performance criteria in the frozen food supply chain. Chaowarut et al. (2009) has identified the ability to respond to food safety and customer demands in the frozen food supply chain as the most important Key Performance Indicator with Analytical Hierarchy Process (AHP) and Balanced Score Card methods. Retail-focused cold food logistics chains may subject their suppliers to detailed inspections based on the HACCP (Hazard Analysis and Critical Control Points) principles (Losito et al., 2011). Accordingly, based on expert opinions by Analytical Hierarchy Process (AHP) by Wang (2010), one of the most neglected criteria by the producers in determining the quality index in the frozen dumpling supply chain is the "transportation and pre-meal food preservation" criterion. There are also studies reporting for effects of different factors on food safety in cold chain logistics, ranging from temperature changes during transportation (Rediers et al., 2009) to the practices of sales agents (Shabani et al., 2012).
As can be seen from the above discussion, one of the most important criteria in the frozen food supply chain problem is that the product quality should be meeting customer needs. In the literature, other criteria frequently examined in this context are; costs, timing, and speed (Akyüz and Erkan, 2010, Gunasekaran et al., 2004). Criteria to be used for comparative
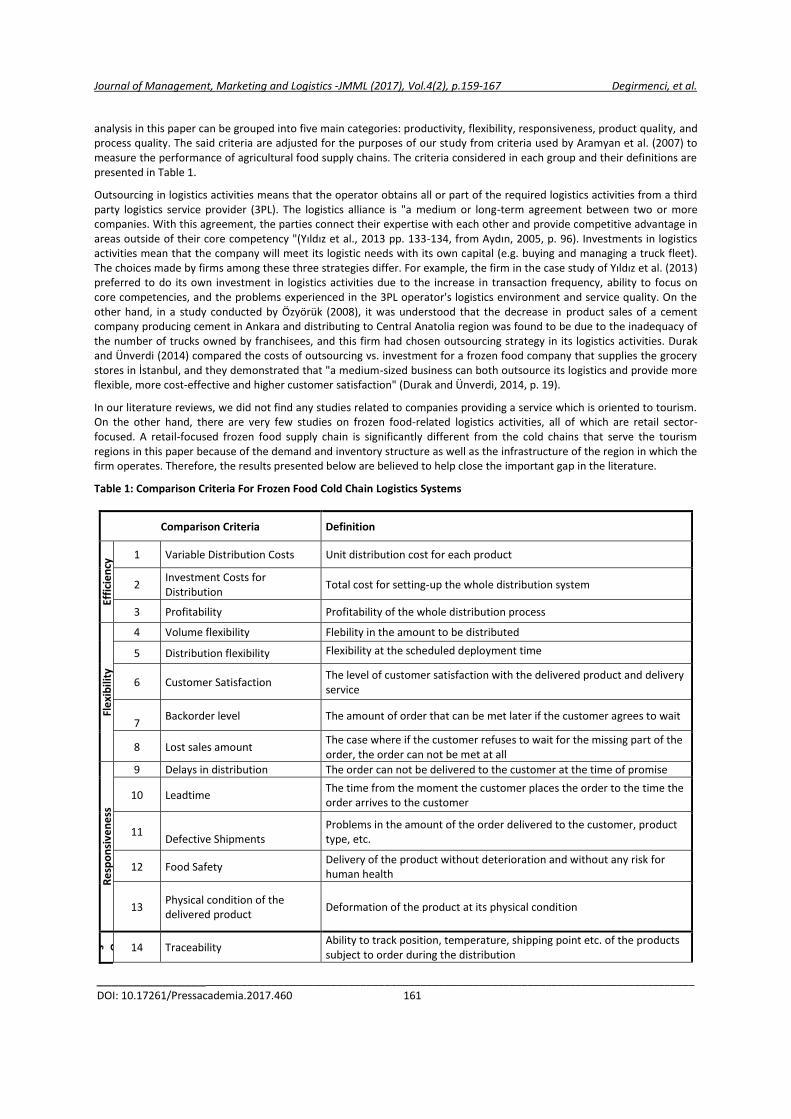
Journal of Management, Marketing and Logistics -JMML (2017), Vol.4(2), p.159-167 Degirmenci, et al.
_________________________________________________________________________________________________
DOI: 10.17261/Pressacademia.2017.460 161
analysis in this paper can be grouped into five main categories: productivity, flexibility, responsiveness, product quality, and process quality. The said criteria are adjusted for the purposes of our study from criteria used by Aramyan et al. (2007) to measure the performance of agricultural food supply chains. The criteria considered in each group and their definitions are presented in Table 1.
Outsourcing in logistics activities means that the operator obtains all or part of the required logistics activities from a third party logistics service provider (3PL). The logistics alliance is "a medium or long-term agreement between two or more companies. With this agreement, the parties connect their expertise with each other and provide competitive advantage in areas outside of their core competency "(Yıldız et al., 2013 pp. 133-134, from Aydın, 2005, p. 96). Investments in logistics activities mean that the company will meet its logistic needs with its own capital (e.g. buying and managing a truck fleet). The choices made by firms among these three strategies differ. For example, the firm in the case study of Yıldız et al. (2013) preferred to do its own investment in logistics activities due to the increase in transaction frequency, ability to focus on core competencies, and the problems experienced in the 3PL operator's logistics environment and service quality. On the other hand, in a study conducted by Özyörük (2008), it was understood that the decrease in product sales of a cement company producing cement in Ankara and distributing to Central Anatolia region was found to be due to the inadequacy of the number of trucks owned by franchisees, and this firm had chosen outsourcing strategy in its logistics activities. Durak and Ünverdi (2014) compared the costs of outsourcing vs. investment for a frozen food company that supplies the grocery stores in İstanbul, and they demonstrated that "a medium-sized business can both outsource its logistics and provide more flexible, more cost-effective and higher customer satisfaction" (Durak and Ünverdi, 2014, p. 19).
In our literature reviews, we did not find any studies related to companies providing a service which is oriented to tourism. On the other hand, there are very few studies on frozen food-related logistics activities, all of which are retail sector-focused. A retail-focused frozen food supply chain is significantly different from the cold chains that serve the tourism regions in this paper because of the demand and inventory structure as well as the infrastructure of the region in which the firm operates. Therefore, the results presented below are believed to help close the important gap in the literature.
Table 1: Comparison Criteria For Frozen Food Cold Chain Logistics Systems
Comparison Criteria Definition
Effi
cie
ncy
1 Variable Distribution Costs Unit distribution cost for each product
2 Investment Costs for Distribution
Total cost for setting-up the whole distribution system
3 Profitability Profitability of the whole distribution process
Fle
xib
ility
4 Volume flexibility Flebility in the amount to be distributed
5 Distribution flexibility Flexibility at the scheduled deployment time
6 Customer Satisfaction The level of customer satisfaction with the delivered product and delivery service
7
Backorder level The amount of order that can be met later if the customer agrees to wait
8 Lost sales amount The case where if the customer refuses to wait for the missing part of the order, the order can not be met at all
Re
spo
nsi
ven
ess
9 Delays in distribution The order can not be delivered to the customer at the time of promise
10 Leadtime The time from the moment the customer places the order to the time the order arrives to the customer
11 Defective Shipments
Problems in the amount of the order delivered to the customer, product type, etc.
12 Food Safety Delivery of the product without deterioration and without any risk for human health
13 Physical condition of the delivered product
Deformation of the product at its physical condition
Pr
oc
es s Q ua lit y 14 Traceability
Ability to track position, temperature, shipping point etc. of the products subject to order during the distribution

Journal of Management, Marketing and Logistics -JMML (2017), Vol.4(2), p.159-167 Degirmenci, et al.
_________________________________________________________________________________________________
DOI: 10.17261/Pressacademia.2017.460 162
15 Proper Handling and Storage Conditions
Ensuring optimum transport and storage conditions for the product in the framework of critical factors such as temperature and shelf life
16 Manageability The ease of management of the distribution process from the producer's point of view
3. METHODOLOGY
Research questions in this paper require an exploratory study. As explained in detail in the literature review, this area has not been adequately researched; for this reason there are no established theories. Therefore, this research is planned as a descriptive study to assist in the formation of the theory in this area. The most appropriate method for such studies is the exploratory analysis (Flynn et al., 1990).
In this paper, it will first be determined how the logistics processes are carried out while the products of frozen food producers reach the customers in the tourism sector. In other words, the problems experienced in each process step will be categorized in the current situation by determining which partner (logistics service providers, producer firm, agents, etc.) executes and finances which process steps. Distribution models that can be used during the transportation of frozen food products to tourism customers will then be identified and reviewed.
In order to reach these goals, our research was conducted as a multi-case study. To select the case studies, we first interviewed the directors of the organized industrial region in the tourism destination subject to our study. From the directors we were able to detect 45 potential active frozen food producers, and then we called these firms to ensure that they were producing frozen food and supplying the tourism sector. Among the 13 firms satisfying these criteria, 3 of them were chosen due to differences in types of products produced, size, and willingness to participate. We believe the experiences of these firms reflect the frozen food industry serving the tourism sector since we were able to analyze most perspectives regarding cold chain logistics for different-sized firms and most types of frozen food products. We have also approached and interviewed one of the biggest national 3PL providers serving the same region to compare the views of producers and 3PL providers.
Data collection was completed within a year, including a single tourism season. In order to be able to answer the research questions and reach the project targets, it was necessary to collect detailed data from the producer enterprises and the 3PL provider. For this reason, semi-structured interviews were used as the data collection method. Interviews were conducted face-to-face and at least two researchers participated in the interviews to ensure that the data to be collected were accurate and reliable. While one of the researchers directed the questions, the other took note of the answers given by the participant and recorded the voice if the participant allowed it. At some interviews three researchers were present and researchers compared their notes with each other. Interviews lasted between 1.5-2 hours.
4. CASE ANALYSIS
Antalya, located on the mediterranean cost of Turkey, is one of the most visited cities in the world. There are hundreds of hotels, holiday villages, and other hospitality facilities in this city. At the tourism season (spring, summer, and autumn months), the population of the city increases greatly due to tourist arrivals, and especially at the peak time of the season it becomes impossible to prepare all the food from raw ingredients at the hotels. The frozen food producers serving this city during tourism season experience all the pressures described above to ensure cold chain logistics activities are carried out properly; othewise, the customers (hotels) do not accept the deliveries and the producers face risk of great losses. Our empirical research focuses on the experiences of the frozen food producers and 3PL providers serving this region at the tourism season.
All producers in the case studies produce and deliver prepackaged frozen food products that only requires to defrost and heat/cook to prepare at the hospitality facility. They differ with respect to the type of food produced, which lets us consider a wide aspect of logistics activities to serve customers from the tourism sector.
On the full scale, the cold chain logistics activities can be described as below (Figure 1). However, every frozen food supply chain may have been designed such that some facilities may not be present, and the activities could be executed and/or financed by different supply chain partners (producer, 3PL, customer). This can affect the whole performance of the supply chain. We aim to understand how frozen food logistics chains at touristic destinations are currently designed, how different responsibilities are allocated on chain partners, and then to analyze these decisions to gain insights.

Journal of Management, Marketing and Logistics -JMML (2017), Vol.4(2), p.159-167 Degirmenci, et al.
_________________________________________________________________________________________________
DOI: 10.17261/Pressacademia.2017.460 163
Figure 1: Process Steps İn Frozen Food Cold Chain Serving Touristic Destionations
As stated in the methodology, we selected three frozen food producers serving hospitality firms: a dairy products producer, a meat products producer, and a vegetable, pastry, and potato products producer. Finally, we have interviewed a 3PL provider capable to serve all types of frozen food producers in each process step above.
4.1 First Case-Study
4.1.1. Description of the Firm
In this case study, we analyzed a dairy products firm producing cheese and butter for hospitality facilities. The company has been operating for 50 years, total annual sales are 200-250 million TL (53-67 million USD), 10-15% of the sales are made to the tourism sector, approximately 30 million TL (8 million USD). The company has 495 employees.
4.1.2.Frozen Food Supply Chain Used for Serving the Tourism Sector
The firm sells most of its products to the distributors; thus, it only assumes steps 1 and 2 above physically and financially, steps 3-9 are assumed by the distributors, and steps 10 and 11 are assumed by the customers (hospitality firms). For step 12, depending on the reason for the return, the responsibility could be assumed either by the distributor or the firm itself. For instance, the firm accepts the unsold products after the tourism season if their expiration date has not come yet.
For the choice of the cold chain logistics model, the firm may employ different options depending on the circumstances. While the firm chooses to deliver its products and the financial responsibility to its distributors, if the order request comes from a distant location (outside of the Antalya region), they choose to use 3PL providers for transportation. On the other hand, if the order is a very big batch, the customer comes and picks the delivery himself/herself; at the event of a very short leadtime for the order, the firm delivers the order itself, rather than transferring the order to the distributor. Some
2. Transportation of frozen products from production facility to intermediate storage
1. Loading frozen products into transport
vehicles for physical distribution (at the production facility)
3. Emptying frozen products in the intermediate storage
4. Storage of frozen products in intermediate storage
5. Inventory management of frozen products in intermediate storage
6. Value-added services in intermediate storage for frozen products (labeling, repackaging, etc.)
7. Loading frozen food products into transportation vehicles for physical distribution from intermediate storage to touristic facility
9. Emptying frozen products at the touristic facility
12. Management of returned goods
8. Transportation of frozen food products from intermediate storage to touristic facility
11. Inventory Management of frozen food products at the touristic facility
10. Placement of frozen products into the storage of the touristic facility

Journal of Management, Marketing and Logistics -JMML (2017), Vol.4(2), p.159-167 Degirmenci, et al.
_________________________________________________________________________________________________
DOI: 10.17261/Pressacademia.2017.460 164
customers require more traceability, such that they require the temperature records for all supply chain processes, and if their vehicles do not have enough technical qualifications the firm does not use 3PL providers. The evaluation of different cold chain logistics systems for this firm was summarized in Table 2.
For their 3PL choices, the firm requires 3PL to make a contract to assume insurance responsibility, to have a national distribution network, and to allow traceability. As potential problems in their existing network, the firm reported that sometimes deliveries were made to incorrect distributors; however, they had been able to uncover the reason and solve the issue. The firm always confirms that the distributors abide by their standards on distribution routes, personnel, cold storage, frigorific vehicles, etc.
4.2.Second Case-Study
4.2.1.Description of the Firm
In this case study, we analyzed a frozen meat products firm producing red and white meat for hospitality facilities. The company has been operating for 18 years, total annual sales are 50-100 million TL (13-26 million USD), 25-50% of the sales are made to the tourism sector. The company has 175 employees.
4.2.2.Frozen Food Supply Chain Used for Serving the Tourism Sector
The firm employs two different types of cold chain logistics system designs; through distributors, and by transporting by itself. For the case of distributors, the process is described as the following. Step 1 in Figure 1 is executed and financially assumed by the firm. Step 2 could either be totally assumed by the firm itself or the distributor. Step 3 is executed by either the firm itself or the distributor while it is financially assumed by the distributor; steps 4, 5, 7-9 completely belong to the distributor, steps 6, 10-12 are not applicable for this firm. For the case of transporting by itself, the firm assumes steps 1 and 9, and the other steps are not applicable for this choice.
The firm chooses to work with distributors if they have strong networks and customer relations at their own districts and they comply with the firm’s standards. If the firm cannot find an appropriate distributor for a particular district, then it delivers the orders itself. This firm does not work with 3PL providers. The evaluation of different cold chain logistics systems for this firm was summarized in Table 2.
As potential problems for the logistics processes, the temperature requirements are a very sensitive issue for the firm. Especially at direct deliveries by the firm itself to several delivery points closely located to each other, frequent stops cause the vehicle doors to open often, and the cold chain could be broken. This firm also audits its distributors and requires them to be trained in applying the First-Expired-First-Out priority principle.
4.3.Third Case-Study
4.3.1.Description of the Firm
In this case study, we analyzed frozen fruit, vegetables, pastry, and potatoe products firm serving the hospitality facilities. The company has been operating for more than 50 years, and they have been producing vegetables for 25 years. Total annual sales are 300-400 million TL (80-107 million USD), 10% of the sales are made to the tourism sector. The company has 1400 employees.
4.3.2.Frozen Food Supply Chain Used for Serving the Tourism Sector
Similar to the second case study, this firm also employs two different chain designs, either delivery by itself or through distributors. This firm operates nationally and it has eight regional centers, 50 distributors nationwide. With this scale, they assume steps 1-5, 7-9, and 12 by themselves, steps 6, 10, and 11 are not applicable. The firm sometimes employs 3PL providers to transfer goods from the production to interim storage facility; however, the firm itself assumes financial responsibility in these cases.
The evaluation of different cold chain logistics systems for this firm was summarized in Table 2 (some criteria required too detailed analysis to decide on due to the large scale of the firm, so no comments were made for such criteria).
Due to the national scale and economical strength, this firm has vehicles with higher qualifications, such that defrosting risk during frequent stops is lower for this firm’s deliveries. As potential problems, they report that if 3PL is employed, the drivers may sometimes forget to leave the vehicle in working condition at the time of delivery, and the temperature requirements may not be met. This happens especially when the hotel is receiving more than one delivery at the time and the truck has to wait until the other deliveries are accepted.

Journal of Management, Marketing and Logistics -JMML (2017), Vol.4(2), p.159-167 Degirmenci, et al.
_________________________________________________________________________________________________
DOI: 10.17261/Pressacademia.2017.460 165
4.4.Fourth Case-Study
4.4.1.Description of the Firm
In this case study, we analyzed how a nationwide 3PL provider experiences the current cold chain logistics operations during the tourism season and the reasons that producers may or may not prefer to use 3PL providers for their supply chain activities. The 3PL firm has been operating for 10 years, the total sales reach 1.3 billion TL (350 million USD), the firm has 7000 employees, and it has storage facilities nationwide and overseas (50 in Turkey, 25 overseas).
4.4.2.3PL Provider Serving the Tourism Sector
The firm assumes most logistics activities for its customers; transportation, storage, handling, packaging, inventory management, inspection/control, and insurance. According to the 3PL provider, frozen food producers serving the tourism sector choose to work with them to minimize costs. This is because 3PL providers benefit from economies of scale, and for the same reason they own equipment with higher technical qualifications (e. g. high capacity generators at the storage facility protects the frozen food against temperature changes due to powerouts). On the other hand, there are producers choosing not to work with 3PL providers. Either that they may not be aware of the cooperation opportunities, or they may feel uncomfortable with delegating responsibility to other parties and lose trace of the product before delivery. It is also possible that they may be requesting nonstandard service (such as deliveries with very short leadtimes), or they may not be capable of using analytical techniques to minimize costs and hence could be making nonoptimal decisions in supply chain design. The 3PL provider firm has also observed that especially small-scale producers may be reluctant to discontinue previous work agreements with their old distributors for sentimental reasons
Table 2: Comparison of Different Frozen Food Cold Chain Logistics Systems from the Perspectives of the Producers
Comparison Criteria
Cold Chain Logistics System Design (Evaluation Criteria: 1-Very Unpreferable, 2- Unpreferable, 3-Indifferent, 4-Preferable, 5-Very preferable, Left Empty if no
comments were received)
Direct delivery to the
customer
Delivery to Distributors
Both (Direct Delivery &
Distributor)
Outsourcing to 3PL Provider
Yes No
Evaluations of Criteria by the Firm in Case Study #
1 2 3 1 2 3 1 2 3 1 2 3 1 2 3
Effi
cie
ncy
1 Variable Distribution Costs 4 3 3 4 3 5 4 2 1 4
2 Investment Costs for
Distribution 2 2 3 5 4 4 4 4 2 2
3 Profitability 3 5 3 4 3 5 4 4 2 3
Fle
xib
ility
4 Volume flexibility 3 5 3 4 4 5 5 5 1 3
5 Distribution flexibility 3 2 3 5 3 4 5 3 1 3
6 Customer Satisfaction 4 5 3 5 3 5 4 3 2 3
7
Backorder level 4 1 2 3 3 4 4 3 2 3
8 Lost sales amount 4 1 5 2 4 4 3 3 4 4 4 2 2
Re
spo
nsi
ven
ess
9 Delays in distribution 4 5 5 3 4 4 3 5 4 4 2 2 3
10 Leadtime 2 4 5 3 4 4 3 4 4 5 4 1 2
11
Defective Shipments 5 5 5 3 4 4 3 4 4 3 2 3
12 Food Safety 4 5 5 3 4 5 4 4 4 2 2 4
13 Physical condition of the
delivered product 4 5 4 3 4 3 3 4 4 3 2 4

Journal of Management, Marketing and Logistics -JMML (2017), Vol.4(2), p.159-167 Degirmenci, et al.
_________________________________________________________________________________________________
DOI: 10.17261/Pressacademia.2017.460 166
Pro
cess
Qu
alit
y
14 Traceability 4 5 1 2 5 1 3 5 4 4 2 3
15
Proper Handling and Storage Conditions
4 5 5 2 4 4 3 4 4 3 2 4
16 Manageability 5 5 5 3 4 4 4 4 4 4 2 3
5. FINDINGS AND DISCUSSIONS
For frozen food producers serving the tourism sector, firm-specific and also sector-specific factors were observed to be dominant in choosing the cold chain logistics system design. For instance, we see that the meat producer in the second case study is of smaller scale compared to the other two firms of national scale. This firm is the only one expressing marketing opportunities and customer relationship as an important factor in prefering to work with distributors. This firm also has the most sensitive meat type of products that could be affected by any infinitesimal temperature changes, and they are again the only firm that do not work with 3PL providers at all.
Thus, we have observed that smaller scale frozen food producers choose to work with distributors if they have strong customer relations at their tourism districts. The product’s sensitivity level to temperature changes influences the producer towards not using the 3PL provider. This also coincides with the fourth case study observations (3PL case), such that the firms with highly temperature-sensitive products may not feel comfortable in delegating the transportation to the 3PL while having the financial responsibility of the load. They will be assuming customer dissatisfaction risk in case of damage due to temperature-oriented problems.
The other two firms in the first and third case studies are of larger scale, and they include 3PL provider in their supply chain designs, albeit on a nondominant scale. The main situations that lead these firms to prefer cold chain designs without a 3PL provider are urgent orders with short leadtimes and lack of sensitivity towards temperature requirements by the employees/drivers of the 3PL.
In the fourth case study the 3PL firm describes the urgent order circumstances as nonstandard service. Even if these firms work with 3PL providers they request that 3PL provides traceability and assumes insurance responsibility. When we look at the producers’ evaluation results on 3PL providers we observe that, as expressed in the fourth case study by the 3PL provider, using 3PL is advatageous to decrease the investment costs. However, the quality and food safety requirements are so pressuring that although the vehicles and facility infrastructre of 3PLs are of higher level, the firms still may not choose to outsource logistics processes. If the 3PL providers are not willing to assume insurance responsibilities and train their personnel, the producer will not be willing to work with 3PL providers, and it will apply cold chain logistics designs including only distributors or direct delivery by themselves. This difference compared with the retail sector is mainly caused by factors specific to tourism destinations. Closely located delivery stops cause the drivers to stop the frigorific vehicles frequently, and when they open the storage doors to retrieve the products, the hot weather enters inside the vehicle. Moreover, the tourism sector has peak times and this causes lots of urgent orders to be made that would not let firms to outsource logistics.
5. CONCLUSIONS AND FUTURE RESEARCH
In this paper we have analyzed, through multiple case studies, the principles with which cold chain logistics systems for frozen food producers in touristic destinations are designed. We have observed that there are significant differences in cold chains of this type compared to the traditional 3PL-oriented cold chains serving the retail sector. We have observed that even if the firm has large enough scale to not have any marketing and customer relationship related concerns, they generally choose not to use 3PLs due to issues on food safety/quality despite the advantages in investment costs.
The very hot weather and frequent stops made at hospitality facilities lead to increased risk of temperature changes, and this leaves the cold chain prone to product damage. As the product’s sensitivity to temperature changes increases, the producers become more reluctant to work with 3PL providers. This was the case with the frozen meat producer observed at the second case study. This not only risks health hazards, but also customer (hospitalty firm) dissatisfaction and financial losses could also be very harmful in the long term. Therefore, if the producers choose to work with 3PLs on some occasions, they make 3PLs sign contracts for financial responsibility and have their emploees trained and audited on temperature sensitivity.
From the 3PL’s perspective, it was observed that the high-tech infrastructre and vehicles were made available to customers. However, due to economies of scale to be employed, 3PLs may not be flexible and responsive enough to accept urgent order requests, and this is also a difference from the retail sector where the demand is more regular and more correctly
Journal of Management, Marketing and Logistics -JMML (2017), Vol.4(2), p.159-167 Degirmenci, et al.
_________________________________________________________________________________________________
DOI: 10.17261/Pressacademia.2017.460 167
estimated. In the tourism sector, however, not all customer arrivals are scheduled in an organized manner, and during peak times, such as the holiday seasons, the hospitality firms may encounter higher demand for food than planned, and this would lead to urgent order requests nonconforming to 3PL service schedules.
For future research, there could be more case studies conducted at different touristic destinations to observe whether there are differences between the practices of 3PL firms serving to frozen food producers. More studies could also be conducted to measure any potential differences in cold chain designs with respect to differences in firms sizes/scales and types of food produced.
REFERENCES
Akyüz, G. A. & Erkan, T. E. 2010, “Supply chain performance measurement: a literature review”, International Journal of Production Research, vol. 17, no. 1, pp. 5137-5155.
Aramyan, L. H., Lansink, A. G. F. M. O., van der Vorst, J. G. A. F. & van Kooten, O. 2007, “Performance measurement in agri-food supply chains: a case study”, Supply Chain Management: An International Journal, vol. 12, no.4, pp. 304-315.
Aydın, S. Z. 2005, “Tedarik Zinciri Yönetiminde Stratejik İttifak Olarak Üçüncü Parti Lojistik”, Unpublished doctoral dissertation. Süleyman Demirel University Social Sciences Institute Business Administration Department, Isparta.
Chaowarut, W., Wanitwattanakosol, J. & Sopadang, A. 2009, “A Framework for Performance Measurement of Supply Chains in Frozen Food Industries”, ThaiVCML, 98-108. Chen H.-L., Li J.-Y. & Liu Y.-S. 2011, “A Review On The Service Quality Of Fresh Food Cold Chain Logistics”, Logistics Technology, 19.
Durak, M. G. & Ünverdi, İ. 2014, “Dondurulmus Gıda Lojistiğinde Maliyet Bilgisinin Kullanımı”, International Journal of Economics and Business Research, vol. 5, no. 4, pp. 19-41.
Flynn, B. B., Sakakibara, S., Schroeder, R.G., Bates, K.A. & Flynn, E. J. 1990, “Empirical Research Methods in Operations Management”, Journal of Operations Management, vol. 9, no. 2, pp. 250-284. Golnar B., Balan S. & Elham M. 2013, “Robust optimisation model for the cold food chain logistics problem under uncertainty”, International Journal of Logistics Economics and Globalisation, vol. 5, no. 3, pp. 167-179.
Gunasekaran, A., Patel, C. & McGaughey, R. E. 2004, “A framework for supply chain performance measurement”, International Journal of Production Economics, vol. 87, no. 3, pp. 333–347.
Losito, P., Visciano, P., Genualdo, M. & Cardone, G. 2011, “Food Supplier Qualification by an Italian Large-scale-Distributor: Auditing system and non-conformances”, Food Control, vol. 22, no. 12, pp. 2047-2051.
Montanari, R. 2008, “Cold chain tracking: a managerial perspective”, Trends in Food Science Technology, vol. 19, no. 8, pp. 425-431.
Özyörük, B. 2008, “Tedarik Zincirinde Ürün Dağıtımı için Üçüncü Taraf Kullanımı (3PL) ve Firma Seçimi”, Süleyman Demirel University The Journal of Faculty of Economics and Administrative Sciences, vol. 13, no. 2, pp. 65-73.
Rediers, H., Claes, M. , Peeters, L. & Willems, K. A. 2009, “Evaluation of the cold chain of fresh-cut endive from farmer to plate”. Postharvest Biology and Technology, vol. 51, no. 2, pp. 257-262.
Shabani A., Saen R. F. & Torabipour, S. M. R. 2012, “A new benchmarking approach in Cold Chain”, Applied Mathematical Modelling, vol. 36, no. 1, pp. 212–224.
Sun X., Tan L., Guo Q., 2009, “To Study on Quality Safety Controlling for Agriculture Products Supply Chain”, Value Engineering, no. 12.
Tanyaş, M. 2013, “Gıda ve Soğuk Zincir Lojistiği”. Ekonomi Ajandası. http://ekonomiajandasi.net/gida-ve-soguk-zincir-lojistigi/28472 Accesessed March 2, 2017.
Tarhan, E. 2013, “Soğuk tedarik zincir lojistiği ve ATP konvansiyonunun katkıları”, http://www.utikad.org.tr/haberler/?id=10619. Accessed March 2, 2017.
Wang, H. 2010, “An Empirical Research on Quality and Safety of The Quick-Frozen Food Supply Chain”, International Conference of Information Science and Management Engineering, 7-8 Aug. 2010. Shaanxi, China, pp. 314-317.
Yıldız, M. S., Bilgin, Y. & Yazgan, H. İ. 2013, “İşletmeleri Lojistik Faaliyetlerde Yatırıma Yönelten Faktörlerin İncelenmesi: Çınar Boru Profil Sanayi ve Ticaret A.Ş. Örneği”, International Journal Of Economics And Business Research, vol. 4, no. 4, pp. 131-145.
Zhang, G., Habenicht, W. & Spieß, W. E. L. 2003, “Improving the structure of deep frozen and chilled food chain with tabu search procedure”, Journal of Food Engineering, vol. 60, pp. 67–79

Journal of Management, Marketing and Logistics -JMML (2017), Vol.4(2), p.168-177 Karakoc
_________________________________________________________________________________________________
DOI: 10.17261/Pressacademia.2017. 461 168
INTELLIGENT ROUTING APPROACH FOR THE DISTRIBUTIONS REGARDING TO THE SUPPLY CHAIN MANAGEMENT OF AGRICULTURAL PRODUCTS AND FOODS DOI: 10.17261/Pressacademia.2017.461 JMML- V.4-ISS.2-2017(10)-p.168-177 Mehmet Karakoc AKEV University, Department of Software Engineering, Antalya, Turkey. [email protected]
_____________________________________________________________________________________________________
To cite this document Karakoc, M , (2017). Intellıgent routıng approach for the dıstrıbutıons regardıng to the supply chaın management of agrıcultural products and foods. Journal of Management, Marketing and Logistics (JMML), V.4, Iss.2, p.168-177. Permemant link to this document: http://doi.org/10.17261/Pressacademia.2017.461 Copyright: Published by PressAcademia and limited licenced re-use rights only.
ABSTRACT Purpose- In this study, to effectively manage the supply chain intended for the storage, transportation and distribution of agricultural
products and foods, an intelligent routing approach is proposed for accomplishing this distribution at low cost.
Methodology- As an activity in logistics, the demands related to the exportation of various foods/goods in agricultural production are
considered. It is assumed that a vehicle fleet, each vehicle with a certain load capacity, starts at a depot with the loads, visits a set of points
using the shortest paths while accomplishing the related distributions and returns back to the depot. It is aimed to find the route set with
the minimum cost so that all customers are to be visited.
Findings- The main contribution of this study in which the Capacitated Vehicle Routing Problem has been addressed is to find the route set
to service all the customers in a region while considering the points to be serviced globally; or for each sub-region, the separated tours to
service the related customer group while considering them as subsets.
Conclusion- Using the hybrid meta-heuristic algorithm including Genetic Algorithms and Local Search developed for the solution, low costly
route sets with separated/global tours may be generated within very short periods of time.
Keywords: Genetic algorithms, capacitated vehicle routing problem, logistics, supply chain, local search
JEL Codes: C61, C63, C88
TARIM ÜRÜNLERİ VE GIDALARIN TEDARİK ZİNCİRİ YÖNETİMİNE İLİŞKİN DAĞITIM İŞLEMLERİ İÇİN ZEKİ BİR ROTALAMA YAKLAŞIMI
ÖZET Amaç- Bu çalışmada, tarım ürünlerinin ve gıdaların depolanması, taşınması ve dağıtılmasına yönelik Tedarik Zincirinin etkili bir biçimde
yönetilebilmesi için söz konusu dağıtımın düşük maliyetle gerçekleştirilebileceği zeki bir rotalama yaklaşımı önerilmektedir.
Yöntem- Lojistik bir etkinlik olarak, tarımsal üretimde çeşitli gıdaların/ürünlerin ihracatına ilişkin talepler dikkate alınmaktadır. Her biri
belirli bir yükleme kapasitesine sahip bir araç filosunun, bir depodan talepleri yüklenip hareket ettiği, en kısa güzergâhları kullanarak bir dizi
noktayı ziyaret edip ilgili dağıtımları gerçekleştirdiği ve depoya geri döndüğü varsayılmaktadır. Tüm müşteriler ziyaret edilecek şekilde, en az
maliyetli rota kümesini belirlemek amaçlanır.
Bulgular- Kapasiteli Araç Rotalama Probleminin ele alındığı bu çalışmanın temel katkısı, hizmet verilecek noktaların, bütünsel olarak
değerlendirilip bir bölgedeki tüm müşterilere hizmet verecek rota kümesinin veya alt-kümeler olarak değerlendirilip her alt-bölge için ilgili
müşteri grubuna hizmet verecek ayrık turların belirlenebilmesidir.
Sonuç- Çözüm için geliştirilen Genetik Algoritmalar ve Yerel Arama içeren melez meta-sezgisel algoritma aracılığıyla, ayrık/bütünsel turlar
içeren düşük maliyetli rota kümeleri çok kısa sürelerde oluşturulabilmektedir.
Anahtar Kelimeler: Genetik algoritmalar, kapasiteli araç rotalama problemi, lojistik, tedarik zinciri, yerel arama
JEL Kodları: C61, C63, C88
Year: 2017 Volume: 4 Issue: 2
Journal of Management, Marketing and Logistics – (JMML), ISSN: 2148-6670, http://www.pressacademia.org/journals/jmml

Journal of Management, Marketing and Logistics -JMML (2017), Vol.4(2), p.168-177 Karakoc
_________________________________________________________________________________________________
DOI: 10.17261/Pressacademia.2017. 461 169
1. GİRİŞ
Lojistik, ürünlerin ve hizmetlerin tedarik edilmesine yönelik tüm etkinliklerin planlanması ve yönetilmesine ilişkin bir kavramdır. Bu kapsamda, modern yaklaşımlar takip edilerek ve teknolojik araçlar kullanılarak geri hizmetin verimli bir biçimde yerine getirilmesi amaçlanır. Ürünün ve hizmetin etkili ve verimli bir biçimde sağlanabilmesine yönelik etkinliklerin düşük maliyetlerle gerçekleştirilmesi ise Tedarik Zinciri Yönetimine karşılık gelmektedir. Tedarik Zinciri Yönetimine ilişkin olarak, ele alınan pek çok konu ve uygulanan pek çok etkinlik söz konusudur: (i) çizelgeleme, dağıtım, planlama, sevkiyat, tahmin vb. uygulamaları. (ii) depo, döküm/stok, sipariş, talep vb. yönetimi. (iii) tedarik döngü süresini kısaltma ve teslimat sürelerini iyileştirme (taleplere hızlı geri dönüş). (iv) üretimin sürekliliğini sağlama.
Rotalama, gezgin/mobil robotlar, gezgin satıcılar, insanlar, insansız hava araçları, postacılar, sualtı araçları ve taşıtlar (örneğin ambulans, helikopter, kamyon, taksi veya tır) için en kısa yolu bulma, gezinim, yol planlama ve yönlendirme gibi problemlerde; hareket planlama, yol ağı izleme ve yol bakımı gibi etkinliklerde söz konusudur. Dağıtım, lojistik, nakliye ve ulaştırma gibi amaçlarla, bilgisayar ağlarında, talebe duyarlı ulaştırma sistemlerinde ve özellikle Tedarik Zinciri Yönetiminde çözüm gerektirir. Dantzig ve Ramser (1959) tarafından önerilen bu kombinasyonel eniyileme ve doğrusal programlama problemi, literatürde Araç Rotalama/Yönlendirme Problemi (ARP) olarak çalışılmaktadır. ARP, hesaplamasal olarak karmaşık ve zor bir gerçek-dünya problemi olup, pek çok problem için çözümün bir parçasıdır: (i) ambulansların hastanın bulunduğu nokta ve hastane arasında kullanacakları en uygun rotaları belirleme. (ii) arazi/yerleşke alanlarında, fabrika ortamlarında ve limanlarda dağıtım-toplama işleri. (iii) askerî alanlarda keşif, patlayıcıların tespit ve imhası. (iv) binaların temizlik işleri, çöp/nesne toplama, sokak temizliği. (v) insansız araçlar, okul otobüsleri, personel servisleri ve satış elemanları için güzergâh belirleme. (vi) posta/süt/yakıt dağıtımı, koli/paket alım ve teslimatı. (vii) üretilen araçların çeşitli bölgelerdeki bayilere bir tır filosu aracılığıyla ulaştırılması.
ARP, konum verisi (depo ve talep noktaları), talep miktarları ve araç kapasitesi (maksimum depolama/yükleme) gibi çok sayıda değişken içerir ve ARP’de üç temel bileşen söz konusudur: (1) çalışma uzayında homojen/heterojen olarak dağılmış, kümelenmiş/kümelenmemiş, karesel/konik olarak konumlandırılmış konumlar (depo, merkezî veya merkezî olmayan bir biçimde). (2) sıralı/rasgele gelen homojen veya heterojen talepler. (3) özdeş veya heterojen araçlar. Tüm işlemsel kısıtlar sağlanacak şekilde, müşteri taleplerinin en az maliyetle karşılanması amaçlanır. Maliyet ise toplam rota uzunluğu (tüm rotaların uzunlukları toplamı), tamamlanma zamanı veya toplam bekleme süresi olarak ele alınabilir.
Bu çalışmada, tarım ürünlerinin ve gıdaların depolanması, taşınması ve dağıtılmasına yönelik Tedarik Zincirinin etkili bir biçimde yönetilebilmesi için söz konusu dağıtımın düşük maliyetle gerçekleştirilebileceği zeki bir rotalama yaklaşımı önerilmektedir. Lojistik bir etkinlik olarak, tarımsal üretimde çeşitli gıdaların/ürünlerin ihracatına ilişkin talepler/dağıtımlar dikkate alınmaktadır. Her biri belirli bir yükleme kapasitesine sahip bir araç filosunun, belirli bir noktadan (depo) talepleri yüklenip hareket ettiği, en kısa güzergâhları kullanarak bir dizi noktayı (alıcılar/müşteriler) ziyaret edip ilgili dağıtımları gerçekleştirdiği ve depoya geri döndüğü varsayılmaktadır. Tüm müşteriler ziyaret edilecek (hizmet alacak) şekilde, araçlar tarafından kullanılacak en az maliyetli en uygun rota kümesini belirlemek amaçlanır. Bu amaçla, hem akademik olarak hem de sektörde çalışılan önemli bir gerçek-dünya problemi olan Kapasiteli ARP (KARP) ele alındı. Bu problem ayrıca, kapasite sınırı olmadan ve ayrık turlar içerecek şekilde çoklu Gezgin Satıcı Problemi (GSP) olarak modellendi. Çözüm için Genetik Algoritmalar (GA) ve Yerel Arama içeren melez meta-sezgisel (meta-heuristic) bir algoritma geliştirildi.
Çalışmanın geri kalan kısmı şu şekilde düzenlenmiştir. İkinci bölümde, Araç Rotalama Problemleri vb. problemler ile ilgili literatür taraması sunulmuştur. Üçüncü bölümde, ilk olarak çalışma kapsamında ele alınan probleme ve daha sonra çözüm için geliştirilen melez meta-sezgisel algoritmaya ilişkin ayrıntılar verilmiştir. Dördüncü bölümde, bu kapsamda yapılan deneysel çalışmalar ve elde edilen test bulguları sunulmuştur. Son bölümde ise sonuçlar sunulmuş ve konuyla ilgili yapılabilecek çalışmalar belirtilmiştir.
2. LİTERATÜR TARAMASI
ARP’nin çeşitli varyasyonları ve özel türleri mevcuttur: (1) teslimatların içinde yapılması gerektiği zaman aralıkları olan ve her müşterinin talebinin gerekli zamanda karşılandığı zaman pencereli ARP. (2) araçların bir rotadan fazla yapabildiği çok turlu ARP. (3) bir dizi malın belirli toplama noktalarından diğer teslimat noktalarına ulaştırılmasını gerektiren dağıtım-toplamalı ARP. (4) herhangi bir teslim konumunda teslim edilmekte olan öğenin en son alınan öğe olduğu son giren ilk çıkar ARP. Ayrıca, bölge-kısıtlı, çok-depolu, kümülatif/periyodik kapasiteli vb. pek çok ARP türü de mevcuttur. Öte yandan, araçlar heterojen, teslimatlar ayrık olabilir ve belli başlama/bitiş zamanları, hizmet türü, öncelik kuralı, rotaların maksimum uzunluk sınırları veya teslimat zamanı kısıtları dikkate alınabilir.
GSP’de, gezgin satıcı tüm talepleri taşıyabilecek kapasitede ise tek turda tüm şehirleri ziyaret edebilir. Bu durumda, bu problem tek rota içeren KARP olarak düşünülebilir ve tek araçla tüm talepler karşılanır. Çoklu GSP’de, kapasite sınırı olmadan çok sayıda gezgin satıcı ile birden fazla tur yapmak söz konusudur. Ark/Ayrıt Rotalama Probleminde, bir postacı bir

Journal of Management, Marketing and Logistics -JMML (2017), Vol.4(2), p.168-177 Karakoc
_________________________________________________________________________________________________
DOI: 10.17261/Pressacademia.2017. 461 170
şehrin tüm yollarını bir kez ziyaret eder ve başlangıç konumuna geri döner. Konum Rotalama Probleminde ise ARP’ye ek olarak depo konumlarına karar verilir. ARP, hem rotalama hem de araçlara atama gerektirir.
Luo ve Chen (2014), çok-depolu ARP’yi (ayrıca zaman aralıkları ile) çözecek iyileştirilmiş bir çözüm yöntemini ve çok-aşamalı modelini sunmuşlardır. Bu problemde depolar, müşteri kümelerinin ağırlık merkezleri (tüm müşteriler için) olarak değerlendirilirler. Bir önceki süreç ile ulaşılan en iyi çözüme göre, yeni kümeler üretecek kümeleme analizleri gerçekleştirilir. İyileştirilen yol bilgisi yeni kümelere aktarılır. Çok-depolu araç rotalama problemlerini çözmek için Yücenur ve Demirel (2011), genetik algoritma ve karınca kolonisi eniyilemesi içeren melez bir algoritma kullanmışlardır. Ho vd. (2008) ise çok-depolu ARP’nin verimliliği için iki melez genetik algoritma kullanmışlardır. Onlara göre, başlangıç için melezleştirilmiş sezgisel yöntemler çözümlerin kalitesine büyük ölçüde yön vermektedir.
Subramanian vd. (2013), homojen-filolu ARP sınıfı için melez bir algoritma önermişlerdir. Algoritmalarını, KARP, asimetrik ARP, açık ARP, eş-zamanlı dağıtım-toplamalı ARP, karışık dağıtım-toplamalı (çok-depolu) ARP ve çok-depolu ARP örnekleri üzerinde kapsamlı bir şekilde test etmişlerdir. Elde ettikleri sonuçlar, sezgisel yöntemlerle bulunan ilgili türevlere göre oldukça rekabetçidir. Ayrıca bir dizi yeni en iyi çözüm elde etmişlerdir.
KARP için Stanojević vd. (2013), daha iyi rotalar üretmek amacıyla rotaları birleştiren yeni bir sezgisel yöntem geliştirmişlerdir. Wang ve Lu (2009) ise çaprazlama ve mutasyon olasılıklarının en uygun birleşimi ile yeni bir melez genetik algoritma önermişlerdir. Lin vd. (2009), melez meta-sezgisel yöntemler uygulamışlar; Berger ve Barkaoui (2003) ise melez bir genetik algoritma önermişlerdir. Yurtkuran ve Emel (2010) ise nüfus tabanlı melez bir yöntem kullanmışlar, yeni bir yerel arama stratejisi olan yinelemeli takas yaklaşımıyla, elde edilen çözümleri iyileştirmişlerdir. Yaklaşım, seçili ebeveynin konum vektöründen rasgele iki bileşen seçer ve değerleri takas eder. Bu bileşenlerin komşuları değiştirilerek dört çocuk daha oluşturulur ve en iyi çocuk, ebeveyninden daha iyi ise ebeveynle değiştirilir.
Du ve He (2012), büyük ölçekli ARP için yeni ve etkili bir melez meta-sezgisel algoritma sunmuşlardır. Algoritma, iki-aşamalı bir yaklaşım içermektedir: (1) başlangıç rotalar oluşturmak için en yakın komşuluk arama kullanılır ve (2) rotaları rota-içi ve rotalar-arası takas ile iyileştirmek için tabu aramadan yararlanılır.
Genelleştirilmiş ARP, klasik ARP’nin doğal bir uzantısıdır (Pop vd., 2013). Bu problemde, müşteriler bölümlere (grup/küme) ayrılır ve araç filoları için minimum uzunlukta rota kümeleri tasarlanır. Kapasite kısıtlarına bağlı olarak, depodan hareket edilir, her gruptan tam olarak bir müşteri ziyaret edilir ve depoya geri dönülür. Yerel-bütünsel bir yaklaşımla, GA ve güçlü bir yerel arama yaklaşımı birleştirilerek, verimli bir melez sezgisel algoritma sunulmuştur.
Leung vd. (2013), müşterilerin, iki-boyutlu yüklemeyle ve farklı kapasitedeki araç filosu kullanılarak hizmet aldığı problem için sezgisel yerel arama ve tavlama benzetimi önermişlerdir. Her yeni çözüm için yüklemenin yapılabilirliğini kontrol edecek sezgisel yöntemler ve arama sürecini hızlandırmak için yüklemenin yapılabilirliği ile ilgili bilgiyi kaydedecek bir veri yapısı kullanmışlardır. Onlara göre, belirsiz bir rota incelendiğinde, depolanmış bilgiyi getirmek kolaydır. Bu rota mevcut değilse, bilgi kaydedilir.
Bortfeldt (2012), KARP’yi üç-boyutlu yükleme ve ek kutulama kısıtlarıyla ele almıştır. KARP genelleştirmesi olan bu problemde, müşteri taleplerinin üç-boyutlu, dikey ve yığınlanabilir kutulardan oluştuğu varsayılmaktadır. Bortfeldt (2012), rotalama için tabu arama ve araçlara atama için ağaç arama algoritmalarını içeren verimli bir melez algoritma tanıtmıştır. Rotalama yaklaşımındaki hareketler, kutulama açısından uygunluğu kontrol edilmeden önce değerlendirilir. Böylece, iyi çözüm kalitesi için gerekli kutulama çabası önemli ölçüde azalır. Ruan vd. (2013), üç-boyutlu yükleme KARP’yi ele almışlardır. Tüm araçların merkezî bir depoyu temel aldıkları bu problem, araçlar için uygun yükleme ve başarılı rotalamayı eniyilemeyi gerektirir. Bal arısı çiftleşme eniyilemesi ve altı yükleme sezgisini birleştiren melez bir yöntem sunulmuştur. Bütünleşik problemi çözmede, biri araç rotalama ve diğerleri üç-boyutlu yükleme için kullanılmıştır. Üç-boyutlu yükleme ve araç rotalamanın önemli bir birleşimi olan bu problem, Fuellerer vd. (2010) tarafından da çalışılmıştır. Onlar, yükün araçlara yüklenmesi ve yol ağı üzerinde araç rotalamanın birleşiminin eniyilemesini amaçlamışlardır. Onlara göre, yüksek karmaşıklığı nedeniyle, bu problem üzerinde literatür çok sınırlıdır. Problem, yükleme için hızlı kutulama sezgilerini kullanan karınca kolonisi eniyilemesi kullanılarak çözülmüştür. Algoritma, rotalama ve kutulama olarak iki farklı sezgi bilgisini birleştirmektedir.
Cacchiani vd. (2014), bir ARP genelleştirmesi olarak, periyodik ARP’yi ele almışlardır. Bu problem, verilen planlama diliminin her günü için minimum maliyetli rota kümesini belirlemeyi içermektedir. Her müşteri, gereken sayıda ziyaret edilmeli ve gerekli ürün miktarını her seferinde almalıdır. Ayrıca, gün başına düşen rota sayısı toplam kullanılabilir araç sayısını geçememektedir. Rotalama problemleri için birkaç günlük planlanmalar hesaba katılmaktadır. Hà vd. (2014), araç sayısı bir karar değişkeni olacak şekilde, esnek filo büyüklüklü genelleştirilmiş ARP’yi ele almışlardır. Uygun filo büyüklüğü, günlük rotalama maliyetini en aza indirmek amacıyla belirlenebilmektedir.
Tlili vd. (2014), araçların belirlenen maksimum uzunluğa kadar seyahat edebileceği mesafe-kısıtlı KARP için parçacık sürüsü eniyilemesi ile değişken komşuluk aramayı bütünleştiren melez meta-sezgisel bir yöntem önermişlerdir.

Journal of Management, Marketing and Logistics -JMML (2017), Vol.4(2), p.168-177 Karakoc
_________________________________________________________________________________________________
DOI: 10.17261/Pressacademia.2017. 461 171
Marinakis vd. (2013), rasgele talepli ARP’yi başarılı bir biçimde çözmek için parçacık sürüsü eniyilemesi tabanlı yeni bir melez yöntem tanıtmışlardır. Bu problemde, sonlu kapasiteli bir araç, tam yüklemeyle depodan ayrılır ve sadece onlara ulaştığında talepleri bilinecek bir dizi müşteriye hizmet vermek zorundadır. Lei vd. (2011) ise taleplerin rasgele olduğu ve her köşeye bir zaman penceresinin uygulandığı KARP’yi ele almışlardır. Gerçekleşen talep araç kapasitesini aştığı zaman, aynı rotadaki konumlarda başarısızlık olabilir. Problem, rasgele bir problem olarak modellenmiş ve çözüm için uyarlanabilir bir geniş çerçevede komşuluk arama önerilmiştir.
Mevcut çalışmalardan farklı olarak bu çalışmanın temel katkısı, hizmet verilecek noktaların, (1) bütünsel olarak değerlendirilip bir bölgedeki tüm müşterilere hizmet verecek rota kümesinin veya (2) alt-kümeler olarak değerlendirilip her alt-bölge için ilgili müşteri grubuna hizmet verecek ayrık turların belirlenebilmesidir.
3. VERİ VE YÖNTEM
3.1. Kapasiteli Araç Rotalama Problemi
ARP’nin en genel şekli, tüm müşterilerin taleplerinin bilindiği ve karşılandığı, tüm araçların özdeş ve sınırlı kapasiteli olduğu KARP’dir (Boonsam vd., 2011). KARP’de, merkezî bir depoda teslimat işini gerçekleştiren m adet q kapasiteli v hızına sahip aracın, bir coğrafi alanda farklı noktalara dağılmış n müşterinin taleplerini en az C maliyetle karşılamak için kullanacakları en uygun R rota kümesi belirlenir. KARP, yoğun bir biçimde çalışılan ve çok sayıda türü olan yaygın bir Yöneylem Araştırması (Operations Research) problemi olup, örnek bir çözüm Şekil 1’de verilmiştir.
Şekil 1: Örnek KARP Çözümü (36 müşteri konumu / her müşterinin talebi 10 ve araç kapasitesi 60)
Şekil 1’de resmedilen örnekteki kesikli çizgiler, her rotadaki son müşteriden depoya olan geçişleri ifade eder. Bu temel ARP modeline ilişkin çözümde, her biri 6 müşteri konumu içeren 6 rota mevcuttur. Her konum noktasal olup (x-y koordinatları ile), depo ve müşteriler sırasıyla, büyük bir kare ve daireler ile gösterilmiştir. Depo-müşteri konumları, talep miktarları ve araç kapasitesi önceden bilinir. Noktalar arasındaki bağlantıları ifade eden kenarlar üzerindeki ağırlıklar ise aralarındaki uzaklık/maliyet bilgisidir. Probleme ilişkin varsayımlar şunlardır:
Her müşterinin bir talebi vardır ve depo tüm talepleri karşılayabilecek ürün stokuna sahiptir.
Tüm talepleri karşılayabilecek yeterli sayıda araç mevcuttur.
Talep miktarları ve araç kapasitesi birim temelli (tamsayı değerler) olduğu için araçları maksimum seviyede dolduran yüklemeler yapılabilir.
Probleme ilişkin keskin kısıtlar ise şunlardır:
Her araç, depodan hareket eder, bir dizi müşteriye hizmet verir ve depoya geri döner.
Her müşteri, tam olarak bir araç tarafından ve sadece bir kez ziyaret edilir.
Herhangi bir rota üzerindeki talep miktarlarının toplamı araç kapasitesini geçemez.
Rota sayısı (gerekli/kullanılacak araç sayısı) en az ve toplam rota uzunluğu en kısa olacak şekilde, en az maliyetli rota kümesi belirlenir. Çoğu çalışmada (Chand vd., 2010; Chand ve Mohanty, 2013) bu iki hedef üzerinde yoğunlaşılmıştır.

Journal of Management, Marketing and Logistics -JMML (2017), Vol.4(2), p.168-177 Karakoc
_________________________________________________________________________________________________
DOI: 10.17261/Pressacademia.2017. 461 172
3.2. Genetik Algoritmalar Tabanlı Çözüm
GA, evrimsel hesaplama (evolutionary computing) alanının arama yöntemlerinden biri olarak, karmaşık ve zor problemlerin çözümü için kullanılan gürbüz bir eniyileme tekniğidir. Darwin’in evrim teorisinden esinlenilen ve evrimsel süreci temel alan bir teknik olup, en iyinin hayatta kalması prensibine dayanır. GA, her biri problem için bir aday çözümü temsil eden kromozom grubundan, her kromozom ise genellikle sayısal karakter dizilerinden oluşur. Başlangıç nüfus tamamen rasgele veya belli ölçüde müdahale ile oluşturulur. Her nesilde tüm kromozomlar değerlendirilir. Nüfustan seçilen kromozomlar çaprazlama işlemine tabi tutulurlar ve elde edilen çocuklara mutasyon işlemi uygulanır. Yeni nesil ise ebeveyn ve çocuk kromozomlardan seçim yapılarak oluşturulur. Nesiller devam ettikçe problem için en uygun çözümlere yakınsanır. Son nesildeki en iyi uygunluk değerlerine sahip kromozomlar çözüm olarak değerlendirilirler. Süreç, belirlenen maksimum nesil değerine ve/veya beklenen uygunluk değerine ulaşılması gibi durumlarda sonlandırılır. GA, problemlere en iyi çözümü garanti etmeseler de iyi bir çözüm kümesi sunarlar.
ARP, problem büyüklüğünün (müşteri sayısı) artmasıyla karmaşıklığın (çözüm zamanı / işlem sayısı) üstel olarak (exponentially) artmasına bağlı olarak, NP-zor problemler sınıfında yer almaktadır. Bu nedenle, bütünsel arama (global search) yaparak en uygun çözümleri sağlayabilmek için meta-sezgisel bir yöntem olarak GA tercih edilmiştir. Ayrıca, arama uzayını daha verimli bir biçimde taramak ve yerel en iyi noktalara (local optimums) takılma durumlarını en aza indirerek daha iyi sonuçlar ve daha iyi başarım elde edebilmek ve hatta bütünsel en iyi noktaya/çözüme (global optimum) ulaşabilmek için GA yerel arama ile melezleştirilmiştir. Geliştirilen bu melez algoritma, literatürde taklitçi (memetic) algoritma (Moscato ve Cotta, 2003) olarak bilinmektedir ve akış şeması Şekil 2’de verilmiştir.
Şekil 2: Geliştirilen GA ve Yerel Arama Tabanlı Melez Meta-Sezgisel Algoritmanın Akış Şeması
Başlangıç Nüfusu Oluştur
Sonlanma koşulu
sağlandı mı?
Seçilim
Çaprazlama
Mutasyon
İyileştirilmiş Yerel Arama Uygula
Yeni Nüfusu Üret
Nüfustaki en iyi
çözümü görüntüle
H
E Seçkincilik
Şekil 2’deki melez algoritmanın temel bileşenlerine ilişkin ayrıntılar ilerleyen kısımdaki alt bölümlerde verilmektedir.
3.2.1. Kromozom Gösterimi
Rotalara ait müşteri gruplarının sıfır araç tanımlayıcısı (depo konumu) ile birbirinden ayrıldığı tek vektör içeren bir gösterim tercih edilmiştir. Her rota, güzergâhı üzerindeki müşterilerin bu rotayı kullanacak araç tarafından ziyaret edilme sırasını içerir ve her müşteri konumu, her gösterimde tam olarak bir kez yer alır. Örneğin “{0 1 3 5 0 4 2 0 6}” gösteriminde, müşteriler şu üç rotada kümelenmişlerdir: (i) Depo 1 3 5, (ii) Depo 4 2 ve (iii) Depo 6. Gösterimdeki konum sayısı, müşteri sayısı (n) ile rota/sıfır sayısının toplamıdır. Her aracın sadece tek müşterinin talebini karşılaması durumunda ise 2n olur. Uygun bir aday çözüme ilişkin gösterimdeki her rota, probleme özgü kısıtları sağlamalıdır.
3.2.2. Başlangıç Nüfusun Üretilmesi
Başlangıç nüfus tamamen rasgele olmayacak şekilde üretilir. Öncesinde, noktalar arasındaki mesafeler (Öklid karesel uzaklıkları) hesaplandıktan sonra, her konum için bu konuma en yakın uzaklıktaki belli sayıdaki konum belirlenir. Böylece,

Journal of Management, Marketing and Logistics -JMML (2017), Vol.4(2), p.168-177 Karakoc
_________________________________________________________________________________________________
DOI: 10.17261/Pressacademia.2017. 461 173
birbirine daha/en yakın ardışık nokta çiftleri oluşturularak, daha iyi aday çözümler üretilmesi mümkün olur. Bu amaçla, en yakın komşuluk algoritması (nearest neighbor algorithm) kullanılmıştır.
3.2.3. Uygunluğun Değerlendirilmesi
Maliyeti hesaplamak için kullanılan çok-hedefli uygunluk fonksiyonu, rota sayısını ve toplam rota uzunluğunu en aza indirmeyi amaçlar. Nüfustaki i. kromozomun uygunluk değeri Denklem (1)’deki F fonksiyonu ile hesaplanır.
F(i)=(α×mi)+(β×Ci) (1)
Denklem (1)’de α ve β sırasıyla, rota sayısı (m) ve toplam rota uzunluğu (C) için katsayı değerleridir (F fonksiyonu ve katsayı değerleri ile ilgili ayrıntılar için Bkz. Chand ve Mohanty, 2013).
3.2.4. Genetik İşleçler
Nüfustan seçilen ebeveyn çiftine tek-noktalı ve çift-noktalı permütasyon çaprazlama işleçleri uygulanarak elde edilen çocuklar, mutasyon işleci olarak yerel aramaya tabi tutulurlar.
3.2.5. Yerel Arama
Yerel arama, mevcut çözümü çevresindeki komşu çözümlere bakarak yinelemeli bir biçimde iyileştiren etkili bir tekniktir. 2-opt algoritmasında, yerel en iyi noktalarda takılı kalmamak için kromozom, iki noktadan kırılır ve bu aralık ters yönde olacak şekilde yeniden oluşturulur. Rota-içi konum sırası değişikliği ve rotalar-arası konum sırası takasları ile rota sayısını düşürmek ve toplam rota uzunluğunu azaltmak amaçlanır ve bu süreç, yerel en iyi noktaya (local minimum) ulaşılana kadar devam eder. Değişiklikler sonrasında, aynı rota sayısı için rotalar arasındaki yüklemeler dengelenir veya ardışık iki sıfırın yer aldığı uygun/yeni bir çözüme ilişkin gösterimdeki mevcut rota sayısı bir azalır:
Eski çözüm : 0 1 3 5 0 4 2 0 6 → 2-opt algoritması uygulanmadan önce (üç rota)
Yeni çözüm : 0 1 3 5 0 0 2 4 6 → 0 1 3 5 0 2 4 6 (iki rota)
Her nesil sonunda ve sadece kromozomu iyileştirecek durumlarda uygulanan iyileştirilmiş yerel arama algoritmasının sözde kodu Tablo 1’de verilmiştir.
Tablo 1: GA Tabanlı Yöntem Kapsamında Uygulanan 2-opt Algoritmasının Sözde Kodu
Algoritma: applyImprovedLocalSearch(Kromozom birey)
while “birey için yerel en iyi noktaya ulaşılmadı / iyileşme söz konusu” do
Kromozom gösterimindeki en iyi “i, i + 1” ve “j, j + 1” kenar çiftini belirle
if mesafe(i, i + 1) + mesafe(j, j + 1) > mesafe(i, j) + mesafe(i + 1, j + 1) then
Kenarları takas et ve kromozomun uygunluk değerini güncelle
end if
end while
Tablo 1’de, i ve j kromozomdaki genlere karşılık gelen değişkenler olup, mesafe ise nokta çiftleri arasındaki uzaklıkları içeren matristir.
3.2.6. Yeni Neslin Oluşturulması
Her nesilde, en iyi aday çözümleri muhafaza etmek için ilk olarak nüfustaki en iyi kromozom çifti doğrudan yeni nesle aktarılır (elitism). Daha sonra, nüfus büyüklüğünü (n) korumak için n - 2 kadar çocuk üretilir ve elde edilen çocuklar en kötüden başlayarak ebeveynler ile değiştirilir. Yeterince iyi olmayan aday çözümlerden de iyi çözümler elde edilebilir; ayrıca, bu durum çeşitlilik sağlamak ve yerel en iyi noktalarda takılı kalmamak için de yararlıdır. Bu nedenle, ebeveynlerinden daha iyi olmayan çocuklara da yaşama şansı verilir.
4. BULGULAR VE TARTIŞMA
4.1. Deneysel Çalışmalar
Geliştirilen melez meta-sezgisel algoritmanın başarısını test edebilmek için ilk olarak literatürden alınan (1) simetrik KARP ve (2) tek-depolu çoklu GSP örnekleri üzerinde iki ayrı vaka çalışması yapılmıştır. Daha sonra, rasgele müşteri konumu kurumları üzerinde de deneyler yapılmıştır.

Journal of Management, Marketing and Logistics -JMML (2017), Vol.4(2), p.168-177 Karakoc
_________________________________________________________________________________________________
DOI: 10.17261/Pressacademia.2017. 461 174
4.1.1. Veri Kümesi Ve Deneysel Kurulum
Deneylerde, müşteri sayısının (GSP için şehir sayısı) değişiminin belirlenen güzergâhları ve toplam rota uzunluklarını nasıl etkilediği incelenmiştir. Talep miktarı, araç kapasitesi (GSP için söz konusu değil) ve çözüme ilişkin rota sayısı (GSP için gezgin satıcı sayısı) değişimleri ise dikkate alınmamıştır.
İlk deneylerde, literatürdeki VRPLIB kütüphanesinden birkaç KARP örneği için ilgili konum verisi, talep miktarları ve araç kapasitesi ve TSPLIB kütüphanesinden bir GSP örneği için ilgili konum verisi; diğer deneylerde ise talep miktarları ve araç kapasitesi sabit tutularak, rasgele nokta kümeleri kullanıldı. İkinci deneylerde, her müşterinin talebi 10 ve araç kapasitesi 250’dir. Örneğin bu durumda, 100 müşteri konumu içeren her probleme ilişkin çözüm dört (10×100÷250) rota içermektedir. Çözüm yönteminin istatistiksel başarısını göstermek için ilk deneyler aynı nokta kümeleri ile yinelenirken, diğer deneyler ise farklı nokta kümeleri ile yinelendi. Her başarım testi için ayrıca, en iyi değerin bulunduğu nesil değeri ve o ana kadar geçen çalışma süresi ve toplam çalışma süresi bilgileri kaydedildi. Tüm deneylerde kullanılan genetik algoritma değişkenleri ve ilgili değerler Tablo 2’de verilmiştir.
Tablo 2: GA Tabanlı Yöntemin Değişkenleri ve Varsayılan Değerler
Değişken Değer
Nüfus büyüklüğü ve maksimum nesil değeri 100 – 1000
Seçim yöntemi Turnuva seçimi
Çaprazlama işleci ve yerel arama için olasılık değerleri %80 – %5
α ve β değerleri (Chand ve Mohanty, 2013) 0.7 – 0.5
Genetik algoritma gerçekleştiriminde, başlangıç nüfusun üretilmesi için kullanılan en yakın komşuluk algoritması kapsamında, en yakın komşuluk değeri 5, bu algoritmanın uygulanma olasılığı ise %90 olarak belirlendi. Geliştirilen program (algoritmanın kodlanması ve konum ekleme ve ayarlar için arayüz tasarımı) için Microsoft Visual Studio 2012 platformu üzerinde C# programlama dili, gerçekleştirilen deneyler için 3.20 GHz işlemciye ve 8GB ana belleğe sahip 64 bit Windows 7 işletim sistemi yüklü Intel(R) Core(TM) CPU bir masaüstü bilgisayar kullanıldı.
4.1.2. Mevcut müşteri/şehir konumu kurulumları ile gerçekleştirilen deneyler
GA tabanlı yöntemin başarımını göstermek için birkaç KARP örneği temel alınarak deneysel çalışma yapıldı. Geliştirilen algoritma her örnek için 10 kez işletilerek, rota sayıları, güzergâhlar ve minimum/maksimum toplam rota uzunlukları, ortalama uzaklık, standart sapma ve ortalama hata (en iyi değerden sapma) değerleri ve araç doluluk oranları (Denklem (2)’deki formülle tanımlı) belirlendi. Deney sonuçları Tablo 3’te verilmiştir.
Araç doluluk oranı=Q÷(m×q) (2)
Denklem (2)’de Q, m ve q sırasıyla, tüm müşterilerin toplam talebi, araç sayısı ve araç kapasitesi olup; “m×q” ise araçların toplam kapasitesine karşılık gelmektedir.
Tablo 3: Geliştirilen Yöntem ile KARP Çözümüne İlişkin Sonuçlar
Örnek (*) Bilinen En İyi Değer (-) n m q Maksimum Uzaklık Araç Doluluk Oranı
att-n48-k4 40002 47 4 15 40002 0,73
A-n34-k5 778 33 5 100 778 0,92
A-n80-k10 1763 79 10 100 1763 0,94
B-n39-k5 549 38 5 100 549 0,88
E-n22-k4 375 21 4 6000 375 0,94
E-n23-k3 569 22 3 4500 569 0,75
E-n30-k3 534 29 3 4500 534 0,94
E-n51-k5 521 50 5 160 521 0,97
E-n101-k8 815 100 8 200 815 0,91
F-n45-k4 724 44 4 2010 724 0,90
F-n72-k4 237 71 4 30000 237 0,96 Kaynak: http://neo.lcc.uma.es/vrp/vrp-instances/capacitated-vrp-instances/ (*) https://www.coin-or.org/SYMPHONY/branchandcut/VRP/data/index.htm.old (-)

Journal of Management, Marketing and Logistics -JMML (2017), Vol.4(2), p.168-177 Karakoc
_________________________________________________________________________________________________
DOI: 10.17261/Pressacademia.2017. 461 175
Tablo 3’te n, m ve q sırasıyla, müşteri/araç sayıları ve araç kapasitesidir. Görüldüğü gibi, literatürde raporlanmış minimum rota sayıları ve en kısa toplam rota uzunlukları tüm örnekler için her çalıştırmada bulunmuştur. Standart sapmalar ve ortalama hatalar sıfır olup, mevcut durumda belirgin bir kararlılık vardır. Tam yakınsama ile elde edilen sonuçlar oldukça başarılıdır (en iyi değerler için Bkz. Lysgaard vd., 2004; Fukasawa vd., 2006; Stanojević vd., 2013).
GA tabanlı yöntemin başarımını gösterdikten sonra, berlin52 GSP örneği temel alınarak çoklu GSP için de deneysel çalışma yapıldı. Şehir listesindeki ilk şehir depo (51 şehir konumu söz konusu) ve her talep miktarı “1” olacak şekilde, farklı sayılardaki gezgin satıcılar, depodan hareket eder, kapasite sınırı olmadan depo dışında en az iki şehri ziyaret eder ve depoya geri dönerler. Geliştirilen algoritma bu örnek için 100 kez işletilerek, güzergâhlar ve minimum/maksimum toplam rota uzunlukları ve ortalama uzaklık, standart sapma ve ortalama hata değerleri belirlendi. Deney sonuçları Tablo 4’te verilmiştir.
Tablo 4: Geliştirilen Yöntem ile Tek-Depolu Çoklu GSP (-) Çözümüne İlişkin Sonuçlar
Örnek (*) m q Minimum Uzaklık Araç Doluluk Oranı
berlin52 1 - 7542 -
berlin52-m2 2 26 7880 0,98
berlin52-m3 3 17 8497 1,00
berlin52-m5 5 11 9523 0,93
berlin52-m7 7 8 10746 0,91 Kaynak: https://profs.info.uaic.ro/~mtsplib/ (-) Kaynak: https://profs.info.uaic.ro/~mtsplib/TSPLIB/berlin52.tsp (*)
Tablo 4’te, m gezgin satıcı sayısı olup; aynı şehir konumu kurulumu için gezgin satıcı sayısı arttıkça maliyet de artar.
4.1.3. Rasgele Müşteri Konumu Kurulumları İle Gerçekleştirilen Deneyler
Depo-müşteri konumlarının rasgele oluşturulduğu bu deneylerde müşteri sayısı değiştirilir. İlk olarak, deney 100 müşteri konumu ile 10 kez yinelenir. Daha sonra, mevcut konum kümesinden rasgele 15 müşteri konumu çıkarılarak elde edilen yeni küme üzerinde gerçekleştirilir. Müşteri sayısı 10 olana kadar devam eden bu işlem, farklı müşteri yerleşimleri için yinelenmemiştir. Sonuçlar, Tablo 5’te verilmiştir.
Tablo 5: Farklı Müşteri Sayıları için Toplam Rota Uzunlukları
Müşteri Sayısı (n) 100 85 70 55 40 25 10
Araç Sayısı (m) 4 4 3 3 2 1 1
Minimum Uzaklık 10432 9848 8971 8047 6589 4991 3932
Tablo 5’te, ortamdaki müşteri sayısının azalmasıyla maliyetin doğrusal bir biçimde azaldığı gözlemlenmiştir.
4.2. Test Bulguları
Farklı nokta kümeleri üzerinde gerçekleştirilen çeşitli deneylerde, başarılı şu sonuçlar elde edilmiştir: (i) başlangıç nüfusun üretilmesinde tamamen rasgele olan bir yöntem kullanılmaması ve yerel aramanın nesiller boyunca uygulanmasıyla, oldukça hızlı bir biçimde çözüme yakınsama sağlandığı gözlemlenmiştir. (ii) uygun çözümlere (en uygun rota kümeleri ile gerekli araç sayısı ve minimum maliyet) çok küçük nesil değerlerinde (100 nesil tekrarı yeterli olabilmiştir) ve kısa çalışma zamanlarında ulaşılabilmiştir. (iii) genel olarak müşteri sayısının artması, maliyeti (toplam rota uzunluğu) büyük ölçüde artırır. (iv) ortamdaki müşterilerin birbirlerine uzak olmalarıyla, daha uzun güzergâhlar ve daha yüksek maliyetler söz konusu olur.
5. SONUÇ VE ÖNERİLER
Bu çalışmada, tarım ürünleri ve gıdaların Tedarik Zinciri Yönetimine ilişkin dağıtım işlemleri için zeki bir rotalama yaklaşımı ele alındı. Tüm talepleri en az maliyet ile karşılayabilmek için KARP ve çoklu GSP çalışıldı. Bir araç filosunun bir depodan hareket ettiği, bir dizi müşteriye hizmet verip depoya geri döndüğü en kısa rotalar belirlendi. Çözümün doğruluğunu ve uygulanabilirliğini test etmek için geliştirilen GA ve yerel arama tabanlı melez meta-sezgisel algoritma kullanılarak, deneysel çalışmalar yapılıp başarılı sonuçlar elde edildi. Deneylerde, bilinen en iyi değerler veya bu değerlere oldukça yakın değerler elde edilmiştir. Test bulguları, dağıtım işlemlerinin Yerel Arama ile iyileştirilmiş GA kullanılarak kayda-değer derecede kısa sürelerde gerçekleştirilebileceğini göstermiştir. Geliştirilen çözüm aracılığıyla, hem ayrık hem de bütünsel turlar içeren düşük maliyetli rota kümeleri dinamik olarak oluşturulabilecektir. Geliştirilen program, endüstriye yönelik pratik uygulamaların çözümü için uyarlanabilir.

Journal of Management, Marketing and Logistics -JMML (2017), Vol.4(2), p.168-177 Karakoc
_________________________________________________________________________________________________
DOI: 10.17261/Pressacademia.2017. 461 176
KAYNAKLAR
Berger, J. & Barkaoui, M. 2003, “A hybrid genetic algorithm for the capacitated vehicle routing problem”, Genetic and Evolutionary Computation Conference (GECCO’03): Part I, pp. 646-656, Lecture Notes in Computer Science, 2723.
Boonsam, P., Suthikarnnarunai, N. & Chitphaiboon, W. 2011, “Assignment problem and vehicle routing problem for an improvement of cash distribution”, World Congress on Engineering and Computer Science (WCECS), vol. II, October 19-21, San Francisco, USA.
Bortfeldt, A. 2012, “A hybrid algorithm for the capacitated vehicle routing problem with three-dimensional loading constraints”, Computers & Operations Research, vol. 39, no. 9, pp. 2248-2257.
Cacchiani, V., Hemmelmayr, V.C. & Tricoire, F. 2014, “A set-covering based heuristic algorithm for the periodic vehicle routing problem”, Discrete Applied Mathematics, vol. 163, no. 1, pp. 53-64.
Chand, P. & Mohanty, J.R. 2013, “Solving vehicle routing problem with proposed non-dominated sorting genetic algorithm and comparison with classical evolutionary algorithms”, International Journal of Computer Applications (IJCA), vol. 69, no. 26, pp. 34-41.
Chand, P., Mishra, B.S.P. & Dehuri, S. 2010, “A multi objective genetic algorithm for solving vehicle routing problem”, International Journal of Information Technology and Knowledge Management, vol. 2, no. 2, pp. 503-506.
Dantzig, G.B. & Ramser, J.H. 1959, “The truck dispatching problem”, Management Science, vol. 6, no. 1, pp. 80-91.
Du, L. & He, R. 2012, “Combining nearest neighbor search with tabu search for large-scale vehicle routing problem”, Physics Procedia, vol. 25, pp. 1536-1546, International Conference on Solid State Devices and Materials Science, April 1-2, Macao.
Fuellerer, G., Doerner, K.F., Hartl, R.F. & Iori, M. 2010, “Metaheuristics for vehicle routing problems with three-dimensional loading constraints”, European Journal of Operational Research, vol. 201, no. 3, pp. 751-759.
Fukasawa, R., Lysgaard, J., de Aragão, M.P., Reis, M., Uchoa, E. & Werneck, R.F. 2006, “Robust branch-and-cut-and-price for the capacitated vehicle routing problem”, Mathematical Programming, vol. 106, no. 3, pp. 491-511.
Hà, M.H., Bostel, N., Langevin, A. & Rousseau, L.M. 2014, “An exact algorithm and a metaheuristic for the generalized vehicle routing problem with flexible fleet size”, Computers & Operations Research, vol. 43, pp. 9-19.
Ho, W., Ho, G.T.S., Ji, P. & Lau, H.C.W. 2008, “A hybrid genetic algorithm for the multi-depot vehicle routing problem”, Engineering Applications of Artificial Intelligence, vol. 21, no. 4, pp. 548-557.
Lei, H., Laporte, G. & Guo, B. 2011, “The capacitated vehicle routing problem with stochastic demands and time windows”, Computers & Operations Research, vol. 38, no. 12, pp. 1775-1783.
Leung, S.C.H., Zhang, Z., Zhang, D., Hua, X. & Lim, M.K. 2013, “A meta-heuristic algorithm for heterogeneous fleet vehicle routing problems with two-dimensional loading constraints”, European Journal of Operational Research, vol. 225, no. 2, pp. 199-210.
Lin, S.W., Lee, Z.J., Ying, K.C. & Lee, C.Y. 2009, “Applying hybrid meta-heuristics for capacitated vehicle routing problem”, Expert Systems with Applications, vol. 36, no. 2, pp. 1505-1512.
Luo, J. & Chen, M.R. 2014, “Improved shuffled frog leaping algorithm and its multi-phase model for multi-depot vehicle routing problem”, Expert Systems with Applications, vol. 41, no. 5, pp. 2535-2545.
Lysgaard, J., Letchford, A.N. & Eglese, R.W. 2004, “A new branch-and-cut algorithm for the capacitated vehicle routing problem”, Mathematical Programming, vol. 100, no. 2, pp. 423-445.
Marinakis, Y., Iordanidou, G.R. & Marinaki, M. 2013, “Particle swarm optimization for the vehicle routing problem with stochastic demands”, Applied Soft Computing, vol. 13, no. 4, pp. 1693-1704.
Moscato, P. & Cotta, C. 2003, “A gentle introduction to memetic algorithms”, pp. 105-144 Handbook of Metaheuristics, Glover, F., Kochenberger, G.A. (Eds.), Springer US, 57, Boston MA, 560p.
Pop, P.C., Matei, O. & Sitar, C.P. 2013, “An improved hybrid algorithm for solving the generalized vehicle routing problem”, Neurocomputing, vol. 109, pp. 76-83, “New Trends on Soft Computing Models in Industrial and Environmental Applications” — A selection of extended and updated papers from the SOCO 2011 International Conference.
Ruan, Q., Zhang, Z., Miao, L. & Shen, H. 2013, “A hybrid approach for the vehicle routing problem with three-dimensional loading constraints”, Computers & Operations Research, vol. 40, no. 6, pp. 1579-1589.
Stanojević, M., Stanojević, B. & Vujošević, M. 2013, “Enhanced savings calculation and its applications for solving capacitated vehicle routing problem”, Applied Mathematics and Computation, vol. 219, no. 20, pp. 10302-10312.
Subramanian, A., Uchoa, E. & Ochi, L.S. 2013, “A hybrid algorithm for a class of vehicle routing problems”, Computers & Operations Research, vol. 40, no. 10, pp. 2519-2531.
Yurtkuran, A. & Emel, E. 2010, “A new hybrid electromagnetism-like algorithm for capacitated vehicle routing problems”, Expert Systems with Applications, vol. 37, no. 4, pp. 3427-3433.

Journal of Management, Marketing and Logistics -JMML (2017), Vol.4(2), p.168-177 Karakoc
_________________________________________________________________________________________________
DOI: 10.17261/Pressacademia.2017. 461 177
Tlili, T., Faiz, S. & Krichen, S. 2014, “A hybrid metaheuristic for the distance-constrained capacitated vehicle routing problem”, Procedia - Social and Behavioral Sciences, vol. 109, pp. 779-783, 2nd World Conference on Business, Economics and Management.
Wang, C.H. & Lu, J.Z. 2009, “A hybrid genetic algorithm that optimizes capacitated vehicle routing problems”, Expert Systems with Applications, vol. 36, no. 2, pp. 2921-2936.
Yücenur, G.N. & Demirel, N.Ç. 2011, “A hybrid algorithm with genetic algorithm and ant colony optimization for solving multi-depot vehicle routing problems”, Journal of Engineering and Natural Sciences, vol. Sigma 29, no. 3, pp. 340-350.
Journal of Management, Marketing and Logistics -JMML (2017), Vol.4(2), p.178-185 Koc, Uysal
_________________________________________________________________________________________________
DOI: 10.17261/Pressacademia.2017.462 178
REVERSE LOGISTICS AND APPLICATION OF ARAS METHOD
DOI: 10.17261/Pressacademia.2017.462 JMML- V.4-ISS.2-2017(11)-p.178-185
Nesrin Koc
1, Fahriye Uysal
2
1Akdeniz University, School of Applied Sciences, Antalya, Turkey. [email protected] 2Akdeniz University, School of Applied Sciences, Antalya, Turkey. [email protected]
_________________________________________________________________________________________________________________
To cite this document Koc, N. and F.Uysal, (2017). Reverse logistics and application of ARAS method . Journal of Management, Marketing and Logistics (JMML), V.4, Iss.2, p.178-185. Permemant link to this document: http://doi.org/10.17261/Pressacademia.2017.462 Copyright: Published by PressAcademia and limited licenced re-use rights only.
ABSTRACT Purpose- In recent years, product recovery, environmental awareness, efficient use of resources and sustainability issues have gained
importance. For this reason, the importance attached to reverse logistics activities of information and products towards the starting point
of the final user is also increasing. Reverse logistics gives firms a competitive advantage and allows them to create an image of an
environmentalist firm. In this context, the critical success factors that influence reverse logistics activities and the evaluation of the
performance of this process are extremely important in terms of businesses. In this study, textile, retail and automotive sectors were
evaluated according to selected logistic critical success factors selected from the literature.
Methodology- In the evaluation process, ARAS (Additive Ratio Assesment) was used as a multi-criteria decision making method.
Findings- According to the evaluation results, the automotive sector ranks first in terms of reverse logistics practices, second in the retail
sector and third in the textile sector.
Conclusion- As a result of the study, the importance given to logistics applications is evaluated in contrast to different sectors.
Keywords: ARAS method, critical success factors, reverse logistics.
JEL Codes: C02, D30, M10
TERSİNE LOJİSTİK VE ARAS YÖNTEMİ UYGULAMASI
ÖZET Amaç- Son yıllarda ürün geri kazanımı, çevresel duyarlılık, kaynakların etkin kullanımı ve sürdürülebilirlik konuları önem kazanmıştır. Bu
nedenle, bilgi ve ürünlerin nihai kullanıcıdan başlangıç noktasına doğru akışı olan tersine lojistik faaliyetlerine verilen önem de artmaktadır.
Tersine lojistik, firmalara hem rekabet avantajı sağlar hem de çevreci firma imajını yaratmalarına olanak verir. Bu bağlamda tersine lojistik
faaliyetlerine etki eden kritik başarı faktörleri ve bu sürecin performansının değerlendirilmesi işletmeler açısından son derece önemlidir. Bu
çalışmada, tekstil, perakende ve otomotiv sektörleri, literatürden seçilen tersine lojistik kritik başarı faktörlerine göre değerlendirilmiştir.
Yöntem- Değerlendirme sürecinde, çok kriterli karar verme yöntemlerinden ARAS (Additive Ratio Assesment) kullanılmıştır.
Bulgular- Değerlendirme sonuçlarına göre, otomotiv sektörü tersine lojistik uygulamaları açısından ilk sırada, perakende sektörü ikinci
sırada ve tekstil sektörü üçüncü sırada yer almıştır.
Sonuç- Çalışma sonucunda farklı sektörlerin tersine lojistik uygulamalarına verdikleri önem değerlendirilmektedir.
Anahtar Kelimeler: ARAS Yöntemi, Kritik Başarı Faktörleri, Tersine Lojistik
JEL Kodları: C02, D30, M10
Year: 2017 Volume: 4 Issue: 2
Journal of Management, Marketing and Logistics – (JMML), ISSN: 2148-6670, http://www.pressacademia.org/journals/jmml

Journal of Management, Marketing and Logistics -JMML (2017), Vol.4(2), p.178-185 Koc, Uysal
_________________________________________________________________________________________________
DOI: 10.17261/Pressacademia.2017.462 179
1. GİRİŞ
Dünya nüfusunun artması ve kaynakların giderek azalması beraberinde kaynakların etkin kullanımı, çevresel duyarlılık, ürün geri kazanımı ve sürdürülebilirlik gibi konuları gündeme getirmiştir. Bu konular, toplum ve toplumu ilgilendiren tüm kesimler tarafından en çok önem verilen konular arasında olmuştur. Müşteriler satın aldıkları ürün ve hizmetlerin çevreye olan etkilerini daha çok sorgular hale gelmiştir. Bu durum direkt olarak üreticilerin dikkatini çekmiş ve gerek üretim gerekse üretim sonrası süreçlerde sadece müşteriye değil aynı zamanda çevreye de odaklanma gerçeğini ortaya çıkarmıştır (Alfonso-Lizarazo vd., 2013).
Tüm bu gelişmeler, üreticilerin rekabet avantajı elde ettikleri lojistik alanında yansımalarını göstermiş ve temel olarak “tek yönlü yolda yanlış yönde gitmek” olarak tanımlanan “Tersine Lojistik” kavramı ortaya çıkmıştır (URL 1). Tersine lojistik, Cullen vd. (2013) tarafından “materyalin süreç envanterinde, paketlemede ve nihai ürünlerde bir üreticiden, dağıtıcıdan veya kullanım noktasından, geri kazanma veya uygun bir şekilde imha etme noktasına kadar olan geriye doğru planlama, uygulama ve kontrol süreçlerinin akışı” olarak tanımlanmıştır.
Sistem olarak ele alındığı zaman tersine lojistik, kapalı çevrim ve açık çevrim sistemi olmak üzere iki şekilde oluşabilmektedir. Kapalı çevrim sisteminde, sistemdeki döngüyü sağlayabilmek için başlangıç noktası ve nihai nokta çakışıktır. Açık çevrim sisteminde ise, bu noktalar farklı yerlerde olabilmektedir. Genelde, geri dönüşüm işlemleri açık çevrim tersine lojistik sistemi olmasına rağmen yeniden üretim ve yeniden kullanım işlemleri kapalı çevrim tersine lojistik sistemi olmaktadır (Rahman ve Subramanian, 2012). Ancak tersine lojistik süreç ve sistemleri bilgi, tedarikçi ilişkileri gibi pek çok faktörle ilişkili olabilmektedir. . Bu faktörlerin tanımlanması ve araştırılması, şirketlerin hedeflerine ulaşmasına yardımcı olmaktadır. (Bahiraei vd., 2015).
2. LİTERATÜRE BAKIŞ
Tersine lojistik konusunda ilk çalışmalar 1960-1970’lerde başlamıştır (Rahman ve Subramanian, 2012). Feischmann vd. (1997) çalışmasında tersine lojistik bağlamında ortaya çıkan sorunları sistematik bir şekilde gözden geçirmiş ve tersine lojistik alanını; dağıtım planlaması, envanter kontrolü ve üretim planlaması olarak üç ana bölüme ayırmıştır. Bu bölümlerin her biri için ortaya çıkan yeniden kullanım çabalarının etkilerini tartışmış ve daha fazla araştırmaya ihtiyaç duyulan alanları belirlemiştir. Cartel ve Ellram (1998) literatürü gözden geçirerek lojistik personelinin tersine lojistikteki rolü hakkında geniş bir bakış açısı geliştirmiştir. Tibben-Lembke (2002) çalışmasında ürün yaşam döngüsünün tersine lojistik üzerine etkisini incelemiştir. Srivastava (2008) ve Mutha ve Pokharel (2009) tersine lojistik için ağ tasarımı yapmıştır. Barker ve Zabinsky (2011) çalışmasında tersine lojistik için Analitik Hiyerarşi Süreci (AHP) kullanarak çok kriterli bir karar verme modeli sunmuş ve sunulan modeli gerçek hayattan üç vaka çalışması ile uygulamalı olarak göstermiştir. Bahiraei vd. (2015) tedarik zinciri yönetimi kritik başarı faktörlerine dayanarak, tersine lojistik kritik başarı faktörlerini belirlemiştir. Daha sonra bu faktörleri, (Technique for Order Preference by Similarity to an Ideal Solution) TOPSIS yöntemini kullanarak en çok önemli olandan en az önemli olana doğru sıralamıştır.
Tersine lojistik süreçlerine bakıldığında, tersine lojistiğin birkaç farklı lojistik aktivitesini kapsadığı görülmektedir. Temel tersine lojistik süreci; toplama, inceleme, seçme ve sıralama, yeniden işleme veya yeniden kazanma ve son adım yeniden dağıtma aşamalarını içerir. Yeniden işleme aşaması; tamir etme, yenileştirme, yeniden üretme, yeniden kazanma, geri dönüşüm ve atıkların imha edilmesi faaliyetlerinden oluşmaktadır (Bahiraei vd., 2015).
3. VERİ VE YÖNTEM
3.1.ARAS Yöntemi
ARAS (Additive Ratio Assesment) yöntemi Zavadskas ve Turskis (2010) tarafından geliştirilmiş Çok Kriterli Karar Verme (ÇKKV) yöntemidir. Tipik bir ÇKKV problemi, her biri aynı anda göz önüne alınması gereken farklı karar kriterleri açısından açıkça tanımlanan belirli sayıda karar alternatifini sıralamakla ilgilidir (Zavadskas ve Turskis, 2010; Zavadskas vd., 2010). Literatürde yer alan birçok ÇKKV yönteminin önem verdiği nokta, ideal pozitif ve ideal negatif çözüme olan göreli uzaklıklardır veya mevcut çözümlerin fayda fonksiyonu değerlerini, ideal pozitif alternatif çözüm değeri ile karşılaştırmaktadır. ARAS yönteminde ise araştırmaya konu olan alternatiflerin fayda fonksiyonu değerleri, karar problemine araştırmacı tarafından eklenen optimal alternatife ait fayda fonksiyonu değeri ile karşılaştırılmaktadır (Yıldırım, 2015).
ARAS yöntemi 4 adımdan oluşmaktadır (Zavadskas ve Turskis, 2010; Zavadskas vd., 2010).
1.Adım: Karar Matrisinin Oluşturulması
Diğer tüm ÇKKV yöntemlerinde olduğu gibi ARAS yönteminde de ilk olarak alternatiflerin, kriterlerin ve bunlara ait skorların yer aldığı karar matrisi oluşturulur. Ancak klasik ÇKKV yöntemlerinden farklı olarak ARAS yönteminde, karar matrisinde kriterlere ait optimal değerlerin gösterildiği bir satır vardır.

Journal of Management, Marketing and Logistics -JMML (2017), Vol.4(2), p.178-185 Koc, Uysal
_________________________________________________________________________________________________
DOI: 10.17261/Pressacademia.2017.462 180
X karar matrisi, m alternatif sayısını, n ise kriter sayısını göstermek üzere,
(1)
şeklinde oluşturulur. X karar matrisi üzerinde, xij; i alternatifinin j kriterinde gösterdiği performans değerini, x0j; j kriterinin optimum değerini ifade etmektedir. Eğer j kriterinin optimum değeri bilinmiyorsa, kriterin fayda veya maliyet özelliği göstermesine göre optimal değer;
xij = max xij
x0j = min x0j
(2)
formülleri kullanılarak bulunur.
2.Adım: Normalize Karar Matrisinin Oluşturulması
ARAS yönteminde ikinci aşama, bütün kriterlerin başlangıç karar matrisinde yer alan performans değerlerinin normalizasyon işlemidir. Bu işlem, hem karar probleminde kullanılan kriter performans değerlerinin ortak bir birime hem de kriter performans skorunun çok geniş aralıklarda değer alması durumunda değerlerin daha küçük aralıklara dönüştürülmesine olanak sağlar (Yıldırım, 2015).
Normalize karar matrisi için, X matrisi, X matrisine dönüştürülür ve aşağıdaki şekilde oluşturulur.
(3)
X matrisinde yer alan x0j değeri, eğer kriterin performans değerinin yüksek olması tercih ediliyorsa;
(4)
fonksiyonu, eğer kriterin performans değerinin düşük olması tercih ediliyorsa;
(5)

Journal of Management, Marketing and Logistics -JMML (2017), Vol.4(2), p.178-185 Koc, Uysal
_________________________________________________________________________________________________
DOI: 10.17261/Pressacademia.2017.462 181
fonksiyonları ile hesaplanır.
3.Adım: Ağırlıklı Normalize Karar Matrisinin Oluşturulması
Ağırlıklı normalize karar matrisi Â, genelde uzman değerlendirmeleri sonucunda belirlenen wj kriter ağırlıkları kullanılarak oluşturulur. Kriter ağırlıkları, 0 < wj < 1 koşulunu sağlamak zorundadır. Kriter ağırlıkları wj,
(6)
koşulunu sağlamak üzere sınırlandırılmıştır.
Ağırlıklı normalize karar matrisi aşağıdaki şekilde oluşturulur:
(7)
 matrisine göre bütün kriterlerin ağırlıklandırılmış şekli,
(8)
formülü ile hesaplanır. Formüle göre j kriterinin, ağırlığını (önemini) wj; ağırlıklı normalize değerini xij ifade eder.
4.Adım: Optimallik Fonksiyon Değerinin Hesaplanması
Son adım olan optimallik fonksiyon değeri,
(9)
formülü ile hesaplanır. Formülde yer alan Si değeri, i alternatifinin optimallik fonksiyon değeridir. Si değerinde en büyük değer en iyiyi, en küçük değer en kötüyü ifade eder. Alternatiflere ait Si değerlerinin S0 optimal fonksiyon değerine oranı Ki
fayda derecesini verir ve aşağıdaki formül yardımıyla hesaplanır:
(10)
Ki değeri [0, 1] aralığında değer alır. Hesaplanan Ki değerleri ile alternatiflerin göreli fayda etkinliği hesaplanır ve sonunda bu değerler büyükten küçüğe doğru sıralanarak karar alternatifleri ile ilgili değerlendirme yapılır.
4. UYGULAMA VE BULGULAR
4.1.Problemin Belirlenmesi
Bu çalışmada, tersine lojistik uygulamaları tekstil, perakende ve otomotiv sektörlerinde tersine lojistik kritik başarı faktörleri açısından değerlendirilmiştir.

Journal of Management, Marketing and Logistics -JMML (2017), Vol.4(2), p.178-185 Koc, Uysal
_________________________________________________________________________________________________
DOI: 10.17261/Pressacademia.2017.462 182
4.2.Tersine Lojistik Kritik Başarı Faktörlerinin Belirlenmesi
Kritik Başarı Faktörleri (KBF) teorisi, Daniel (1961) ve Rockart (1979) tarafından yapılan strateji araştırmaları içerisinde bulunmuştur (Dinter, 2013). Zou vd. (2014) çalışmasında KBF’ni “belli bir şirketin hedeflerine ulaşması için olumlu sonuçların mutlaka gerekli olduğu birkaç önemli faaliyet alanı” olarak tanımlamıştır. KBF, ilk zamanlarda yönetim çalışmaları projelerinde uygulanmaktaydı ancak daha sonra organizasyonel yönetim, operasyonel yönetim, tedarik zinciri yönetimi ve tersine lojistik gibi çeşitli alanlarda yaygın olarak kullanılmaya başlanmıştır (Zhou vd., 2011). Kullanım alanının yaygınlaşması bu faktörlerden sağlanan faydanın da farklı alanlara yayılmasına olanak vermiştir. Örneğin; KBF, organizasyonel uygulamaları ve performansı geliştirebilmektedir ve aynı zamanda akademik bakış açısından daha büyük ölçekli bir araştırma ve geliştirme alanı sağlayabilmektedir (Bahiraei vd., 2015).
Bahiraei vd. (2015) literatürden yararlanarak tersine lojistik kritik başarı faktörlerini oluşturmuş ve TOPSIS yöntemi ile bu faktörleri en çok önemli olandan en az önemli olana doğru sıralamıştır.
Tablo 1: Tersine Lojistik Kritik Başarı Faktörleri
No Kritik Başarı Faktörü Kaynak
1 Ulaşım (K1) Zhou vd. 2011; Pettit and Beresford 2009 2 Süreç Planlama (K2) Koh vd. 2011; Kim and Rhee 2012; Pettit and Beresford 2009 3 Kaynak Yönetimim (K3) Zou vd. 2014; Pal and Torstensson 2011; Salaheddin 2009 4 Bilgi Teknolojisi ve Paylaşımı (K4) Zou vd. 2014; Pal and Torstensson 2011; Trkman 2010; Pettit and
Beresford 2009; Salaheddin 2009 5 Üst Yönetim Uyumu (K5) Bai and Sarkis 2013; Salaheddin 2009 6 Lojistik Ağ Tasarımı (K6) Zou vd. 2014; Zhou vd. 2011 7 Standardizasyon (K7) Kim and Rhee 2012; Trkman 2010; Salaheddin 2009 8 Kontrol (K8) Pal and Torstensson 2011; Salaheddin 2009; Bradley 2008; Chen and
Shiu 2008 9 Organizasyonel Strateji (K9) Trkman 2010; Salaheddin 2009; Bradley 2008 10 Yönetim Kalitesi (K10) Zou vd. 2014; Pal and Torstensson 2011; Salaheddin 2009 11 İnsan Kaynakları Yönetimi (K11) Trkman 2010; Pettit and Beresford 2009; Bradley 2008 12 Kapasite (K12) Pal and Torstensson 2011; Pettit and Beresford 2009 13 İş Birliği ve İletişim (K13) Pettit and Beresford 2009; Salaheddin 2009; Lam and Chin 2005 14 Kültür (K14) Bai and Sarkis 2013; Koh vd. 2011; Lam and Chin 2005 15 Otomasyon (K15) Trkman 2010; Salaheddin 2009 16 Yenilik (K16) Zou vd. 2014; Koh vd. 2011; Pal and Torstensson 2011; Trkman 2010
4.3.Alternatiflerin Belirlenmesi
Tersine lojistik kapsamında sektör değerlendirmesi için 3 adet sektör/ alternatif (A1, A2, A3) uzman görüşü alınarak belirlenmiştir.
4.4.Verilerin Elde Edilmesi
Belirlenen alternatiflerin, literatür taraması sonucu elde edilen 16 adet kriteri için puanlama, tersine lojistik ve yöneylem araştırmaları konusunda uzman öğretim üyeleri tarafından yapılmıştır. Uygulamada kullanılan veri setine ilişkin bilgiler aşağıdaki tabloda gösterilmektedir.
Tablo 2: Uygulamada Kullanılan Veriler
K1 K2 K3 K4 K5 K6 K7 K8 K9 K10 K11 K12 K13 K14 K15 K16
A1 8 6 6 7 7 6 4 9 6 5 6 7 7 5 5 4 A2 8 6 7 7 7 7 4 8 6 6 6 5 7 5 6 4 A3 9 9 9 9 9 9 9 10 9 8 8 7 7 6 7 8 4.5.Kriter Ağırlıklarının Belirlenmesi Kriter ağırlıkları, her bir kritere eşit oranda verilmiş olup değerlendirme kriterinin ağırlıklarını içeren tablo aşağıda
gösterilmiştir.

Journal of Management, Marketing and Logistics -JMML (2017), Vol.4(2), p.178-185 Koc, Uysal
_________________________________________________________________________________________________
DOI: 10.17261/Pressacademia.2017.462 183
Tablo 3: Değerlendirme Kriterlerinin Ağırlıkları
KRİTER AĞIRLIK
K1 0,0625
K2 0,0625
K3 0,0625
K4 0,0625
K5 0,0625
K6 0,0625
K7 0,0625
K8 0,0625
K9 0,0625
K10 0,0625
K11 0,0625
K12 0,0625
K13 0,0625
K14 0,0625
K15 0,0625
K16 0,0625
4.6. Bulgular
Alternatiflerin değerlendirilmesi amacıyla kullanılan ARAS sonuçları Tablo 4’de verilmiştir. Tablo 4’e göre, A3 alternatifi en yüksek fayda derecesini alarak birinci sırada, A2 alternatifi ikinci sırada ve son sırada ise A1 alternatifi yer almıştır.
Tablo 5: Optimallik Fonksiyon Değerleri ve Alternatiflerin Sıralamaları
Si Ki %Ki Sıra
OPTİMAL 0,288
A1 0,211 0,7307 73,07% 3
A2 0,213 0,7388 73,88% 2
A3 0,288 1,0000 100,00% 1
5. SONUÇ
Tersine lojistik kapsamında sektör değerlendirmesi yapılan bu çalışmada, öncelikli olarak literatürden tersine lojistik KBF araştırılmıştır. Daha sonra her bir sektör için bulunan kriterler, sektör uzmanları tarafından puanlanmıştır. Ardından kriterler için ağırlık değerleri her bir kriter için eşit olarak verilmiş ve ARAS yöntemi kullanılarak alternatifler sıralanmıştır.
ARAS yöntemi sonuçlarına göre, otomotiv sektörü tersine lojistik uygulamaları açısından ilk sırada yer almıştır. Otomotiv sektöründe ürün geri dönüşümlerinin ve bu ürünlerin yeniden kullanım için geri kazanım oranının yüksek olduğu bilinmektedir (URL 1). Ham çeliğin yaklaşık olarak %40’ı otomotiv sektöründe tüketilmektedir. Bu nedenle hurda geri kazanımı otomobiller için en önemli kaynaktır. Türkiye’de 2020 yılından itibaren ömrünü tamamlamış araçlarda yeniden kullanım ve geri kazanım oranları ortalama araç ağırlığının %95’ine, yeniden kullanım ve geri dönüşüm oranları ise ortalama araç ağırlığının en az %85’ine çıkılması hedeflenmektedir (URL 2). Bu nedenle otomotiv sektörünün tersine lojistik uygulamaları değerlendirmesinde diğer iki sektöre göre daha üst sırada yer aldığı görülmektedir.
Analiz sonuçlarına göre ikinci sırada perakende sektörü yer almıştır. Ülkemizde mevcut yasal düzenlemeler çevreyi korumak amacıyla perakendecilere görevler vermektedir. Örneğin Ambalaj Atıklarının Kontrolü Yönetmeliği çevresel açıdan uygun ambalajların üretimini, ambalaj atıklarının yarattığı kirliliğin önlenmesini, kullanılan ambalaj miktarını azaltılmasını, ambalaj atıklarının yeniden kullanım, geri dönüşüm ve geri kazanım yoluyla değerlendirilmesini ile ilgili düzenlemeleri içermektedir (URL 3). Bu nedenle analiz sonuçlarına göre perakende sektörünün ikinci sırada çıktığı görülmektedir.
Değerlendirme sonuçlarına göre son sırada tekstil sektörü yer almıştır. Türk tekstil sektörü tersine lojistik uygulamalarından yeterince yararlanamamaktadır. Tekstil teleflerinin (elyaf, iplik ve kumaş telefleri) büyük kısmı dönüşüme girmekte ve

Journal of Management, Marketing and Logistics -JMML (2017), Vol.4(2), p.178-185 Koc, Uysal
_________________________________________________________________________________________________
DOI: 10.17261/Pressacademia.2017.462 184
ekonomiye yeniden kazandırılmaktadır. Ancak kullanılmış giysilerin büyük kısmı geri dönüştürülmemekte ve yeniden işlenerek yeni ürünler haline getirilememektedir (URL 4). Be sebeple tekstil sektörü tersine lojistik uygulamaları değerlendirmesinde diğer iki sektöre göre daha alt sırada yer aldığı görülmektedir.
Gelecek çalışmalarda, farklı sektörler eklenerek değerlendirme yapılabilir ve farklı ülkelerde yapılacak çalışmalar ile tersine lojistik konusunda hangi sektörlerin öne çıktığı ortaya konulabilir.
KAYNAKLAR
Alfonso-Lizarazo, E H., Montoya-Torres, J R. & Gutierrez-Franco, E. 2013, “Modelling Reverse Logistics Prosess in the argo-industrial Sector: The Case of the Palm Oil Supply Chain”, Applied Mathematical Modelling, Vol. 37, pp.9652-9664.
Bahiraei, N., Panjehfouladgaran, H. & Yusuff R M. 2015, “Ranking of Critical Success Factors in Reverse Logistics by TOPSIS”, 2.Proceedings of the 2015 International Conference on Industrial Engineering and Operations Management Dubai, United Arab Emirates (UAE).
Bai, C. & Sarkis, J. 2013, “A Grey-Based DEMATEL Model for Evaluating Business Process Management Critical Success Factors,” Int. J. Production Economics, Vol. 146, pp. 281–292.
Barker, T J. & Zabinsky, Z B. 2011, “A Multicriteria Decisio Making Model for Reverse Logistics Using Anaytical Hiererhy Process”, Vol. 39, pp. 558-573.
Bradley, J. 2008, “Management Based Critical Success Factors in the Implementation of Enterprise Resource Planning Systems,” Int. J. Accounting Information Systems, Vol. 9, pp. 175-200.
Carter, C R. & Ellram, L M. 1998, “Reverse Logistics: A Review of the Literature and Framework for Future Investigation”, Journal of Business Logistics, Vol. 19 (1), pp. 85-102.
Cheng, C. C. J. & Shiu, E. C. 2008, “Critical Success Factors of New Product Development in Taiwan’s Electronics Industry,” Asia Pacific Journal of Marketing and Logistics, Vol. 20, pp.174-189.
Cullen, J., Tsamenyi, M., Bernon, M. & Gorst, J. 2013, “Reverse Logistics in the UK Retail Sector: A CAse Study of the Role of Management Accounting in driving Organisation Change”, Management Accounting Research, Vol. 24, pp. 212-227.
Dinter, B. 2013, “Success Factors for Information Logistics Strategy- An Emprical Investigation”, Decision support systems, Vol. 54, pp. 1207-1218.
Fleischmann, M., Bloemhof-Ruwaard, J M., Dekker R, Laan, E., Nunen, J A E E. & Wassenhove, L N V. 1997, “Quantitative models for reverse logistics: A review”, European Journal of Operational Rcsearch, Vol. 103, pp. 1-17.
.Kim, J. & Rhee, J. 2012, “An Empirical Study on the Impact of Critical Success Factors on the Balanced Scorecard Performance in Korean Green Supply Chain Management Enterprises” Int. J. Production Research, Vol. 50, pp. 2465–2483.
Koh, S C L., Gunasekaran, A. & Goodman, T. 2011, “Drivers, Barriers and Critical Success Factors for ERPII Implementation in Supply Chains: A Critical Analysis,” J. Strategic Information Systems, Vol. 20, pp. 385-402.
Lam, K L. & Chin, K S. 2005. “Identifying and Prioritizing Critical Success Factors for Conflict Management in Collaborative New Product Development,” Industrial Marketing Management, Vol. 34, pp. 761-772.
Mutha, A. & Pokharel, S. 2009. “Strategic Network Desing for Reverse Logistics and Remanufacturing Using New and Old Product Modules”, Computers and Engineering, vol. 56, pp. 334-346.
Pal, R., ve Torstensson, H. (2011), “Aligning Critical Success Factors to Organizational Design: A Study of Swedish Textile and Clothing Firms” Business Process Management Journal, Vol. 17, pp. 403-436.
Pettit, S. ve Beresford, A. (2009), “Critical Success Factors in the Context of Humanitarian Aid Supply Chains,” Int. J. of Physical Distribution and Logistics Management, Vol. 39 (6), pp. 450-468.
Rahman, S. ve Subramanian, N. (2012), “Factors for Implementing end-of-life Computer recycling Operations in Reverse Supply Chains”, Int. J. Production Economics, Vol. 140, pp. 239-248.
Salaheldin, S I. (2009), “Critical Success Factors for TQM Implementation and Their Impact on Performance of SMEs,” Int. J. Productivity and Performance Management, Vol. 58, pp. 215-237.
Srivastava, S K. (2008), “Network Desing for Reverse Logistics”, The International Journal of Management Science, Vol. 36, pp. 535-548.
Tibben-Lembke, R S. (2002), “Life After Death: reverse Logistics and the Product Life Cycle”, International Journal of Physical Distribution and Logistics Management, Vol. 32 (3), pp. 223-244).
Trkman, P. (2010), “The Critical Success Factors of Business Process Management,” Int. J. of Information Management, Vol. 30, pp. 125–134.

Journal of Management, Marketing and Logistics -JMML (2017), Vol.4(2), p.178-185 Koc, Uysal
_________________________________________________________________________________________________
DOI: 10.17261/Pressacademia.2017.462 185
URL 1, http://www.lojistikhatti.com/haber/2012/09/tersine-lojistik, 09.03.2017.
URL 2, http://mmfdergi.uludag.edu.tr/article/viewFile/5000083252/5000077378, 09.03.2017.
URL 3, http://www.csb.gov.tr/gm/cygm/index.php?Sayfa=sayfa&Tur=webmenu&Id=266, 09.03.2017.
URL4,http://docplayer.biz.tr/3879864-Turk-tekstil-ve-hazır-giyim-sektorunde-tersine-lojistigin-uygulama-olanakları html, 09.03.2017.
Yıldırım, B F. (2015), “Çok Kriterli Karar Verme Problemlerinde ARAS Yöntemi”, Kafkas Üniversitesi İktisadi ve İdari Bilimler Fakültesi Dergisi, Vol. 6 (9), pp. 285-296.
Zavadskas, E K., Turskis, Z. ve Vilutiene, T. (2010), “Multiple Criteria Analysis of Foundation Instalment Alternatives by Applying Additive Ratio Assessment (ARAS) Method”, Archives of Civil and Mechanical Engineering, Vol. 10 (3), pp. 123-141.
Zavadskas, E K. ve Turskis, Z. (2010), “A New Additive Ratio Assessment (ARAS) Method in Multicriteria decision‐making”, Technological and Economic Development of Economy, Vol. 16 (2), pp. 159-172.
Zhou, Q., Huang, W. ve Zhang Y. (2011), “Identifiing Critical Success Factors in Emergency Management Using a Fuzzy DEMATEL Method”, Safety Science, Vol. 49, pp. 243-252.
Zou, W., Kumaraswamy, M., Chung, J. ve Wong, J. (2014), “Identification the Critical Success Factors for Relationship Management in PPP Projects”, International Journal of Project Management, Vol. 32, pp. 265-274.

Journal of Management, Marketing and Logistics -JMML (2017), Vol.4(2), p.186-201 Ayrim, Can
_________________________________________________________________________________________________
DOI: 10.17261/Pressacademia.2017.463 186
PRIORITIZATION OF FAILURE MODES IN FOOD LOGISTIC PROCESS WITH A FUZZY APPROACH DOI: 10.17261/Pressacademia.2017.463 JMML- V.4-ISS.2-2017(12)-p.186-201 Yelda Ayrim
1, Gulin Feryal Can
2
1Başkent University, Faculty of Engineering, Industrial Engineering Department, Ankara, Turkey. [email protected] 2Başkent University, Faculty of Engineering, Industrial Engineering Department, Ankara, Turkey. [email protected]
_________________________________________________________________________________________________________________
To cite this document Ayrim Y.and G.F.Can, (2017). Prioritization of failure modes in food logistic process with a fuzzy approach. Journal of Management, Marketing and Logistics (JMML), V.4, Iss.2, p.186-201. Permemant link to this document: http://doi.org/10.17261/Pressacademia.2017.463 Copyright: Published by PressAcademia and limited licenced re-use rights only.
ABSTRACT Purpose- Food logistics include food transfer activities that transport dry food, beverage and canned products etc. at any time, to
anywhere and without any damage by transport companies using special equipment and expert staff support. Unless the required
sensitivity for food logistics interacting with human health is not shown, it may result in situations that can damage human health and even
cause death. Accordingly, it is very important to determine the failures that may arise from the beginning and to determine the risk levels
related to these failures and take precautions related to these failures. In this way, failure costs and customer complaints that may occur
after delivery can be reduced.
Methodology- In this study, Failure Modes and Effects Analysis (FMEA) were used to determine the failures that may be encountered in
food logistics and the risk levels associated with these failures. In this context considering disadvantages of traditional FMEA, weights of the
risk factors related to the failure modes are determined by using Fuzzy DEMATEL (Decision Making Trial and Evaluation Laboratory) and
these failure modes are prioritized by implementing Fuzzy WASPAS (Weighted Aggregated Sum Product Assessment). In addition, for
identifying the consistency of failure modes ranking, comparison study is realized.
Findings- As a result of the study, it is determined that to perform regular maintenance and calibration of vehicle coolers failure mode has
the first priority. Also, as a result of the comparison analysis, it is proved by the Sperman Rank Correlation Coefficient values that the
proposed approach can produce consistent results.
Conclusion- In real life, the transportation of foods in the condition that will not threaten human health and provide required
environmental conditions has a great importance in the food logistics. Among these conditions the fact that, the unsuitable environment
temperature for the transported food is one of the most important problems in terms of deterioration of sensitive foods. Degraded food
during transport will bring health problems when they are consumed by people and will cause high cost of products and loss of customers
for the logistics firm.
Keywords: Multi criteria decision making, FMEA, food logistics, fuzzy DEMATEL, fuzzy WASPAS.
JEL Codes: D81, L87, L91
GIDA LOJİSTİĞİ SÜRECİNDE HATA TÜRLERİNİN BULANIK BİR YAKLAŞIMLA ÖNCELİKLENDİRİLMESİ __________________________________________________________________________________
ÖZET Amaç- Gıda lojistiği, nakliye firmalarının özel ekipman kullanarak ve uzman personel desteği ile kuru gıda, içecek ve konserve gibi ürünleri
istenilen yere, istenilen zamanda ve gıdaya herhangi bir zarar vermeden ulaştırma faaliyetlerini kapsamaktadır. İnsan sağlığı ile etkileşim
halinde olan gıda lojistiğinde gerekli hassasiyet gösterilmediği takdirde insan sağlığına zarar verecek ve hatta ölümle sonuçlanabilecek
durumlar ortaya çıkabilecektir. Buna göre yönetilen bu süreçte baştan oluşabilecek hataların tespit edilmesi, bu hatalara ilişkin risk
seviyelerinin belirlenmesi ve önlemlerin alınması oldukça önemlidir. Bu şekilde, hata maliyetleri ile teslim sonrasında oluşabilecek müşteri
şikâyetleri azaltılabilecektir.
Year: 2017 Volume: 4 Issue: 2
Journal of Management, Marketing and Logistics – (JMML), ISSN: 2148-6670, http://www.pressacademia.org/journals/jmml

Journal of Management, Marketing and Logistics -JMML (2017), Vol.4(2), p.186-201 Ayrim, Can
_________________________________________________________________________________________________
DOI: 10.17261/Pressacademia.2017.463 187
Yöntem- Bu çalışmada gıda lojistiğinde karşılaşılabilecek hataların ve bu hatalara bağlı risk düzeylerinin tespiti için Hata Türleri ve Etkileri
Analizi (HTEA) kullanılmıştır. Bu kapsamda, geleneksel HTEA’nın geliştirilmesi gereken yönleri de dikkate alınarak belirlenen hata türlerine
ilişkin risk faktörlerinin ağırlıkları Bulanık DEMATEL (Decision Making Trial and Evaluation Laboratory) yöntemi ile elde edilmiş ve Bulanık
WASPAS (Weighted Aggregated Sum Product Assessment) ile bu hatalar önceliklendirilmiştir. Ayrıca hata türlerine ilişkin elde edilen
sıralamaların tutarlılığının belirlenmesi için karşılaştırma analizi gerçekleştirilmiştir.
Bulgular- Çalışma sonucunda, araç soğutucularının düzenli bakım ve kalibrasyonunun yapılmaması hata türünün birinci önceliğe sahip
olduğu belirlenmiştir. Yapılan karşılaştırma analizi sonucunda ise önerilen yaklaşımın tutarlı sonuçlar ürettiği Sperman Sıra Korelasyonu
katsayısı değerleriyle kanıtlanmıştır.
Sonuç- Gerçek hayatta da gıda lojistiğinde insan sağlığını tehdit etmeyecek şekilde, gerekli ortam koşulları sağlanarak gıdaların taşınması
büyük önem arz etmektedir. Bu koşullar arasında, ortam sıcaklığının taşınan gıdaya uygun olmaması hassas gıdaların bozulabilmesi
açısından en önemli problemlerden birisidir. Taşıma süresince bozulan gıdalar insanlar tarafından tüketildiklerinde sağlık problemlerini de
beraberinde getirecek ve lojistik firması için de yüksek bozulan ürün maliyetlerine, müşteri kaybına sebep olacaktır.
Anahtar Kelimeler: Çok kriterli karar verme, FMEA, gıda lojistiği, bulanık DEMATEL, bulanık WASPAS.
JEL Kodları: D81, L87, L91
1. GİRİŞ
Gıda lojistiği, nakliye firmalarının kuru gıda, içecek ve konserve gibi ürünleri belirli sıcaklık ve hijyen koşullarında istenilen yere, istenilen zamanda ulaştırılması işlemidir. Bu işlem, özel ekipman ve bilgi sahibi personel gerektirmektedir. Gıda lojistiği, insan sağlığı ile birebir etkileşimde olan bir faaliyet olduğu için taşıma esnasında gösterilmesi gereken hassasiyet diğer taşıma faaliyetlerine göre üst düzeydedir. Taşıma esnasında gıda malzemelerinin ezilmemesi, ambalajların hasar görmemesi için titiz ve özenli bir nakliye işleminin gerçekleştirilmesi önemlidir.
Gıda lojistiğinde, taşınacak ürünlerin açık bir şekilde tanımlanması, düzenli sıcaklık, nem ve hijyen kontrollerinin yapılması, ürüne uygun depolama işlemlerinin gerçekleştirilmesine dikkat edilmelidir. Paketlemede kullanılan ambalaj malzemelerinin de birinci sınıf kaliteye sahip olması gereklidir. Ayrıca, gıda nakliyesinin son aşamasında kullanılan soğuk hava depoları da ürüne uygun olarak seçilmelidir. Bununla birlikte, ürünlere ilişkin taşıma ve saklama koşulları konunun uzmanları tarafından önceden belirlenerek planlanmalıdır. Bu kurallara önem verilmediği zaman, zehirlenmeler hatta ölümler gibi insan sağlığını tehdit eden durumlar yaşanabilir. Taşıma ve depolama öncesi planlamaların yapılmadığı durumlarda ise ürün kaybı ortaya çıkabilir. Bu durum, müşteri ve ülke ekonomisi kapsamında kayıplara yol açabilir.
Gıda lojistiğinde amaç, ürünleri taşımak ve depolamak olduğu kadar balık, et, süt gibi kısa ömürlü ürünlerin rafa en kısa zamanda ulaştırılmasını sağlamaktır. Burada performans ölçütü, soğuk raflarda en uzun süre kalabilecek şekilde taşınabilen bir ürünü elde etmektir. Bu şekilde ürünlerin yenilerini rafa koyma süresi uzayacaktır.
Türkiye’de gıda lojistiğinin büyük bir bölümü karayolu ile gerçekleştirilmektedir. Sektör, çok güçlü bir lojistik ağa ve teknolojisine sahip olmasına rağmen soğuk hava sistemlerini gerektiren araçların ve depoların eksikliğinin sıkıntısını yaşamaktadır. Gıda sektörünün büyümesi ve talebin artmasıyla gıda üretiminin en temel sorunları olan gıdaların bozulması, kalite kaybının önlenmesi ve tüketici sağlığını tehdit etmeyecek ürünlerin tüketiciye ulaştırılması için gerekli faaliyetler üzerinde önemle durulmaktadır.
Bu çalışmada, HTEA kullanılarak gıda lojistiğinde ortaya çıkabilecek hataların belirlenmesi amaçlanmıştır. HTEA, ürünlerin ve proseslerin geliştirilmesinde öncelikli olarak hata riskinin ortadan kaldırılmasına odaklanan sezgisel bir yaklaşımdır. HTEA, meydana gelebilecek hataları önceden tahmin ederek önlemeye çalışan ve meydana gelebilecek problemlerin son müşteriye olan etkilerini, analiz eden güçlü bir tekniktir. HTEA’da bir sisteme, ürüne veya hizmete yönelik ortaya çıkabilecek hata türlerine ilişkin risk seviyeleri farklı risk faktörlerine bağlı olarak değişmektedir. Bu risk faktörleri, çok kriterli karar verme (ÇKKV) yapısına göre kriterleri oluşturur. Hata türleri ise alternatifleri tanımlar. Kriterlerin hata türlerine göre değerlendirilmesi ve hata türlerinin etkilerinin belirlenmesi konunun uzmanları tarafından gerçekleştirilir. Bu kapsamda, HTEA yaklaşımı ÇKKV problemi yapısına sahiptir. Çalışmada, HTEA yaklaşımı temel alınarak Decision Making Trial and Evaluation Laboratory (DEMATEL) ve Weighted Aggregated Sum Product Assessment (WASPAS) yöntemlerinin uygulanmasıyla gıda lojistiğinde ortaya çıkabilecek hata türleri ve bu hata türlerine ilişkin risk seviyeleri belirlenmiştir. DEMATEL 1972 ve 1976 yılları arasında Cenevre Battelle Memorial Enstitüsü, Bilim ve İnsan İlişkileri programı tarafından geliştirilmiştir (Fontela ve Gabus, 1974). Yöntem graf teori temelli olup kriterler arasındaki nedensel ilişkiyi modellemekte ve kriterleri sebep ve sonuç gruplarına bölebilmektedir (Li ve Tzeng, 2009). DEMATEL, kriterlerin birbirleri üzerindeki etkilerini dikkate alarak öncelik sıralarını belirlemektedir. Etkisi en yüksek olan kriter, en yüksek önceliğe sahiptir ve bu tür kriterler

Journal of Management, Marketing and Logistics -JMML (2017), Vol.4(2), p.186-201 Ayrim, Can
_________________________________________________________________________________________________
DOI: 10.17261/Pressacademia.2017.463 188
sebep kriterleri olarak ifade edilir. Etkisi düşük olan kriterler düşük önceliği olan kriterlerdir ve bu tür kriterler sonuç kriterleri olarak tanımlanır (Tseng ve Lin, 2008). 2004 yılında Chakraborty ve Zavadskas tarafından geliştirilen WASPAS yöntemi Ağırlıklı Toplam Modeli (Weighted Sum Model-WSM) ile Ağırlıklı Çarpım Modeli (Weighted Product Model-WPM) olmak üzere iki farklı modelin sonuçlarını birleştiren bir ÇKKV yaklaşımıdır. Yöntemde söz konusu iki model kullanılarak birleşik optimallik kriterinin değeri hesaplanmakta ve bu değer alternatiflerin sıralamasında kullanılmaktadır. WASPAS işleyiş prosedürü içerisinde duyarlılık analizini de gerçekleştirebilen ve bu sayede alternatif sıralamalarındaki tutarlığı kontrol edebilen bir yöntemdir (Chakraborty ve Zavadskas, 2014).
2. LİTERATÜR ARAŞTIRMASI
Bu bölümde, son yıllarda literatürde HTEA, DEMATEL ve WASPAS yöntemleri kullanılarak yapılan çalışmalara yer verilmiştir.
Literatürde, HTEA’nin farklı ÇKKV yöntemleri ile birlikte kullanıldığı görülmektedir. Chang (2009), ağırlıklandılmış geometrik ortalama operatörü ve DEMATEL kullanarak ürün HTEA uygulayarak hata türlerini önceliklendirmiştir. Abdelgawad ve Fayek (2010), inşaat sektöründe oluşabilecek risklerin değerlendirmesinde bulanık AHP kullanarak hata türlerine ilişkin sıralamayı elde etmişlerdir. Zammori ve Gabbrielli (2011), hataların önceliklendirilmesi için hiyerarşik yapıya dayalı ANP yöntemiyle Risk Öncelik Puanını (RÖP) hesaplamışlardır. Emovon vd. (2015), deniz makinesi sistemlerinde oluşabilecek hataları VIKOR (VIšekriterijumsko KOmpromisno Rangiranje) tekniği ile önceliklendirerek uzlaşık programlama ve TOPSIS (Technique For Order Preference By Similarity To An Ideal Solution) ile elde edilen çözümleri karşılaştırmışlardır.
Literatürde DEMATEL kullanılarak yapılan çalışmalara bakıldığında bir çok karar probleminde kriter ağırlıklarının belirlenmesi amacıyla yöntemin uygulandığı görülmektedir. Chang vd., (2011) çalışmalarında, tedarikçi seçiminde etkili olan anahtar faktörleri belirlemek için bulanık DEMATEL yöntemini uygulamışlardır. Wu (2012), başarılı bir bilgi yönetimi uygulaması için kritik faktörlerin ortaya konulması amacıyla bulanık DEMATEL yöntemini önermiştir. Tsai vd.(2015) devre kartları üretiminin çevresel performansını incelemişlerdir ve çevresel performans kriterleri arasındaki etkileşimin yönünü ve seviyesini değerlendirebilmek için bulanık DEMATEL yaklaşımını kullanmışlardır. Akyüz ve Çelik (2015) ham petrol tanker gemilerinde gaz boşaltma işlemi sırasında oluşabilecek tehlike kaynakları arasındaki nedensellik ilişkilerini belirlemek için bulanık DEMATEL kullanmıştır.
WASPAS yöntemi kullanılarak gerçekleştirilen çalışmalarda da farklı karar problemlerinin ele alındığı literatürden görülmektedir. Zolfani (2013), kurulması planlanan bir alışveriş merkezi için yer seçiminde Step-wise Weight Assessment Ratio Analysis (SWARA) yöntemini yer seçimi kriterlerinin ağırlıklandırmasında, WASPAS yöntemini ise alternatif yerlerin sıralanmasında kullanmıştır. Vafaeipour vd. (2014) güneş enerjisi projesinin uygulanmasına ilişkin bölge seçiminde SWARA ve WASPAS yöntemlerini uygulamışlardır. Chakraborty ve Zavadskas (2014) tarafından imalat kararlarının önceliklendirilmesinde WASPAS kullanılmıştır. Bitarafan vd. (2014) tarafından sensör alternatiflerinin seçiminde SWARA-WASPAS yaklaşımları uygulanmıştır. Zavadskas vd. (2014) tarafından aralık değerli sezgisel bulanık sayılar (interval-valued intuitionistic fuzzy numbers) kullanılarak terk edilmiş yapıların renovasyon önceliklerinin belirlenmesinde WASPAS uygulanmıştır. Ayrıca, esnek imalat sistemi seçimi, esnek hücresel imalat için makine seçimi, AGV seçimi, otomatik kontrol sistemi seçimi ve endüstriyel robot seçimi gibi karar problemlerinde de WASPAS kullanılmıştır (Chakraborty vd., 2015). Bulanık WASPAS (WASPAS-F) ve Bulanık Analitik Hiyerarşi Prosesi (FAHP) yaklaşımları Turskis vd. (2015) tarafından alışveriş merkezi yer seçiminde kullanılmıştır. Zavadskas vd. (2015) tarafından Gri WASPAS (Waspas Gray-WASPAS-G) inşaat projelerinde doğru yüklenici seçimi için uygulanmıştır.
3. HATA TÜRÜ VE ETKİLERİ ANALİZİ (HTEA)
HTEA, en yaygın kullanılan risk değerlendirme yöntemlerinden birisidir. 1960’lı yıllarda uzay endüstrisinde tasarım metodolojisi olarak geliştirilmiştir. HTEA, bilinen veya potansiyel hataların sebeplerini, sistemde veya son kullanıcıda söz konusu hataların oluşturabileceği etkileri dikkate alarak hatalarla ilişkili risklerin değerlendirilmesi ve bunların önlenebilmesi için öncelik sırasının belirlenmesi amacıyla geliştirilmiş sistematik bir yaklaşımdır. HTEA; bir sistemin potansiyel hata türlerini analiz etmek için hataları risk dereceleri açısından benzerliklerine göre sınıflandıran bir ürün geliştirme ve operasyon yönetim yaklaşımıdır. HTEA’nde amaçlanan hataları önceden tanımlayarak gerekli önlemleri almak ve tasarım aşamasından itibaren hataların olası nedenlerini belirlemektir (Chang KH., 2009).
HTEA’nde, alanında uzman bir ekip kurularak üründe veya sistemde ortaya çıkabilecek tüm olası hata türleri tanımlanır. Bu hata türleri olasılık, şiddet ve fark edilebilirlik risk faktörleri dikkate alınarak hata türlerine ait RÖP Eşitlik (1) ‘deki gibi hesaplanır.
𝑅Ö𝑃 = 𝑂 ∗ Ş ∗ 𝐹 (1)
Burada;
𝑂: Her bir hata türünün oluşma olasılığı,

Journal of Management, Marketing and Logistics -JMML (2017), Vol.4(2), p.186-201 Ayrim, Can
_________________________________________________________________________________________________
DOI: 10.17261/Pressacademia.2017.463 189
Ş: Her bir hata türünün şiddet değeri,
𝐹: Her bir hata türünün farkedilebilirlik değeridir.
RÖP değerlerine göre hata türleri ve bunlara ilişkin alınacak önlemler sıralanır. RÖP hesaplamasında olasılık, şiddet ve fark edilebilirlik risk faktörleri için kullanılan skalalar sırasıyla Tablo 1, Tablo 2 ve Tablo 3’te verimiştir.
Tablo 1: Olasılık İçin Kullanılan Değerlendirme Skalası
HATA OLASILIĞI HATA KÜMÜLATİF SAYISI DERECE
Aşırı Derecede Yüksek: Kaçınılmaz Hata ½’den fazla 10
Çok Yüksek 1/3 9
Tekrarlanan Hata 1/8 8
Yüksek 1/20 7
Kısmen Orta 1/80 6
Orta 1/400 5
Nispeten Az 1/2000 4
Az 1/15000 3
Çok Az 1/150000 2
Olası Olmayan Hata 1/1500000’den düşük 1
Tablo 2: Şiddet İçin Kullanılan Değerlendirme Skalası
ETKİ ŞİDDETİN ETKİSİ DERECE
Uyarısız Gelen Tehlike Felakete yol açabilecek etkiye sahip ve uyarısız gelen
potansiyel hata
10
Uyarısız Gelen Tehlike Yüksek hasara ve toplu ölümlere yol açabilecek etkiye sahip
ve uyarısız gelen potansiyel hata
9
Çok Yüksek Sistemin tamamen hasar görmesini sağlayan yıkıcı etkiye
sahip ağır yaralanmalara, 3.derece yanık, akut, ölüm vb.
etkiye sahip hata
8
Yüksek Ekipmanı tamamen hasar görmesine sebep olan ve ölüme,
zehirlenme, 3.derece yanık, akut ölümcül hastalık vb. etkiye
sahip hata
7
Orta Sistemin performansını etkileyen, uzuv ve organ kaybı, ağır
yaralanma, kanser vb. yol açan hata
6
Düşük Kırık, kalıcı küçük iş görmemezlik, 2.derece yanık, beyin
sarsıntısı vb. etkiye sahip hata
5
Çok Düşük İncinme, küçük kesik ve sıyrıklar, ezilmeler vb. hafif
yaralanmalar ile kısa süreli rahatsızlıklara neden olan hata
4
Küçük Sistemin çalışmasını yavaşlatan hata 3
Çok Küçük Sistemin çalışmasında kargaşaya yol açan hata 2
Yok Etki yok 1

Journal of Management, Marketing and Logistics -JMML (2017), Vol.4(2), p.186-201 Ayrim, Can
_________________________________________________________________________________________________
DOI: 10.17261/Pressacademia.2017.463 190
Tablo 3: Fark Edilebilirlik İçin Kullanılan Değerlendirme Skalası
Bununla birlikte, geleneksel HTEA prosedürünün geliştirilmesi gereken birçok yönü bulunmaktadır. Geleneksel HTEA’da sadece olasılık, şiddet ve fark edilebilirlik faktörleri dikkate alınarak hata türlerine ilişkin RÖP’nın hesaplanması, bu üç faktörün de aynı öneme sahip olduğunun varsayılması, bu faktörlere ait skala değerlerinin farklı olduğu durumlarda dahi aynı RÖP’larının elde edilmesi, RÖP hesabı için değişimlere fazlasıyla duyarlı olan matematiksel çarpım işleminin kullanılması ve risk faktörleri arasındaki ilişkilerin göz ardı edilmesi zayıf yönlere örnek olarak verilebilir. Bununla birlikte, üç risk faktörü için de önceden kesin bir değerlendirme yapılmasının zor olmasına rağmen faktöler için kullanılan skalaların kesin değerler içermesi geleneksel HTEA’nin güvenilirliğini azaltmaktadır.
4.BULANIK MANTIK
Bulanık mantık, 1965 yılında Lotfi A. Zadeh tarafından ortaya atılmıştır. Tam veya kesin olmayan, belirsizlik içeren bilgilere dayanarak tutarlı ve doğru kararlar vermeyi sağlayan ve bu tür bilgileri işleyerek sayısal bir şekilde modelleyebilen sisteme bulanık mantık adı verilmektedir (Allahverdi, 2002). Gerçek hayatta insan kararları belirsizlik içermektedir ve kesin sayısal değerlerle ifade edilebilmesi zordur. Bu nedenle insan kararlarını modellemede sözel değişkenleri kullanmak gerçeğe daha yakın değerlendirmeleri de beraberinde getirecektir. Bu açıdan bulanık mantık ile karar süreçlerinin entegrasyonu önem taşımaktadır (Li ve Yang, 2004).
4.1.Bulanık Küme
Bulanık küme, her bir elemanın 0 ile 1 arasında değişen ve kümeye ait olma derecesini gösteren üyelik fonksiyonu ile
nitelendirmektedir (Zadeh, 1965). Burada, 𝐸 evrensel kümesinde tanımlanan bulanık küme ��’ya ait üyelik fonksiyonu 𝜇𝐴;
𝜇𝐴: 𝐸 → [0,1] olarak ifade edilir. ��’nın herhangi bir elemanı olan 𝑥 için üyelik derecesi Eşitlik (2)’deki gibi tanımlanır.
�� = {(𝑥, 𝜇𝐴(𝑥))|𝑥 ∈ 𝐸} (2)
𝜇𝐴 , [0,1] kapalı aralığında gerçek bir sayı olmakla birlikte; ‘0’ değeri ilgili elemanın kümenin üyesi olmadığını, ‘1’ değeri ilgili elemanın kümenin tam üyesi olduğunu gösterir. Eğer 0 < 𝜇𝐴 < 1 ise, bu değer ilgili elemanın kümeye kısmi üyeliğini belirtir (Zadeh, 1975).
FARK EDİLEBİLİRLİK FARK EDİLEBİLİRLİK OLASILIĞI DERECE
Tespit edilemez Olası hatanın nedeninin ve takip eden hatanın
kesfedilebilirliği mümkün değil
10
Çok Az Olası hatanın nedeninin ve takip eden hatanın
keşfedilebilirliği çok uzak
9
Az Olası hatanın nedeninin ve takip eden hatanın
keşfedilebilirliği uzak
8
Çok Düşük Olası hatanın nedeninin ve takip eden hatanın
keşfedilebilirliği çok düşük
7
Düşük Olası hatanın nedeninin ve takip eden hatanın
keşfedilebilirliği düşük
6
Orta Olası hatanın nedeninin ve takip eden hatanın
keşfedilebilirliği çok orta
5
Yüksek Ortalama Olası hatanın nedeninin ve takip eden hatanın
keşfedilebilirliği yüksek ortalama
4
Yüksek Olası hatanın nedeninin ve takip eden hatanın
keşfedilebilirliği yüksek
3
Çok Yüksek Olası hatanın nedeninin ve takip eden hatanın
keşfedilebilirliği çok yüksek
2
Hemen Hemen Kesin Olası hatanın nedeninin ve takip eden hatanın
keşfedilebilirliği hemen hemen kesin
1

Journal of Management, Marketing and Logistics -JMML (2017), Vol.4(2), p.186-201 Ayrim, Can
_________________________________________________________________________________________________
DOI: 10.17261/Pressacademia.2017.463 191
4.2.Üçgensel Bulanık Sayı
Bulanık sayıların özel bir çeşidi olan üçgensel bulanık sayı, 𝑎1, 𝑎2, 𝑎3 olmak üzere üç tane gerçek sayıdan oluşan parametre ile tanımlanır. Bu parametreler sırasıyla en küçük olası değeri, en olası değeri ve en büyük olası değeri ifade eder.
�� = (𝑎1, 𝑎2, 𝑎3) üçgensel bulanık bir sayı olmak üzere, üyelik fonksiyonu Eşitlik (3)’teki gibi tanımlanır.
𝜇𝐴(𝑥) =
(
0, 𝑥 < 𝑎1(𝑥−𝑎1)
(𝑎2−𝑎1), 𝑎1 ≤ 𝑥 ≤ 𝑎2
(𝑎3−𝑥)
(𝑎3−𝑎2), 𝑎2 ≤ 𝑥 ≤ 𝑎3
0, 𝑥 > 𝑎3 )
(3)
�� = (𝑎1, 𝑎2, 𝑎3) ve �� = (𝑏1, 𝑏2, 𝑏3) iki pozitif bulanık sayı olmak üzere aşağıda verilen aritmetik işlemler gerçekleştirilebilir (Li ve Yang, 2004).
�� + �� = (𝑎1 + 𝑏1, 𝑎2 + 𝑏2, 𝑎3 + 𝑏3) (4)
�� − �� = (𝑎1 − 𝑏3, 𝑎2 − 𝑏2, 𝑎3 − 𝑏1) (5)
�� × �� = (𝑎1𝑏1, 𝑎2𝑏2, 𝑎3𝑏3) (6)
�� × 𝑘 = (𝑎1𝑘, 𝑎2𝑘, 𝑎3𝑘) (7)
�� ÷ �� = (𝑎1/𝑏3, 𝑎2/𝑏2, 𝑎3/𝑏1) (8)
��−1 ≈ (1
𝑎3,
1
𝑎2,
1
𝑎1) (9)
5.ÖNERİLEN YAKLAŞIM
Çalışmada geleneksel HTEA’nın geliştirilmesi gereken yönleri dikkate alınarak; DEMATEL ve WASPAS yöntemlerinin kullanılmasıyla oluşturulan iki aşamalı bir yaklaşım önerilmiştir. Birinci aşamada, Bulanık DEMATEL yöntemi uygulanılarak kriter önem ağırlıkları, kriterler arasındaki ilişkiler gözetilerek belirlenmiştir. İkinci aşamada ise Bulanık WASPAS yöntemi uygulanarak hata türlerine ilişkin öncelik sıralaması elde edilmiştir. Önerilen yaklaşıma ait adımlar aşağıda verilmiştir.
Adım 1: Kriterleri etkileşim düzeylerine göre değerlendir.
𝑙 adet karar verici 𝐾𝑉𝑘; (𝑘 = 1,… , 𝑙), 𝑛 adet kriteri 𝐾𝑗; (𝑗 = 1,… , 𝑛) Tablo 4 ile verilen Bulanık Etki Skalasını kullanarak
değerlendirir. Bu değerlendirme sonucunda her bir 𝐾𝑉𝑘 için Bulanık Direkt İlişki Matrisi ��𝑘 Eşitlik (10)’daki gibi elde edilir ve
𝑝𝑖��𝑘 = (𝑎𝑖𝑗1, 𝑎𝑖𝑗2, 𝑎𝑖𝑗3) üçgensel bulanık sayısı, 𝐾𝑉𝑘tarafından belirlenen 𝑖. faktörün 𝑗. faktörü etkileme düzeyini gösterir.
Tablo 4: Bulanık Etki Skalası
Puan Tanım TFN
1 Etkisiz (E) 0,00 0,00 0,25
2 Düşük Etki (DE) 0,00 0,25 0,50
3 Orta Etki (OE) 0,25 0,50 0,75
4 Yüksek Etki (YE) 0,50 0,75 1,00
5 Çok Yüksek Etki (ÇYE) 0,75 1,00 1,00
��𝑘 =
𝐶1
𝐶2
𝐶3
⋮𝐶𝑛
[ 𝑝11
𝑘 𝑝12𝑘
𝑝31𝑘 … 𝑝1��
𝑘
𝑝21𝑘 𝑝22
𝑘𝑝32
𝑘 … 𝑝2��𝑘
𝑝31𝑘 𝑝32
𝑘𝑝33
𝑘 … 𝑝3��𝑘
⋮ ⋮ ⋮ ⋱ ⋮
𝑝𝑛1𝑘 𝑝𝑛2
𝑘𝑝𝑛3
𝑘 … 𝑝𝑛��𝑘]
(10)

Journal of Management, Marketing and Logistics -JMML (2017), Vol.4(2), p.186-201 Ayrim, Can
_________________________________________________________________________________________________
DOI: 10.17261/Pressacademia.2017.463 192
Adım 2: Birleştirilmiş Direkt İlişki Matrisini oluştur.
Her bir 𝐾𝑉𝑘 için oluşturulan ��𝑘, Eşitlik (11)’de verilen Bulanık Ağırlıklandırılmış Geometrik Ortalama (Fuzzy Weighted
Geometric Mean-FWGM) operatörü kullanılarak birleştirilir ve Birleştirilmiş Direkt İlişki Matrisi �� Eşitlik (12)’deki gibi elde edilir (Rituparna vd., 2011).
𝑝𝑖�� = ∏ 𝑝𝑖��𝑘
𝛼𝑘∑ 𝛼𝑘
𝑛𝑗=1
⁄𝑛𝑖=1 (11)
Burada,
𝛼𝑘 = (𝛼𝑘1, 𝛼𝑘2, 𝛼𝑘3) 𝑘. 𝐾𝑉’ye deneyimine dayalı olarak atanan bulanık önem ağırlığını gösterir. Her bir 𝐾𝑉 için önem ağırlığı Tablo 5 kullanılarak belirlenir.
�� =
𝐾1
𝐾2
𝐾3
⋮𝐾𝑛 [
𝑝11 𝑝12 𝑝13 … 𝑝1𝑛
𝑝21 𝑝22 𝑝23 … 𝑝2𝑛
𝑝31 𝑝32 𝑝33 … 𝑝3𝑛
⋮ ⋮ ⋮ ⋱ ⋮
𝑝𝑚1 𝑝𝑚2 𝑝𝑚3 … 𝑝𝑚𝑛]
(12)
Tablo 5. Karar Verici Önem Ağırlıkları
Puan Tanım TFN
1 Deneyimsiz 0,00 0,00 0,25
2 1–5 yıl 0,00 0,25 0,50
3 5-10 yıl 0,25 0,50 0,75
4 10-15 yıl 0,50 0,75 1,00
5 15 yıldan fazla 0,75 1,00 1,00
𝛼𝑘 Eşitlik (13)’deki gibi durulaştırılarak 𝛼𝑘𝑑𝑒𝑓elde edilir ve kriter önem ağırlıklarının elde edilmesi sürecinde kullanılır.
𝛼𝑘𝑑𝑒𝑓 =1
4(𝛼𝑘1 + 2𝛼𝑘2 + 𝛼𝑘3) (13)
Adım 3: Normalize direkt ilişki matrisini oluştur.
[��]’de yer alan bütün 𝑎𝑖𝑗1, 𝑎𝑖𝑗2, 𝑎𝑖𝑗3’ler için Eşitlik (14) kullanılarak sütun toplamı alınır. Sütun toplamları arasından en
büyüğü seçilir ve bu değer 𝑟 olarak ifade edilir. Daha sonra [��]’nin bütün elemanları Eşitlik (15)’deki gibi 𝑟’ye bölünür ve
Normalize Direk İlişki Matrisi 𝑍 = [𝑧𝑖��]𝑛×𝑛 elde edilir.
𝑟 = max1≤𝑖≤𝑛 ∑ 𝑎𝑖𝑗3𝑛𝑗=1 (14)
𝑧𝑖�� =𝑝𝑖��
𝑟= (
𝑝𝑖𝑗1
𝑟,𝑝𝑖𝑗2
𝑟,𝑝𝑖𝑗3
𝑟) (15)
Adım 4: Toplam İlişki Matrisini oluştur.
Normalize Direk İlişki Matrisi 𝑍 elde edildikten sonra Eşitlik (16) kullanılarak Toplam İlişki Matrisi �� = [𝑡𝑖��]𝑛×𝑛 oluşturulur.
�� = 𝑍1 + 𝑍2+ . . . = ∑ 𝑍��∞İ=1 = 𝑍(𝐼 − 𝑍)−1 (16)
Adım 5: Gönderici ve alıcı grupları belirle.
�� matrisinde satır toplamları Eşitlik (17) kullanılarak alınır ve �� hesaplanır. Aynı matriste, Eşitlik (18) kullanılarak sütun
toplamlarını temsil eden �� bulunur.
�� = ∑ 𝑡𝑖��𝑛𝑖=1 (17)
�� = ∑ 𝑡𝑖��𝑛𝑗=1 (18)
Her bir kriter için 𝐾𝑗; 𝑗 = 1,… , 𝑛 için, �� − �� = (𝑠𝑖𝑗1 , 𝑠𝑖𝑗2, 𝑠𝑖𝑗3) ve �� + �� = (𝑢𝑖𝑗1 , 𝑢𝑖𝑗2, 𝑢𝑖𝑗3) değerleri hesaplanır.
�� − �� ve �� + �� değerleri üçgensel bulanık sayılar oldukları için Eşitlik (19) ve Eşitlik (20) kullanılarak durulaştırma yapılır ve
(�� + ��)𝑑𝑒𝑓ve (�� − ��)𝑑𝑒𝑓 değerleri elde edilir.
(�� + ��)𝑑𝑒𝑓 =1
4(𝑠𝑖𝑗1 + 2𝑠𝑖𝑗2 + 𝑠𝑖𝑗3) (19)
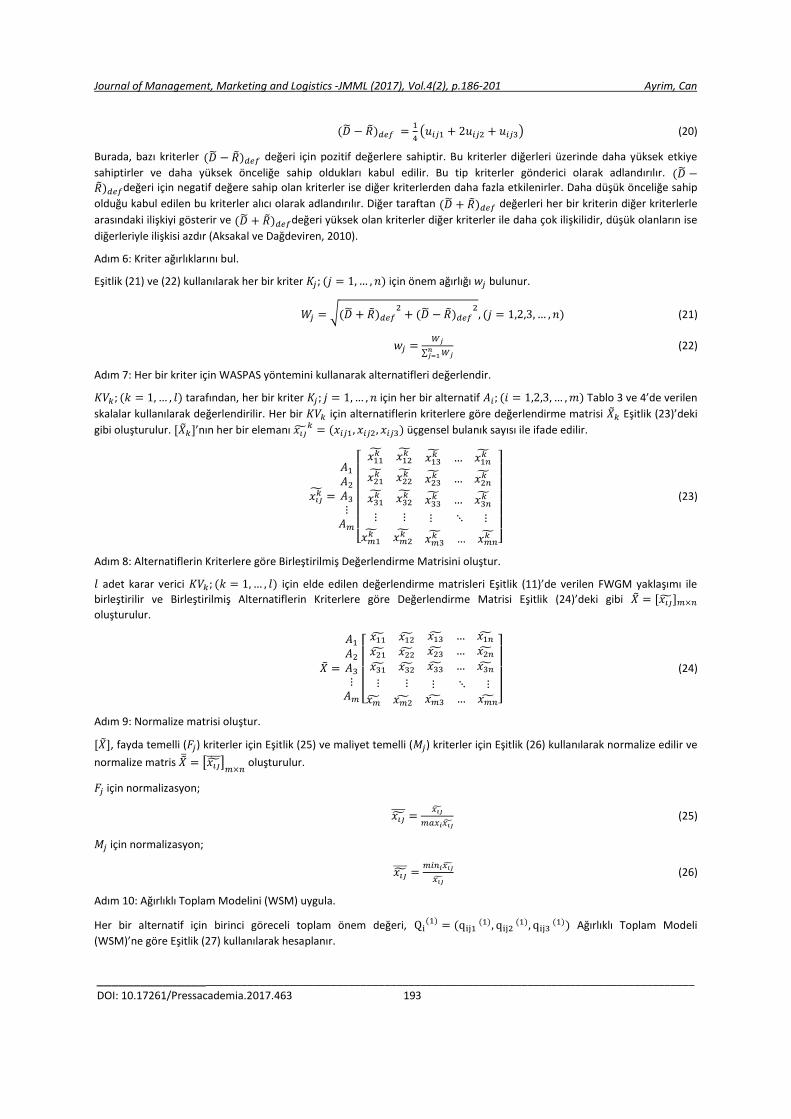
Journal of Management, Marketing and Logistics -JMML (2017), Vol.4(2), p.186-201 Ayrim, Can
_________________________________________________________________________________________________
DOI: 10.17261/Pressacademia.2017.463 193
(�� − ��)𝑑𝑒𝑓 =1
4(𝑢𝑖𝑗1 + 2𝑢𝑖𝑗2 + 𝑢𝑖𝑗3) (20)
Burada, bazı kriterler (�� − ��)𝑑𝑒𝑓 değeri için pozitif değerlere sahiptir. Bu kriterler diğerleri üzerinde daha yüksek etkiye
sahiptirler ve daha yüksek önceliğe sahip oldukları kabul edilir. Bu tip kriterler gönderici olarak adlandırılır. (�� −��)𝑑𝑒𝑓değeri için negatif değere sahip olan kriterler ise diğer kriterlerden daha fazla etkilenirler. Daha düşük önceliğe sahip
olduğu kabul edilen bu kriterler alıcı olarak adlandırılır. Diğer taraftan (�� + ��)𝑑𝑒𝑓 değerleri her bir kriterin diğer kriterlerle
arasındaki ilişkiyi gösterir ve (�� + ��)𝑑𝑒𝑓değeri yüksek olan kriterler diğer kriterler ile daha çok ilişkilidir, düşük olanların ise
diğerleriyle ilişkisi azdır (Aksakal ve Dağdeviren, 2010).
Adım 6: Kriter ağırlıklarını bul.
Eşitlik (21) ve (22) kullanılarak her bir kriter 𝐾𝑗; (𝑗 = 1,… , 𝑛) için önem ağırlığı 𝑤𝑗 bulunur.
𝑊𝑗 = √(�� + ��)𝑑𝑒𝑓2+ (�� − ��)𝑑𝑒𝑓
2, (𝑗 = 1,2,3,… , 𝑛) (21)
𝑤𝑗 =𝑊𝑗
∑ 𝑊𝑗𝑛𝑗=1
(22)
Adım 7: Her bir kriter için WASPAS yöntemini kullanarak alternatifleri değerlendir.
𝐾𝑉𝑘; (𝑘 = 1,… , 𝑙) tarafından, her bir kriter 𝐾𝑗 ; 𝑗 = 1,… , 𝑛 için her bir alternatif 𝐴𝑖; (𝑖 = 1,2,3,… ,𝑚) Tablo 3 ve 4’de verilen
skalalar kullanılarak değerlendirilir. Her bir 𝐾𝑉𝑘 için alternatiflerin kriterlere göre değerlendirme matrisi ��𝑘 Eşitlik (23)’deki
gibi oluşturulur. [��𝑘]’nın her bir elemanı 𝑥𝑖��𝑘 = (𝑥𝑖𝑗1, 𝑥𝑖𝑗2, 𝑥𝑖𝑗3) üçgensel bulanık sayısı ile ifade edilir.
𝑥𝑖𝑗�� =
𝐴1
𝐴2
𝐴3
⋮𝐴𝑚
[ 𝑥11
�� 𝑥12�� 𝑥13
�� … 𝑥1𝑛��
𝑥21�� 𝑥22
�� 𝑥23�� … 𝑥2𝑛
��
𝑥31�� 𝑥32
�� 𝑥33�� … 𝑥3𝑛
��
⋮ ⋮ ⋮ ⋱ ⋮
𝑥𝑚1�� 𝑥𝑚2
�� 𝑥𝑚3�� … 𝑥𝑚𝑛
�� ]
(23)
Adım 8: Alternatiflerin Kriterlere göre Birleştirilmiş Değerlendirme Matrisini oluştur.
𝑙 adet karar verici 𝐾𝑉𝑘; (𝑘 = 1,… , 𝑙) için elde edilen değerlendirme matrisleri Eşitlik (11)’de verilen FWGM yaklaşımı ile
birleştirilir ve Birleştirilmiş Alternatiflerin Kriterlere göre Değerlendirme Matrisi Eşitlik (24)’deki gibi �� = [𝑥𝑖��]𝑚×𝑛
oluşturulur.
�� =
𝐴1
𝐴2
𝐴3
⋮𝐴𝑚 [
𝑥11 𝑥12 𝑥13 … 𝑥1��
𝑥21 𝑥22 𝑥23 … 𝑥2��
𝑥31 𝑥32 𝑥33 … 𝑥3��
⋮ ⋮ ⋮ ⋱ ⋮
𝑥�� 𝑥𝑚2 𝑥𝑚3 … 𝑥𝑚��]
(24)
Adım 9: Normalize matrisi oluştur.
[��], fayda temelli (𝐹𝑗) kriterler için Eşitlik (25) ve maliyet temelli (𝑀𝑗) kriterler için Eşitlik (26) kullanılarak normalize edilir ve
normalize matris �� = [𝑥𝑖�� ]
𝑚×𝑛 oluşturulur.
𝐹𝑗 için normalizasyon;
𝑥𝑖�� =
𝑥𝑖��
𝑚𝑎𝑥𝑖𝑥𝑖�� (25)
𝑀𝑗 için normalizasyon;
𝑥𝑖�� =
𝑚𝑖𝑛𝑖𝑥𝑖��
𝑥𝑖�� (26)
Adım 10: Ağırlıklı Toplam Modelini (WSM) uygula.
Her bir alternatif için birinci göreceli toplam önem değeri, Qi(1) = (qij1
(1), qij2 (1), qij3
(1)) Ağırlıklı Toplam Modeli
(WSM)’ne göre Eşitlik (27) kullanılarak hesaplanır.

Journal of Management, Marketing and Logistics -JMML (2017), Vol.4(2), p.186-201 Ayrim, Can
_________________________________________________________________________________________________
DOI: 10.17261/Pressacademia.2017.463 194
𝑄𝑖(1) = ∑ 𝑥𝑖��
× 𝑤𝑗𝑛𝑗=1 (27)
Adım 11: Ağırlıklı Çarpım Modelini (WPM) uygula.
Her bir alternatif için ikinci göreceli çarpım önem değeri, Qi(2) = (qij1
(2), qij2 (2), qij3
(2)) Ağırlıklı Çarpım Modeli (WPM)’ne
göre Eşitlik (28) kullanılarak hesaplanır (Šaparauskas vd., 2011, Zavadskas vd., 2012).
𝑄𝑖(2) = ∏ (𝑥𝑖��
)𝑤𝑗𝑛𝑗=1 (28)
𝑄𝑖(1) ve 𝑄𝑖
(2) bulanık sayı olduğu için Eşitlik (29) ve Eşitlik (30) kullanılarak durulaştırılır.
𝑄𝑖(1) =
1
4(𝑞𝑖𝑗1
(1) + 2𝑞𝑖𝑗2 (1) + 𝑞𝑖𝑗3
(1)) (29)
𝑄𝑖(2) =
1
4(𝑞𝑖𝑗1
(2) + 2𝑞𝑖𝑗2 (2) + 𝑞𝑖𝑗3
(2)) (30)
Adım 12: Fayda fonsiyonunu oluştur.
Her bir alternatif için toplam birleşik optimallik değeri, 𝑄𝑖 Eşitlik (31) kullanılarak elde edilir (Zavadskas vd., 2013a, 2013b).
𝑄𝑖 = 𝜆𝑄𝑖(1) + (1 − 𝜆)𝑄𝑖
(2) ; 𝜆 ∈ [0,1] (31)
Adım 13: Alternatifleri sırala.
Alternatifler, 𝑄𝑖 değerlerine göre büyükten küçüğe doğru sıralanır. En büyük 𝑄𝑖 değerine sahip olan alternatif birinci sırada yer alır.
6.UYGULAMA
Çalışmada önerilen yaklaşım, 13 yıldır gıda lojistiğinde faaliyet gösteren, soğuk zincir, kuru veya likit gıda gibi tüm gıda ürünlerinin lojistiği konusunda Türkiye’nin en deneyimli firmalarından birisinde, gıda lojistiğinde ortaya çıkabilecek hata türlerinin önceliklendirilmesi amacıyla uygulanmıştır. Firma, Türkiye'nin 18 şehrinde 57 depo, 500.000 m² kapalı depolama alanı ve 390.000 paletli yük stok kapasitesiyle hizmet vermektedir.
Firmada gıda lojistiği faaliyetleri sırasında Tablo 6’da belirtilen 12 hata türü tespit edilmiştir. Bu hata türleri geliştirilen HTEA yaklaşımı ile ele alınmıştır. Önerilen bu yaklaşımla, gıda lojistiğinde hataların belirlenerek risk derecelerine göre önceliklendirilmesi sağlanmıştır.
Tablo 6: Belirlenen Hata Türleri
Sıra No
Hata Türleri Açıklama
1 𝑨𝟏 Yeterli saklama imkânlarının sağlanamaması
2 𝑨𝟐 Zamanında teslim edilememesi
3 𝑨𝟑 Stok sorunları (yanlış depolama)
4 𝑨𝟒 Gıda güvenliğinin sağlanamaması
5 𝑨𝟓 Ürüne uygun olmayan biçimde dağıtım
6 𝑨𝟔 Paketlemeden kaynaklanan hatalar
7 𝑨𝟕 Uygun olmayan araç yükleme ve boşaltma yöntemleri
8 𝑨𝟖 Ürünlerin araç içinde kontrolsüz hareketi
9 𝑨𝟗 Taşıma aracının ürüne uygun havalandırma, nem ve sıcaklık koşullarına sahip olmaması
10 𝑨𝟏𝟎 Uygun olmayan ürünlerin karışık olarak taşınması
11 𝑨𝟏𝟏 Araç soğutucularının düzenli bakımı ve kalibrasyonunun yapılmaması
12 𝑨𝟏𝟐 Depo ve araçların temizlik ve kontrollerinin sağlanmaması
Hata türlerini önceliklendirebilmek için olasılık (𝐾1), şiddet (𝐾2), fark edilebilirlik (𝐾3) ve maliyet (𝐾4), kriterleri (𝐾𝑗; 𝑗 =
1,… ,4) temel alınmıştır. Burada, maliyet kriterini değerlendirme skalası HTEA yönteminde kullanılan mantık çerçevesinde geliştirilmiştir. Hata türlerinin sıralanmasında olasılık, şiddet ve maliyet kriterleri yüksek değerleri aldığında ilgili hata daha yüksek önceliğe sahip olurlarken; fark edilebilirlik kriteri için ise düşük fark edilebilirlik değerleri hata türünü yüksek önceliğe

Journal of Management, Marketing and Logistics -JMML (2017), Vol.4(2), p.186-201 Ayrim, Can
_________________________________________________________________________________________________
DOI: 10.17261/Pressacademia.2017.463 195
taşımaktadır. Buna göre oluşturulan bulanık değerlendirme skalaları Tablo 7 ve Tablo 8’te verilmiştir ve Bölüm 5’te belirtilen
algoritma aşağıdaki gibi uygulanmıştır.
Tablo 7: Olasılık, Şiddet Ve Maliyet Kriterleri İçin Değerlendirme Skalası
Puan Tanım TFN
1 Çok düşük 0,00 0,00 0,25
2 Düşük 0,00 0,25 0,50
3 Orta 0,25 0,50 0,75
4 Yüksek 0,50 0,75 1,00
5 Çok yüksek 0,75 1,00 1,00
Tablo 8: Fark Edilebilirlik Kriteri İçin Değerlendirme Skalası
Puan Tanım TFN
1 Çok düşük 0,75 1,00 1,00
2 Düşük 0,50 0,75 1,00
3 Orta 0,25 0,50 0,75
4 Yüksek 0,00 0,25 0,50
5 Çok yüksek 0,00 0,00 0,25
Adım 1: Kriterleri etkileşim düzeylerine göre değerlendir. Kriterler arası etkileşimler 3 karar verici 𝐾𝑉𝑘; (𝑘 = 1,2,3), tarafından değerlendirilmiştir. 𝐾𝑉1 için değerlendirme matrisi örnek olarak Tablo 9’de verilmiştir.
Tablo 9: 𝑲𝑽𝟏 İçin Değerlendirme Matrisi
𝑲𝟏 𝑲𝟐 𝑲𝟑 𝑲𝟒
𝑲𝟏 0 0 0 0,50 0,75 1,00 0,50 0,75 1,00 0,25 0,50 0,75
𝑲𝟐 0,00 0,25 0,50 0 0 0 0,50 0,75 1,00 0,25 0,50 0,75
𝑲𝟑 0,75 1,00 1,00 0,25 0,50 0,75 0 0 0 0,25 0,50 0,75
𝑲𝟒 0,00 0,25 0,50 0,00 0,25 0,50 0,00 0,00 0,25 0 0 0
Adım 2: Birleştirilmiş Direkt İlişki Matrisini oluştur.
𝐾𝑉𝑘; (𝑘 = 1,2,3), tarafından oluşturulan ��𝑘 matrisleri Eşitlik (11) kullanılarak birleştirilir. Uygulamada deneyimlerine göre
üç karar vericinin önem ağırlıkları 𝛼1 = 0,50, 𝛼2 = 0,25 ve 𝛼3 = 0,25 olarak alınmıştır. Birleştirilmiş İlişki Matrisi �� Tablo 10’da gösterilmiştir.
Tablo 10: Birleştirilmiş Direkt İlişki Matrisi ��
𝑲𝟏 𝑲𝟐 𝑲𝟑 𝑲𝟒
𝑲𝟏 0,00 0,00 0,00 0,55 0,81 1,00 0,55 0,81 1,00 0,35 0,61 0,87
𝑲𝟐 0,00 0,30 0,55 0,00 0,00 0,00 0,61 0,87 1,00 0,00 0,42 0,68
𝑲𝟑 0,43 0,71 0,87 0,30 0,55 0,81 0,00 0,00 0,00 0,00 0,42 0,68
𝑲𝟒 0,00 0,33 0,59 0,00 0,35 0,61 0,00 0,00 0,39 0,00 0,00 0,00
Adım 3: Normalize direkt ilişki matrisini oluştur.
Eşitlik (14) ve Eşitlik (15) kullanılarak [𝑍 ]oluşturumuş ve Tablo 11’de verilmiştir.
Tablo 11: Normalize Direkt İlişki Matrisi, 𝒁
𝑲𝟏 𝑲𝟐 𝑲𝟑 𝑲𝟒
𝑲𝟏 0,00 0,00 0,00 0,47 0,47 0,41 0,47 0,47 0,41 0,30 0,36 0,36
𝑲𝟐 0,00 0,17 0,23 0,00 0,00 0,00 0,53 0,51 0,41 0,00 0,25 0,28
𝑲𝟑 0,37 0,41 0,36 0,26 0,32 0,33 0,00 0,00 0,00 0,00 0,25 0,28
𝑲𝟒 0,00 0,19 0,25 0,00 0,21 0,25 0,00 0,00 0,16 0,00 0,00 0,00
Adım 4: Toplam İlişki Matrisini oluştur.

Journal of Management, Marketing and Logistics -JMML (2017), Vol.4(2), p.186-201 Ayrim, Can
_________________________________________________________________________________________________
DOI: 10.17261/Pressacademia.2017.463 196
[𝑍 ] elde edildikten sonra Eşitlik (16) kullanılarak [��] oluşturulmuş ve Tablo 12’de gösterilmiştir.
Tablo 12: Toplam İlişki Matrisi, ��
𝑲𝟏 𝑲𝟐 𝑲𝟑 𝑲𝟒
𝑲𝟏 -1,00 -0,76 -0,77 0,00 0,40 0,38 0,00 0,53 0,40 1,00 0,14 0,29
𝑲𝟐 0,00 0,24 0,23 -1,00 -0,60 -0,62 0,00 0,53 0,40 1,00 0,14 0,29
𝑲𝟑 0,00 0,24 0,23 0,00 0,40 0,38 -1,00 -0,47 -0,60 1,00 0,14 0,29
𝑲𝟒 0,00 0,24 0,23 0,00 0,40 0,38 0,00 0,53 0,40 0,00 -0,86 -0,71
Adım 5: Gönderici ve alıcı grupları belirle.
Her bir kriter için �� − �� ve �� + �� değerleri elde edilmiş ve Eşitlik (19) ve Eşitlik (20) kullanılarak (�� + ��)𝑑𝑒𝑓ve (�� − ��)𝑑𝑒𝑓
hesaplanarak Tablo 13’te verilmiştir.
Tablo 13: (�� + ��)𝒅𝒆𝒇ve (�� − ��)𝒅𝒆𝒇 Değerleri
Kriterler (�� + ��)𝑑𝑒𝑓 (�� − ��)𝑑𝑒𝑓
𝑲𝟏 0,23 -0,28
𝑲𝟐 0,23 -0,07
𝑲𝟑 0,23 0,72
𝑲𝟒 0,23 0,57
Adım 6: Kriter ağırlıklarını bul.
Eşitlik (21) ve (22) kullanılarak kriter ağılıkları elde edilmiş ve Tablo 14’te verilmiştir.
Tablo 14: Kriter Ağırlıkları
𝒘𝒋
𝑲𝟏 0,19
𝑲𝟐 0,12
𝑲𝟑 0,38
𝑲𝟒 0,31
Adım 7: Her bir kriter için alternatifleri değerlendir.
Alternatiflerin kriterlere göre değerlendirmeleri 3 karar verici 𝐾𝑉𝑘; (𝑘 = 1,2,3), tarafından yapılmıştır. 𝐾𝑉1 için [��𝑘] örnek olarak Tablo 15’te verilmiştir. Tablo 15: Değerlendirme Matrisi
𝑲𝟏 𝑲𝟐 𝑲𝟑 𝑲𝟒
𝑨𝟏 0,75 1,00 1,00 0,50 0,75 1,00 0,00 0,25 0,50 0,00 0,25 0,50
𝑨𝟐 0,75 1,00 1,00 0,25 0,50 0,75 0,00 0,25 0,50 0,00 0,00 0,25
𝑨𝟑 0,00 0,25 0,50 0,50 0,75 1,00 0,00 0,25 0,50 0,25 0,50 0,75
𝑨𝟒 0,00 0,25 0,50 0,75 1,00 1,00 0,50 0,75 1,00 0,75 1,00 1,00
𝑨𝟓 0,25 0,50 0,75 0,50 0,75 1,00 0,25 0,50 0,75 0,25 0,50 0,75
𝑨𝟔 0,00 0,25 0,50 0,25 0,50 0,75 0,00 0,25 0,50 0,00 0,25 0,50
𝑨𝟕 0,50 0,75 1,00 0,50 0,75 1,00 0,50 0,75 1,00 0,25 0,50 0,75
𝑨𝟖 0,25 0,50 0,75 0,75 1,00 1,00 0,75 1,00 1,00 0,00 0,25 0,50
𝑨𝟗 0,00 0,25 0,50 0,75 1,00 1,00 0,50 0,75 1,00 0,75 1,00 1,00
𝑨𝟏𝟎 0,25 0,50 0,75 0,00 0,25 0,50 0,00 0,00 0,25 0,25 0,50 0,75
𝑨𝟏𝟏 0,25 0,50 0,75 0,75 1,00 1,00 0,75 1,00 1,00 0,75 1,00 1,00
𝑨𝟏𝟐 0,25 0,50 0,75 0,75 1,00 1,00 0,25 0,50 0,75 0,50 0,75 1,00
Adım 8: Alternatiflerin Kriterlere göre Birleştirilmiş Değerlendirme Matrisini oluştur.

Journal of Management, Marketing and Logistics -JMML (2017), Vol.4(2), p.186-201 Ayrim, Can
_________________________________________________________________________________________________
DOI: 10.17261/Pressacademia.2017.463 197
[��] Eşitlik (11) kullanılarak oluşturulmuş ve Tablo 16’da verilmiştir.
Tablo 16: Birleştirilmiş Değerlendirme Matrisi, ��
𝑲𝟏 𝑲𝟐 𝑲𝟑 𝑲𝟒
𝑨𝟏 0,51 0,78 0,93 0,35 0,61 0,87 0,00 0,30 0,55 0,00 0,35 0,61
𝑨𝟐 0,68 0,93 1,00 0,35 0,61 0,87 0,00 0,00 0,35 0,00 0,00 0,39
𝑨𝟑 0,00 0,42 0,66 0,55 0,81 1,00 0,00 0,30 0,55 0,33 0,59 0,81
𝑨𝟒 0,00 0,43 0,71 0,51 0,78 0,93 0,61 0,87 1,00 0,68 0,93 1,00
𝑨𝟓 0,43 0,71 0,87 0,00 0,51 0,78 0,00 0,35 0,61 0,00 0,42 0,68
𝑨𝟔 0,00 0,30 0,55 0,00 0,00 0,51 0,00 0,00 0,42 0,00 0,00 0,42
𝑨𝟕 0,42 0,68 0,93 0,00 0,51 0,78 0,35 0,61 0,87 0,00 0,35 0,61
𝑨𝟖 0,30 0,55 0,81 0,00 0,50 0,71 0,75 1,00 1,00 0,00 0,00 0,42
𝑨𝟗 0,00 0,39 0,66 0,75 1,00 1,00 0,42 0,68 0,93 0,68 0,93 1,00
𝑨𝟏𝟎 0,30 0,55 0,81 0,00 0,39 0,66 0,00 0,00 0,50 0,00 0,42 0,68
𝑨𝟏𝟏 0,30 0,55 0,81 0,75 1,00 1,00 0,61 0,87 1,00 0,68 0,93 1,00
𝑨𝟏𝟐 0,25 0,50 0,75 0,68 0,93 1,00 0,30 0,55 0,81 0,42 0,68 0,93
Adım 9: Normalize matrisi oluştur.
HTEA’nin işleyiş mantığına göre bir hata türünün öncelikli olması için ortaya çıkma olasılığının, yaratacağı şiddetin, maliyetin yüksek olması ve fark edilebilirliğinin düşük olması gereklidir. Bu nedenle fark edilebilirlik faktörüne ait skala değerler ters çevrilerek oluşturulmuştur. Buna göre, bütün kriterler fayda yapılı kriterlere dönüşmüştür. Eşitlik (25) kullanılarak elde
edilen [��]Tablo (17)’de gösterilmiştir.
Tablo 17: Normalize Matris, ��
𝑲𝟏 𝑲𝟐 𝑲𝟑 𝑲𝟒 𝑨𝟏 0,76 0,84 0,93 0,47 0,61 0,87 0,00 0,30 0,55 0,00 0,38 0,61
𝑨𝟐 1,00 1,00 1,00 0,47 0,61 0,87 0,00 0,00 0,35 0,00 0,00 0,39
𝑨𝟑 0,00 0,45 0,66 0,74 0,81 1,00 0,00 0,30 0,55 0,49 0,64 0,81
𝑨𝟒 0,00 0,47 0,71 0,69 0,78 0,93 0,82 0,87 1,00 1,00 1,00 1,00
𝑨𝟓 0,64 0,76 0,87 0,00 0,51 0,78 0,00 0,35 0,61 0,00 0,45 0,68
𝑨𝟔 0,00 0,32 0,55 0,00 0,00 0,51 0,00 0,00 0,42 0,00 0,00 0,42
𝑨𝟕 0,62 0,73 0,93 0,00 0,51 0,78 0,47 0,61 0,87 0,00 0,38 0,61
𝑨𝟖 0,44 0,59 0,81 0,00 0,50 0,71 1,00 1,00 1,00 0,00 0,00 0,42
𝑨𝟗 0,00 0,42 0,66 1,00 1,00 1,00 0,56 0,68 0,93 1,00 1,00 1,00
𝑨𝟏𝟎 0,44 0,59 0,81 0,00 0,39 0,66 0,00 0,00 0,50 0,00 0,45 0,68
𝑨𝟏𝟏 0,44 0,59 0,81 1,00 1,00 1,00 0,82 0,87 1,00 1,00 1,00 1,00
𝑨𝟏𝟐 0,37 0,54 0,75 0,90 0,93 1,00 0,40 0,55 0,81 0,62 0,73 0,93
Adım 10: Ağırlıklı Toplam Modelini (WSM) uygula.
Eşitlik (26) kullanılarak elde edilen WSM’ın sonuçları Tablo 18’de gösterilmiştir.
Tablo 18: ATM Sonuçları
𝑲𝟏 𝑲𝟐 𝑲𝟑 𝑲𝟒
𝑨𝟏 0,15 0,17 0,19 0,06 0,07 0,10 0,00 0,11 0,21 0,00 0,11 0,18
𝑨𝟐 0,20 0,20 0,20 0,06 0,07 0,10 0,00 0,00 0,13 0,00 0,00 0,12
𝑨𝟑 0,00 0,09 0,13 0,09 0,10 0,12 0,00 0,11 0,21 0,15 0,19 0,24
𝑨𝟒 0,00 0,09 0,14 0,08 0,09 0,11 0,31 0,33 0,38 0,30 0,30 0,30
𝑨𝟓 0,13 0,15 0,17 0,00 0,06 0,09 0,00 0,13 0,23 0,00 0,14 0,20
𝑨𝟔 0,00 0,06 0,11 0,00 0,00 0,06 0,00 0,00 0,16 0,00 0,00 0,13
𝑨𝟕 0,12 0,15 0,19 0,00 0,06 0,09 0,18 0,23 0,33 0,00 0,11 0,18

Journal of Management, Marketing and Logistics -JMML (2017), Vol.4(2), p.186-201 Ayrim, Can
_________________________________________________________________________________________________
DOI: 10.17261/Pressacademia.2017.463 198
𝑨𝟖 0,09 0,12 0,16 0,00 0,06 0,08 0,38 0,38 0,38 0,00 0,00 0,13
𝑨𝟗 0,00 0,08 0,13 0,12 0,12 0,12 0,21 0,26 0,35 0,30 0,30 0,30
𝑨𝟏𝟎 0,09 0,12 0,16 0,00 0,05 0,08 0,00 0,00 0,19 0,00 0,14 0,20
𝑨𝟏𝟏 0,09 0,12 0,16 0,12 0,12 0,12 0,31 0,33 0,38 0,30 0,30 0,30
𝑨𝟏𝟐 0,07 0,11 0,15 0,11 0,11 0,12 0,15 0,21 0,31 0,19 0,22 0,28
Adım 11: Ağırlıklı Çarpım Modelini (WPM) uygula.
Eşitlik (27) kullanılarak elde edilen WPM’ın sonuçları Tablo 19’da gösterilmiştir.
Tablo 18: AÇM Sonuçları
𝑲𝟏 𝑲𝟐 𝑲𝟑 𝑲𝟒
𝑨𝟏 0,95 0,97 0,99 0,91 0,94 0,98 0,00 0,63 0,80 0,00 0,74 0,86
𝑨𝟐 1,00 1,00 1,00 0,91 0,94 0,98 0,00 0,00 0,67 0,00 0,00 0,75
𝑨𝟑 0,00 0,86 0,92 0,96 0,97 1,00 0,00 0,63 0,80 0,80 0,87 0,94
𝑨𝟒 0,00 0,86 0,94 0,96 0,97 0,99 0,93 0,95 1,00 1,00 1,00 1,00
𝑨𝟓 0,92 0,95 0,97 0,00 0,92 0,97 0,00 0,67 0,83 0,00 0,78 0,89
𝑨𝟔 0,00 0,81 0,89 0,00 0,00 0,92 0,00 0,00 0,72 0,00 0,00 0,76
𝑨𝟕 0,91 0,94 0,99 0,00 0,92 0,97 0,75 0,83 0,95 0,00 0,74 0,86
𝑨𝟖 0,86 0,91 0,96 0,00 0,92 0,96 1,00 1,00 1,00 0,00 0,00 0,76
𝑨𝟗 0,00 0,85 0,92 1,00 1,00 1,00 0,80 0,86 0,97 1,00 1,00 1,00
𝑨𝟏𝟎 0,86 0,91 0,96 0,00 0,89 0,95 0,00 0,00 0,77 0,00 0,78 0,89
𝑨𝟏𝟏 0,86 0,91 0,96 1,00 1,00 1,00 0,93 0,95 1,00 1,00 1,00 1,00
𝑨𝟏𝟐 0,83 0,89 0,95 0,99 0,99 1,00 0,70 0,80 0,92 0,86 0,91 0,98
Adım 12: Fayda fonsiyonunu oluştur.
𝜆 = 0,5 alınarak Eşitlik (28)’in kullanılmasıyla 𝑄𝑖 hesaplanmış ve Tablo 20’de verilmiştir. Burada WSM ve WPM yaklaşımlarına ait sonuçların birleşik optimallik kriterinde eşit etkiye sahip olduğu varsayılmıştır.
Adım 13: Alternatifleri sırala.
𝑄𝑖 değerlerine göre elde edilen sıralama Tablo 20’de gösterilmiştir.
Tablo 20: Sıralama Sonuçları
𝑸𝒊 Sıralama
𝑨𝟏 0,42 8
𝑨𝟐 0,23 11
𝑨𝟑 0,44 6
𝑨𝟒 0,72 2
𝑨𝟓 0,43 7
𝑨𝟔 0,13 12
𝑨𝟕 0,51 5
𝑨𝟖 0,38 9
𝑨𝟗 0,68 3
𝑨𝟏𝟎 0,24 10
𝑨𝟏𝟏 0,87 1
𝑨𝟏𝟐 0,66 4
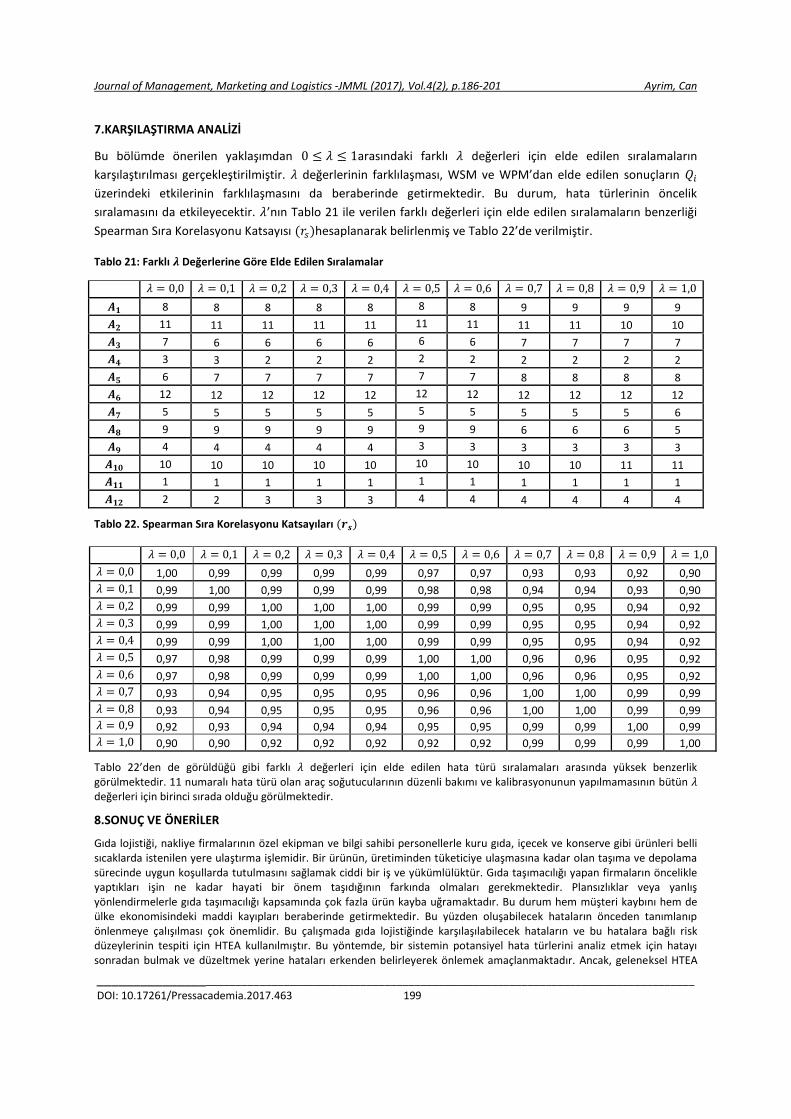
Journal of Management, Marketing and Logistics -JMML (2017), Vol.4(2), p.186-201 Ayrim, Can
_________________________________________________________________________________________________
DOI: 10.17261/Pressacademia.2017.463 199
7.KARŞILAŞTIRMA ANALİZİ
Bu bölümde önerilen yaklaşımdan 0 ≤ 𝜆 ≤ 1arasındaki farklı 𝜆 değerleri için elde edilen sıralamaların
karşılaştırılması gerçekleştirilmiştir. 𝜆 değerlerinin farklılaşması, WSM ve WPM’dan elde edilen sonuçların 𝑄𝑖
üzerindeki etkilerinin farklılaşmasını da beraberinde getirmektedir. Bu durum, hata türlerinin öncelik
sıralamasını da etkileyecektir. 𝜆’nın Tablo 21 ile verilen farklı değerleri için elde edilen sıralamaların benzerliği
Spearman Sıra Korelasyonu Katsayısı (𝑟𝑠)hesaplanarak belirlenmiş ve Tablo 22’de verilmiştir.
Tablo 21: Farklı 𝝀 Değerlerine Göre Elde Edilen Sıralamalar
𝜆 = 0,0 𝜆 = 0,1 𝜆 = 0,2 𝜆 = 0,3 𝜆 = 0,4 𝜆 = 0,5 𝜆 = 0,6 𝜆 = 0,7 𝜆 = 0,8 𝜆 = 0,9 𝜆 = 1,0
𝑨𝟏 8 8 8 8 8 8 8 9 9 9 9
𝑨𝟐 11 11 11 11 11 11 11 11 11 10 10
𝑨𝟑 7 6 6 6 6 6 6 7 7 7 7
𝑨𝟒 3 3 2 2 2 2 2 2 2 2 2
𝑨𝟓 6 7 7 7 7 7 7 8 8 8 8
𝑨𝟔 12 12 12 12 12 12 12 12 12 12 12
𝑨𝟕 5 5 5 5 5 5 5 5 5 5 6
𝑨𝟖 9 9 9 9 9 9 9 6 6 6 5
𝑨𝟗 4 4 4 4 4 3 3 3 3 3 3
𝑨𝟏𝟎 10 10 10 10 10 10 10 10 10 11 11
𝑨𝟏𝟏 1 1 1 1 1 1 1 1 1 1 1
𝑨𝟏𝟐 2 2 3 3 3 4 4 4 4 4 4
Tablo 22. Spearman Sıra Korelasyonu Katsayıları (𝒓𝒔)
𝜆 = 0,0 𝜆 = 0,1 𝜆 = 0,2 𝜆 = 0,3 𝜆 = 0,4 𝜆 = 0,5 𝜆 = 0,6 𝜆 = 0,7 𝜆 = 0,8 𝜆 = 0,9 𝜆 = 1,0
𝜆 = 0,0 1,00 0,99 0,99 0,99 0,99 0,97 0,97 0,93 0,93 0,92 0,90
𝜆 = 0,1 0,99 1,00 0,99 0,99 0,99 0,98 0,98 0,94 0,94 0,93 0,90
𝜆 = 0,2 0,99 0,99 1,00 1,00 1,00 0,99 0,99 0,95 0,95 0,94 0,92
𝜆 = 0,3 0,99 0,99 1,00 1,00 1,00 0,99 0,99 0,95 0,95 0,94 0,92
𝜆 = 0,4 0,99 0,99 1,00 1,00 1,00 0,99 0,99 0,95 0,95 0,94 0,92
𝜆 = 0,5 0,97 0,98 0,99 0,99 0,99 1,00 1,00 0,96 0,96 0,95 0,92
𝜆 = 0,6 0,97 0,98 0,99 0,99 0,99 1,00 1,00 0,96 0,96 0,95 0,92
𝜆 = 0,7 0,93 0,94 0,95 0,95 0,95 0,96 0,96 1,00 1,00 0,99 0,99
𝜆 = 0,8 0,93 0,94 0,95 0,95 0,95 0,96 0,96 1,00 1,00 0,99 0,99
𝜆 = 0,9 0,92 0,93 0,94 0,94 0,94 0,95 0,95 0,99 0,99 1,00 0,99
𝜆 = 1,0 0,90 0,90 0,92 0,92 0,92 0,92 0,92 0,99 0,99 0,99 1,00
Tablo 22’den de görüldüğü gibi farklı 𝜆 değerleri için elde edilen hata türü sıralamaları arasında yüksek benzerlik görülmektedir. 11 numaralı hata türü olan araç soğutucularının düzenli bakımı ve kalibrasyonunun yapılmamasının bütün 𝜆 değerleri için birinci sırada olduğu görülmektedir.
8.SONUÇ VE ÖNERİLER
Gıda lojistiği, nakliye firmalarının özel ekipman ve bilgi sahibi personellerle kuru gıda, içecek ve konserve gibi ürünleri belli sıcaklarda istenilen yere ulaştırma işlemidir. Bir ürünün, üretiminden tüketiciye ulaşmasına kadar olan taşıma ve depolama sürecinde uygun koşullarda tutulmasını sağlamak ciddi bir iş ve yükümlülüktür. Gıda taşımacılığı yapan firmaların öncelikle yaptıkları işin ne kadar hayati bir önem taşıdığının farkında olmaları gerekmektedir. Plansızlıklar veya yanlış yönlendirmelerle gıda taşımacılığı kapsamında çok fazla ürün kayba uğramaktadır. Bu durum hem müşteri kaybını hem de ülke ekonomisindeki maddi kayıpları beraberinde getirmektedir. Bu yüzden oluşabilecek hataların önceden tanımlanıp önlenmeye çalışılması çok önemlidir. Bu çalışmada gıda lojistiğinde karşılaşılabilecek hataların ve bu hatalara bağlı risk düzeylerinin tespiti için HTEA kullanılmıştır. Bu yöntemde, bir sistemin potansiyel hata türlerini analiz etmek için hatayı sonradan bulmak ve düzeltmek yerine hataları erkenden belirleyerek önlemek amaçlanmaktadır. Ancak, geleneksel HTEA

Journal of Management, Marketing and Logistics -JMML (2017), Vol.4(2), p.186-201 Ayrim, Can
_________________________________________________________________________________________________
DOI: 10.17261/Pressacademia.2017.463 200
prosedürünün geliştirilmesi gereken birçok yönü bulunmaktadır. Çalışmada geleneksel HTEA’nın geliştirilmesi gereken yönleri de dikkate alınarak risk faktörleri arasındaki nedensel ilişkiyi daha iyi yansıtabilecek Bulanık DEMATEL ile kriter ağırlıkları elde edilmiş ve Bulanık WASPAS kullanılarak hata türleri sıralanmıştır. Önerilen bu yaklaşımla, gıda lojistiğinde hataların belirlenerek risk derecelerine göre sıralanması sağlanmıştır.
Yapılan karşılaştırma analizi sonucunda önerilen yaklaşımın tutarlı sonuçlar ürettiği Sperman Sıra Korelasyonu katsayısı değerlerinden de görülmektedir. Burada, araç soğutucularının düzenli bakım ve kalibrasyonunun yapılmaması hata türünün birinci önceliğe sahip olduğu bütün farklı 𝜆 değerleri için belirlenmiştir. Gerçek hayatta da gıda lojistiğinde insan sağlığını tehdit etmeyecek şekilde, gerekli ortam koşulları sağlanarak gıdaların taşınması büyük önem arz etmektedir. Bu koşullar arasında, ortam sıcaklığının taşınan gıdaya uygun olmaması hassas gıdaların bozulabilmesi açısından en önemli problemlerden birisidir. Taşıma süresince bozulan gıdalar insanlar tarafından tüketildiklerinde sağlık problemlerini de beraberinde getirecek ve lojistik firması için de yüksek bozulan ürün maliyetlerine, müşteri kaybına sebep olacaktır.
KAYNAKLAR
Abdelgawad M, Fayek AR (2010) Risk management in the construction industry using combined fuzzy FMEA and fuzzy AHP. J Constr Eng Manage 136(9):1028–1036.
Aksakal E. ve Dağdeviren M. (2010), Anp Ve Dematel Yöntemleri İle Personel Seçimi Problemine Bütünleşik Bir Yaklaşım, Gazi Üniv. Müh. Mim. Fak. Der. Cilt 25, No 4, 905-913.
Akyuz E., Celik E. (2015), A fuzzy DEMATEL method to evaluate critical operational hazards during gas freeing process in crude oil tankers, Journal of Loss Prevention in the Process Industries 38243e253.
Allahverdi N. (2002). Uzman Sistemler Bir Yapay Zeka Uygulaması, Atlas Yayın Dağıtım, İstanbul
Bitarafan, M., Zolfani, S. H., Arefi, S. L., Zavadskas, E. K., Mahmoudzadeh, A. (2014), Evaluatıon of real-tıme ıntellıgent sensors for structural health monıtorıng of brıdges based on swara-waspas; a case ın IRAN. Baltic Journal of Road & Bridge Engineering, 9(4),333-340.
Chakraborty, S., Zavadskas, E. K. (2014), Applications of WASPAS method in manufacturing decision making. Informatica, 25(1), 1-20.
Chakraborty, S., Zavadskas, E. K., Antucheviciene, J. (2015), Applications of WASPAS method as a multi-criteria decisionmaking tool. Economic Computation and Economic Cybernetics Studies and Research, 49(1) 5-22.
Chang KH (2009) Evaluate the orderings of risk for failure problems using a more general RPN methodology. Microelectron Reliab 49(12):1586–1596.
Chang, B.,Chang, C.W., Wu, C.H. (2011), “Fuzzy DEMATEL Method For Developing Supplier Selection Criteria”, Expert Systems With Applications, Volume 38, Issue 3, March 2011, 1850-1858.
Emovon I, Norman RA, MA J, Pazouki K (2015) An integrated multicriteria decision making methodology using compromise solution methods for prioritising risk of marine machinery systems. Ocean Eng 105:92–103.
Fontela, E., Gabus, A. (1974), “DEMATEL, innovative methods. Report no. 2 structural analysis of the world problematique”, Battelle Geneva Research Institute, 67-69.
Li, C.W., Tzeng, G.H. (2009), “Identification of a threshold value for the DEMATEL method using the maximum mean de-entropy algorithm to find critical services provided by a semiconductor intellectual property mall” Expert Systems with Applications, 36: 9891–9898.
Li, D. F., Yang, J. B. (2004). Fuzzy Linear Programming Technique for Multiattribute Group Decision Making in Fuzzy Environments, Information Sciences, 158, p. 263-264.
Rituparna C., Supahi M., D. Datta (2011), Arithmetic of Triangular Fuzzy Variable from Credibility Theory, International Journal of Energy, Information and Communications Vol. 2, Issue 3.
Šaparauskas, J., Zavadskas, E. K., Turskis, Z. (2011), Selection of facade's alternatives of commercial and public buildings based on multiple criteria. International Journal of Strategic Property Management, 15(2), 189-203
Tsai S., Chien M., Xue Y., Li L., Jiang X., Chen Q., Zhou J.,. Wang L. (2015), Using the Fuzzy DEMATEL to Determine Environmental Performance: A Case of Printed Circuit Board Industry in Taiwan. PLoS ONE 10(6): e0129153. doi:10.1371/journal.pone.0129153.
Tseng M.L., Lin Y. H. (2008), “Application of fuzzy DEMATEL to develop a cause and effect model of municipal solid waste”, Environ Monit Assess, DOI 10.1007/s10661-008-0601-2.
Turskis, Z., Zavadskas, E. K., Antucheviciene, J., Kosareva, N. (2015), A hybrid model based on fuzzy AHP and fuzzy WASPAS for construction site selection. International Journal of Computers Communications & Control, 10(6), 113-128.

Journal of Management, Marketing and Logistics -JMML (2017), Vol.4(2), p.186-201 Ayrim, Can
_________________________________________________________________________________________________
DOI: 10.17261/Pressacademia.2017.463 201
Vafaeipour, M., Zolfani, S. H., Varzandeh, M. H. M., Derakhti, A., & Eshkalag, M. K. (2014), Assessment of regions priority for implementation of solar projects in Iran: New application of a hybrid multi-criteria decision making approach. Energy Conversion and Management, 86, 653-663.
Wu, W.W. (2012), “Segmenting Critical Factors For Successful Knowledge Management Implementation Using The Fuzzy DEMATEL Method”, Applied Soft Computing, Volume 12, Issue 1, Pages 527-535.
Zadeh, L. A. (1965), Fuzzy Sets, Information and Control, 8, p.338-353.
Zadeh, L. A. (1975), The Concept of a Linguistic Variable and its Application to Approximate Reasoning-I, Information Sciences, 8, p.199-249.
Zavadskas, E.K., Turskis, Z., Antucheviciene, J., Zakarevicius, A. (2012). Optimization of Weighted Aggregated Sum Product Assessment. Elektronika ir Elektrotechnika – Electronics and Electrical Engineering, 122(6), 3–6.
Zavadskas, E. K., Antucheviciene, J., Šaparauskas, J., Turskis, Z. (2013a), Multi-criteria assessment of facades’ alternatives: peculiarities of ranking methodology. Procedia Engineering, 57, 107-112.
Zavadskas, E. K., Antucheviciene, J., Saparauskas, J., & Turskis, Z. (2013b), MCDM methods WASPAS and MULTIMOORA: verification of robustness of methods when assessing alternative solutions. Economic Computation and Economic Cybernetics Studies and Research, 47(2), 5-20.
Zavadskas, E. K., Antucheviciene, J., Hajiagha, S. H. R., & Hashemi, S. S. (2014), Extension of weighted aggregated sum product assessment with interval-valued intuitionistic fuzzy numbers (WASPAS-IVIF). Applied Soft Computing, 24, 1013-1021.
Zavadskas, E. K., Turskis, Z., & Antucheviciene, J. (2015), Selecting a Contractor by Using a Novel Method forMultiple Attribute Analysis: Weighted Aggregated SumProduct Assessment with Grey Values (WASPAS-G)–Art. 02–Volume 24• Issue 2
Zammori F, Gabbrielli R (2011) ANP/RPN: A multi criteria evaluation of the risk priority number. Qual Reliab Eng Int 28(1):85–104.
Zolfani, S. H., Aghdaie, M. H., Derakhti, A., Zavadskas, E. K., Varzandeh, M. H. M. (2013), Decision making on business issues with foresight perspective; an application of new hybrid MCDM model in shopping mall locating. Expert systems with applications, 40(17), 7111-7121.