About the Irish Universities Nutrition Alliance the Irish Universities Nutrition Alliance The Irish...
41
North/South Ireland food consumption survey: summary report. Item Type Report Authors Irish Universities Nutrition Alliace (IUNA);Safefood Food Safety Promotion Board Publisher Safefood Download date 01/09/2018 19:35:16 Link to Item http://hdl.handle.net/10147/265434 Find this and similar works at - http://www.lenus.ie/hse
Transcript of About the Irish Universities Nutrition Alliance the Irish Universities Nutrition Alliance The Irish...

North/South Ireland foodconsumption survey: summary report.
Item Type Report
Authors Irish Universities Nutrition Alliace (IUNA);Safefood Food SafetyPromotion Board
Publisher Safefood
Download date 01/09/2018 19:35:16
Link to Item http://hdl.handle.net/10147/265434
Find this and similar works at - http://www.lenus.ie/hse
About the Irish Universities Nutrition Alliance The Irish Universities Nutrition Alliance (lUNA) is a formal association of the academic nutrition units at Trinity College Dublin, University College Cork and the University of Ulster. The IUNA is committed to joint initiatives in research and teaching.
Irish Universities Nutrition Alliance (www.iuna.net)
Trinity College Dublin UniVersity College Cork University of Ulster
Department of Clinical Medicine Nutritional Scien~es Northern Ireland Centre Trinity Centre for Health Department of Food Science, for Diet and Health (NICHE) Sciences Food Technology and Nutrition St. James's Hospital University College Cork University of Ulster Dublin 8 Cork Coleraine BT52 1SA Ireland Ireland Northern Ireland
rei: +353-1-6082101 rei: +353-21-4902649 rei: +44-2870-324795 Fax: +353-1-4542043 Fax: +353-21-4270244 Fax: +44-2870-324965 email: mgibneyOtcd.ie email: [email protected] email: [email protected]
This summary report provides an outline of the IUNA North/South Ireland Food Consumption Survey: Food And Nutrient Intakes, Anthropometry, Attitudinal Data & Physical Activity Patterns. A detailed description of the methodogy used and the data obtained from the survey will be made available on the internet at www.iuna.net.
Note: Our website home page www.iuna.netis temporarily out of service. Please access www.ulst.ac.uklvsbms/iuna
Olrish Universities Nutrition Alliance 2001 Published by: Food Safety Promotion Board, Abbey Court, Lower Abbey Street, Dublin 1 ISBN: 9-9540351-0-0

I I •
BOO R
outh ~re~and food (onsumpt~on Survey
" . Irish Universities Nutrition Alliance
: Summary Report
~ File Captured Inform a & Indexed to Adobe PDF

I: Nfu; !Jfea{th Lwrarg J
North/South Ireland Food Consumption Survey

FOREWORD
In the past 20 years, with increasing
affluence and changing lifestyles on the
island of Ireland, attitudes and approaches
to food have altered dramatically. As a
result of these changes the tenet of °meat
and two veg" of the last generation no
longer adequately describes the diet of
today's population. The Irish Universities
Nutrition Alliance (lUNA) in conducting this
survey has created a clear picture, which
illustrates the significant changes in our
dietary habits.
The relationship between nutrition and
health is well documented. A poor diet and
nutrition are identified as risk factors for
cardiovascular disease, obesity, diabetes
mellitus, gastrointestinal disease,
osteoporosis, and some types of cancer.
The Food Safety Promotion Board public
health programme aims to foster the
provision and consumption of a healthy and
nutritious diet as a key intervention tool in
protecting and improving public health.
The Board seeks to improve the knowledge
and skills necessary for the public to choose
a safe and healthy diet. To this end detailed
nutritional information regarding
population dietary habits is essential.
In the wake of BSE and other food scares,
consumers have been primarily concerned
with issues of food safety. While food
safety concerns must of course be
addressed, we must also foster a healthy ,"t ,
diet. This is of particuiiir import~nce given
that nutritional imbalances currently pose
the most significant public health risk in
developed countries.
The IUNA survey is therefore both extremely
valuable and timely. The information
provided by the survey will enhance the
knowledge of policy makers in developing
public health interventions aimed at
reducing the risk of nutrition related
disease in the next generation.
Martin Higgins
Interim Chief Executive
Food Safety Promotion Board

p1
North/South Ireland Food Consumption Survey.
Summary Report on
Food and Nutrient I ntakes, A nthropometry, A ttitudinal 0 ata & Physical Activity Patterns
Irish Universities Nutrition Alliance
Summary Report prepared by Dr. Mairead Kiely
, nIl .lDJJ ULSTEil
University College, Cork University of Ulster Trinity College, Dublin Irish Universities Nutrition Alliance

p2
IRISH UNIVERSITIES NUTRITION ALLIANCE RESEARCH TEAM: I This survey was carried out by the following team:
Trinity College Dublin
University College Cork
University of Ulster
Funding
Professor Michael J. Gibney, Professor of Nutrition
Ms. Karen Harrington, joint Project Co-ordinator
Ms. Sinead McCarthy, Research Nutritionist
Ms. Maureen McGowan, Research Nutritionist
Professor Albert Flynn, Professor of Nutrition
Dr. Mairead Kiely, joint Project Co-ordinator
Ms. Marie Galvin, Research Nutritionist
Ms. Evelyn Hannon, Research Nutritionist
Ms. Maria 0' Brien, Research Nutritionist
Ms. Niamh 0' Connor, Research Nutritionist
Professor Sean Strain, Professor of Nutrition
Dr. Barbara Livingstone, Reader in Human Nutrition
Dr. Paula Robson, joint Project Co-ordinator
Ms. Sabrina Bell, Research Assistant
Mr. Paul Browne, Research Assistant
Ms. Caroline McClafferty, Research Assistant
Ms. Romilly Moore, Research Assistant
Ms. Caitriona 0' Doherty, Research Assistant
Ms. Glenda Wilson, Research Assistant
The IUNA is grateful to the following who provided funds to carry out this survey:
,~ the Department of Agriculture, Food and Rural Development in Dublin through the Non
Commissioned Food Research Programme, part financed by the European Regional
Development Fund.
,~ the Food Safety Authority of Ireland and its predecessor, the Food Safety Advisory Board.
f) the Northern Ireland Centre for Diet and Health at the University of Ulster, which is
assisted by the European Regional Development Fund through the IRTU Technology
Development Programme.
f) industrial partners: Kelloggs, Bord Bia, Coca-Cola, Cadburys, Dairy Council for Northern
Ireland, Irish Sugar, Kerry Group, Mars Confectionery, Meat and Livestock Commission
UK, National Dairy Council, Nestle Ireland, Tesco Ireland and the Irish Business and
Employers Confederation (lBEQ.
I

p3
Acknowledgments
Many people kindly gave their time and advice at various stages throughout the survey,
which was invaluable to the success of this project. The IUNA would especially like to thank
and acknowledge the following people for their advice and assistance:
~ Dr. Karin Hulshof, TNO, Zeist, Netherlands, Dr. Joyce Hughes, UK Department of Health,
Ms. Janet Gregory, UK Office of Population Censuses and Surveys, Mr. Steven Finch, UK
National Centre for Social Research formerly SCPR, Dr. Gillian Smithersand Dr. Michael
Day, UK Ministry of Agriculture, Fisheries and Food, Dr. Mary Flynn, Dublin Institute of
Technology, Kevin St., Dr. Joyce Lambe, Dr. Mary Kearney, Dr. John Kearney and Mrs. Jo
Gibney, Institute of European Food Studies, Dr. Barbara Knox, University of Ulster, all of
whom kindly advised on various aspects of the design and methodology of the project.
'lOur colleagues, Dr. Yvonne Carroll, Dr. Bernice Corridan, Ms. Kay Cunningham, Ms. Sheila
King, Dr. Helen Roche, Ms. Yvonne Ryan and Dr. Nick Kennedy, who also advised on
methodological aspects of the survey.
~ Dr. Gordon Cran, Queen's University Belfast and Mr. James Williams, Economic and Social
Research Institute in Dublin, for their advice and help in survey sampling.
~ Dr. Nick War~ham, Institute of Public Health, University of Cambridge, UK, who kindly
provided the Physical Activity Questionnaire, the computer programme to process the
data and also assisted in data analysis. Thanks also to his assistant, Dr. Kirsten Rennie.
~ Mr. Anthony Johns, linuviel Software, Warrington, UK, who developed the customised
software used on this project, both the nutrient analysis software {WISP©, WISP-DES©,
EMS©} and the questionnaire software (Q-DES©, Q-CON©).
~ Mr. Alan Morgan, CMS Weighing Equipment, London, UK, for his helpful advice on
calibration of the anthropometric equipment and Mr. Jim Mannion, Legal Metrology
Service, Dublin and the technicians of NICHE, University of Ulster, for carrying out the
calibration.
'1 The Central Statistics Office, Dublin and the UK Office of Population Censuses and
Surveys, for advice on classification of social class, socioeconomic status and socio
demographic status.
~ All the companies and food manufacturers who so kindly provided nutrition composition
details of their products.
" Mr. Jim Larragy, Information Systems Services, Trinity College Dublin, for his advice on
creating the relational database using SPSS and training of the survey team in the use of
SPSS and Ms. Kathleen 0' Sullivan, University College Cork, for statistical assistance.
" Cara Prior, Deirdre Brady, Dr. Michelle McKinley, George Hull, Shauna Trainor, Rachel
Gawley, Jacinta Greene and Mary Gilsenan for their help with questionnaire data entry.
Sincere thanks are due to the Food Safety Promotion Board for supporting and organising
the launch and publication of the Summary Report.
Most importantly, sincerest thanks to all those who volunteered to participate in the survey,
willingly gave up their time and welcomed us into their homes. Without you this survey
would not have been possible.

p4
Main Outcomes I Foods and beverages I Overall, the 18 to 64 year old population of Ireland, North and South, consumed a wide variety
of foods and beverages. Potatoes, bread and dairy products were consumed by almost
everybody. Tea was the most common beverage, and was drunk by 91 % of adults. Respondents
consumed a wide range of meats, meat dishes, vegetables and vegetable dishes. Meats, breads,
potatoes, dairy products and biscuits/cakes provided almost 60% of energy. Overall,24% of food
and drink energy was consumed outside the home. Younger adults aged 18-35 years (particularly
men) obtained twice as much energy from food and drink consumed outside the home as adults
aged 51-64 years.
Alcohol I Eighty percent of respondents (81 % of men and 79% of women) were alcohol consumers.
Younger adults (18-35 years) were more likely to consume alcohol (74% of men and 70% of
women), and in larger quantities, than older adults (51-64 years) (66% of men and 40% of
women). Two out of 3 men and 4 out of 5 women consumed alcohol in quantities that were
within the recommended ranges. However, 36% of men and 20% of women reported
consuming greater quantities than the recommended maximum weekly intakes of 21 units for
men and 14 units for women.
Energy and Macronutrients I Five food groups including meats, breads, potatoes, dairy products and biscuits/cakes provided
59% of energy. Protein intakes were more than adequate in most people. Meats, dairy
products and breads provided two thirds of the protein consumed. Mean daily fat intakes in
men and women were higher, and mean carbohydrate intakes were lower than current dietary
recommendations. The four main sources of fat in the diet were meats, spreading fats and oils,
dairy products and biscuits/cakes. More than half of the carbohydrate was provided by breads,
potatoes, biscuits/cakes, confectionery and savoury snacks.
Dietary Fibre I Men had higher intakes of fibre than women did but women consumed more fibre-dense diets
than men. Breads, potatoes and vegetables provided two-thirds of the fibre consumed. More
than 3 out of 4 adults did not meet the nutritional goal for dietary fibre intakes. The mean
daily fibre intake was below the minimum of the recommended range in almost half of
women and one quarter of men. This is likely to contribute to impaired bowel function and
constipation, which in turn may contribute to increased risk of chronic gastrointestinal disease.
p5
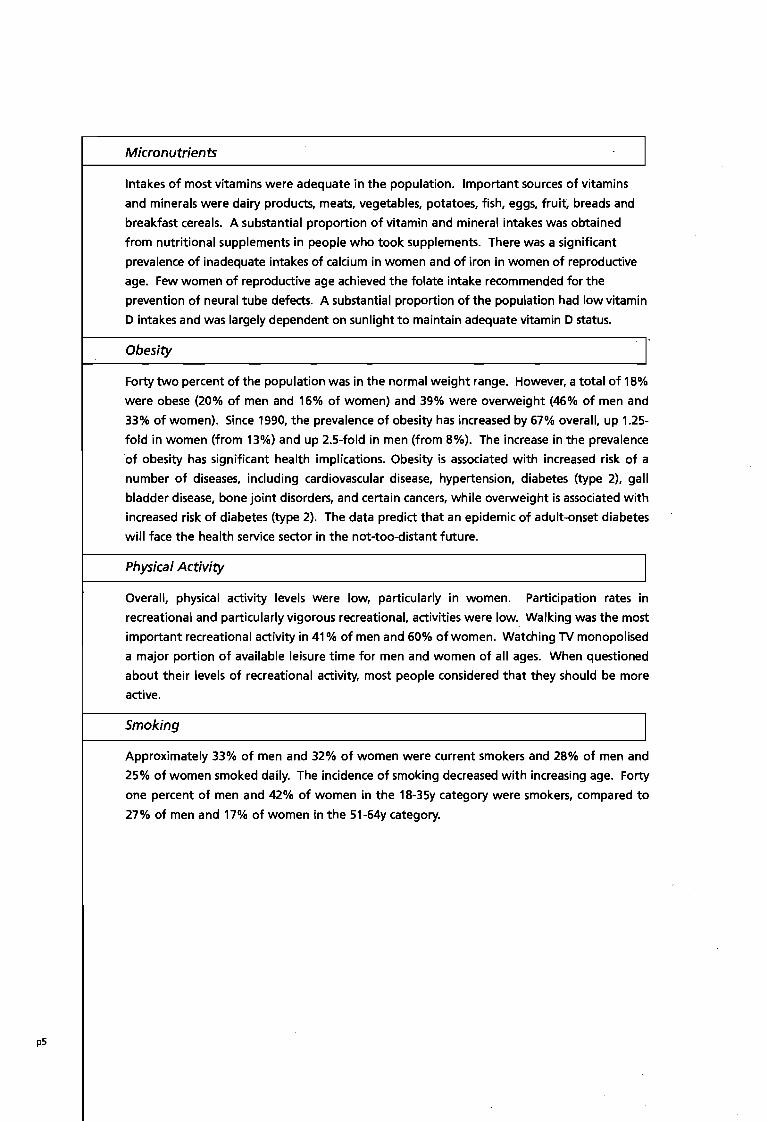
Micronutrients I Intakes of most vitamins were adequate in the population. Important sources of vitamins
and minerals were dairy products, meats, vegetables, potatoes, fish, eggs, fruit, breads and
breakfast cereals. A substantial proportion of vitamin and mineral intakes was obtained
from nutritional supplements in people who took supplements. There was a significant
prevalence of inadequate intakes of calcium in women and of iron in women of reproductive
age. Few women of reproductive age achieved the folate intake recommended for the
prevention of neural tube defects. A substantial proportion of the population had low vitamin
D intakes and was largely dependent on sunlight to maintain adequate vitamin D status.
Obesity
Forty two percent of the population was in the normal weight range. However, a total of 18%
were obese (20% of men and 16% of women) and 39% were overweight (46% of men and
33% of women). Since 1990, the prevalence of obesity has increased by 67% overall, up 1.25
fold in women (from 13%) and up 2.5-fold in men (from 8%). The increase in the prevalence
of obesity has significant health implications. Obesity is associated with increased risk of a
number of diseases, including cardiovascular disease, hypertension, diabetes (type 2), gall
bladder disease, bone joint disorders, and certain cancers, while overweight is associated with
increased risk of diabetes (type 2). The data predict that an epidemic of adult-onset diabetes
will face the health service sector in the not-too-distant future.
Physical Activity I Overall, physical activity levels were low, particularly in women. Participation rates in
recreational and particularly vigorous recreational, activities were low. Walking was the most
important recreational activity in 41 % of men and 60% of women. Watching TV monopolised
a major portion of available leisure time for men and women of all ages. When questioned
about their levels of recreational activity, most people considered that they should be more
active.
Smoking I Approximately 33% of men and 32% of women were current smokers and 28% of men and
25% of women smoked daily. The incidence of smoking decreased with increasing age. Forty
one percent of men and 42% of women in the 18-35y category were smokers, compared to
27% of men and 17% of women in the 51-64y category.

Introduction
p6

p7
Introduction
This Summary Report describes the methods
used and the main findings with regard to
food and beverage consumption, nutrient
intakes, and anthropometric, physical
activity and attitudinal data from the
North/South Ireland Food Consumption
Survey (NSIFCS). This survey investigated
habitual food and beverage consumption,
lifestyle, health indicators and attitudes to
food and health in a representative sample
(n=1379) of the 18-64 year old adult
population in the Republic of Ireland and
Northern Ireland during 1997-1999. The
extensive electronic database which has
been compiled from this survey is the most
complete and up-to-date collection of food
consumption data available for adults in the
island of Ireland. It is one of the most
comprehensive of its kind in Europe. It
represents a very valuable resource, which
will be used by agencies concerned with
public health policy and planning and
consumer health protection in Ireland and
Europe and by the food industry.
The survey was carried out by the Irish
Universities Nutrition Alliance (lUNA - a
formal alliance of the academic nutrition
centres at University College, Cork, Trinity
College, Dublin and the University of Ulster,
Coleraine which is committed to joint
initiatives in research and teaching). It was
funded jOintly by the Department of
Agriculture, Food, and Rural Development,
the Food Safety Authority of Ireland, the
Northern Ireland Centre for Diet and Health
and thirteen food industry partners.
A detailed description of the methodology
used and the data obtained from the survey
will be made available on the internet at
wwwjuna.net.
pS
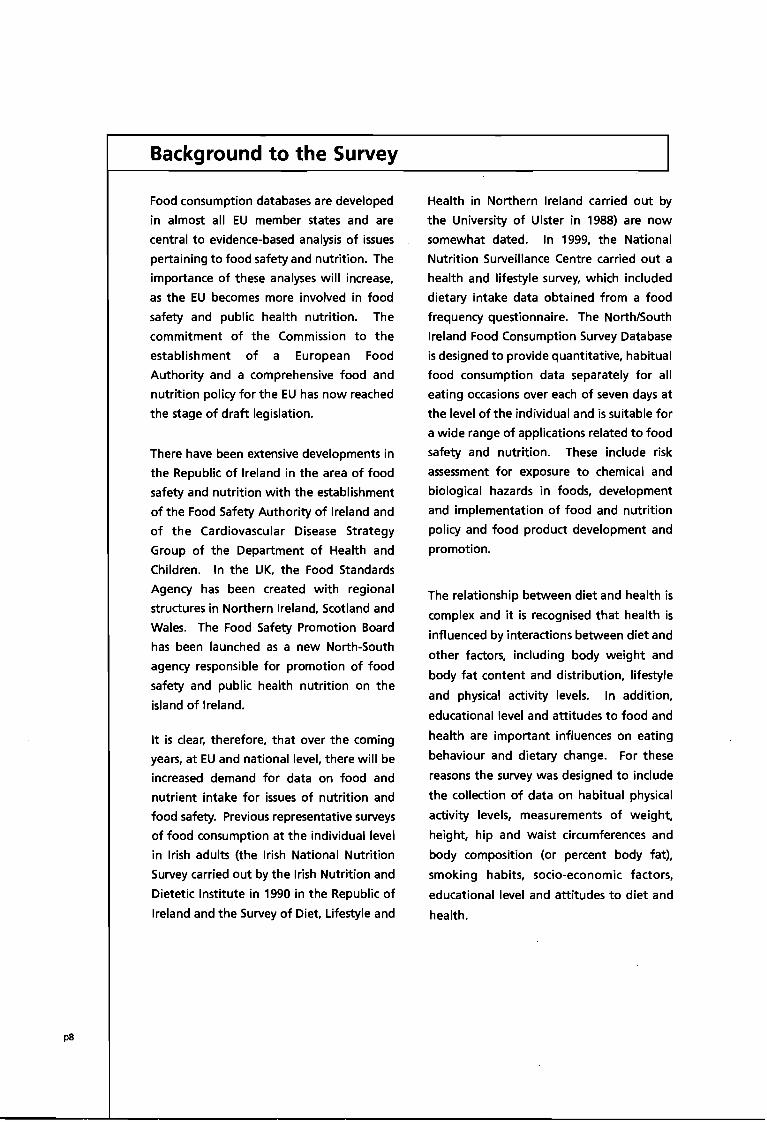
Background to the Survey
Food consumption data bases are developed
in almost all EU member states and are
central to evidence-based analysis of issues
pertaining to food safety and nutrition. The
importance of these analyses will increase,
as the EU becomes more involved in food
safety and public health nutrition. The
commitment of the Commission to the
establishment of a European Food
Authority and a comprehensive food and
nutrition policy for the EU has now reached
the stage of draft legislation.
There have been extensive developments in
the Republic of Ireland in the area of food
safety and nutrition with the establishment
of the Food Safety Authority of Ireland and
of the Cardiovascular Disease Strategy
Group of the Department of Health and
Children. In the UK, the Food Standards
Agency has been created with regional
structures in Northern Ireland, Scotland and
Wales. The Food Safety Promotion Board
has been launched as a new North-South
agency responsible for promotion of food
safety and public health nutrition on the
island of Ireland.
It is clear, therefore, that over the coming
years, at EU and national level, there will be
increased demand for data on food and
nutrient intake for issues of nutrition and
food safety. Previous representative surveys
of food consumption at the individual level
in Irish adults (the Irish National Nutrition
Survey carried out by the Irish Nutrition and
Dietetic Institute in 1990 in the Republic of
Ireland and the Survey of Diet, Lifestyle and
Health in Northern Ireland carried out by
the University of Ulster in 1988) are now
somewhat dated. In 1999, the National
Nutrition Surveillance Centre carried out a
health and lifestyle survey, which included
dietary intake data obtained from a food
frequency questionnaire. The NorthlSouth
Ireland Food Consumption Survey Database
is designed to provide quantitative, habitual
food consumption data separately for all
eating occasions over each of seven days at
the level of the individual and is suitable for
a wide range of applications related to food
safety and nutrition. These include risk
assessment for exposure to chemical and
biological hazards in foods, development
and implementation of food and nutrition
policy and food product development and
promotion.
The relationship between diet and health is
complex and it is recognised that health is
influenced by interactions between diet and
other factors, including body weight and
body fat content and distribution, lifestyle
and physical activity levels. In addition,
educational level and attitudes to food and
health are important influences on eating
behaviour and dietary change. For these
reasons the survey was designed to include
the collection of data on habitual physical
activity levels, measurements of weight,
height, hip and waist circumferences and
body composition (or percent body fat),
smoking habits, socio-economic factors,
educational level and attitudes to diet and
health.

pg
Aims and Objectives of the Survey
1 To establish in a representative sample of adults aged 18 to 64 years on the island of Ireland a database of:
n habitual food and beverage consumption
n height, weight, body fat content and distribution
n habitual physical activity levels
n lifestyle characteristics, including smoking habits
n attitudes to food and health
n socio-demographic characteristics
2 To apply this database to investigate:
food and nutrient intakes in relation to nutritional adequacy and excess and
compliance with current dietary guidelines
body weight, body fat content and distribution, habitual physical activity levels,
lifestyle and socio-demographic characteristics, and attitudes in relation to food and
health
In addition the survey design and the database structure were selected with a view to
facilitate its use for a number of other key purposes, including:
risk assessment for exposure to chemical and biological hazards in the food supply
the development of quantitative and qualitative food based dietary guidelines for
healthy eating
estimation of current nutrient intakes, and modelling of potential future nutrient
intakes from fortified foods and nutritional supplements
to provide scientific data to underpin food product development and promotion
plO
Sampling and Recruitment Procedures and Methods
of Data Collection
pll
Sampling and Recruitment Procedures and Methods of Data Collection A sample of 1379 adults between the ages
of 18 and 64 years, including 662 men and
717 women and excluding pregnant and
lactating mothers, from all over the island
of Ireland, took part in the survey. The
participants were randomly selected using
the electoral register as the sampling frame.
Each person who was selected was
contacted by mail and followed up shortly
afterwards with a visit from a researcher.
Eligible persons were invited to participate
and a consent form was signed. The
response rate was 63%, which was high
given the sizeable commitment to the study
on the part of the respondents. Analysis of
the demographic profile of the sample has
confirmed that the survey sample was
representative of the population of the
island of Ireland with respect to age, sex..
geographical location (urban/rural), marital
status, social class and socio-economic
group.
Food intake was determined using a 7-day
estimated food record. The respondent
kept a diary of everything he/she ate and
drank over a one-week period, recording
the time, location, amount, cooking method
and quantity of each item of food and drink
consumed. To ensure that the level of detail
and accuracy of recording was kept at a
consistently high level, a researcher visited
the respondent in their home or workplace
four times during the recording week. A
comprehensive quantification protocol,
which included a combination of food
quantification methods, was used to obtain
the best estimates of food and drink
consumed. The researcher weighed some
foods e.g. breakfast cereals, spreading, fats
and beverages. A specially designed
photographic food atlas was used to assign
weights to other foods. Respondents were
encouraged to keep food packaging to
allow improved accuracy of the food and
portion descriptions.
Self-administered questionnaires were used
to collect information on employment
status, social and demographic variables,
lifestyle factors, habitual physical activity
levels, attitudes, health status, medication,
supplement use and dieting habits. The
researcher carried out body measurements,
including height, weight, waist and hip
circumference and body composition (i.e.
fat/lean ratio using bioeletrical impedance
analysis).
The survey commenced in 1997 with a
feasibility study to evaluate the proposed
methods and to estimate response rates.
The main phase of the fieldwork started in
October 1997 and data collection was
completed in October 1999. Data collection
was seasonally balanced. The data were
compiled into a fully integrated relational
database. This means that each piece of
data collected for each respondent is linked
to that respondent's ID number. Quality
control procedures were implemented
throughout the collection, processing and
compilation of data.
The survey was designed to provide data on
an all-Ireland basis. Although the database is
structured so that the data can be analysed
for the island as a whole or separately for the
North and South, the investigators would
caution against drawing any major
conclusions from North-South comparisons,
as regional comparisons were not included in
the study design. Given that such
comparisons might interest the general
public, the investigators have made some
comparisons in key areas of public health
nutrition and have found no differences in
food and nutrient intake or in body weight
or physical activity.

Anthropometry
p12

Anthropometry Anthropometric data including weight, body weight in kg divided by body height in
height, waist circumference, hip metres squared) which is the standard
circumference and body composition are measure of relative body weight was
shown in Table 1. Body Mass Index (BMI; calculated using weight and height data.
TABLE 1
ANTHROPOMETRIC MEASUREMENTS FOR MEN AND WOMEN BY AGE GROUP IN THE NS\FCS----
Men Women
1S-64y 1S-35y 36-50y 51-64y 1S-64y 1S-35y 36-5Oy 51-64y
WEIGHT (kg) j 82.9 81.0 84.8 83.2 67.5 64.6 68.1 71.1
I HEIGHT (m) 1.75 1.77 1.75 1.73 1.62 1.63 1.62 1.60
BMI (kg/m') 26.9 25.8 27.7 27.6 25.8 24.4 26.1 27.8
WAIST CIRCUMFERENCE (cm) i 94.3 90.3 96.6 97.6 I
81.2 77.5 81.9 86.6 I
HIP CIRCUMFERENCE(cm)
I 104.1 103.0 105.4 104.1 I 101.8 99.6 102.3 i04.9
WAIST TO HIP RATIO J
0.91 0.88 0.92 0.94 0.80 0.78 0.80 0.82
BODY FAT (%) i 21.2 17.7 22.7 24.0 33.2 29.2 34.1 39.1
TABLE 2
PERCENT MEN AND WOMEN IN EACH AGE GROUP IN EACH OF THE BMI CATEGORIES
FROM THE NSIFCS AND THE IRISH NATIONAL NUTRITION SURVEY 1990
Men Women
1S-64y 1S-35y 36-50y 51-64y 1S-64y 1S-35y 36-50y 51-64y
NSIFCS 2000 I
UNDERWEIGHT I 0.3 0.8 0.0 0.0
I 1.1 2.3 0.4 0.7
I
I NORMAL
I 33.3 44.6 26.7 25.0
I 50.4 64.2 47.0 32.9
OVERWEIGHT 46.3 41.3 48.9 50.6 I 32.5 24.5 37.7 36.8
OBESE I 20.1 13.3 24.4 24.4 ,
15.9 9.1 15.0 29.6
INNS 1990 I I UNDERWEIGHT
I 0.40 0.8 0.0 0.0 I 2.7 3.6 1.1 2.7
NORMAL 41.0 58.1 23.7 26.8
I 56.0 69.3 56.4 25.7
! OVERWEIGHT I 50.8 37.1 64.5 62.5 28.4 20.5 33.0 40.5
I
OBESE : 7.8 4.0 11.8 10.7 I 12.9 6.6 9.6 31.1
The World Health Organisation (WHO) BMI cut-off points were used to estimate
the levels of underweight (<18.5 kglrnZ), normal weight (18.5-24.9 kglrnZ),
overweight (25.0-29.9 kglm2) and obesity (7?!30.0 kglrnZ) in the population.
p13
I

p14
I
Table 2 shows that, according to WHO
definitions, less than 1 % of individuals were
underweight, 42% were in the normal
weight range, 39% were overweight and
18% were obese. A higher percentage of
women (50.4%) than men (33.3%) were of
normal 'weight and a higher percentage of
men (46.3%) than women (32.5%) were
overweight. Overall, 20.1 % of men and
15.9% of women were obese.
The percentage of the population which
was overweight or obese increased with
increasing age. As can be seen in Table 2,
9% of women aged 18 to 35 years and
almost 30% of women aged 51 to 64 years
were in the obese category. It is also worth
noting that 2.3% of females aged 18 to 35
were underweight to a level that
corresponds to chronic energy deficiency by
WHO standards. In comparison to data
published in the Irish National Nutrition
Survey in 1990, the prevalence of obesity
has increased by 67% in the population. In
men in particular, the prevalence of obesity
has more than doubled, from 7.8% in 1990
to 20% in 2000.
The increase in the prevalence of obesity
has significant health implications. Obesity
FIGURE 1
is associated with increased risk of a number
of diseases, including cardiovascular disease,
hypertension, diabetes (type 2), gall bladder
disease, bone joint disorders, and certain
cancers, while overweight is associated with
increased risk of diabetes (type 2). The data
predict that an epidemic of adult-onset
diabetes will face the health service sector
in the not-too-distant future.
Body fat distribution is now recognised as an
important indicator of disease risk and
increased levels of fat deposited in the
central area of the body, measured by waist
circumference and waist to hip ratio, is
associated with increased risk of chronic
disease, including cardiovascular disease,
hypertension and diabetes (type 2). Cut-off
points have been established for waist
circumference and waist to hip ratio, which
identify people who are at increased risk of
these chronic diseases. Using these cut-offs,
waist circumference identified 24% of men
and 24% of women to be at an increased
risk, and an additional 23% of men and 23%
of women to be at a high risk for having CVD
risk factors. This risk increased with
increasing age for both men and women,
shown in Figure 1.
PERCENTAGE OF MEN AND WOMEN IN EACH GROUP WITH INCREASED RISK FOR CARDIOVASCULAR DISEASE, IDENTIFIED BY WAIST CIRCUMFERENCE
70
60
50
40
30
20
10
% 0
Men
18-64y 18-35y 36-50y 51-64y
Women
18-64y 18-35y 36-50y 51-64y
o High o Increased
I Normal

Food Consumption
p15

p16
Food Consumption
Foods and Beverages
During the course of the survey, respondents
recorded 3,060 individual food items into the
7-day food diary. Each of these foods was
allocated to one of 68 food groups. Table 3
TABLE 3
summarises some of the data from the report
on average food group intakes in the total
population and in consumers only.
MEAN AND SD OF FOOD GROUP INTAKES (g/DAY) IN THE TOTAL SAMPLE, PERCENTAGE CONSUMERS
OF FOOD GROUPS, AND MEAN AND SO OF FOOD GROUP INTAKES (g/OAY) IN CONSUMERS ONLY
Population (n=1379) Consumers only
Mean SO % consumers Mean SO
1 Rice & Pasta, Flours, Grains & Starches
2 Savouries 24 40
78 59 94 83 57
8 Biscuits 14 18 76 19 18
9 Cakes, Pastries & Buns 17 25 60 29 26
10 Wholemilk 150 188
11 Low Fat, Skimmed & Fortified Milks 88
12 Other Milks 5 32 6 88 101
13 Creams 2 5
14 Cheeses 12 15
15 Yoghurt~ 16 33 32 49 41
7
s & Chilled Desserts 16 27 50 32 31
18 Milk Puddin s 6 16
Dishes 17 21 68 25 22
4 11
22 Other S 12 14
23 Oils* 0 14 2 2
24 Hard Cook in Fats 0
158 165
26 Processed & Homemade Potato Products 7 17
27 Chi ed, Fried & Roasted Potatoes
28 Ve etable & Pulse Dishes 17 43 50 34 56
29 Peas, Beans & Lentils 23 27 75 30 27

Population (n=1379) Consumers only
Mean SD % consumers Mean SD
30 Green Vegetables 14 18 63 22 18
31 Carrots 15 20 66 22 22
32 Salad Vegetables 24 28 76 32 28
33 Other Vegetables 25 27 85 30 27
34 Tinned or Jarred Vegetables 3 8 23 12 14
35 Fruit Juices 33 60 41 81 70
36 Bananas 27 44 49 56 49
37 Other fruits 45 65 62 72 69
38 Citrus Fruit 22 50 31 71 68
39 Tinned Fruit 3 9 14 18 18
40 Nuts & Seeds, Herbs & Spices 1 5 18 7 11
41 Fish & Fish p'roducts 23 27 66 35 26
42 Fish Dishes 3 13 7 40 27
43 Bacon & Ham 22 25 80 27 25
44 Beef & Veal 17 25 55 31 26
45 Lamb 7 16 26 27 21
46 Pork 10 19 35 29 20
47 Chicken, Turkev & Game 22 25 71 31 25
48 Offal & Offal Dishes 1 5' 4 19 15
49 Beef & Veal Dishes 31 46 47 65 47
50 Lamb, Pork & Bacon Dishes 7 22 14 50 37
51 Poultry & Game Dishes 21 37 35 60 40
52 Burgers (Beef & Pork) 7 15 28 25 20
53 Sausages 10 13 59 16 14
54 Meat Pies & Pastries 5 16 19 29 24
55 Meat Products 19 24 70 27 24
56 Alcoholic Beverages 333 587 65 513 662
57 Sugars, Syrups, Preserves & Sweeteners 18 23 80 23 24
58 Chocolate Confectionery 12 20 63 19 23
59 Non-chocolate Confectionery 2 5 23 8 8
60 Savoury Snacks 6 11 48 12 13
61 Soups, Sauces & Miscellaneous Foods 46 52 93 50 52
62 Teas 561 409 91 619 385
63 Coffees 153 259 55 279 295
64 Other Beverages 258 386 77 335 410
65 Carbonated Beverages 86 152 54 158 177
p17 66 Diet Carbonated Beverages 35 121 21 170 218
67 Squashes, Cordials & Fruit Juice Drinks 20 67 21 96 118
.. Does not include oils consumed in recipes

p18
The most commonly consumed foods were
potatoes, breads and dairy products, which
were consumed by almost the whole
population. Potatoes (all types except
crisps) were consumed by over 99% of the
population, and the mean intake among
consumers was 225g per day. Similarly,
breads were consumed by over 99% of
adults with a mean intake of 139g per day.
Dairy products including milk, cheese, cream
and yoghurt were consumed by 99.7% and
the mean daily intake was 281g, of which
milk comprised 243g. Bacon and ham were
the most commonly consumed meats (80%),
followed by chicken (71 %), sausages (59%)
and beef (55%). The majority of the
population consumed vegetables and fruits.
Men consumed greater amounts of food
from most food groups than women, but
women consumed a greater variety of foods
than men did. Age-related differences were
observed with regard to food choice in men
and women, with those in the older age
categories having a greater consumption of
wholemeal and brown breads, porridge,
green vegetables and tea. People in the 18
to 35 year age group ate more rice, pasta,
chips and savoury snacks than those aged 51
to 64 years.
Ninety one percent of the sample drank tea
with an average daily consumption of 619
ml. Coffee was consumed by 55% of the
population, averaging 279 ml per day.
I Alcohol
Questionnaire data from the sample, which
estimated usual alcohol intake, found that
80% (81 % of men and 79% of women)
were alcohol consumers. Sixty five percent
of the sample (70% of men and 61 % of
women) recorded alcohol consumption
during the 7 day recording period. The
average daily consumption of alcoholic
beverages in drinkers was 767ml in men and
244ml in women. Men and women in the
18 to 35 year group were more likely to
consume alcohol (74% of men and 70% of
women), than men and women aged 51-64
years (66% of men and 40% of women).
The mean consumption of alcoholic
beverages in 18-35 year old men was 971ml
per day, compared with 596ml per day in 51-
64 year old men. Similarly, younger women
consumed substantially more alcoholic
beverages (319ml per day) than older
women did (139ml per day).
The questionnaire data show that 2 out of 3
men and 4 out of 5 women consumed
alcohol in quantities that were within the
recommended ranges. However, in alcohol
drinkers, more than one third (36%) of men
and one fifth (20%) of women consumed
greater than the maximum alcohol intake
of 21 units and 14 units per week for men
and women, recommended by the
Department of Health and Children.
Eating Out
With increasing prosperity and changing
social and work conditions many people are
eating out of home more frequently. In the
Survey, respondents were asked to record,
in the food diary, where each item of food
was eaten. Sixty eight percent of
eating/drinking occasions were n at home",
28% in a restaurantlpublcoffee
shop/takeaway ("out") and 4% in "other
people's homes". Seventy two percent of
energy was consumed "at home", 24% was
consumed "out" and 4% was consumed in
"other people's homes·. Figure 2 shows
that younger men and women (18-35 years)
obtained twice as much energy from foods
and drinks consumed outside the home as
51-64 year olds did and the proportion was
greater for men than women in each age
group.

p19
FIGURE 2
PERCENT OF TOTAL ENERGY FROM FOODS/DRINKS EATEN DOUT"
40
35 ______________________________________ _
30
25
20
15
10
%0
18-35y 36-50y 51-64y
Nutritional Supplements
The use of nutritional supplements was
assessed along with food consumption in
the 7-day food diary. In addition, habitual
supplement use was assessed in a
questionnaire. Three hundred and twenty
three respondents (23%) consumed
supplements during the recording week and
the questionnaire showed that 387
respondents (28%) said that they were
currently using supplements. Twice as many
women used supplements as men and this
ratio did not change with age. People in
D Women
I Men
the 36-50 and 51-64 year age categories had
a slightly higher rate of supplement use
than the 18-35 year olds. Other studies of
habitual supplement use in the US,
Germany, the Netherlands and Sweden have
reported similar rates of consumption. One
hundred and eighty four separate types of
supplements were recorded, including
single and multi-vitamin and mineral
preparations, a range of cod liver oil-based
products and others such as garlic and
ginseng.

Nutrient Intakes
p20

Nutrient Intakes Energy and macronutrients
Mean daily energy and macronutrient products (16%), breads (14%)' potatoes
intakes and the % of energy (excluding (11 %), milk, yoghurt and cheese (9%) and
alcohol) from macronutrients of men and biscuits, cakes and pastries (9%), shown in
women are presented in Table 4. Men had Figure 3. There was little difference
higher intakes of energy and all between men and women, in the % of
macro nutrients than women. Energy energy obtained from the various food
intakes decreased with increasing age for groups, with the exception of alcohol,
both men and women. Five food groups which provided almost twice as much
contributed 59% of energy intake in the energy in men as in women.
population overall, i.e. meat and meat
TABLE 4
MEAN AND SD OF ENERGY AND MACRONUTRIENT INTAKES AND THE % OF FOOD ENERGY
(EXCLUDING ALCOHOL) FROM MACRONUTRIENTS IN MEN AND WOMEN AGED 18 TO 64 YEARS
Total Population Men Women
n=1379 n=662 n=717
Mean SD Mean SD Mean SD
ENERGY (MJ) 9.3 3.1 11.0 3.1 7.6 2.0
PROTEIN (g) 84.4 26.9 100.2 26.6 69.8 17.2
% ENERGY 16.4 2.9 16.6 2.8 16.2 3.0
FAT (g) 87.1 102.2 34.3 73.1 24.9
% ENERGY 36.9 5.8 37.0 5.4 37.0 6.0
CHO (g) 260.1 91.1 305.1 96.0 218.6 62.3
% ENERGY 46.5 5.5 46.2 5.4 46.6 5.6 ,
ALCOHOL (g) 15.8 23.6 22.9 29.8 9.3 13.0
Figure 3
Percent contribution of food groups to energy intake
o~~'" The mean daily alcohol intake in men 17% 16%
Vegetables (22.9g1day) was 2.5 times that in women 4%
Breakfast 0 14% Breads (9.3g1d) and alcohol intakes were higher in
Cereals 4 Vo 18-35 year old men (29.6g1d) and women
~ Alchohol 5% Beverages 6% I~ ~~~" (12.9g/d) than in 51-64 year old men
Spreads 7% (17.9g1day) and women (3.9g1day). Confectionery 7% 9%
Milk & Yogurt Cakes & Biscuits
p21
p22
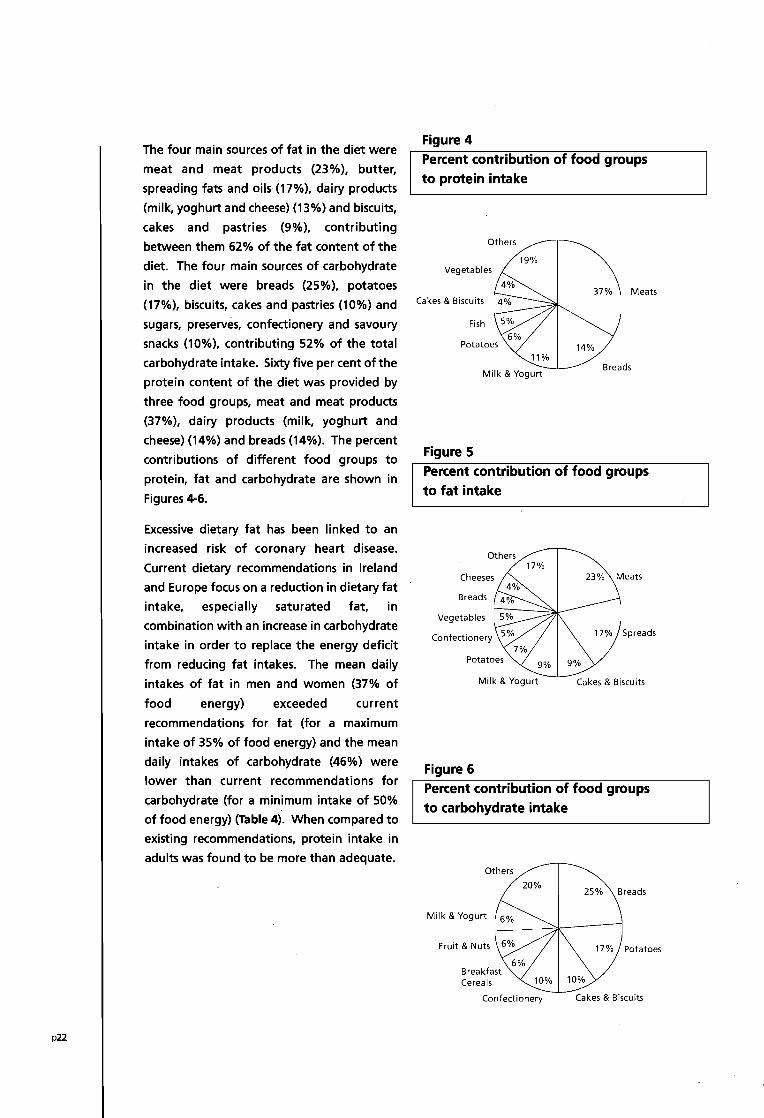
The four main sources of fat in the diet were
meat and meat products (23%), butter,
spreading fats and oils (17%), dairy products
(milk, yoghurt and cheese) (13%) and biscuits,
cakes and pastries (9%), contributing
between them 62% of the fat content of the
diet. The four main sources of carbohydrate
in the diet were breads (25%), potatoes
(17%), biscuits, cakes and pastries (10%) and
sugars, preserves, confectionery and savoury
snacks (10%), contributing 52% of the total
carbohydrate intake. Sixty five per cent of the
protein content of the diet was provided by
three food groups, meat and meat products
(37%), dairy products (milk, yoghurt and
cheese) (14%) and breads (14%). The percent
contributions of different food groups to
protein, fat and carbohydrate are shown in
Figures 4-6.
Excessive dietary fat 'has been linked to an
increased risk of coronary heart disease.
Current dietary recommendations in Ireland
and Europe focus on a reduction in dietary fat
intake, especially saturated fat, in
combination with an increase in carbohydrate
intake in order to replace the energy deficit
from reducing fat intakes. The mean daily
intakes of fat in men and women (37% of
food energy) exceeded current
recommendations for fat (for a maximum
intake of 35% of food energy) and the mean
daily intakes of carbohydrate (46%) were
lower than current recommendations for
carbohydrate (for a minimum intake of 50%
of food energy) (Table 4). When compared to
existing recommendations, protein intake in
adults was found to be more than adequate.
Figure 4
Percent contribution of food groups
to protein intake
Others
19% Vegetables
Meats Cakes & Biscuits
Fish
14%
Milk & Yogurt Breads
Figure 5
Percent contribution of food groups
to fat intake
Others 17%
Cheeses 23% Meats
Breads
Vegetables
Confectionery
Milk & Yogurt Cakes & Biscuits
Figure 6
Percent contribution of food groups
to carbohydrate intake
Others
20%
Milk & Yogurt
Fruit & Nuts
Cereals
Confectionery Cakes & Biscuits
p23
Dietary Fibre
The primary action of dietary fibre in the
body is in the gastrointestinal tract and
different fibre sources exert different
physiological effects. Insoluble fibre
absorbs water, and acts as a bulking agent
. in the stomach, thereby improving satiety.
Insoluble fibre also promotes laxation and
eating foods high in fibre has been found to
reduce symptoms of chronic constipation
and diverticular disease. Soluble fibre
delays the transit time of food through the
stomach and small intestine and improves
glycaemic control and insulin sensitivity.
Moderate epidemiological evidence
suggests a protective role for dietary fibre
against coronary heart disease.
The mean daily intake of dietary fibre in the
total sample was 20.2g. While, on average,
men consumed larger quantities of fibre
(23.2g) than women (17.4g), women
consumed more fibre-dense diets (2.33
g1MJ) than men (2.16 g/MJ). Expressed as
non-starch polysaccharide (NSP), i.e. dietary
fibre excluding lignin and resistant starch,
the mean daily intake in the total sample
was 14.8g (16.7g in men and 13.0g in
women). Women aged 18-35 years had the
lowest mean daily dietary fibre intake
(16.1g).
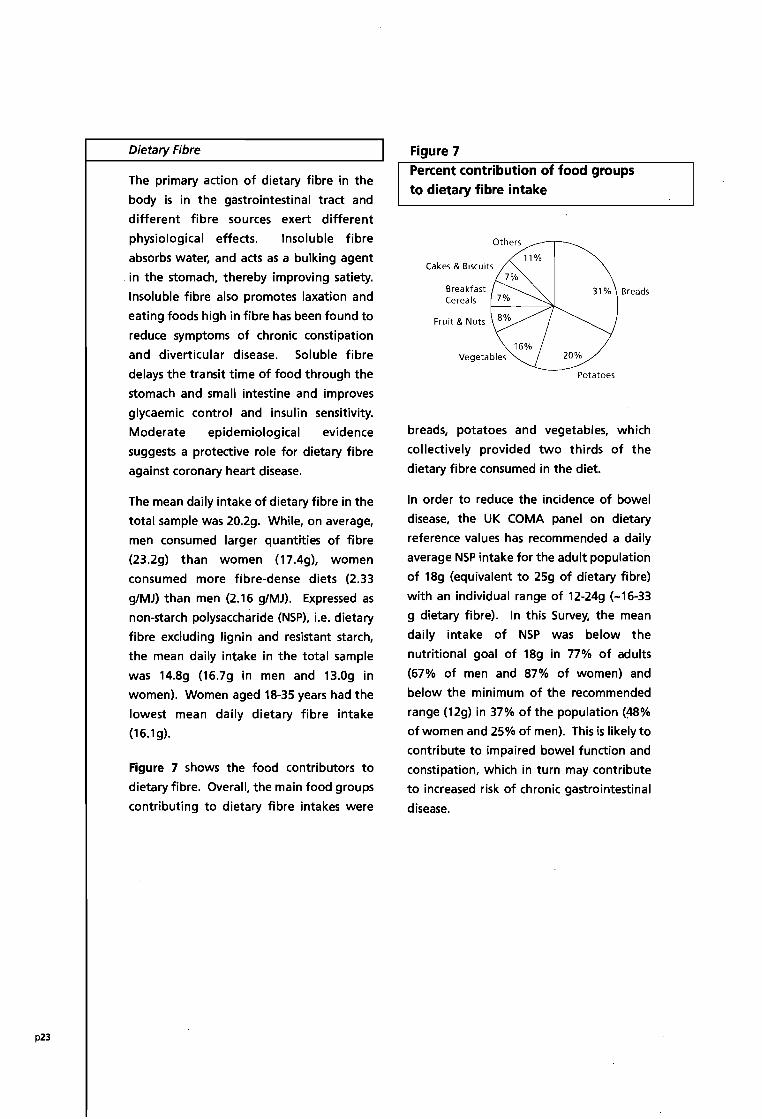
Figure 7 shows the food contributors to
dietary fibre. Overall, the main food groups
contributing to dietary fibre intakes were
Figure 7 Percent contribution of food groups to dietary fibre intake
Others
Cakes & Biscuits
Breakfast Cereals
Fruit & Nuts
11%
31 % Breads
20%
Potatoes
breads, potatoes and vegetables, which
collectively provided two thirds of the
dietary fibre consumed in the diet.
In order to reduce the incidence of bowel
disease, the UK COMA panel on dietary
reference values has recommended a daily
average NSP intake for the adult population
of 18g (equivalent to 25g of dietary fibre)
with an individual range of 12-24g (-16-33
g dietary fibre). In this Survey, the mean
daily intake of NSP was below the
nutritional goal of 18g in 77% of adults
(67% of men and 87% of women) and
below the minimum of the recommended
range (12g) in 37% of the population (~%
of women and 25% of men). This is likely to
contribute to impaired bowel function and
constipation, which in turn may contribute
to increased risk of chronic gastrointestinal
disease.

p24
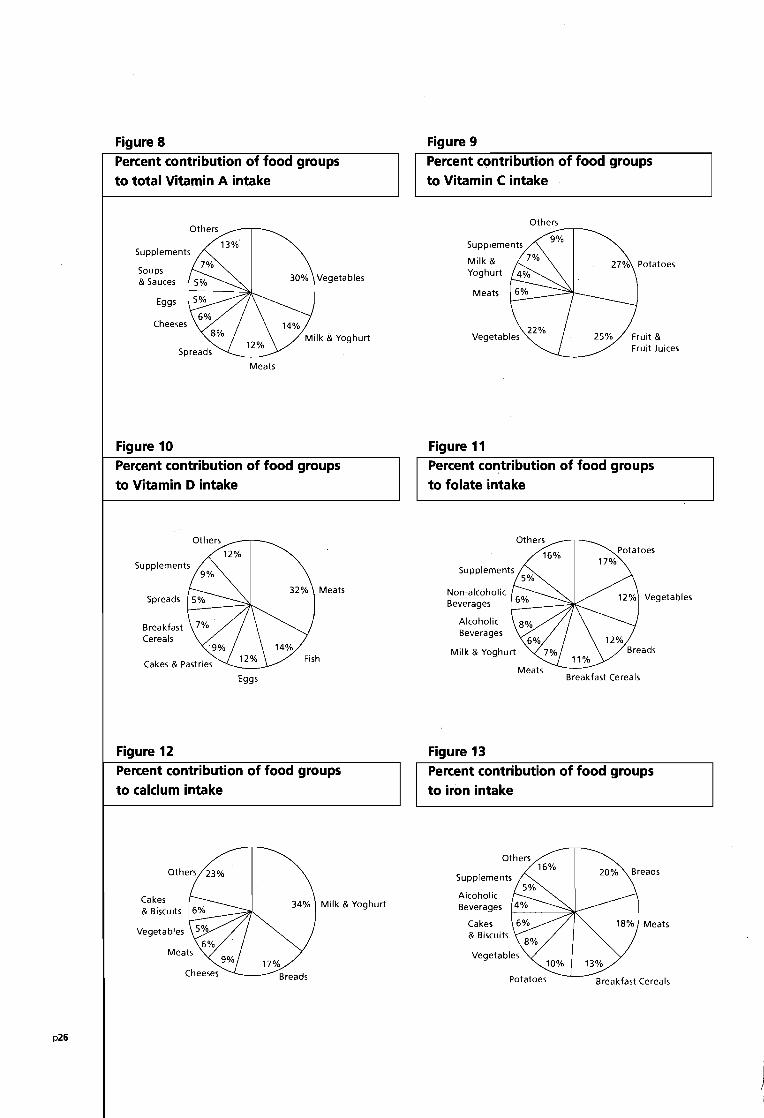
Vitamins and Minerals
Table 5 shows the intakes of vitamins and
minerals in men and women. Figures 8 to 13
show the main food contributors to intakes
of vitamins A, 0, C, folate, calcium and iron
in the population. Overall, the contribution
of nutritional supplements to the mean
daily intakes of men and women of all ages
for any vitamin or mineral was less than
12%. However, supplements did contribute
significantly to the mean daily intakes of
some vitamins in supplement consumers.
Intakes were adequate in the population
for most vitamins, as indicated by the low
percentage of the population with intakes
below the average requirements (AR).
However, a significant prevalence of
inadequate intakes was observed for
vitamin A (20% of men and 17% of
women), and riboflavin (13% of men and
20% of women). The proportions of men
(16%) and women (11 %) with mean daily
vitamin E intakes less than the lowest
threshold intakes indicate that the
prevalence of vitamin E inadequacy may be
significant. A substantial proportion of the
population had low vitamin 0 intakes and
was largely dependent on sunlight to
maintain adequate vitamin 0 status.
Only 2% of women aged 18-35 years and
5% of women aged 36-50 years achieved
the recommended folate intake of 600~g1d
for women of reproductive years for the
prevention of neural tube defects. All of
the women who met the recommendation
were using folate-containing supplements.
In women ,aged 18-50 years who consumed
supplemental folate (14%, n=80), mean
intakes o(folate were 480~g (233~g from
food and 248~g from supplements),
indicating a reduced risk of NTO in this
group. Of the women who did not take
supplements, none had mean intakes that
approached this level.
A significant prevalence of intakes below
the AR was observed for iron, calcium, zinc
and copper, particularly in women. Forty
eight per cent of women aged 18 to 50
years (whose iron requirements are high
due to menstrual losses) had inadequate
iron intakes, exposing them to increased
risk of depletion of iron stores and iron
deficiency .anaemia. It has been reported
that 1 in 3 Irish women has inadequate iron
stores and 1 in 30 exhibit iron deficiency
anaemia. In women aged 18 to 50 years
who used supplements, the proportion with
inadequate intakes of iron was half that of
women who did not use supplements,
indicating that supplements containing iron
make an important contribution to the diets
of menstruating women.
Calcium intakes were below the AR in 23%
of women. Inadequate calcium intake
contributes to reduced bone mass and
increased susceptibility to osteoporosis.
According to the World Health
Organisation, one in four women in Europe
over 50 years of age has osteoporosis.

TABLE 5
MEAN AND SD OF DAILY INTAKES. OF MICRONUTRIENTS FOR MEN AND WOMEN OF ALL AGES
Men 18-64y (n:::662) Women 18-64y (n=717)
Mean SD Mean SD
VITAMINS*
RETINOL (IJQ) 598 794 530 687
CAROTENE (IJQ) 2543 2091 2312 1644
TOTAL VITAMIN A (IJQ RE) 1022 891 915 751
VITAMIN D (IJg) 3.7 3.4 3.7 8.7
VITAMIN E (IJQ) 11.2 37.2 10.9 27.4
THIAMIN (mg) 2.3 1.5 2.1 4.1
RIBOFLAVIN (m g) 2.2 1.5 2.0 3.4
PRE-FORMED NIACIN (mg) 28.2 9.9 20.7 9.9
TOTAL NIACIN EQUIVALENTS (mg) 48.9 14.2 34.9 12.1
VITAMIN B6 (mg) 3.5 1.9 3.6 7.3
VITAMIN B12 (IJg) 5.4 3.7 4.1 3.6
FOLATE (IJg) 332 128 260 144
BIOTIN (l1g) 42.8 23.6 34.1 25.0
PANTOTHENATE (mg) 6.5 2.7 5.3 4.8
VITAMIN C (mg) 116 223 108 183
MINERAlS*
CALCIUM (mg) 949 354 742 299
MAGNESIUM (mg) 354 116 255 83
PHOSPHORUS (mg) 1645 463 1161 318
IRON (mg) 14.4 5.5 14.1 18.7
COPPER (mg) 1.5 0.8 1.2 0.7
ZINC (mg) 11.6 4.4 8.5 5.0
... All sources including dietary supplements
p25
p26
Figure 8
Percent contribution of food groups
to total Vitamin A intake
Others
Supplements
Soups & Sauces
Eggs
Cheeses
Figure 10
30% Vegetables
Meats
Percent contribution of food groups
to Vitamin D intake
Supplements
Spreads
Breakfast Cereals
Figure 12
Others
Eggs
Percent contribution of food groups
to calcium intake
Others 23%
Cakes & Biscuits
Vegetables
Figure 9
Percent contribution of food groups
to Vitamin C intake
Milk & Yoghurt
Meats
Figure 11
Others
Percent contribution of food groups
to folate intake
Non-alcoholic Beverages
Alcoholic Beverages
Milk & Yoghurt
Figure 13
Others Potatoes
17%
Breakfast Cereals
Percent contribution of food groups
to iron intake
Others 16%
20% Supplements
Cakes & Biscuits
Potatoes Breakfast Cereals

Physical Activity
p27

p28
Physical Activity
The benefits of regular physical activity are
well documented. Epidemiological
evidence has demonstrated clearly that
physically inactive adults are at increased
risk of CVD, hypertension, diabetes mellitus
(Type 2), osteoporosis, various cancers,
anxiety and depression, as well as all cause
mortality. In addition, a sedentary lifestyle
contributes to the development of obesity
while participation in physical activity aids
long-term maintenance of weight reduction
and slows down weight gain over time.
Levels of usual physical activity were
characterised in the Survey by a
comprehensive self-administered
questionnaire, which was developed at the
Institute of Public Health, Ca~bridge. The
questionnaire provided a detailed
assessment of the amount and intensity of
all daily physical activities (occupational
activity, non-occupational activity and
sports and other recreations), and metabolic
energy equivalents were assigned to each
activity.
Overall, men were significantly more active
than women, and in different ways. Men
were approximately twice as active in work
and recreational activity as women were
but women were three times more active in
household tasks. The levels of physical
activity declined with increasing age
particularly leisure activity in men.
Compared with 18-35 year olds, median
total physical activity for the 51-64 year old
respondents was lower by approximately
25% in men and 50% in women. In women,
spending more time in household pursuits.
offset the decline in work activity with age.
Participation in recreational, particularly
vigorous recreational, activities was low.
Walking was by far the most important
leisure activity for both men (41 %) and
women (60%). Table 6 shows average
amounts of time spent by men and women
of different age groups watching television,
in recreational activities such as walking and
gardening and in vigorous recreational
activities. In terms of hours per week spent
in vigorous physical activity, women spent
less time (1 hrlwk) than men (1.7 hrlwk),
younger respondents (aged 18-35 years)
were more active than older respondents,
and professional and skilled non-manual
women were more active than women in
other occupational groups. Fifty percent of
women in the 51-64 year age group
reported no participation in any vigorous
physical activity.

TABLE 6
AVERAGE AMOUNTS OF TIME SPENT BY MEN AND WOMEN OF DIFFERENT AGES· WATCHING
TELEVISION AND PARTICIPATING IN RECREATIONAL ACTIVITIES AND VIGOROUS
RECREATIONAL ACTIVITIES
/ All ages 18-35 years 36-50 years 51-64 years
TOTAL
TELEVISION VIEWING (HRIWEEK) 18.7 19.0 18.1 19,0
RECREATIONAL ACTIVITIES (HR/WEEK) 6.7 7.9 6.4 5,5
VIGOROUS RECREATIONAL 1.3 2.1 1.1 0.5
ACTIVITIES (HRIWEEK)
MEN "
TELEVISION VIEWING (HRIWEEK) 19.1 19.2 18.8 19.3
RECREATIONAL ACTIVITIES (HRIWEEK) 8.7 10.4 8.3 6.8
VIGOROUS RECREATIONAL 1.7 2.7 1.3 0.6
ACTIVITIES (HRIWEEK)
WOMEN
TELEVISION VIEWING (HR/WEEK) ,18,3 18.8 17.5 18.7
RECREATIONAL ACTIVITIES (HR/WEEK) 4.9 5.5 4.7 4.1
VIGOROUS RECREATIONAL 1.0 1.4 0.9 0.4
ACTIVITIES (HRIWEEK)
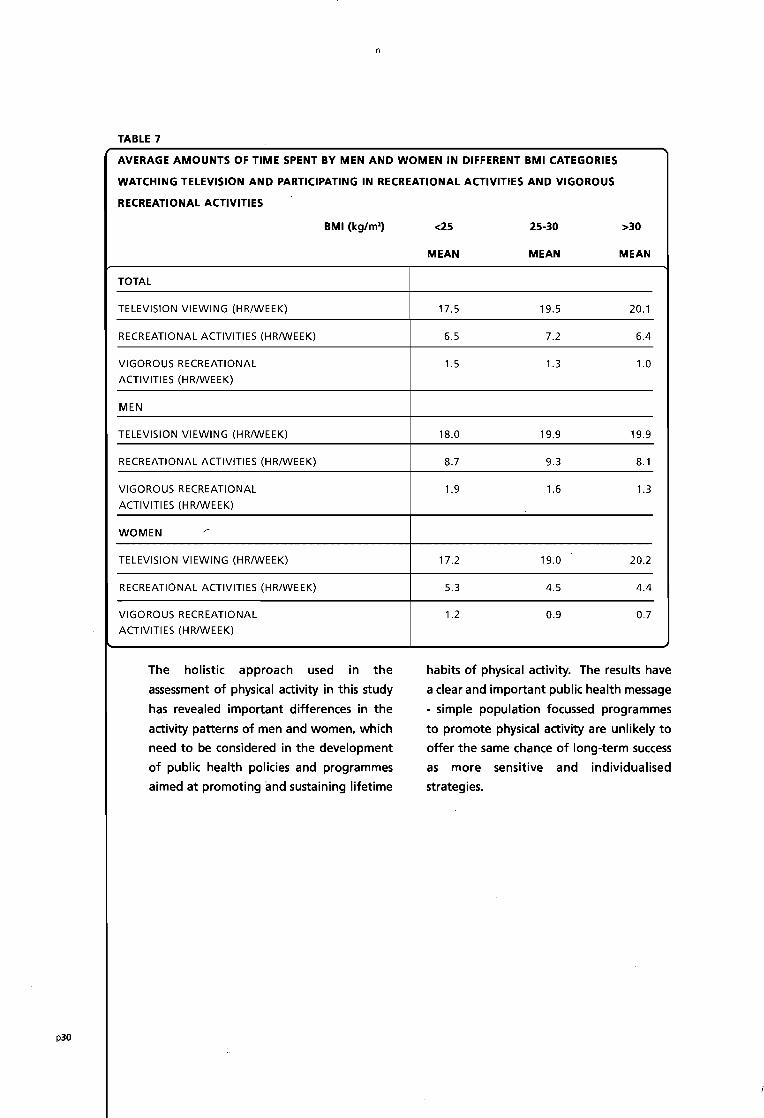
Watching TV monopolised a major portion Higher levels of total, occupational and
of available leisure time and median time recreational activities were associated with
spent on TV viewing and related pursuits a trend towards lower BMI in both men and
was similar for men (19 hourslweek) and women. On average, overweight and obese
women (18 hours/week). Twenty-five respondents spent 2-3 hours per week more
percent of respondents spent at least 25 time in TV viewing and less time in
hours/week in these pursuits. There were vigorously active pursuits than non-
no age-related trends in the amount of time overweight respondents, as seen in Table 7.
spent watching TV.
p29
n
TABLE 7
AVERAGE AMOUNTS OF TIME SPENT BY MEN AND WOMEN IN DIFFERENT BMI CATEGORIES
WATCHING TELEVISION AND PARTICIPATING IN RECREATIONAL ACTIVITIES AND VIGOROUS
RECREATIONAL ACTIVITIES
BMI (kg/m') <25 25-30 >30
MEAN MEAN MEAN
TOTAL
TELEVISION VIEWING (HR/WEEK) 17.5 19.5 20.1
RECREATIONAL ACTIVITIES (HR/WEEK) 6.5 7.2 6.4
VIGOROUS RECREATIONAL 1.5 1.3 1.0
ACTIVITIES (HRIWEEK)
MEN
TELEVISION VIEWING (HR/WEEK) 18.0 19.9 19.9
RECREATIONAL ACTIVITIES (HRIWEEK) 8.7 9.3 8.1
VIGOROUS RECREATIONAL 1.9 1.6 1.3
ACTIVITIES (HRIWEEK)
WOMEN ---
TELEVISION VIEWING (HR/WEEK) 17.2 19.0 20.2
RECREATIONAL ACTIVITIES (HRIWEEK) 5.3 4.5 4.4
VIGOROUS RECREATIONAL 1.2 0.9 0.7
ACTIVITIES (HRIWEEK)
The holistic approach used in the habits of physical activity. The results have
assessment of physical activity in this study a clear and important public health message
has revealed important differences in the - simple population focussed programmes
activity patterns of men and women, which to promote physical activity are unlikely to
need to be considered in the development offer the same chance of long-term success
of public health policies and programmes as more sensitive and individualised
aimed at promoting and sustaining lifetime strategies.
p30 ..

Attitudes
p31

Attitudes The promotion of healthy eating is likely to likely to perceive that they did not need to
be more effective if it is targeted to specific make any dietary changes tended to be
subgroups in the population. In order to people in the 51 to 64 year age group and
identify appropriate target groups for people who were educated to primary level
nutrition education, it is necessary to only. A total of 572 respondents said that
examine the influence of socio-demographic they had modified their eating habits in the
factors on attitudes towards a healthy diet. past year. Women, respondents with a
tertiary level education or a professional
Sixty two percent of respondents perceived occupation, respondents who were obese
that they "make conscious efforts to eat a and non-smokers were all more likely to
healthy diet" either "most of the time" or have made dietary changes in the previous
"quite often". These respondents tended year. Sixty four percent of people made
to be women, older subjects (51-64 years), changes because they wanted to eat a
to have a professional occupation or a healthy diet while 53% did so because of
managerialltechnical position and to be obesity/overweight, shown in Table 8.
either a non- or ex-smoker. Respondents who had modified their eating
habits for the purpose of eating healthily
Awareness of the need to alter one's diet is were more likely to be women, well
an important stage in changing dietary educated and from a higher social class.
behaviour. Just over half of respondents Table 9 shows that the most common
(52%) considered that they do not need to dietary changes were a reduction in fat
make changes to their diet, as it is healthy (70%) and an increase in fruit and
enough. Respondents who were more vegetables (67%).
TABLE 8
REASONS FOR MAKING DIETARY CHANGES CITED BY RESPONDENTS WHO HAD MODIFIED THEIR
EATING HABITS OVER THE PAST YEAR (N=572)
REASON %
WANTED TO EAT A HEALTHY DIET 64
OVERWEIGHT/OBESITY 53
BOWEL PROBLEMS 11
OTHER REASONS 9
DIFFERENT FOOD PREFERENCES 8
HIGH BLOOD PRESSURE 7
RAISED CHOLESTEROL 7
STOMACH PROBLEMS 6
CONVENIENCE 5
FAMILY HISTORY OF ILLNESS 4
ALLERGIES 3
DIABETES 2
UNDERWEIGHT 1
p32

p33
TABLE 9
PERCENTAGES OF RESPONDENTS WHO REPORTED MAKING SPECIFIC CHANGES TO THEIR EATING
HABITS OVER THE PAST YEAR
DIETARY CHANGE
REDUCED FAT
INCREASED FRUIT AND VEGETABLES
INCREASED FIBRE
REDUCED CALORIES
REDUCED ALCOHOL
INCREASED CONVENIENCE FOODS
INCREASED ALCOHOL
Almost half of the population (48%) agreed
with the statement • my weight is fine for
my age". The respondents most likely to
think that their weight was appropriate
were aged 18 to 35 years, unskilled workers
and students and those in the normal
weight range. Among those that were
obese, 86% disagreed with the statement.
A relatively high proportion (50%) of the
older age group (51-64 years) considered
%
70
67
41
34
22
5
2
that their weight was fine for their age in
spite of the fact that 27%. of this group
were obese and 44% were overweight.
Most respondents (81 %) believed that they
should be taking more exercise and 45%
felt that they should be taking a lot more
exercise, suggesting that the majority of
respondents were not complacent about
their level of exercise.

p34
Smoking
Smoking is a known risk factor for coronary
heart disease, stroke and cancer. In Ireland,
it has been estimated that smoking is
associated with 21 % of total deaths, in
comparison to, Sweden, for example, where
smoking accounts for 8% of total deaths.
Approximately 33% of men and 32% of
women were current smokers and 28% of
men and 25% of women smoked daily. On
average, most adults commenced smoking
in their late teens and of those who gave
up, most did so in their early thirties. In
men and women, the incidence of smoking
decreased with increasing age. Forty one
percent of men and 42% of women in the
18-35y category were smokers, compared to
27% of men and 17% of women in the
51-64y category.

how to contact us Telephone our free helpline: from the north on: 0800 085 1683
from the south on: 1800 40 4567
Write to us at our interim postal address: Food Safety Promotion Board. Abbey Court, Lower Abbey Street, Dublin 1
Or email us at; [email protected]

-••• 1
"
_th '-"'1. ~.', ,
,\ \
\ '
, '-"
" \ ':i, r"'; ,f;
, "I
, ~,
.' '
': ::
Food Safety Promotion Board,
Abbey Court,
Lower Abbey Street,
Dublin 1
free telephone helpline:
from the north on: 0800 085 1683
from the south on: 1800 40 4567
email: info@fspb,org
'1' ,
;,'
, ,
I'"~
\' «~
.','
, "
;,\
" . . " .;;
"',:,
,-" ',' ,,'
i'~
, "«
. "$.\ •
;':,:r '''':
C" '(\ .I,.,~
"':' i ,:'
" ,
:\,.,
,',
'.-.
',' .~ ..
.,'
" . :' /'. ~ ;( ~ ~~