
About Exim Bank's Working Paper Series EXIM 2015.pdf · About Exim Bank's Working Paper Series As...
88
Transcript of About Exim Bank's Working Paper Series EXIM 2015.pdf · About Exim Bank's Working Paper Series As...
About Exim Bank's Working Paper Series
As part of its endeavour in enriching the knowledge of Indian exporters and thereby to enhance their competitiveness, Exim Bank periodically conducts research studies. These research studies are broadly categorized into three segments, viz. sector studies, country studies and macro-economic related analysis. These studies are published in the form of Occasional Papers, Working Papers and Books. The research papers that are brought out in the form of Working Papers are done with swift analysis and data collation from various sources. The research papers under the series provide an analytical overview on various trade and investment related issues.
Previous Working Papers brought out by Exim Bank
Paper No. 12 Vanilla and its Potential in India, September 2005Paper No. 13 Export Performance of Small and Medium Scale Enterprises in India,
October 2005Paper No. 14 Prospects for Exports of Handicrafts from North Eastern Region (NER),
October 2005Paper No. 15 FDI Flows and Investment Policies in India and Select Asian Countries:
A Comparative Analysis, October 2005Paper No. 16 Indian Construction Industry: Opportunities Abroad, February 2007Paper No. 17 Potential for Enhancing India's Trade with Myanmar: A Brief Analysis, April 2012Paper No. 18 Potential for Enhancing India's Trade with Iran: A Brief Analysis, July 2012Paper No. 19 Potential for Enhancing India's Trade with Pakistan: A Brief Analysis, August 2012Paper No. 20 Potential for Enhancing India's Trade with China: A Brief Analysis, January 2013 Paper No. 21 Enhancing India's Trade Relations with Africa: Focus on Select Countries,
May 2013 Paper No. 22 Enhancing India's Trade Relations with LAC: Focus on Select Countries,
August 2013Paper No. 23 Enhancing India - Myanmar Trade and Investment Relations:
A Brief Analysis, August 2013Paper No. 24 Potential for Enhancing India's Trade with Russia: A Brief Analysis, September, 2013Paper No. 25 Indian Ceramic Industry: Scenario, Challenges & Strategies, September, 2013Paper No. 26 Potential for Enhancing India's Trade with France: A Brief Analysis, October, 2013Paper No. 27 Potential for Enhancing India's Trade with United Kingdom: A Brief Analysis,
November, 2013Paper No. 28
February, 2014Paper No. 29 Enhancing India's Trade Relations with Southern African Development Community
(SADC): A Brief Analysis, March 2014 Paper No. 30 Potential for Enhancing India's Trade with Australia: A Brief Analysis, April 2014 Paper No. 31 Potential for Enhancing Intra-SAARC Trade: A Brief Analysis, June 2014Paper No. 32 Strategic Development of Ship Building Sector: Institutional Support System and
Policy Framework in India and Select Countries, July 2014Paper No. 33 Potential for Enhancing India’s Trade with Korea Republic: A Brief Analysis,
August 2014Paper No. 34 Enhancing India’s Bilateral Ties with Cambodia, LAO PDR, Myanmar, Vietnam:
A Brief Analysis, November 2014Paper No. 35 Indian Handloom Industry: A Sector Study, March 2015Paper No. 36 Turkey: A Study of India’s Trade and Investment Potential, March 2015Paper No. 37 Study on Indian Pharmaceutical Industry, March 2015Paper No. 38 Enhancing India’s Trade Relations with ECOWAS: A Brief Analysis, May 2015Paper No. 39 Potential for Enhancing India’s Trade with Iran: A Brief Analysis, June 2015Paper No. 40 Potential for Enhancing India’s Trade with Pakistan: A Brief Analysis, June 2015Paper No. 41 Potential for Enhancing India’s Trade with China: An Update, August 2015Paper No. 42 Potential for Enhancing India’s Trade with Russia: A Brief Analysis, August 2015Paper No. 43 Enhancing India’s Trade Relations with LAC: Focus on Select Countries,
October 2015Paper No. 44 Turkey: A Study of India’s Trade and Investment Potential, October 2015Paper No. 45 Enhancing India’s Trade Relations with Africa: A Brief Analysis, October 2015
Potential for Enhancing India's Trade with Germany: A Brief Analysis
EXPORT-IMPORT BANK OF INDIA
WORKING PAPER NO. 46
INDIAN LEAThER INDusTRy:PERsPEcTIvE AND sTRATEGIEs
EXIM Bank’s Working Paper Series is an attempt to disseminate the findings of research studies carried out in the Bank. The results of research studies can interest exporters, policy makers, industrialists, export promotion agencies as well as researchers. However, views expressed do not necessarily reflect those of the Bank. While reasonable care has been taken to ensure authenticity of information and data, EXIM Bank accepts no responsibility for authenticity, accuracy or completeness of such items.
© Export-Import Bank of IndiaNovember 2015

Export-Import Bank of India 3
Indian Leather Industry: Perspective and Strategies
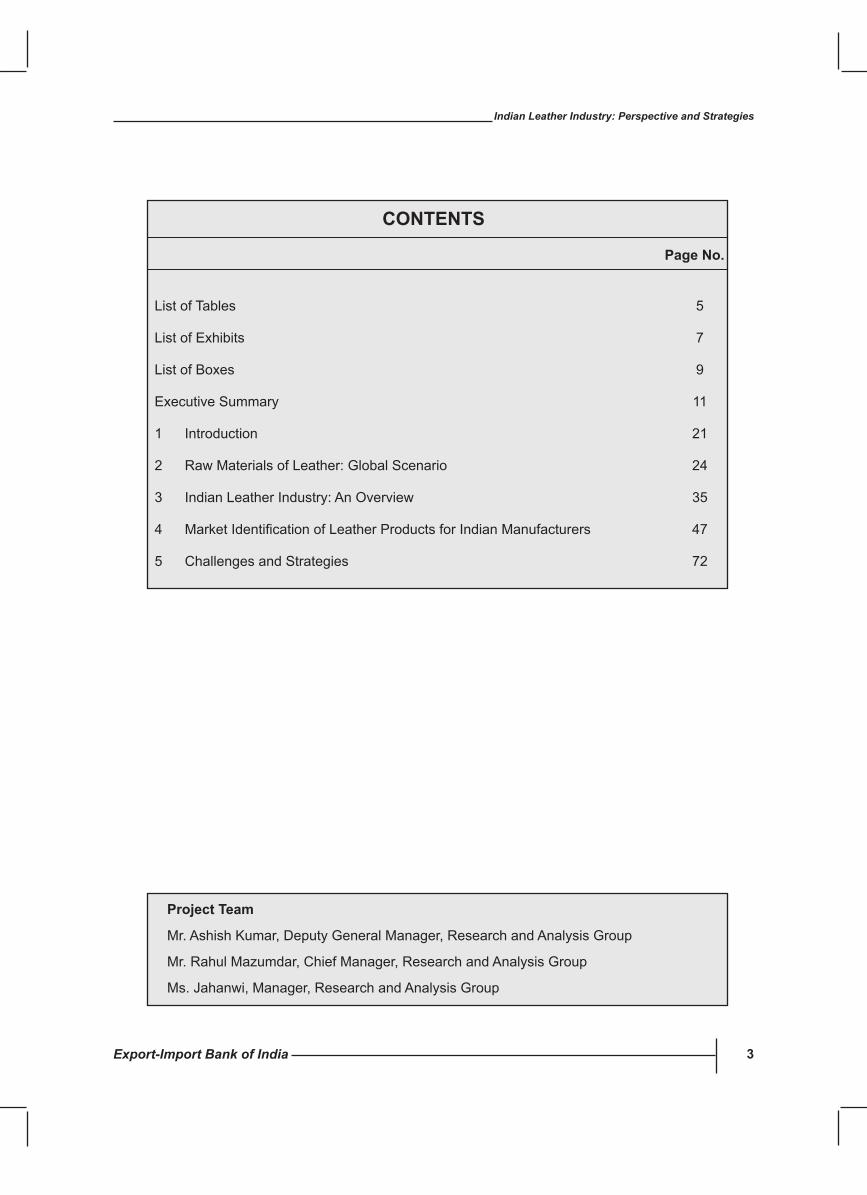
cONTENTs
Page No.
List of Tables 5
List of Exhibits 7
List of Boxes 9
Executive Summary 11
1 Introduction 21
2 Raw Materials of Leather: Global Scenario 24
3 Indian Leather Industry: An Overview 35
4 MarketIdentificationofLeatherProductsforIndianManufacturers 47
5 Challenges and Strategies 72
Project Team
Mr. Ashish Kumar, Deputy General Manager, Research and Analysis Group
Mr. Rahul Mazumdar, Chief Manager, Research and Analysis Group
Ms. Jahanwi, Manager, Research and Analysis Group

Export-Import Bank of India 5
Indian Leather Industry: Perspective and Strategies
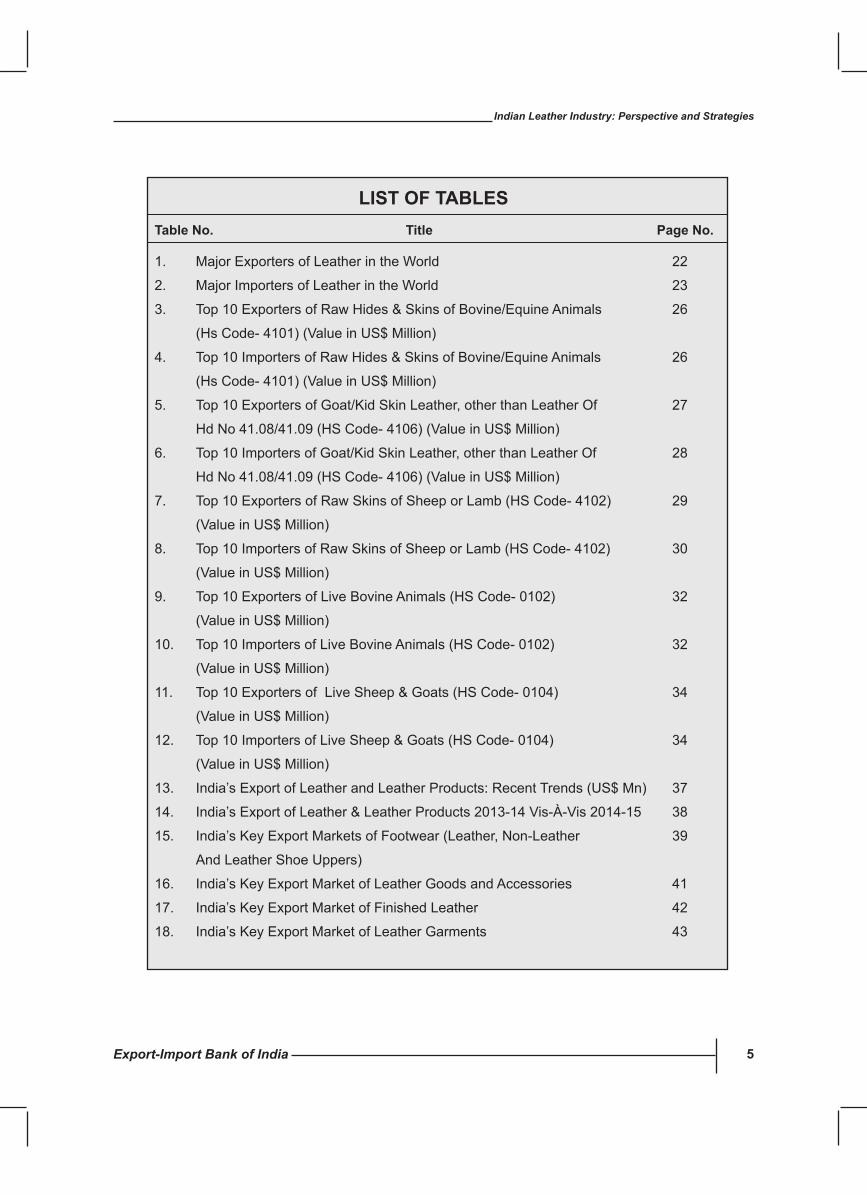
LIsT OF TABLEsTable No. Title Page No.
1. Major Exporters of Leather in the World 22
2. Major Importers of Leather in the World 23
3. Top 10 Exporters of Raw Hides & Skins of Bovine/Equine Animals 26
(Hs Code- 4101) (Value in US$ Million)
4. Top 10 Importers of Raw Hides & Skins of Bovine/Equine Animals 26
(Hs Code- 4101) (Value in US$ Million)
5. Top 10 Exporters of Goat/Kid Skin Leather, other than Leather Of 27
Hd No 41.08/41.09 (HS Code- 4106) (Value in US$ Million)
6. Top 10 Importers of Goat/Kid Skin Leather, other than Leather Of 28
Hd No 41.08/41.09 (HS Code- 4106) (Value in US$ Million)
7. Top 10 Exporters of Raw Skins of Sheep or Lamb (HS Code- 4102) 29
(Value in US$ Million)
8. Top 10 Importers of Raw Skins of Sheep or Lamb (HS Code- 4102) 30
(Value in US$ Million)
9. Top 10 Exporters of Live Bovine Animals (HS Code- 0102) 32
(Value in US$ Million)
10. Top 10 Importers of Live Bovine Animals (HS Code- 0102) 32
(Value in US$ Million)
11. Top 10 Exporters of Live Sheep & Goats (HS Code- 0104) 34
(Value in US$ Million)
12. Top 10 Importers of Live Sheep & Goats (HS Code- 0104) 34
(Value in US$ Million)
13. India’sExportofLeatherandLeatherProducts:RecentTrends(US$Mn) 37
14. India’sExportofLeather&LeatherProducts2013-14Vis-À-Vis2014-15 38
15. India’s Key Export Markets of Footwear (Leather, Non-Leather 39
And Leather Shoe Uppers)
16. India’s Key Export Market of Leather Goods and Accessories 41
17. India’s Key Export Market of Finished Leather 42
18. India’s Key Export Market of Leather Garments 43
Export-Import Bank of India6
Indian Leather Industry: Perspective and Strategies
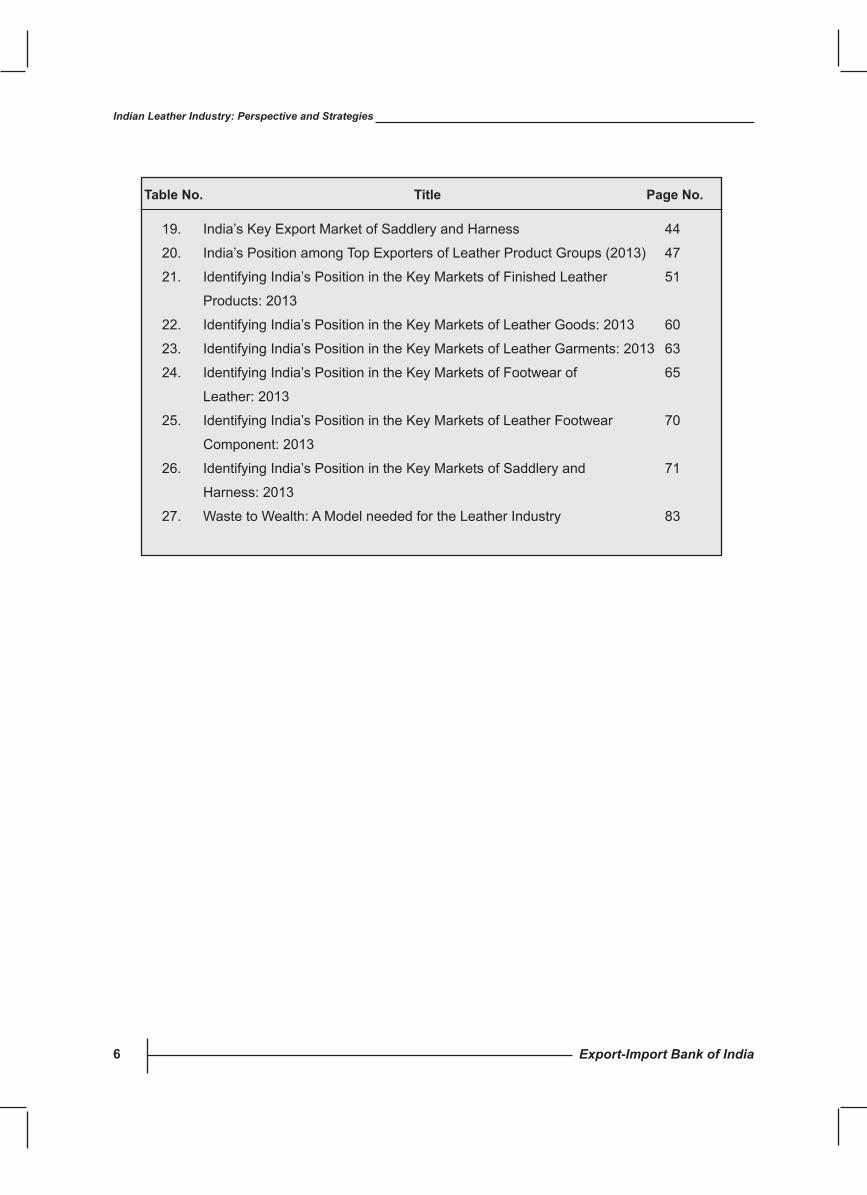
19. India’s Key Export Market of Saddlery and Harness 44
20. India’sPositionamongTopExportersofLeatherProductGroups(2013) 47
21. IdentifyingIndia’sPositionintheKeyMarketsofFinishedLeather 51
Products:2013
22. IdentifyingIndia’sPositionintheKeyMarketsofLeatherGoods:2013 60
23. IdentifyingIndia’sPositionintheKeyMarketsofLeatherGarments:2013 63
24. IdentifyingIndia’sPositionintheKeyMarketsofFootwearof 65
Leather: 2013
25. IdentifyingIndia’sPositionintheKeyMarketsofLeatherFootwear 70
Component: 2013
26. IdentifyingIndia’sPositionintheKeyMarketsofSaddleryand 71
Harness: 2013
27. Waste to Wealth: A Model needed for the Leather Industry 83
Table No. Title Page No.
Export-Import Bank of India 7
Indian Leather Industry: Perspective and Strategies
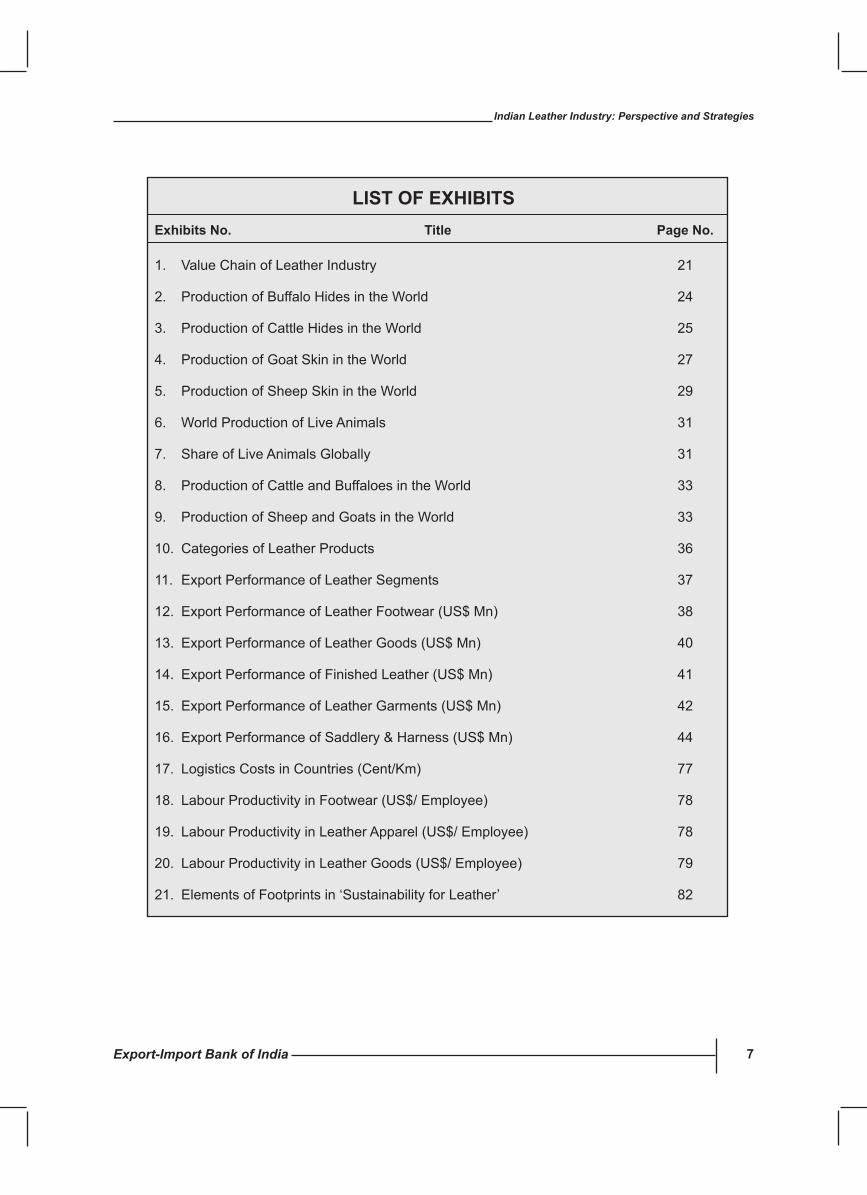
LIsT OF EXhIBITsExhibits No. Title Page No.
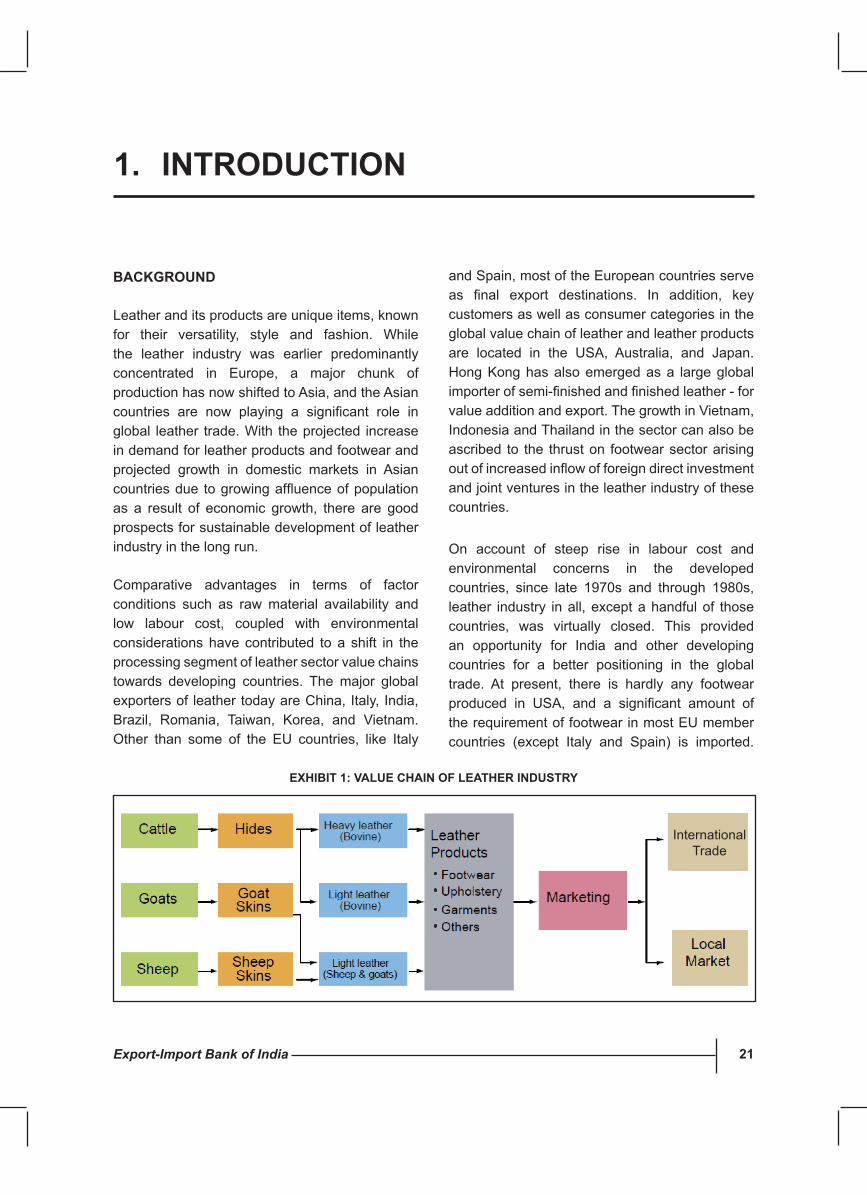
1. Value Chain of Leather Industry 21
2. ProductionofBuffaloHidesintheWorld 24
3. ProductionofCattleHidesintheWorld 25
4. ProductionofGoatSkinintheWorld 27
5. ProductionofSheepSkinintheWorld 29
6. WorldProductionofLiveAnimals 31
7. Share of Live Animals Globally 31
8. ProductionofCattleandBuffaloesintheWorld 33
9. ProductionofSheepandGoatsintheWorld 33
10. CategoriesofLeatherProducts 36
11. ExportPerformanceofLeatherSegments 37
12. ExportPerformanceofLeatherFootwear(US$Mn) 38
13. ExportPerformanceofLeatherGoods(US$Mn) 40
14. ExportPerformanceofFinishedLeather(US$Mn) 41
15. ExportPerformanceofLeatherGarments(US$Mn) 42
16. ExportPerformanceofSaddlery&Harness(US$Mn) 44
17. Logistics Costs in Countries (Cent/Km) 77
18. LabourProductivityinFootwear(US$/Employee) 78
19. LabourProductivityinLeatherApparel(US$/Employee) 78
20. LabourProductivityinLeatherGoods(US$/Employee) 79
21. Elements of Footprints in ‘Sustainability for Leather’ 82

Export-Import Bank of India 9
Indian Leather Industry: Perspective and Strategies
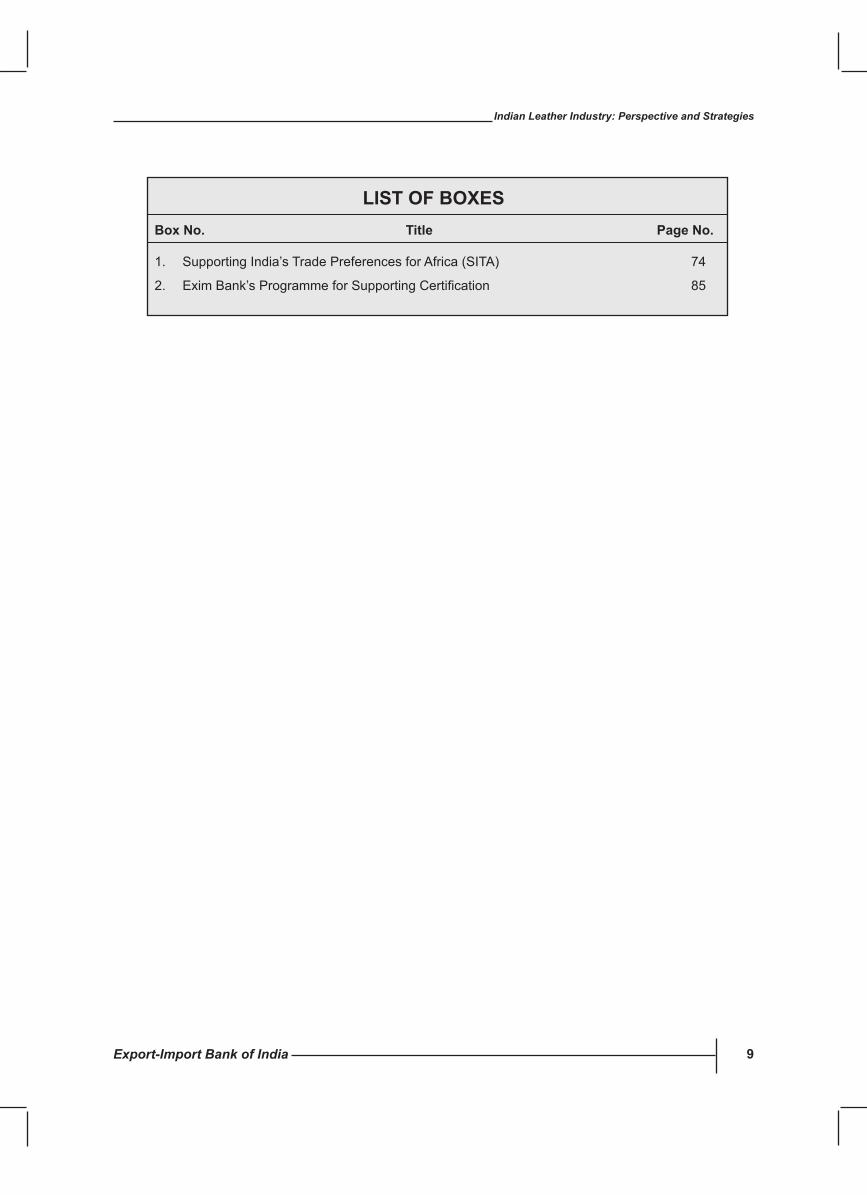
LIsT OF BOXEsBox No. Title Page No.
1. SupportingIndia’sTradePreferencesforAfrica(SITA) 74
2. EximBank’sProgrammeforSupportingCertification 85

Export-Import Bank of India 11
Indian Leather Industry: Perspective and Strategies
EXEcuTIvE suMMARy
OvERvIEW
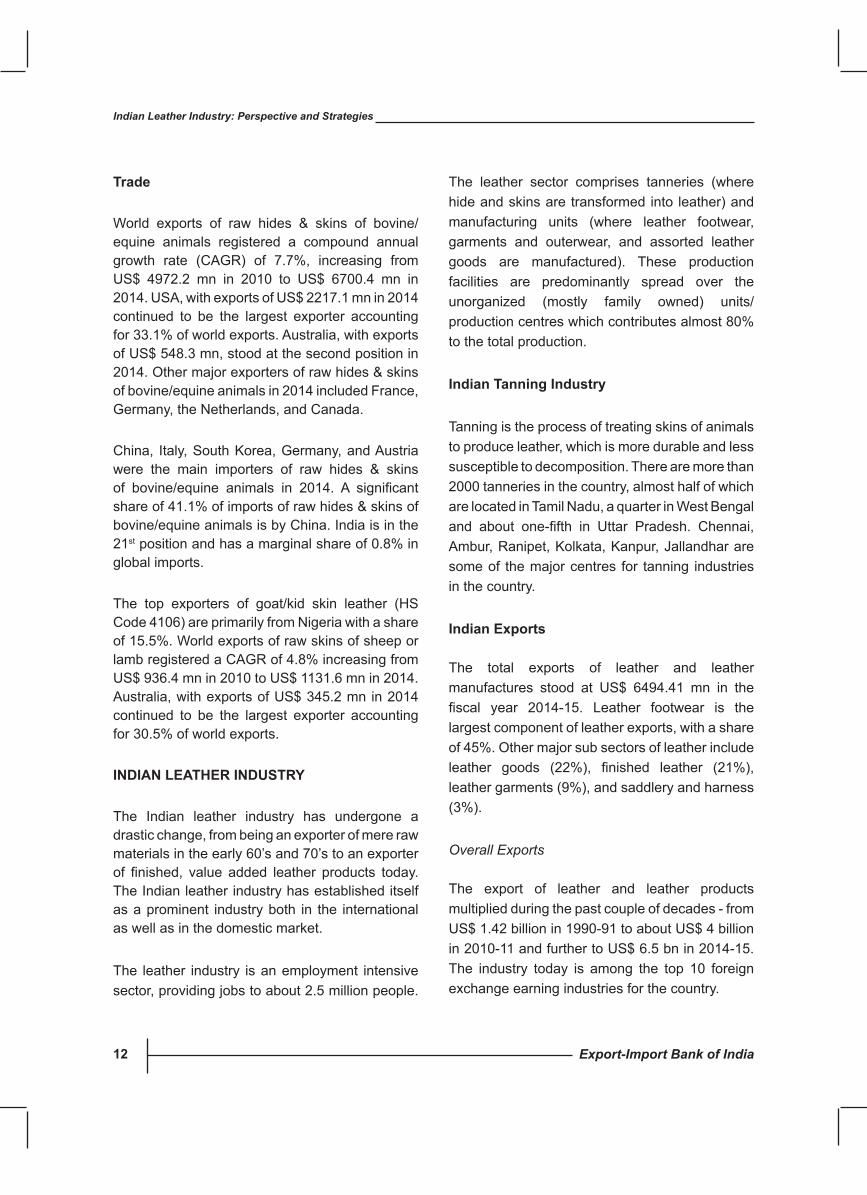
Leather and its products are unique items, known for their versatility, style and fashion. Comparative advantages in terms of factor conditions such as raw material availability and low labour cost, coupled with environmental considerations have contributed to a shift in the processing segment of leather sector value chains towards developing countries.
INTERNATIONAL TRADE
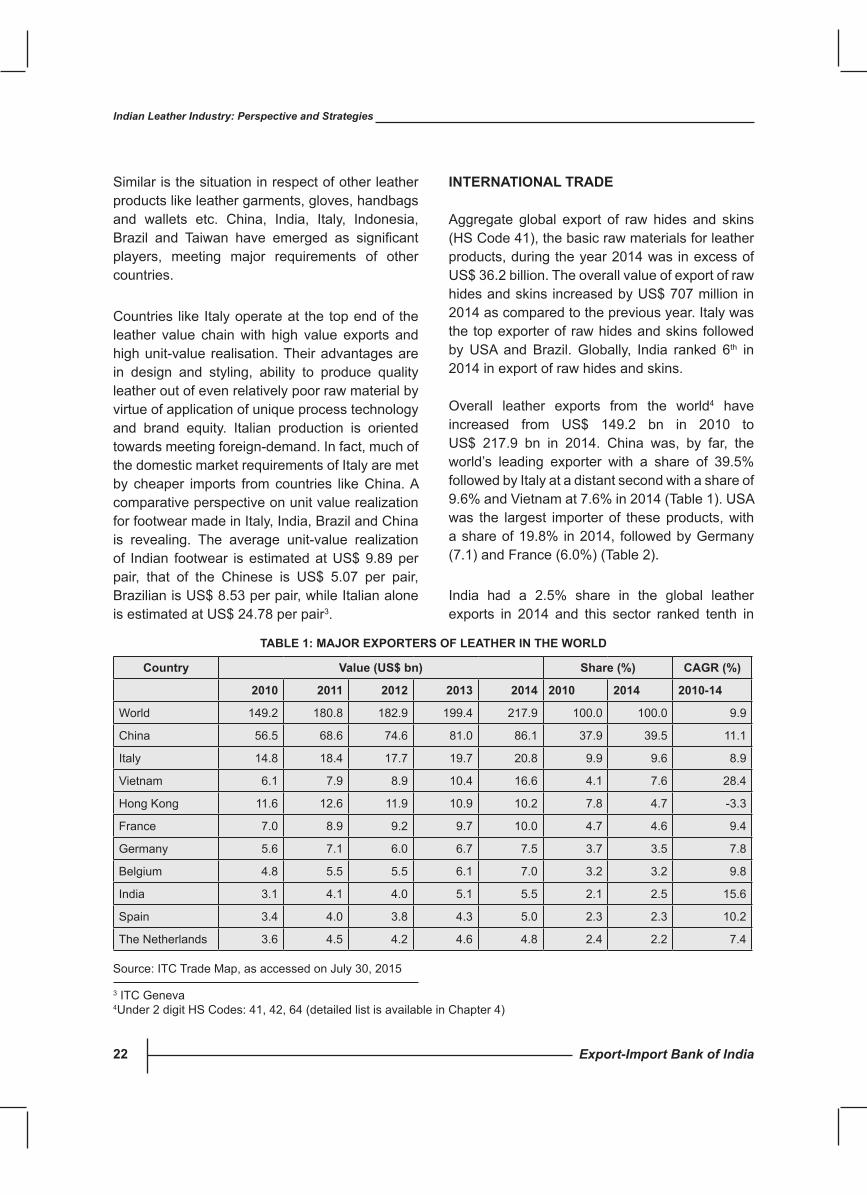
Overall leather exports from the world1 have increased from US$ 149.2 bn in 2010 to US$ 217.9 bn in 2014. China was, by far, the world’s leading exporter with a share of 39.5%, followed by Italy at a distant second with a share of 9.6% and Vietnam at 7.6% in 2014. India had a 2.5% share in the global leather exports in 2014 and this sector ranked tenth in terms of the country’s foreign exchange earnings from the merchandise exports.
The composition of leather exports from India has been changing, with more and more value added products being exported. The growth of Indian leather industry has been driven by various factors, with low cost of manpower in footwear manufacturing being one of the key contributors.
GLOBAL scENARIO OF RAW MATERIAL
It is known that the leather industry relies on the by-products of the meat and dairy industries for over 95% of its raw materials. The ratio of cattle
population (the primary source of leather hides and skins) and leather produced to the size of human population has remained remarkably steady for the last one hundred years. The FAO report, World Agriculture: Towards 2015-2030, highlights the fact that the proportion of animal products in the human diet has increased over the last three decades, at the expense of cereals and other crops. This trend is expected to continue, and may challenge the availability of raw materials.
Production
The world production of buffalo hide has increased from 892,000 tonnes in 2009 to 957,000 tonnes in 2013. India, with an availability of 618,000 tonnes, had the highest availability of buffalo hides in 2013, representing a share of 65%, followed by Pakistan and China, with 121,000 tonnes and101,000 tonnes of buffalo hides, respectively.
The world production of cattle increased in 2013, to reach 8.12 million tonnes. China, with a share of 19%, was the largest producer of cattle hides in 2013 followed by USA (14%), Brazil (11%), India (5%) and Argentina (5%).
Productionofgoatskin,76.7%ofwhichoccursinAsia, has also expanded steadily to exceed 1.2 million tonnes.
The world sheep skin production shot up substantially in 2012 to 8.92 million tonnes and increased further to 9.19 million tonnes in 2013. New Zealand, was by far, the largest producer of sheep skin, accounting for 80% of the world production in 2013.
1Under 2 digit HS Codes: 41, 42, 64 (detailed list is available in Chapter 4)
Export-Import Bank of India12
Indian Leather Industry: Perspective and Strategies
Trade
World exports of raw hides & skins of bovine/equine animals registered a compound annual growth rate (CAGR) of 7.7%, increasing from US$ 4972.2 mn in 2010 to US$ 6700.4 mn in 2014. USA, with exports of US$ 2217.1 mn in 2014 continued to be the largest exporter accounting for 33.1% of world exports. Australia, with exports of US$ 548.3 mn, stood at the second position in 2014. Other major exporters of raw hides & skins of bovine/equine animals in 2014 included France, Germany, the Netherlands, and Canada.
China, Italy, South Korea, Germany, and Austria were the main importers of raw hides & skins of bovine/equine animals in 2014. A significantshare of 41.1% of imports of raw hides & skins of bovine/equine animals is by China. India is in the 21st position and has a marginal share of 0.8% in global imports.
The top exporters of goat/kid skin leather (HS Code 4106) are primarily from Nigeria with a share of 15.5%. World exports of raw skins of sheep or lamb registered a CAGR of 4.8% increasing from US$ 936.4 mn in 2010 to US$ 1131.6 mn in 2014. Australia, with exports of US$ 345.2 mn in 2014 continued to be the largest exporter accounting for 30.5% of world exports.
INDIAN LEAThER INDusTRy
The Indian leather industry has undergone a drastic change, from being an exporter of mere raw materials in the early 60’s and 70’s to an exporter of finished, value added leather products today.The Indian leather industry has established itself as a prominent industry both in the international as well as in the domestic market.
The leather industry is an employment intensive sector, providing jobs to about 2.5 million people.
The leather sector comprises tanneries (where hide and skins are transformed into leather) and manufacturing units (where leather footwear, garments and outerwear, and assorted leather goods are manufactured). These production facilities are predominantly spread over the unorganized (mostly family owned) units/production centres which contributes almost 80% to the total production.
Indian Tanning Industry
Tanning is the process of treating skins of animals to produce leather, which is more durable and less susceptible to decomposition. There are more than 2000 tanneries in the country, almost half of which are located in Tamil Nadu, a quarter in West Bengal and about one-fifth in Uttar Pradesh. Chennai,Ambur, Ranipet, Kolkata, Kanpur, Jallandhar are some of the major centres for tanning industries in the country.
Indian Exports
The total exports of leather and leather manufactures stood at US$ 6494.41 mn in the fiscal year 2014-15. Leather footwear is thelargest component of leather exports, with a share of 45%. Other major sub sectors of leather include leather goods (22%), finished leather (21%),leather garments (9%), and saddlery and harness (3%).
Overall Exports
The export of leather and leather products multiplied during the past couple of decades - from US$ 1.42 billion in 1990-91 to about US$ 4 billion in 2010-11 and further to US$ 6.5 bn in 2014-15. The industry today is among the top 10 foreign exchange earning industries for the country.
Export-Import Bank of India 13
Indian Leather Industry: Perspective and Strategies
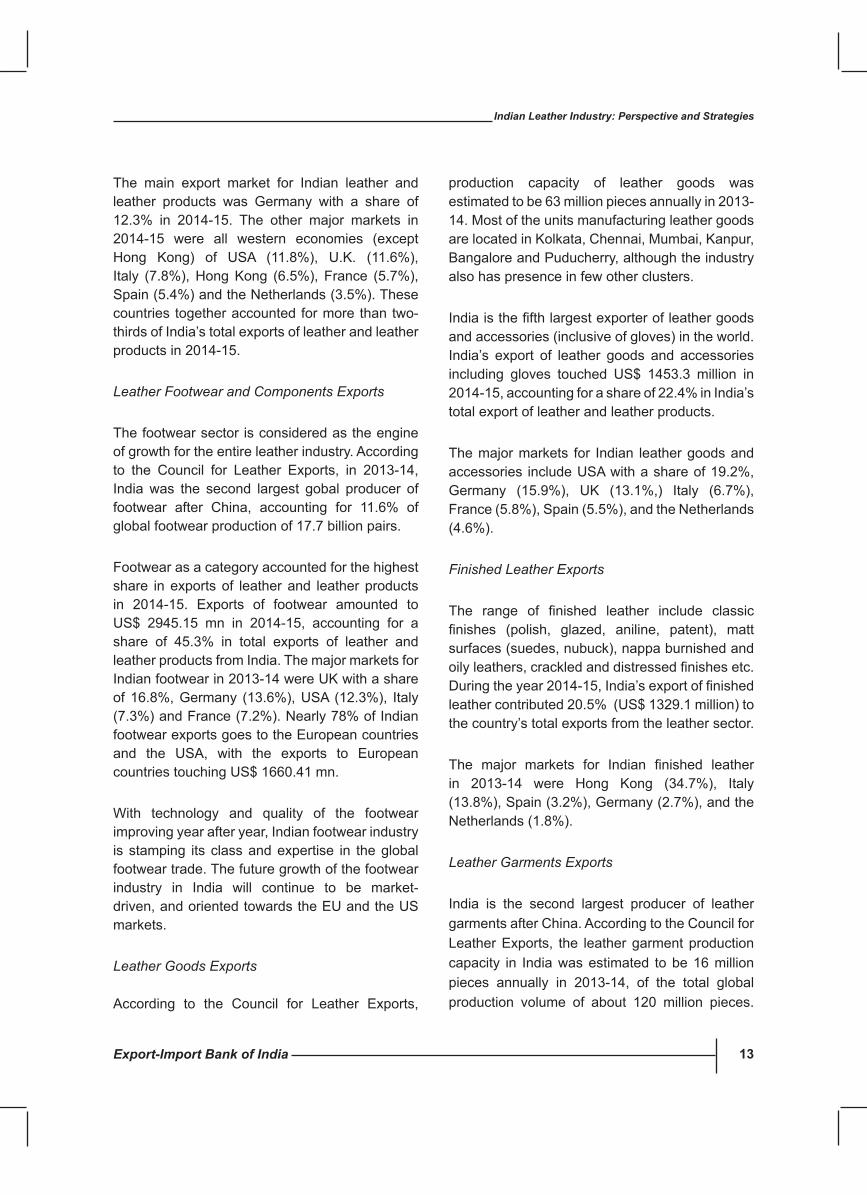
The main export market for Indian leather and leather products was Germany with a share of 12.3% in 2014-15. The other major markets in 2014-15 were all western economies (except Hong Kong) of USA (11.8%), U.K. (11.6%), Italy (7.8%), Hong Kong (6.5%), France (5.7%), Spain (5.4%) and the Netherlands (3.5%). These countries together accounted for more than two-thirds of India’s total exports of leather and leather products in 2014-15.
Leather Footwear and Components Exports
The footwear sector is considered as the engine of growth for the entire leather industry. According to the Council for Leather Exports, in 2013-14, India was the second largest gobal producer of footwear after China, accounting for 11.6% of global footwear production of 17.7 billion pairs.
Footwear as a category accounted for the highest share in exports of leather and leather products in 2014-15. Exports of footwear amounted to US$ 2945.15 mn in 2014-15, accounting for a share of 45.3% in total exports of leather and leather products from India. The major markets for Indian footwear in 2013-14 were UK with a share of 16.8%, Germany (13.6%), USA (12.3%), Italy (7.3%) and France (7.2%). Nearly 78% of Indian footwear exports goes to the European countries and the USA, with the exports to European countries touching US$ 1660.41 mn.
With technology and quality of the footwear improving year after year, Indian footwear industry is stamping its class and expertise in the global footwear trade. The future growth of the footwear industry in India will continue to be market-driven, and oriented towards the EU and the US markets.
Leather Goods Exports
According to the Council for Leather Exports,
production capacity of leather goods was estimated to be 63 million pieces annually in 2013-14. Most of the units manufacturing leather goods are located in Kolkata, Chennai, Mumbai, Kanpur, BangaloreandPuducherry,althoughtheindustryalso has presence in few other clusters.
Indiaisthefifthlargestexporterofleathergoodsand accessories (inclusive of gloves) in the world. India’s export of leather goods and accessories including gloves touched US$ 1453.3 million in 2014-15, accounting for a share of 22.4% in India’s total export of leather and leather products.
The major markets for Indian leather goods and accessories include USA with a share of 19.2%, Germany (15.9%), UK (13.1%,) Italy (6.7%), France (5.8%), Spain (5.5%), and the Netherlands (4.6%).
Finished Leather Exports
The range of finished leather include classicfinishes (polish, glazed, aniline, patent), mattsurfaces (suedes, nubuck), nappa burnished and oilyleathers,crackledanddistressedfinishesetc.Duringtheyear2014-15,India’sexportoffinishedleather contributed 20.5% (US$ 1329.1 million) to the country’s total exports from the leather sector.
The major markets for Indian finished leatherin 2013-14 were Hong Kong (34.7%), Italy (13.8%), Spain (3.2%), Germany (2.7%), and the Netherlands (1.8%).
Leather Garments Exports
India is the second largest producer of leather garments after China. According to the Council for Leather Exports, the leather garment production capacity in India was estimated to be 16 million pieces annually in 2013-14, of the total global production volume of about 120 million pieces.
Export-Import Bank of India14
Indian Leather Industry: Perspective and Strategies
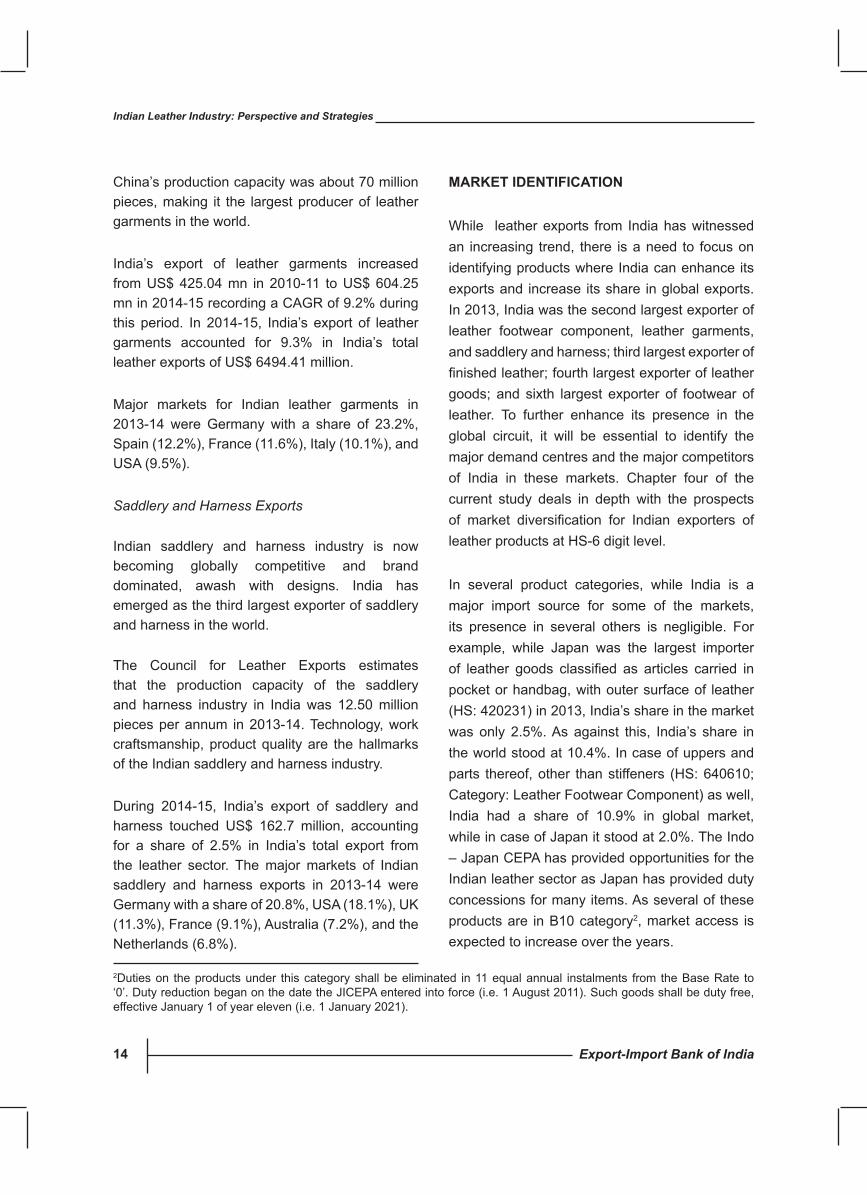
China’s production capacity was about 70 million pieces, making it the largest producer of leather garments in the world.
India’s export of leather garments increased from US$ 425.04 mn in 2010-11 to US$ 604.25 mn in 2014-15 recording a CAGR of 9.2% during this period. In 2014-15, India’s export of leather garments accounted for 9.3% in India’s total leather exports of US$ 6494.41 million.
Major markets for Indian leather garments in 2013-14 were Germany with a share of 23.2%, Spain (12.2%), France (11.6%), Italy (10.1%), and USA (9.5%).
Saddlery and Harness Exports
Indian saddlery and harness industry is now becoming globally competitive and brand dominated, awash with designs. India has emerged as the third largest exporter of saddlery and harness in the world.
The Council for Leather Exports estimates that the production capacity of the saddlery and harness industry in India was 12.50 million pieces per annum in 2013-14. Technology, work craftsmanship, product quality are the hallmarks of the Indian saddlery and harness industry.
During 2014-15, India’s export of saddlery and harness touched US$ 162.7 million, accounting for a share of 2.5% in India’s total export from the leather sector. The major markets of Indian saddlery and harness exports in 2013-14 were Germany with a share of 20.8%, USA (18.1%), UK (11.3%), France (9.1%), Australia (7.2%), and the Netherlands (6.8%).
MARKET IDENTIFIcATION
While leather exports from India has witnessed an increasing trend, there is a need to focus on identifying products where India can enhance its exports and increase its share in global exports. In 2013, India was the second largest exporter of leather footwear component, leather garments, and saddlery and harness; third largest exporter of finishedleather;fourthlargestexporterofleathergoods; and sixth largest exporter of footwear of leather. To further enhance its presence in the global circuit, it will be essential to identify the major demand centres and the major competitors of India in these markets. Chapter four of the current study deals in depth with the prospects of market diversification for Indian exporters ofleather products at HS-6 digit level.
In several product categories, while India is a major import source for some of the markets, its presence in several others is negligible. For example, while Japan was the largest importer of leather goods classified as articles carried inpocket or handbag, with outer surface of leather (HS: 420231) in 2013, India’s share in the market was only 2.5%. As against this, India’s share in the world stood at 10.4%. In case of uppers and parts thereof, other than stiffeners (HS: 640610; Category: Leather Footwear Component) as well, India had a share of 10.9% in global market, while in case of Japan it stood at 2.0%. The Indo –JapanCEPAhasprovidedopportunitiesfortheIndian leather sector as Japan has provided duty concessions for many items. As several of these products are in B10 category2, market access is expected to increase over the years.
2Duties on the products under this category shall be eliminated in 11 equal annual instalments from the Base Rate to ‘0’.DutyreductionbeganonthedatetheJICEPAenteredintoforce(i.e.1August2011).Suchgoodsshallbedutyfree,effective January 1 of year eleven (i.e. 1 January 2021).
Export-Import Bank of India 15
Indian Leather Industry: Perspective and Strategies
In the leather garments segemt, India has a significantmarket shareof20.6%. It can furtherenhance its presence in the global market by focussing more on the USA market. USA is the largest importer of these products, but the market is largely dominated by Chinese imports. In the category of Saddlery and Harness as well, India should focus more on the North American markets of USA and Canada, where China has a significantly largermarketshareascomparedtoIndia.
India needs to tap the opportunities available in these markets for further strengthening its position in the global market for leathers.
chALLENGEs AND sTRATEGIEs
Raw Material Availability: In most parts of the country, cattle are generally slaughtered only when they become old enough, as permitted by the law. Slaughtering of cattle is done only in a few states like Kerala, West Bengal and those in the North East, although buffalo, sheep and goats are slaughtered for meat all over the country.
Although India has the highest buffalo population in the world and exports leather to various countries including China, it still does not have competency in raw material cost. The primary reason is relatively limited availability of high quality raw material (leather) from Indian abattoirs. In addition, there are reported issues of price regulations of hides and skins provided by abattoirs, which further putscostpressuresonmanufacturersoffinishedleather and leather products.
There are also segment specific issues in rawmaterials that impact the competitiveness of the sector. For leather footwear sector, there is limited indigenous production of several non-leather raw materials, due to which most of the footwear
manufacturers have to rely on imports. Similarly, forleatherapparelindustry,finishedleatherfurisnot easily available in India. Also for leather goods industry,mostofthemetalfittingsandaccessoriesare being imported from Taiwan, Japan, and Hong-Kong.
In tanning industry as well, there are chemicals that are used for dyeing like oils and fats; synthetic tanning agent etc. that are being imported mainly from Europe at a high duty, thereby adding to the overallcostoftheproductoffinishedleather.
Identifying Prospects of sourcing Raw Materials: India needs to get into the global value chain of leather. India currently has a shortage of raw material, and hence it is important to source the raw materials from the countries which offer better quality and variety.
Africa’s abundance of livestock represents a natural strength for the sector, as leather is a by-product of the meat industry. Africa has about 20.8% of the world’s cattle population and about 28.2% of the world’s sheep and goat population. Indian leather industry could look at sourcing their raw material requirements for leather and hides from Africa, especially East African countries like Ethiopia and Kenya.
Besides, countries in CIS like Uzbekistan and Kazakhstan can also be potential sources for raw hides and skins, semi-processed leather and leather. In the Latin American countries, Brazil, Argentina, Uruguay and Paraguay maybe explored by Indian leather manufacturers as potential sources of different kinds of leather.
India exploring Jvs in African markets: In spite of having a latent potential to have a leather industry base, Africa’s exports have remained
Export-Import Bank of India16
Indian Leather Industry: Perspective and Strategies
almost flat. Exports of leather have increasedmarginally from US$ 1.9 bn in 2010 to US$ 2.0 bn in 2014.
Indian leather industry could look at exploring joint ventures with companies in these countries as well, providing technical assistance, know-how and investments for low-end value addition. These JVs would convert raw hides and skins into semi-finishedleatherforshipmenttoIndia.
Exploring Opportunities overseas with the onset of Mega Trade Agreements: In October 2015, the Trans Pacific Partnership (TPP)Agreement, a consortium of 12 countries from both thesidesofthePacificwithapopulationexceeding805 million, and a combined GDP size of US$28 trillion, was signed. The second agreement in the pipeline is the Regional Comprehensive Economic Partnership (RCEP). Another megaagreement that may also possibly be signed is the TransAtlanticTradeandInvestmentPartnership(TTIP)AgreementbetweentheEUandtheUSA.There is a large consensus that these mega-trade agreements are poised to change the landscape of global value chain and the business interests across the world.
Although India is not a part of the already signed TPP,itisanegotiatingmemberoftheRCEP.Sincethe leather industry in India is largely dominated by SMEs, devising a strategy to be prepared for any trade diversion as a result of these agreements is of utmost importance.
For example, Indian leather manufacturers may explore opportunities and re-evaluate their strategies to base their operations in Vietnam. At the same time, it would enable Indian entities to alsotakeadvantageofthefirstmovereffecttogaingreatermarketaccess.Puttinguptheproduction
base in Vietnam would help Indian manufacturers to access much greater markets with almost nil or concessionalimportdutiesofferedundertheTPP,and thereby it is possible to increase India’s share in the world’s largest leather import market.
Introducing Global Quality standards: In order to increase its share in international market, India needs to enhance and develop requisite infrastructure to produce leather products while abiding by international quality standards.
To cite an example, the Turkish Government has undertaken a project called ‘Turquality’, an accreditation system for the product groups with brand potential to upgrade the perception of products made in Turkey. On the one side, the programme involved activities for the development of a quality manual and accreditation scheme which definedthequalitystandardswhichapplicantswillbe required to meet in order to be accepted in the programme and for use of the Turquality logo and brand. On the other side, an articulated auditing programme was being implemented with the aim to “benchmark” Turkish companies with international best practices. The aim was a national branding strategy, to bring world class standards and best practices to Turkish industries, to brand Turkey itself, so the perception can be created on a global scale. In the event applicants receive the coveted Turquality logo, the Turkish government provides subsidies of up to US$ 5,00,000 for marketing and distribution; and US$ 3,00,000 for design and development. As at the end of 2014, 111 brands from 100 different companies had received Turquality support, whereas 55 brands from 54 differentcompaniesbenefited fromtheBrandingProgram.
The Government of India on its part could introduce a similar scheme to incentivise Indian
Export-Import Bank of India 17
Indian Leather Industry: Perspective and Strategies
leatherunitstoabidebytheidentifiedinternationalaccreditations which will help build a brand image for the Indian leather goods. In the event firmsreceive the accreditation, the government could provide subsidies of up to Rs. 5 crore for marketing and distribution and for technology upgradation and R&D.
Since a large segment of the leather industry falls under MSMEs, the possible creation of an organization mandated for promotion of brands, dissemination of information and assistance to MSMEscanalsobeconsideredor theOfficeofthe Commissioner of MSMEs may be entrusted with the job.
Branding: There is a need to focus on the concept of branding of the Indian leather sector. This is critical given that there are hardly any well known Indian leather brands in the international market. The Government could create an ‘Indian Leather’ mark with the objective of improving the image and respectability of Indian leather and leather products, generally through subjecting applicants to quality assurance evaluations. International markets would then recognize the standardization process that India would have adopted and start sourcing from these domestic companies thereby boosting exports in the long run.
Technology upgradation and Modernization of Tanneries: Efforts need to be aligned so as to upgrade the technology and modernize tanneries, improve the production environment of the tanneries including housekeeping and safety so that the health of the tannery workers is ensured. Areas requiring technology interventions include water and energy saving, better utilization of raw materials resources, having eco-friendly leather, etc. It may be noted that the ‘Integrated Development of Leather Sector’ (IDLS) scheme implemented during the Tenth and Eleventh Five
YearPlan period haswidely been successful inenabling the tanning sector to modernize and upgrade the technologies.
cost structure: Most of the countries including India have not been able to achieve absolute competitiveness with respect to cost structure. Furthermore, since most of the big leather clusters in India like Kanpur, Agra, and Delhi etc. are landlocked regions, transportation and logistics cost is higher in these areas especially for exports, thereby adversely impacting their competitiveness. India’s cost of logistics, as a shareoftheGDP,isoneofthehighestintheworld(12–13%oftheGDP)comparedtothedevelopedmarkets(below10%oftheGDP).Thisisreflectedin the transportation cost per kilometre, which hampers the industry’s competitiveness as the industry is export-based and has to reach a wide retail market.
Labour Productivity: Higher labour productivity of competing countries (China and Vietnam for leather footwear, Pakistan and Italy for leatherapparel, and China and France for leather goods) is one of the sources of their competitive advantage over India. This shows that competing countries, China, France and Italy in particular, have been able to successfully manage the system inefficiencies and have been able to progresstowards the next stages of competitiveness.
India lags behind because of strict labour laws as compared to countries like China which impacts overall labour productivity. There are reported issues of long absenteeism from work, lower levels ofefficiencyinwork,andotherissueswhichimpactthe overall productivity of the labour force in India. Further, the labour is ageing in the Indian leather footwear industry without proportionate addition of skilled people joining the industry, thereby further impactingproductivityofIndianfirms.
Export-Import Bank of India18
Indian Leather Industry: Perspective and Strategies
The labour productivity of India in the leather apparel segment has been dismal primarily because of limited automation in the industry with more than 80% of the work being manual. Another reasonisthatveryfewIndianfirmshavein-housedesign facilities due to which the value addition in the product is very limited and only basic patterns are produced, which are then exported to European countries like Italy where further value addition is done on the back of superior design capabilities.
Market Diversification: The overall market of the Indianleatherindustryhasbeenlargelyconfinedtosome traditional markets in spite of the headwinds ithas faceddue to thefinancial turmoil in thesecountries. For example, 8 out of the top 10 markets for Indian footwear are in Europe. However, Europe iscurrentlyconfrontedwithslowGDPgrowthandhence slower growth in consumption levels, which is bound to impact the footwear industry. In leather goods industry as well, exports are highly skewed towards the European market. While India is the second largest exporter of saddlery and harness products, and is the largest producer in terms of volume, the segment needs to tap Latin American, Russian and Middle East markets.
Addressing Pollution concerns: The leather industry in India comes under the Red Category - polluting industries - hence there remains some fear among the industrial community to enter into the leather industry. Tanning wastewater must therefore be suitably treated and controlled for suspended solids (which includes sulphides, chlorides, sulphates, chromium, nitrous elements, etc). Zero wastewater discharge has been made mandatory in the state of Tamil Nadu and the tanneries have installed adequate amenities in place to attain zero wastewater discharge. However, the environmental issues continue to remain a challenge.
The Government in India could learn from initiatives that have been taken up in prominent leather producing countries. For example, the greenLIFE program in EU plans to introduce an enzymatic and oxidative liming process to produce leather of the same quality with reduced environmental costs, by avoiding the usage of harmful and toxic substances such as sulphides and soluble chromium in the tanning process. Similar support to the leather industry in India will help it to not only undertake manufacturing in a conscious environmental manner, but also equip the industry to tap the markets which have strict environmental laws in place. Leather clusters can also come together in setting up necessary infrastructure likecommoneffluenttreatmentplantsfortreatingpollutants.
The sustainability Footprint – An Integral Approach: To achieve a sustainable footprint in the leather industry, it is essential to take a close look at the role of ecology in the value chain of leather. There are four key elements in the production of leather that should be grouped together to provide a sustainable footprint concept, viz. carbon, water, resources and toxicological footprint.
Carbon footprinting has appeared as a strong and popular indicator of the greenhouse gas intensity of any activity or organization. It is estimated that alternative solutions in tanning could reduce carbon footprint by as much as 15%.
The Water Footprint will continue to grow in importance in the coming years because the efficientuseofwaterisoneofthekeychallengesof this century. The pressure is on innovation for new technologies and chemicals in order to providemorewater - efficient processes for theproduction of leather.
Export-Import Bank of India 19
Indian Leather Industry: Perspective and Strategies
The Resource Footprint covers many aspects as it touches on different resources employed in the leather production. The raw stock is the single most important and valuable resource in the production of leather. Every attempt to increase the value added by upgrading low-quality leather, eliminating waste in the cutting of patterns, reducing waste products, or lowering the costs of tanneries results in an immediate benefit. The resource footprintalsocovers theefficientuseofchemicalsbasedon regenerative raw materials and optimised production processes in tanneries, including, for example, lower energy consumption.
The toxicological footprint addresses the use of harmful substances in the production of leather, the restricted substance list, the management and handling of harmful substances, legal requirements,thedemandsofspecificindustries/brands, as well as product and process safety. The aim of the toxicological footprint is to minimise the levels of harmful substances used in the production of leather and ideally to eliminate them. Current discussions include the ZDHC (Zero Discharge of Hazardous Chemicals) campaign initiated by select companies and the new VOC (Volatile Organic Compounds) regulations that apply to automotive leather in China.
Adoption of Waste to Wealth Approach: Regardless of the leather used as by-products from the production of meat, the need is to evaluate if there is an alternative use for animal skin generated from this industrial production. Currently, animal skin which does not go into the leather production endsupin incinerationor landfill,whichreducesthe added value of the overall process. Animal skin can be processed into gelatin or collagen products, but not all of the waste that is generated by the livestock industry can be processed into valuable products. Theoretically, it would also be possible to produce biogas, but efficiencies arelow and the needed infrastructure is missing.
Hides should be marketed in order to contribute to the overall added value in production. If this were not the case, meat producers would have to pay for the disposal of the skin, and this would increase the overall cost of meat production.
Animal skin is an organic material and, theoretically, 99% of it can be processed into useful products. The products that can be made from animal skin mainly include leather, dog chews, sausage skins and cosmetic products. The animal skin has to be seen as a sustainable material, and for this reason, the leather made from it should be viewed as being just as sustainable. The focus then has to be on the process of transforming the animal skin into the leather product and achieving this in a sustainable way.
creating a Favourable Business Environment: Some of the key challenges faced by the Indian leather industry include poor ranking in the ease of doing business, quality adherence and delivery compliance, lack of innovation and technology focus on footwear components, absence of large scale investments and environmental issues. The power problems faced by the companies due to shortage of power supply from state utilities also adds to the challenge. It is perhaps because of these reasons that India has failed to draw interest from foreign investors in the leather industry. FDI into the Indian leather sector was just US$ 156.9 mn during the 15 year period 2000 to 2015. Foreign capital has played a key role in the Vietnamese industry (which comprises largely footwear, alongside some leather products such as bags).
The State and Central Government in India need to introduce investor-friendly policies. Foreign capital will not only create job opportunities in the Indian leather sector, it will over time also bring in skillsand technical know-howwhichcanbenefit
Export-Import Bank of India20
Indian Leather Industry: Perspective and Strategies
the entire domestic industry. Foreign capital can stepinastheengineofgrowth.Inflowofforeigninvestment in the Indian leather industry, while aided by liberal FDI policies of the Government of India, also faces competition from small low cost countries in South East Asia. Thus, quality of infrastructure available in the country, as well as innovative investment policies will help to differentiate India as a manufacturing location for investors. Some of the key measures required are:
Introducing special package for the •international companies to set-up units in India, and even possibly help in developing new leather clusters.
A single widow clearance for land acquisition •and all statutory compliance for all sectors, including leather.
Various leather associations in India along •with the Council for Leather Exports and the Government should organize road shows in target markets.
Engage actively with US Organizations like •FDRA (Footwear Distributors and Retailers of America) and large corporations to include India as a strategic sourcing partner.
Moving towards Verified Certifications: A World Bank’s Enterprise Survey of leather showsIndia(only7%ofthefirmssurveyedhavequality accreditations) has performed poorly in comparisontoVietnam(35%ofthefirmssurveyedhavequalityaccreditations)andPakistan(28%ofthe firms surveyed have quality accreditations),
both of which have more number of firmshaving accreditations such as ISO (International Organization for Standardization), NEQS (National Environmental Quality Standards), etc. MostofthefirmsacrosstheglobeincludingIndiahave limited knowledge and awareness of the quality standards that are to be followed to be competitive in the international markets. Further, there are many quality standards being enforced by European markets like REACH (Regulation on Registration, Evaluation, Authorisation and Restriction of Chemicals) for chemicals used in the leather tanning process, which need to be followed by companies in order to supply to these markets. In China, for instance, the Ministry of Industry and Information Technology introduced a group of newly approved standards for 359 industrial sectors, including 20 standards for the leather industry.
The manufacturers have to successfully emphasize the environmental soundness of the product in the information to the buyers since major attention is being paid to the increasing role of the environment regulations.
At the same time, because the tanning industry needs natural resources, chemical products and energy, environmental sustainability becomes a fundamental aspect of leather production. Companies strongly committed to ecological principles should be a norm in the industry in order to ensure long-term economic, environmental and social sustainability. The tanneries’ commitment to environmentalsustainabilitycanbeconfirmedbysomeimportantinternationalproductcertificationsassumed on a voluntary basis.
Export-Import Bank of India 21
Indian Leather Industry: Perspective and Strategies
1. INTRODucTION
BAcKGROuND
Leather and its products are unique items, known for their versatility, style and fashion. While the leather industry was earlier predominantly concentrated in Europe, a major chunk of production has now shifted to Asia, and the Asian countries are now playing a significant role inglobal leather trade. With the projected increase in demand for leather products and footwear and projected growth in domestic markets in Asian countriesdue togrowingaffluenceofpopulationas a result of economic growth, there are good prospects for sustainable development of leather industry in the long run.
Comparative advantages in terms of factor conditions such as raw material availability and low labour cost, coupled with environmental considerations have contributed to a shift in the processing segment of leather sector value chains towards developing countries. The major global exporters of leather today are China, Italy, India, Brazil, Romania, Taiwan, Korea, and Vietnam. Other than some of the EU countries, like Italy
and Spain, most of the European countries serve as final export destinations. In addition, keycustomers as well as consumer categories in the global value chain of leather and leather products are located in the USA, Australia, and Japan. Hong Kong has also emerged as a large global importerofsemi-finishedandfinishedleather-forvalue addition and export. The growth in Vietnam, Indonesia and Thailand in the sector can also be ascribed to the thrust on footwear sector arising outofincreasedinflowofforeigndirectinvestmentand joint ventures in the leather industry of these countries.
On account of steep rise in labour cost and environmental concerns in the developed countries, since late 1970s and through 1980s, leather industry in all, except a handful of those countries, was virtually closed. This provided an opportunity for India and other developing countries for a better positioning in the global trade. At present, there is hardly any footwear produced in USA, and a significant amount ofthe requirement of footwear in most EU member countries (except Italy and Spain) is imported.
EXhIBIT 1: vALuE chAIN OF LEAThER INDusTRy
InternationalTrade
Export-Import Bank of India22
Indian Leather Industry: Perspective and Strategies
Similar is the situation in respect of other leather products like leather garments, gloves, handbags and wallets etc. China, India, Italy, Indonesia, Brazil and Taiwan have emerged as significantplayers, meeting major requirements of other countries.
Countries like Italy operate at the top end of the leather value chain with high value exports and high unit-value realisation. Their advantages are in design and styling, ability to produce quality leather out of even relatively poor raw material by virtue of application of unique process technology and brand equity. Italian production is oriented towards meeting foreign-demand. In fact, much of the domestic market requirements of Italy are met by cheaper imports from countries like China. A comparative perspective on unit value realization for footwear made in Italy, India, Brazil and China is revealing. The average unit-value realization of Indian footwear is estimated at US$ 9.89 per pair, that of the Chinese is US$ 5.07 per pair, Brazilian is US$ 8.53 per pair, while Italian alone is estimated at US$ 24.78 per pair3.
INTERNATIONAL TRADE
Aggregate global export of raw hides and skins (HS Code 41), the basic raw materials for leather products, during the year 2014 was in excess of US$ 36.2 billion. The overall value of export of raw hides and skins increased by US$ 707 million in 2014 as compared to the previous year. Italy was the top exporter of raw hides and skins followed by USA and Brazil. Globally, India ranked 6th in 2014 in export of raw hides and skins.
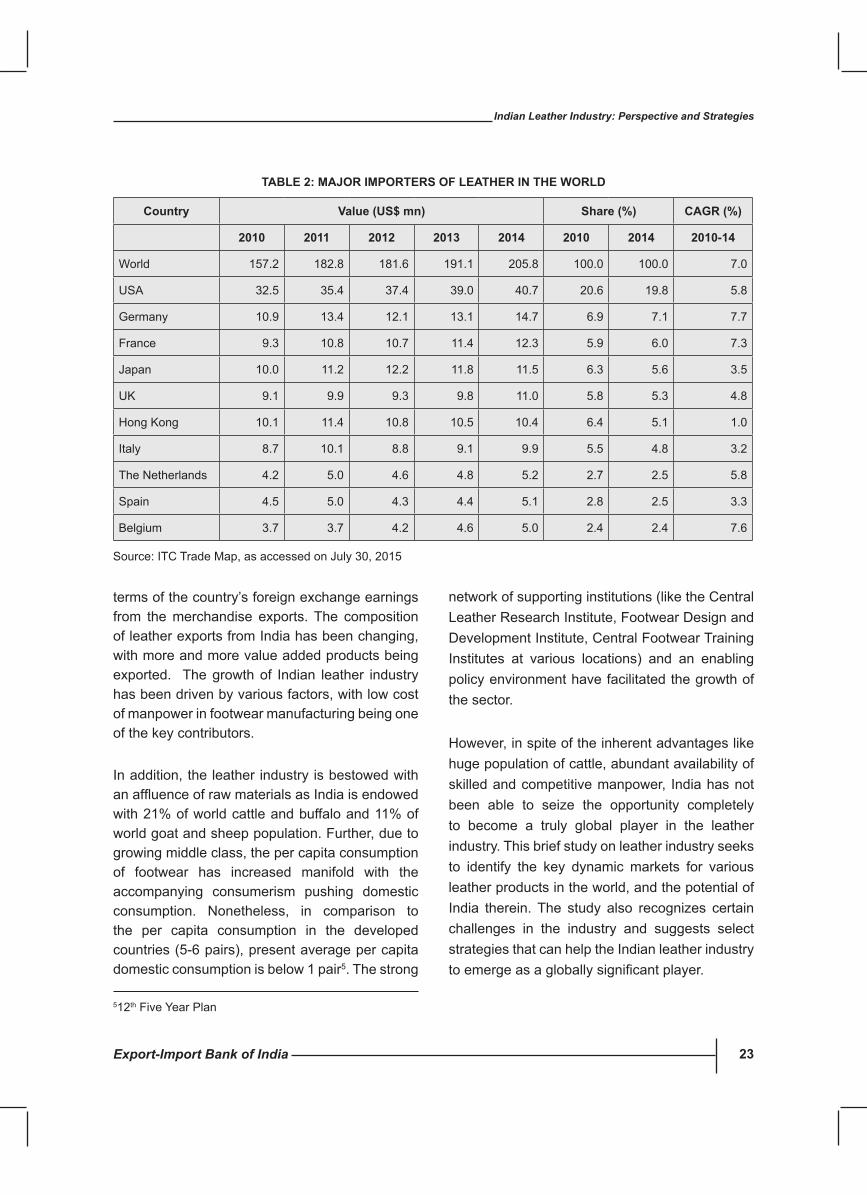
Overall leather exports from the world4 have increased from US$ 149.2 bn in 2010 to US$ 217.9 bn in 2014. China was, by far, the world’s leading exporter with a share of 39.5% followed by Italy at a distant second with a share of 9.6% and Vietnam at 7.6% in 2014 (Table 1). USA was the largest importer of these products, with a share of 19.8% in 2014, followed by Germany (7.1) and France (6.0%) (Table 2).
India had a 2.5% share in the global leather exports in 2014 and this sector ranked tenth in
3 ITC Geneva4Under 2 digit HS Codes: 41, 42, 64 (detailed list is available in Chapter 4)
country value (us$ bn) share (%) cAGR (%)
2010 2011 2012 2013 2014 2010 2014 2010-14
World 149.2 180.8 182.9 199.4 217.9 100.0 100.0 9.9
China 56.5 68.6 74.6 81.0 86.1 37.9 39.5 11.1
Italy 14.8 18.4 17.7 19.7 20.8 9.9 9.6 8.9
Vietnam 6.1 7.9 8.9 10.4 16.6 4.1 7.6 28.4
Hong Kong 11.6 12.6 11.9 10.9 10.2 7.8 4.7 -3.3
France 7.0 8.9 9.2 9.7 10.0 4.7 4.6 9.4
Germany 5.6 7.1 6.0 6.7 7.5 3.7 3.5 7.8
Belgium 4.8 5.5 5.5 6.1 7.0 3.2 3.2 9.8
India 3.1 4.1 4.0 5.1 5.5 2.1 2.5 15.6
Spain 3.4 4.0 3.8 4.3 5.0 2.3 2.3 10.2
The Netherlands 3.6 4.5 4.2 4.6 4.8 2.4 2.2 7.4
Source: ITC Trade Map, as accessed on July 30, 2015
TABLE 1: MAJOR EXPORTERs OF LEAThER IN ThE WORLD
Export-Import Bank of India 23
Indian Leather Industry: Perspective and Strategies
terms of the country’s foreign exchange earnings from the merchandise exports. The composition of leather exports from India has been changing, with more and more value added products being exported. The growth of Indian leather industry has been driven by various factors, with low cost of manpower in footwear manufacturing being one of the key contributors.
In addition, the leather industry is bestowed with anaffluenceofrawmaterialsasIndiaisendowedwith 21% of world cattle and buffalo and 11% of world goat and sheep population. Further, due to growing middle class, the per capita consumption of footwear has increased manifold with the accompanying consumerism pushing domestic consumption. Nonetheless, in comparison to the per capita consumption in the developed countries (5-6 pairs), present average per capita domestic consumption is below 1 pair5. The strong
TABLE 2: MAJOR IMPORTERs OF LEAThER IN ThE WORLD
country value (us$ mn) share (%) cAGR (%)
2010 2011 2012 2013 2014 2010 2014 2010-14
World 157.2 182.8 181.6 191.1 205.8 100.0 100.0 7.0
USA 32.5 35.4 37.4 39.0 40.7 20.6 19.8 5.8
Germany 10.9 13.4 12.1 13.1 14.7 6.9 7.1 7.7
France 9.3 10.8 10.7 11.4 12.3 5.9 6.0 7.3
Japan 10.0 11.2 12.2 11.8 11.5 6.3 5.6 3.5
UK 9.1 9.9 9.3 9.8 11.0 5.8 5.3 4.8
Hong Kong 10.1 11.4 10.8 10.5 10.4 6.4 5.1 1.0
Italy 8.7 10.1 8.8 9.1 9.9 5.5 4.8 3.2
The Netherlands 4.2 5.0 4.6 4.8 5.2 2.7 2.5 5.8
Spain 4.5 5.0 4.3 4.4 5.1 2.8 2.5 3.3
Belgium 3.7 3.7 4.2 4.6 5.0 2.4 2.4 7.6
Source: ITC Trade Map, as accessed on July 30, 2015
network of supporting institutions (like the Central Leather Research Institute, Footwear Design and Development Institute, Central Footwear Training Institutes at various locations) and an enabling policy environment have facilitated the growth of the sector.
However, in spite of the inherent advantages like huge population of cattle, abundant availability of skilled and competitive manpower, India has not been able to seize the opportunity completely to become a truly global player in the leather industry. This brief study on leather industry seeks to identify the key dynamic markets for various leather products in the world, and the potential of India therein. The study also recognizes certain challenges in the industry and suggests select strategies that can help the Indian leather industry toemergeasagloballysignificantplayer.
512thFiveYearPlan
Export-Import Bank of India24
Indian Leather Industry: Perspective and Strategies
2. RAW MATERIALs OF LEAThER: GLOBAL scENARIO
Leather and leather products are among the most widely traded products worldwide, and are based on renewable and readily available resources. It is estimated that global exports of leather exceeds US$ 217.9 billion, and is expected to continue growing alongside the increase in population and urbanization of developing and emerging countries.
The production and supply of leather has gradually moved away from industrialized to developing countries, which have emerged as major players in international trade. In fact, developing and emerging economies can now manage the whole supply chain on their own and are fast becoming the most important suppliers of value-added finishedproducts.About45%ofglobalfootwear,for example, is made in China. The supply chain is global and a great deal of trade is happening nowadays in the direction of South-South and South-North.
It is known that the leather industry relies on by-products of the meat and dairy industries for over 95% of its raw materials. The ratio of cattle population (the primary source of leather hides and skins) and leather produced to the size of human population has remained remarkably steady for the last one hundred years6. The FAO report, World Agriculture: Towards 2015-2030, highlights the fact that the proportion of animal products in the human diet has increased over the last three decades, at the expense of cereals and other crops. This trend is expected to continue, and may challenge the availability of raw materials.
PRODucTION OF RAW hIDEs AND sKINs
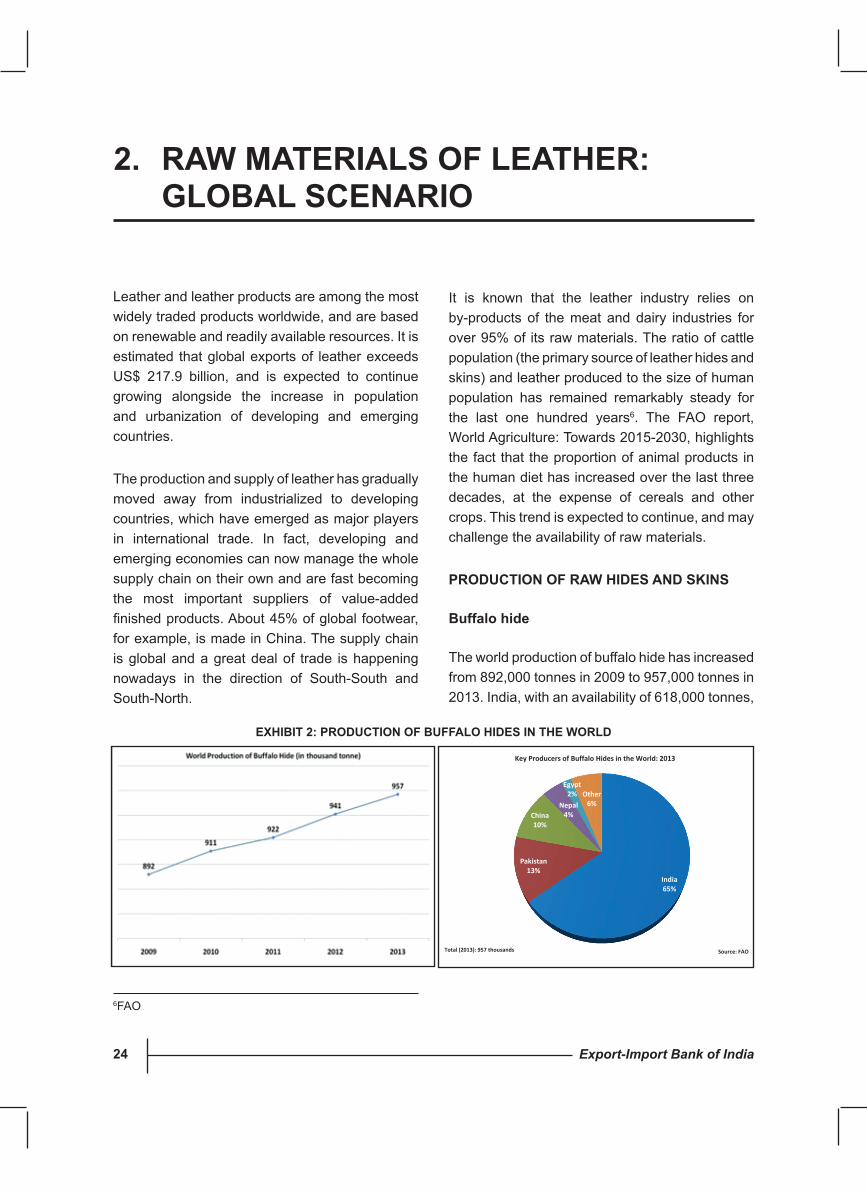
Buffalo hide
The world production of buffalo hide has increased from 892,000 tonnes in 2009 to 957,000 tonnes in 2013. India, with an availability of 618,000 tonnes,
6FAO
India 65%
Pakistan 13%
China 10%
Nepal 4%
Egypt 2% Other
6%
Key Producers of Buffalo Hides in the World: 2013
Total (2013): 957 thousands Source: FAO
EXhIBIT 2: PRODucTION OF BuFFALO hIDEs IN ThE WORLD
Export-Import Bank of India 25
Indian Leather Industry: Perspective and Strategies
had the highest availability of buffalo hides in 2013, representingashareof65%,followedbyPakistanand China, with 121,000 tonnes and 101,000 tonnes of buffalo hides, respectively (Exhibit 2). Asia, with a share of 97.3%, accounted for almost the entire production of buffalo hides in the world.
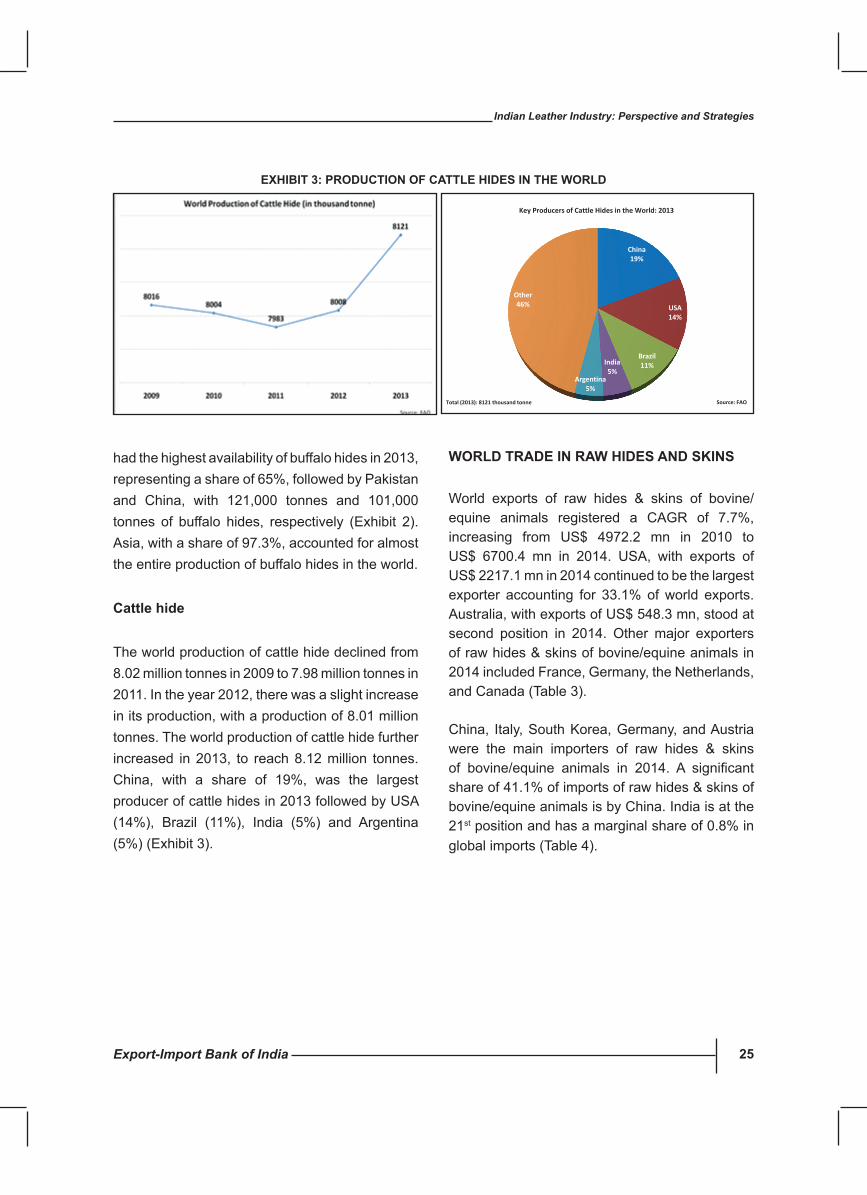
cattle hide
The world production of cattle hide declined from 8.02 million tonnes in 2009 to 7.98 million tonnes in 2011. In the year 2012, there was a slight increase in its production, with a production of 8.01 million tonnes. The world production of cattle hide further increased in 2013, to reach 8.12 million tonnes. China, with a share of 19%, was the largest producer of cattle hides in 2013 followed by USA (14%), Brazil (11%), India (5%) and Argentina (5%) (Exhibit 3).
WORLD TRADE IN RAW hIDEs AND sKINs
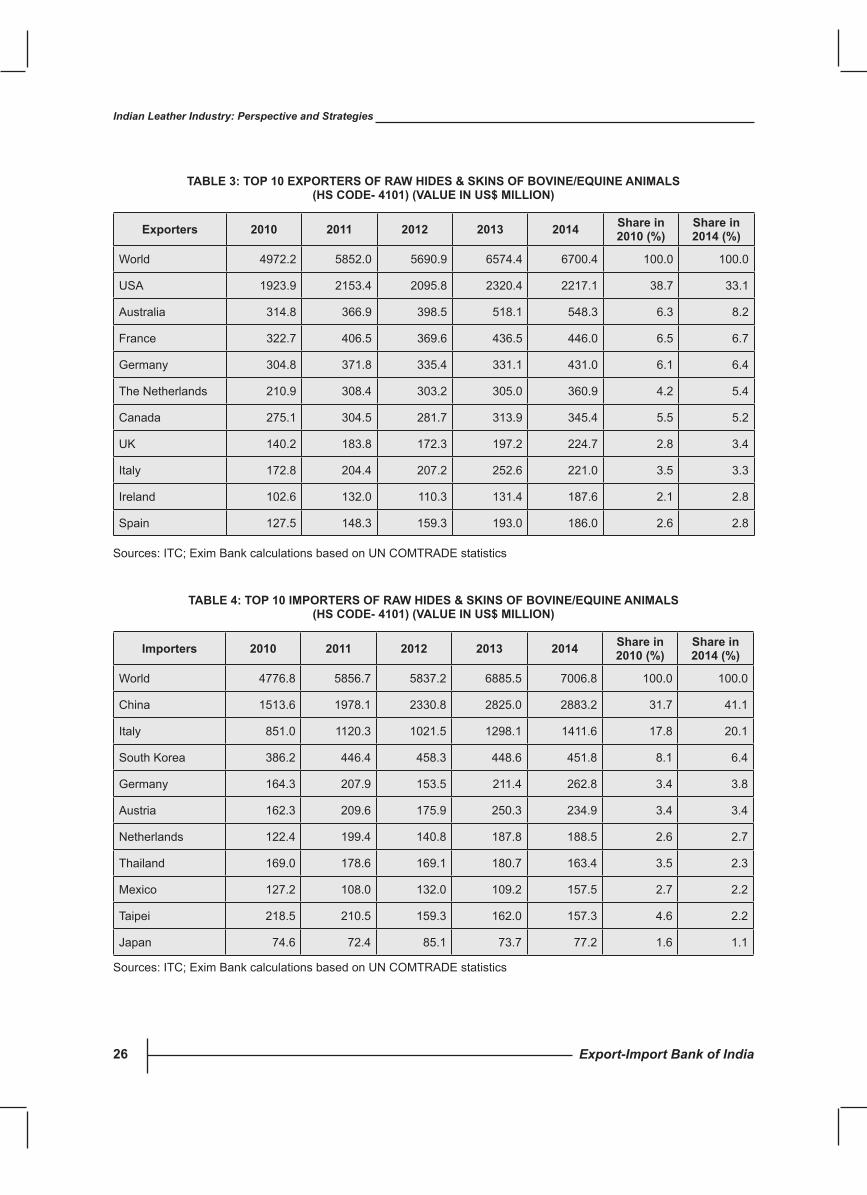
World exports of raw hides & skins of bovine/equine animals registered a CAGR of 7.7%, increasing from US$ 4972.2 mn in 2010 to US$ 6700.4 mn in 2014. USA, with exports of US$ 2217.1 mn in 2014 continued to be the largest exporter accounting for 33.1% of world exports. Australia, with exports of US$ 548.3 mn, stood at second position in 2014. Other major exporters of raw hides & skins of bovine/equine animals in 2014 included France, Germany, the Netherlands, and Canada (Table 3).
China, Italy, South Korea, Germany, and Austria were the main importers of raw hides & skins of bovine/equine animals in 2014. A significantshare of 41.1% of imports of raw hides & skins of bovine/equine animals is by China. India is at the 21st position and has a marginal share of 0.8% in global imports (Table 4).
China 19%
USA 14%
Brazil 11% India
5% Argentina
5%
Other 46%
Key Producers of Cattle Hides in the World: 2013
Total (2013): 8121 thousand tonne Source: FAO
EXhIBIT 3: PRODucTION OF cATTLE hIDEs IN ThE WORLD
Export-Import Bank of India26
Indian Leather Industry: Perspective and Strategies
Exporters 2010 2011 2012 2013 2014 share in 2010 (%)
share in 2014 (%)
World 4972.2 5852.0 5690.9 6574.4 6700.4 100.0 100.0
USA 1923.9 2153.4 2095.8 2320.4 2217.1 38.7 33.1
Australia 314.8 366.9 398.5 518.1 548.3 6.3 8.2
France 322.7 406.5 369.6 436.5 446.0 6.5 6.7
Germany 304.8 371.8 335.4 331.1 431.0 6.1 6.4
The Netherlands 210.9 308.4 303.2 305.0 360.9 4.2 5.4
Canada 275.1 304.5 281.7 313.9 345.4 5.5 5.2
UK 140.2 183.8 172.3 197.2 224.7 2.8 3.4
Italy 172.8 204.4 207.2 252.6 221.0 3.5 3.3
Ireland 102.6 132.0 110.3 131.4 187.6 2.1 2.8
Spain 127.5 148.3 159.3 193.0 186.0 2.6 2.8
TABLE 3: TOP 10 EXPORTERs OF RAW hIDEs & sKINs OF BOvINE/EQuINE ANIMALs (hs cODE- 4101) (vALuE IN us$ MILLION)
Sources: ITC; Exim Bank calculations based on UN COMTRADE statistics
Importers 2010 2011 2012 2013 2014 share in 2010 (%)
share in 2014 (%)
World 4776.8 5856.7 5837.2 6885.5 7006.8 100.0 100.0
China 1513.6 1978.1 2330.8 2825.0 2883.2 31.7 41.1
Italy 851.0 1120.3 1021.5 1298.1 1411.6 17.8 20.1
South Korea 386.2 446.4 458.3 448.6 451.8 8.1 6.4
Germany 164.3 207.9 153.5 211.4 262.8 3.4 3.8
Austria 162.3 209.6 175.9 250.3 234.9 3.4 3.4
Netherlands 122.4 199.4 140.8 187.8 188.5 2.6 2.7
Thailand 169.0 178.6 169.1 180.7 163.4 3.5 2.3
Mexico 127.2 108.0 132.0 109.2 157.5 2.7 2.2
Taipei 218.5 210.5 159.3 162.0 157.3 4.6 2.2
Japan 74.6 72.4 85.1 73.7 77.2 1.6 1.1
TABLE 4: TOP 10 IMPORTERs OF RAW hIDEs & sKINs OF BOvINE/EQuINE ANIMALs (hs cODE- 4101) (vALuE IN us$ MILLION)
Sources: ITC; Exim Bank calculations based on UN COMTRADE statistics

Export-Import Bank of India 27
Indian Leather Industry: Perspective and Strategies
GOAT sKIN
Productionofgoatskin,76.7%ofwhichoccursinAsia, has expanded steadily to exceed 1.2 million tonnes. The world production of goat skin stood at 1.26 million tonnes in the year 2013. China was the largest producer of goat skin, with 392,000 tonnes of goat skin produced in 2013. The other major producers during this period were India
(145,000 tonnes),Pakistan(107,000tonnes)andJordan (103,000 tonnes) (Exhibit 4).
World Trade in Goat / Kid skin
The top exporters of goat/kid skin leather (HS Code 4106) are primarily from Nigeria with a share of 15.5%. Taipei, Kenya, and Italy were the other major exporters with shares of 10.2%, 6.3%, and 6.1% in 2014, respectively (Table 5).
TABLE 5: TOP 10 EXPORTERs OF GOAT/KID sKIN LEAThER, OThER ThAN LEAThER OF hD NO 41.08/41.09 (hs cODE- 4106) (vALuE IN us$ MILLION)
Exporters 2010 2011 2012 2013 2014 share in 2010 (%)
share in 2014 (%)
World 1356.3 861.4 867.0 901.8 590.5 100.0 100.0
Nigeria 956.4 329.0 378.0 431.4 91.6 70.5 15.5
Taipei, Chinese 52.6 49.1 52.3 55.6 60.4 3.9 10.2
Kenya 24.9 32.1 0.0 40.1 37.1 1.8 6.3
Italy 27.8 40.5 34.4 45.4 36.3 2.1 6.1
Netherlands 6.2 33.4 59.1 22.2 30.2 0.5 5.1
Uganda 9.7 18.0 23.7 25.9 30.0 0.7 5.1
Saudi Arabia 6.9 7.5 5.4 11.2 29.8 0.5 5.0
Bangladesh 22.9 33.0 21.7 21.6 23.7 1.7 4.0
Hong Kong 35.0 44.1 31.1 29.8 23.0 2.6 3.9
France 11.7 20.8 20.3 16.8 22.2 0.9 3.8
Sources: ITC; Exim Bank calculations based on UN COMTRADE statistics
China 31%
India 11%
Pakistan 9%
Jordan 8%
Bangladesh 6%
Other 35%
Total (2013): 1261 thousand tonne Source: FAO
Key Producers of Goat Skin in the World: 2013
EXhIBIT 4: PRODucTION OF GOAT sKIN IN ThE WORLD
Export-Import Bank of India28
Indian Leather Industry: Perspective and Strategies
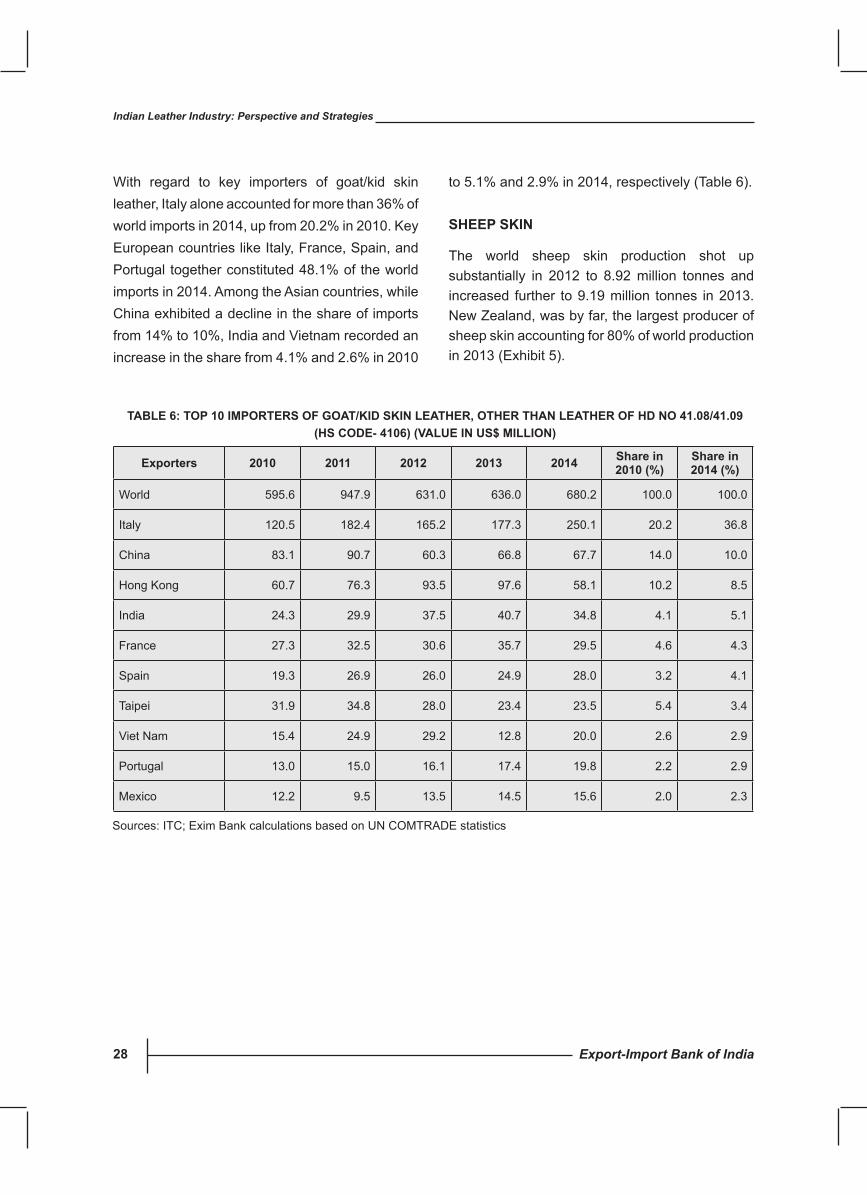
With regard to key importers of goat/kid skin leather, Italy alone accounted for more than 36% of world imports in 2014, up from 20.2% in 2010. Key European countries like Italy, France, Spain, and Portugaltogetherconstituted48.1%oftheworldimports in 2014. Among the Asian countries, while China exhibited a decline in the share of imports from 14% to 10%, India and Vietnam recorded an increase in the share from 4.1% and 2.6% in 2010
to 5.1% and 2.9% in 2014, respectively (Table 6).
shEEP sKIN
The world sheep skin production shot up substantially in 2012 to 8.92 million tonnes and increased further to 9.19 million tonnes in 2013. New Zealand, was by far, the largest producer of sheep skin accounting for 80% of world production in 2013 (Exhibit 5).
Exporters 2010 2011 2012 2013 2014 share in 2010 (%)
share in 2014 (%)
World 595.6 947.9 631.0 636.0 680.2 100.0 100.0
Italy 120.5 182.4 165.2 177.3 250.1 20.2 36.8
China 83.1 90.7 60.3 66.8 67.7 14.0 10.0
Hong Kong 60.7 76.3 93.5 97.6 58.1 10.2 8.5
India 24.3 29.9 37.5 40.7 34.8 4.1 5.1
France 27.3 32.5 30.6 35.7 29.5 4.6 4.3
Spain 19.3 26.9 26.0 24.9 28.0 3.2 4.1
Taipei 31.9 34.8 28.0 23.4 23.5 5.4 3.4
Viet Nam 15.4 24.9 29.2 12.8 20.0 2.6 2.9
Portugal 13.0 15.0 16.1 17.4 19.8 2.2 2.9
Mexico 12.2 9.5 13.5 14.5 15.6 2.0 2.3
TABLE 6: TOP 10 IMPORTERs OF GOAT/KID sKIN LEAThER, OThER ThAN LEAThER OF hD NO 41.08/41.09 (hs cODE- 4106) (vALuE IN us$ MILLION)
Sources: ITC; Exim Bank calculations based on UN COMTRADE statistics

Export-Import Bank of India 29
Indian Leather Industry: Perspective and Strategies
World Trade in sheep / Lamb skin
World exports of raw skins of sheep or lamb registered a CAGR of 4.8% increasing from US$ 936.4 mn in 2010 to US$ 1131.6 mn in 2014. Australia, with exports of US$ 345.2 mn in 2014 continued to be the largest exporter accounting
for 30.5% of world exports. New Zealand, with exports of US$ 129.9 mn, stood at second position in 2014. Other major exporters of raw skins of sheep or lamb in 2014 included UK, Spain, South Africa and Iran (Table 7). India however does not figureamongstthetop25exportersofrawskinsof sheep or lamb.
Exporters 2010 2011 2012 2013 2014 share in 2010 (%)
share in 2014 (%)
World 936.4 1544.3 1415.8 1590.9 1131.6 100.0 100.0
Australia 313.9 477.9 403.2 431.1 345.2 33.5 30.5
New Zealand 87.1 161.7 191.7 176.8 129.9 9.3 11.5
UK 102.4 188.0 137.6 146.8 107.3 10.9 9.5
Spain 107.4 164.5 148.4 154.5 102.3 11.5 9.0
South Africa 56.3 80.7 67.0 172.3 76.1 6.0 6.7
Iran 15.7 15.3 83.0 85.0 49.3 1.7 4.4
Italy 42.4 61.4 53.5 58.8 38.9 4.5 3.4
France 33.8 54.4 38.6 49.0 33.7 3.6 3.0
Ireland 15.0 25.4 24.3 39.7 26.3 1.6 2.3
The Netherlands 8.8 18.5 12.4 15.6 25.8 0.9 2.3
TABLE 7: TOP 10 EXPORTERs OF RAW sKINs OF shEEP OR LAMB (hs cODE- 4102) (vALuE IN us$ MILLION)
Sources: ITC; Exim Bank calculations based on UN COMTRADE statistics
New Zealand 80%
China 4% Jordan
3%
Australia 1%
Sudan 1%
Other 11%
Key Producers of Sheep Skin in the World: 2013
Total (2013): 9189 thousand tonnes Source: FAO
EXhIBIT 5: PRODucTION OF shEEP sKIN IN ThE WORLD
Export-Import Bank of India30
Indian Leather Industry: Perspective and Strategies
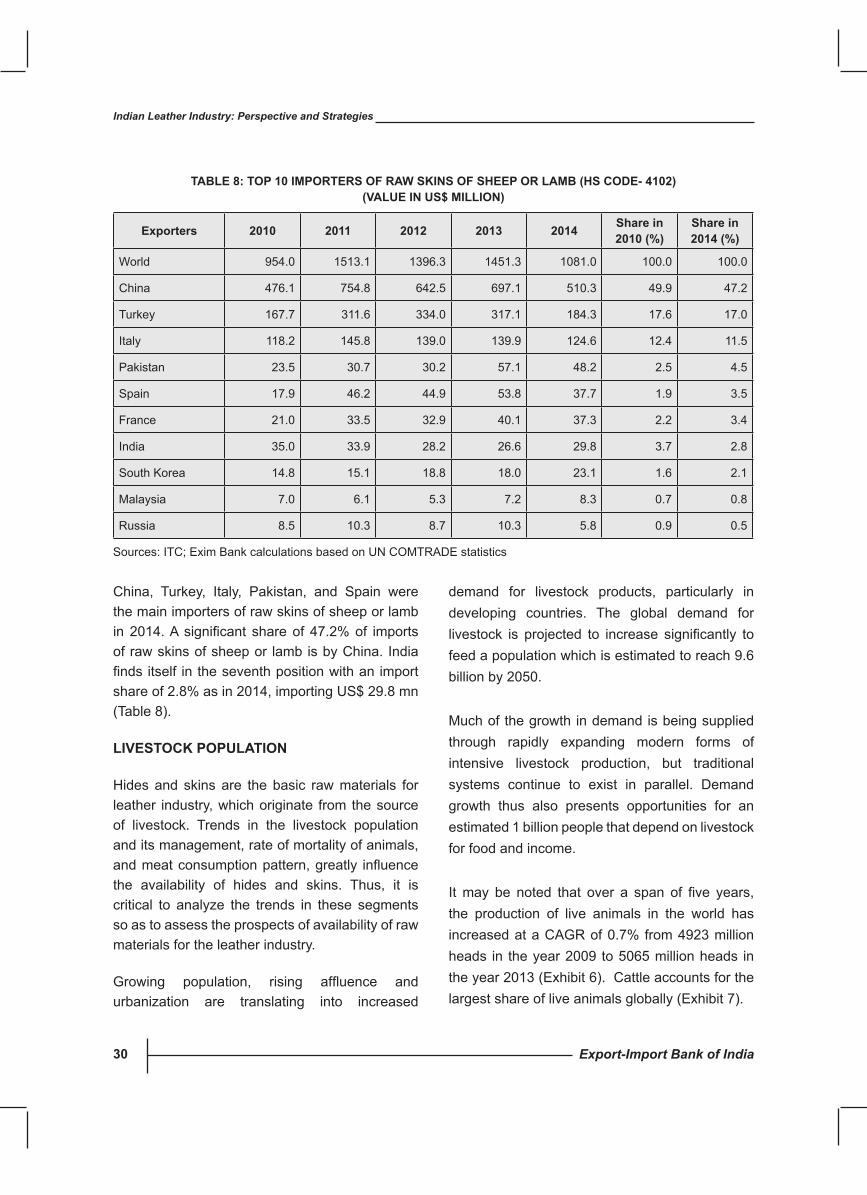
China, Turkey, Italy, Pakistan, and Spain werethe main importers of raw skins of sheep or lamb in 2014.A significant shareof 47.2%of importsof raw skins of sheep or lamb is by China. India findsitself intheseventhpositionwithanimportshare of 2.8% as in 2014, importing US$ 29.8 mn (Table 8).
LIvEsTOcK POPuLATION
Hides and skins are the basic raw materials for leather industry, which originate from the source of livestock. Trends in the livestock population and its management, rate of mortality of animals, andmeatconsumptionpattern,greatly influencethe availability of hides and skins. Thus, it is critical to analyze the trends in these segments so as to assess the prospects of availability of raw materials for the leather industry.
Growing population, rising affluence andurbanization are translating into increased
demand for livestock products, particularly in developing countries. The global demand for livestock is projected to increase significantly tofeed a population which is estimated to reach 9.6 billion by 2050.
Much of the growth in demand is being supplied through rapidly expanding modern forms of intensive livestock production, but traditional systems continue to exist in parallel. Demand growth thus also presents opportunities for an estimated 1 billion people that depend on livestock for food and income.
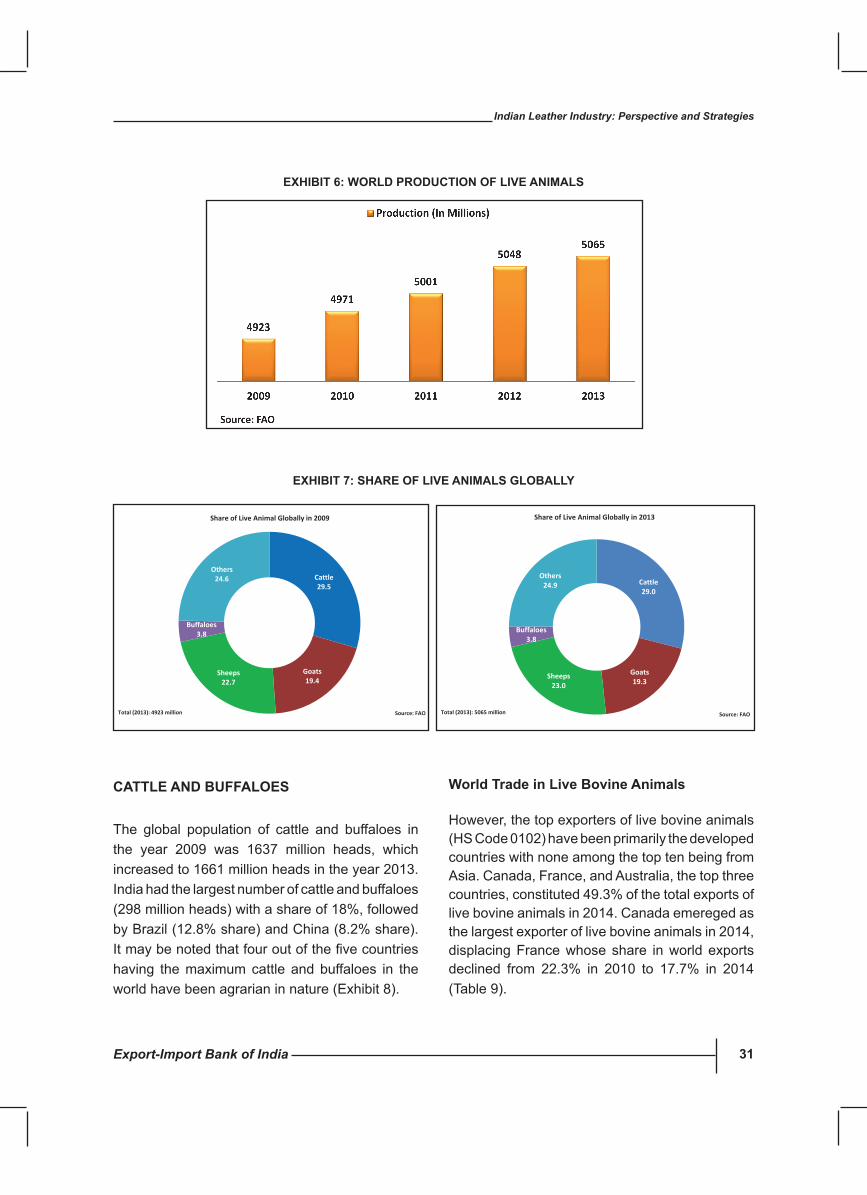
Itmay be noted that over a span of five years,the production of live animals in the world has increased at a CAGR of 0.7% from 4923 million heads in the year 2009 to 5065 million heads in the year 2013 (Exhibit 6). Cattle accounts for the largest share of live animals globally (Exhibit 7).
Exporters 2010 2011 2012 2013 2014 share in 2010 (%)
share in 2014 (%)
World 954.0 1513.1 1396.3 1451.3 1081.0 100.0 100.0
China 476.1 754.8 642.5 697.1 510.3 49.9 47.2
Turkey 167.7 311.6 334.0 317.1 184.3 17.6 17.0
Italy 118.2 145.8 139.0 139.9 124.6 12.4 11.5
Pakistan 23.5 30.7 30.2 57.1 48.2 2.5 4.5
Spain 17.9 46.2 44.9 53.8 37.7 1.9 3.5
France 21.0 33.5 32.9 40.1 37.3 2.2 3.4
India 35.0 33.9 28.2 26.6 29.8 3.7 2.8
South Korea 14.8 15.1 18.8 18.0 23.1 1.6 2.1
Malaysia 7.0 6.1 5.3 7.2 8.3 0.7 0.8
Russia 8.5 10.3 8.7 10.3 5.8 0.9 0.5
TABLE 8: TOP 10 IMPORTERs OF RAW sKINs OF shEEP OR LAMB (hs cODE- 4102) (vALuE IN us$ MILLION)
Sources: ITC; Exim Bank calculations based on UN COMTRADE statistics
Export-Import Bank of India 31
Indian Leather Industry: Perspective and Strategies
cATTLE AND BuFFALOEs
The global population of cattle and buffaloes in the year 2009 was 1637 million heads, which increased to 1661 million heads in the year 2013. India had the largest number of cattle and buffaloes (298 million heads) with a share of 18%, followed by Brazil (12.8% share) and China (8.2% share). Itmaybenotedthatfouroutofthefivecountrieshaving the maximum cattle and buffaloes in the world have been agrarian in nature (Exhibit 8).
World Trade in Live Bovine Animals
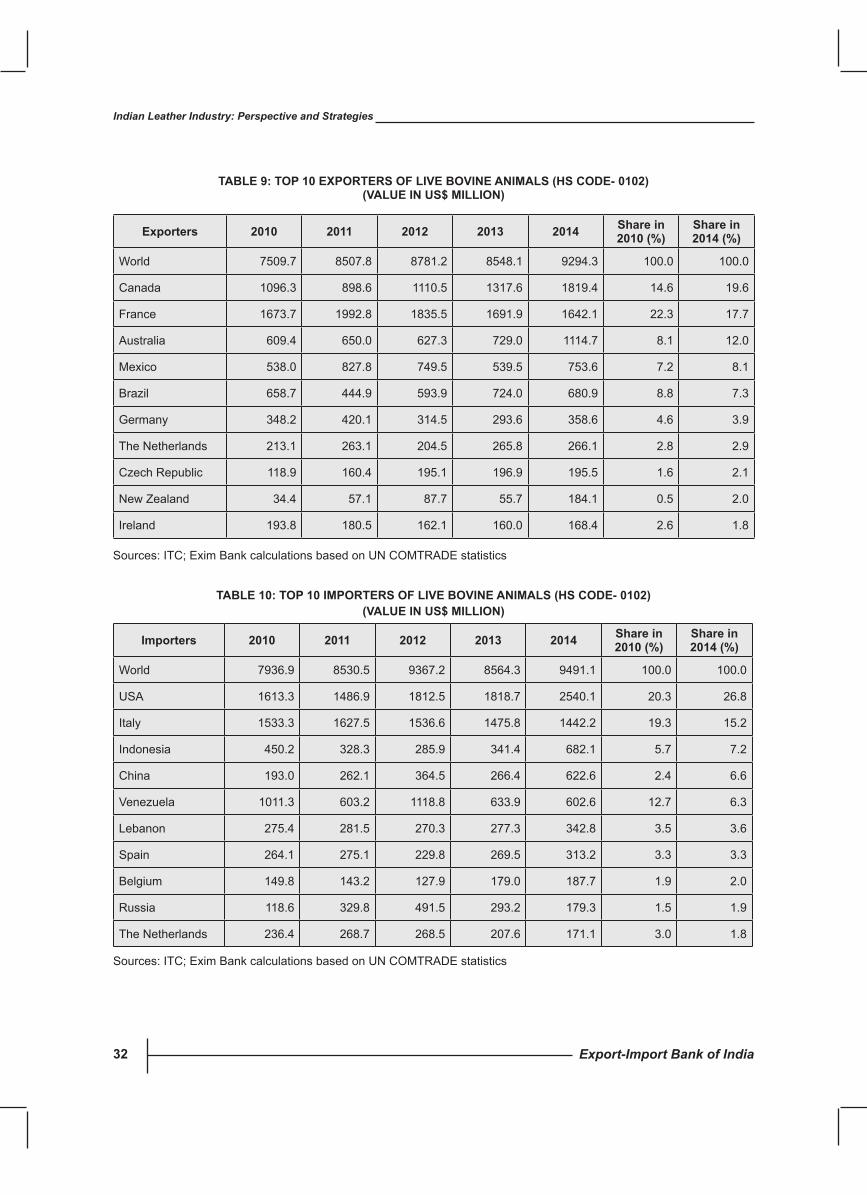
However, the top exporters of live bovine animals (HS Code 0102) have been primarily the developed countries with none among the top ten being from Asia. Canada, France, and Australia, the top three countries, constituted 49.3% of the total exports of live bovine animals in 2014. Canada emereged as the largest exporter of live bovine animals in 2014, displacing France whose share in world exports declined from 22.3% in 2010 to 17.7% in 2014 (Table 9).
Cattle 29.5
Goats 19.4
Sheeps 22.7
Buffaloes 3.8
Others 24.6
Source: FAO
Share of Live Animal Globally in 2009
Total (2013): 4923 million
Cattle 29.0
Goats 19.3
Sheeps 23.0
Buffaloes 3.8
Others 24.9
Total (2013): 5065 million
Share of Live Animal Globally in 2013
Source: FAO
EXhIBIT 7: shARE OF LIvE ANIMALs GLOBALLy
EXhIBIT 6: WORLD PRODucTION OF LIvE ANIMALs
Export-Import Bank of India32
Indian Leather Industry: Perspective and Strategies
TABLE 9: TOP 10 EXPORTERs OF LIvE BOvINE ANIMALs (hs cODE- 0102) (vALuE IN us$ MILLION)
Exporters 2010 2011 2012 2013 2014 share in 2010 (%)
share in 2014 (%)
World 7509.7 8507.8 8781.2 8548.1 9294.3 100.0 100.0
Canada 1096.3 898.6 1110.5 1317.6 1819.4 14.6 19.6
France 1673.7 1992.8 1835.5 1691.9 1642.1 22.3 17.7
Australia 609.4 650.0 627.3 729.0 1114.7 8.1 12.0
Mexico 538.0 827.8 749.5 539.5 753.6 7.2 8.1
Brazil 658.7 444.9 593.9 724.0 680.9 8.8 7.3
Germany 348.2 420.1 314.5 293.6 358.6 4.6 3.9
The Netherlands 213.1 263.1 204.5 265.8 266.1 2.8 2.9
Czech Republic 118.9 160.4 195.1 196.9 195.5 1.6 2.1
New Zealand 34.4 57.1 87.7 55.7 184.1 0.5 2.0
Ireland 193.8 180.5 162.1 160.0 168.4 2.6 1.8
Sources: ITC; Exim Bank calculations based on UN COMTRADE statistics
Importers 2010 2011 2012 2013 2014 share in 2010 (%)
share in 2014 (%)
World 7936.9 8530.5 9367.2 8564.3 9491.1 100.0 100.0
USA 1613.3 1486.9 1812.5 1818.7 2540.1 20.3 26.8
Italy 1533.3 1627.5 1536.6 1475.8 1442.2 19.3 15.2
Indonesia 450.2 328.3 285.9 341.4 682.1 5.7 7.2
China 193.0 262.1 364.5 266.4 622.6 2.4 6.6
Venezuela 1011.3 603.2 1118.8 633.9 602.6 12.7 6.3
Lebanon 275.4 281.5 270.3 277.3 342.8 3.5 3.6
Spain 264.1 275.1 229.8 269.5 313.2 3.3 3.3
Belgium 149.8 143.2 127.9 179.0 187.7 1.9 2.0
Russia 118.6 329.8 491.5 293.2 179.3 1.5 1.9
The Netherlands 236.4 268.7 268.5 207.6 171.1 3.0 1.8
TABLE 10: TOP 10 IMPORTERs OF LIvE BOvINE ANIMALs (hs cODE- 0102) (vALuE IN us$ MILLION)
Sources: ITC; Exim Bank calculations based on UN COMTRADE statistics

Export-Import Bank of India 33
Indian Leather Industry: Perspective and Strategies
With regard to key importers of live bovine animals, USA alone accounts for more than a quarter of the total world imports, with its share having increased from 20.3% in 2010 to touch 26.8% in 2014. Key European countries like Italy, Spain, Belgium and the Netherlands together constituted more than one-fifthoftheworldimportsin2014.AmongtheAsian peers, Indonesia and China exhibited an increase in share of imports of live bovine animals from 5.7% to 7.2%, and 2.4% to 6.6%, respectively during 2010 to 2014 (Table 10).
shEEP AND GOATs
The world population of sheep and goats stood at 2139 million heads in 2013, up from 2071 million heads in 2009. With a total production of
358 million heads, China had the largest share of 16.7% in the world sheep and goats population. India, with 198 million heads of sheep and goats, stood at second position in world population of sheep and goats (Exhibit 9).
World Trade in sheep and Goats
Global exports of live sheep & goats (HS Code- 0104) have witnessed a decline from US$ 1.4 bn in 2010 to US$ 1.3 bn in 2014, after reaching a peak of US$ 2 bn in 2013. Romania has emerged as the major exporter with its share in global exports having increased from 8.1% in 2010 to 16.6% in 2014. Australia, which had a share of 21.2% in world exports in 2010, experienced a decline to 16.5% in 2014. On the other hand, other major
China 16.7%
India 9.2%
Nigeria 4.5%
Sudan 4.5%
Pakistan 4.4%
Others 60.7%
Key Producers of Sheep & Goats in the World: 2013
Total (2013): 2139 million heads Source: FAO
India 18.0%
Brazil 12.8%
China 8.2% USA
5.4% Pakistan
4.3%
Others 51.3%
Key Producers of Cattle & Buffaloes in the World: 2013
Total (2013): 1661 million heads Source: FAO
EXhIBIT 9: PRODucTION OF shEEP AND GOATs IN ThE WORLD
EXhIBIT 8: PRODucTION OF cATTLE AND BuFFALOEs IN ThE WORLD
Export-Import Bank of India34
Indian Leather Industry: Perspective and Strategies
Exporters 2010 2011 2012 2013 2014 share in 2010 (%)
share in 2014 (%)
World 1416.4 1850.8 1909.1 2037.7 1340.0 100 100Romania 114.2 168.0 173.9 199.3 222.0 8.1 16.6Australia 299.6 347.6 296.2 174.2 221.0 21.2 16.5Jordan 31.6 115.5 137.0 218.0 206.0 2.2 15.4Spain 33.0 38.0 64.7 102.3 116.8 2.3 8.7Somalia 160.4 210.4 240.7 338.3 81.4 11.3 6.1Iran 0.9 32.1 53.5 66.8 81.0 0.1 6.0Oman 25.3 19.2 25.2 35.2 77.0 1.8 5.7Hungary 53.9 61.2 53.7 51.0 50.0 3.8 3.7France 53.9 72.9 49.1 48.5 46.7 3.8 3.5UK 7.9 11.3 7.8 11.1 28.2 0.6 2.1
TABLE 11: TOP 10 EXPORTERs OF LIvE shEEP & GOATs (hs cODE- 0104) (vALuE IN us$ MILLION)
Sources: ITC; Exim Bank calculations based on UN COMTRADE statistics
Importers 2010 2011 2012 2013 2014 share (2010)
share (2014)
World 1511.4 1809.0 1721.5 1903.7 1343.9 100 100
Libya 2.8 12.8 107.1 175.6 203.7 0.2 15.2
Saudi Arabia 522.3 576.9 676.8 825.1 198.5 34.6 14.8
Kuwait 167.4 207.8 152.6 127.5 144.0 11.1 10.7
Oman 57.6 55.9 68.1 91.1 125.0 3.8 9.3
Jordan 43.3 54.0 86.5 122.0 107.3 2.9 8.0
Italy 123.5 125.2 104.3 92.4 94.4 8.2 7.0
Qatar 103.1 145.7 67.6 66.3 71.5 6.8 5.3
Bahrain 81.1 88.1 77.1 28.1 48.4 5.4 3.6
France 49.3 42.8 39.9 42.7 43.8 3.3 3.3
UAE 31.1 29.1 36.1 32.3 41.7 2.1 3.1
TABLE 12: TOP 10 IMPORTERs OF LIvE shEEP & GOATs (hs cODE- 0104) (vALuE IN us$ MILLION)
Sources: ITC; Exim Bank calculations based on UN COMTRADE statistics
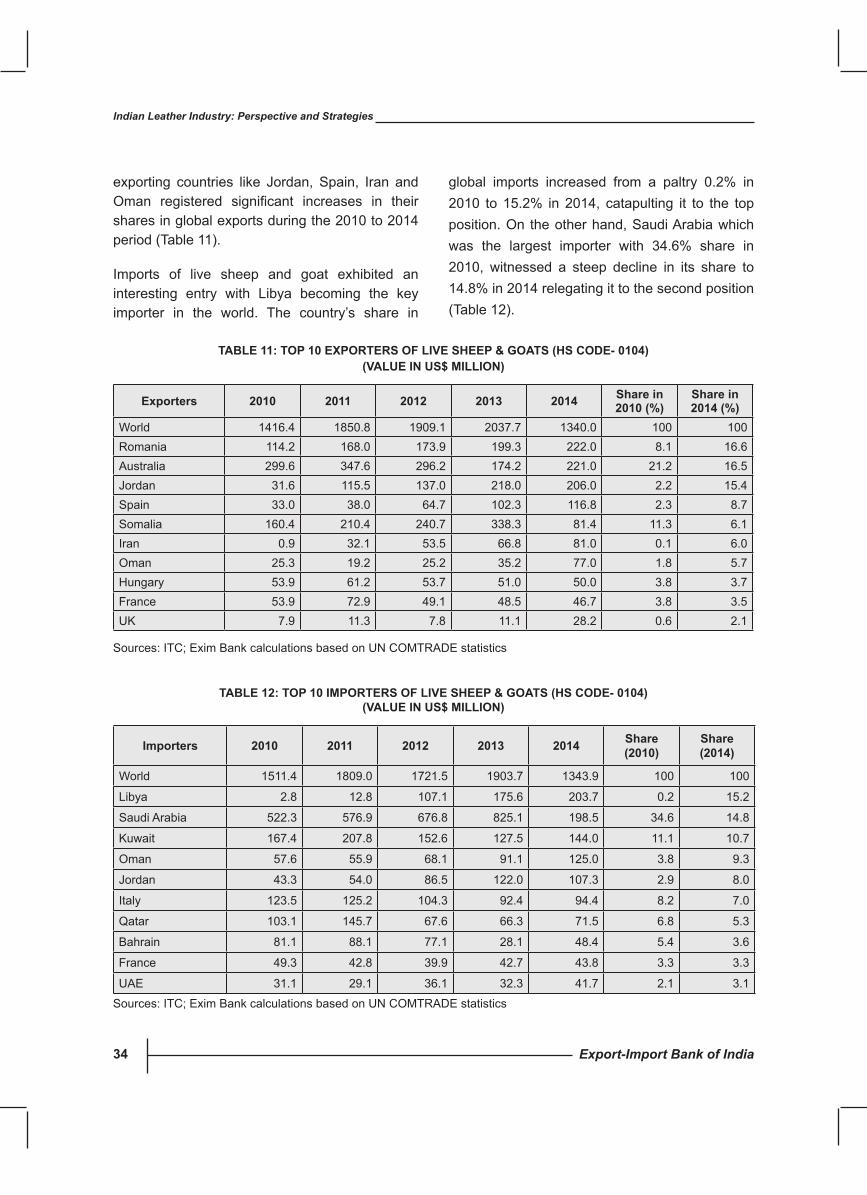
exporting countries like Jordan, Spain, Iran and Oman registered significant increases in theirshares in global exports during the 2010 to 2014 period (Table 11).
Imports of live sheep and goat exhibited an interesting entry with Libya becoming the key importer in the world. The country’s share in
global imports increased from a paltry 0.2% in 2010 to 15.2% in 2014, catapulting it to the top position. On the other hand, Saudi Arabia which was the largest importer with 34.6% share in 2010, witnessed a steep decline in its share to 14.8% in 2014 relegating it to the second position (Table 12).
Export-Import Bank of India 35
Indian Leather Industry: Perspective and Strategies
3. INDIAN LEAThER INDusTRy: AN OvERvIEW
The Indian leather industry has undergone a drastic change, from being an exporter of mere raw materials in the early 60’s and 70’s to an exporter offinished,valueaddedleatherproductstoday.Ithas established itself as a prominent industry both in international as well as in the domestic market. Apart from being the second largest exporter of leather footwear component, leather garments, and saddlery and harness; third largest exporter of finishedleather;fourthlargestexporterofleathergoods, India is also the second largest producer of footwear and leather garments in the world.
The leather industry is an employment intensive sector, providing jobs to about 2.5 million people. These people belong mostly to the weaker sections of the society. Women employment is also predominant in leather products sector with their share being an estimated 30%7. Moreover, 55% of workforce in the sector is below 35 years of age, which indicates that the sector has abundant young skilled talent8.
With an annual turnover of over US$ 12 billion, the export of leather and leather products increased manifold over the past decades and touched US$ 6.5 billion during 2014-15. The sector is also known for its consistency in high export earnings.
The leather sector comprises tanneries (where hide and skins are transformed into leather) and manufacturing units (where leather footwear, garments and outerwear, and assorted leather
goods are manufactured). These production facilities are predominantly spread over the unorganized (mostly family owned) units/production centres which contributes almost 80% to the total production.
The units are generally spread across large, medium, small and household units with the small and household units contributing almost 80% of the production. Large and medium units are generally tanneries or big companies which are involved in manufacturing of footwear.
The major production centres for leather and leather products are located at Tamil Nadu (Chennai, Ambathur, Ranipet, Vaniyambadi, Tiruchirappalli, Dindigul) followed by West Bengal (Kolkata), Uttar Pradesh (Kanpur,Agra, Noida).Maharashtra (Mumbai) has the lowest number of manufacturing units.
Leather is one of the industries in which India has abundance of raw material (India is endowed with 18% of world cattle & buffalo and 9.2% of the world goat & sheep population), skilled manpower and technology, apart from the capability to comply with international environmental standards.
INDIAN TANNING INDusTRy
Indian tanning industry, started in 1980, with a modest production devoted to leather for shoe uppers.Overtheyears,itdiversifiedintoarangeof
7http://www.leatherindia.org/about-council/industryatGlance.asp8http://makeinindia.com/sector/leather/
Export-Import Bank of India36
Indian Leather Industry: Perspective and Strategies
end-use segments. Today, Indian tanning Industry produces over 2 billion square feet of leather per annum. There are more than 2000 tanneries in the country, almost half of which are located in Tamil Nadu, a quarter in West Bengal and about one-fifth inUttarPradesh.Chennai,Ambur,Ranipet,Kolkata, Kanpur, Jallandhar are some of the major centres for tanning industries in the country.9
suPPLy OF RAW hIDEs AND sKINs
Leatherisadurableandflexiblematerialcreatedbythe tanning of animal raw hide and skin, often cattle hide. It can be produced through manufacturing processes ranging from cottage industry to heavy industries. Tanning is the process of treating skins of animals to produce leather, which is more durable and less susceptible to decomposition. The raw material for the leather industry comes from dead animals. India has the largest livestock population in the world. The country has a strong raw material base of goat, buffalo, cow, and sheep leather (18% of world cattle & buffalo and 9.2%
of world goat & sheep population). The building of capacities in the leather and leather product sector in India is considered one of the crucial requirements for enhancing production.
EXPORTs
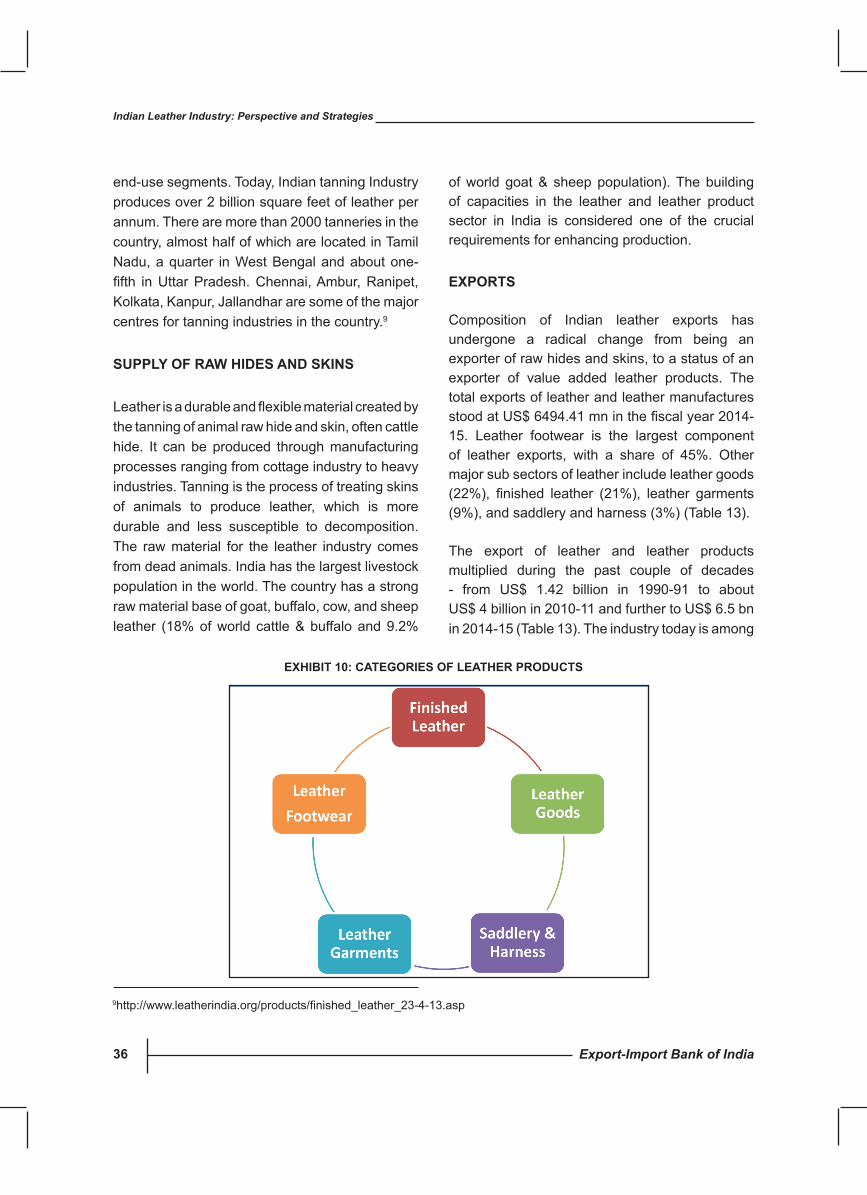
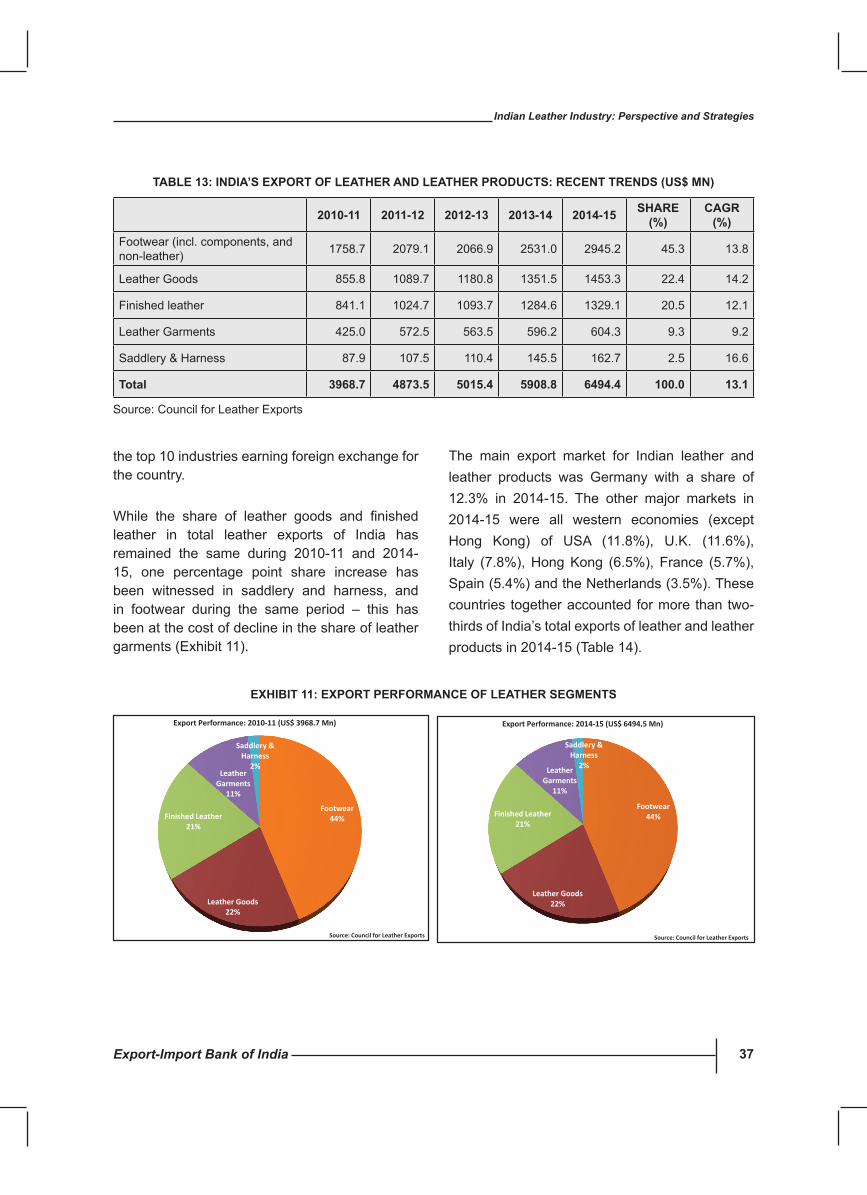
Composition of Indian leather exports has undergone a radical change from being an exporter of raw hides and skins, to a status of an exporter of value added leather products. The total exports of leather and leather manufactures stoodatUS$6494.41mninthefiscalyear2014-15. Leather footwear is the largest component of leather exports, with a share of 45%. Other major sub sectors of leather include leather goods (22%), finished leather (21%), leather garments(9%), and saddlery and harness (3%) (Table 13).
The export of leather and leather products multiplied during the past couple of decades - from US$ 1.42 billion in 1990-91 to about US$ 4 billion in 2010-11 and further to US$ 6.5 bn in 2014-15 (Table 13). The industry today is among
9http://www.leatherindia.org/products/finished_leather_23-4-13.asp
EXhIBIT 10: cATEGORIEs OF LEAThER PRODucTs
Export-Import Bank of India 37
Indian Leather Industry: Perspective and Strategies
the top 10 industries earning foreign exchange for the country.
While the share of leather goods and finishedleather in total leather exports of India has remained the same during 2010-11 and 2014-15, one percentage point share increase has been witnessed in saddlery and harness, and in footwear during the same period – this has been at the cost of decline in the share of leather garments (Exhibit 11).
2010-11 2011-12 2012-13 2013-14 2014-15 shARE (%)
cAGR (%)
Footwear (incl. components, and non-leather) 1758.7 2079.1 2066.9 2531.0 2945.2 45.3 13.8
Leather Goods 855.8 1089.7 1180.8 1351.5 1453.3 22.4 14.2
Finished leather 841.1 1024.7 1093.7 1284.6 1329.1 20.5 12.1
Leather Garments 425.0 572.5 563.5 596.2 604.3 9.3 9.2
Saddlery & Harness 87.9 107.5 110.4 145.5 162.7 2.5 16.6
Total 3968.7 4873.5 5015.4 5908.8 6494.4 100.0 13.1
TABLE 13: INDIA’s EXPORT OF LEAThER AND LEAThER PRODucTs: REcENT TRENDs (us$ MN)
Source: Council for Leather Exports
The main export market for Indian leather and leather products was Germany with a share of 12.3% in 2014-15. The other major markets in 2014-15 were all western economies (except Hong Kong) of USA (11.8%), U.K. (11.6%), Italy (7.8%), Hong Kong (6.5%), France (5.7%), Spain (5.4%) and the Netherlands (3.5%). These countries together accounted for more than two-thirds of India’s total exports of leather and leather products in 2014-15 (Table 14).
Footwear 44%
Leather Goods 22%
Finished Leather 21%
Leather Garments
11%
Saddlery & Harness
2%
Source: Council for Leather Exports
Export Performance: 2014-15 (US$ 6494.5 Mn)
Footwear 44%
Leather Goods 22%
Finished Leather 21%
Leather Garments
11%
Saddlery & Harness
2%
Source: Council for Leather Exports
Export Performance: 2010-11 (US$ 3968.7 Mn)
EXhIBIT 11: EXPORT PERFORMANcE OF LEAThER sEGMENTs
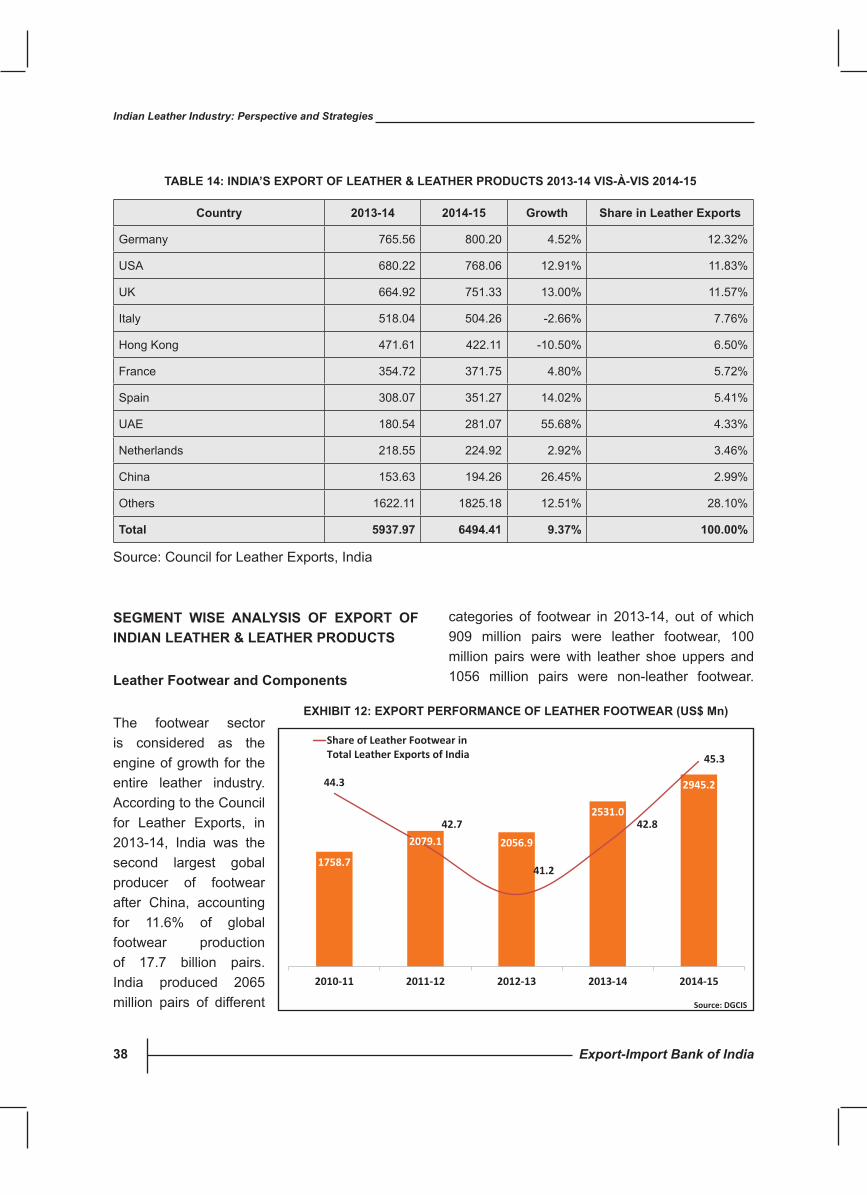
Export-Import Bank of India38
Indian Leather Industry: Perspective and Strategies
TABLE 14: INDIA’s EXPORT OF LEAThER & LEAThER PRODucTs 2013-14 vIs-À-vIs 2014-15
country 2013-14 2014-15 Growth share in Leather Exports
Germany 765.56 800.20 4.52% 12.32%
USA 680.22 768.06 12.91% 11.83%
UK 664.92 751.33 13.00% 11.57%
Italy 518.04 504.26 -2.66% 7.76%
Hong Kong 471.61 422.11 -10.50% 6.50%
France 354.72 371.75 4.80% 5.72%
Spain 308.07 351.27 14.02% 5.41%
UAE 180.54 281.07 55.68% 4.33%
Netherlands 218.55 224.92 2.92% 3.46%
China 153.63 194.26 26.45% 2.99%
Others 1622.11 1825.18 12.51% 28.10%
Total 5937.97 6494.41 9.37% 100.00%
Source: Council for Leather Exports, India
1758.7
2079.1 2056.9
2531.0
2945.2 44.3
42.7
41.2
42.8
45.3
39
40
41
42
43
44
45
46
0.0
500 .0
1000.0
1500.0
2000.0
2500.0
3000.0
3500.0
2010-11 2011-12 2012-13 2013-14 2014-15
Share of Leather Footwear inTotal Leather Exports of India
Source: DGCIS
Export Performance of Leather Footwear (US$ Mn) EXhIBIT 12: EXPORT PERFORMANcE OF LEAThER FOOTWEAR (us$ Mn)
sEGMENT WIsE ANALysIs OF EXPORT OF INDIAN LEAThER & LEAThER PRODucTs
Leather Footwear and components
The footwear sector is considered as the engine of growth for the entire leather industry. According to the Council for Leather Exports, in 2013-14, India was the second largest gobal producer of footwear after China, accounting for 11.6% of global footwear production of 17.7 billion pairs. India produced 2065 million pairs of different
categories of footwear in 2013-14, out of which 909 million pairs were leather footwear, 100 million pairs were with leather shoe uppers and 1056 million pairs were non-leather footwear.
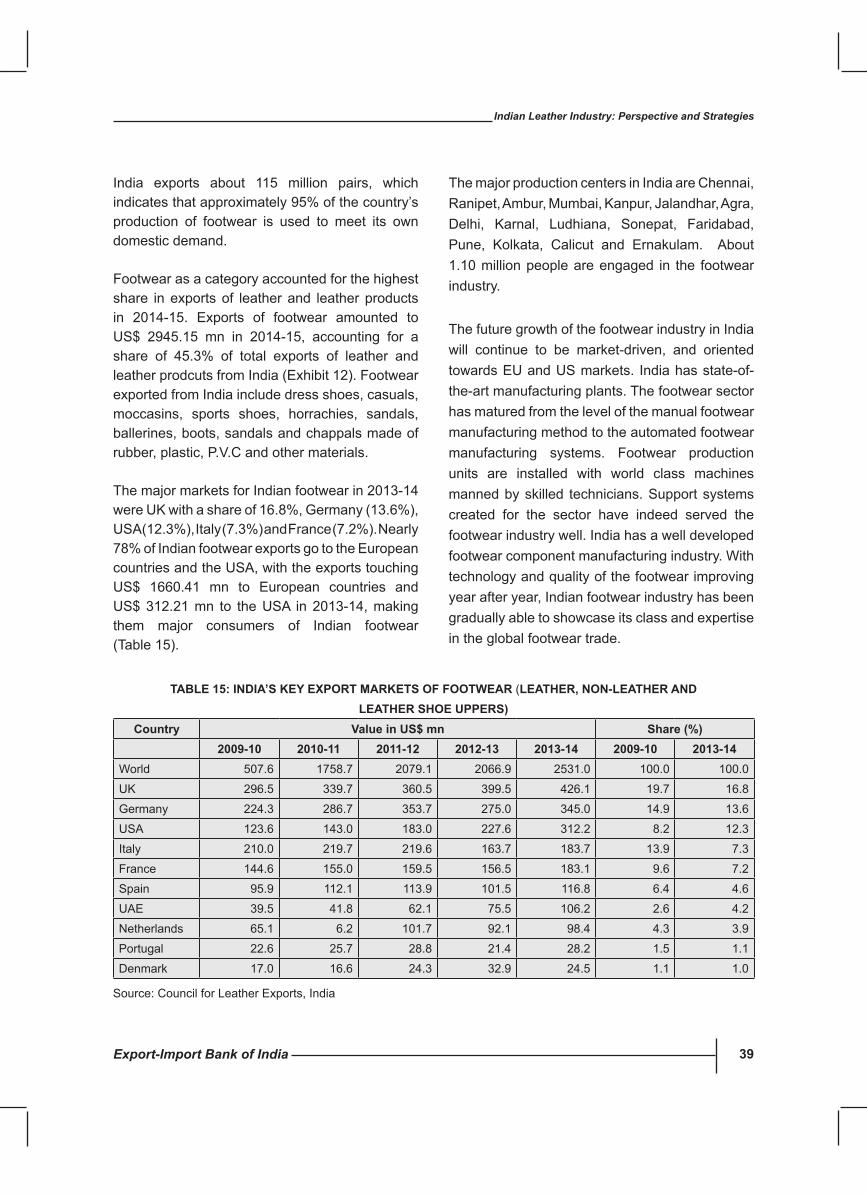
Export-Import Bank of India 39
Indian Leather Industry: Perspective and Strategies
India exports about 115 million pairs, which indicates that approximately 95% of the country’s production of footwear is used to meet its own domestic demand.
Footwear as a category accounted for the highest share in exports of leather and leather products in 2014-15. Exports of footwear amounted to US$ 2945.15 mn in 2014-15, accounting for a share of 45.3% of total exports of leather and leather prodcuts from India (Exhibit 12). Footwear exported from India include dress shoes, casuals, moccasins, sports shoes, horrachies, sandals, ballerines, boots, sandals and chappals made of rubber,plastic,P.V.Candothermaterials.
The major markets for Indian footwear in 2013-14 were UK with a share of 16.8%, Germany (13.6%), USA (12.3%), Italy (7.3%) and France (7.2%). Nearly 78% of Indian footwear exports go to the European countries and the USA, with the exports touching US$ 1660.41 mn to European countries and US$ 312.21 mn to the USA in 2013-14, making them major consumers of Indian footwear (Table 15).
The major production centers in India are Chennai, Ranipet, Ambur, Mumbai, Kanpur, Jalandhar, Agra, Delhi, Karnal, Ludhiana, Sonepat, Faridabad, Pune, Kolkata, Calicut and Ernakulam. About1.10 million people are engaged in the footwear industry.
The future growth of the footwear industry in India will continue to be market-driven, and oriented towards EU and US markets. India has state-of-the-art manufacturing plants. The footwear sector has matured from the level of the manual footwear manufacturing method to the automated footwear manufacturing systems. Footwear production units are installed with world class machines manned by skilled technicians. Support systems created for the sector have indeed served the footwear industry well. India has a well developed footwear component manufacturing industry. With technology and quality of the footwear improving year after year, Indian footwear industry has been gradually able to showcase its class and expertise in the global footwear trade.
TABLE 15: INDIA’s KEy EXPORT MARKETs OF FOOTWEAR (LEAThER, NON-LEAThER ANDLEAThER shOE uPPERs)
country value in us$ mn share (%)2009-10 2010-11 2011-12 2012-13 2013-14 2009-10 2013-14
World 507.6 1758.7 2079.1 2066.9 2531.0 100.0 100.0
UK 296.5 339.7 360.5 399.5 426.1 19.7 16.8
Germany 224.3 286.7 353.7 275.0 345.0 14.9 13.6
USA 123.6 143.0 183.0 227.6 312.2 8.2 12.3
Italy 210.0 219.7 219.6 163.7 183.7 13.9 7.3
France 144.6 155.0 159.5 156.5 183.1 9.6 7.2
Spain 95.9 112.1 113.9 101.5 116.8 6.4 4.6
UAE 39.5 41.8 62.1 75.5 106.2 2.6 4.2
Netherlands 65.1 6.2 101.7 92.1 98.4 4.3 3.9
Portugal 22.6 25.7 28.8 21.4 28.2 1.5 1.1
Denmark 17.0 16.6 24.3 32.9 24.5 1.1 1.0
Source: Council for Leather Exports, India
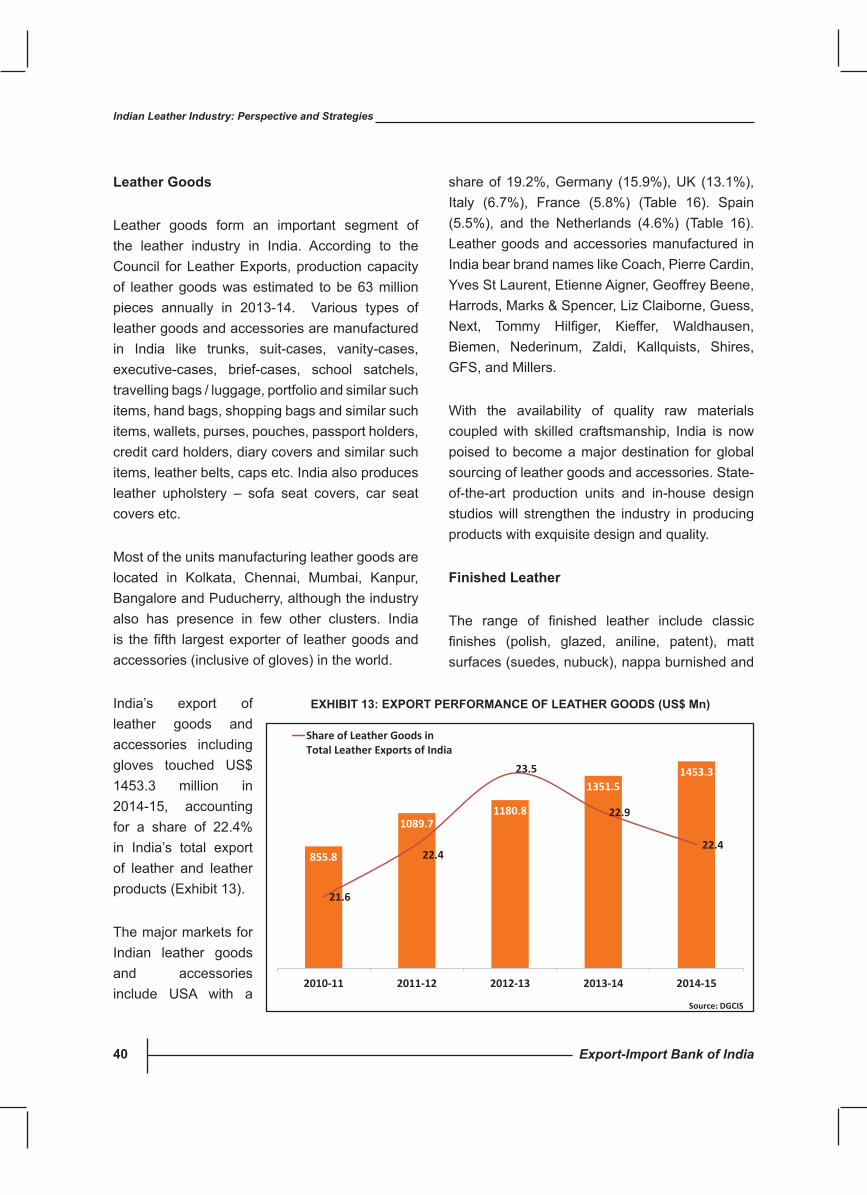
Export-Import Bank of India40
Indian Leather Industry: Perspective and Strategies
Leather Goods
Leather goods form an important segment of the leather industry in India. According to the Council for Leather Exports, production capacity of leather goods was estimated to be 63 million pieces annually in 2013-14. Various types of leather goods and accessories are manufactured in India like trunks, suit-cases, vanity-cases, executive-cases, brief-cases, school satchels, travelling bags / luggage, portfolio and similar such items, hand bags, shopping bags and similar such items, wallets, purses, pouches, passport holders, credit card holders, diary covers and similar such items, leather belts, caps etc. India also produces leather upholstery – sofa seat covers, car seat covers etc.
Most of the units manufacturing leather goods are located in Kolkata, Chennai, Mumbai, Kanpur, BangaloreandPuducherry,althoughtheindustryalso has presence in few other clusters. India is thefifth largestexporterof leathergoodsandaccessories (inclusive of gloves) in the world.
India’s export of leather goods and accessories including gloves touched US$ 1453.3 million in 2014-15, accounting for a share of 22.4% in India’s total export of leather and leather products (Exhibit 13).
The major markets for Indian leather goods and accessories include USA with a
share of 19.2%, Germany (15.9%), UK (13.1%), Italy (6.7%), France (5.8%) (Table 16). Spain (5.5%), and the Netherlands (4.6%) (Table 16). Leather goods and accessories manufactured in IndiabearbrandnameslikeCoach,PierreCardin,Yves St Laurent, Etienne Aigner, Geoffrey Beene, Harrods, Marks & Spencer, Liz Claiborne, Guess, Next, Tommy Hilfiger, Kieffer, Waldhausen,Biemen, Nederinum, Zaldi, Kallquists, Shires, GFS, and Millers.
With the availability of quality raw materials coupled with skilled craftsmanship, India is now poised to become a major destination for global sourcing of leather goods and accessories. State-of-the-art production units and in-house design studios will strengthen the industry in producing products with exquisite design and quality.
Finished Leather
The range of finished leather include classicfinishes (polish, glazed, aniline, patent), mattsurfaces (suedes, nubuck), nappa burnished and
855.8
1089.7 1180.8
1351.5 1453.3
21.6
22.4
23.5
22.9
22.4
20.5
21
21.5
22
22.5
23
23.5
24
0.0
200 .0
400 .0
600 .0
800 .0
100 0.0
120 0.0
140 0.0
160 0.0
2010-11 2011-12 2012-13 2013-14 2014-15
Share of Leather Goods inTotal Leather Exports of India
Export Performance of Leather Goods (US$ Mn)
Source: DGCIS
EXhIBIT 13: EXPORT PERFORMANcE OF LEAThER GOODs (us$ Mn)
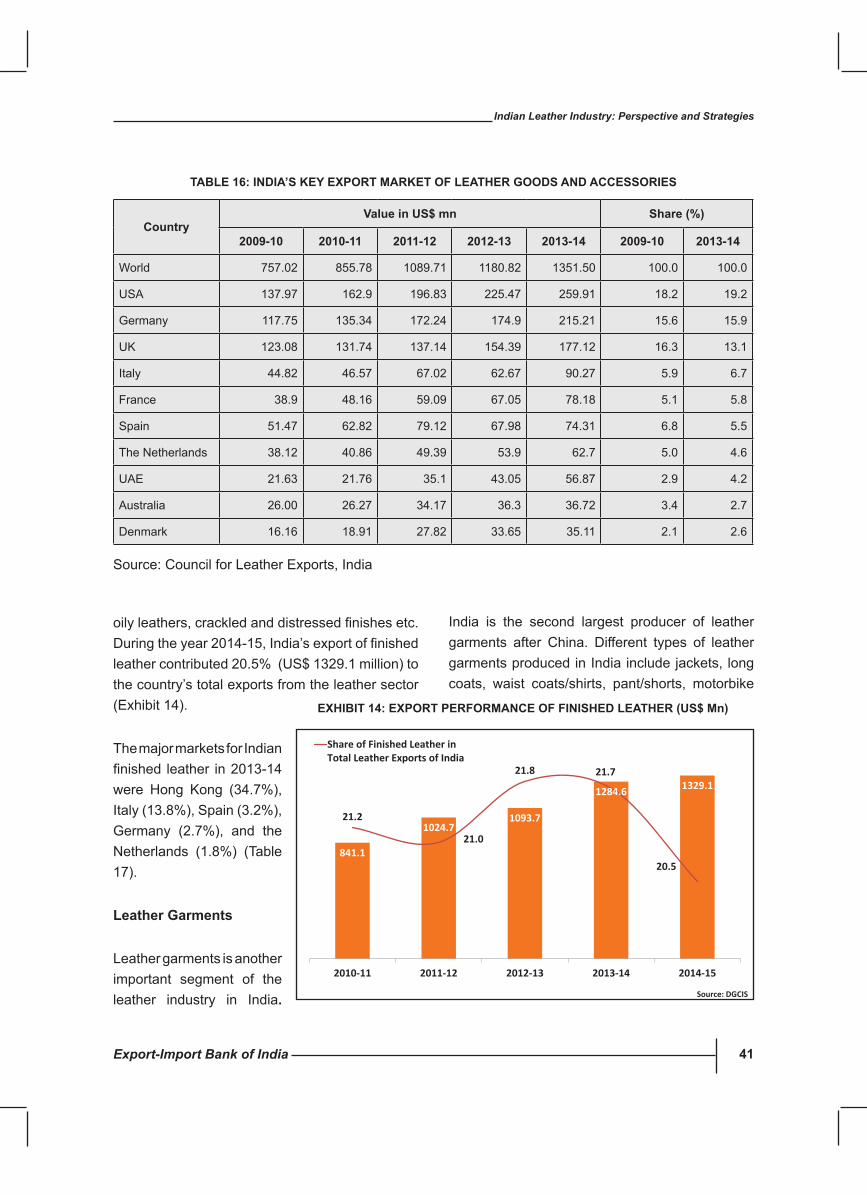
Export-Import Bank of India 41
Indian Leather Industry: Perspective and Strategies
oilyleathers,crackledanddistressedfinishesetc.Duringtheyear2014-15,India’sexportoffinishedleather contributed 20.5% (US$ 1329.1 million) to the country’s total exports from the leather sector (Exhibit 14).
The major markets for Indian finished leather in2013-14were Hong Kong (34.7%), Italy (13.8%), Spain (3.2%), Germany (2.7%), and the Netherlands (1.8%) (Table 17).
Leather Garments
Leather garments is another important segment of the leather industry in India.
India is the second largest producer of leather garments after China. Different types of leather garments produced in India include jackets, long coats, waist coats/shirts, pant/shorts, motorbike
countryvalue in us$ mn share (%)
2009-10 2010-11 2011-12 2012-13 2013-14 2009-10 2013-14
World 757.02 855.78 1089.71 1180.82 1351.50 100.0 100.0
USA 137.97 162.9 196.83 225.47 259.91 18.2 19.2
Germany 117.75 135.34 172.24 174.9 215.21 15.6 15.9
UK 123.08 131.74 137.14 154.39 177.12 16.3 13.1
Italy 44.82 46.57 67.02 62.67 90.27 5.9 6.7
France 38.9 48.16 59.09 67.05 78.18 5.1 5.8
Spain 51.47 62.82 79.12 67.98 74.31 6.8 5.5
The Netherlands 38.12 40.86 49.39 53.9 62.7 5.0 4.6
UAE 21.63 21.76 35.1 43.05 56.87 2.9 4.2
Australia 26.00 26.27 34.17 36.3 36.72 3.4 2.7
Denmark 16.16 18.91 27.82 33.65 35.11 2.1 2.6
TABLE 16: INDIA’s KEy EXPORT MARKET OF LEAThER GOODs AND AccEssORIEs
Source: Council for Leather Exports, India
841.1
1024.7 1093.7
1284.6 1329.1
21.2
21.0
21.8 21.7
20.5
19.5
20.0
20.5
21.0
21.5
22.0
0.0
200 .0
400 .0
600 .0
800 .0
100 0.0
120 0.0
140 0.0
2010-11 2011-12 2012-13 2013-14 2014-15
Share of Finished Leather inTotal Leather Exports of India
Export Performance of Finished Leather (US$ Mn)
Source: DGCIS
EXhIBIT 14: EXPORT PERFORMANcE OF FINIshED LEAThER (us$ Mn)
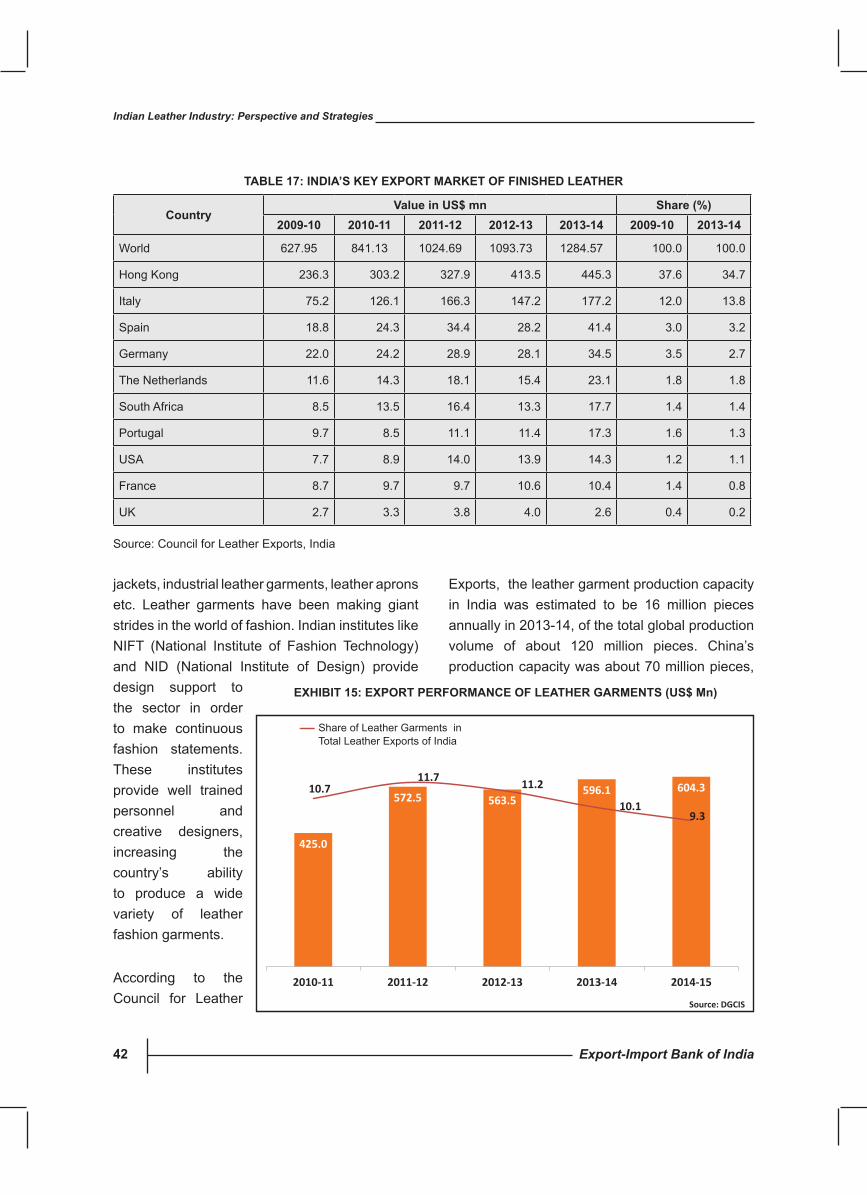
Export-Import Bank of India42
Indian Leather Industry: Perspective and Strategies
jackets, industrial leather garments, leather aprons etc. Leather garments have been making giant strides in the world of fashion. Indian institutes like NIFT (National Institute of Fashion Technology) and NID (National Institute of Design) provide design support to the sector in order to make continuous fashion statements. These institutes provide well trained personnel and creative designers, increasing the country’s ability to produce a wide variety of leather fashion garments.
According to the Council for Leather
Exports, the leather garment production capacity in India was estimated to be 16 million pieces annually in 2013-14, of the total global production volume of about 120 million pieces. China’s production capacity was about 70 million pieces,
countryvalue in us$ mn share (%)
2009-10 2010-11 2011-12 2012-13 2013-14 2009-10 2013-14
World 627.95 841.13 1024.69 1093.73 1284.57 100.0 100.0
Hong Kong 236.3 303.2 327.9 413.5 445.3 37.6 34.7
Italy 75.2 126.1 166.3 147.2 177.2 12.0 13.8
Spain 18.8 24.3 34.4 28.2 41.4 3.0 3.2
Germany 22.0 24.2 28.9 28.1 34.5 3.5 2.7
The Netherlands 11.6 14.3 18.1 15.4 23.1 1.8 1.8
South Africa 8.5 13.5 16.4 13.3 17.7 1.4 1.4
Portugal 9.7 8.5 11.1 11.4 17.3 1.6 1.3
USA 7.7 8.9 14.0 13.9 14.3 1.2 1.1
France 8.7 9.7 9.7 10.6 10.4 1.4 0.8
UK 2.7 3.3 3.8 4.0 2.6 0.4 0.2
Source: Council for Leather Exports, India
TABLE 17: INDIA’s KEy EXPORT MARKET OF FINIshED LEAThER
425.0
572.5 563.5 596.1 604.3 10.7
11.7 11.2
10.1 9.3
0.0
2.0
4.0
6.0
8.0
10.0
12.0
14.0
0.0
100 .0
200 .0
300 .0
400 .0
500 .0
600 .0
700 .0
2010-11 2011-12 2012-13 2013-14 2014-15
Share of Leather Garments inTotal Leather Exports of India
Source: DGCIS
Export Performance of Leather Garments (US$ Mn) EXhIBIT 15: EXPORT PERFORMANcE OF LEAThER GARMENTs (us$ Mn)
Share of Leather Garments inTotal Leather Exports of India
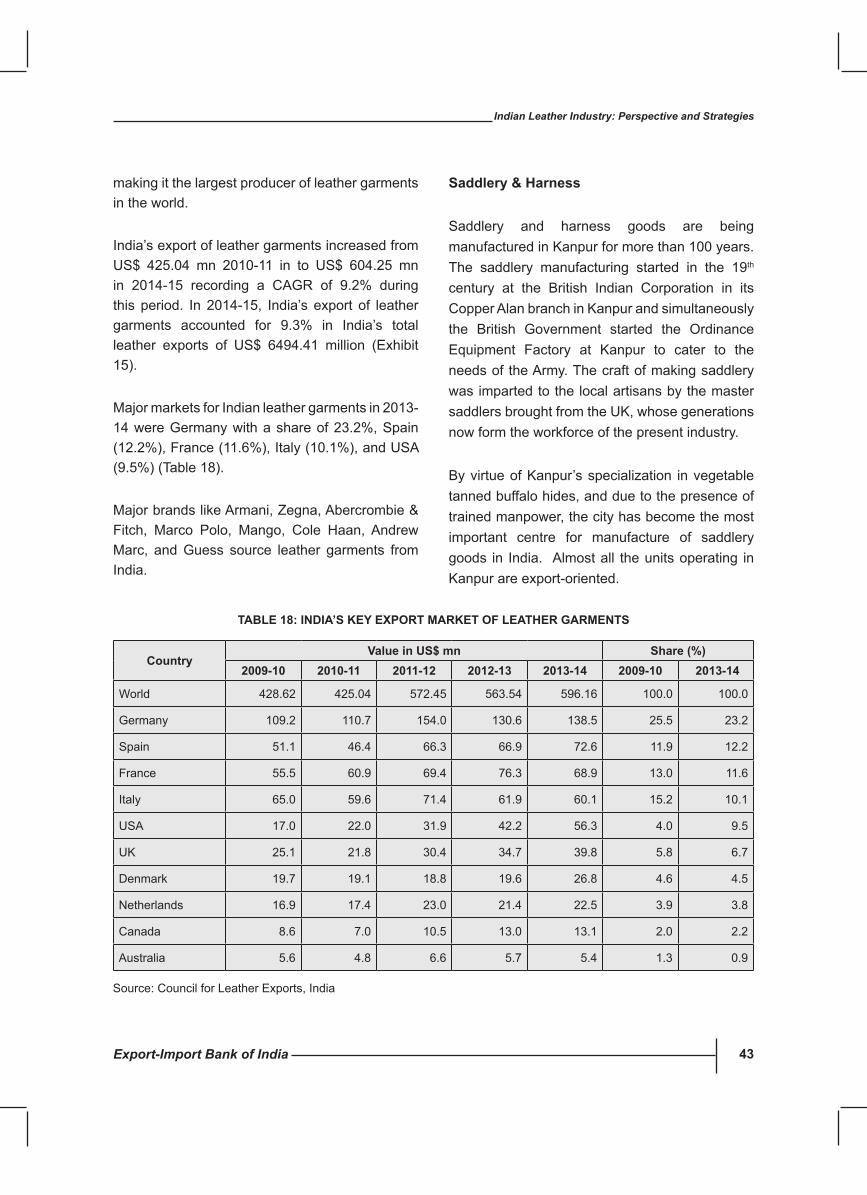
Export-Import Bank of India 43
Indian Leather Industry: Perspective and Strategies
making it the largest producer of leather garments in the world.
India’s export of leather garments increased from US$ 425.04 mn 2010-11 in to US$ 604.25 mn in 2014-15 recording a CAGR of 9.2% during this period. In 2014-15, India’s export of leather garments accounted for 9.3% in India’s total leather exports of US$ 6494.41 million (Exhibit 15).
Major markets for Indian leather garments in 2013-14 were Germany with a share of 23.2%, Spain (12.2%), France (11.6%), Italy (10.1%), and USA (9.5%) (Table 18).
Major brands like Armani, Zegna, Abercrombie & Fitch, Marco Polo, Mango, Cole Haan, AndrewMarc, and Guess source leather garments from India.
saddlery & harness
Saddlery and harness goods are being manufactured in Kanpur for more than 100 years. The saddlery manufacturing started in the 19th century at the British Indian Corporation in its Copper Alan branch in Kanpur and simultaneously the British Government started the Ordinance Equipment Factory at Kanpur to cater to the needs of the Army. The craft of making saddlery was imparted to the local artisans by the master saddlers brought from the UK, whose generations now form the workforce of the present industry.
By virtue of Kanpur’s specialization in vegetable tanned buffalo hides, and due to the presence of trained manpower, the city has become the most important centre for manufacture of saddlery goods in India. Almost all the units operating in Kanpur are export-oriented.
TABLE 18: INDIA’s KEy EXPORT MARKET OF LEAThER GARMENTs
country value in us$ mn share (%)
2009-10 2010-11 2011-12 2012-13 2013-14 2009-10 2013-14
World 428.62 425.04 572.45 563.54 596.16 100.0 100.0
Germany 109.2 110.7 154.0 130.6 138.5 25.5 23.2
Spain 51.1 46.4 66.3 66.9 72.6 11.9 12.2
France 55.5 60.9 69.4 76.3 68.9 13.0 11.6
Italy 65.0 59.6 71.4 61.9 60.1 15.2 10.1
USA 17.0 22.0 31.9 42.2 56.3 4.0 9.5
UK 25.1 21.8 30.4 34.7 39.8 5.8 6.7
Denmark 19.7 19.1 18.8 19.6 26.8 4.6 4.5
Netherlands 16.9 17.4 23.0 21.4 22.5 3.9 3.8
Canada 8.6 7.0 10.5 13.0 13.1 2.0 2.2
Australia 5.6 4.8 6.6 5.7 5.4 1.3 0.9
Source: Council for Leather Exports, India
Export-Import Bank of India44
Indian Leather Industry: Perspective and Strategies
Indian saddlery and harness industry is now becoming globally competitive and brand dominated, awash with designs. India has emerged as the second largest exporter of saddlery and harness in the world. The different categories of saddlery and harness exported from India are saddles / bridles, harness and other saddlery items.
Indian saddlery and harness products are gaining an ever-increasing recognition in the highly
competitive global saddlery and harness leather arena. The Council for Leather Exports estimates that the production capacity of the saddlery and harness industry in India was 12.50 million pieces per annum in 2013-14. Technology, work
TABLE 19: INDIA’s KEy EXPORT MARKET OF sADDLERy AND hARNEss
countryvalue in us$ mn share (%)
2009-10 2010-11 2011-12 2012-13 2013-14 2009-10 2013-14
World 83.39 87.92 107.54 110.41 145.54 100.0 100.0
Germany 18.0 18.5 22.2 22.3 30.3 21.6 20.8
USA 10.1 11.4 13.8 16.6 26.4 12.1 18.1
UK 9.3 8.6 11.2 13.4 16.4 11.2 11.3
France 7.6 6.3 6.2 8.9 13.2 9.1 9.1
Australia 5.4 5.9 9.1 7.7 10.5 6.4 7.2
The Netherlands 5.4 5.7 6.5 7.0 9.9 6.5 6.8
Italy 3.6 3.7 4.0 2.9 4.4 4.3 3.0
Canada 2.3 2.6 3.0 3.6 3.4 2.8 2.3
Spain 1.9 2.4 2.3 2.5 2.8 2.3 1.9
Denmark 2.5 3.0 3.1 3.1 2.7 3.0 1.9
Source: Council for Leather Exports, India
87.9
107.5 110.4
145.5
162.7
2.2 2.2 2.2
2.5 2.5
2.0
2.1
2.2
2.3
2.4
2.5
2.6
0.0
20.0
40.0
60.0
80.0
100 .0
120 .0
140 .0
160 .0
180 .0
2010-11 2011-12 2012-13 2013-14 2014-15
Share of Saddlery & Harness in TotalLeather Exports of India
Export Performance of Saddlery & Harness (US$ Mn)
Source: DGCIS
EXhIBIT 16: EXPORT PERFORMANcE OF sADDLERy & hARNEss (us$ Mn)
Share of Saddlery and Harness inTotal Leather Exports of India
Export-Import Bank of India 45
Indian Leather Industry: Perspective and Strategies
craftsmanship, product quality are the hallmarks of the Indian saddlery and harness industry.
During 2014-15, India’s export of saddlery and harness touched US$ 162.7 million, accounting for a share of 2.5% in India’s total export from the leather sector (Exhibit 16). The major markets of Indian saddlery and harness exports in 2013-14 were Germany with a share of 20.8%, USA (18.1%), UK (11.3%), France (9.1%), Australia (7.2%), and the Netherlands (6.8%) (Table 19).10
GOvERNMENT POLIcIEs
To support the leather sector, the Government of India has taken several initiatives. Some of the major ones are as follows:
l Leather sector is one of the “Focus Sectors” under the Foreign Trade Policy of theGovernment of India.
l Entire leather sector is de-licensed, facilitating expansion on modern lines with state-of-the-art machinery and equipments;
l 100% Foreign Direct Investment permitted through automatic route.
l A 5% concessional import duty on import of specified machinery for use in leather andfootwear industry has been allowed;
l Duty free import of raw hides and skins, wet blue chrome tanned leather, crust leather and finishedleatherofallkindsincludingsplitsandsides thereof is allowed;
l Duty free importofspecifiedcriticalinputsformanufacturers of leather garments and other leather products including footwear under the Duty Free Import Scheme is allowed;
l Basic customs duty exempted on machinery orequipmentforEffluentTreatmentPlantsinleather industry;
l Gradual lowering of import tariff (current peak custom duty is 10%); and
l Simplified import/exportprocedures includingquick customs clearance
Under the ‘Make in India’ programme, the Government of India has created separate cell(s) to guide and facilitate investors and individual firmsontheirFDIandJVproposals.Further,theGovernment of India has designated the Council for Leather Exports (CLE) to identify potential and prospective non-resident investors including well known foreign companies who could be invited by the Government to invest in the leather and leather products manufacturing in India.
Keeping in view the historical performance, strength of the sector and support from the government, the Indian leather industry is poised to grow manifolds.
In the Union Budget 2015-16, the Hon’ble Union Minister of Finance announced the Excise duty reduction for footwear in order to boost manufacturing in the leather footwear segment. This includes:
10http://www.leatherindia.org/products/saddlery-14.asp
Export-Import Bank of India46
Indian Leather Industry: Perspective and Strategies
l Reduction in excise duty from 12% to 6% on leather footwear with upper made of leather of heading HS codes 4107 or 4112 to 4114 of retail sale price of more than Rs 1000/- per pair.
l For the purpose of the above exemption, leather footwear means footwear, classifiedunder the Tariff Heading 6403 or 6405, having uppers of leather, where leather refers to goods of heading 4107 or 4112 to 4114.
l Footwear, including leather footwear, of retail price up to Rs. 500 per pair and those with retail price exceeding Rs. 500 per pair but not
exceeding Rs. 1000 per pair continue to attract nil and 6% excise duty, respectively.
l The abatement for footwear as a percentage of retail sale price is being reduced from 35% to 25% for all footwear.
In view of the fact that the leather sector holds immense potential for growth, both on the export front as well as domestic retail market front, and also has enormous scope generating more employment opportunities for the weaker sections of the society, the Government of India has identified the leather sector as oneof the focussectors for the Make in India programme.
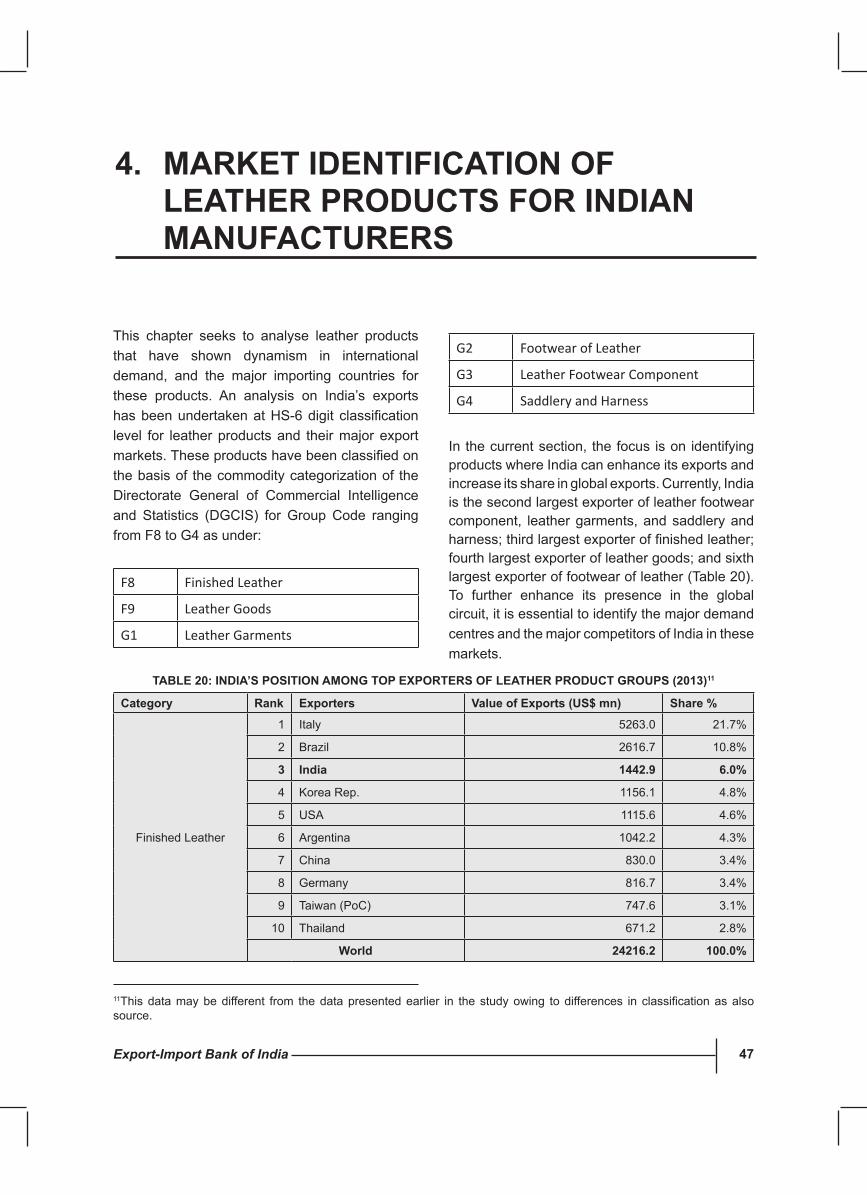
Export-Import Bank of India 47
Indian Leather Industry: Perspective and Strategies
This chapter seeks to analyse leather products that have shown dynamism in international demand, and the major importing countries for these products. An analysis on India’s exports hasbeenundertakenatHS-6digit classificationlevel for leather products and their major export markets.Theseproductshavebeenclassifiedonthe basis of the commodity categorization of the Directorate General of Commercial Intelligence and Statistics (DGCIS) for Group Code ranging from F8 to G4 as under:
F8 Finished Leather
F9 Leather Goods
G1 Leather Garments
4. MARKET IDENTIFIcATION OF LEAThER PRODucTs FOR INDIAN MANuFAcTuRERs
G2 Footwear of Leather
G3 Leather Footwear Component
G4 Saddlery and Harness
In the current section, the focus is on identifying products where India can enhance its exports and increase its share in global exports. Currently, India is the second largest exporter of leather footwear component, leather garments, and saddlery and harness;thirdlargestexporteroffinishedleather;fourth largest exporter of leather goods; and sixth largest exporter of footwear of leather (Table 20). To further enhance its presence in the global circuit, it is essential to identify the major demand centres and the major competitors of India in these markets.
category Rank Exporters value of Exports (us$ mn) share %
Finished Leather
1 Italy 5263.0 21.7%
2 Brazil 2616.7 10.8%
3 India 1442.9 6.0%
4 Korea Rep. 1156.1 4.8%
5 USA 1115.6 4.6%
6 Argentina 1042.2 4.3%
7 China 830.0 3.4%
8 Germany 816.7 3.4%
9 Taiwan(PoC) 747.6 3.1%
10 Thailand 671.2 2.8%
World 24216.2 100.0%
TABLE 20: INDIA’s POsITION AMONG TOP EXPORTERs OF LEAThER PRODucT GROuPs (2013)11
11Thisdatamaybedifferent from thedatapresentedearlier in thestudyowing todifferences in classificationasalsosource.
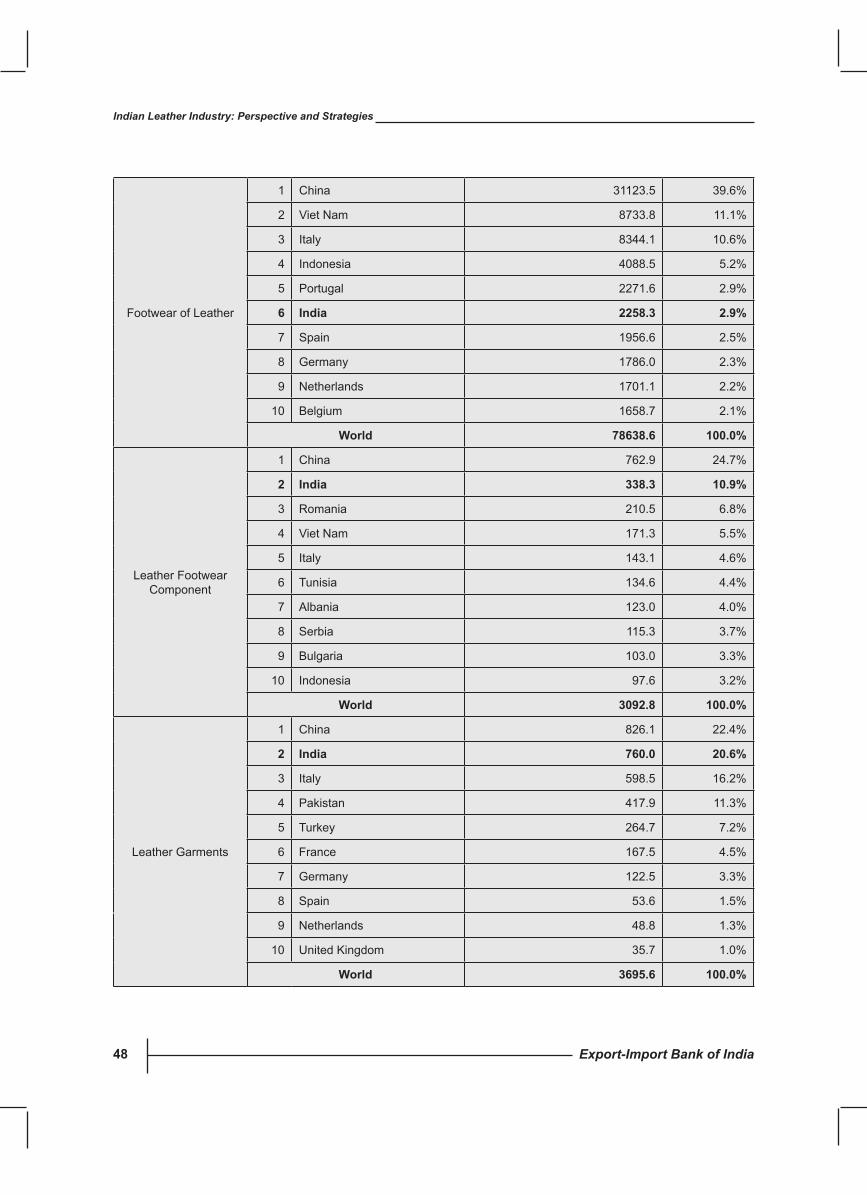
Export-Import Bank of India48
Indian Leather Industry: Perspective and Strategies
Footwear of Leather
1 China 31123.5 39.6%
2 Viet Nam 8733.8 11.1%
3 Italy 8344.1 10.6%
4 Indonesia 4088.5 5.2%
5 Portugal 2271.6 2.9%
6 India 2258.3 2.9%
7 Spain 1956.6 2.5%
8 Germany 1786.0 2.3%
9 Netherlands 1701.1 2.2%
10 Belgium 1658.7 2.1%
World 78638.6 100.0%
Leather Footwear Component
1 China 762.9 24.7%
2 India 338.3 10.9%
3 Romania 210.5 6.8%
4 Viet Nam 171.3 5.5%
5 Italy 143.1 4.6%
6 Tunisia 134.6 4.4%
7 Albania 123.0 4.0%
8 Serbia 115.3 3.7%
9 Bulgaria 103.0 3.3%
10 Indonesia 97.6 3.2%
World 3092.8 100.0%
Leather Garments
1 China 826.1 22.4%
2 India 760.0 20.6%
3 Italy 598.5 16.2%
4 Pakistan 417.9 11.3%
5 Turkey 264.7 7.2%
6 France 167.5 4.5%
7 Germany 122.5 3.3%
8 Spain 53.6 1.5%
9 Netherlands 48.8 1.3%
10 United Kingdom 35.7 1.0%
World 3695.6 100.0%
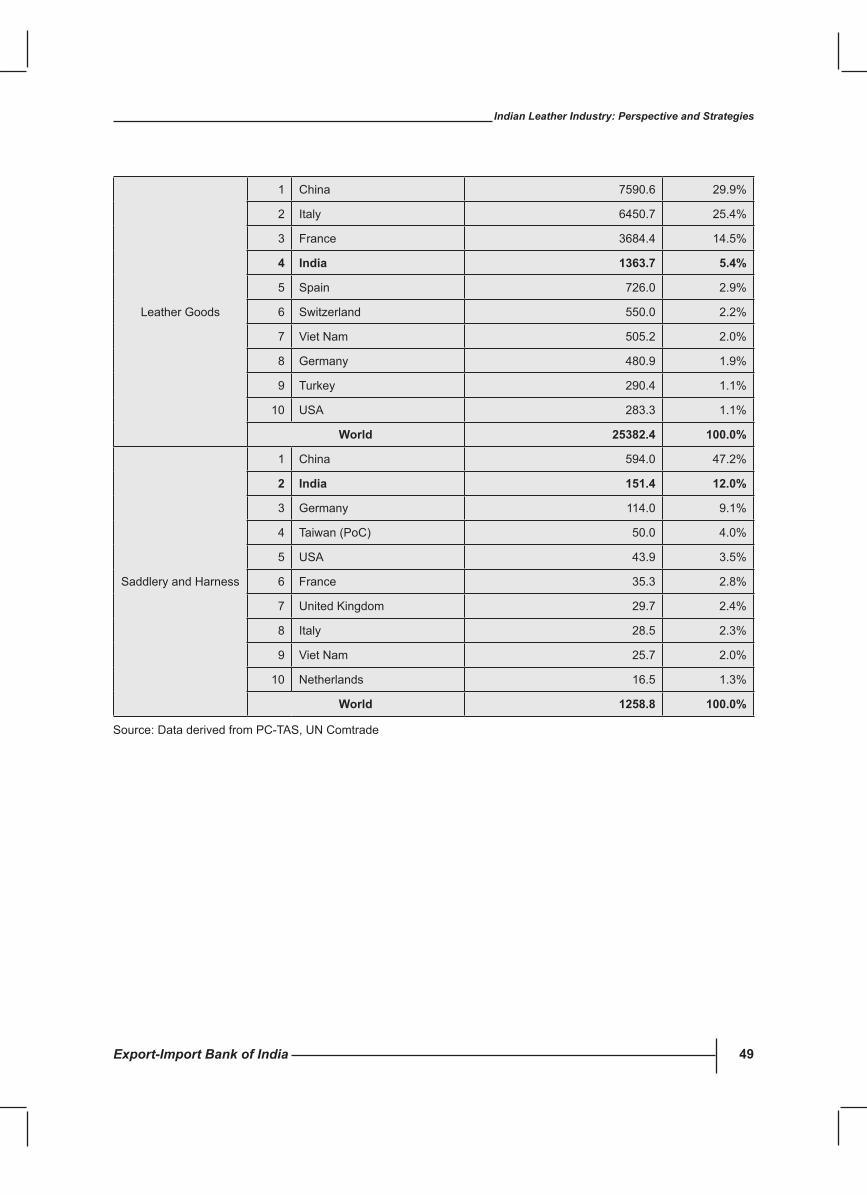
Export-Import Bank of India 49
Indian Leather Industry: Perspective and Strategies
Leather Goods
1 China 7590.6 29.9%
2 Italy 6450.7 25.4%
3 France 3684.4 14.5%
4 India 1363.7 5.4%
5 Spain 726.0 2.9%
6 Switzerland 550.0 2.2%
7 Viet Nam 505.2 2.0%
8 Germany 480.9 1.9%
9 Turkey 290.4 1.1%
10 USA 283.3 1.1%
World 25382.4 100.0%
Saddlery and Harness
1 China 594.0 47.2%
2 India 151.4 12.0%
3 Germany 114.0 9.1%
4 Taiwan(PoC) 50.0 4.0%
5 USA 43.9 3.5%
6 France 35.3 2.8%
7 United Kingdom 29.7 2.4%
8 Italy 28.5 2.3%
9 Viet Nam 25.7 2.0%
10 Netherlands 16.5 1.3%
World 1258.8 100.0%
Source:DataderivedfromPC-TAS,UNComtrade
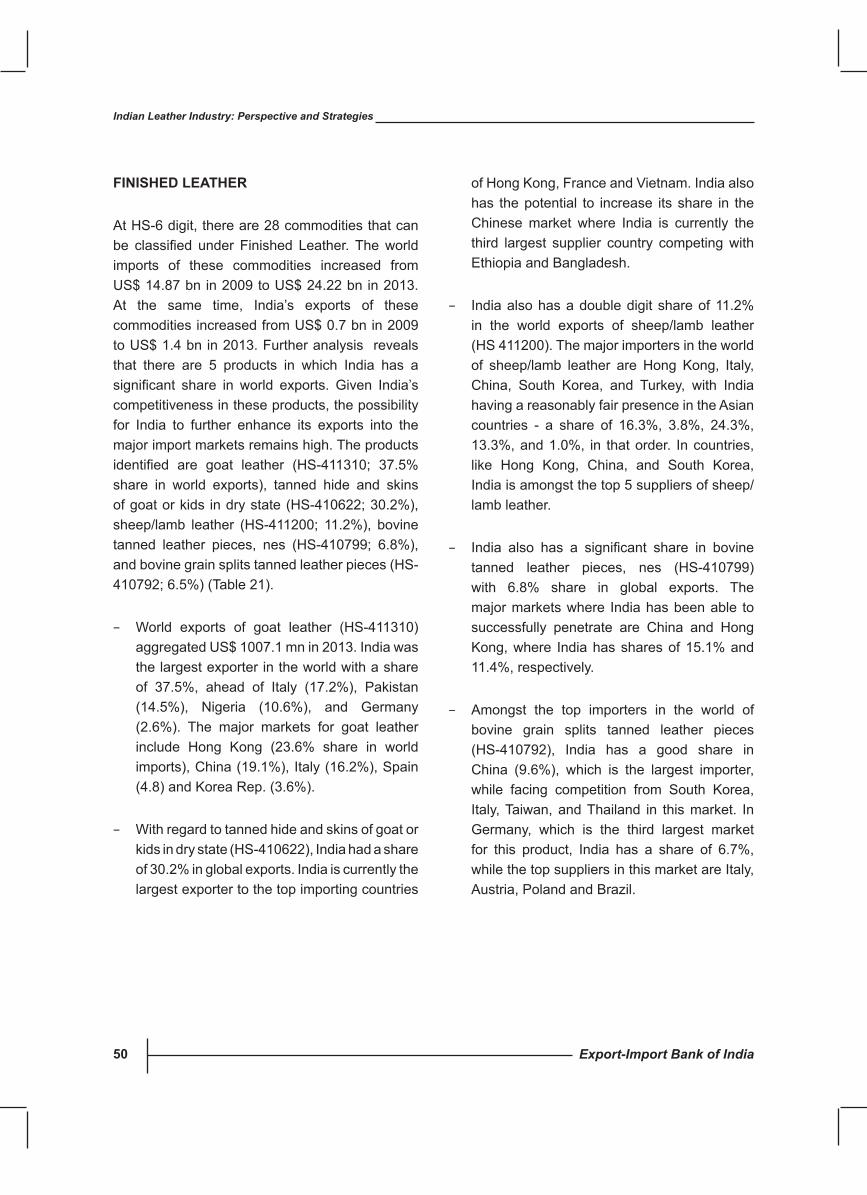
Export-Import Bank of India50
Indian Leather Industry: Perspective and Strategies
FINIshED LEAThER
At HS-6 digit, there are 28 commodities that can be classified under Finished Leather.Theworldimports of these commodities increased from US$ 14.87 bn in 2009 to US$ 24.22 bn in 2013. At the same time, India’s exports of these commodities increased from US$ 0.7 bn in 2009 to US$ 1.4 bn in 2013. Further analysis reveals that there are 5 products in which India has a significant share in world exports. Given India’scompetitiveness in these products, the possibility for India to further enhance its exports into the major import markets remains high. The products identified are goat leather (HS-411310; 37.5%share in world exports), tanned hide and skins of goat or kids in dry state (HS-410622; 30.2%), sheep/lamb leather (HS-411200; 11.2%), bovine tanned leather pieces, nes (HS-410799; 6.8%), and bovine grain splits tanned leather pieces (HS-410792; 6.5%) (Table 21).
World exports of goat leather (HS-411310) −aggregated US$ 1007.1 mn in 2013. India was the largest exporter in the world with a share of 37.5%, ahead of Italy (17.2%), Pakistan(14.5%), Nigeria (10.6%), and Germany (2.6%). The major markets for goat leather include Hong Kong (23.6% share in world imports), China (19.1%), Italy (16.2%), Spain (4.8) and Korea Rep. (3.6%).
With regard to tanned hide and skins of goat or −kids in dry state (HS-410622), India had a share of 30.2% in global exports. India is currently the largest exporter to the top importing countries
of Hong Kong, France and Vietnam. India also has the potential to increase its share in the Chinese market where India is currently the third largest supplier country competing with Ethiopia and Bangladesh.
India also has a double digit share of 11.2% −in the world exports of sheep/lamb leather (HS 411200). The major importers in the world of sheep/lamb leather are Hong Kong, Italy, China, South Korea, and Turkey, with India having a reasonably fair presence in the Asian countries - a share of 16.3%, 3.8%, 24.3%, 13.3%, and 1.0%, in that order. In countries, like Hong Kong, China, and South Korea, India is amongst the top 5 suppliers of sheep/lamb leather.
India also has a significant share in bovine−tanned leather pieces, nes (HS-410799) with 6.8% share in global exports. The major markets where India has been able to successfully penetrate are China and Hong Kong, where India has shares of 15.1% and 11.4%, respectively.
Amongst the top importers in the world of −bovine grain splits tanned leather pieces (HS-410792), India has a good share in China (9.6%), which is the largest importer, while facing competition from South Korea, Italy, Taiwan, and Thailand in this market. In Germany, which is the third largest market for this product, India has a share of 6.7%, while the top suppliers in this market are Italy, Austria,PolandandBrazil.
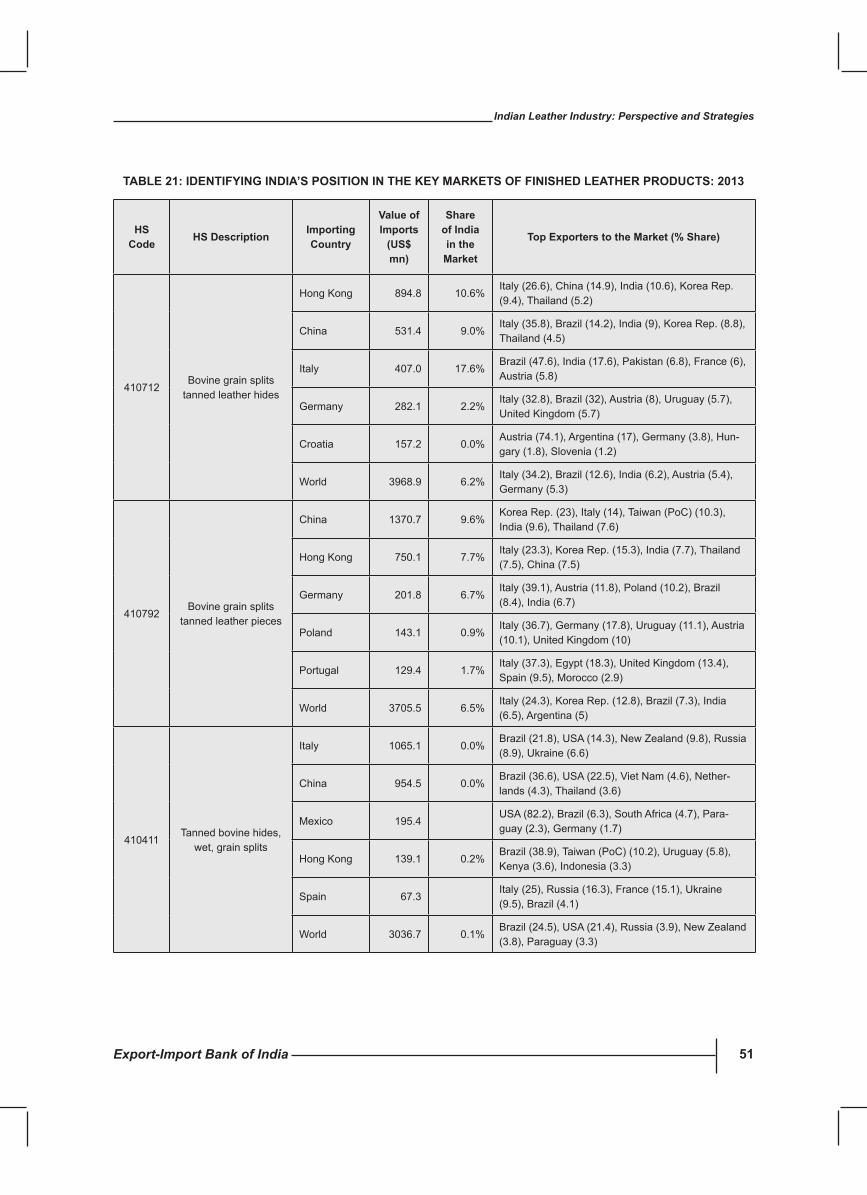
Export-Import Bank of India 51
Indian Leather Industry: Perspective and Strategies
TABLE 21: IDENTIFyING INDIA’s POsITION IN ThE KEy MARKETs OF FINIshED LEAThER PRODucTs: 2013
hs code hs Description Importing
country
value of Imports
(us$ mn)
share of India in the
Market
Top Exporters to the Market (% share)
410712Bovine grain splits
tanned leather hides
Hong Kong 894.8 10.6%Italy (26.6), China (14.9), India (10.6), Korea Rep. (9.4), Thailand (5.2)
China 531.4 9.0%Italy (35.8), Brazil (14.2), India (9), Korea Rep. (8.8), Thailand (4.5)
Italy 407.0 17.6%Brazil(47.6),India(17.6),Pakistan(6.8),France(6),Austria (5.8)
Germany 282.1 2.2%Italy (32.8), Brazil (32), Austria (8), Uruguay (5.7), United Kingdom (5.7)
Croatia 157.2 0.0%Austria (74.1), Argentina (17), Germany (3.8), Hun-gary (1.8), Slovenia (1.2)
World 3968.9 6.2%Italy (34.2), Brazil (12.6), India (6.2), Austria (5.4), Germany (5.3)
410792Bovine grain splits
tanned leather pieces
China 1370.7 9.6%KoreaRep.(23),Italy(14),Taiwan(PoC)(10.3),India (9.6), Thailand (7.6)
Hong Kong 750.1 7.7%Italy (23.3), Korea Rep. (15.3), India (7.7), Thailand (7.5), China (7.5)
Germany 201.8 6.7%Italy(39.1),Austria(11.8),Poland(10.2),Brazil(8.4), India (6.7)
Poland 143.1 0.9%Italy (36.7), Germany (17.8), Uruguay (11.1), Austria (10.1), United Kingdom (10)
Portugal 129.4 1.7%Italy (37.3), Egypt (18.3), United Kingdom (13.4), Spain (9.5), Morocco (2.9)
World 3705.5 6.5%Italy (24.3), Korea Rep. (12.8), Brazil (7.3), India (6.5), Argentina (5)
410411Tanned bovine hides,
wet, grain splits
Italy 1065.1 0.0%Brazil (21.8), USA (14.3), New Zealand (9.8), Russia (8.9), Ukraine (6.6)
China 954.5 0.0%Brazil (36.6), USA (22.5), Viet Nam (4.6), Nether-lands (4.3), Thailand (3.6)
Mexico 195.4USA(82.2),Brazil(6.3),SouthAfrica(4.7),Para-guay (2.3), Germany (1.7)
Hong Kong 139.1 0.2%Brazil(38.9),Taiwan(PoC)(10.2),Uruguay(5.8),Kenya (3.6), Indonesia (3.3)
Spain 67.3Italy (25), Russia (16.3), France (15.1), Ukraine (9.5), Brazil (4.1)
World 3036.7 0.1%Brazil (24.5), USA (21.4), Russia (3.9), New Zealand (3.8),Paraguay(3.3)
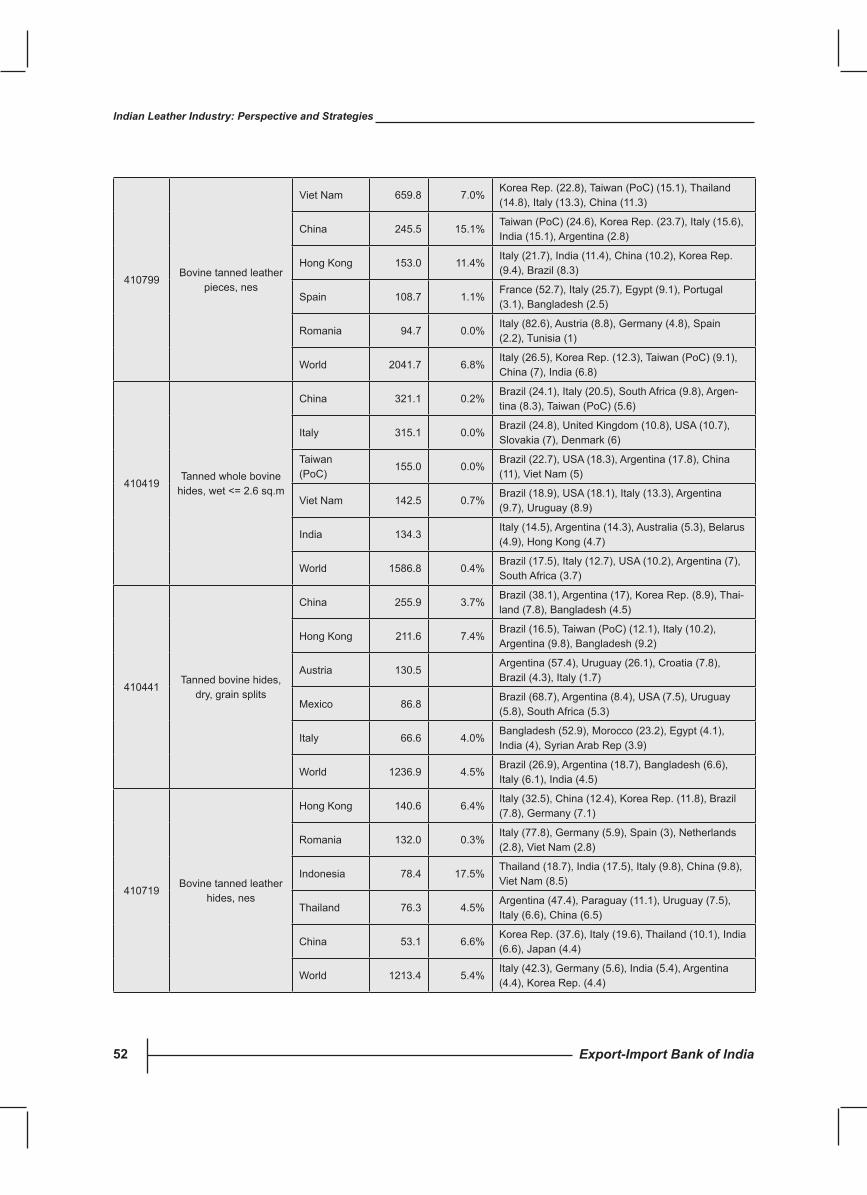
Export-Import Bank of India52
Indian Leather Industry: Perspective and Strategies
410799Bovine tanned leather
pieces, nes
Viet Nam 659.8 7.0%KoreaRep.(22.8),Taiwan(PoC)(15.1),Thailand(14.8), Italy (13.3), China (11.3)
China 245.5 15.1%Taiwan(PoC)(24.6),KoreaRep.(23.7),Italy(15.6),India (15.1), Argentina (2.8)
Hong Kong 153.0 11.4%Italy (21.7), India (11.4), China (10.2), Korea Rep. (9.4), Brazil (8.3)
Spain 108.7 1.1%France(52.7),Italy(25.7),Egypt(9.1),Portugal(3.1), Bangladesh (2.5)
Romania 94.7 0.0%Italy (82.6), Austria (8.8), Germany (4.8), Spain (2.2), Tunisia (1)
World 2041.7 6.8%Italy(26.5),KoreaRep.(12.3),Taiwan(PoC)(9.1),China (7), India (6.8)
410419Tanned whole bovine
hides, wet <= 2.6 sq.m
China 321.1 0.2%Brazil (24.1), Italy (20.5), South Africa (9.8), Argen-tina(8.3),Taiwan(PoC)(5.6)
Italy 315.1 0.0%Brazil (24.8), United Kingdom (10.8), USA (10.7), Slovakia (7), Denmark (6)
Taiwan (PoC)
155.0 0.0%Brazil (22.7), USA (18.3), Argentina (17.8), China (11), Viet Nam (5)
Viet Nam 142.5 0.7%Brazil (18.9), USA (18.1), Italy (13.3), Argentina (9.7), Uruguay (8.9)
India 134.3Italy (14.5), Argentina (14.3), Australia (5.3), Belarus (4.9), Hong Kong (4.7)
World 1586.8 0.4%Brazil (17.5), Italy (12.7), USA (10.2), Argentina (7), South Africa (3.7)
410441Tanned bovine hides,
dry, grain splits
China 255.9 3.7%Brazil (38.1), Argentina (17), Korea Rep. (8.9), Thai-land (7.8), Bangladesh (4.5)
Hong Kong 211.6 7.4%Brazil(16.5),Taiwan(PoC)(12.1),Italy(10.2),Argentina (9.8), Bangladesh (9.2)
Austria 130.5Argentina (57.4), Uruguay (26.1), Croatia (7.8), Brazil (4.3), Italy (1.7)
Mexico 86.8Brazil (68.7), Argentina (8.4), USA (7.5), Uruguay (5.8), South Africa (5.3)
Italy 66.6 4.0%Bangladesh (52.9), Morocco (23.2), Egypt (4.1), India (4), Syrian Arab Rep (3.9)
World 1236.9 4.5%Brazil (26.9), Argentina (18.7), Bangladesh (6.6), Italy (6.1), India (4.5)
410719Bovine tanned leather
hides, nes
Hong Kong 140.6 6.4%Italy (32.5), China (12.4), Korea Rep. (11.8), Brazil (7.8), Germany (7.1)
Romania 132.0 0.3%Italy (77.8), Germany (5.9), Spain (3), Netherlands (2.8), Viet Nam (2.8)
Indonesia 78.4 17.5%Thailand (18.7), India (17.5), Italy (9.8), China (9.8), Viet Nam (8.5)
Thailand 76.3 4.5%Argentina(47.4),Paraguay(11.1),Uruguay(7.5),Italy (6.6), China (6.5)
China 53.1 6.6%Korea Rep. (37.6), Italy (19.6), Thailand (10.1), India (6.6), Japan (4.4)
World 1213.4 5.4%Italy (42.3), Germany (5.6), India (5.4), Argentina (4.4), Korea Rep. (4.4)
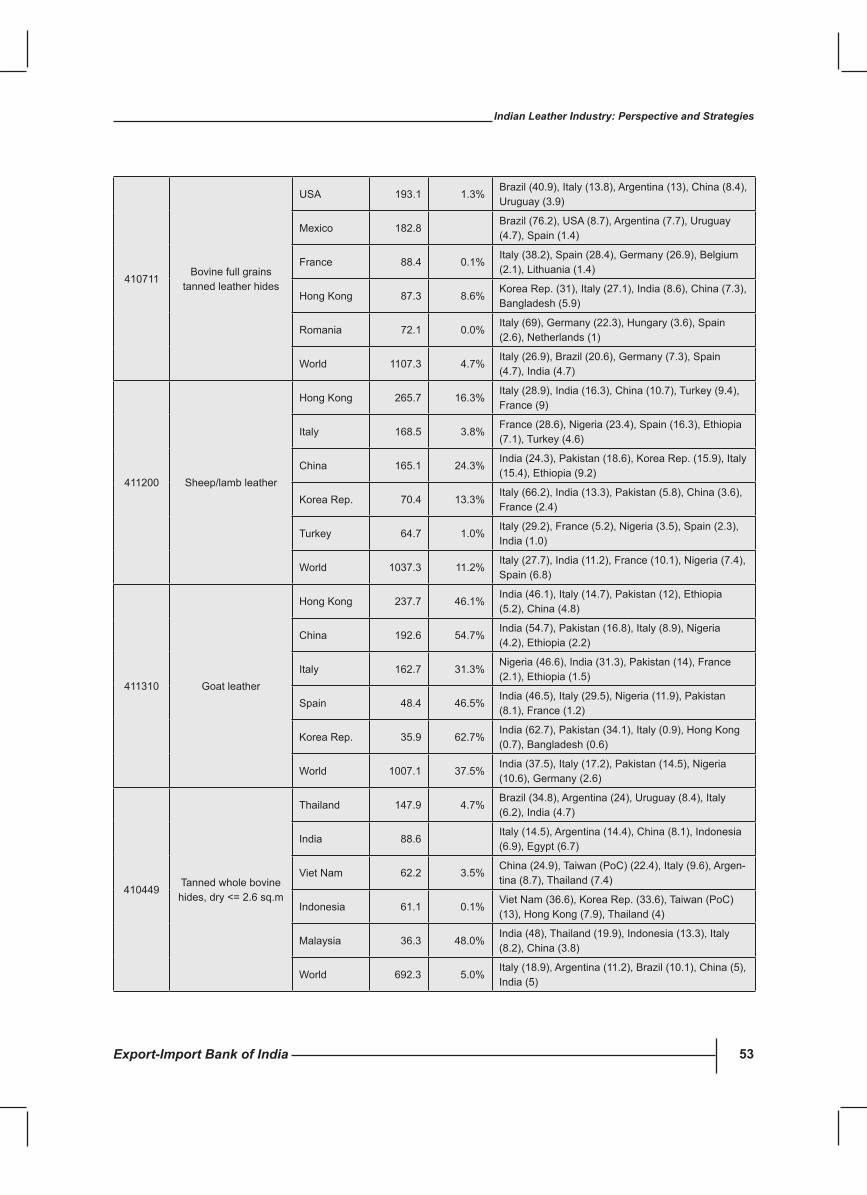
Export-Import Bank of India 53
Indian Leather Industry: Perspective and Strategies
410711Bovine full grains
tanned leather hides
USA 193.1 1.3%Brazil (40.9), Italy (13.8), Argentina (13), China (8.4), Uruguay (3.9)
Mexico 182.8Brazil (76.2), USA (8.7), Argentina (7.7), Uruguay (4.7), Spain (1.4)
France 88.4 0.1%Italy (38.2), Spain (28.4), Germany (26.9), Belgium (2.1), Lithuania (1.4)
Hong Kong 87.3 8.6%Korea Rep. (31), Italy (27.1), India (8.6), China (7.3), Bangladesh (5.9)
Romania 72.1 0.0%Italy (69), Germany (22.3), Hungary (3.6), Spain (2.6), Netherlands (1)
World 1107.3 4.7%Italy (26.9), Brazil (20.6), Germany (7.3), Spain (4.7), India (4.7)
411200 Sheep/lamb leather
Hong Kong 265.7 16.3%Italy (28.9), India (16.3), China (10.7), Turkey (9.4), France (9)
Italy 168.5 3.8%France (28.6), Nigeria (23.4), Spain (16.3), Ethiopia (7.1), Turkey (4.6)
China 165.1 24.3%India(24.3),Pakistan(18.6),KoreaRep.(15.9),Italy(15.4), Ethiopia (9.2)
Korea Rep. 70.4 13.3%Italy(66.2),India(13.3),Pakistan(5.8),China(3.6),France (2.4)
Turkey 64.7 1.0%Italy (29.2), France (5.2), Nigeria (3.5), Spain (2.3), India (1.0)
World 1037.3 11.2%Italy (27.7), India (11.2), France (10.1), Nigeria (7.4), Spain (6.8)
411310 Goat leather
Hong Kong 237.7 46.1%India(46.1),Italy(14.7),Pakistan(12),Ethiopia(5.2), China (4.8)
China 192.6 54.7%India(54.7),Pakistan(16.8),Italy(8.9),Nigeria(4.2), Ethiopia (2.2)
Italy 162.7 31.3%Nigeria(46.6),India(31.3),Pakistan(14),France(2.1), Ethiopia (1.5)
Spain 48.4 46.5%India(46.5),Italy(29.5),Nigeria(11.9),Pakistan(8.1), France (1.2)
Korea Rep. 35.9 62.7%India(62.7),Pakistan(34.1),Italy(0.9),HongKong(0.7), Bangladesh (0.6)
World 1007.1 37.5%India(37.5),Italy(17.2),Pakistan(14.5),Nigeria(10.6), Germany (2.6)
410449Tanned whole bovine hides, dry <= 2.6 sq.m
Thailand 147.9 4.7%Brazil (34.8), Argentina (24), Uruguay (8.4), Italy (6.2), India (4.7)
India 88.6Italy (14.5), Argentina (14.4), China (8.1), Indonesia (6.9), Egypt (6.7)
Viet Nam 62.2 3.5%China(24.9),Taiwan(PoC)(22.4),Italy(9.6),Argen-tina (8.7), Thailand (7.4)
Indonesia 61.1 0.1%VietNam(36.6),KoreaRep.(33.6),Taiwan(PoC)(13), Hong Kong (7.9), Thailand (4)
Malaysia 36.3 48.0%India (48), Thailand (19.9), Indonesia (13.3), Italy (8.2), China (3.8)
World 692.3 5.0%Italy (18.9), Argentina (11.2), Brazil (10.1), China (5), India (5)
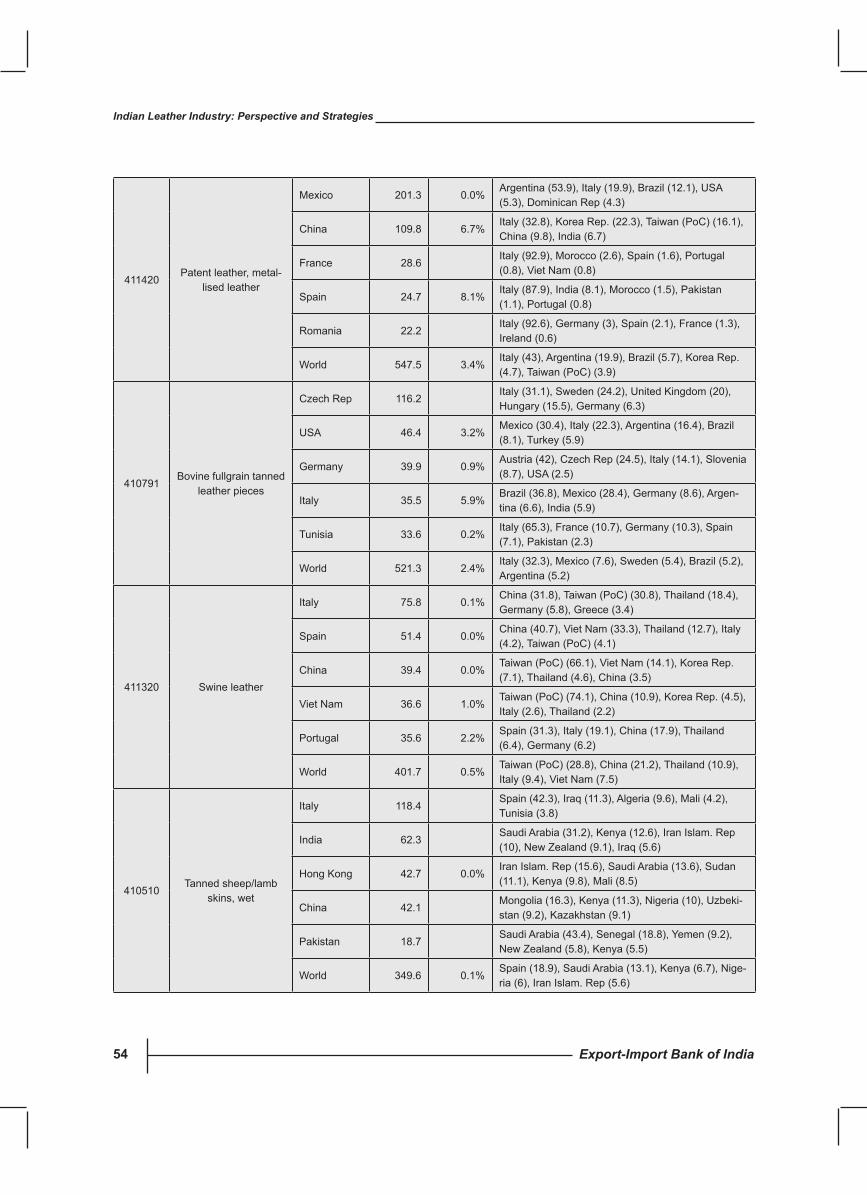
Export-Import Bank of India54
Indian Leather Industry: Perspective and Strategies
411420Patentleather,metal-
lised leather
Mexico 201.3 0.0%Argentina (53.9), Italy (19.9), Brazil (12.1), USA (5.3), Dominican Rep (4.3)
China 109.8 6.7%Italy(32.8),KoreaRep.(22.3),Taiwan(PoC)(16.1),China (9.8), India (6.7)
France 28.6Italy(92.9),Morocco(2.6),Spain(1.6),Portugal(0.8), Viet Nam (0.8)
Spain 24.7 8.1%Italy(87.9),India(8.1),Morocco(1.5),Pakistan(1.1),Portugal(0.8)
Romania 22.2Italy (92.6), Germany (3), Spain (2.1), France (1.3), Ireland (0.6)
World 547.5 3.4%Italy (43), Argentina (19.9), Brazil (5.7), Korea Rep. (4.7),Taiwan(PoC)(3.9)
410791Bovine fullgrain tanned
leather pieces
Czech Rep 116.2Italy (31.1), Sweden (24.2), United Kingdom (20), Hungary (15.5), Germany (6.3)
USA 46.4 3.2%Mexico (30.4), Italy (22.3), Argentina (16.4), Brazil (8.1), Turkey (5.9)
Germany 39.9 0.9%Austria (42), Czech Rep (24.5), Italy (14.1), Slovenia (8.7), USA (2.5)
Italy 35.5 5.9%Brazil (36.8), Mexico (28.4), Germany (8.6), Argen-tina (6.6), India (5.9)
Tunisia 33.6 0.2%Italy (65.3), France (10.7), Germany (10.3), Spain (7.1),Pakistan(2.3)
World 521.3 2.4%Italy (32.3), Mexico (7.6), Sweden (5.4), Brazil (5.2), Argentina (5.2)
411320 Swine leather
Italy 75.8 0.1%China(31.8),Taiwan(PoC)(30.8),Thailand(18.4),Germany (5.8), Greece (3.4)
Spain 51.4 0.0%China (40.7), Viet Nam (33.3), Thailand (12.7), Italy (4.2),Taiwan(PoC)(4.1)
China 39.4 0.0%Taiwan(PoC)(66.1),VietNam(14.1),KoreaRep.(7.1), Thailand (4.6), China (3.5)
Viet Nam 36.6 1.0%Taiwan(PoC)(74.1),China(10.9),KoreaRep.(4.5),Italy (2.6), Thailand (2.2)
Portugal 35.6 2.2%Spain (31.3), Italy (19.1), China (17.9), Thailand (6.4), Germany (6.2)
World 401.7 0.5%Taiwan(PoC)(28.8),China(21.2),Thailand(10.9),Italy (9.4), Viet Nam (7.5)
410510Tanned sheep/lamb
skins, wet
Italy 118.4Spain (42.3), Iraq (11.3), Algeria (9.6), Mali (4.2), Tunisia (3.8)
India 62.3Saudi Arabia (31.2), Kenya (12.6), Iran Islam. Rep (10), New Zealand (9.1), Iraq (5.6)
Hong Kong 42.7 0.0%Iran Islam. Rep (15.6), Saudi Arabia (13.6), Sudan (11.1), Kenya (9.8), Mali (8.5)
China 42.1Mongolia (16.3), Kenya (11.3), Nigeria (10), Uzbeki-stan (9.2), Kazakhstan (9.1)
Pakistan 18.7Saudi Arabia (43.4), Senegal (18.8), Yemen (9.2), New Zealand (5.8), Kenya (5.5)
World 349.6 0.1%Spain (18.9), Saudi Arabia (13.1), Kenya (6.7), Nige-ria (6), Iran Islam. Rep (5.6)
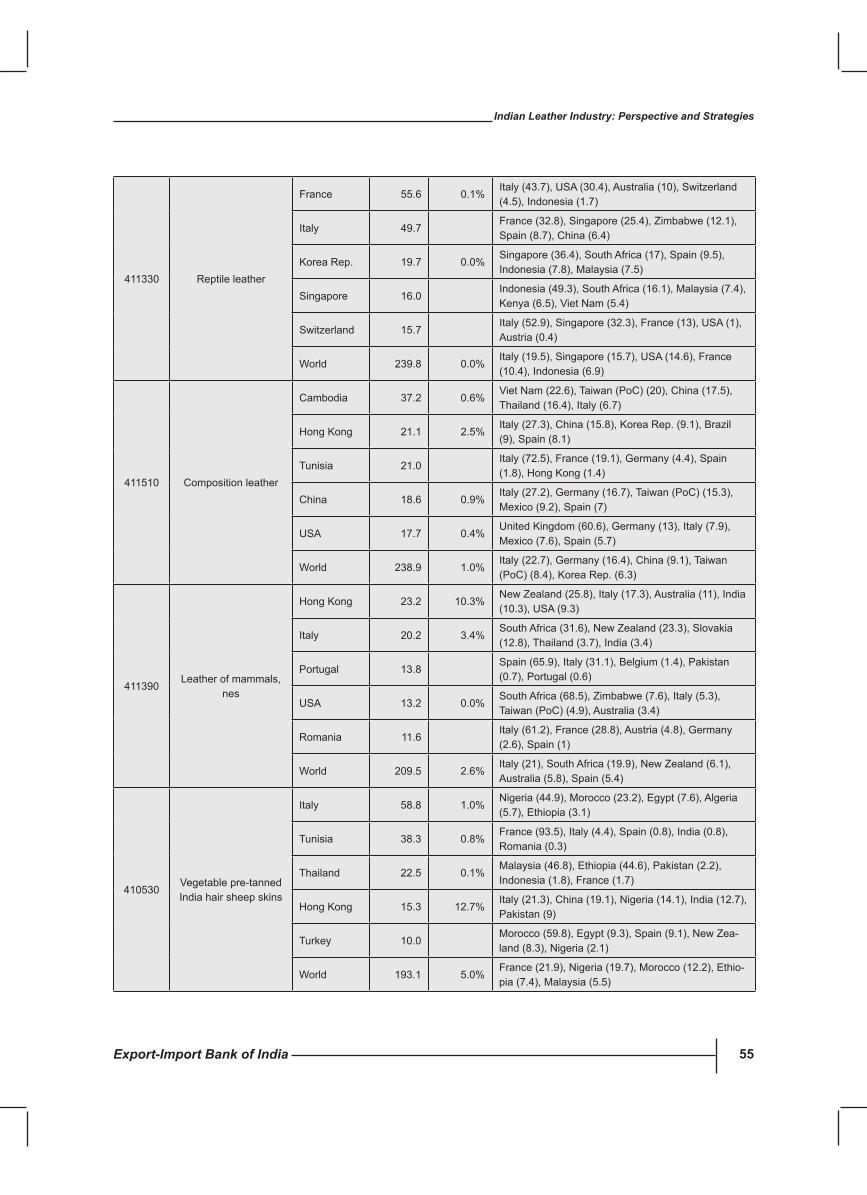
Export-Import Bank of India 55
Indian Leather Industry: Perspective and Strategies
411330 Reptile leather
France 55.6 0.1%Italy (43.7), USA (30.4), Australia (10), Switzerland (4.5), Indonesia (1.7)
Italy 49.7France (32.8), Singapore (25.4), Zimbabwe (12.1), Spain (8.7), China (6.4)
Korea Rep. 19.7 0.0%Singapore (36.4), South Africa (17), Spain (9.5), Indonesia (7.8), Malaysia (7.5)
Singapore 16.0Indonesia (49.3), South Africa (16.1), Malaysia (7.4), Kenya (6.5), Viet Nam (5.4)
Switzerland 15.7Italy (52.9), Singapore (32.3), France (13), USA (1), Austria (0.4)
World 239.8 0.0%Italy (19.5), Singapore (15.7), USA (14.6), France (10.4), Indonesia (6.9)
411510 Composition leather
Cambodia 37.2 0.6%VietNam(22.6),Taiwan(PoC)(20),China(17.5),Thailand (16.4), Italy (6.7)
Hong Kong 21.1 2.5%Italy (27.3), China (15.8), Korea Rep. (9.1), Brazil (9), Spain (8.1)
Tunisia 21.0Italy (72.5), France (19.1), Germany (4.4), Spain (1.8), Hong Kong (1.4)
China 18.6 0.9%Italy(27.2),Germany(16.7),Taiwan(PoC)(15.3),Mexico (9.2), Spain (7)
USA 17.7 0.4%United Kingdom (60.6), Germany (13), Italy (7.9), Mexico (7.6), Spain (5.7)
World 238.9 1.0%Italy (22.7), Germany (16.4), China (9.1), Taiwan (PoC)(8.4),KoreaRep.(6.3)
411390Leather of mammals,
nes
Hong Kong 23.2 10.3%New Zealand (25.8), Italy (17.3), Australia (11), India (10.3), USA (9.3)
Italy 20.2 3.4%South Africa (31.6), New Zealand (23.3), Slovakia (12.8), Thailand (3.7), India (3.4)
Portugal 13.8Spain(65.9),Italy(31.1),Belgium(1.4),Pakistan(0.7),Portugal(0.6)
USA 13.2 0.0%South Africa (68.5), Zimbabwe (7.6), Italy (5.3), Taiwan(PoC)(4.9),Australia(3.4)
Romania 11.6Italy (61.2), France (28.8), Austria (4.8), Germany (2.6), Spain (1)
World 209.5 2.6%Italy (21), South Africa (19.9), New Zealand (6.1), Australia (5.8), Spain (5.4)
410530Vegetable pre-tanned India hair sheep skins
Italy 58.8 1.0%Nigeria (44.9), Morocco (23.2), Egypt (7.6), Algeria (5.7), Ethiopia (3.1)
Tunisia 38.3 0.8%France (93.5), Italy (4.4), Spain (0.8), India (0.8), Romania (0.3)
Thailand 22.5 0.1%Malaysia(46.8),Ethiopia(44.6),Pakistan(2.2),Indonesia (1.8), France (1.7)
Hong Kong 15.3 12.7%Italy (21.3), China (19.1), Nigeria (14.1), India (12.7), Pakistan(9)
Turkey 10.0Morocco (59.8), Egypt (9.3), Spain (9.1), New Zea-land (8.3), Nigeria (2.1)
World 193.1 5.0%France (21.9), Nigeria (19.7), Morocco (12.2), Ethio-pia (7.4), Malaysia (5.5)
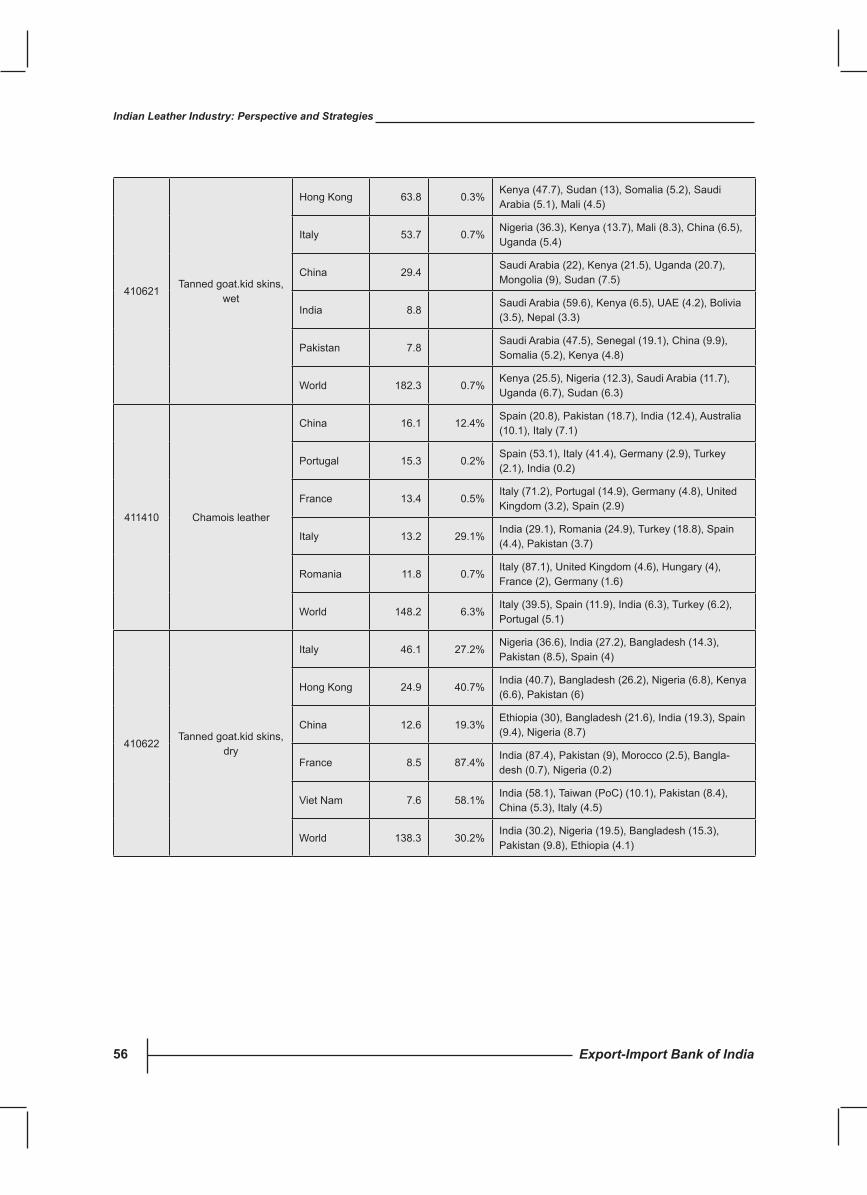
Export-Import Bank of India56
Indian Leather Industry: Perspective and Strategies
410621Tanned goat.kid skins,
wet
Hong Kong 63.8 0.3%Kenya (47.7), Sudan (13), Somalia (5.2), Saudi Arabia (5.1), Mali (4.5)
Italy 53.7 0.7%Nigeria (36.3), Kenya (13.7), Mali (8.3), China (6.5), Uganda (5.4)
China 29.4Saudi Arabia (22), Kenya (21.5), Uganda (20.7), Mongolia (9), Sudan (7.5)
India 8.8Saudi Arabia (59.6), Kenya (6.5), UAE (4.2), Bolivia (3.5), Nepal (3.3)
Pakistan 7.8Saudi Arabia (47.5), Senegal (19.1), China (9.9), Somalia (5.2), Kenya (4.8)
World 182.3 0.7%Kenya (25.5), Nigeria (12.3), Saudi Arabia (11.7), Uganda (6.7), Sudan (6.3)
411410 Chamois leather
China 16.1 12.4%Spain(20.8),Pakistan(18.7),India(12.4),Australia(10.1), Italy (7.1)
Portugal 15.3 0.2%Spain (53.1), Italy (41.4), Germany (2.9), Turkey (2.1), India (0.2)
France 13.4 0.5%Italy(71.2),Portugal(14.9),Germany(4.8),UnitedKingdom (3.2), Spain (2.9)
Italy 13.2 29.1%India (29.1), Romania (24.9), Turkey (18.8), Spain (4.4),Pakistan(3.7)
Romania 11.8 0.7%Italy (87.1), United Kingdom (4.6), Hungary (4), France (2), Germany (1.6)
World 148.2 6.3%Italy (39.5), Spain (11.9), India (6.3), Turkey (6.2), Portugal(5.1)
410622Tanned goat.kid skins,
dry
Italy 46.1 27.2%Nigeria (36.6), India (27.2), Bangladesh (14.3), Pakistan(8.5),Spain(4)
Hong Kong 24.9 40.7%India (40.7), Bangladesh (26.2), Nigeria (6.8), Kenya (6.6),Pakistan(6)
China 12.6 19.3%Ethiopia (30), Bangladesh (21.6), India (19.3), Spain (9.4), Nigeria (8.7)
France 8.5 87.4%India(87.4),Pakistan(9),Morocco(2.5),Bangla-desh (0.7), Nigeria (0.2)
Viet Nam 7.6 58.1%India(58.1),Taiwan(PoC)(10.1),Pakistan(8.4),China (5.3), Italy (4.5)
World 138.3 30.2%India (30.2), Nigeria (19.5), Bangladesh (15.3), Pakistan(9.8),Ethiopia(4.1)
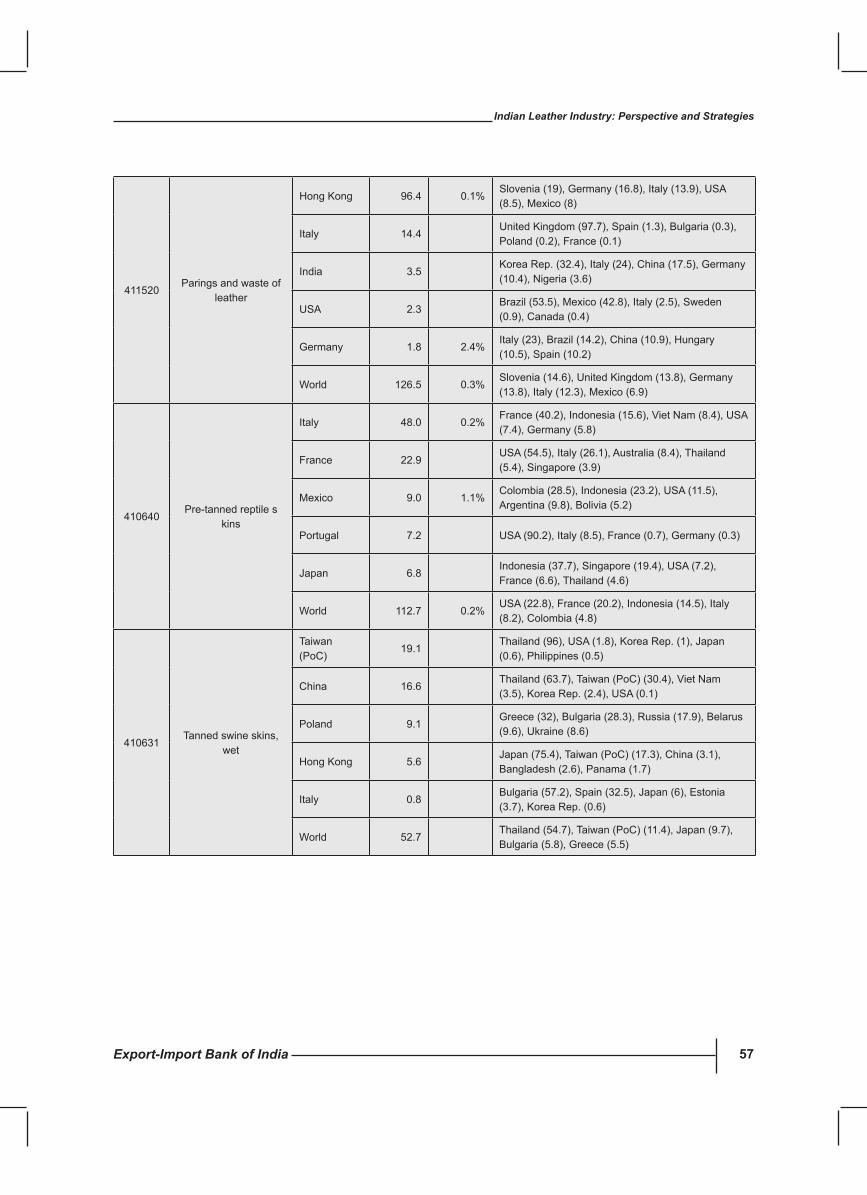
Export-Import Bank of India 57
Indian Leather Industry: Perspective and Strategies
411520Paringsandwasteof
leather
Hong Kong 96.4 0.1%Slovenia (19), Germany (16.8), Italy (13.9), USA (8.5), Mexico (8)
Italy 14.4United Kingdom (97.7), Spain (1.3), Bulgaria (0.3), Poland(0.2),France(0.1)
India 3.5Korea Rep. (32.4), Italy (24), China (17.5), Germany (10.4), Nigeria (3.6)
USA 2.3Brazil (53.5), Mexico (42.8), Italy (2.5), Sweden (0.9), Canada (0.4)
Germany 1.8 2.4%Italy (23), Brazil (14.2), China (10.9), Hungary (10.5), Spain (10.2)
World 126.5 0.3%Slovenia (14.6), United Kingdom (13.8), Germany (13.8), Italy (12.3), Mexico (6.9)
410640Pre-tannedreptiles
kins
Italy 48.0 0.2%France (40.2), Indonesia (15.6), Viet Nam (8.4), USA (7.4), Germany (5.8)
France 22.9USA (54.5), Italy (26.1), Australia (8.4), Thailand (5.4), Singapore (3.9)
Mexico 9.0 1.1%Colombia (28.5), Indonesia (23.2), USA (11.5), Argentina (9.8), Bolivia (5.2)
Portugal 7.2 USA (90.2), Italy (8.5), France (0.7), Germany (0.3)
Japan 6.8Indonesia (37.7), Singapore (19.4), USA (7.2), France (6.6), Thailand (4.6)
World 112.7 0.2%USA (22.8), France (20.2), Indonesia (14.5), Italy (8.2), Colombia (4.8)
410631Tanned swine skins,
wet
Taiwan (PoC)
19.1Thailand (96), USA (1.8), Korea Rep. (1), Japan (0.6),Philippines(0.5)
China 16.6Thailand(63.7),Taiwan(PoC)(30.4),VietNam(3.5), Korea Rep. (2.4), USA (0.1)
Poland 9.1Greece (32), Bulgaria (28.3), Russia (17.9), Belarus (9.6), Ukraine (8.6)
Hong Kong 5.6Japan(75.4),Taiwan(PoC)(17.3),China(3.1),Bangladesh(2.6),Panama(1.7)
Italy 0.8Bulgaria (57.2), Spain (32.5), Japan (6), Estonia (3.7), Korea Rep. (0.6)
World 52.7Thailand(54.7),Taiwan(PoC)(11.4),Japan(9.7),Bulgaria (5.8), Greece (5.5)
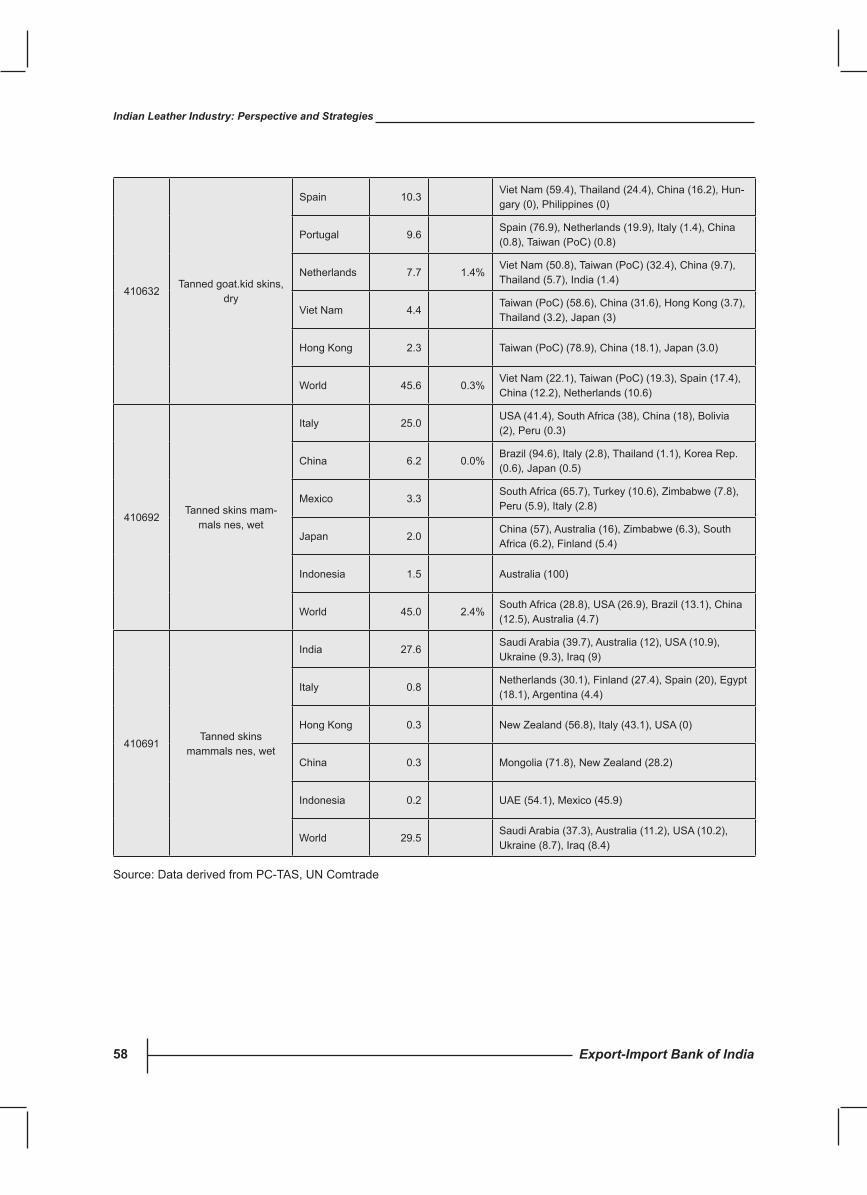
Export-Import Bank of India58
Indian Leather Industry: Perspective and Strategies
410632Tanned goat.kid skins,
dry
Spain 10.3Viet Nam (59.4), Thailand (24.4), China (16.2), Hun-gary(0),Philippines(0)
Portugal 9.6Spain (76.9), Netherlands (19.9), Italy (1.4), China (0.8),Taiwan(PoC)(0.8)
Netherlands 7.7 1.4%VietNam(50.8),Taiwan(PoC)(32.4),China(9.7),Thailand (5.7), India (1.4)
Viet Nam 4.4Taiwan(PoC)(58.6),China(31.6),HongKong(3.7),Thailand (3.2), Japan (3)
Hong Kong 2.3 Taiwan(PoC)(78.9),China(18.1),Japan(3.0)
World 45.6 0.3%VietNam(22.1),Taiwan(PoC)(19.3),Spain(17.4),China (12.2), Netherlands (10.6)
410692Tanned skins mam-
mals nes, wet
Italy 25.0USA (41.4), South Africa (38), China (18), Bolivia (2),Peru(0.3)
China 6.2 0.0%Brazil (94.6), Italy (2.8), Thailand (1.1), Korea Rep. (0.6), Japan (0.5)
Mexico 3.3South Africa (65.7), Turkey (10.6), Zimbabwe (7.8), Peru(5.9),Italy(2.8)
Japan 2.0China (57), Australia (16), Zimbabwe (6.3), South Africa (6.2), Finland (5.4)
Indonesia 1.5 Australia (100)
World 45.0 2.4%South Africa (28.8), USA (26.9), Brazil (13.1), China (12.5), Australia (4.7)
410691Tanned skins
mammals nes, wet
India 27.6Saudi Arabia (39.7), Australia (12), USA (10.9), Ukraine (9.3), Iraq (9)
Italy 0.8Netherlands (30.1), Finland (27.4), Spain (20), Egypt (18.1), Argentina (4.4)
Hong Kong 0.3 New Zealand (56.8), Italy (43.1), USA (0)
China 0.3 Mongolia (71.8), New Zealand (28.2)
Indonesia 0.2 UAE (54.1), Mexico (45.9)
World 29.5Saudi Arabia (37.3), Australia (11.2), USA (10.2), Ukraine (8.7), Iraq (8.4)
Source:DataderivedfromPC-TAS,UNComtrade
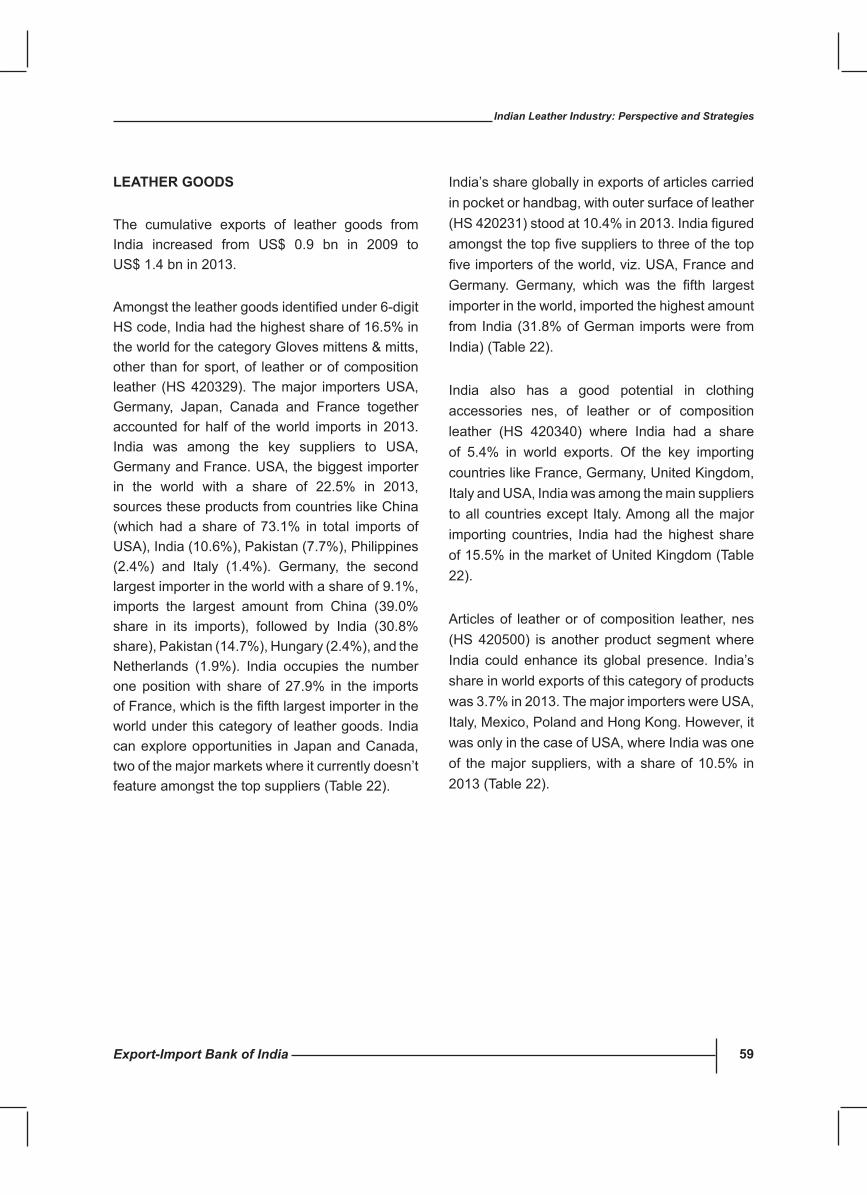
Export-Import Bank of India 59
Indian Leather Industry: Perspective and Strategies
LEAThER GOODs
The cumulative exports of leather goods from India increased from US$ 0.9 bn in 2009 to US$ 1.4 bn in 2013.
Amongsttheleathergoodsidentifiedunder6-digitHS code, India had the highest share of 16.5% in the world for the category Gloves mittens & mitts, other than for sport, of leather or of composition leather (HS 420329). The major importers USA, Germany, Japan, Canada and France together accounted for half of the world imports in 2013. India was among the key suppliers to USA, Germany and France. USA, the biggest importer in the world with a share of 22.5% in 2013, sources these products from countries like China (which had a share of 73.1% in total imports of USA),India(10.6%),Pakistan(7.7%),Philippines(2.4%) and Italy (1.4%). Germany, the second largest importer in the world with a share of 9.1%, imports the largest amount from China (39.0% share in its imports), followed by India (30.8% share),Pakistan(14.7%),Hungary(2.4%),andtheNetherlands (1.9%). India occupies the number one position with share of 27.9% in the imports ofFrance,whichisthefifthlargestimporterintheworld under this category of leather goods. India can explore opportunities in Japan and Canada, two of the major markets where it currently doesn’t feature amongst the top suppliers (Table 22).
India’s share globally in exports of articles carried in pocket or handbag, with outer surface of leather (HS420231)stoodat10.4%in2013.Indiafiguredamongstthetopfivesupplierstothreeofthetopfiveimportersoftheworld,viz.USA,FranceandGermany. Germany, which was the fifth largestimporter in the world, imported the highest amount from India (31.8% of German imports were from India) (Table 22).
India also has a good potential in clothing accessories nes, of leather or of composition leather (HS 420340) where India had a share of 5.4% in world exports. Of the key importing countries like France, Germany, United Kingdom, Italy and USA, India was among the main suppliers to all countries except Italy. Among all the major importing countries, India had the highest share of 15.5% in the market of United Kingdom (Table 22).
Articles of leather or of composition leather, nes (HS 420500) is another product segment where India could enhance its global presence. India’s share in world exports of this category of products was 3.7% in 2013. The major importers were USA, Italy,Mexico,PolandandHongKong.However,itwas only in the case of USA, where India was one of the major suppliers, with a share of 10.5% in 2013 (Table 22).
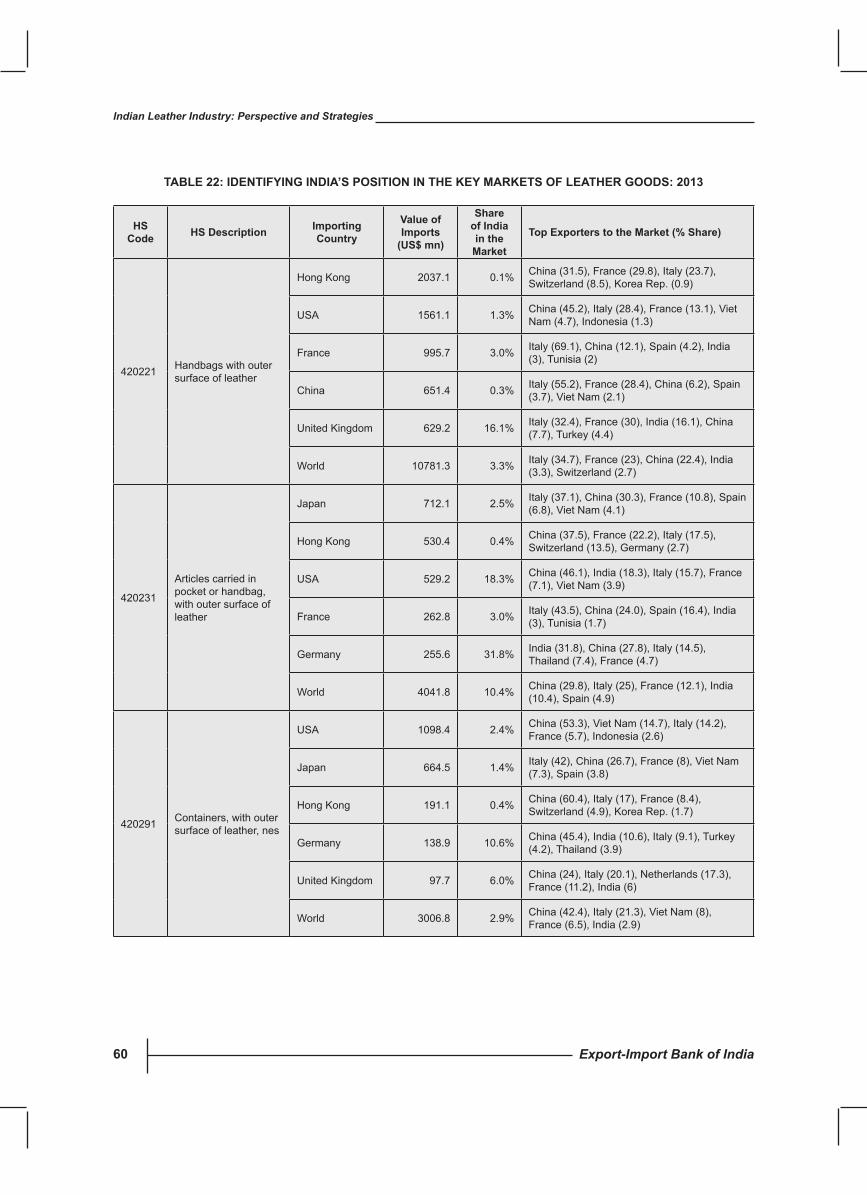
Export-Import Bank of India60
Indian Leather Industry: Perspective and Strategies
TABLE 22: IDENTIFyING INDIA’s POsITION IN ThE KEy MARKETs OF LEAThER GOODs: 2013
hs code hs Description Importing
country
value of Imports
(us$ mn)
share of India in the
Market
Top Exporters to the Market (% share)
420221 Handbags with outer surface of leather
Hong Kong 2037.1 0.1% China (31.5), France (29.8), Italy (23.7), Switzerland (8.5), Korea Rep. (0.9)
USA 1561.1 1.3% China (45.2), Italy (28.4), France (13.1), Viet Nam (4.7), Indonesia (1.3)
France 995.7 3.0% Italy (69.1), China (12.1), Spain (4.2), India (3), Tunisia (2)
China 651.4 0.3% Italy (55.2), France (28.4), China (6.2), Spain (3.7), Viet Nam (2.1)
United Kingdom 629.2 16.1% Italy (32.4), France (30), India (16.1), China (7.7), Turkey (4.4)
World 10781.3 3.3% Italy (34.7), France (23), China (22.4), India (3.3), Switzerland (2.7)
420231
Articles carried in pocket or handbag, with outer surface of leather
Japan 712.1 2.5% Italy (37.1), China (30.3), France (10.8), Spain (6.8), Viet Nam (4.1)
Hong Kong 530.4 0.4% China (37.5), France (22.2), Italy (17.5), Switzerland (13.5), Germany (2.7)
USA 529.2 18.3% China (46.1), India (18.3), Italy (15.7), France (7.1), Viet Nam (3.9)
France 262.8 3.0% Italy (43.5), China (24.0), Spain (16.4), India (3), Tunisia (1.7)
Germany 255.6 31.8% India (31.8), China (27.8), Italy (14.5), Thailand (7.4), France (4.7)
World 4041.8 10.4% China (29.8), Italy (25), France (12.1), India (10.4), Spain (4.9)
420291 Containers, with outer surface of leather, nes
USA 1098.4 2.4% China (53.3), Viet Nam (14.7), Italy (14.2), France (5.7), Indonesia (2.6)
Japan 664.5 1.4% Italy (42), China (26.7), France (8), Viet Nam (7.3), Spain (3.8)
Hong Kong 191.1 0.4% China (60.4), Italy (17), France (8.4), Switzerland (4.9), Korea Rep. (1.7)
Germany 138.9 10.6% China (45.4), India (10.6), Italy (9.1), Turkey (4.2), Thailand (3.9)
United Kingdom 97.7 6.0% China (24), Italy (20.1), Netherlands (17.3), France (11.2), India (6)
World 3006.8 2.9% China (42.4), Italy (21.3), Viet Nam (8), France (6.5), India (2.9)
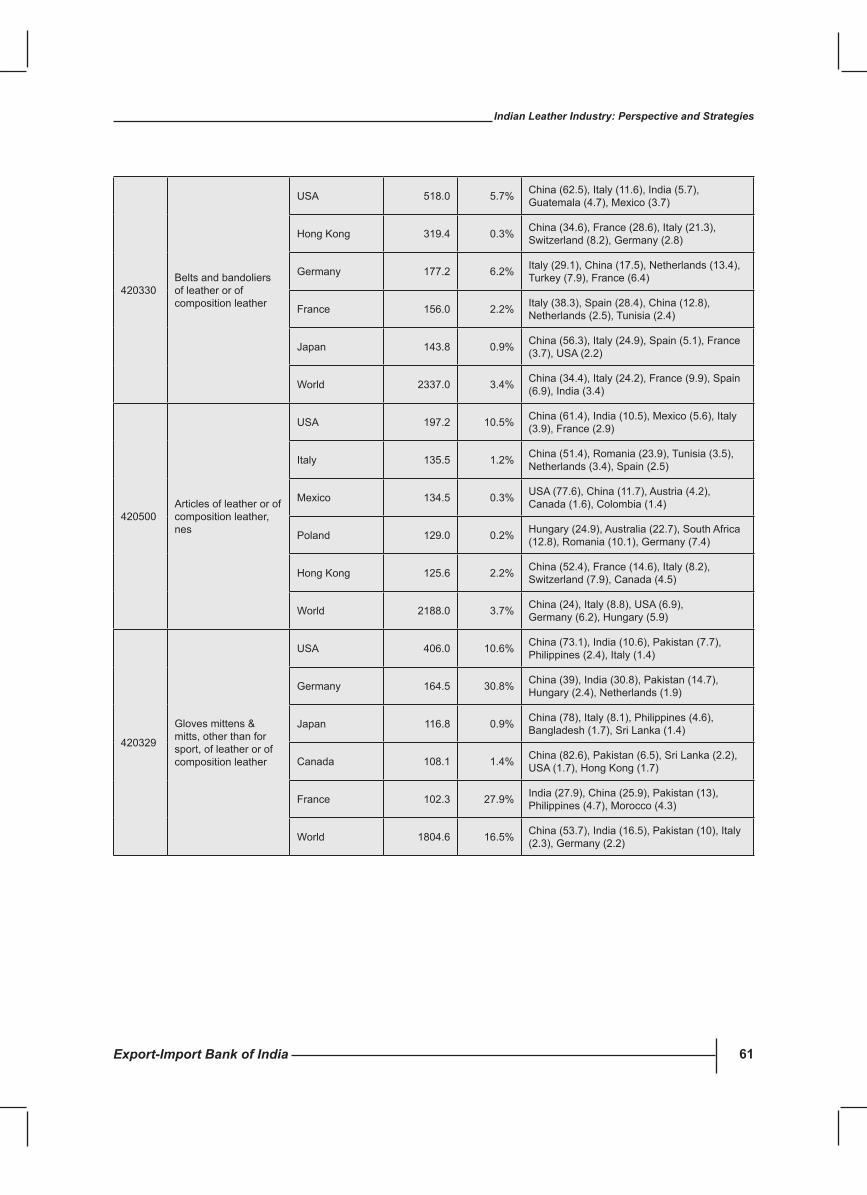
Export-Import Bank of India 61
Indian Leather Industry: Perspective and Strategies
420330Belts and bandoliers of leather or of composition leather
USA 518.0 5.7% China (62.5), Italy (11.6), India (5.7), Guatemala (4.7), Mexico (3.7)
Hong Kong 319.4 0.3% China (34.6), France (28.6), Italy (21.3), Switzerland (8.2), Germany (2.8)
Germany 177.2 6.2% Italy (29.1), China (17.5), Netherlands (13.4), Turkey (7.9), France (6.4)
France 156.0 2.2% Italy (38.3), Spain (28.4), China (12.8), Netherlands (2.5), Tunisia (2.4)
Japan 143.8 0.9% China (56.3), Italy (24.9), Spain (5.1), France (3.7), USA (2.2)
World 2337.0 3.4% China (34.4), Italy (24.2), France (9.9), Spain (6.9), India (3.4)
420500Articles of leather or of composition leather, nes
USA 197.2 10.5% China (61.4), India (10.5), Mexico (5.6), Italy (3.9), France (2.9)
Italy 135.5 1.2% China (51.4), Romania (23.9), Tunisia (3.5), Netherlands (3.4), Spain (2.5)
Mexico 134.5 0.3% USA (77.6), China (11.7), Austria (4.2), Canada (1.6), Colombia (1.4)
Poland 129.0 0.2% Hungary (24.9), Australia (22.7), South Africa (12.8), Romania (10.1), Germany (7.4)
Hong Kong 125.6 2.2% China (52.4), France (14.6), Italy (8.2), Switzerland (7.9), Canada (4.5)
World 2188.0 3.7% China (24), Italy (8.8), USA (6.9), Germany (6.2), Hungary (5.9)
420329
Gloves mittens & mitts, other than for sport, of leather or of composition leather
USA 406.0 10.6% China(73.1),India(10.6),Pakistan(7.7),Philippines(2.4),Italy(1.4)
Germany 164.5 30.8% China(39),India(30.8),Pakistan(14.7),Hungary (2.4), Netherlands (1.9)
Japan 116.8 0.9% China(78),Italy(8.1),Philippines(4.6),Bangladesh (1.7), Sri Lanka (1.4)
Canada 108.1 1.4% China(82.6),Pakistan(6.5),SriLanka(2.2),USA (1.7), Hong Kong (1.7)
France 102.3 27.9% India(27.9),China(25.9),Pakistan(13),Philippines(4.7),Morocco(4.3)
World 1804.6 16.5% China(53.7),India(16.5),Pakistan(10),Italy(2.3), Germany (2.2)
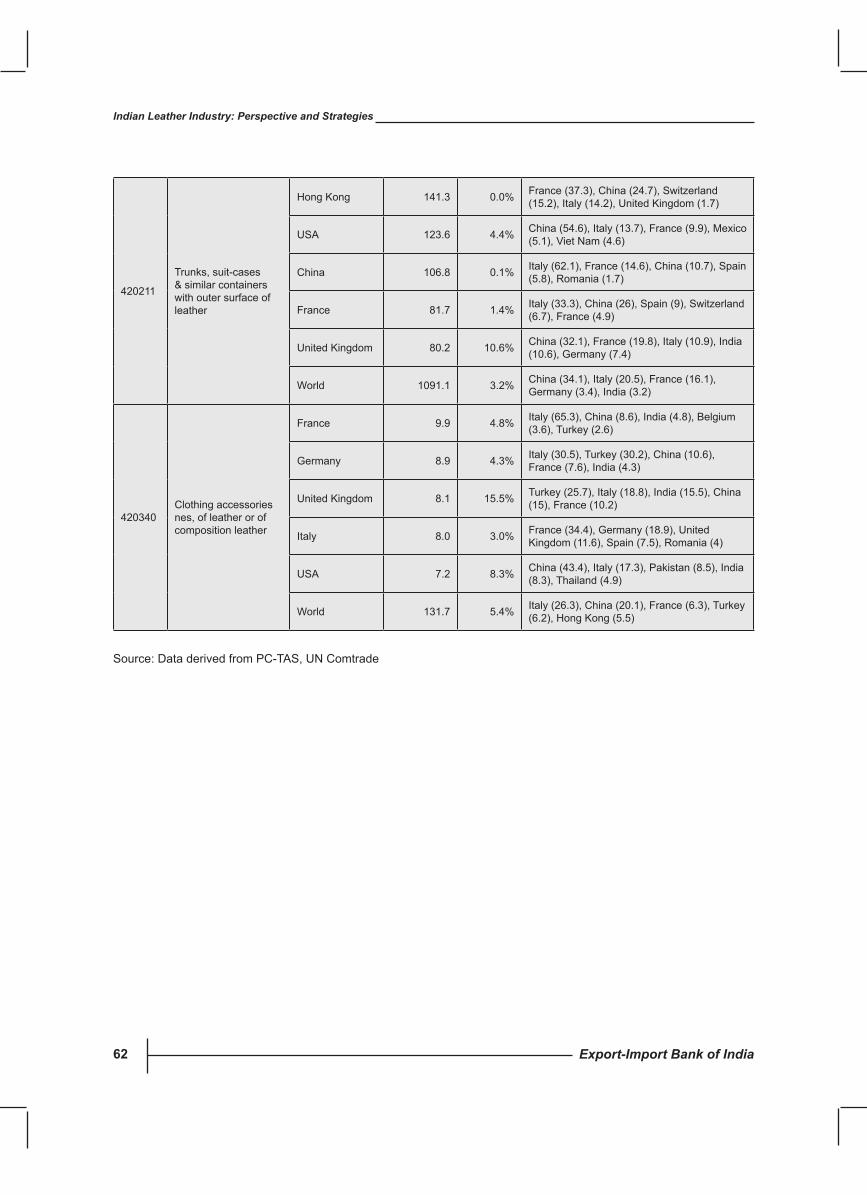
Export-Import Bank of India62
Indian Leather Industry: Perspective and Strategies
420211
Trunks, suit-cases & similar containers with outer surface of leather
Hong Kong 141.3 0.0% France (37.3), China (24.7), Switzerland (15.2), Italy (14.2), United Kingdom (1.7)
USA 123.6 4.4% China (54.6), Italy (13.7), France (9.9), Mexico (5.1), Viet Nam (4.6)
China 106.8 0.1% Italy (62.1), France (14.6), China (10.7), Spain (5.8), Romania (1.7)
France 81.7 1.4% Italy (33.3), China (26), Spain (9), Switzerland (6.7), France (4.9)
United Kingdom 80.2 10.6% China (32.1), France (19.8), Italy (10.9), India (10.6), Germany (7.4)
World 1091.1 3.2% China (34.1), Italy (20.5), France (16.1), Germany (3.4), India (3.2)
420340Clothing accessories nes, of leather or of composition leather
France 9.9 4.8% Italy (65.3), China (8.6), India (4.8), Belgium (3.6), Turkey (2.6)
Germany 8.9 4.3% Italy (30.5), Turkey (30.2), China (10.6), France (7.6), India (4.3)
United Kingdom 8.1 15.5% Turkey (25.7), Italy (18.8), India (15.5), China (15), France (10.2)
Italy 8.0 3.0% France (34.4), Germany (18.9), United Kingdom (11.6), Spain (7.5), Romania (4)
USA 7.2 8.3% China(43.4),Italy(17.3),Pakistan(8.5),India(8.3), Thailand (4.9)
World 131.7 5.4% Italy (26.3), China (20.1), France (6.3), Turkey (6.2), Hong Kong (5.5)
Source:DataderivedfromPC-TAS,UNComtrade
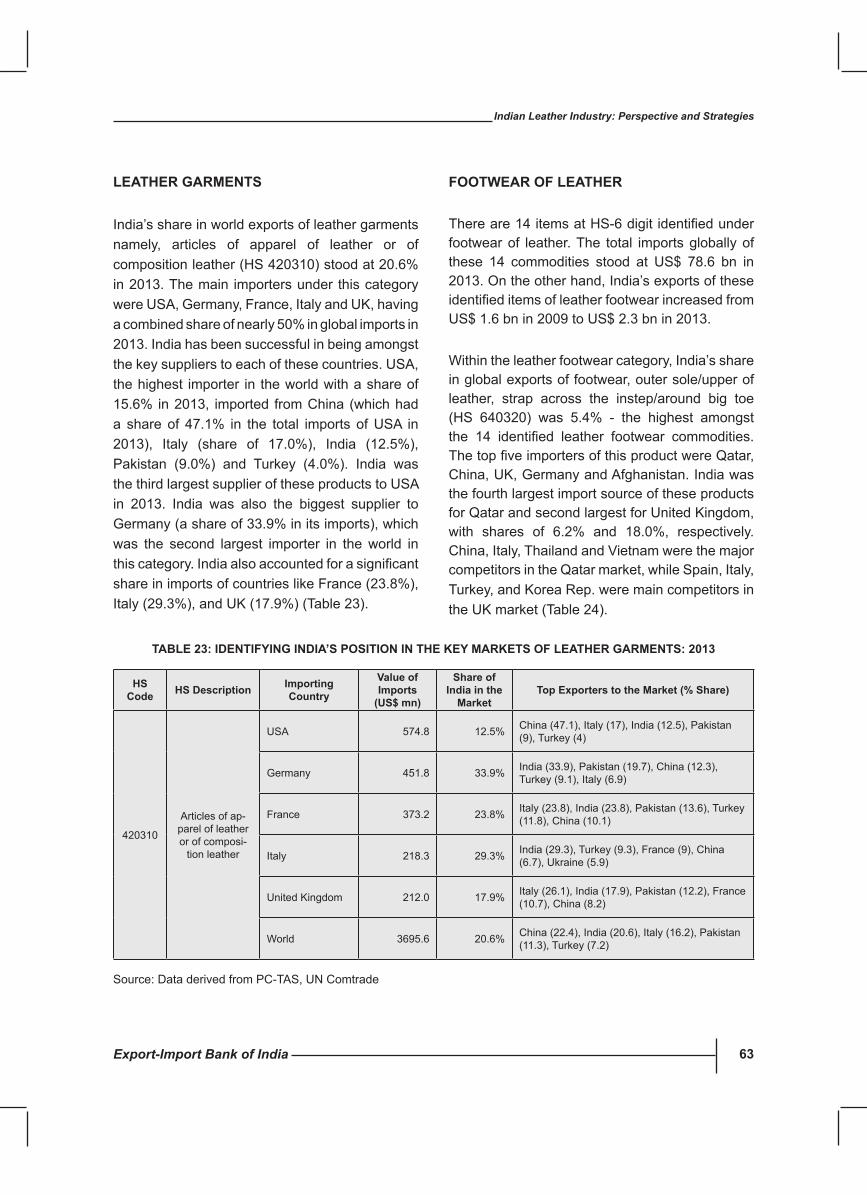
Export-Import Bank of India 63
Indian Leather Industry: Perspective and Strategies
LEAThER GARMENTs
India’s share in world exports of leather garments namely, articles of apparel of leather or of composition leather (HS 420310) stood at 20.6% in 2013. The main importers under this category were USA, Germany, France, Italy and UK, having a combined share of nearly 50% in global imports in 2013. India has been successful in being amongst the key suppliers to each of these countries. USA, the highest importer in the world with a share of 15.6% in 2013, imported from China (which had a share of 47.1% in the total imports of USA in 2013), Italy (share of 17.0%), India (12.5%), Pakistan (9.0%) and Turkey (4.0%). India wasthe third largest supplier of these products to USA in 2013. India was also the biggest supplier to Germany (a share of 33.9% in its imports), which was the second largest importer in the world in thiscategory.Indiaalsoaccountedforasignificantshare in imports of countries like France (23.8%), Italy (29.3%), and UK (17.9%) (Table 23).
FOOTWEAR OF LEAThER
Thereare14itemsatHS-6digitidentifiedunderfootwear of leather. The total imports globally of these 14 commodities stood at US$ 78.6 bn in 2013. On the other hand, India’s exports of these identifieditemsofleatherfootwearincreasedfromUS$ 1.6 bn in 2009 to US$ 2.3 bn in 2013.
Within the leather footwear category, India’s share in global exports of footwear, outer sole/upper of leather, strap across the instep/around big toe (HS 640320) was 5.4% - the highest amongst the 14 identified leather footwear commodities.ThetopfiveimportersofthisproductwereQatar,China, UK, Germany and Afghanistan. India was the fourth largest import source of these products for Qatar and second largest for United Kingdom, with shares of 6.2% and 18.0%, respectively. China, Italy, Thailand and Vietnam were the major competitors in the Qatar market, while Spain, Italy, Turkey, and Korea Rep. were main competitors in the UK market (Table 24).
hs code hs Description Importing
country
value of Imports
(us$ mn)
share of India in the
MarketTop Exporters to the Market (% share)
420310
Articles of ap-parel of leather or of composi-
tion leather
USA 574.8 12.5% China(47.1),Italy(17),India(12.5),Pakistan(9), Turkey (4)
Germany 451.8 33.9% India(33.9),Pakistan(19.7),China(12.3),Turkey (9.1), Italy (6.9)
France 373.2 23.8% Italy(23.8),India(23.8),Pakistan(13.6),Turkey(11.8), China (10.1)
Italy 218.3 29.3% India (29.3), Turkey (9.3), France (9), China (6.7), Ukraine (5.9)
United Kingdom 212.0 17.9% Italy(26.1),India(17.9),Pakistan(12.2),France(10.7), China (8.2)
World 3695.6 20.6% China(22.4),India(20.6),Italy(16.2),Pakistan(11.3), Turkey (7.2)
TABLE 23: IDENTIFyING INDIA’s POsITION IN ThE KEy MARKETs OF LEAThER GARMENTs: 2013
Source:DataderivedfromPC-TAS,UNComtrade
Export-Import Bank of India64
Indian Leather Industry: Perspective and Strategies
Indiaalsohadasignificantshareof4.4%inworldexports of footwear, outer soles of rubber/ plastic uppers of leather covering ankle nes (HS Code 640391)in2013.However,Indiadoesnotfigureinthe top suppliers to the major importing countries of the world for this product, apart from France which is the third largest importer having 6.8% share in world imports, and where India’s share is 6.6% of its imports (Table 24).
India also had a fairly high share of 4.0% in global exports of footwear, outer soles of rubber/plastics uppers of leather, nes (HS Code 640399). USA is the largest importer of these products, with a share of 24.4% in global imports. India is among the major suppliers of these products to USA, with a share of 2.3% in 2013. India also accounted for 7.3% of Germany’s import of these products, and 12.8% of UK’s import (Table 24).
There are product lines under HS-6 digit in the footwear segments where India does not have a substantial share in global exports, but has been successful in penetrating select markets of the key importers of that product. For example:
With a 3.9% share in global exports of −footwear, outer soles and uppers of leather, nes (HS 640359), India has been successful inenteringfourofthetopfiveimportmarkets.India’s share in imports of USA (top importer
with 19.1% share) imports stood at 5.2% and it faces competition from countries like Italy, China, Spain, and Brazil. India, with a 3.0% share in French imports (second largest importer with 12.8% share) competes with Italy, Portugal, Spain and UK. India alsooccupiesasignificantshareinboththefourthandthefifthlargestimportingcountriesintheworld – India has a 9.9% share in UK (fourth largest importer with a share of 7.4%), and 9.4%shareinGermany(fifthlargestimporterwith a share of 5.1%).
While India has a global export share of 2.6% in −footwear, outer sole of rubber/plastic /leather, uppers of leather with/metal toe-cap (HS Code 640340), it had an 11% share in the French import market, making it the fourth largest supplier to the country. India faces competition in this market from countries like Italy (with 27.1% share), China (with 22.7% share), Tunisia (with 13.4% share), and Slovakia (with 9.9% share).
In the footwear with uppers of leather or −composition leather, nes (HS 640510), India’s share in global exports stood at just 1.9%. However, India had a 26.1% share in the second largest importing market of Singapore. The major competitors for India in this market are China, Malaysia, Italy and France.
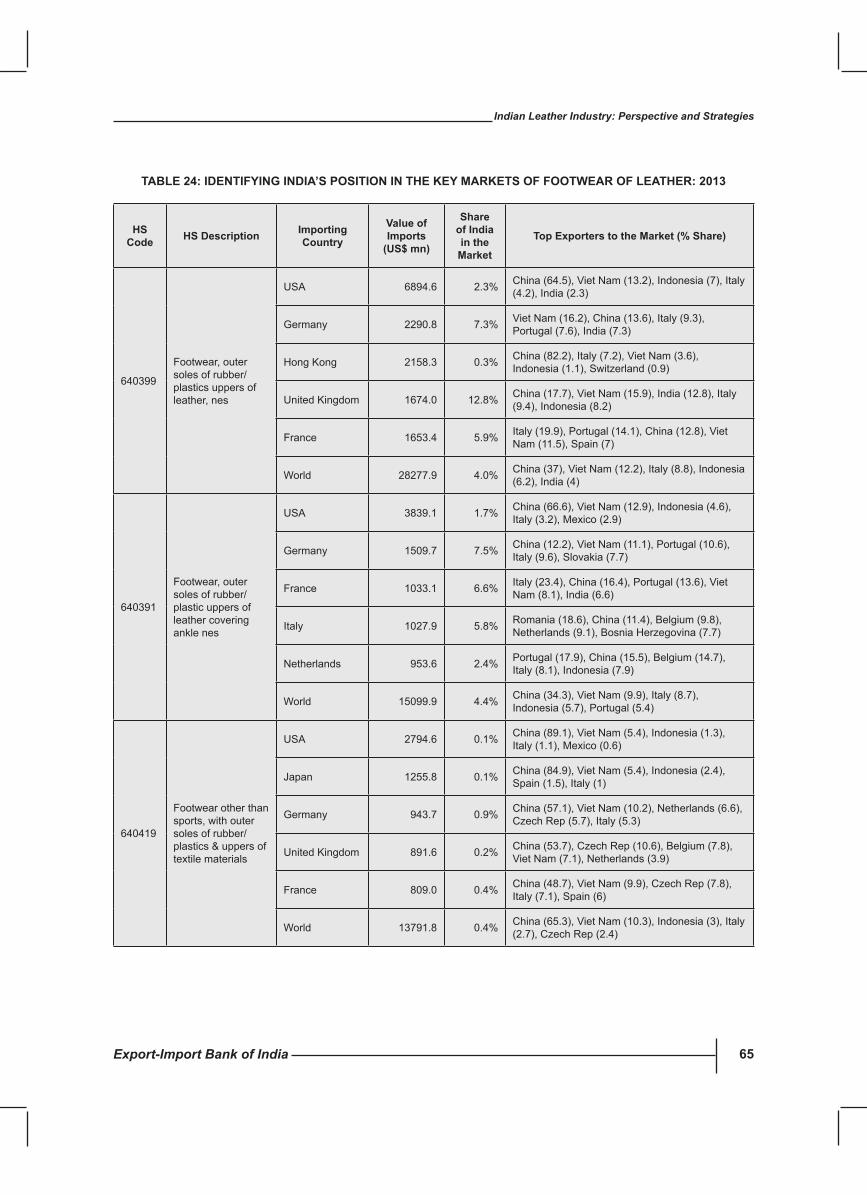
Export-Import Bank of India 65
Indian Leather Industry: Perspective and Strategies
TABLE 24: IDENTIFyING INDIA’s POsITION IN ThE KEy MARKETs OF FOOTWEAR OF LEAThER: 2013
hs code hs Description Importing
country
value of Imports
(us$ mn)
share of India in the
Market
Top Exporters to the Market (% share)
640399
Footwear, outer soles of rubber/plastics uppers of leather, nes
USA 6894.6 2.3% China (64.5), Viet Nam (13.2), Indonesia (7), Italy (4.2), India (2.3)
Germany 2290.8 7.3% Viet Nam (16.2), China (13.6), Italy (9.3), Portugal(7.6),India(7.3)
Hong Kong 2158.3 0.3% China (82.2), Italy (7.2), Viet Nam (3.6), Indonesia (1.1), Switzerland (0.9)
United Kingdom 1674.0 12.8% China (17.7), Viet Nam (15.9), India (12.8), Italy (9.4), Indonesia (8.2)
France 1653.4 5.9% Italy(19.9),Portugal(14.1),China(12.8),VietNam (11.5), Spain (7)
World 28277.9 4.0% China (37), Viet Nam (12.2), Italy (8.8), Indonesia (6.2), India (4)
640391
Footwear, outer soles of rubber/ plastic uppers of leather covering ankle nes
USA 3839.1 1.7% China (66.6), Viet Nam (12.9), Indonesia (4.6), Italy (3.2), Mexico (2.9)
Germany 1509.7 7.5% China(12.2),VietNam(11.1),Portugal(10.6),Italy (9.6), Slovakia (7.7)
France 1033.1 6.6% Italy(23.4),China(16.4),Portugal(13.6),VietNam (8.1), India (6.6)
Italy 1027.9 5.8% Romania (18.6), China (11.4), Belgium (9.8), Netherlands (9.1), Bosnia Herzegovina (7.7)
Netherlands 953.6 2.4% Portugal(17.9),China(15.5),Belgium(14.7),Italy (8.1), Indonesia (7.9)
World 15099.9 4.4% China (34.3), Viet Nam (9.9), Italy (8.7), Indonesia(5.7),Portugal(5.4)
640419
Footwear other than sports, with outer soles of rubber/ plastics & uppers of textile materials
USA 2794.6 0.1% China (89.1), Viet Nam (5.4), Indonesia (1.3), Italy (1.1), Mexico (0.6)
Japan 1255.8 0.1% China (84.9), Viet Nam (5.4), Indonesia (2.4), Spain (1.5), Italy (1)
Germany 943.7 0.9% China (57.1), Viet Nam (10.2), Netherlands (6.6), Czech Rep (5.7), Italy (5.3)
United Kingdom 891.6 0.2% China (53.7), Czech Rep (10.6), Belgium (7.8), Viet Nam (7.1), Netherlands (3.9)
France 809.0 0.4% China (48.7), Viet Nam (9.9), Czech Rep (7.8), Italy (7.1), Spain (6)
World 13791.8 0.4% China (65.3), Viet Nam (10.3), Indonesia (3), Italy (2.7), Czech Rep (2.4)
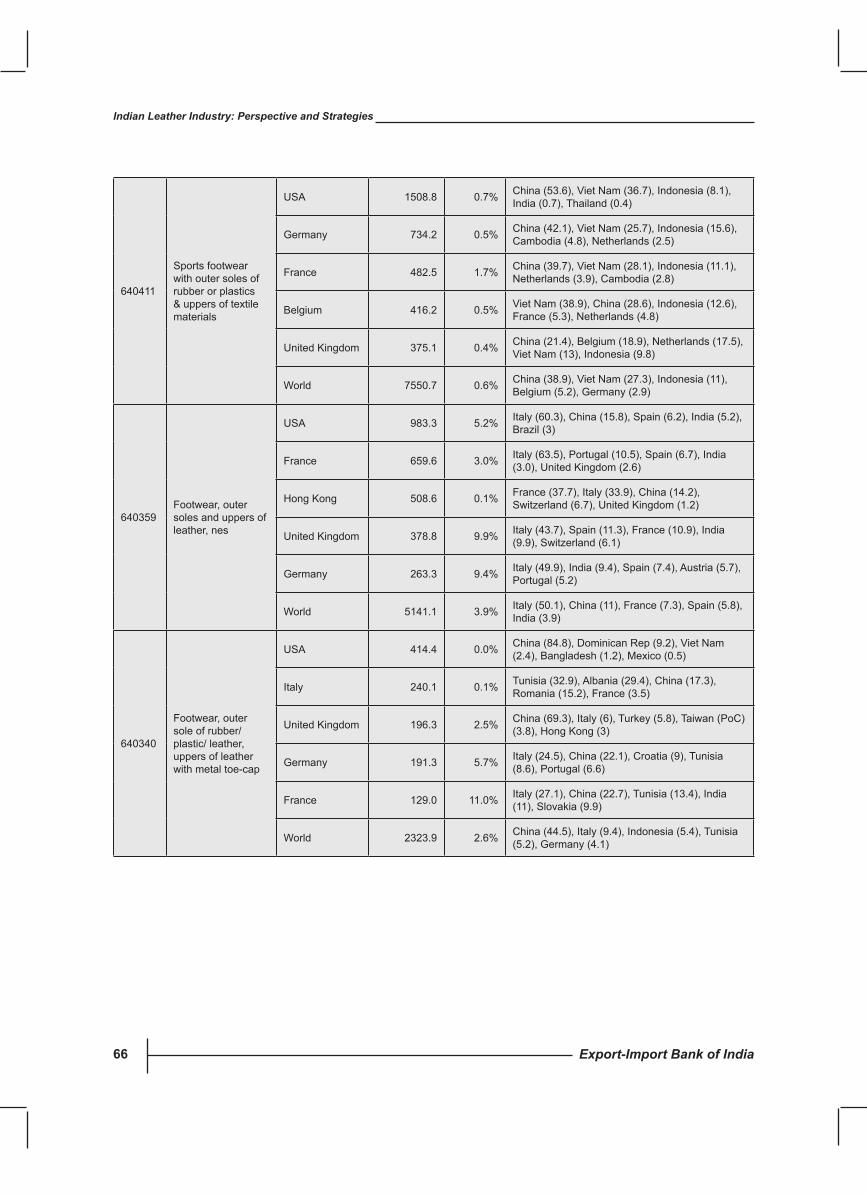
Export-Import Bank of India66
Indian Leather Industry: Perspective and Strategies
640411
Sports footwear with outer soles of rubber or plastics & uppers of textile materials
USA 1508.8 0.7% China (53.6), Viet Nam (36.7), Indonesia (8.1), India (0.7), Thailand (0.4)
Germany 734.2 0.5% China (42.1), Viet Nam (25.7), Indonesia (15.6), Cambodia (4.8), Netherlands (2.5)
France 482.5 1.7% China (39.7), Viet Nam (28.1), Indonesia (11.1), Netherlands (3.9), Cambodia (2.8)
Belgium 416.2 0.5% Viet Nam (38.9), China (28.6), Indonesia (12.6), France (5.3), Netherlands (4.8)
United Kingdom 375.1 0.4% China (21.4), Belgium (18.9), Netherlands (17.5), Viet Nam (13), Indonesia (9.8)
World 7550.7 0.6% China (38.9), Viet Nam (27.3), Indonesia (11), Belgium (5.2), Germany (2.9)
640359Footwear, outer soles and uppers of leather, nes
USA 983.3 5.2% Italy (60.3), China (15.8), Spain (6.2), India (5.2), Brazil (3)
France 659.6 3.0% Italy(63.5),Portugal(10.5),Spain(6.7),India(3.0), United Kingdom (2.6)
Hong Kong 508.6 0.1% France (37.7), Italy (33.9), China (14.2), Switzerland (6.7), United Kingdom (1.2)
United Kingdom 378.8 9.9% Italy (43.7), Spain (11.3), France (10.9), India (9.9), Switzerland (6.1)
Germany 263.3 9.4% Italy (49.9), India (9.4), Spain (7.4), Austria (5.7), Portugal(5.2)
World 5141.1 3.9% Italy (50.1), China (11), France (7.3), Spain (5.8), India (3.9)
640340
Footwear, outer sole of rubber/ plastic/ leather, uppers of leather with metal toe-cap
USA 414.4 0.0% China (84.8), Dominican Rep (9.2), Viet Nam (2.4), Bangladesh (1.2), Mexico (0.5)
Italy 240.1 0.1% Tunisia (32.9), Albania (29.4), China (17.3), Romania (15.2), France (3.5)
United Kingdom 196.3 2.5% China(69.3),Italy(6),Turkey(5.8),Taiwan(PoC)(3.8), Hong Kong (3)
Germany 191.3 5.7% Italy (24.5), China (22.1), Croatia (9), Tunisia (8.6),Portugal(6.6)
France 129.0 11.0% Italy (27.1), China (22.7), Tunisia (13.4), India (11), Slovakia (9.9)
World 2323.9 2.6% China (44.5), Italy (9.4), Indonesia (5.4), Tunisia (5.2), Germany (4.1)
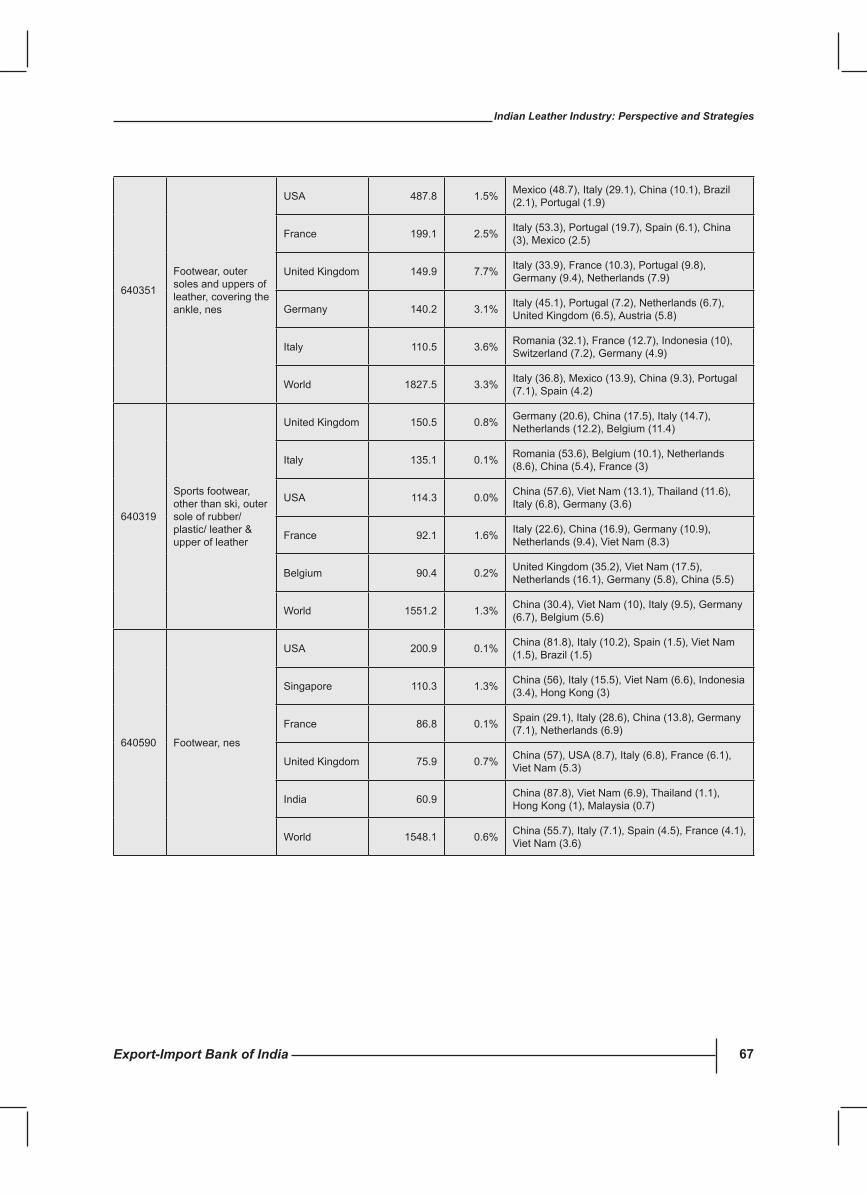
Export-Import Bank of India 67
Indian Leather Industry: Perspective and Strategies
640351
Footwear, outer soles and uppers of leather, covering the ankle, nes
USA 487.8 1.5% Mexico (48.7), Italy (29.1), China (10.1), Brazil (2.1),Portugal(1.9)
France 199.1 2.5% Italy(53.3),Portugal(19.7),Spain(6.1),China(3), Mexico (2.5)
United Kingdom 149.9 7.7% Italy(33.9),France(10.3),Portugal(9.8),Germany (9.4), Netherlands (7.9)
Germany 140.2 3.1% Italy(45.1),Portugal(7.2),Netherlands(6.7),United Kingdom (6.5), Austria (5.8)
Italy 110.5 3.6% Romania (32.1), France (12.7), Indonesia (10), Switzerland (7.2), Germany (4.9)
World 1827.5 3.3% Italy(36.8),Mexico(13.9),China(9.3),Portugal(7.1), Spain (4.2)
640319
Sports footwear, other than ski, outer sole of rubber/ plastic/ leather & upper of leather
United Kingdom 150.5 0.8% Germany (20.6), China (17.5), Italy (14.7), Netherlands (12.2), Belgium (11.4)
Italy 135.1 0.1% Romania (53.6), Belgium (10.1), Netherlands (8.6), China (5.4), France (3)
USA 114.3 0.0% China (57.6), Viet Nam (13.1), Thailand (11.6), Italy (6.8), Germany (3.6)
France 92.1 1.6% Italy (22.6), China (16.9), Germany (10.9), Netherlands (9.4), Viet Nam (8.3)
Belgium 90.4 0.2% United Kingdom (35.2), Viet Nam (17.5), Netherlands (16.1), Germany (5.8), China (5.5)
World 1551.2 1.3% China (30.4), Viet Nam (10), Italy (9.5), Germany (6.7), Belgium (5.6)
640590 Footwear, nes
USA 200.9 0.1% China (81.8), Italy (10.2), Spain (1.5), Viet Nam (1.5), Brazil (1.5)
Singapore 110.3 1.3% China (56), Italy (15.5), Viet Nam (6.6), Indonesia (3.4), Hong Kong (3)
France 86.8 0.1% Spain (29.1), Italy (28.6), China (13.8), Germany (7.1), Netherlands (6.9)
United Kingdom 75.9 0.7% China (57), USA (8.7), Italy (6.8), France (6.1), Viet Nam (5.3)
India 60.9 China (87.8), Viet Nam (6.9), Thailand (1.1), Hong Kong (1), Malaysia (0.7)
World 1548.1 0.6% China (55.7), Italy (7.1), Spain (4.5), France (4.1), Viet Nam (3.6)
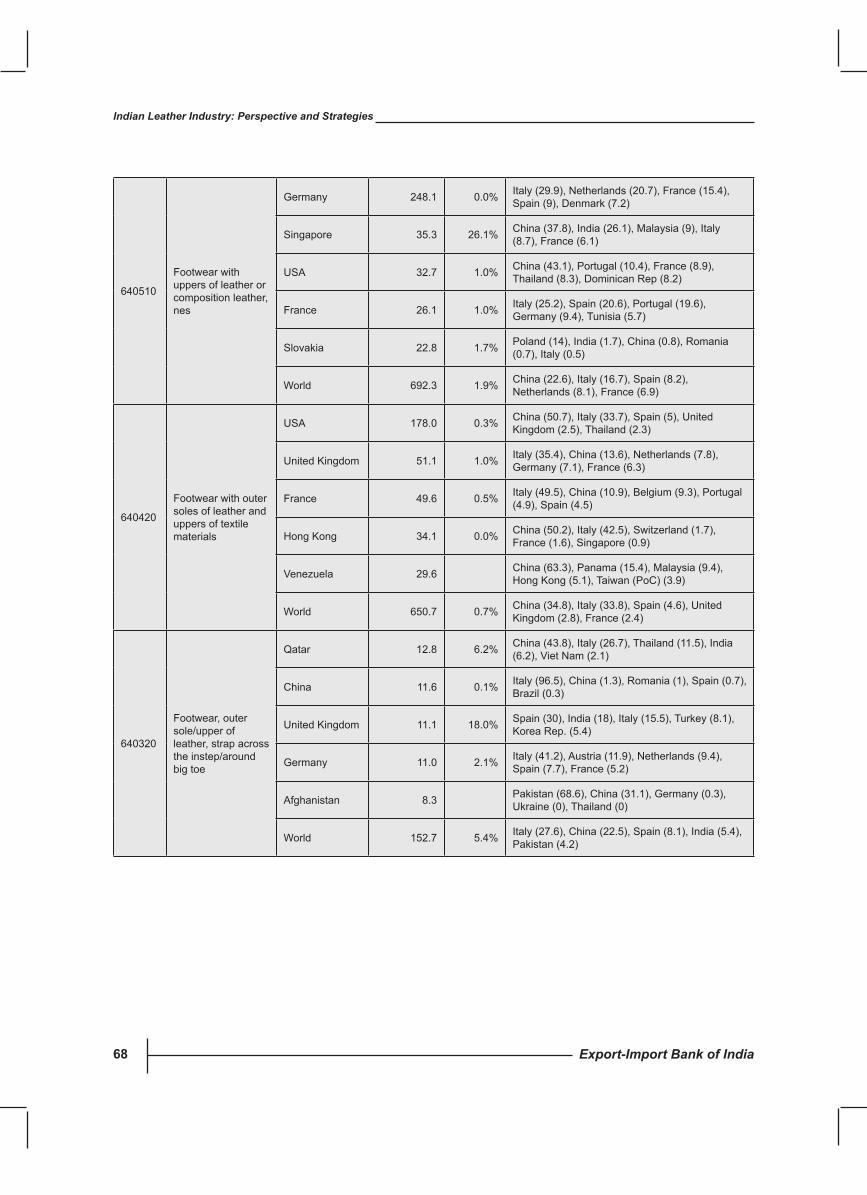
Export-Import Bank of India68
Indian Leather Industry: Perspective and Strategies
640510
Footwear with uppers of leather or composition leather, nes
Germany 248.1 0.0% Italy (29.9), Netherlands (20.7), France (15.4), Spain (9), Denmark (7.2)
Singapore 35.3 26.1% China (37.8), India (26.1), Malaysia (9), Italy (8.7), France (6.1)
USA 32.7 1.0% China(43.1),Portugal(10.4),France(8.9),Thailand (8.3), Dominican Rep (8.2)
France 26.1 1.0% Italy(25.2),Spain(20.6),Portugal(19.6),Germany (9.4), Tunisia (5.7)
Slovakia 22.8 1.7% Poland(14),India(1.7),China(0.8),Romania(0.7), Italy (0.5)
World 692.3 1.9% China (22.6), Italy (16.7), Spain (8.2), Netherlands (8.1), France (6.9)
640420
Footwear with outer soles of leather and uppers of textile materials
USA 178.0 0.3% China (50.7), Italy (33.7), Spain (5), United Kingdom (2.5), Thailand (2.3)
United Kingdom 51.1 1.0% Italy (35.4), China (13.6), Netherlands (7.8), Germany (7.1), France (6.3)
France 49.6 0.5% Italy(49.5),China(10.9),Belgium(9.3),Portugal(4.9), Spain (4.5)
Hong Kong 34.1 0.0% China (50.2), Italy (42.5), Switzerland (1.7), France (1.6), Singapore (0.9)
Venezuela 29.6 China(63.3),Panama(15.4),Malaysia(9.4),HongKong(5.1),Taiwan(PoC)(3.9)
World 650.7 0.7% China (34.8), Italy (33.8), Spain (4.6), United Kingdom (2.8), France (2.4)
640320
Footwear, outer sole/upper of leather, strap across the instep/around big toe
Qatar 12.8 6.2% China (43.8), Italy (26.7), Thailand (11.5), India (6.2), Viet Nam (2.1)
China 11.6 0.1% Italy (96.5), China (1.3), Romania (1), Spain (0.7), Brazil (0.3)
United Kingdom 11.1 18.0% Spain (30), India (18), Italy (15.5), Turkey (8.1), Korea Rep. (5.4)
Germany 11.0 2.1% Italy (41.2), Austria (11.9), Netherlands (9.4), Spain (7.7), France (5.2)
Afghanistan 8.3 Pakistan(68.6),China(31.1),Germany(0.3),Ukraine (0), Thailand (0)
World 152.7 5.4% Italy (27.6), China (22.5), Spain (8.1), India (5.4), Pakistan(4.2)
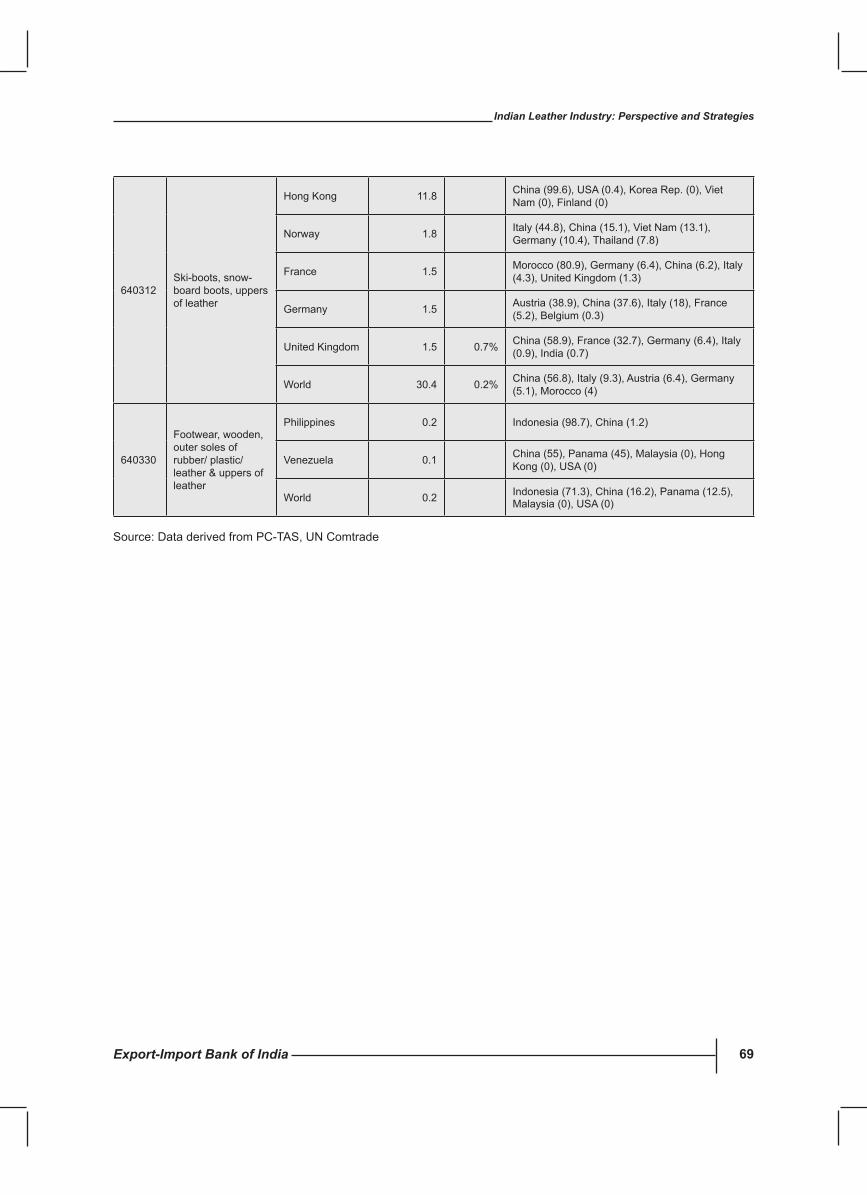
Export-Import Bank of India 69
Indian Leather Industry: Perspective and Strategies
640312Ski-boots, snow-board boots, uppers of leather
Hong Kong 11.8 China (99.6), USA (0.4), Korea Rep. (0), Viet Nam (0), Finland (0)
Norway 1.8 Italy (44.8), China (15.1), Viet Nam (13.1), Germany (10.4), Thailand (7.8)
France 1.5 Morocco (80.9), Germany (6.4), China (6.2), Italy (4.3), United Kingdom (1.3)
Germany 1.5 Austria (38.9), China (37.6), Italy (18), France (5.2), Belgium (0.3)
United Kingdom 1.5 0.7% China (58.9), France (32.7), Germany (6.4), Italy (0.9), India (0.7)
World 30.4 0.2% China (56.8), Italy (9.3), Austria (6.4), Germany (5.1), Morocco (4)
640330
Footwear, wooden, outer soles of rubber/ plastic/leather & uppers of leather
Philippines 0.2 Indonesia (98.7), China (1.2)
Venezuela 0.1 China(55),Panama(45),Malaysia(0),HongKong (0), USA (0)
World 0.2 Indonesia(71.3),China(16.2),Panama(12.5),Malaysia (0), USA (0)
Source:DataderivedfromPC-TAS,UNComtrade
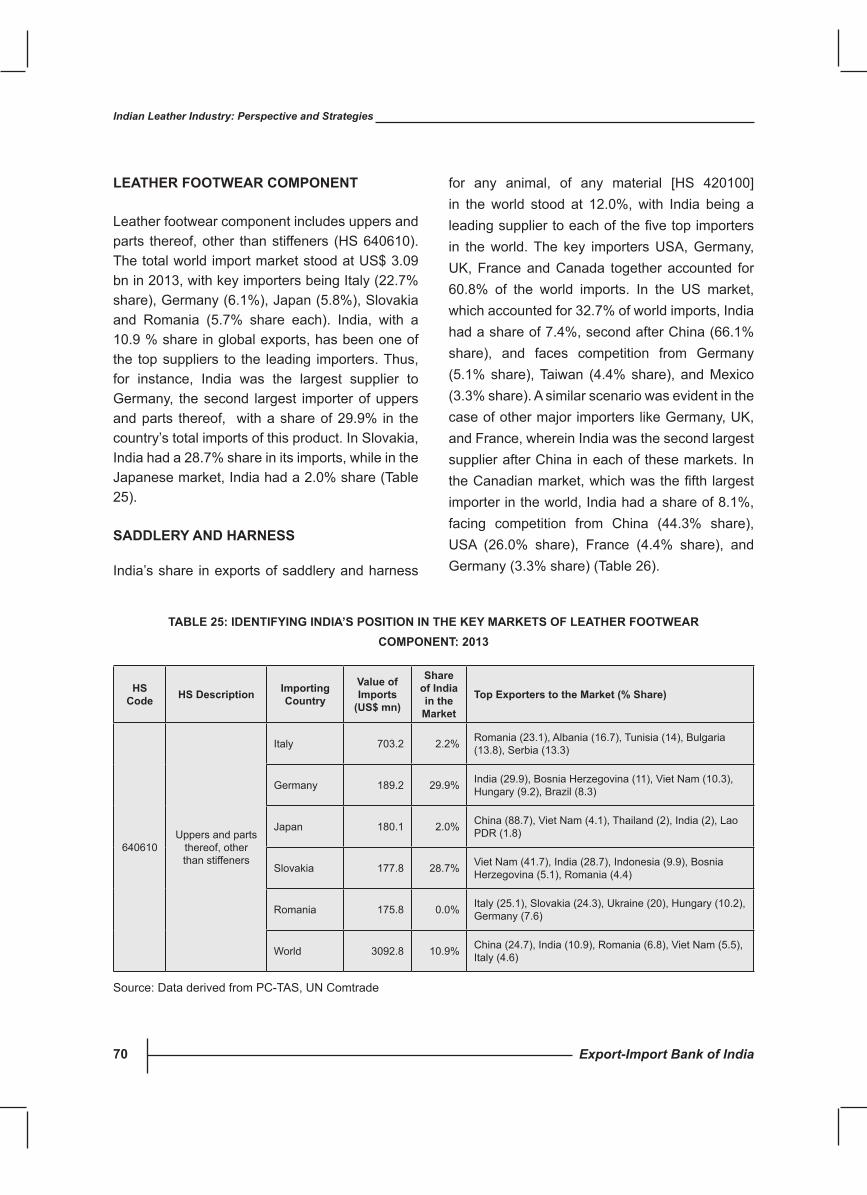
Export-Import Bank of India70
Indian Leather Industry: Perspective and Strategies
LEAThER FOOTWEAR cOMPONENT
Leather footwear component includes uppers and parts thereof, other than stiffeners (HS 640610). The total world import market stood at US$ 3.09 bn in 2013, with key importers being Italy (22.7% share), Germany (6.1%), Japan (5.8%), Slovakia and Romania (5.7% share each). India, with a 10.9 % share in global exports, has been one of the top suppliers to the leading importers. Thus, for instance, India was the largest supplier to Germany, the second largest importer of uppers and parts thereof, with a share of 29.9% in the country’s total imports of this product. In Slovakia, India had a 28.7% share in its imports, while in the Japanese market, India had a 2.0% share (Table 25).
sADDLERy AND hARNEss
India’s share in exports of saddlery and harness
for any animal, of any material [HS 420100] in the world stood at 12.0%, with India being a leadingsuppliertoeachofthefivetopimportersin the world. The key importers USA, Germany, UK, France and Canada together accounted for 60.8% of the world imports. In the US market, which accounted for 32.7% of world imports, India had a share of 7.4%, second after China (66.1% share), and faces competition from Germany (5.1% share), Taiwan (4.4% share), and Mexico (3.3% share). A similar scenario was evident in the case of other major importers like Germany, UK, and France, wherein India was the second largest supplier after China in each of these markets. In theCanadianmarket,whichwasthefifthlargestimporter in the world, India had a share of 8.1%, facing competition from China (44.3% share), USA (26.0% share), France (4.4% share), and Germany (3.3% share) (Table 26).
hs code hs Description Importing
country
value of Imports
(us$ mn)
share of India in the
Market
Top Exporters to the Market (% share)
640610Uppers and parts
thereof, other than stiffeners
Italy 703.2 2.2% Romania (23.1), Albania (16.7), Tunisia (14), Bulgaria (13.8), Serbia (13.3)
Germany 189.2 29.9% India (29.9), Bosnia Herzegovina (11), Viet Nam (10.3), Hungary (9.2), Brazil (8.3)
Japan 180.1 2.0% China (88.7), Viet Nam (4.1), Thailand (2), India (2), Lao PDR(1.8)
Slovakia 177.8 28.7% Viet Nam (41.7), India (28.7), Indonesia (9.9), Bosnia Herzegovina (5.1), Romania (4.4)
Romania 175.8 0.0% Italy (25.1), Slovakia (24.3), Ukraine (20), Hungary (10.2), Germany (7.6)
World 3092.8 10.9% China (24.7), India (10.9), Romania (6.8), Viet Nam (5.5), Italy (4.6)
TABLE 25: IDENTIFyING INDIA’s POsITION IN ThE KEy MARKETs OF LEAThER FOOTWEAR cOMPONENT: 2013
Source:DataderivedfromPC-TAS,UNComtrade
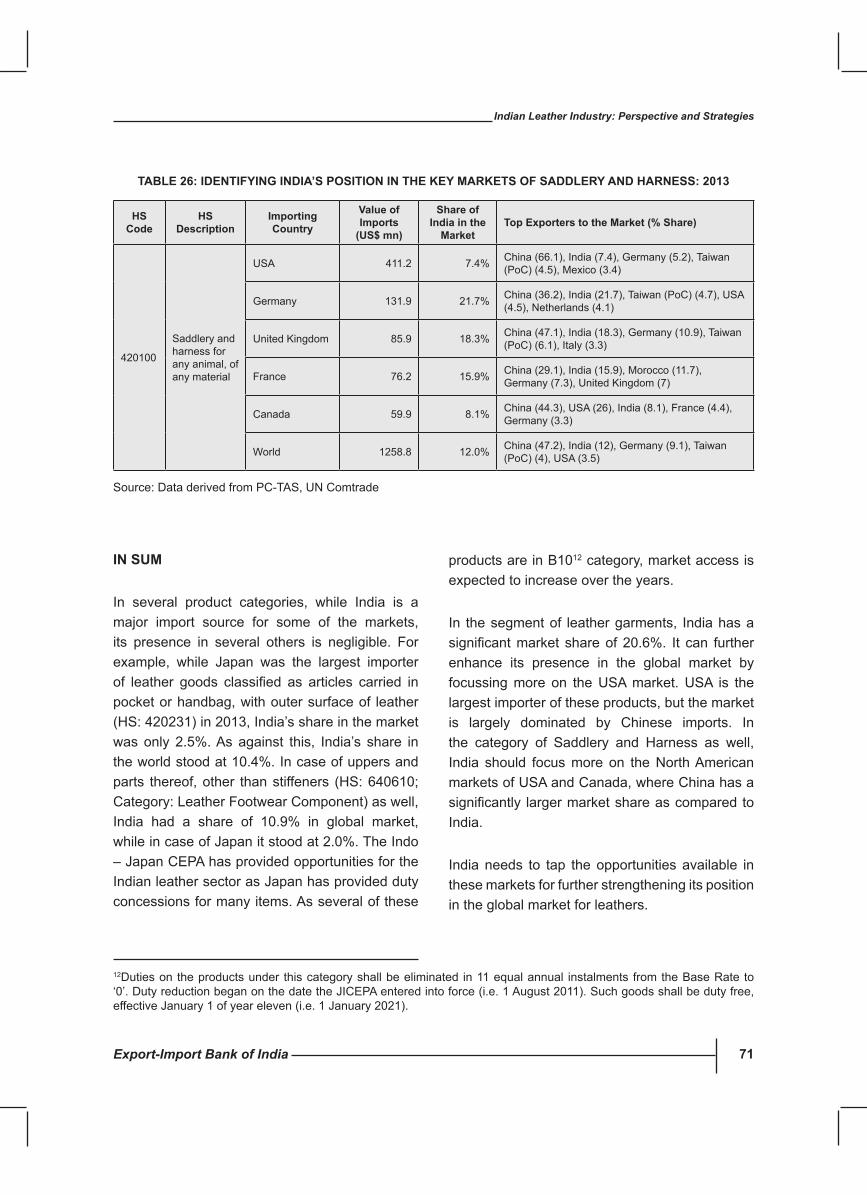
Export-Import Bank of India 71
Indian Leather Industry: Perspective and Strategies
IN suM
In several product categories, while India is a major import source for some of the markets, its presence in several others is negligible. For example, while Japan was the largest importer of leather goods classified as articles carried inpocket or handbag, with outer surface of leather (HS: 420231) in 2013, India’s share in the market was only 2.5%. As against this, India’s share in the world stood at 10.4%. In case of uppers and parts thereof, other than stiffeners (HS: 640610; Category: Leather Footwear Component) as well, India had a share of 10.9% in global market, while in case of Japan it stood at 2.0%. The Indo –JapanCEPAhasprovidedopportunitiesfortheIndian leather sector as Japan has provided duty concessions for many items. As several of these
TABLE 26: IDENTIFyING INDIA’s POsITION IN ThE KEy MARKETs OF sADDLERy AND hARNEss: 2013
hs code
hs Description
Importing country
value of Imports
(us$ mn)
share of India in the
MarketTop Exporters to the Market (% share)
420100
Saddlery and harness for any animal, of any material
USA 411.2 7.4% China (66.1), India (7.4), Germany (5.2), Taiwan (PoC)(4.5),Mexico(3.4)
Germany 131.9 21.7% China(36.2),India(21.7),Taiwan(PoC)(4.7),USA(4.5), Netherlands (4.1)
United Kingdom 85.9 18.3% China (47.1), India (18.3), Germany (10.9), Taiwan (PoC)(6.1),Italy(3.3)
France 76.2 15.9% China (29.1), India (15.9), Morocco (11.7), Germany (7.3), United Kingdom (7)
Canada 59.9 8.1% China (44.3), USA (26), India (8.1), France (4.4), Germany (3.3)
World 1258.8 12.0% China (47.2), India (12), Germany (9.1), Taiwan (PoC)(4),USA(3.5)
Source:DataderivedfromPC-TAS,UNComtrade
products are in B1012 category, market access is expected to increase over the years.
In the segment of leather garments, India has a significantmarket shareof20.6%. It can furtherenhance its presence in the global market by focussing more on the USA market. USA is the largest importer of these products, but the market is largely dominated by Chinese imports. In the category of Saddlery and Harness as well, India should focus more on the North American markets of USA and Canada, where China has a significantly largermarketshareascomparedtoIndia.
India needs to tap the opportunities available in these markets for further strengthening its position in the global market for leathers.
12Duties on the products under this category shall be eliminated in 11 equal annual instalments from the Base Rate to ‘0’.DutyreductionbeganonthedatetheJICEPAenteredintoforce(i.e.1August2011).Suchgoodsshallbedutyfree,effective January 1 of year eleven (i.e. 1 January 2021).
Export-Import Bank of India72
Indian Leather Industry: Perspective and Strategies
5. chALLENGEs AND sTRATEGIEs
RAW MATERIAL AvAILABILITy
For the leather industry in India to grow, the concern towards availability of leather has to be addressed. India does not have organized animal farming which results in shortage of raw material. In most parts of the country, cattle are generally slaughtered only when they become old enough, as permitted by the law. Slaughtering of cattle is done only in a few states like Kerala, West Bengal and those in the North East, although buffalo, sheep and goats are slaughtered for meat all over the country. However, in many parts of North India, the buffalo is used as a draught animal and therefore not slaughtered until it becomes old.
Although India has the highest buffalo population in the world and exports leather to various countries including China, it still does not have competency in raw material cost. The primary reason is relatively limited availability of high quality raw material (leather) from Indian abattoirs. Indian manufacturers of leather products have reported frequent issues of cuts, marks on the skins, etc. Due to this, India needs to rely on imports of high quality raw material.
In addition, there are reported issues of price regulations of hides and skins provided by abattoirs, which further puts cost pressures on manufacturers of finished leather and leatherproducts. Apart from these issues, there is limited availability of cow leather in India because of
regulationsinvariousregions.Thus,Indianfirmshave to rely on imports of cow leather.
There are also segment specific issues in rawmaterials that impact the competitiveness of the overall sector. For leather footwear sector, there is very limited indigenous production of non-leather raw materials like synthetic leather, laces, PUsoles, insole board, steel toe caps etc., due to which most of the footwear manufacturers have to rely on imports. This adds to the costs of Indian manufacturers. For leather apparel industry, finishedleatherfurisnoteasilyavailableinIndia,hence it is imported which again adds to the cost of leather apparel. For leather goods industry, most of the metal fittings and accessories arebeing imported from Taiwan, Japan, and Hong-Kong since there is limited availability in India, which leads to increase in the overall cost.
In tanning industries, there are chemicals that are used for dyeing like oils and fats, synthetic tanning agent etc. that are being imported mainly from Europe. These chemicals are imported at a high duty which adds to the overall cost of the product offinished leatherand in turnaffects thecostofleather products, which use finished leather astheir principal input.
IDENTIFyING PROsPEcTs OF sOuRcING RAW MATERIALs
India needs to get into the global value chain of leather. Supply chains, which are often buyer-
Export-Import Bank of India 73
Indian Leather Industry: Perspective and Strategies
driven, can spread across several countries and regions, as marketing and manufacturing agents set up global production networks, principally in developing countries. To gain access to new markets and secure additional market share, the Indian leather sector must integrate itself to the extent possible globally.
India currently has a shortage of raw material and hence it is important to source the raw materials from countries which offer better quality and variety. Since the demand for leather is expanding, sourcing from other countries can also help in controlling costs.
Africa’s abundance of livestock represents a natural strength for the sector, as leather is a by-product of the meat industry. Africa has about 20.8% of the world’s cattle population and about 28.2% of the world’s sheep and goat population. This puts Africa at the centre of the booming leather industry as a key supplier of hides and raw materials to the growing industry of leather and leather goods. However, despite its significanceas a livestock producer, Africa accounts for only 9.5% of world production of cattle hides and about 19.4% of goat skin and 3.2% sheepskins. Indian leather industry could look at sourcing their raw material requirements for leather and hides from Africa, especially East African countries like Ethiopia and Kenya. It may be noted that Ethiopia’s second highest foreign exchange earnings, after coffee, comes from export of hides and skins.
Besides, countries in CIS like Uzbekistan and Kazakhstan can also be potential sources for raw hides and skins, semi-processed leather and leather. In the Latin American countries, Brazil, Argentina, Uruguay and Paraguay canbe explored by Indian leather manufacturers as potential sources of different kinds of leather.
INDIA EXPLORING Jvs IN AFRIcAN MARKETs
In spite of possessing a latent potential to have a leather industry base, Africa’s exports have remained almost flat. Exports of leather haveincreased only marginally from US$ 1.9 bn in 2010 to US$ 2.0 bn in 2014.
Demand for raw hides and skins in India outstrips its domestic supply. A solution to the shortage lies just across the ocean and partnering with other nations, particularly East African nations, which have materials to meet the need and desire to upgrade their countries’ leather sector.
Indian leather industry could look at exploring joint ventures with companies in these countries as well as providing technical assistance, know-how and investments for low-end value addition. These JVs would convert raw hides and skins into semi-finished leather for shipment to India.India has rich experience in the entire leather value chain, from tanning to garmenting. India has well known institutions for leather technology, research, design development, in addition to a large number of training centers in private sector, which can also help countries in Africa to upgrade their productivity.
EXPLORING OPPORTuNITIEs OvERsEAs WITh ThE ONsET OF MEGA TRADE AGREEMENTs
In October 2015, the Trans Pacific Partnership(TPP)Agreement, a consortium of 12 countriesfromboththesidesofthePacificwithapopulationexceeding805million,andacombinedGDPsizeofUS$ 28 trillion, was signed. The second agreement in the pipeline is the Regional Comprehensive
Export-Import Bank of India74
Indian Leather Industry: Perspective and Strategies
BOX 1: suPPORTING INDIA’s TRADE PREFERENcEs FOR AFRIcA (sITA)
Africa’s achievements in the global leather market vary between countries and regions. However, the great potential of the African leather sector remains largely untapped, and the continent’s leather industry has not kept pace with the substantial growth in the production of leather and leather goods in other developing regions.
Seizing global market opportunities in the leather sector is one of the key challenges for the African nations. By increasing its exports, the leather sector will bring a range of economic as well as social benefitstothecontinent.Sinceleatherisaby-productofthemeatindustry,thestartingpointofthesupply chain is linked to the animal husbandry and to the rural economies. Successful development of the leather industry will contribute to poverty reduction in rural areas. Also, leather is a labour-intensive industry and therefore an important source for employment generation.
In this context, it may be stated that India is well-positioned as a partner to improve the productive and export capacities of African partner countries. With the growing importance of South-South cooperation, India’s expertise in the leather sector can be leveraged by the African countries to build trade capacities.
The UK based Department for International Development (DFID) mandated the International Trade Centre(ITC),Genevatodesignandimplementaproject,called‘SupportingIndia’sTradePreferencesfor Africa’ (SITA). Exim Bank of India is a partner to the ITC in implementing the SITA project, and promoting Indian engagements in East Africa. The ITC’s SITA project is aimed at building business partnershipsandfillingIndiandemandforgoodsandservicesbytappingthecapacityofEastAfricancountries – namely Ethiopia, Kenya, Rwanda, Uganda and Tanzania. The project focusses on promoting exports from these East African countries to India through investment and skills transfer fromIndia.Leathersectorisalsooneoftheidentifiedsectorsforcooperationbetweenthetworegions.As part of the SITA project, Indian companies will be keen to share know-how, technology and quality standards.
EconomicPartnership(RCEP).UnderRCEP,the10-member ASEAN trade bloc has come together withsixothercountriesintheAsia-Pacificregion,viz. Japan, South Korea, China, India, Australia and New Zealand. These 16 countries together are home to 3 billion people having a combined GDP of about US$ 21.8 trillion. Another megaagreement that may also possibly be signed is the TransAtlanticTradeandInvestmentPartnership(TTIP)AgreementbetweentheEUandtheUSA.There is a large consensus that these mega-trade agreements are poised to change the landscape
of global value chain and the business interests across the world.
Amidst all these mega trade agreements, it becomes important for the leather manufacturers in India to identify suitable overseas opportunities to set their production base. Although India is not apartofthealreadysignedTPP,itisanegotiatingmemberoftheRCEP.Sincetheleatherindustryin India is largely dominated by SMEs, devising a strategy to be prepared for any such trade diversion as a result of these agreements is of utmost importance.
Export-Import Bank of India 75
Indian Leather Industry: Perspective and Strategies
For example, Indian leather manufacturers could explore opportunities and re-evaluate their strategies to base their operations in Vietnam which would help the Indian entities in reaping the benefits of an emerging middle-incomeVietnamese market. At the same time, it would enable Indian entities to also take advantage of the first mover effect to gain greater marketaccess. Leather exports from Vietnam have increased at a CAGR of 21.3% from US$ 4.8 bn in 2009 to US$ 10.4 bn in 2013, with the US alone occupying almost one-third of Vietnamese leather exports. Currently, Vietnam serves about 11% of USA’s import demand of leather, while India’s share in USA’s leather import demand remains at just2%.PuttingupaproductionbaseinVietnamwould help Indian manufacturers to access a much wider market with almost nil or concessional importdutiesofferedunder theTPP.Thiswouldresult in increasing India’s share in the world’s largest leather import market.
INTRODucING GLOBAL QuALITy sTANDARDs
In order to increase its share in international market, India needs to enhance and develop requisite infrastructure to produce leather products while abiding by international quality standards. American Society for Testing and Material (ASTM) International’s leather standards are instrumental in the determination, testing, and evaluation of the various physical and chemical properties of different forms of leather. A list of these standards is available on ASTM’s website. These standards help the users and producers of leather goods all over the world in assessing their materials for good quality and workmanship towards satisfactory use.
To cite an example, the Turkish Government has undertaken a project called ‘Turquality’, an accreditation system for the product groups with brand potential to upgrade the perception of products made in Turkey. The Turquality programme mainly consists of two complementing activities. On the one side, there was the development of a quality manual and accreditation scheme which defined the quality standardswhich applicants will be required to meet in order to be accepted in the programme and for use of the Turquality logo and brand. On the other side, an articulated auditing programme was being implemented with the aim to “benchmark” Turkish companies with international best practices. The aim was a national branding strategy, to bring world class standards and best practices to Turkish industries, to brand Turkey itself, so the perception can be created on a global scale. The TurqualityProgrammeseekstoimprovetheimageand respectability of Turkish products generally through subjecting applicants to quality assurance evaluations. In the event applicants receive the coveted Turquality logo, the Turkish government provides subsidies of up to US$ 5,00,000 for marketing and distribution; and US$ 3,00,000 for design and development. As at the end of 2014, 111 brands from 100 different companies had received Turquality support, whereas 55 brands from 54 different companies benefited from theBrandingProgram.
The Government of India on its part could introduce a similar scheme to incentivise Indian leatherunitstoabidebytheidentifiedinternationalaccreditations which will help build a brand image for the Indian leather goods. In the event firmsreceive the accreditation, the government could provide subsidies of up to Rs. 5 crore for marketing
Export-Import Bank of India76
Indian Leather Industry: Perspective and Strategies
and distribution and for technology upgradation and R&D.
Since a large segment of the leather industry falls under MSMEs, the possible creation of an organization mandated for promotion of brands, dissemination of information and assistance to MSMEscanalsobeconsideredor theOfficeofthe Commissioner of MSMEs may be entrusted with the job.
BRANDING
Consequent to India emerging as a manufacturing destination in view of competitive advantages, and also considering that India has a huge domestic market in the footwear and leather products due togrowthinaffluencelevelsofconsumers,thereis a need to focus on the concept of branding of the Indian leather sector. This is critical given that there are hardly any well known Indian leather brands in the international market.
The Government could create an ‘Indian Leather’ mark with the objective of improving the image and respectability of Indian leather and leather products, generally through subjecting applicants to quality assurance evaluations. An ‘Indian Leather’ mark awarded to domestic companies based on their performance and standing across pre-definedcriteriasuchascapacity,technology,manufacturing excellence, packaging, sales and customer satisfaction will help them aim for improvement across all work areas ultimately resulting in better end product for the consumers, thereby making Indian products more competitive in the domestic as well as international market. International markets would then recognize the standardization process that India would have adopted and start sourcing from these domestic
companies thereby boosting exports in the long run.
TEchNOLOGy uPGRADATION AND MODERNIzATION OF TANNERIEs
Tanneries have remained a cause of concern in the value chain of leather industry. Efforts need to be aligned so as to upgrade the technology and modernize tanneries, improve the production environment of the tanneries including housekeeping and safety so that the health of the tannery workers is ensured. This would also help to attract the new generation manpower to tanneries which is increasingly becoming a major challenge.
Areas requiring technology interventions include water and energy saving, better utilization of raw materials resources, having eco-friendly leather, etc. It may be noted that the ‘Integrated Development of Leather Sector’ (IDLS) scheme implemented during the Tenth and Eleventh Five YearPlan period haswidely been successful inenabling the tanning sector to modernize and upgrade the technologies.
cOsT sTRucTuRE
Cost structure encompasses all the expenses that afirmmusttakeintoaccountwhilemanufacturingand selling a product. Margins can be improved either by increasing sales prices or reducing costs. Most of the countries including India have not been able to achieve absolute competitiveness with respect to cost structure. Furthermore, since most of the big leather clusters in India like Kanpur, Agra, and Delhi etc. are landlocked regions, transportation and logistics cost is higher in these areas especially for exports, thereby adversely impacting their competitiveness.
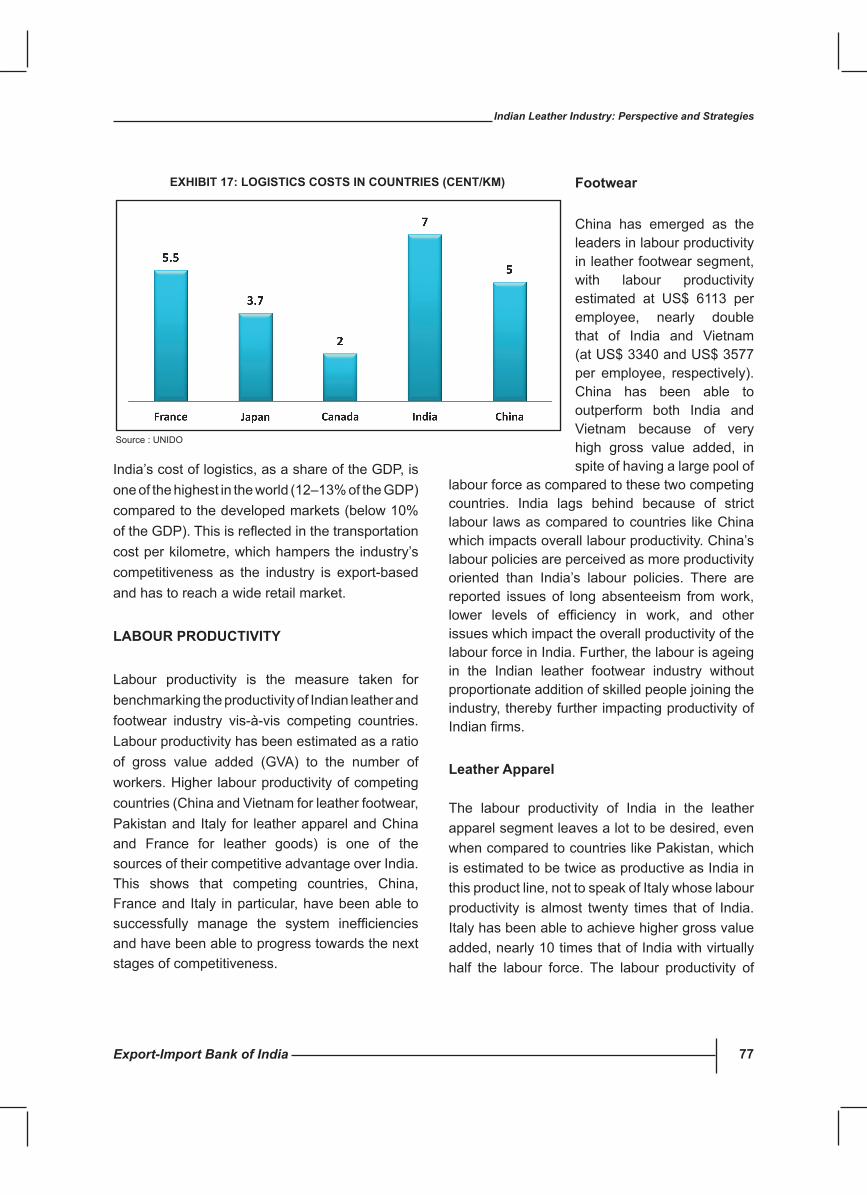
Export-Import Bank of India 77
Indian Leather Industry: Perspective and Strategies
India’scostoflogistics,asashareoftheGDP,isoneofthehighestintheworld(12–13%oftheGDP)compared to the developed markets (below 10% oftheGDP).Thisisreflectedinthetransportationcost per kilometre, which hampers the industry’s competitiveness as the industry is export-based and has to reach a wide retail market.
LABOuR PRODucTIvITy
Labour productivity is the measure taken for benchmarking the productivity of Indian leather and footwear industry vis-à-vis competing countries. Labour productivity has been estimated as a ratio of gross value added (GVA) to the number of workers. Higher labour productivity of competing countries (China and Vietnam for leather footwear, Pakistanand Italy for leather apparel and China and France for leather goods) is one of the sources of their competitive advantage over India. This shows that competing countries, China, France and Italy in particular, have been able to successfully manage the system inefficienciesand have been able to progress towards the next stages of competitiveness.
Footwear
China has emerged as the leaders in labour productivity in leather footwear segment, with labour productivity estimated at US$ 6113 per employee, nearly double that of India and Vietnam (at US$ 3340 and US$ 3577 per employee, respectively). China has been able to outperform both India and Vietnam because of very high gross value added, in spite of having a large pool of
labour force as compared to these two competing countries. India lags behind because of strict labour laws as compared to countries like China which impacts overall labour productivity. China’s labour policies are perceived as more productivity oriented than India’s labour policies. There are reported issues of long absenteeism from work, lower levels of efficiency in work, and otherissues which impact the overall productivity of the labour force in India. Further, the labour is ageing in the Indian leather footwear industry without proportionate addition of skilled people joining the industry, thereby further impacting productivity of Indianfirms.
Leather Apparel
The labour productivity of India in the leather apparel segment leaves a lot to be desired, even whencomparedtocountrieslikePakistan,whichis estimated to be twice as productive as India in this product line, not to speak of Italy whose labour productivity is almost twenty times that of India. Italy has been able to achieve higher gross value added, nearly 10 times that of India with virtually half the labour force. The labour productivity of
EXhIBIT 17: LOGIsTIcs cOsTs IN cOuNTRIEs (cENT/KM)
Source : UNIDO
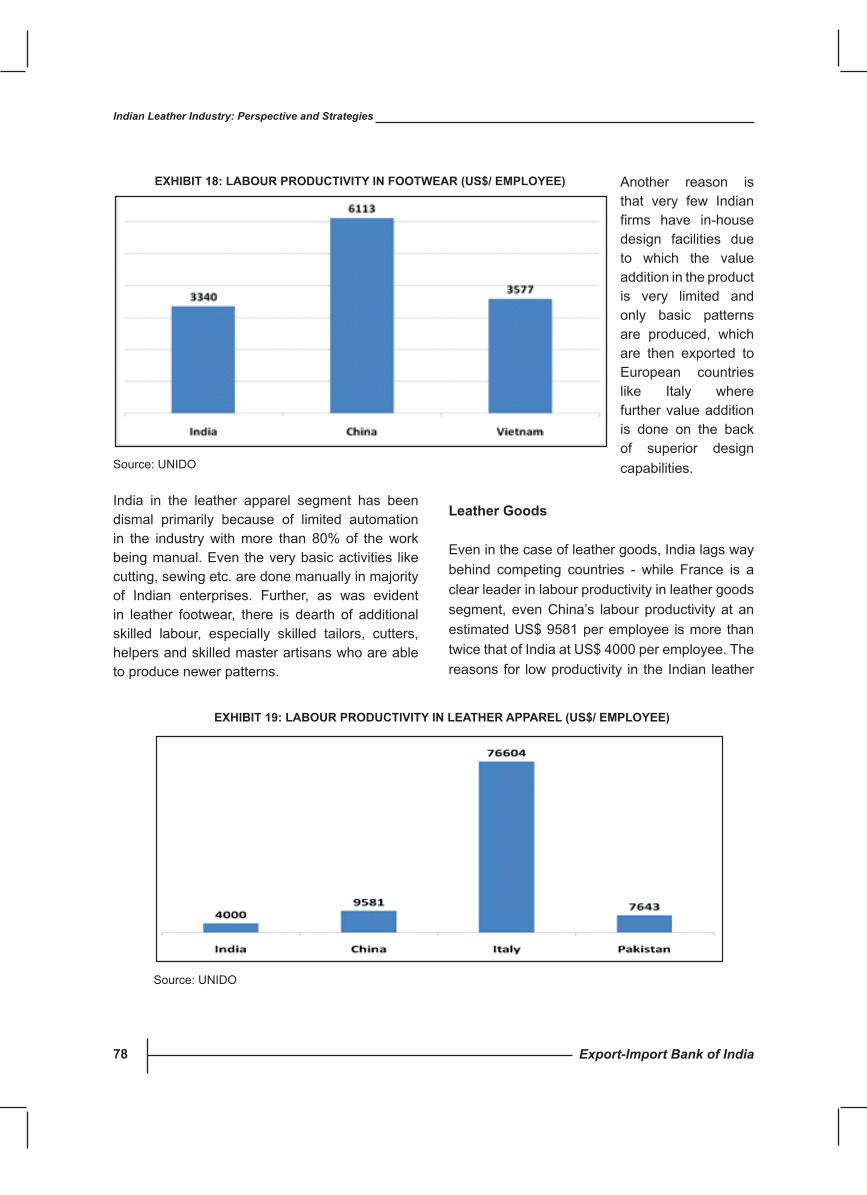
Export-Import Bank of India78
Indian Leather Industry: Perspective and Strategies
India in the leather apparel segment has been dismal primarily because of limited automation in the industry with more than 80% of the work being manual. Even the very basic activities like cutting, sewing etc. are done manually in majority of Indian enterprises. Further, as was evident in leather footwear, there is dearth of additional skilled labour, especially skilled tailors, cutters, helpers and skilled master artisans who are able to produce newer patterns.
Another reason is that very few Indian firms have in-housedesign facilities due to which the value addition in the product is very limited and only basic patterns are produced, which are then exported to European countries like Italy where further value addition is done on the back of superior design capabilities.
Leather Goods
Even in the case of leather goods, India lags way behind competing countries - while France is a clear leader in labour productivity in leather goods segment, even China’s labour productivity at an estimated US$ 9581 per employee is more than twice that of India at US$ 4000 per employee. The reasons for low productivity in the Indian leather
Source: UNIDO
EXhIBIT 18: LABOuR PRODucTIvITy IN FOOTWEAR (us$/ EMPLOyEE)
EXhIBIT 19: LABOuR PRODucTIvITy IN LEAThER APPAREL (us$/ EMPLOyEE)
Source: UNIDO
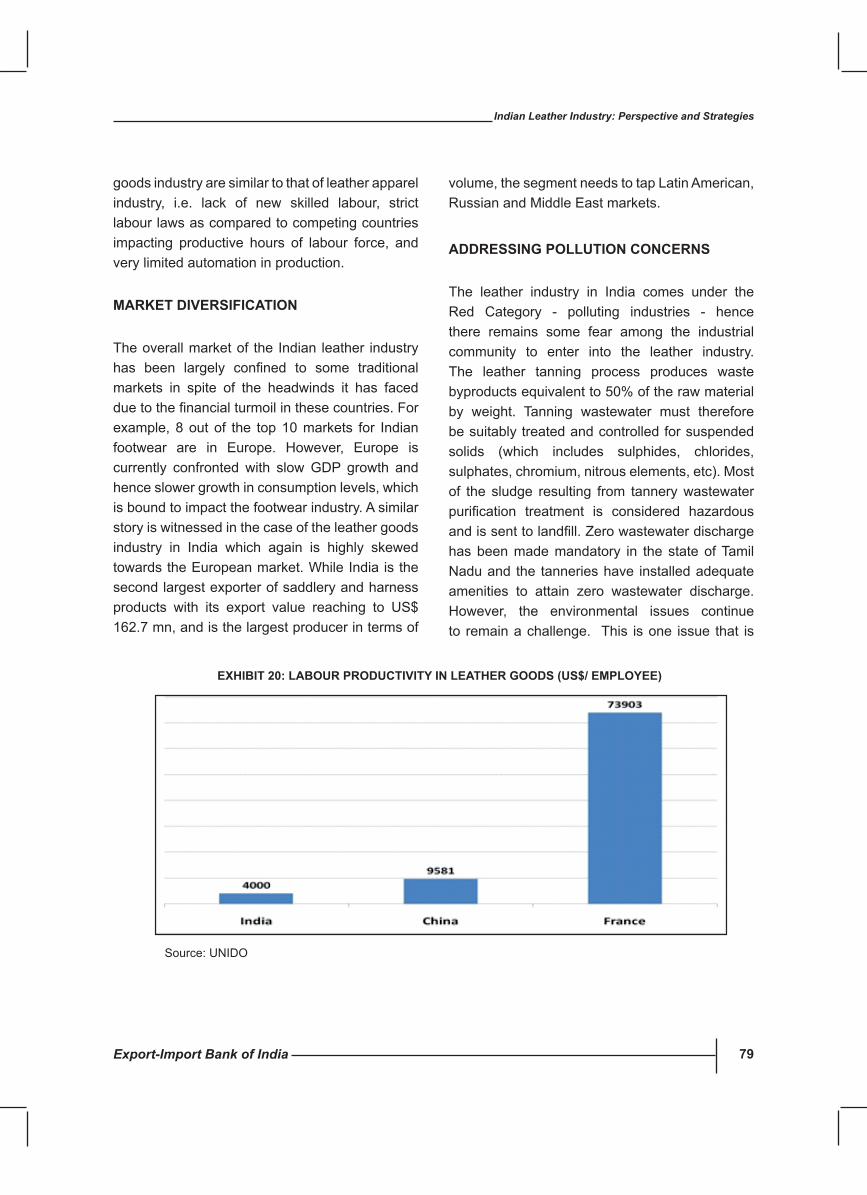
Export-Import Bank of India 79
Indian Leather Industry: Perspective and Strategies
goods industry are similar to that of leather apparel industry, i.e. lack of new skilled labour, strict labour laws as compared to competing countries impacting productive hours of labour force, and very limited automation in production.
MARKET DIvERsIFIcATION
The overall market of the Indian leather industry has been largely confined to some traditionalmarkets in spite of the headwinds it has faced duetothefinancialturmoilinthesecountries.Forexample, 8 out of the top 10 markets for Indian footwear are in Europe. However, Europe is currently confronted with slowGDP growth andhence slower growth in consumption levels, which is bound to impact the footwear industry. A similar story is witnessed in the case of the leather goods industry in India which again is highly skewed towards the European market. While India is the second largest exporter of saddlery and harness products with its export value reaching to US$ 162.7 mn, and is the largest producer in terms of
volume, the segment needs to tap Latin American, Russian and Middle East markets.
ADDREssING POLLuTION cONcERNs
The leather industry in India comes under the Red Category - polluting industries - hence there remains some fear among the industrial community to enter into the leather industry. The leather tanning process produces waste byproducts equivalent to 50% of the raw material by weight. Tanning wastewater must therefore be suitably treated and controlled for suspended solids (which includes sulphides, chlorides, sulphates, chromium, nitrous elements, etc). Most of the sludge resulting from tannery wastewater purification treatment is considered hazardousandissenttolandfill.Zerowastewaterdischargehas been made mandatory in the state of Tamil Nadu and the tanneries have installed adequate amenities to attain zero wastewater discharge. However, the environmental issues continue to remain a challenge. This is one issue that is
Source: UNIDO
EXhIBIT 20: LABOuR PRODucTIvITy IN LEAThER GOODs (us$/ EMPLOyEE)
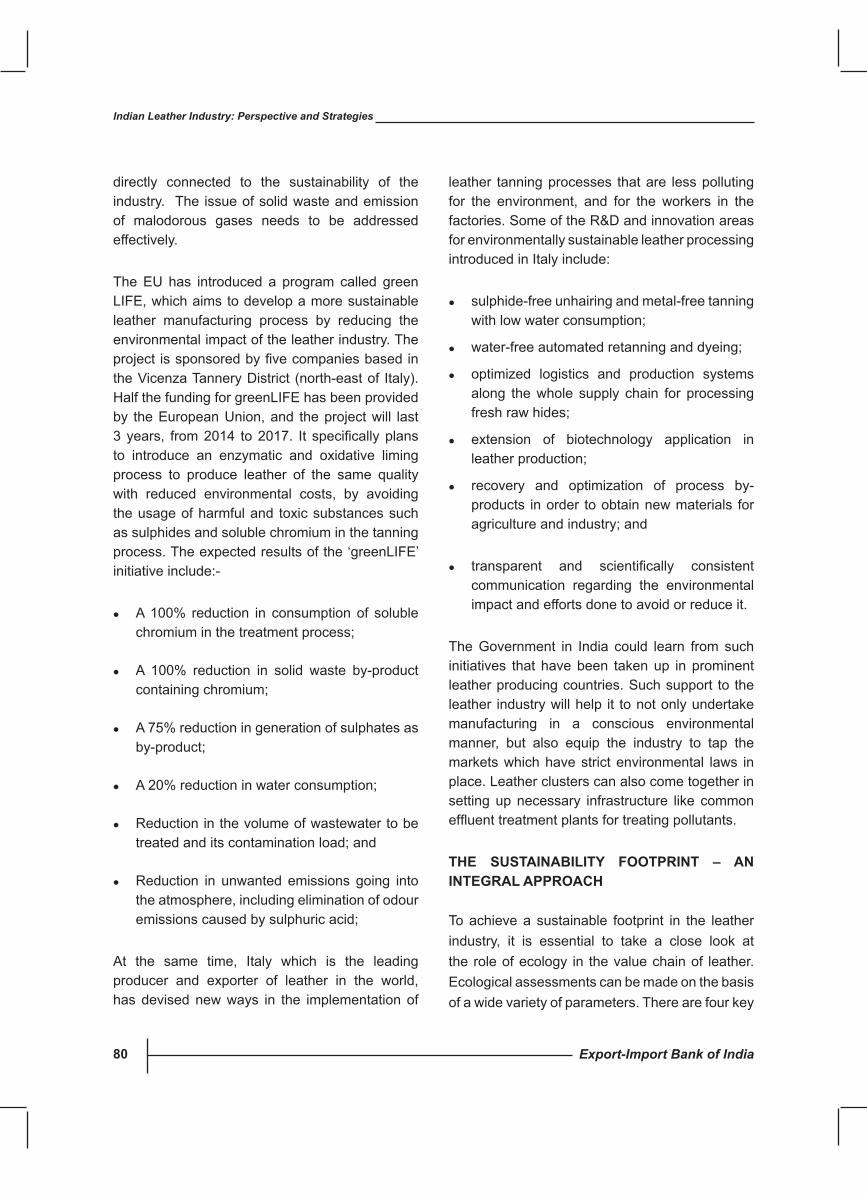
Export-Import Bank of India80
Indian Leather Industry: Perspective and Strategies
directly connected to the sustainability of the industry. The issue of solid waste and emission of malodorous gases needs to be addressed effectively.
The EU has introduced a program called green LIFE, which aims to develop a more sustainable leather manufacturing process by reducing the environmental impact of the leather industry. The project issponsoredbyfivecompaniesbasedinthe Vicenza Tannery District (north-east of Italy). Half the funding for greenLIFE has been provided by the European Union, and the project will last 3years, from2014 to2017. It specificallyplansto introduce an enzymatic and oxidative liming process to produce leather of the same quality with reduced environmental costs, by avoiding the usage of harmful and toxic substances such as sulphides and soluble chromium in the tanning process. The expected results of the ‘greenLIFE’ initiative include:-
l A 100% reduction in consumption of soluble chromium in the treatment process;
l A 100% reduction in solid waste by-product containing chromium;
l A 75% reduction in generation of sulphates as by-product;
l A 20% reduction in water consumption;
l Reduction in the volume of wastewater to be treated and its contamination load; and
l Reduction in unwanted emissions going into the atmosphere, including elimination of odour emissions caused by sulphuric acid;
At the same time, Italy which is the leading producer and exporter of leather in the world, has devised new ways in the implementation of
leather tanning processes that are less polluting for the environment, and for the workers in the factories. Some of the R&D and innovation areas for environmentally sustainable leather processing introduced in Italy include:
l sulphide-free unhairing and metal-free tanning with low water consumption;
l water-free automated retanning and dyeing;
l optimized logistics and production systems along the whole supply chain for processing fresh raw hides;
l extension of biotechnology application in leather production;
l recovery and optimization of process by-products in order to obtain new materials for agriculture and industry; and
l transparent and scientifically consistentcommunication regarding the environmental impact and efforts done to avoid or reduce it.
The Government in India could learn from such initiatives that have been taken up in prominent leather producing countries. Such support to the leather industry will help it to not only undertake manufacturing in a conscious environmental manner, but also equip the industry to tap the markets which have strict environmental laws in place. Leather clusters can also come together in setting up necessary infrastructure like common effluenttreatmentplantsfortreatingpollutants.
ThE susTAINABILITy FOOTPRINT – AN INTEGRAL APPROAch
To achieve a sustainable footprint in the leather industry, it is essential to take a close look at the role of ecology in the value chain of leather. Ecological assessments can be made on the basis of a wide variety of parameters. There are four key
Export-Import Bank of India 81
Indian Leather Industry: Perspective and Strategies
elements in the production of leather that should be grouped together to provide a sustainable footprint concept, viz. carbon, water, resources and toxicological footprint.
The carbon Footprint: Carbon footprinting has appeared as a strong and popular indicator of the greenhouse gas intensity of any activity or organization. A methodology is required to address the emissions associated with the leather industry, where there is a strong need of assessment in order to evaluate and take action towards the reduction of impact over the environment. It is estimated that alternative solutions in tanning could reduce carbon footprint by as much as 15%.
The Water Footprint: This will continue to grow in importance in the coming years because the efficientuseofwaterisoneofthekeychallengesof this century. The water that is used as a solvent in the production of leather is a scarce resource, and it is becoming increasingly more expensive in termsofbothconsumptionandeffluenttreatment.The pressure is on innovation for new technologies and chemicals in order to provide more water - efficientprocessesfortheproductionofleather.
The Resource Footprint: This covers many aspects as it touches on different resources employed in the leather production. However, it needs to be recognised that the raw stock is the single most important and valuable resource in the production of leather. Every attempt to increase the value added by upgrading low-quality leather, eliminating waste in the cutting of patterns, reducing waste products, or lowering the costs oftanneriesresultsinanimmediatebenefit.Theresourcefootprintalsocoverstheefficientuseofchemicals based on regenerative raw materials and optimised production processes in tanneries, including, for example, lower energy consumption.
This is another example of the cradle-to-cradle approach because leather needs to be capable of being recycled or completely biodegraded in order to ensure that it can be disposed of in a sustainable way.
The Toxicological Footprint: This is another aspect of leather production that is frequently discussed. One example is the on-going discussion concerning Cr (VI) (chromium) or NMP(N-Methylpyrrolidone)inthevaluechainandfinalproduct.Thetoxicologicalfootprintaddressesthe use of harmful substances in the production of leather, the restricted substance list, the management and handling of harmful substances, legal requirements, the demands of specificindustries/brands, as well as product and process safety. The aim of the toxicological footprint is to minimise the levels of harmful substances used in the production of leather and ideally to eliminate them. Current discussions include the ZDHC (Zero Discharge of Hazardous Chemicals) campaign initiated by select companies and the new VOC (Volatile Organic Compounds) regulations that apply to automotive leather in China.
ADOPTION OF WAsTE TO WEALTh APPROAch
Whenever there is industrial slaughtering, animal skins will be available as a by-product. Less than 2%ofanimalsintheworldarefarmedspecifically for their skin to produce luxury goods. With no formal data available, and with low technology usage in leather industry in India, the situation possibly remains the same for India also. Regardless of the leather used as by-products from the production of meat, the need is to evaluate if there is an alternative use for animal skin generated from this industrial production. Currently, animal skin which does not go into the leather production endsupin incinerationor landfill, which reduces
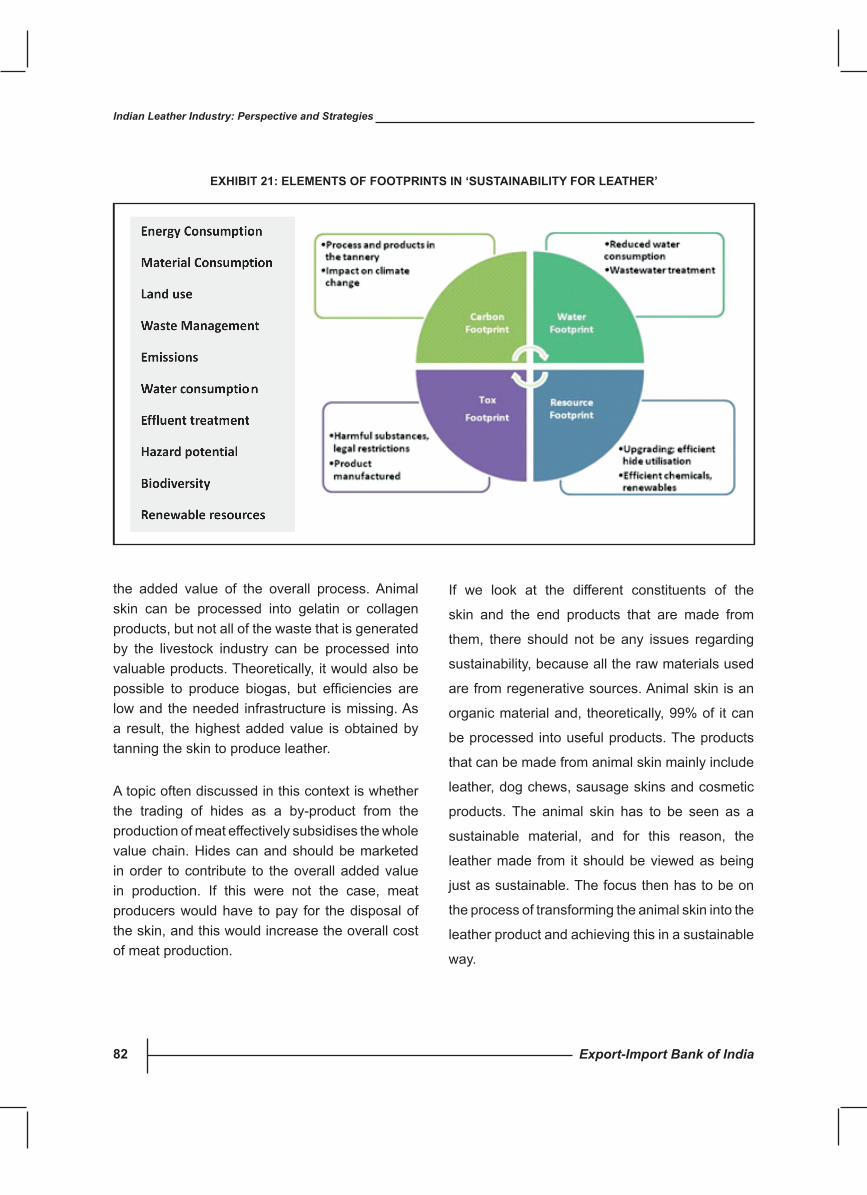
Export-Import Bank of India82
Indian Leather Industry: Perspective and Strategies
the added value of the overall process. Animal skin can be processed into gelatin or collagen products, but not all of the waste that is generated by the livestock industry can be processed into valuable products. Theoretically, it would also be possible to produce biogas, but efficiencies arelow and the needed infrastructure is missing. As a result, the highest added value is obtained by tanning the skin to produce leather.
A topic often discussed in this context is whether the trading of hides as a by-product from the production of meat effectively subsidises the whole value chain. Hides can and should be marketed in order to contribute to the overall added value in production. If this were not the case, meat producers would have to pay for the disposal of the skin, and this would increase the overall cost of meat production.
If we look at the different constituents of the
skin and the end products that are made from
them, there should not be any issues regarding
sustainability, because all the raw materials used
are from regenerative sources. Animal skin is an
organic material and, theoretically, 99% of it can
be processed into useful products. The products
that can be made from animal skin mainly include
leather, dog chews, sausage skins and cosmetic
products. The animal skin has to be seen as a
sustainable material, and for this reason, the
leather made from it should be viewed as being
just as sustainable. The focus then has to be on
the process of transforming the animal skin into the
leather product and achieving this in a sustainable
way.
EXhIBIT 21: ELEMENTs OF FOOTPRINTs IN ‘susTAINABILITy FOR LEAThER’
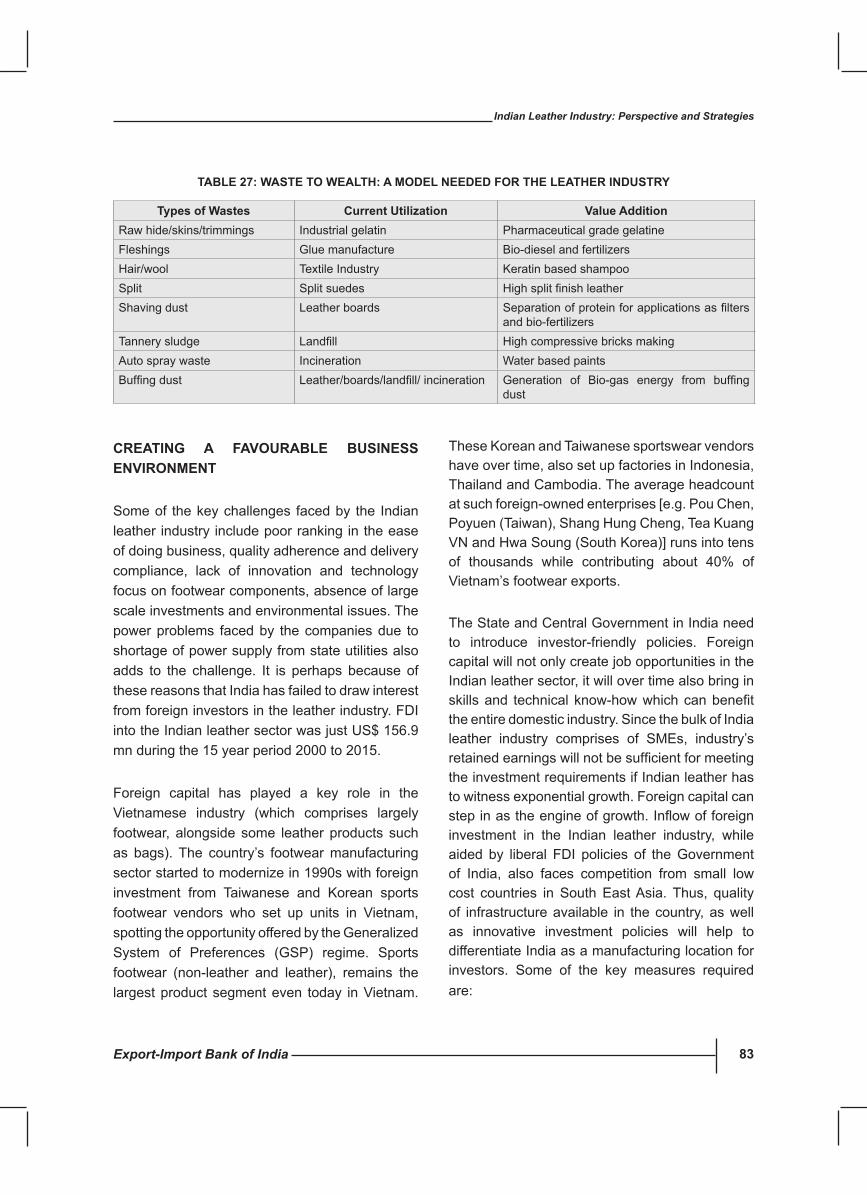
Export-Import Bank of India 83
Indian Leather Industry: Perspective and Strategies
cREATING A FAvOuRABLE BusINEss ENvIRONMENT
Some of the key challenges faced by the Indian leather industry include poor ranking in the ease of doing business, quality adherence and delivery compliance, lack of innovation and technology focus on footwear components, absence of large scale investments and environmental issues. The power problems faced by the companies due to shortage of power supply from state utilities also adds to the challenge. It is perhaps because of these reasons that India has failed to draw interest from foreign investors in the leather industry. FDI into the Indian leather sector was just US$ 156.9 mn during the 15 year period 2000 to 2015.
Foreign capital has played a key role in the Vietnamese industry (which comprises largely footwear, alongside some leather products such as bags). The country’s footwear manufacturing sector started to modernize in 1990s with foreign investment from Taiwanese and Korean sports footwear vendors who set up units in Vietnam, spotting the opportunity offered by the Generalized System of Preferences (GSP) regime. Sportsfootwear (non-leather and leather), remains the largest product segment even today in Vietnam.
These Korean and Taiwanese sportswear vendors have over time, also set up factories in Indonesia, Thailand and Cambodia. The average headcount atsuchforeign-ownedenterprises[e.g.PouChen,Poyuen(Taiwan),ShangHungCheng,TeaKuangVN and Hwa Soung (South Korea)] runs into tens of thousands while contributing about 40% of Vietnam’s footwear exports.
The State and Central Government in India need to introduce investor-friendly policies. Foreign capital will not only create job opportunities in the Indian leather sector, it will over time also bring in skillsand technical know-howwhichcanbenefitthe entire domestic industry. Since the bulk of India leather industry comprises of SMEs, industry’s retainedearningswillnotbesufficientformeetingthe investment requirements if Indian leather has to witness exponential growth. Foreign capital can stepinastheengineofgrowth.Inflowofforeigninvestment in the Indian leather industry, while aided by liberal FDI policies of the Government of India, also faces competition from small low cost countries in South East Asia. Thus, quality of infrastructure available in the country, as well as innovative investment policies will help to differentiate India as a manufacturing location for investors. Some of the key measures required are:
TABLE 27: WAsTE TO WEALTh: A MODEL NEEDED FOR ThE LEAThER INDusTRy
Types of Wastes current utilization value AdditionRaw hide/skins/trimmings Industrial gelatin PharmaceuticalgradegelatineFleshings Glue manufacture Bio-diesel and fertilizersHair/wool Textile Industry Keratin based shampooSplit Split suedes HighsplitfinishleatherShaving dust Leather boards Separationofproteinforapplicationsasfilters
and bio-fertilizersTannery sludge Landfill High compressive bricks makingAuto spray waste Incineration Water based paintsBuffingdust Leather/boards/landfill/incineration Generation of Bio-gas energy from buffing
dust
Export-Import Bank of India84
Indian Leather Industry: Perspective and Strategies
Introducing special package for the international companies to set-up units in India, and even possibly help in developing new leather clusters.
A single widow clearance for land acquisition and all statutory compliance for all sectors, including leather.
Various leather associations in India along with the Council for Leather Exports and the Government should organize road shows in target markets.
Engage actively with US Organizations like FDRA (Footwear Distributors and Retailers of America) and large corporations to include India as a strategic sourcing partner.
MOvING TOWARDs vERIFIED cERTIFI-cATIONs
EversincesustainabilitywasfirstdefinedbytheUN Brundtland Commission, it has been one of the key topics in social and industrial development, and it has become one of the key growth factors for the world economy. No industry, including the leather industry and its value chain, can isolate itself from the concepts of sustainability.
A World Bank’s Enterprise Survey of leather showsIndia(only7%ofthefirmssurveyedhavequality accreditations) has performed poorly in comparisontoVietnam(35%ofthefirmssurveyedhavequalityaccreditations)andPakistan(28%ofthe firms surveyed have quality accreditations),both of which have more number of firmshaving accreditations such as ISO (International Organization for Standardization), NEQS (National Environmental Quality Standards), etc. MostofthefirmsacrosstheglobeincludingIndiahave limited knowledge and awareness of the
quality standards that are to be followed to be competitive in the international markets. Further, there are many quality standards being enforced by European markets like REACH (Regulation on Registration, Evaluation, Authorisation and Restriction of Chemicals) for chemicals used in the leather tanning process, which need to be followed by companies in order to supply to these markets. In China, for instance, the Ministry of Industry and Information Technology introduced a group of newly approved standards for 359 industrial sectors, including 20 standards for the leather industry. These new standards are introduced for the purpose of industrial contamination control and reassurance of products’ quality. These standards have already been applied since 1st April, 2011.
Leather manufacturers who produce environmentally sound products are expected to enjoy a competitive advantage. The manufacturers have to successfully emphasize the environmental soundness of the product in the information to the buyers since major attention is being paid to the increasing role of the environment regulations. Therefore, the manufacturers have to view their products and production processes not just by looking at traditional aspects like price, quality, customer demands etc. but also at the environment. Environmentally sound production, consequently, opens new market opportunities.
At the same time, because the tanning industry needs natural resources, chemical products and energy, environmental sustainability becomes a fundamental aspect of leather production. Companies strongly committed to ecological principles should be a norm in the industry in order to ensure long-term economic, environmental and social sustainability. The tanneries’ commitment to environmentalsustainabilitycanbeconfirmedbysomeimportantinternationalproductcertificationsassumed on a voluntary basis. Some of the most prevalent ones in Europe are:
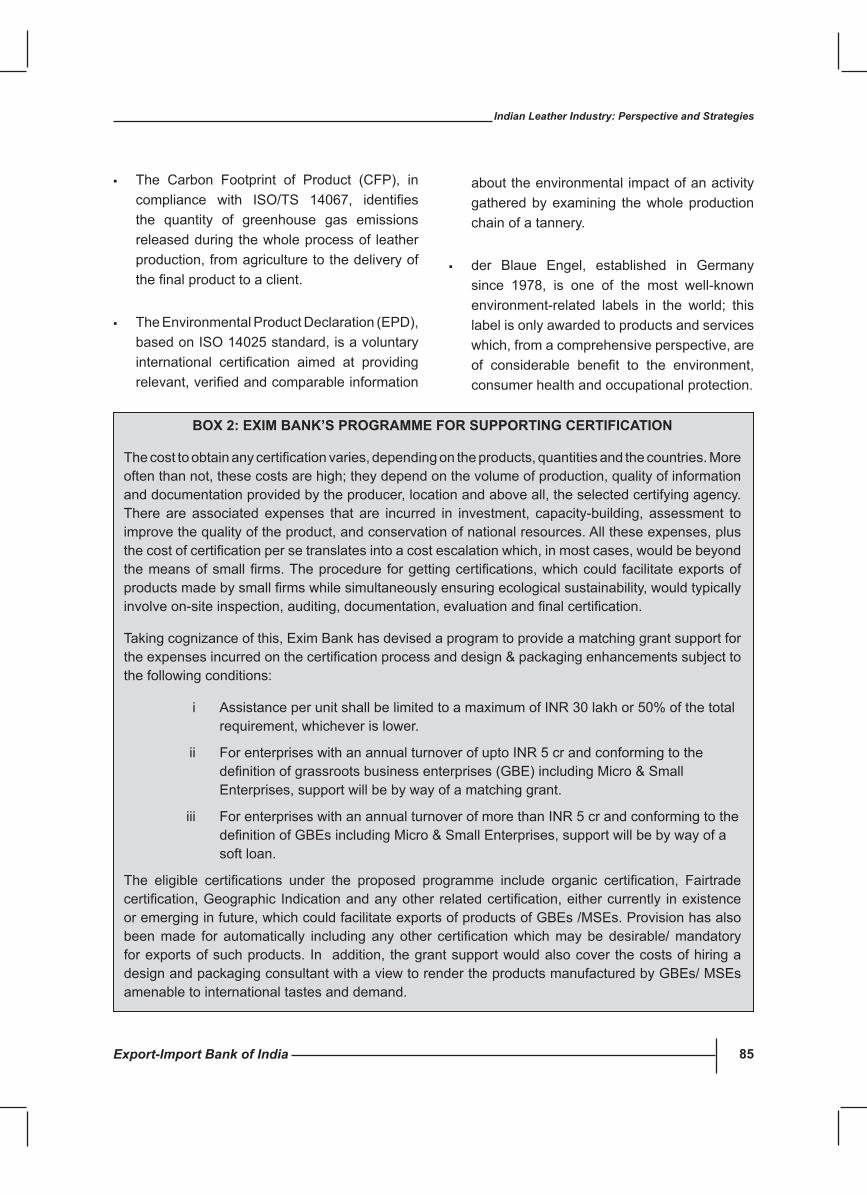
Export-Import Bank of India 85
Indian Leather Industry: Perspective and Strategies
The Carbon Footprint of Product (CFP), incompliance with ISO/TS 14067, identifiesthe quantity of greenhouse gas emissions released during the whole process of leather production, from agriculture to the delivery of thefinalproducttoaclient.
TheEnvironmentalProductDeclaration(EPD),based on ISO 14025 standard, is a voluntary international certification aimed at providingrelevant,verifiedandcomparableinformation
about the environmental impact of an activity gathered by examining the whole production chain of a tannery.
der Blaue Engel, established in Germany since 1978, is one of the most well-known environment-related labels in the world; this label is only awarded to products and services which, from a comprehensive perspective, are of considerable benefit to the environment,consumer health and occupational protection.
BOX 2: EXIM BANK’s PROGRAMME FOR suPPORTING cERTIFIcATION
Thecosttoobtainanycertificationvaries,dependingontheproducts,quantitiesandthecountries.Moreoften than not, these costs are high; they depend on the volume of production, quality of information and documentation provided by the producer, location and above all, the selected certifying agency. There are associated expenses that are incurred in investment, capacity-building, assessment to improve the quality of the product, and conservation of national resources. All these expenses, plus thecostofcertificationpersetranslatesintoacostescalationwhich,inmostcases,wouldbebeyondthemeansofsmallfirms.Theprocedureforgettingcertifications,whichcould facilitateexportsofproductsmadebysmallfirmswhilesimultaneouslyensuringecologicalsustainability,wouldtypicallyinvolveon-siteinspection,auditing,documentation,evaluationandfinalcertification.
Taking cognizance of this, Exim Bank has devised a program to provide a matching grant support for theexpensesincurredonthecertificationprocessanddesign&packagingenhancementssubjecttothe following conditions:
i Assistance per unit shall be limited to a maximum of INR 30 lakh or 50% of the total requirement, whichever is lower.
ii For enterprises with an annual turnover of upto INR 5 cr and conforming to the definitionofgrassrootsbusinessenterprises(GBE)includingMicro&SmallEnterprises, support will be by way of a matching grant.
iii For enterprises with an annual turnover of more than INR 5 cr and conforming to the definitionofGBEsincludingMicro&SmallEnterprises,supportwillbebywayofasoft loan.
The eligible certifications under the proposed programme include organic certification, Fairtradecertification,Geographic Indicationandanyotherrelatedcertification,eithercurrently inexistenceoremerginginfuture,whichcouldfacilitateexportsofproductsofGBEs/MSEs.Provisionhasalsobeenmade for automatically includinganyother certificationwhichmaybedesirable/mandatoryfor exports of such products. In addition, the grant support would also cover the costs of hiring a design and packaging consultant with a view to render the products manufactured by GBEs/ MSEs amenable to international tastes and demand.
YANGON
5th Floor, 35, King Street, London - EC2V 8BB, United Kingdom.Phone: (44) 20 77969040 Fax: (44) 20 76000936 E-mail: [email protected]


![LANDING TEAM DOCUMENT EXIM IN TRANSITIONaltgov2.org/wp-content/uploads/EXIM_transition.pdfEXIM Bank Scoring Table [1] Offsetting Receipts represent EXIM Bank's earned profit after](https://static.fdocuments.net/doc/165x107/5f6f5d8e7c3aeb62247642e1/landing-team-document-exim-in-exim-bank-scoring-table-1-offsetting-receipts-represent.jpg)
