
ABORATORY PERFORMANCE RESULTS
46
EMERGING TECHNOLOGIES LABORATORY PERFORMANCE RESULTS: INDIRECT EVAPORATIVE AIR CONDITIONING & CONDENSER PRE- COOLING AS CLIMATE APPROPRIATE RETROFITS FOR PACKAGED ROOFTOP UNITS Prepared by: Curtis Harrington and Jonathan Woolley Western Cooling Efficiency Center University of California, Davis Robert Davis Applied Technology Services Pacific Gas & Electric Company For: New Program Development & Launch Customer Programs and Services Southern California Edison April 30, 2015
Transcript of ABORATORY PERFORMANCE RESULTS
EMERGING TECHNOLOGIES
LABORATORY PERFORMANCE RESULTS: INDIRECT EVAPORATIVE AIR CONDITIONING & CONDENSER PRE-COOLING AS CLIMATE APPROPRIATE RETROFITS FOR PACKAGED ROOFTOP UNITS
Prepared by:
Curtis Harrington and Jonathan Woolley Western Cooling Efficiency Center University of California, Davis
Robert Davis Applied Technology Services Pacific Gas & Electric Company
For:
New Program Development & Launch Customer Programs and Services Southern California Edison
April 30, 2015

Southern California Edison Page i
Customer Programs & Services April 2015
EXECUTIVE SUMMARY
BACKGROUND This report records results of a detailed laboratory evaluation of an indirect evaporative cooler and coupled to a rooftop packaged air conditioner (RTU) that was retrofit with a condenser air pre-cooler. The scheme reduces air conditioner compressor energy use in two main ways:
1. By reducing condenser inlet temperature and improving efficiency for the vapor compression cycle 2. By providing a substantial portion of the building cooling needs with indirect evaporative cooling
OBJECTIVES The primary goal for this project was to characterize energy efficiency of the retrofit package in all modes of operation, in all possible configurations, and across a full range of operating conditions. Laboratory test results were carefully analyzed to consider the technical opportunities and challenges related to the equipment and to identify opportunities for additional improvements to the technology. These results provide the basis for recommendations about how utility efficiency programs, design engineers, and customers might proceed to apply this type of technology for management of indoor environmental quality in commercial buildings while simultaneously reducing energy consumption and peak demand.
TECHNOLOGY REVIEW Indirect evaporative cooling and condenser air pre-cooling offers the ability to transform new or existing RTUs into climate appropriate equipment for hot dry climates. The IEC delivers a very efficient means to cool outside air for ventilation or even modest room cooling purposes while the condenser air pre-cooler can significantly improve the performance of the vapor compression cycle of the RTU. The equipment expands the number of operating modes significantly by allowing multiple combinations of IEC and compressor stages.
With this retrofit package comes the need to develop smart controls that can determine the most appropriate mode for a particular situation. Since the retrofit does not replace an existing powered component from the RTU there is the potential that this technology could increase the electrical demand compared to the baseline RTU while achieving much higher cooling efficiency and capacity. However, it could reduce the total electrical demand for a building if multiple units were outfitted with the retrofit to handle ventilation air allowing other existing units to run in recirculation mode or be disconnected all together.
RESULTS & RECOMMENDATIONS Analysis indicates that addition of the indirect evaporative and condenser pre-cooler systems could reduce annual energy consumption by nearly 60% over the baseline system. Efficiency for indirect evaporative cooling at peak conditions was observed at EER=38.7.
We strongly recommend that the technology be adopted by utility energy efficiency programs. We are particularly impressed by the promise of such substantial peak demand reduction from a single machine that can be straightforwardly integrated into either new or existing buildings. As is the case for most air conditioning technologies, we believe that some applications will be more well-suited than others, and suggest that programs adopting this technology be designed to avoid scenarios where overall energy performance is more limited. A simulation study should be conducted to assess the savings potential for target customers and to identify applications that ought to be avoided. This should happen in parallel with a first generation program that draws on customer smart meter data and limited field monitoring to assess the actual savings achieved by installation of the equipment.

Southern California Edison Page 1
Customer Programs & Services April 2015
ACKNOWLEDGEMENTS Southern California Edison’s New Program Development & Launch (NPD&L) group is responsible for this report. It was developed in cooperation with Pacific Gas & Electric Company, under Southern California Edison project number ET13SCE7090. The University of California, Davis Western Cooling Efficiency Center conducted this technology evaluation using laboratory measurements executed by Robert Davis at Pacific Gas & Electric Company Applied Technology Services.
The research team extends thanks to Seeley International for their collaboration in this project, for making equipment available for laboratory study, and for their leadership in advancing the development of very efficient climate appropriate commercial cooling solutions.
DISCLAIMER This report was prepared for Southern California Edison (SCE) and funded by California utility customers under the auspices of the California Public Utilities Commission. Reproduction or distribution of the whole or any part of the contents of this document without the express written permission of SCE is prohibited. This work was performed with reasonable care and in accordance with professional standards. However, neither SCE nor any entity performing the work pursuant to SCE’s authority make any warranty or representation, expressed or implied, with regard to this report, the merchantability or fitness for a particular purpose of the results of the work, or any analyses, or conclusions contained in this report.

Southern California Edison Page 2
Customer Programs & Services April 2015
ABBREVIATIONS AND ACRONYMS CEC California Energy Commission
COP Coefficient of Performance (dimensionless)
cp Specific Heat Capacity (e.g. Btu/lbm-°F)
CPUC California Public Utilities Commission
CX Concentration (of constituent X) (eg. ppm)
DX Direct Expansion Vapor Compression
ε Sensible Heat Exchanger Effectiveness (dimensionless)
�̇�𝐸 Electric Power, (Rate of Electric Energy Consumption) (e.g. kW)
EA Exhaust Air
�̇�𝐻 Cooling Capacity, (Enthalpy Flow Rate) (e.g. kBtu/h)
ℎ Specific Enthalpy (e.g. Btu/lbm-dryair)
HR Humidity Ratio (e.g. lbmwater/lbmdryair)
IEC Indirect Evaporative Air Conditioner (Indirect Evaporative Cooling)
�̇�𝑚 Mass Flow Rate (e.g. lbm/h)
OSA Outside Air
ΔP Differential Static Pressure (e.g. inWC)
RA Return Air
RH Relative Humidity (%)
RTU Rooftop Packaged Air Conditioning Unit
SA Supply Air
SCE Southern California Edison
T Temperature (e.g. °F)
�̇�𝑉 Volume Flow Rate (e.g. scfm)
WBE Wet Bulb Effectiveness

Southern California Edison Page 3
Customer Programs & Services April 2015
FIGURES FIGURE 1. CONCEPTUAL SCHEMATIC FOR INDIRECT EVAPORATIVE COOLING ............................................................................... 8 FIGURE 2. SCHEMATIC OF ROOFTOP UNIT WITH INDIRECT EVAPORATIVE COOLING AND EVAPORATIVE CONDENSER PRE-COOLING ......... 9 FIGURE 3. LABORATORY LAYOUT – SECTION VIEW .............................................................................................................. 12 FIGURE 4. PHYSICAL LAYOUT OF ROOFTOP UNIT AND INDIRECT EVAPORATIVE UNIT IN OUTDOOR CHAMBER ................................... 13 FIGURE 5. INSTRUMENTATION SCHEMATIC FOR LABORATORY TEST ...................................................................................... 15 FIGURE 6. PSYCHROMETRIC CHART – RANGE OF TARGET TEST CONDITIONS, AND DESIGN CONDITIONS FOR SEVERAL CITIES ............... 19 FIGURE 7: MAP OF IEC FAN AIRFLOW, POWER CONSUMPTION, & CASE STATIC PRESSURE ACROSS A RANGE OF FAN SPEEDS, WITH
DIFFERENT DAMPER OPENINGS, AND WITH THE RTU FAN ON AND OFF FOR REFERENCE, MANUFACTURER RECOMMENDS TO SET DAMPER SO FULL SPEED CASE PRESSURE = 0.72 (INWG) ................................................................................. 23
FIGURE 8: SENSIBLE COOLING CAPACITY IN EACH MODE OF OPERATION FOR EIGHT CLIMATE CONDITIONS ...................................... 26 FIGURE 9: ELECTRIC POWER CONSUMPTION FROM EACH COMPONENT IN EACH MODE OF OPERATION .......................................... 28 FIGURE 10: ENERGY EFFICIENCY RATIO IN EACH MODE OF OPERATION ..................................................................................... 29 FIGURE 11: WET BULB EFFECTIVENESS AS A FUNCTION OF OUTSIDE AIR WET BULB DEPRESSION FOR THREE FAN SPEEDS (A) RESULTS
FROM EVERY TEST (B) AVERAGE VALUES FOR RESULTS FROM ALL TESTS ..................................................................... 34 FIGURE 12: (A) INDIRECT WET BULB EFFECTIVENESS AS A FUNCTION OF INDIRECT WET BULB DEPRESSION (B) PSYCHROMETRIC DIAGRAM
ILLUSTRATION OF PRIMARY AND SECONDARY PROCESS FOR INDIRECT EVAPORATIVE .................................................... 35 FIGURE 13: COOLING CAPACITY AS A FUNCTION OF OUTDOOR WET BULB DEPRESSION, IN INDIRECT EVAPORATIVE ONLY MODE ............ 35 FIGURE 14: PSYCHROMETRIC PERFORMANCE MODE: “IEC HIGH” AT SEVERAL OUTSIDE AIR CONDITIONS. IEC PRODUCT AIRFLOW =
2,100 CFM .................................................................................................................................................. 36 FIGURE 15: PSYCHROMETRIC PERFORMANCE MODE: “IEC LOW + DX2 + PC” AT SEVERAL OUTSIDE AIR CONDITIONS. IEC PRODUCT
AIRFLOW = 1130 CFM, RETURN AIRFLOW = 1660 CFM, SUPPLY AIRFLOW = 2640 CFM ............................................. 37 FIGURE 16: PSYCHROMETRIC PERFORMANCE MODE: “IEC HIGH + DX2+PC” AT SEVERAL OUTSIDE AIR CONDITIONS IEC PRODUCT
AIRFLOW = 2460 CFM, RETURN AIRFLOW = 800 CFM, SUPPLY AIRFLOW RATE = 2780 CFM ....................................... 37 FIGURE 17: DISTRIBUTION OF ANNUAL COOLING LOAD BY OUTSIDE TEMPERATURE AND LOAD FRACTION ......................................... 38 FIGURE 18: WATER EVAPORATION RATE FOR IEC AND PRE COOLER MEASURED IN EACH TEST ....................................................... 41 FIGURE 19: CA APPLIED WATER USES (MILLION ACRE FEET) ................................................................................................. 41 TABLES TABLE 1. MODES OF OPERATION FOR INDIRECT EVAPORATIVE + ROOFTOP UNIT COMBINATION ................................................. 10 TABLE 2. MEASUREMENTS AND INSTRUMENTATION FOR LABORATORY TESTS ......................................................................... 16 TABLE 3. RANGE OF TEST CONDITIONS USED FOR DESIGN OF EXPERIMENTS ............................................................................ 19 TABLE 4. RANGE OF TEST CONDITIONS USED FOR DESIGN OF EXPERIMENTS ............................................................................ 20 TABLE 5: SUMMARY PERFORMANCE DATA TABLE FOR TESTS IN EACH MODE AND EACH MODE AND CLIMATE CONDITION ................. 30 TABLE 6. OPERATING SCENARIOS, CAPACITY, AND EFFICIENCY AT CLIMATE CONDITIONS USED TO ESTIMATE ANNUAL SAVINGS .......... 39

Southern California Edison Page 4
Customer Programs & Services April 2015
CONTENTS EXECUTIVE SUMMARY ............................................................................................................................................ I
BACKGROUND ................................................................................................................................................................. I OBJECTIVES .................................................................................................................................................................... I TECHNOLOGY REVIEW ...................................................................................................................................................... I RESULTS & RECOMMENDATIONS ........................................................................................................................................ I
INTRODUCTION ..................................................................................................................................................... 5
PROJECT OVERVIEW .............................................................................................................................................. 6
CLIMATE APPROPRIATE COOLING ....................................................................................................................................... 6 OVERVIEW OF THE TECHNOLOGY ....................................................................................................................................... 7
ASSESSMENT OBJECTIVES .................................................................................................................................... 11
ASSESSMENT METHODOLOGY ............................................................................................................................. 12
OVERVIEW OF THE TECHNICAL APPROACH ......................................................................................................................... 12 LABORATORY FACILITY ................................................................................................................................................... 12 INSTRUMENTATION SCHEME ........................................................................................................................................... 13 DESIGN OF EXPERIMENTS ............................................................................................................................................... 19 DEFINITION & CALCULATION OF PERFORMANCE METRICS .................................................................................................... 20
RESULTS & DISCUSSION ....................................................................................................................................... 23
FAN MAPPING ............................................................................................................................................................. 23 COOLING CAPACITY ....................................................................................................................................................... 25 SYSTEM POWER & EFFICIENCY ........................................................................................................................................ 27 INDIRECT EVAPORATIVE COOLING PERFORMANCE ............................................................................................................... 34 PSYCHROMETRIC PERFORMANCE ..................................................................................................................................... 36 ESTIMATED ANNUAL SAVINGS ......................................................................................................................................... 38 WATER USE EFFICIENCY ................................................................................................................................................. 41
CONCLUSIONS & RECOMMENDATIONS ............................................................................................................... 42
REFERENCES ......................................................................................................................................................... 43

Southern California Edison Page 5
Customer Programs & Services April 2015
INTRODUCTION This study documents the laboratory measured performance for a rooftop package air conditioner (RTU) outfitted with an indirect evaporative air conditioner (IEC) ducted to the outdoor air supply damper for the unit and an evaporative condenser air pre-cooler. The testing was performed by PG&E Applied Technology Services and the UC Davis Western Cooling Efficiency Center as part of the Western Cooling Challenge program. This work is directly in support of PG&E Emerging Technologies efforts related to the California Energy Efficiency Strategic Plan (CA-EESP) goals to accelerate marketplace penetration of new climate-appropriate HVAC technologies (CPUC 2011).
Cooling and ventilation account for more than 25 percent of the annual electricity consumption for commercial buildings in California (CEC 2006). Air conditioners can account for more than 50 percent of the peak electric load for commercial buildings during the hottest summer afternoons (CEC 2006). California’s electric grid typically experiences the highest 20 percent of demand for less than 5 percent hours each year (CA ISO 2015), and this can be attributed almost exclusively to cooling throughout the state.
In terms of source energy consumption or greenhouse gas emissions, heating, cooling and ventilation can account for more than 50% of the annual footprint for a commercial building (EIA 2012). As efficiency for lighting and electronics progresses rapidly, HVAC is currently projected to become the largest annual energy end use in most commercial buildings.
Rooftop air conditioners are often the single largest individually connected load in a building. Therefore, these systems stand as a substantial opportunity for energy efficiency improvements. Since rooftop air conditioners have a very low turnover rate, the efficiency of a system installed will very likely persist in operation for more than 20 years. This research looks at a retrofit package that can have an immediate impact on the energy performance of existing RTUs transforming them from climate agnostic technologies to ones that are better tuned and more appropriate for a specific set of climate zones.
Vapor compression air conditioners have traditionally not varied much in design according to climate zone. However, there are substantial opportunities to reduce energy consumption for cooling and ventilation when a system is designed thoughtfully to work in concert with the meteorological conditions of the region in which it is installed. Therefore, in an effort to strike substantial reduction in energy consumption, to improve management of electrical demand, and to ease integration of renewable and environmentally responsible energy resources, the CA-EESP has established aggressive goals to advance broader market adoption of climate appropriate HVAC technologies.
California’s climate zones are all relatively dry, so one climate-appropriate method to improve efficiency for cooling is the efficient use of modern and sophisticated evaporative cooling technologies. There are a variety of technologies in this category. This study focuses on an innovative application of an IEC by ducting the device into the outdoor air supply damper of an RTU.
There are a number of ways to utilize IEC as part of a building HVAC system. For this laboratory test the IEC was setup to deliver cool air through the outside air inlet of an existing RTU. In addition, a condenser air pre-cooler was used to improve the performance of the refrigeration cycle of the RTU. The system tested is capable of many modes of operation that use various combinations of the RTU components, the IEC, and the pre-cooler. The various modes are outlined in Table 1.
Equipment handling outside air is especially well-suited to employ indirect evaporative cooling. Whereas cooling capacity and efficiency of vapor compression systems generally decreases at high outdoor air temperatures, the capacity and efficiency for indirect evaporative cooling components typically increases. Subsequently, the largest incremental savings can be achieved when IEC is applied to cooling hot ventilation air. When integrated with an RTU, the technology can also be used to cover sensible room cooling loads, but the energy savings achieved compared to a conventional baseline is less substantial.
This report presents analysis of results from laboratory testing of indirect evaporative air conditioner and condenser air pre-cooler retrofitted on to an existing RTU - one example of a retrofit package that incorporates indirect evaporative cooling, vapor compression, and condenser air precooling. The laboratory

Southern California Edison Page 6
Customer Programs & Services April 2015
examination was conducted at PG&E Applied Technology Services in San Ramon, California. Tests were organized in a way to measure the cooling capacity and energy consumption for the system in each mode of operation, and across a range of operating conditions. Further, performance of each major sub component was characterized as a function of the relevant independent conditions. For example, fan performance was mapped separately from tests of thermal performance. Laboratory tests were designed to gather a level of detail appropriate to inform and validate the simulation of system performance in various climate conditions and applications.
The CA-EESP advances goals for broad market deployment of climate appropriate cooling solutions. Technologies in this category offer greater energy savings in California’s climates than other cooling efficiency measures; they are especially valuable for electricity savings during peak cooling hours when air conditioning alone can account for more than 30% of the peak demand on the statewide electric network (EIA 2012, CEC 2006). Many studies have demonstrated that add-on evaporative pre-coolers for conventional air conditioners can reduce peak electrical demand from cooling by as much as 30-60% (Woolley 2014, Modera 2014, Pistochini 2014, Davis, 2015). However, the savings achieved depends significantly on technology and application.
PROJECT OVERVIEW
CLIMATE APPROPRIATE COOLING CA-EESP outlines four major programmatic initiatives, as“Big Bold Enegy Efficiency Strategies” to facilitate broad energy savings for our built environment:
• All new residential construction will be zero net energy by 2020 • All new commercial construction will be zero net energy by 2030 • HVAC will be transformed to ensure that its energy performance is optimal for California’s climate • All low-income customers will have the opportunity to participate in energy efficiency programs by
2020
The third initiative targets a 50 percent efficiency improvement for HVAC by 2020, and a 75 percent improvement by 2030. The plan recognizes that cooling and ventilation is the single largest contributor to peak electrical demand in California, which results in “enormous and costly impacts on generation, transmission, and distribution resources as well as a concurrent lowering of utility load factors.” Strategic goals to transform the HVAC industry focus on:
1. Code compliance 2. Quality installation and maintenance 3. Whole-building integrated design practices, and 4. Development and accelerated implementation of new climate-appropriate equipment and controls
The efficiency measure studied in this project specifically targets the fourth goal: it advances the evaluation and application of climate appropriate systems and controls. Air conditioning equipment has traditionally been designed and rated according to a single number efficiency metric that does not accurately represent the performance of air conditioners in California climates. Optimizing for this metric, manufacturers have mainly sold a single type of air conditioner that functions reliably in any climate, but is also inefficient in every climate. Luckily, there are many climate appropriate technologies and system design strategies that use far less energy than the “one-size fits all” approach. Climate appropriate air conditioning systems and controls are designed and tuned specifically for local climate conditions, and occupant comfort needs; they provide an equal (or better) quality of service with less energy input. Some examples of cooling strategies appropriate for California climates include:
• Sensible-only cooling measures that do not waste energy on unnecessary dehumidification • Indirect evaporative cooling (and other evaporative measures), when water is used efficiently

Southern California Edison Page 7
Customer Programs & Services April 2015
• Advanced economizer controls, natural ventilation cooling, nighttime ventilation pre-cooling, and other passive or semi-active systems that capitalize on large diurnal outdoor temperature swings to reduce the amount of active cooling required at other periods.
• Adaptive comfort controls, and predictive control strategies that conserve energy by allowing indoor conditions to drift across a wider range, in concert with dynamic human comfort considerations that change with outdoor conditions.
• Any technology that uses substantially less energy for cooling (especially at peak) than conventional minimum efficiency equipment.
One should also note that current single number industry standard rating methods are generally not appropriate for describing performance of climate appropriate technologies. The problem is not that the limited range of standard test conditions are not exactly representative of every application in California; the issue is that the standard methods of test (such as ANSI/AHRI Standards 210/240 and 340/360) can actually portray climate optimized products as less efficient than traditional air conditioners (Woolley 2011). These standards unintentionally disadvantage climate appropriate strategies by misrepresenting their performance in comparison to the status quo. In many circumstances climate appropriate strategies cannot even be tested by industry standard methods because they operate in configurations that are fundamentally different than the scenario for which current standards were designed. This shortcoming is especially true for whole building integrated design practices.
The project reported here studies an indirect evaporative air conditioner and an evaporative condenser air pre-cooler added as retrofit to a rooftop air conditioner that had been in service at a cafeteria from 1991 – 2013, and which was removed for the purposes of this laboratory test. The project builds on a body of research, and technology evaluations recently advanced by Southern California Edison, PG&E and other California entities to advance the understanding and market introduction of climate appropriate HVAC solutions. In particular, this laboratory study builds from a recent PG&E field evaluation of the same technology installed in a big-box retail store in Bakersfield CA (Woolley 2014).
OVERVIEW OF THE TECHNOLOGY Indirect evaporative air conditioning uses water evaporation in one air stream to impart sensible cooling to another air stream without any moisture addition to the conditioned space. There are a number indirect evaporative heat exchanger designs, and many different ways to apply indirect evaporative systems as an efficient part of a building HVAC system. The technology studied here uses a specially designed polymer plate heat exchanger that operates partly as counter-flow and partly as cross-flow. The conceptual process is illustrated in Figure 1. The heat exchanger is integrated into a small packaged air handler with an integral sump and variable speed fan. At full speed, the single fan moves approximately 5,000 cfm of outside air which is cooled sensibly as it passes through the primary side of the heat exchanger. At this point the air stream is split; roughly half of the airflow passes back through the secondary side of the heat exchanger, and roughly half is delivered to the building as the product air stream. The secondary side of the heat exchanger is wetted, and evaporation here drives the cooling process. The cascading flow design for this heat exchanger allows this manufacturer’s product, uniquely, to cool below the outside air wet bulb temperature during regular operation.
The indirect evaporative system is designed to operate as a stand-alone cooling unit, and incorporates a proprietary thermostat controller that will adjust the system’s fan speed to vary cooling capacity in response to room conditions. However, in many commercial buildings indirect evaporative cooling may not be adequate to cover all room cooling requirements at all times. Most importantly, although the system cooling capacity and efficiency increase as outside temperature increases, the product air temperature also rises. As a result, although indirect evaporative cooling offers great benefit for cooling efficiency, in many applications it must be applied in combination with other cooling strategies. There are many ways to accomplish this. This laboratory study investigates one approach to the integration on indirect evaporative cooling as retrofit for a conventional vapor compression air conditioner.

Southern California Edison Page 8
Customer Programs & Services April 2015
FIGURE 1. CONCEPTUAL SCHEMATIC FOR INDIRECT EVAPORATIVE COOLING
There are several factors that design engineers must consider when applying indirect evaporative cooling as one element in a whole building HVAC system. Of particular importance:
1. Controls should give priority to indirect evaporative cooling over less efficient cooling modes 2. Controls should give priority to economizer cooling over indirect evaporative cooling 3. Systems must maintain ventilation requirements without overcooling the zone 4. Systems must maintain ventilation requirements even when heating is required 5. If the indirect evaporative system is used in combination with vapor compression equipment (as in
this study), the combination must maintain adequate evaporator coil air-flow 6. Care must be taken to maintain appropriate downstream static pressure
Balancing all of these requirements can become challenging in practice. For example, when an indirect evaporative air conditioner is used as the primary source for ventilation air, a separate system may be needed to provide ventilation air during the heating season. On-board controls do not direct this type of coordination so some sort of global controller is often required.
The need to maintain appropriate static pressure conditions is especially important; failure to do so will result in primary-secondary imbalance for the heat exchanger which will degrade performance. The product tested uses a damper in the product air stream that is manually adjusted to provide the resistance that will result in proper balance. This is sufficient in many applications, but in instances when the downstream resistance changes, other accommodations for pressure management must be made. For example, if the indirect evaporative system is coupled with a conventional air conditioner, the rooftop unit fan operation can disrupt the pressure balance. In this project, the manual damper was adjusted to the proper resistance while the rooftop unit fan was operating, then remained fixed for all tests. Consequently, the resistance to airflow was larger than design for indirect evaporative modes where the rooftop unit fan was turned off. The added resistance decreased product airflow, increased secondary airflow, and resulted in a lower product air temperature.
The physical integration of systems can be complicated as well. A previous field study with the same IEC technology at a big box retail store in Bakersfield, CA (Woolley 2014) demonstrated a method to accommodate all of these needs without revision to the building’s existing energy management and control system, but the physical integration as retrofit to an existing rooftop unit was rather elaborate. The laboratory test reported here set out to explore a simpler approach to use the IEC unit as an addition to an existing rooftop air conditioner. Figure 2 illustrates the integrated system design that was tested.
The IEC unit was set up to deliver product air through the outside air intake for a conventional rooftop air conditioner. In this configuration, the IEC can utilize existing ductwork distribution systems, and it can either operate independent from or in cooperation with the rooftop unit. However, the size of the rooftop unit to which the IEC is matched may change the optimal control strategy. If the airflow resistance through the rooftop unit is small enough the IEC can operate without the rooftop unit fan. In fact, if the product airflow rate were equal to the rooftop unit’s supply airflow rate, the rooftop unit fan could remain off even when vapor compression cooling is need. In this application, the rooftop unit fan was disabled for the “indirect evaporative only” modes, but it was enabled for vapor compression cooling. In the former case all airflow through the rooftop unit came from the IEC, while in the latter case, some additional airflow was drawn from the return air path.
Product Air
Secondary Flow
Primary Flow Primary Inlet
Exhaust Air
Sensible Heat Transfer

Southern California Edison Page 9
Customer Programs & Services April 2015
Air Filters Ind. Evap. Heat Exchanger Evaporator Coil
Variable Speed Fan Balancing Damper Supply Air Fan
Drain Solenoid Barometric Relief 2 Compressors, 1 Circuit
Pumps Outside Air and Return Air Dampers Condenser Coil
Sump Air Filters Evap. Condenser Pre Cooler
FIGURE 2. SCHEMATIC OF ROOFTOP UNIT WITH INDIRECT EVAPORATIVE COOLING AND EVAPORATIVE CONDENSER PRE-COOLING
M
Exhaust Ou
tsid
e Ai
r
Water In
Drain
Return Air Supply Air
Condenser Exhaust
Drain
Water In
Outside Air
Outs
ide
Air
5
6
14
3
7
8 2
9
11
12
10
1
2
3
4
6
7
8
9
11
12
13
15
14
5 10 15
1
4
13
Prod
uct A
ir
3 4
Mix
ed A
ir

Southern California Edison Page 10
Customer Programs & Services April 2015
To ensure that the rooftop unit has access to outside air when indirect evaporative cooling is not needed, a barometric relief was added in the product air duct. The relief remains closed as long as the plenum is positively pressurized, but can open inward when the IEC fan is off and the rooftop unit fan is on. For example, this would occur for economizer cooling, or for minimum ventilation in heating mode.
For laboratory testing, the outside air damper signal for the rooftop unit was overridden to keep the outside air damper fully open anytime the IEC was enabled. There are a variety of ways to accomplish the same thing in a real world application. For example the normal operating position for the outside air damper could be adjusted so that the rooftop unit would supply an appropriate ventilation rate while the IEC is disabled. This is exactly as most rooftop units are regularly configured. Then the IEC’s damper could be adjusted to achieve an appropriate case static pressure while the rooftop unit fan is enabled. In any case, the unfortunate result is that without active damper controls to adjust the operating pressure for the indirect evaporative cooler, the change in downstream resistance associated with rooftop unit fan operation will disrupt the ratio of primary-secondary airflow and performance for the system will suffer.
Table 1 describes the six distinct modes of operation that would occur for the design described and tested.
TABLE 1. MODES OF OPERATION FOR INDIRECT EVAPORATIVE + ROOFTOP UNIT COMBINATION
Mode
RTU
Indo
or F
an
Com
pres
sors
IEC
Fan
Spee
d
Baro
met
ric
O
utsi
de A
ir In
let
Retu
rn A
irflo
w
IEC
Pum
ps
Cond
ense
r
Pre-
Cool
er P
ump3
Off OFF OFF OFF NA NA OFF OFF
Vent. or Econ. ON OFF OFF Open Yes OFF OFF
IEC OFF1 OFF MIN-100%2 Closed No ON OFF
IEC & DX1 ON1 1 100% Closed Yes ON ON
IEC & DX2 ON1 2 100% Closed Yes ON ON
Heating ON OFF OFF Open Yes OFF OFF
1. If airflow resistance through the rooftop unit and ductwork system is low enough, the IEC can operate without the RTU indoor fan. If the IEC product flow rate is large enough, the compressors could operate without the RTU indoor fan. This determination must be made by careful design.
2. IEC fan speed usually varies with the cooling load. Sequence of operations should seek to: • When IEC is the most efficient mode ensure that it reaches full speed before compressors are enabled. • The IEC fan speed should not be allowed to drop below the minimum ventilation rate.
3. Condenser pre-cooling should only operate above an outside air temperature threshold where it is most useful.
Concurrent with this laboratory test, the manufacturer introduced the design for a new indirect evaporative air conditioner that should address some of the challenges discussed here. In particular, the system:
1. Automatically manages an appropriate primary-secondary airflow ratio regardless of changes in the downstream airflow resistance.
2. Incorporates a heat exchanger bypass so that the IEC fan can serve economizer cooling, or supply ventilation when cooling is not required.
In addition to the IEC, an evaporative condenser pre-cooler manufactured by the same company – was added to the rooftop unit to enhance capacity and improve vapor compression efficiency. This retrofit is illustrated in Figure 2, and operation of the component in each mode is described in Table 1. The pre-cooler is constructed of 12” deep cellulose evaporative media with overhead water distribution. The media is mounted

Southern California Edison Page 11
Customer Programs & Services April 2015
in a stainless steel frame designed to fit the condenser inlet face of the conventional rooftop unit. A single pump is used to circulate water from a the sump to the top of the media.
The characteristic performance for this condenser pre-cooler as an independent measure is evaluated in detail through a separate study: Laboratory Testing of Performance Enhancements for Rooftop Packaged Air Conditioners (Davis 2015). There, the pre-cooler was tested according to a methodology recently proposed by ASHRAE SPC 212 (ASHRAE 2015), and characteristic performance metrics for the device are compared directly to other condenser pre-coolers. The laboratory results presented in this report focus on the condenser pre-cooler’s net impacts to capacity and efficiency for the integrated retrofit package.
ASSESSMENT OBJECTIVES The main objectives of this project include:
1. Provide reliable performance data that can be utilized as the basis for annual energy modeling, and for design of efficiency programs.
2. Introduce system functions and operation to utility program managers, design engineers, and end users who may benefit from its application.
3. Advance CA-EESP goals for the broad market application of climate appropriate commercial cooling technologies.
4. Describe important attributes of the technology that may not be readily apparent, but which should be considered in application.
5. Scrutinize equipment design to understand the best applications to derive energy and peak savings, and to identify any scenario or mode of operation where the equipment may not achieve savings over the incumbent technology.
6. Identify opportunities for additional improvements for the technology
In order to accomplish these objectives the project team worked closely with the manufacturer to develop a strong technical understanding of the equipment from the inside-out, and to developed a design for systems integration that would resemble field application of the technology. The team established a design of experiments for laboratory testing to evaluate performance of the system as a whole, and to characterize performance of all major sub components in each mode of operation.
Testing for the IEC and condenser pre-cooler addition was executed by PG&E as one part in a larger series of laboratory evaluations to study retrofit efficiency measures for commercial air conditioners: Laboratory Testing of Performance Enhancements for Rooftop Packaged Air Conditioners (Davis 2015).

Southern California Edison Page 12
Customer Programs & Services April 2015
ASSESSMENT METHODOLOGY
OVERVIEW OF THE TECHNICAL APPROACH This project conducted laboratory measurements of an existing rooftop unit with and without the suite of climate appropriate retrofits discussed in section Overview of the Technology. The baseline RTU was a Carrier model DJD009 with nominal capacity of 8 ½ tons. Thermal tests were conducted at eight outdoor air conditions for several different operating modes in order to develop a thorough performance map for the system with and without each retrofit. Airflow characteristics were measured through a series of separate tests that evaluated fan power and static pressure across a range of fan speeds, internal damper positions, and external resistance conditions.
Laboratory measurements were analyzed to compare performance in each operating mode, and to describe the efficiency benefits for the retrofits across a range of outside air conditions. These characteristics were studied to evaluate the efficiency measure, to identify any technical challenges, and to recommend technical opportunities for future projects. Finally, to estimate the overall potential for cooling energy savings, the maps of system performance with and without the climate appropriate retrofits were imposed on a standard annual system load profile in order to estimate the integrated energy efficiency ratio for the system.
LABORATORY FACILITY All testing was performed in the HVAC testing apparatus in the Advanced Technology Performance Lab at PG&E’s Applied Technology Services in San Ramon, California. The apparatus consists of two side-by-side environmental chambers designed in accordance with ASHRAE Standard 37 (ASHRAE 2009). Each chamber has an independent conditioning system that is controlled to maintain target temperature and humidity conditions in each chamber.
The facility has two “code tester” airflow measurement stations. These systems measure differential static pressure across an array of nozzles and can determine airflow with less than 1% uncertainty. Each code tester is paired with a variable speed fan that is adjusted to compensate for the added resistance from the flow measurement system. For these tests the first code tester was used to measure supply airflow rate, while the second was used to measure condenser exhaust airflow rate. Figure 3 illustrate the laboratory facility layout.
FIGURE 3. LABORATORY LAYOUT – SECTION VIEW
Indoor Chamber Outdoor Chamber
Primary Code Tester
Secondary Code Tester
Conditioning for Indoor Chamber
Conditioning for Outdoor Chamber
Indoor Chamber Outdoor Chamber

Southern California Edison Page 13
Customer Programs & Services April 2015
The indirect evaporative air conditioner, and the rooftop unit with condenser air pre-cooler were placed entirely inside the “outdoor” chamber, as illustrated in Figure 4. Air at the prescribed test conditions is drawn directly from the ‘outdoor’ chamber into the condenser inlet, the economizer inlet, and the indirect evaporative cooler inlet. Supply air from the rooftop unit was ducted to one code tester, and condenser exhaust airflow was ducted to the other code tester. Return air for the rooftop unit was drawn from the ‘indoor’ chamber. Air volume that is drawn out of each chamber by the test equipment is made up by supply from the conditioning unit for each chamber. This air volume originates partly from outside, and partly from the outlet of each code tester.
FIGURE 4. PHYSICAL LAYOUT OF ROOFTOP UNIT AND INDIRECT EVAPORATIVE UNIT IN OUTDOOR CHAMBER
INSTRUMENTATION SCHEME Measurements for this laboratory evaluation were designed mainly to capture the net thermodynamic performance for the rooftop unit and indirect evaporative air conditioner. Accordingly, the majority of instrumentation was located in the external ductwork, or at the open inlets to each machine. In addition to psychrometric conditions and air flow rates, laboratory measurements also captured the whole system electrical use characteristics, and makeup water consumption for each system. The laboratory test did capture a number of internal variables as well, including refrigerant circuit temperatures and pressures, sub-component electric current uses, and some internal temperatures.
Table 2 documents the instrumentation used for each point of measurement in this laboratory study.
65 52.8 ANSI/AHRI 340/360 IEER 25% Capacity
Supply air to code tester
Condenser Pre-Cooler
Return air from indoor chamber
Exhaust to outdoors
RA
Condenser exhaust ducted to code tester
Indirect Evaporative (IEC)
Product air ducted to outside air inlet
PA
SA

Southern California Edison Page 14
Customer Programs & Services April 2015
Figure 6 illustrates the location for each measurement on a system schematic .
Temperature and pressure transmitters were calibrated against laboratory standards through the data acquisition system prior to testing. For the temperatures, the calibration included a low point using an ice bath (32°F) and a high point using a hot block calibrator (120°F). The raw measurements were adjusted to match the reading from a secondary temperature standard placed in the same environment. The four dew-point sensors had received a factory calibration in December 2012.
All of the instruments were connected to signal conditioning modules based on the National Instruments C-series architecture, connected to six Compact-RIO chasses. The modules included different units for RTDs, thermocouples, voltage, current, and pulse counting, plus both analog and digital output modules for the room conditioning systems. Two of the Compact-RIO chasses were set up to read from the weather station and the condensate scale through their RS-232 connections, and create network-shared variables from the text streams. The default chassis internal scan rate for reading the module inputs is 10 Hz, although the weather station and scale updated once every second.
10%
20%
30%
40%
0.000
0.005
0.010
0.015
0.020
0.025
40 50 60 70 80 90 100 110
Hum
idity
Rat
io -
lb m
oist
ure /
lb d
ry a
ir
Dry Bulb Temperature - °F
Annual Conditions in CA CZ 12
Test Conditions
Select ASHRAE 0.4% Design Conditions

Southern California Edison Page 15
Customer Programs & Services April 2015
FIGURE 5. INSTRUMENTATION SCHEMATIC FOR LABORATORY TEST
M
Exhaust
Outs
ide
Air
Water In
Drain
Return Air Supply Air
Condenser Exhaust
Drain
Water In
Outside Air
Outs
ide
Air
PBAR T OSA
T RA
T DP RA
ΔP RA
�̇�𝑉 RA
T ECON
T SA
T DP SA
ΔP SA
�̇�𝑉 SA
T EA
T DP EA
ΔP EA
�̇�𝑉 EA
T SUC
P SUC
T LIQ
P LIQ
T DIS
kW CW
T DP OSA
CT RTU FAN �̇�𝑉 PA
POS
DMPR
SPEED CW
kW PUMP
T INDOOR
T MA
ΔP MA
T COND IN
T WB OSA
�̇�𝑉 CW WATER
�̇�𝑉 DRAIN CW
T CW IN
T CW EXH
ΔP PA
ΔP CASE
kW RTU
T PA
ΔP ESP CT C1
CT C1
CT CF

Southern California Edison Page 16
Customer Programs & Services April 2015
The six Compact-RIO chasses communicate over an Ethernet network to a central host computer, which ran a custom data acquisition and control program developed with National Instruments LabVIEW™ graphical programming language. The program acquired readings from the chasses at a rate of 2 Hz, applied calibration scaling and maintained a running average for each measurement, and logged the averages to a file every 15 seconds. The scaled values and other calculated values were also displayed on screen in both text and graphical form, and used to generate feedback control signals to the space conditioning systems.
The logged data was saved in an ASCII text format that is easily imported into Microsoft Excel for analysis. A macro was run on the raw data file to apply formatting, calculate statistics, and create trend charts. The result was then analyzed to isolate a period of stable operation. For most of the tests, the target period duration was 30 minutes, although shorter duration periods were accepted when thermal stability was not critical (e.g. fan performance mapping), or on rare occasions when some operating anomaly reduced the acceptable data set. Once the steady state period was identified, the statistics (average, standard deviation, range) were isolated to just this period and then copied over to another spreadsheet with one row per test. Operating performance metrics were then calculated from these values, according to equations described in section Definition & Calculation of Performance Metrics. (Davis 2015)
TABLE 2. MEASUREMENTS AND INSTRUMENTATION FOR LABORATORY TESTS
Tag Measurement Instrument Make Accuracy
P BAR Barometric Pressure Multi-function weather station on roof of building Vaisala WTX520
±0.007 PSIA (±0.5 hPa)
T INDOOR Indoor room dry-bulb temperature
Average of four fast-response resistance temperature detectors (RTDs) in room free air.
Burns Engineering ±0.2°F
T RA Return air dry-bulb temperature
Average of four fast-response RTDs inserted through wall of duct attached to test unit return
Burns Engineering ±0.2°F
T DP RA Return air dew-point temperature
Chilled mirror dew point sensor in return air duct near inlet of unit
General Eastern Hygro-M2+
±0.36°F
ΔP RA Return air static pressure
Pressure transmitter attached to manifolded pressure taps at center of each side of the duct entering the unit
Rosemount 3051C ±0.04% span (-2–2 in)
�̇�𝑉RA Return airflow station
Full duct averaging pitot tube array (Air Monitor Fan-E) with low range differential pressure sensor
Air Monitor Veltron II ±0.1% span (0 to 0.1 in)
T ECON Air temperature at economizer inlet
Average of four Type-T thermocouples mounted on units outside air damper intake
Therm-X ±0.5°F
T MA Mixed air temperature
Average of 12 Type-T thermocouples Averaging RTD
Therm-X Minco S457PE
±0.5°F 0.25% read
ΔP MA Mixed Air static pressure
Pressure transmitter attached to port through side of RTU into mixed air plenum.
Rosemount 3051C ±0.04% of span (-2–1 in)
T SA Supply air discharge dry-bulb temperature
Average of six fast-response RTDs inserted through wall of duct attached to test unit return.
Burns Engineering ±0.2°F
T DP SA Supply air discharge dew-point temperature
Chilled mirror dew point sensor General Electric Optica ±0.36°F
ΔP SA Supply air static pressure
Pressure transmitter attached to manifolded pressure taps at center of each side of the duct leaving the unit
Rosemount 3051C ±0.04% span (-1–2 in)

Southern California Edison Page 17
Customer Programs & Services April 2015
Tag Measurement Instrument Make Accuracy
�̇�𝑉 SA
Supply airflow station differential pressure
Pressure transmitter attached to manifolded pressure taps at center of each side of the flow box on both sides of the nozzle partition
Rosemount 3051C ±0.04% span (0–3 in)
Supply airflow station upstream static pressure
Pressure transmitter attached to manifolded pressure taps at center of each side of the flow box upstream of the nozzle partition
Rosemount 3051C ±0.04% of span (-3–3 in)
Supply airflow station dry bulb temperature
Single fast-response RTD upstream of nozzles Burns Engineering ±0.2°F
T OSA Outside air intake dry-bulb temperature
Average of eight fast-response RTDs arrayed across the outside air intake.
Burns Engineering ±0.2°F
T WB OSA Outside air wet-bulb temperature
Average of four fast-response RTDs each enclosed in a wetted wick and with a fan for air movement.
Burns Engineering ±0.2°F
T DP OSA Outside air dew-point temperature Chilled mirror dew point sensor
General Eastern Hygro-M4 ±0.36°F
ΔP ESP Unit pressure drop Pressure transmitter connected between the supply and return manifolds.
Rosemount 3051C ±0.04% span (-4–4 in)
T COND IN Pre-cooler outlet temperature
Single RTD inserted between the pre-cooler and condenser coil. Burns Engineering
±0.2°F
kW PUMP Pre-cooler pump power, voltage and current
3-element true-RMS power meter with digital outputs of power, voltage and current for each phase
Yokogawa WT330 ±(0.1% read +0.1% range)
�̇�𝑉 CW WATER IEC makeup water
Positive displacement water meter with analog output for flow rate and pulse output for totalization
Badger M25 ±1.5% f.s.
�̇�𝑉 CW DRAIN IEC weigh tank Catch basin on electronic scale Measuretek ±0.2 lb
T CW IN IEC outdoor air temperature
Single RTD attached to air intake Burns Engineering ±0.2°F
T PA IEC product air temperature
Single RTD inserted into duct at unit discharge. (Normally matched 4 T/Cs at economizer inake)
Burns Engineering ±0.2°F
T CW EXH IEC exhaust air temperature
Single RTD attached to air discharge Burns Engineering ±0.2°F
ΔP CASE IEC case pressure
Pressure transmitter attached to case tap
Rosemount 3051C ±0.04% span (-1–2 in)
�̇�𝑉 PA
IEC product airflow monitor
Full duct averaging pitot tube array (Air Monitor Fan-E) with low range differential pressure sensor
Air Monitor Veltron II ±0.1% span (0–0.1 in)
IEC product airflow monitor
Full duct averaging pitot tube array (Air Monitor Fan-E) with low range differential pressure sensor
Ashcroft XLDP ±0.25% span (0–1.0 in)
ΔP PA IEC product air pressure
Pressure transmitter attached to static pressure tap of pitot tube array Ashcroft XLDP
±0.25% span (-1–1 in)

Southern California Edison Page 18
Customer Programs & Services April 2015
Tag Measurement Instrument Make Accuracy
kW CW IEC Supply Power, Voltage and Current
3-element true-RMS power meter with digital outputs of power, voltage and current for each phase
Yokogawa WT330 ±(0.1% read +0.1% range)
T EA Exhaust air dry-bulb temperature
Average of four fast-response RTDs inserted through wall of duct attached to test unit exhaust
Burns Engineering ±0.2°F
T DP EA Exhaust air dew-point temperature
Chilled mirror dew point sensor General Eastern Hygro-M2
±0.36°F
ΔP EA Exhaust air static pressure
Pressure transmitter attached to manifolded pressure taps at center of each side of the duct leaving the unit
Rosemount 3051C ±0.04% span (-2–2 in)
�̇�𝑉 EA
Exhaust airflow station differential pressure
Pressure transmitter attached to manifolded pressure taps at center of each side of the flow box on both sides of the nozzle partition
Rosemount 3051C ±0.04% span (0–3 in)
Exhaust airflow station upstream static pressure
Pressure transmitter attached to manifolded pressure taps at center of each side of the flow box upstream of the nozzle partition
Rosemount 3051C ±0.04% span (-3–3 in)
Exhaust airflow station dry bulb temperature
Single fast-response RTD upstream of nozzles Burns Engineering ±0.2°F
P SUC Compressor suction pressures (2 circuits)
Pressure transmitter attached to compressor suction (vapor) line Schrader valve
Rosemount 3051C ±0.04% span (0–300 psig)
P LIQ Condenser outlet pressures (2 circuits)
Pressure transmitter attached to liquid line Schrader valve
Rosemount 3051C ±0.04% span (0–400 psig)
T SUC
Refrigerant temperatures (compressor suction and discharge, condensed liquid)
Type-T thermocouples (6 total) clamped to outside of refrigerant tubing with thermal paste and wrapped in insulation
Therm-X ±0.5°F T DIS T LIQ
kW RTU Unit Supply Power, Voltage and Current
3-element true-RMS power meter with outputs for total power, 3-phase voltage and 3-phase current
Yokogawa 2533 ±0.2% read ±0.1% f.s.
SPEED CW IEC Fan Speed Speed signal from IEC controller
POS DMPR RTU Outside Air Damper Position DC voltage signal from damper actuator
CT C1 Sub-components Line Current
Clamp-on current transmitter on one leg of the power feeding each of two compressors, two fans (fan, cond fan, comp 1 and 2)
NK Technologies ATR1 ±1% of f.s. (±0.2 A)
CT C2 CT CF CT RTU FAN

Southern California Edison Page 19
Customer Programs & Services April 2015
DESIGN OF EXPERIMENTS In order to characterize performance for the test unit, laboratory tests were arranged into two groups:
1. Airflow-only tests to map performance for the RTU and IEC fans 2. Thermal performance tests to map performance of the combined system in all modes of operation
and across a range of environmental operating conditions
The combination was tested across the range of psychrometric conditions recorded in Table 3 and illustrated on a psychrometric chart in Figure 6. Table 4 describes the different modes of operation evaluated.
TABLE 3. RANGE OF TEST CONDITIONS USED FOR DESIGN OF EXPERIMENTS
TDB (°F) TWB (°F) CORRESPONDS TO
Return Air 78 64 Western Return Air
Outs
ide
Air C
ondi
tions
105 73 Western “Peak”
95 75 ANSI/AHRI 340/360 “Nominal” Rating & IEER 100% Capacity
90 64 Western “Annual”
82 73 “Warm Humid”
81.5 66.3 ANSI/AHRI 340/360 IEER 75% Capacity
78 58.5 “Warm Dry”
68 57.5 ANSI/AHRI 340/360 IEER 50% Capacity
65 52.8 ANSI/AHRI 340/360 IEER 25% Capacity
65 52.8 ANSI/AHRI 340/360 IEER 25% Capacity
FIGURE 6. PSYCHROMETRIC CHART – RANGE OF TARGET TEST CONDITIONS, AND DESIGN CONDITIONS FOR SEVERAL CITIES
10%
20%
30%
40%
0.000
0.005
0.010
0.015
0.020
0.025
40 50 60 70 80 90 100 110
Hum
idity
Rat
io -
lb m
oist
ure /
lb d
ry a
ir
Dry Bulb Temperature - °F
Annual Conditions in CA CZ 12
Test Conditions
Select ASHRAE 0.4% Design Conditions
WAR
M H
UMID
IEER
50%
IEER
25%
RETU
RN A
IR
WAR
M D
RY
AHRI
NOM
INAL
WES
TERN
PEA
K
WES
TERN
AN
NUA
L
Southern California Edison Page 20
Customer Programs & Services April 2015
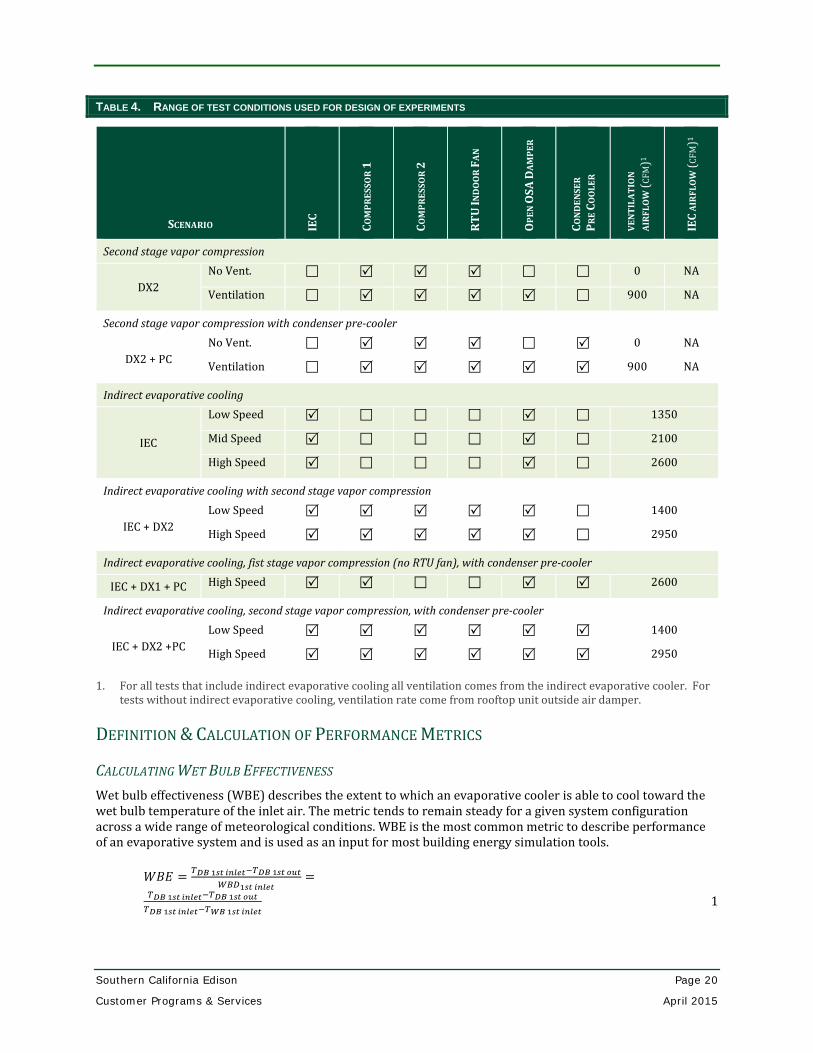
TABLE 4. RANGE OF TEST CONDITIONS USED FOR DESIGN OF EXPERIMENTS
SCENARIO IEC
COM
PRES
SOR
1
COM
PRES
SOR
2
RTU
IND
OO
R FA
N
OPE
N O
SA D
AMPE
R
CON
DEN
SER
PR
E CO
OLE
R
VEN
TILA
TIO
N
AIRF
LOW
(CFM
)1
IEC
AIR
FLO
W (C
FM)1
Second stage vapor compression
DX2 No Vent. 0 NA
Ventilation 900 NA
Second stage vapor compression with condenser pre-cooler
DX2 + PC No Vent. 0 NA
Ventilation 900 NA
Indirect evaporative cooling
IEC
Low Speed 1350
Mid Speed 2100
High Speed 2600
Indirect evaporative cooling with second stage vapor compression
IEC + DX2 Low Speed 1400
High Speed 2950
Indirect evaporative cooling, fist stage vapor compression (no RTU fan), with condenser pre-cooler
IEC + DX1 + PC High Speed 2600
Indirect evaporative cooling, second stage vapor compression, with condenser pre-cooler
IEC + DX2 +PC Low Speed 1400
High Speed 2950
1. For all tests that include indirect evaporative cooling all ventilation comes from the indirect evaporative cooler. For tests without indirect evaporative cooling, ventilation rate come from rooftop unit outside air damper.
DEFINITION & CALCULATION OF PERFORMANCE METRICS
CALCULATING WET BULB EFFECTIVENESS Wet bulb effectiveness (WBE) describes the extent to which an evaporative cooler is able to cool toward the wet bulb temperature of the inlet air. The metric tends to remain steady for a given system configuration across a wide range of meteorological conditions. WBE is the most common metric to describe performance of an evaporative system and is used as an input for most building energy simulation tools.
𝑊𝑊𝑊𝑊𝐸𝐸 = 𝑇𝑇𝐷𝐷𝐷𝐷 1𝑠𝑠𝑠𝑠 𝑖𝑖𝑖𝑖𝑖𝑖𝑖𝑖𝑠𝑠−𝑇𝑇𝐷𝐷𝐷𝐷 1𝑠𝑠𝑠𝑠 𝑜𝑜𝑜𝑜𝑠𝑠𝑊𝑊𝑊𝑊𝑊𝑊1𝑠𝑠𝑠𝑠 𝑖𝑖𝑖𝑖𝑖𝑖𝑖𝑖𝑠𝑠
=𝑇𝑇𝐷𝐷𝐷𝐷 1𝑠𝑠𝑠𝑠 𝑖𝑖𝑖𝑖𝑖𝑖𝑖𝑖𝑠𝑠−𝑇𝑇𝐷𝐷𝐷𝐷 1𝑠𝑠𝑠𝑠 𝑜𝑜𝑜𝑜𝑠𝑠𝑇𝑇𝐷𝐷𝐷𝐷 1𝑠𝑠𝑠𝑠 𝑖𝑖𝑖𝑖𝑖𝑖𝑖𝑖𝑠𝑠−𝑇𝑇𝑊𝑊𝐷𝐷 1𝑠𝑠𝑠𝑠 𝑖𝑖𝑖𝑖𝑖𝑖𝑖𝑖𝑠𝑠
1
Southern California Edison Page 21
Customer Programs & Services April 2015
The metric has traditionally been used to describe performance of direct evaporative coolers, but it can also be applied to indirect evaporative equipment. Since indirect evaporative heat exchangers use a secondary air stream that can have an inlet wet bulb temperature that is lower than that of the primary inlet, it is possible to achieve better than 100% effectiveness.
Describing performance in terms of wet bulb effectiveness offers good conceptual comparison against conventional evaporative coolers, but since the metric does not align with the physical heat transfer mechanisms active in the indirect evaporative heat exchanger, it usually does not give rise to a useful empirical correlation that can used for system modeling. Alternative metrics use the wet bulb temperature of the secondary air stream, or the dew point temperature of the primary air stream as the theoretical potential for an effectiveness ratio.
The conventional wet bulb effectiveness is used to describe equipment performance here, as well as an indirect wet bulb effectiveness that accounts for the wet bulb potential in the secondary air stream:
𝐼𝐼𝐼𝐼𝐼𝐼.𝑊𝑊𝑊𝑊𝐸𝐸 = 𝑇𝑇𝐷𝐷𝐷𝐷 1𝑠𝑠𝑠𝑠 𝑖𝑖𝑖𝑖𝑖𝑖𝑖𝑖𝑠𝑠−𝑇𝑇𝐷𝐷𝐷𝐷 1𝑠𝑠𝑠𝑠 𝑜𝑜𝑜𝑜𝑠𝑠𝐼𝐼𝐼𝐼𝐼𝐼.𝑊𝑊𝑊𝑊𝑊𝑊
= 𝑇𝑇𝐷𝐷𝐷𝐷 1𝑠𝑠𝑠𝑠 𝑖𝑖𝑖𝑖𝑖𝑖𝑖𝑖𝑠𝑠−𝑇𝑇𝐷𝐷𝐷𝐷 1𝑠𝑠𝑠𝑠 𝑜𝑜𝑜𝑜𝑠𝑠𝑇𝑇𝐷𝐷𝐷𝐷 1𝑠𝑠𝑠𝑠 𝑖𝑖𝑖𝑖𝑖𝑖𝑖𝑖𝑠𝑠−𝑇𝑇𝑊𝑊𝐷𝐷 2𝑖𝑖𝑛𝑛 𝑖𝑖𝑖𝑖𝑖𝑖𝑖𝑖𝑠𝑠
2
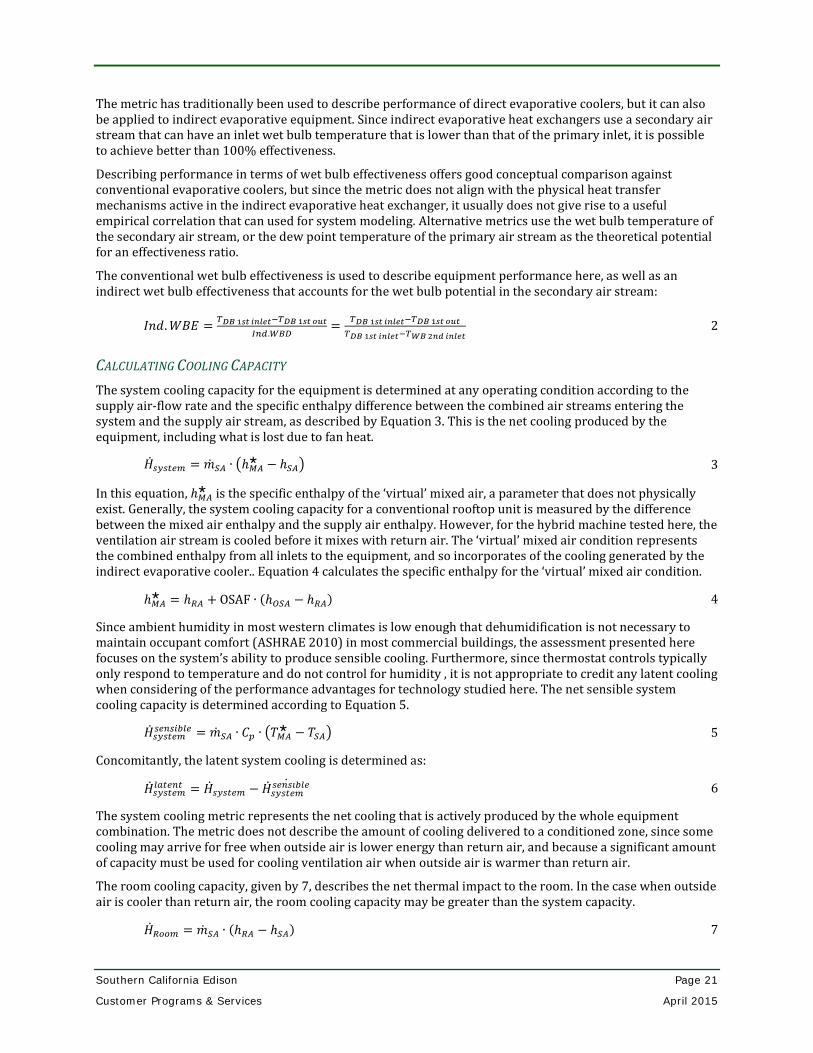
CALCULATING COOLING CAPACITY The system cooling capacity for the equipment is determined at any operating condition according to the supply air-flow rate and the specific enthalpy difference between the combined air streams entering the system and the supply air stream, as described by Equation 3. This is the net cooling produced by the equipment, including what is lost due to fan heat.
�̇�𝐻𝑠𝑠𝑠𝑠𝑠𝑠𝑠𝑠𝑠𝑠𝑠𝑠 = �̇�𝑚𝑆𝑆𝑆𝑆 ∙ �ℎ𝑀𝑀𝑆𝑆 − ℎ𝑆𝑆𝑆𝑆� 3
In this equation, ℎ𝑀𝑀𝑆𝑆 is the specific enthalpy of the ‘virtual’ mixed air, a parameter that does not physically exist. Generally, the system cooling capacity for a conventional rooftop unit is measured by the difference between the mixed air enthalpy and the supply air enthalpy. However, for the hybrid machine tested here, the ventilation air stream is cooled before it mixes with return air. The ‘virtual’ mixed air condition represents the combined enthalpy from all inlets to the equipment, and so incorporates of the cooling generated by the indirect evaporative cooler.. Equation 4 calculates the specific enthalpy for the ‘virtual’ mixed air condition.
ℎ𝑀𝑀𝑆𝑆 = ℎ𝑅𝑅𝑆𝑆 + OSAF ∙ (ℎ𝑂𝑂𝑆𝑆𝑆𝑆 − ℎ𝑅𝑅𝑆𝑆) 4
Since ambient humidity in most western climates is low enough that dehumidification is not necessary to maintain occupant comfort (ASHRAE 2010) in most commercial buildings, the assessment presented here focuses on the system’s ability to produce sensible cooling. Furthermore, since thermostat controls typically only respond to temperature and do not control for humidity , it is not appropriate to credit any latent cooling when considering of the performance advantages for technology studied here. The net sensible system cooling capacity is determined according to Equation 5.
�̇�𝐻𝑠𝑠𝑠𝑠𝑠𝑠𝑠𝑠𝑠𝑠𝑠𝑠𝑠𝑠𝑠𝑠𝐼𝐼𝑠𝑠𝑠𝑠𝑠𝑠𝑠𝑠𝑠𝑠 = �̇�𝑚𝑆𝑆𝑆𝑆 ∙ 𝐶𝐶𝑝𝑝 ∙ �𝑇𝑇𝑀𝑀𝑆𝑆 − 𝑇𝑇𝑆𝑆𝑆𝑆� 5
Concomitantly, the latent system cooling is determined as:
�̇�𝐻𝑠𝑠𝑠𝑠𝑠𝑠𝑠𝑠𝑠𝑠𝑠𝑠𝑠𝑠𝑙𝑙𝑠𝑠𝑠𝑠𝐼𝐼𝑠𝑠 = �̇�𝐻𝑠𝑠𝑠𝑠𝑠𝑠𝑠𝑠𝑠𝑠𝑠𝑠 − �̇�𝐻𝑠𝑠𝑠𝑠𝑠𝑠𝑠𝑠𝑠𝑠𝑠𝑠𝑠𝑠𝑠𝑠𝐼𝐼𝑠𝑠𝑠𝑠𝑠𝑠𝑠𝑠𝑠𝑠̇ 6
The system cooling metric represents the net cooling that is actively produced by the whole equipment combination. The metric does not describe the amount of cooling delivered to a conditioned zone, since some cooling may arrive for free when outside air is lower energy than return air, and because a significant amount of capacity must be used for cooling ventilation air when outside air is warmer than return air.
The room cooling capacity, given by 7, describes the net thermal impact to the room. In the case when outside air is cooler than return air, the room cooling capacity may be greater than the system capacity.
�̇�𝐻𝑅𝑅𝑅𝑅𝑅𝑅𝑠𝑠 = �̇�𝑚𝑆𝑆𝑆𝑆 ∙ (ℎ𝑅𝑅𝑆𝑆 − ℎ𝑆𝑆𝑆𝑆) 7

Southern California Edison Page 22
Customer Programs & Services April 2015
CALCULATING ENERGY EFFICIENCY RATIO Energy efficiency for the equipment at any given operating condition is expressed as the ratio of useful thermal capacity delivered (in units of kbtu/h) to electrical power consumed by the system (in units of kW) – the Energy Efficiency Ratio (in units of kbtu/kWh):
𝐸𝐸𝐸𝐸𝐸𝐸 =𝑇𝑇ℎ𝑒𝑒𝑒𝑒𝑚𝑚𝑒𝑒𝑒𝑒 𝐸𝐸𝐼𝐼𝑒𝑒𝑒𝑒𝐸𝐸𝐸𝐸 𝐷𝐷𝑒𝑒𝑒𝑒𝐷𝐷𝐷𝐷𝑒𝑒𝑒𝑒𝑒𝑒𝐼𝐼𝐸𝐸𝑒𝑒𝑒𝑒𝐸𝐸𝐸𝐸𝑒𝑒𝐷𝐷𝐸𝐸𝑒𝑒𝑒𝑒 𝐸𝐸𝐼𝐼𝑒𝑒𝑒𝑒𝐸𝐸𝐸𝐸 𝐶𝐶𝐶𝐶𝐼𝐼𝐶𝐶𝐶𝐶𝑚𝑚𝑒𝑒𝐼𝐼 =
�̇�𝐻�̇�𝐸𝑠𝑠𝑠𝑠𝑠𝑠𝑠𝑠𝑠𝑠𝑠𝑠
= �𝑘𝑘𝑘𝑘𝐸𝐸𝐶𝐶𝑘𝑘𝑊𝑊ℎ� 8
The EER values presented in this report should not be confused with or compared directly to the AHRI nominal EER, SEER, or IEER values for conventional air conditioners since those metrics describe performance at specific conditions that cannot be replicated for the systems evaluated in this study. For this report EER is presented as a generic metric that varies with conditions, and with frame of reference.
The efficiency assessment presented here only credits sensible cooling capacity, since dehumidification is usually not required, nor controlled for in commercial cooling applications in California. The Sensible Energy Efficiency Ratio can be expressed as:
𝐸𝐸𝐸𝐸𝐸𝐸𝑠𝑠𝑠𝑠𝐼𝐼𝑠𝑠𝑠𝑠𝑠𝑠𝑠𝑠𝑠𝑠 =�̇�𝐻𝑠𝑠𝑠𝑠𝐼𝐼𝑠𝑠𝑠𝑠𝑠𝑠𝑠𝑠𝑠𝑠�̇�𝐸𝑠𝑠𝑠𝑠𝑠𝑠𝑠𝑠𝑠𝑠𝑠𝑠
9
Further, performance results are described both in terms of the Sensible System EER, and the Sensible Room EER. The first metric considers how much energy is consumed to generate a cooling across the machine; the second considers the ratio of that energy consumption to the cooling effect on the room:
𝐸𝐸𝐸𝐸𝐸𝐸𝑠𝑠𝑠𝑠𝑠𝑠𝑠𝑠𝑠𝑠𝑠𝑠𝑠𝑠𝑠𝑠𝐼𝐼𝑠𝑠𝑠𝑠𝑠𝑠𝑠𝑠𝑠𝑠 =�̇�𝐻𝑠𝑠𝑠𝑠𝑠𝑠𝑠𝑠𝑠𝑠𝑠𝑠𝑠𝑠𝑠𝑠𝐼𝐼𝑠𝑠𝑠𝑠𝑠𝑠𝑠𝑠𝑠𝑠
�̇�𝐸𝑠𝑠𝑠𝑠𝑠𝑠𝑠𝑠𝑠𝑠𝑠𝑠 10
and
𝐸𝐸𝐸𝐸𝐸𝐸𝑟𝑟𝑅𝑅𝑅𝑅𝑠𝑠𝑠𝑠𝑠𝑠𝐼𝐼𝑠𝑠𝑠𝑠𝑠𝑠𝑠𝑠𝑠𝑠 =�̇�𝐻𝑟𝑟𝑅𝑅𝑅𝑅𝑠𝑠𝑠𝑠𝑠𝑠𝐼𝐼𝑠𝑠𝑠𝑠𝑠𝑠𝑠𝑠𝑠𝑠
�̇�𝐸𝑠𝑠𝑠𝑠𝑠𝑠𝑠𝑠𝑠𝑠𝑠𝑠 11

Southern California Edison Page 23
Customer Programs & Services April 2015
RESULTS & DISCUSSION Laboratory testing of the IEC and condenser pre-cooler retrofit package was conducted at eight climate conditions and in eleven different operating modes. The results presented in this section focus on airflow characteristics, sensible cooling capacity, total system energy use, and water use for evaporation. The performance and efficiency in each mode is compared to the measured performance of the rooftop unit operating without the evaporative retrofits. Beyond the combined system performance metrics, these results also describe characteristics such as wet-bulb effectiveness for the indirect evaporative cooler alone.
FAN MAPPING
LEGEND: Damper Fraction Open RTU Fan 20% ON Product Airflow 40% OFF Power 60% Case Static Pressure 80% 100% FIGURE 7: MAP OF IEC FAN AIRFLOW, POWER CONSUMPTION, & CASE STATIC PRESSURE
ACROSS A RANGE OF FAN SPEEDS, WITH DIFFERENT DAMPER OPENINGS, AND WITH THE RTU FAN ON AND OFF FOR REFERENCE, MANUFACTURER RECOMMENDS TO SET DAMPER SO FULL SPEED CASE PRESSURE = 0.72 (INWG)
Figure 7plots the results from airflow testing of the IEC across a range of fan speeds, with different balancing damper positions, and with the RTU fan ON. Test results are also shown for a range of fan speeds with the damper fully open and the RTU fan OFF. The IEC fan speed was managed by the manufacturer supplied digital room controller, set to ventilation mode, and was adjusted from setting 2–10. The map presents the product airflow rate, the system power consumption, and the static pressure measured at the outlet of the indirect evaporative heat exchanger, upstream of the product air balancing damper. See Figure 5 for illustration of the case static pressure measurement location. The values presented for power represent to the real power consumption for the IEC, including ancillary power for controls. The values for airflow represent the product airflow rate measured by the pitot tube airflow measurement station in the duct connecting the IEC and the RTU – not the IEC fan flow rate.
0.0
0.4
0.8
1.2
1.6
2.0
0
500
1,000
1,500
2,000
2,500
3,000
3,500
2 4 6 8 10
Case
Sta
tic P
ress
ure
(inW
G) a
nd P
ower
(kW
)
IEC
Prod
uct A
irflo
w (C
FM)
IEC Fan Speed Setting

Southern California Edison Page 24
Customer Programs & Services April 2015
As discussed previously, performance of the indirect evaporative cooler is sensitive to the downstream airflow resistance because the static pressure at the primary outlet of the heat exchanger drives flow through the secondary passages of the heat exchanger. The downstream airflow resistance can be adjusted with a balancing damper located at the IEC product air outlet as indicated in Figure 2. Manufacturer documentation indicates that the appropriate balance between primary and secondary airflow should be achieved when the dampers is adjusted so that the case static pressure operates at to 0.72 inWG while the IEC is at full speed. As long as the external resistance remains steady, the ratio of primary- secondary airflow should remain the same even while the IEC changes fan speed.
The results from airflow testing indicate that the rooftop unit and distribution ductwork provide more downstream resistance than is needed for the IEC. At full speed, with the balancing damper fully open, and the RTU fan OFF, the case static pressure reaches 0.865 inWG. Therefore, in order to reach the targeted primary-secondary balance the RTU fan would need to operate in combination with the IEC fan at all times. However, since the RTU fan consumes almost as much electricity as the IEC fan, the research team decided that the indirect evaporative only mode would operate without the RTU fan. This results in a lower than intended product airflow in this mode. It also results in a lower product air temperature on account of the fact that the primary-secondary airflow ratio decreases.
The airflow map provided in Figure 7 shows the IEC product airflow rates only and does not represent the supply airflow to the building. Supply air flow rates were different for each thermal test, and varied mainly according to the IEC fan speed and whether or not the RTU fan was enabled. For some operating modes the combination was tested at multiple airflow rates, in which case the IEC was adjusted to speed settings 10 (high), 8 (mid), and 5 (low). When the RTU fan operates in series with the IEC fan the supply air to the building is a mixture of product air and return air. One should also note that when the IEC operates without the RTU fan, some airflow is driven through the supply ductwork, and some passes backward through the return air ductwork. Inevitably, some of the product air also leaks out of the rooftop unit cabinet. For all of the results presented here, cooling capacity and efficiency are calculated according to the assumption that no air volume is lost to leakage, and assuming that there are no thermal losses as product air passes through the rooftop unit. Therefore, for operation in indirect evaporative only mode with the rooftop unit fan off:
�̇�𝐻𝑠𝑠𝑠𝑠𝑠𝑠𝑠𝑠𝑠𝑠𝑠𝑠𝑠𝑠𝑠𝑠𝐼𝐼𝑠𝑠𝑠𝑠𝑠𝑠𝑠𝑠𝑠𝑠 = �̇�𝑚𝑃𝑃𝑆𝑆 ∙ 𝐶𝐶𝑝𝑝 ∙ �𝑇𝑇𝑂𝑂𝑆𝑆𝑆𝑆 − 𝑇𝑇𝑃𝑃𝑆𝑆� 12
For combined modes with indirect evaporative and vapor compression with the rooftop unit fan on:
�̇�𝐻𝑠𝑠𝑠𝑠𝑠𝑠𝑠𝑠𝑠𝑠𝑠𝑠𝑠𝑠𝑠𝑠𝐼𝐼𝑠𝑠𝑠𝑠𝑠𝑠𝑠𝑠𝑠𝑠 = �̇�𝑚𝑆𝑆𝑆𝑆 ∙ 𝐶𝐶𝑝𝑝 ∙ �𝑇𝑇𝑅𝑅𝑆𝑆 + �̇�𝑠𝑃𝑃𝑃𝑃�̇�𝑠𝑆𝑆𝑃𝑃
∙ (𝑇𝑇𝑂𝑂𝑆𝑆𝑆𝑆 − 𝑇𝑇𝑅𝑅𝑆𝑆) − 𝑇𝑇𝑆𝑆𝑆𝑆� 13
Finally, for indirect evaporative cooling and vapor compression with the rooftop unit fan off:
�̇�𝐻𝑠𝑠𝑠𝑠𝑠𝑠𝑠𝑠𝑠𝑠𝑠𝑠𝑠𝑠𝑠𝑠𝐼𝐼𝑠𝑠𝑠𝑠𝑠𝑠𝑠𝑠𝑠𝑠 = �̇�𝑚𝑆𝑆𝑆𝑆 ∙ 𝐶𝐶𝑝𝑝 ∙ �𝑇𝑇𝑂𝑂𝑆𝑆𝑆𝑆 − 𝑇𝑇𝑆𝑆𝑆𝑆� + (�̇�𝑚𝑃𝑃𝑆𝑆 − �̇�𝑚𝑆𝑆𝑆𝑆) ∙ 𝐶𝐶𝑝𝑝 ∙ �𝑇𝑇𝑂𝑂𝑆𝑆𝑆𝑆 − 𝑇𝑇𝑃𝑃𝑆𝑆�
14

Southern California Edison Page 25
Customer Programs & Services April 2015
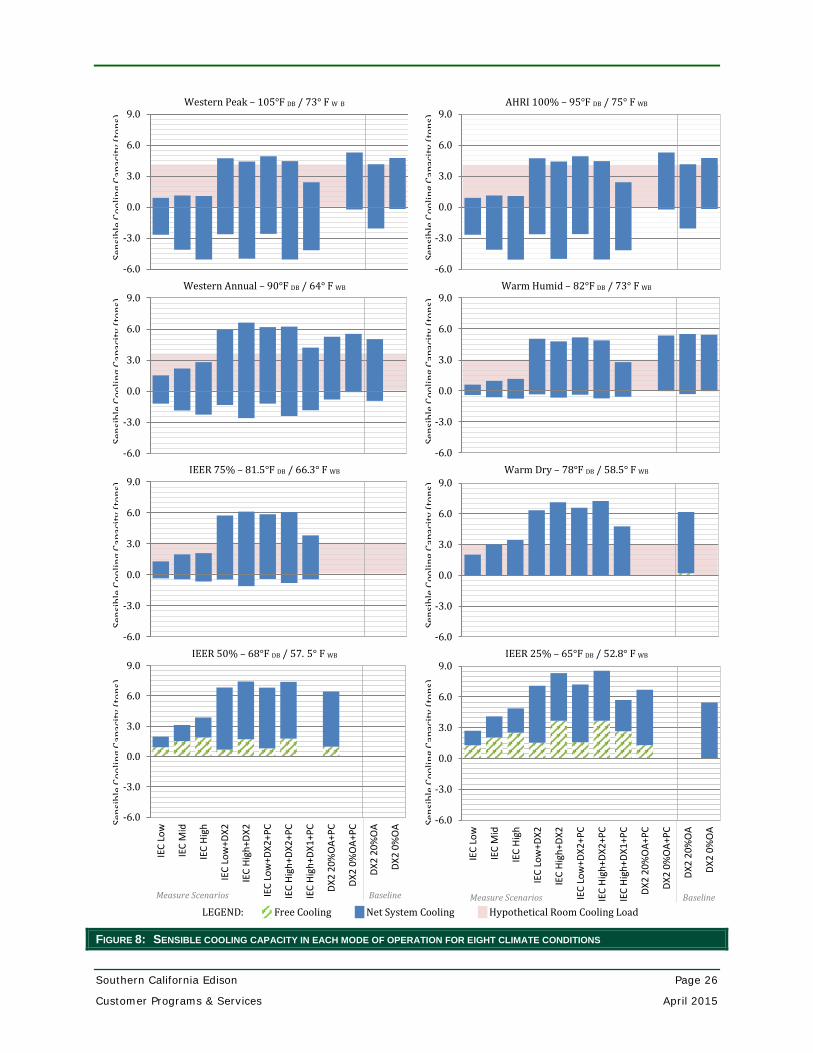
COOLING CAPACITY Figure 8 charts the sensible cooling capacity in each mode of operation for all eight outside air conditions tested. In each plot, the absolute magnitude of each bar represents the system sensible cooling capacity, while the vertical placement of each bar indicates what portion of the system capacity cools ventilation air to room-neutral conditions, and what portion provides sensible room cooling. Zero on the vertical axis corresponds to room-neutral temperature, and the value at the top of each bar indicates the sensible room cooling capacity delivered. The bottom of each blue bar indicates the sensible ventilation cooling load (recorded as negative room cooling). If the outside air is already cooler than the return air, the associated “free” room cooling capacity is recorded in Figure 8 as a green hatch, and additional system cooling begins from that point.
One advantage for the IEC is that system sensible cooling capacity increases as outside air temperature increases. However, the supply air increases concurrently, so the room cooling capacity is lower at high outside air temperatures. This trend is shown in Figure 8, while the IEC generates 6.4 tons of cooling at 105°FDB/73°FWB in mode “IEC High”, the net impact to the room is only 1.3 tons. By comparison, at 78°FDB/58.5°FWB the sensible system capacity and sensible room cooling capacity are both 3.4 tons.
For any given environmental condition, the system combination tested would need to operate in a way that satisfies the sensible room cooling load and provides adequate ventilation. When there are multiple modes of operation that would satisfy these requirements, controls should choose the most efficient option. Figure 8 allows for direct comparison of the room cooling capacity in each mode. In addition to the capacity measured for every mode, each chart also overlays a hypothetical room cooling load for the corresponding condition. This is shown as a red area in the background of each chart. The room cooling load at peak was chosen to match the measured room cooling capacity for the baseline rooftop unit operating with a 20% outside air fraction. The hypothetic room cooling load for other conditions was adjusted to corresponds roughly with industry standard methodology for determination of the Integrated Energy Efficiency Ratio (AHRI 2011).
Figure 8 indicates that at 105°FDB/73°FWB , the preferred operating mode should be “IEC-Low + DX2 + PC”. Indirect evaporative at full speed does not provide enough cooling at this point, and addition of the first stage compressor is still not enough to match the hypothetical load. Interestingly, although the sensible system capacity for indirect evaporative cooling at this condition increases with fan speed, the room cooling capacity remains about the same regardless of speed. This occurs because the product air temperature rises as the product airflow rate increases. As a result, for the hybrid operating modes, it appears to be most beneficial to operate the IEC at part speed in combination with both compressors. The condenser pre-cooler further enhances cooling capacity and efficiency for any mode with vapor compression cooling.
At 90°FDB/64°FWB, the capacity for mode “IEC-High+DX1+PC” matches the hypothetical room load almost exactly. In this mode the IEC operates at full speed, with a single compressor, but no rooftop unit blower. The product airflow rate supplied by the IEC is large enough to sustain first stage compressor operation, but probably not large enough to sustain second stage compressor operation without freezing on the evaporator coil.
Although the capacity for mode “IEC-High+DX1+PC” matches the load at 90°FDB/64°FWB, it would be short sighted to assume that this would be the best operating scenario for the condition. Additional benefits can be gained by cycling between a higher capacity stage, and a lower capacity stage. In fact, if “IEC-High” ran with a 80% runtime fraction in combination with “IEC-Low+DX2+PC” at 20% runtime fraction, the aggregate capacity would match the load and the average room cooling efficiency would be 50% higher than for mode “IEC-High+DX1+PC”. The resulting efficiency would save 54% on hourly energy use for cooling compared to the baseline rooftop unit with 20% outside air.
At part load conditions, the IEC offers the outstanding benefits because it allows for operation without compressors altogether. For the hypothetical scenario presented, compressor cooling would not be needed at all below about 80°F. This is especially valuable because the largest cumulative portion of annual cooling requirements for commercial buildings occur in these mid-range conditions (AHRI 2011).
Below about 70°F the IEC should be able to cover all room cooling loads at low speed, where it operates with EER>45.
Southern California Edison Page 26
Customer Programs & Services April 2015
Sens
ible
Coo
ling
Capa
city
(ton
s)
Western Peak – 105°F DB / 73° F W B
Sens
ible
Coo
ling
Capa
city
(ton
s)
AHRI 100% – 95°F DB / 75° F WB
Sens
ible
Coo
ling
Capa
city
(ton
s)
Western Annual – 90°F DB / 64° F WB
Sens
ible
Coo
ling
Capa
city
(ton
s)
Warm Humid – 82°F DB / 73° F WB
Sens
ible
Coo
ling
Capa
city
(ton
s)
IEER 75% – 81.5°F DB / 66.3° F WB
Sens
ible
Coo
ling
Capa
city
(ton
s)
Warm Dry – 78°F DB / 58.5° F WB
Sens
ible
Coo
ling
Capa
city
(ton
s)
IEER 50% – 68°F DB / 57. 5° F WB
Sens
ible
Coo
ling
Capa
city
(ton
s)
IEER 25% – 65°F DB / 52.8° F WB
LEGEND: Free Cooling Net System Cooling Hypothetical Room Cooling Load
FIGURE 8: SENSIBLE COOLING CAPACITY IN EACH MODE OF OPERATION FOR EIGHT CLIMATE CONDITIONS
-6.0
-3.0
0.0
3.0
6.0
9.0
-6.0
-3.0
0.0
3.0
6.0
9.0
-6.0
-3.0
0.0
3.0
6.0
9.0
-6.0
-3.0
0.0
3.0
6.0
9.0
-6.0
-3.0
0.0
3.0
6.0
9.0
-6.0
-3.0
0.0
3.0
6.0
9.0
-6.0
-3.0
0.0
3.0
6.0
9.0
IEC
Low
IEC
Mid
IEC
High
IEC
Low
+DX2
IEC
High
+DX2
IEC
Low
+DX2
+PC
IEC
High
+DX2
+PC
IEC
High
+DX1
+PC
DX2
20%
OA+
PC
DX2
0%O
A+PC
DX2
20%
OA
DX2
0%O
A -6.0
-3.0
0.0
3.0
6.0
9.0
IEC
Low
IEC
Mid
IEC
High
IEC
Low
+DX2
IEC
High
+DX2
IEC
Low
+DX2
+PC
IEC
High
+DX2
+PC
IEC
High
+DX1
+PC
DX2
20%
OA+
PC
DX2
0%O
A+PC
DX2
20%
OA
DX2
0%O
A
Measure Scenarios Baseline Measure Scenarios Baseline

Southern California Edison Page 27
Customer Programs & Services April 2015
SYSTEM POWER & EFFICIENCY Figure 9 charts the power draw from each component in each mode of operation for the eight outside air conditions tested. Figure 10 charts the sensible system energy efficiency ratio and the sensible room energy efficiency ratio for the same tests.
Power draw for the IEC is much smaller than power for compressor cooling. As a result, the indirect evaporative cooling modes achieve very high efficiency. At 105°FDB/73°FWB, mode “IEC-Low” reaches EER=79.2. That said, an appropriate comparison must consider the room cooling load, and ventilation requirements associated with each climate condition for a particular application. In the scenario considered here, mode “IEC-Low” would provide adequate ventilation, but it would not provide enough sensible room cooling to cover loads at 105°FDB/73°FWB.
In every climate condition tested, the IEC and condenser pre-cooler retrofit can increase cooling capacity and improve efficiency. This is even true for the “Warm Humid” scenario 82°F DB/73° F WB, where an aggregate combination of modes “IEC-High” and “DX2–0% OSA” would increase sensible room cooling efficiency by 5%.
For peak conditions – 105°FDB/73°FWB – an aggregate combination of modes ”IECLOW+DX2+PC” and “IECLOW” would reduce energy use for cooling by 3.1 kWh/hr compared to the baseline rooftop unit with 20% outside air. This equates a savings of more than 25%. At 90°FDB/64°FWB the system can spend less time operating with compressor cooling, so an aggregate combination of “IEC HIGH” and “IEC LOW+DX2+PC” would reduce energy use for cooling by 4.3 kWh/hr – a 54% savings.
At milder conditions where indirect evaporative cooling can carry the entire room cooling load, the fractional savings potential increases substantially. At 78°FDB/58.5°FWB they system could reduce energy consumption by 75% – or 2.7 kWh/hr – by operating in mode “IECHIGH” for 20% of the time then in mode “IECLOW” for the remainder of the time. In this scenario, the aggregate sensible room cooling would be 75% of the room cooling load at peak. Of course, the savings achieved at any given condition depends on the room cooling load profile for the actual application in question. For a building where sensible room cooling load at 78°FDB is only half the sensible room cooling load at peak, the IEC could operate in mode “IECLOW” which would reduce energy use for cooling by 85%.
The potential for savings increases when applied in scenarios with higher ventilation needs.
Notwithstanding the opportunity for substantial energy savings across a wide range of climate conditions, we also note that the hybrid combination evaluated here results in higher electrical power demand than the baseline rooftop unit in almost all circumstances. That is to say, although the measure saves energy, the connected load increases, so electric demand for the IEC, RTU, and pre-cooler operating concurrently will be larger than for the RTU operating alone. This trend is evident in Figure 9 – at 105°FDB/73°FWB , mode “DX 2 – 20% OSA” draws 11.2 kW and mode “IEC High + DX2 + PC” draws 12.8 kW.
The implication of this increase in electrical demand will vary by application. For a small commercial building with a single rooftop unit, the measure might increase demand charges because the single largest 15 minute interval energy consumption will likely occur with all components operating. However, for larger customers with many rooftop units it will be far less likely that all systems at a facility operate simultaneously, so peak demand charges would not increase. The condenser pre-cooler plays a valuable role in these respects since it increases cooling capacity while also reducing instantaneous electrical demand. In any circumstance, the authors recommend that efforts to apply the measure should consider means to reduce connected load. For example, in certain circumstances, addition of the IEC could justify permanent disconnection of one compressor.
For the grid as a whole, since the measure reduces aggregate energy consumption for each site, it will provide needed benefits for network-wide peak demand reduction.

Southern California Edison Page 28
Customer Programs & Services April 2015
Pow
er (k
W)
Western Peak – 105°F DB / 73° F WB
Pow
er (k
W)
AHRI 100% – 95°F DB / 75° F WB
Pow
er (k
W)
Western Annual – 90°F DB / 64° F WB
Pow
er (k
W)
Warm Humid – 82°F DB / 73° F WB
Pow
er (k
W)
IEER 75% – 81.5°F DB / 66.3° F WB
Pow
er (k
W)
Warm Dry – 78°F DB / 58.5° F WB
Pow
er (k
W)
IEER 50% – 68°F DB / 57.5° F WB
Pow
er (k
W)
IEER 25% – 65°F DB / 52.8° F WB
LEGEND: Comp. 1 Comp. 2 Fan Cond. Fan IEC Pre-Cooler
FIGURE 9: ELECTRIC POWER CONSUMPTION FROM EACH COMPONENT IN EACH MODE OF OPERATION
0
2
4
6
8
10
12
14
16
0
2
4
6
8
10
12
14
16
0
2
4
6
8
10
12
14
16
0
2
4
6
8
10
12
14
16
0
2
4
6
8
10
12
14
16
0
2
4
6
8
10
12
14
16
0
2
4
6
8
10
12
14
16
IEC
Low
IEC
Mid
IEC
High
IEC
Low
+DX2
IEC
High
+DX2
IEC
Low
+DX2
+PC
IEC
High
+DX2
+PC
IEC
High
+DX1
+PC
DX2
20%
OA+
PC
DX2
0%O
A+PC
DX2
20%
OA+
PC
DX2
0%O
A
0
2
4
6
8
10
12
14
16
IEC
Low
IEC
Mid
IEC
High
IEC
Low
+DX2
IEC
High
+DX2
IEC
Low
+DX2
+PC
IEC
High
+DX2
+PC
IEC
High
+DX1
+PC
DX2
20%
OA+
PC
DX2
0%O
A+PC
DX2
20%
OA+
PC
DX2
0%O
A
DX2
20%
OA
DX2
0%O
A
DX2
20%
OA
DX2
0%O
A
Measure Scenarios Baseline Measure Scenarios Baseline

Southern California Edison Page 29
Customer Programs & Services April 2015
Sen
s Sys
EER
Sen
s Rm
EER
Western Peak – 105°F DB / 73° F WB
Sen
s Sys
EER
Sen
s Rm
EER
AHRI 100% – 95°F DB / 75° F WB
Sen
s Sys
EER
Sen
s Rm
EER
Western Annual – 90°F DB / 64° F WB
Sen
s Sys
EER
Sen
s Rm
EER
Warm Humid – 82°F DB / 73° F WB
Sen
s Sys
EER
Sen
s Rm
EER
IEER 75% – 81.5°F DB / 66.3° F WB
S
ens S
ys E
ER
S
ens R
m E
ER
Warm Dry – 78°F DB / 58.5° F WB
Sen
s Sys
EER
Sen
s Rm
EER
IEER 50% – 68°F DB / 57.5° F WB
Sen
s Sys
EER
Sen
s Rm
EER
IEER 25% – 65°F DB / 52.8° F WB
LEGEND: Sensible System EER (kbtu/kW) Sensible Room EER (kbtu/kW)
FIGURE 10: ENERGY EFFICIENCY RATIO IN EACH MODE OF OPERATION
19.8
11.4
02468
10
79.2
53.2
38.7
02468
101214161820
20.9
12.1
02468
10
69.2
45.5
33.4
02468
101214161820
35.2
22.3
18.0
02468
10
62.8
41.4
32.5
02468
101214161820
13.6
10.0
02468
10
22.2
02468
101214161820
29.8
20.5
13.3
02468
10
37.7
25.0
02468
101214161820 46
.6
32.0
22.4
02468
101214
46.5
32.0
22.5
02468
101214
45.1
33.5
25.4
02468
101214
23.9
17.1
02468
101214
IEC
Low
IEC
Mid
IEC
High
IEC
Low
+DX2
IEC
High
+DX2
IEC
Low
+DX2
+PC
IEC
High
+DX2
+PC
IEC
High
+DX1
+PC
DX2
20%
OA+
PC
DX2
0%O
A+PC
DX2
20%
OA+
PC
DX2
0%O
A
61.6
43.7
32.2
02468
101214
32.4
21.9
15.6
02468
101214
IEC
Low
IEC
Mid
IEC
High
IEC
Low
+DX2
IEC
High
+DX2
IEC
Low
+DX2
+PC
IEC
High
+DX2
+PC
IEC
High
+DX1
+PC
DX2
20%
OA+
PC
DX2
0%O
A+PC
DX2
20%
OA+
PC
DX2
0%O
A
DX2
20%
OA
DX2
0%O
A
DX2
20%
OA
DX2
0%O
A
Measure Scenarios Baseline Measure Scenarios Baseline

Southern California Edison Page 30
Customer Programs & Services April 2015
TABLE 5: SUMMARY PERFORMANCE DATA TABLE FOR TESTS IN EACH MODE AND EACH MODE AND CLIMATE CONDITION
Test Condition Mode
Outside Air Supply Air Return Air Mixed Air Condenser Exhaust Air IEC Product Air IEC Exhaust Air
T DB (°F) ω (lb/lb) Q (CFM) T DB (°F) ω (lb/lb) Q (CFM) T DB (°F) ω (lb/lb) Q (CFM) T DB (°F) ω (lb/lb) Q (CFM) T DB (°F) ω (lb/lb) Q (CFM) T DB (°F) ω (lb/lb) Q (CFM) ΔP CASE
(inWG) T DB (°F) ω (lb/lb)
Wes
tern
Pea
k (1
05°F
DB/
73°F
WB)
IEC Low 104.9 0.0105 1110 67.0 0.0105 1110 0.23 87.5 0.0247
IEC Mid 104.8 0.0108 1730 69.4 0.0108 1730 0.55 87.2 0.0243
IEC High 105.2 0.0110 2110 71.2 0.0110 2110 0.84 88.1 0.0239
IEC Low+DX2 105.1 0.0105 1130 58.2 0.0089 2630 78.0 0.0097 1580 73.6 0.0101 2630 124.8 0.0102 5876 67.5 0.0105 1130 0.24 87.3 0.0241
IEC High+DX2 105.1 0.0113 2480 60.4 0.0099 2780 78.0 0.0101 640 73.1 0.0110 2780 126.2 0.0111 5831 71.8 0.0113 2480 0.74 87.7 0.0221
IEC Low+DX2+PC 105.0 0.0123 1130 57.4 0.0090 2640 78.0 0.0101 1610 74.8 0.0110 2640 101.8 0.0180 5806 70.3 0.0123 1130 0.24 88.4 0.0250
IEC High+DX2+PC 105.0 0.0128 2480 60.3 0.0101 2780 78.0 0.0103 730 74.8 0.0122 2780 103.7 0.0184 5790 73.9 0.0128 2480 0.74 88.7 0.0231
IEC High+DX1+PC (no RTU fan) 105.0 0.0129 2110 60.8 0.0111 2110 78.0 0.0103 0 72.9 0.0129 2110 91.7 0.0185 5796 72.9 0.0129 2110 0.86 87.0 0.0234
DX2 0%OA+PC 104.9 0.0103 0 59.5 0.0092 2870 80.0 0.0114 2870 80.9 0.0114 2870 100.5 0.0162 5816
DX2 20%OA 105.0 0.0100 810 60.6 0.0095 2670 78.0 0.0098 1860 86.7 0.0099 2670 125.8 0.0095 5885
DX2 0%OA 105.0 0.0073 -10 61.6 0.0098 2850 80.0 0.0113 2860 80.7 0.0112 2850 124.2 0.0070 6503
AHRI
100
% (9
5°F
DB/
75°F
WB)
IEC Low 95.5 0.0143 1380 69.5 0.0143 1380 0.23 83.7 0.0240
IEC Mid 95.0 0.0143 2170 71.3 0.0143 2170 0.56 83.6 0.0234
IEC High 95.0 0.0143 2650 72.1 0.0143 2650 0.86 83.5 0.0232
IEC Low+DX2 96.2 0.0143 1300 58.8 0.0095 2680 78.8 0.0097 1760 75.4 0.0117 2680 117.4 0.0144 5882 71.0 0.0143 1300 0.27 83.8 0.0234
IEC High+DX2 97.6 0.0144 3070 61.3 0.0107 2800 78.9 0.0097 990 74.6 0.0132 2800 119.9 0.0144 5872 73.1 0.0144 3070 0.74 84.7 0.0228
IEC Low+DX2+PC 95.0 0.0144 1350 57.0 0.0093 2700 78.0 0.0097 1730 75.0 0.0118 2700 100.4 0.0183 5850 71.1 0.0144 1350 0.25 83.5 0.0229
IEC High+DX2+PC 94.9 0.0144 3090 59.7 0.0101 2800 78.0 0.0097 890 74.1 0.0133 2800 101.7 0.0183 5832 73.0 0.0144 3090 0.75 83.9 0.0221
IEC High+DX1+PC (no RTU fan) 95.0 0.0144 2640 60.7 0.0111 2640 78.0 0.0097 0 72.2 0.0144 2640 89.3 0.0179 5797 72.2 0.0144 2640 0.87 82.5 0.0218
DX2 0%OA+PC 95.0 0.0145 -10 59.3 0.0093 2870 80.0 0.0115 2880 80.5 0.0116 2870 100.8 0.0169 5830
DX2 20%OA 95.0 0.0098 800 58.1 0.0089 2650 78.0 0.0098 1850 83.5 0.0098 2650 115.8 0.0093 5908
DX2 0%OA 95.0 0.0071 -20 60.5 0.0095 2850 80.1 0.0113 2870 80.5 0.0112 2850 114.6 0.0069 6523

Southern California Edison Page 31
Customer Programs & Services April 2015
Test Condition Mode
Outside Air Supply Air Return Air Mixed Air Condenser Exhaust Air IEC Product Air IEC Exhaust Air
T DB (°F) ω (lb/lb) Q (CFM) T DB (°F) ω (lb/lb) Q (CFM) T DB (°F) ω (lb/lb) Q (CFM) T DB (°F) ω (lb/lb) Q (CFM) T DB (°F) ω (lb/lb) Q (CFM) T DB (°F) ω (lb/lb) Q (CFM) ΔP CASE
(inWG) T DB (°F) ω (lb/lb) W
este
rn A
nnua
l (90
°F D
B/64
°F W
B)
IEC Low 90.0 0.0084 1110 61.1 0.0084 1110 0.24 78.4 0.0188
IEC Mid 90.0 0.0090 1740 63.1 0.0090 1740 0.56 78.2 0.0189
IEC High 89.9 0.0085 2110 62.7 0.0085 2110 0.84 77.7 0.0186
IEC Low+DX2 90.0 0.0084 1150 53.4 0.0076 2640 78.0 0.0098 1590 70.7 0.0092 2640 109.4 0.0080 5921 61.0 0.0084 1150 0.23 78.6 0.0192
IEC High+DX2 90.0 0.0077 2480 51.9 0.0072 2780 78.0 0.0098 680 66.2 0.0081 2780 108.8 0.0074 5902 63.0 0.0077 2480 0.71 78.4 0.0174
IEC Low+DX2+PC 90.0 0.0087 1130 52.2 0.0073 2630 78.0 0.0097 1610 71.3 0.0093 2630 90.6 0.0131 5865 62.0 0.0087 1130 0.22 78.7 0.0186
IEC High+DX2+PC 90.0 0.0101 2490 53.4 0.0077 2780 78.0 0.0098 680 68.9 0.0100 2780 92.4 0.0141 5896 66.4 0.0101 2490 0.71 79.5 0.0183
IEC High+DX1+PC (no RTU fan) 90.0 0.0089 2110 50.9 0.0075 2110 78.0 0.0097 0 64.1 0.0089 2110 79.7 0.0132 5902 64.1 0.0089 2110 0.84 77.6 0.0175
DX2 20%OA+PC 90.0 0.0098 950 55.8 0.0080 2590 78.2 0.0098 1640 82.9 0.0098 2590 92.9 0.0138 5899
DX2 0%OA+PC 90.0 0.0071 0 58.4 0.0089 2860 80.0 0.0114 2860 80.4 0.0113 2860 91.1 0.0119 5848
DX2 20%OA 90.1 0.0097 790 56.9 0.0086 2640 78.0 0.0098 1850 81.9 0.0098 2640 110.7 0.0092 5922
War
m H
umid
(82°
F D
B/73
°F W
B)
IEC Low 82.0 0.0157 1080 70.9 0.0157 1080 0.24 77.1 0.0199
IEC Mid 82.0 0.0157 1730 71.3 0.0157 1730 0.57 77.2 0.0197
IEC High 82.0 0.0157 2110 71.4 0.0157 2110 0.85 77.0 0.0197
IEC Low+DX2 82.0 0.0157 1100 56.9 0.0090 2640 78.0 0.0098 1660 74.9 0.0122 2640 103.6 0.0154 5936 70.2 0.0157 1100 0.24 76.7 0.0199
IEC High+DX2 82.0 0.0157 2430 58.8 0.0097 2770 78.0 0.0098 960 72.8 0.0140 2770 104.5 0.0153 5919 70.8 0.0157 2430 0.74 76.8 0.0195
IEC Low+DX2+PC 82.0 0.0157 1120 56.3 0.0089 2640 78.0 0.0099 1630 74.8 0.0123 2640 96.3 0.0171 5900 70.2 0.0157 1120 0.25 76.9 0.0200
IEC High+DX2+PC 82.0 0.0157 2450 58.5 0.0096 2780 78.0 0.0097 900 72.9 0.0141 2780 97.1 0.0170 5893 71.0 0.0157 2450 0.76 76.9 0.0195
IEC High+DX1+PC (no RTU fan) 82.0 0.0157 2120 58.9 0.0106 2120 78.0 0.0097 0 70.6 0.0157 2120 85.3 0.0169 5885 70.6 0.0157 2120 0.88 76.2 0.0197
DX2 0%OA+PC 82.0 0.0157 -40 58.8 0.0092 2820 80.0 0.0114 2860 80.1 0.0115 2820 97.0 0.0172 5884
DX2 20%OA 82.0 0.0097 780 55.0 0.0082 2640 78.0 0.0098 1860 79.3 0.0098 2640 102.6 0.0092 5936
DX2 0%OA 82.1 0.0069 -40 59.1 0.0091 2850 80.0 0.0113 2890 80.1 0.0112 2850 102.0 0.0067 6567
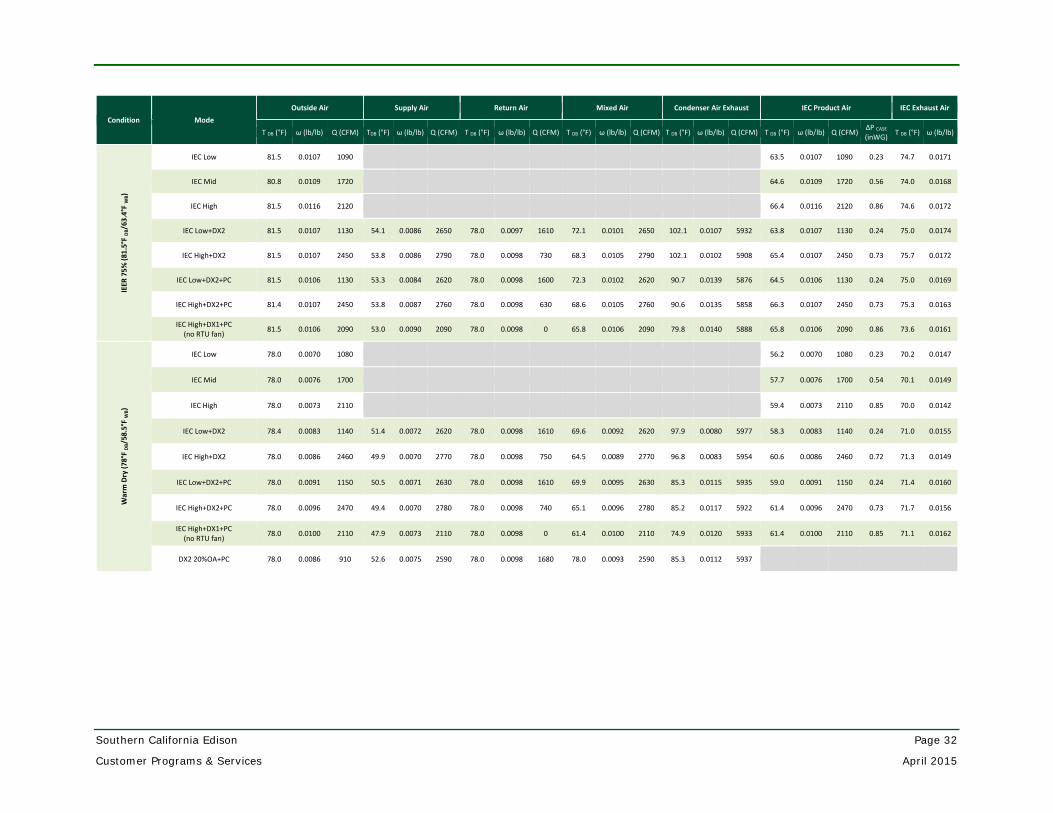
Southern California Edison Page 32
Customer Programs & Services April 2015
Condition Mode Outside Air Supply Air Return Air Mixed Air Condenser Air Exhaust IEC Product Air IEC Exhaust Air
T DB (°F) ω (lb/lb) Q (CFM) TDB (°F) ω (lb/lb) Q (CFM) T DB (°F) ω (lb/lb) Q (CFM) T DB (°F) ω (lb/lb) Q (CFM) T DB (°F) ω (lb/lb) Q (CFM) T DB (°F) ω (lb/lb) Q (CFM) ΔP CASE
(inWG) T DB (°F) ω (lb/lb) IE
ER 7
5% (8
1.5°
F D
B/63
.4°F
WB)
IEC Low 81.5 0.0107 1090 63.5 0.0107 1090 0.23 74.7 0.0171
IEC Mid 80.8 0.0109 1720 64.6 0.0109 1720 0.56 74.0 0.0168
IEC High 81.5 0.0116 2120 66.4 0.0116 2120 0.86 74.6 0.0172
IEC Low+DX2 81.5 0.0107 1130 54.1 0.0086 2650 78.0 0.0097 1610 72.1 0.0101 2650 102.1 0.0107 5932 63.8 0.0107 1130 0.24 75.0 0.0174
IEC High+DX2 81.5 0.0107 2450 53.8 0.0086 2790 78.0 0.0098 730 68.3 0.0105 2790 102.1 0.0102 5908 65.4 0.0107 2450 0.73 75.7 0.0172
IEC Low+DX2+PC 81.5 0.0106 1130 53.3 0.0084 2620 78.0 0.0098 1600 72.3 0.0102 2620 90.7 0.0139 5876 64.5 0.0106 1130 0.24 75.0 0.0169
IEC High+DX2+PC 81.4 0.0107 2450 53.8 0.0087 2760 78.0 0.0098 630 68.6 0.0105 2760 90.6 0.0135 5858 66.3 0.0107 2450 0.73 75.3 0.0163
IEC High+DX1+PC (no RTU fan) 81.5 0.0106 2090 53.0 0.0090 2090 78.0 0.0098 0 65.8 0.0106 2090 79.8 0.0140 5888 65.8 0.0106 2090 0.86 73.6 0.0161
War
m D
ry (7
8°F
DB/
58.5
°F W
B)
IEC Low 78.0 0.0070 1080 56.2 0.0070 1080 0.23 70.2 0.0147
IEC Mid 78.0 0.0076 1700 57.7 0.0076 1700 0.54 70.1 0.0149
IEC High 78.0 0.0073 2110 59.4 0.0073 2110 0.85 70.0 0.0142
IEC Low+DX2 78.4 0.0083 1140 51.4 0.0072 2620 78.0 0.0098 1610 69.6 0.0092 2620 97.9 0.0080 5977 58.3 0.0083 1140 0.24 71.0 0.0155
IEC High+DX2 78.0 0.0086 2460 49.9 0.0070 2770 78.0 0.0098 750 64.5 0.0089 2770 96.8 0.0083 5954 60.6 0.0086 2460 0.72 71.3 0.0149
IEC Low+DX2+PC 78.0 0.0091 1150 50.5 0.0071 2630 78.0 0.0098 1610 69.9 0.0095 2630 85.3 0.0115 5935 59.0 0.0091 1150 0.24 71.4 0.0160
IEC High+DX2+PC 78.0 0.0096 2470 49.4 0.0070 2780 78.0 0.0098 740 65.1 0.0096 2780 85.2 0.0117 5922 61.4 0.0096 2470 0.73 71.7 0.0156
IEC High+DX1+PC (no RTU fan) 78.0 0.0100 2110 47.9 0.0073 2110 78.0 0.0098 0 61.4 0.0100 2110 74.9 0.0120 5933 61.4 0.0100 2110 0.85 71.1 0.0162
DX2 20%OA+PC 78.0 0.0086 910 52.6 0.0075 2590 78.0 0.0098 1680 78.0 0.0093 2590 85.3 0.0112 5937

Southern California Edison Page 33
Customer Programs & Services April 2015
Condition Mode
Outside Air Supply Air Return Air Mixed Air Condenser Air Exhaust IEC Product Air IEC Exhaust Air
T DB (°F) ω (lb/lb) Q (CFM) T DB (°F) ω (lb/lb) Q (CFM) T DB (°F) ω (lb/lb) Q (CFM) T DB (°F) ω (lb/lb) Q (CFM) T DB (°F) ω (lb/lb) Q (CFM) T DB (°F) ω (lb/lb) Q (CFM) ΔP CASE
(inWG) T DB (°F) ω (lb/lb) IE
ER 5
0% (6
8°F
DB/
57.5
°F W
B)
IEC Low 68.2 0.0079 1040 56.5 0.0079 1040 0.24 64.1 0.0120
IEC Mid 68.0 0.0079 1680 57.0 0.0079 1680 0.56 64.1 0.0117
IEC High 68.0 0.0078 2100 57.3 0.0078 2100 0.85 64.1 0.0116
IEC Low+DX2 68.0 0.0081 1130 49.8 0.0074 2660 78.0 0.0098 1680 69.2 0.0091 2660 87.6 0.0077 5964 56.6 0.0081 1130 0.24 66.1 0.0133
IEC High+DX2 68.0 0.0084 2450 48.6 0.0071 2770 78.0 0.0098 800 63.8 0.0088 2770 87.1 0.0082 5948 59.3 0.0084 2450 0.73 67.1 0.0121
IEC Low+DX2+PC 68.5 0.0082 1120 49.7 0.0071 2640 78.0 0.0098 1630 69.5 0.0091 2640 80.3 0.0100 5915 57.6 0.0082 1120 0.24 65.8 0.0124
IEC High+DX2+PC 68.0 0.0086 2460 48.8 0.0072 2780 78.0 0.0098 740 64.3 0.0089 2780 80.3 0.0102 5918 60.3 0.0086 2460 0.73 67.2 0.0118
DX2 20%OA+PC 68.0 0.0079 860 50.6 0.0070 2570 78.0 0.0098 1710 74.3 0.0091 2570 79.9 0.0097 5905
IEER
25%
(65°
F D
B/52
.8°F
WB)
IEC Low 65.0 0.0062 1090 50.5 0.0062 1090 0.24 60.9 0.0110
IEC Mid 65.0 0.0067 1710 51.5 0.0067 1710 0.56 60.4 0.0114
IEC High 65.0 0.0069 2100 52.2 0.0069 2100 0.84 60.5 0.0113
IEC Low+DX2 65.0 0.0080 1130 48.7 0.0066 2640 78.0 0.0097 1680 67.6 0.0090 2640 84.4 0.0073 6007 53.1 0.0080 1130 0.24 60.3 0.0114
IEC High+DX2 65.0 0.0083 2480 45.7 0.0060 2800 78.0 0.0096 930 60.7 0.0086 2800 82.9 0.0076 5979 54.4 0.0083 2480 0.76 60.1 0.0106
IEC Low+DX2+PC 65.0 0.0080 1160 48.0 0.0064 2620 78.0 0.0097 1630 67.5 0.0090 2620 77.3 0.0092 5925 53.5 0.0080 1160 0.24 60.8 0.0112
IEC High+DX2+PC 65.0 0.0083 2480 44.9 0.0058 2800 78.0 0.0096 830 59.9 0.0086 2800 76.1 0.0093 5944 54.1 0.0083 2480 0.76 60.0 0.0108
IEC High+DX1+PC (no RTU fan) 65.0 0.0090 2090 43.3 0.0064 2090 78.0 0.0096 0 55.2 0.0090 2090 66.6 0.0097 5960 55.2 0.0090 2090 0.87 61.1 0.0118
DX2 20%OA+PC 65.0 0.0078 900 49.7 0.0068 2590 78.0 0.0098 1690 73.1 0.0090 2590 77.6 0.0091 5931
DX2 0%OA 82.1 0.0069 -40 59.1 0.0091 2850 80.0 0.0113 2890 80.1 0.0112 2850 102.0 0.0067 6567

Southern California Edison Page 34
Customer Programs & Services April 2015
INDIRECT EVAPORATIVE COOLING PERFORMANCE The indirect evaporative heat exchanger studied here regularly cools air beyond the outside air wet bulb temperature. This unique capability is maintained at all fan speeds and across a wide range of climate conditions. Figure 11 A charts the wet bulb effectiveness for the indirect evaporative cooler measured from every test in this laboratory study. Figure 11 B charts the average for all tests at each fan speed tested.
Wet bulb effectiveness increases with when product airflow rate decreases. This occurs because the air flow is allowed more residence time for evaporation and sensible heat transfer inside the heat exchanger.
It is also important to consider the fact that tests in indirect evaporative only mode were subjected to a higher airflow resistance than what is recommended by the manufacturer. This should tend to change the primary-secondary airflow balance in a way that would decrease product temperature and decrease product airflow. This is supported by the fact that the wet bulb effectiveness results recorded in Figure 11 are somewhat higher than manufacturer stated performance.
Wet
Bul
b Ef
fect
iven
ess (
%)
All Tests
Wet
Bul
b Ef
fect
iven
ess (
%)
Averages for All Tests
Outside Air Wet Bulb Depression (°F)
LEGEND: High Speed Mid Speed Low Speed
FIGURE 11: WET BULB EFFECTIVENESS AS A FUNCTION OF OUTSIDE AIR WET BULB DEPRESSION FOR THREE FAN SPEEDS (A) RESULTS FROM EVERY TEST (B) AVERAGE VALUES FOR RESULTS FROM ALL TESTS
Since the heat transfer rate is driven by temperature difference between the primary flow and secondary flow, and since the temperature of the secondary flow is driven by the direct evaporation of water and a cooling trend that is limited by the wet bulb temperature of the secondary inlet, it can also be helpful to describe heat exchanger performance in terms of the indirect evaporative effectiveness – given by Equation 2.
Figure 12 A plots the indirect wet bub effectiveness measured for each test. Figure 12 B illustrates the psychrometric process for the primary and secondary airflows. The psychrometric chart indicates that the wet bulb temperature at the secondary inlet is much lower than the wet bulb temperature at the primary inlet. Evaporation from this point establishes a larger temperature difference for heat exchange, which is what ultimately allows for cooling below the outside air wet bulb temperature.
As illustrated in Figure 12 A, the indirect wet bulb effectiveness does change some with airflow, but 87% of all tests achieved an indirect wet bulb depression effectiveness between 70 – 90%. In either case, wet bulb effectiveness remains fairly consistent across a range of wet bulb depression conditions. The larger variation at lower wet bulb depressions occurs because natural variation in measurement and system performance is distorted and magnified mathematically by the wet bulb effectiveness ratio as wet bulb depression approaches zero.
0%
20%
40%
60%
80%
100%
120%
140%
160%
0 10 20 30 40
112% 116%122%
0%
20%
40%
60%
80%
100%
120%
140%
160%

Southern California Edison Page 35
Customer Programs & Services April 2015
Indi
rect
Wet
Bul
b Ef
fect
iven
ess (
%)
(TOS
A-T P
A) /
(TOS
A-T W
B 2
ND)
All Tests
Hum
idity
Rat
io (l
b-H
20/l
b-dr
y ai
r)
Indirect Wet Bulb Depression (°F)= (TOSA-TWB, 2ND)
Temperature (°F)
LEGEND: High Speed Mid Speed Low Speed Outside Air = 1STIN Exhaust Air = 2NDOUT
Product Air = 1STOUT = 2NDIN
FIGURE 12: (A) INDIRECT WET BULB EFFECTIVENESS AS A FUNCTION OF INDIRECT WET BULB DEPRESSION (B) PSYCHROMETRIC DIAGRAM ILLUSTRATION OF PRIMARY AND SECONDARY PROCESS FOR INDIRECT EVAPORATIVE
Figure 13 plots sensible cooling capacity for indirect evaporative only mode as a function of outdoor wet bulb depression. While effectiveness is fairly consistent across a range of conditions, cooling capacity is strongly dependent on both airflow and temperature. Each airflow rate tested exhibits a separate and distinct linear relationship as a function of outside air wet bulb depression. This chart also illuminates that outdoor wet bulb depression and airflow rate could be the best two independent parameters for regression modeling of the system performance in indirect evaporative cooling mode.
Sens
ible
Sys
tem
Coo
ling
Capa
city
(ton
s)
Outdoor Wet Bulb Depression (°F)= (TOSA-TWB, OSA) LEGEND: High Speed Mid Speed Low Speed
FIGURE 13: COOLING CAPACITY AS A FUNCTION OF OUTDOOR WET BULB DEPRESSION, IN INDIRECT EVAPORATIVE ONLY MODE
0.00
0.10
0.20
0.30
0.40
0.50
0.60
0.70
0.80
0.90
1.00
0 10 20 30 40 500.000
0.005
0.010
0.015
0.020
0.025
40 50 60 70 80 90 100 110
0.0
1.0
2.0
3.0
4.0
5.0
6.0
7.0
8.0
0 10 20 30 40
T WB 2
ND
IN T W
B 2N
D IN

Southern California Edison Page 36
Customer Programs & Services April 2015
PSYCHROMETRIC PERFORMANCE Figure 14 – Figure 16 illustrate the cooling characteristics for three modes tested at five outside air conditions. Figure 14 examines mode “IECHIGH”, Figure 15 examines mode “IECLOW+DX2+PC”, and Figure 16 examines mode “IECHIGH+DX2+PC”. Measurements for temperature and humidity at key air nodes in the system are plotted on a psychrometric chart for each outside air condition. Points are included for the outside air, product air, return air, mixed air, and supply air conditions. For clarity, reference the points listed in Figure 14 – Figure 16 against the diagram in Figure 2. These plots offer some insight into how the IEC behaves across a range of inlet temperatures, and into how the IEC interacts with the rooftop unit for the combination evaluated here.
There are a few notable characteristics that are illustrated by these psychrometric plots.
First, despite the fact the “IECLOW” delivered less product airflow than “IECLOW+DX2+PC”, the product air temperatures for each mode are very similar.
Second, while mode “IECLOW+DX2+PC” generates a lower product air temperature than “IECHIGH+DX2+PC”, the latter mode results in a lower mixed air temperature because product air makes up a larger portion of the mixed air. Notably, the lower mixed air temperature significantly reduces vapor compression cooling capacity, and decreases the sensible heat ratio. The electricity use for compressor operation decreases somewhat, but not as much as the decrease in cooling capacity. This observation is important because it means that while the IEC operates with very high efficiency, and the combination achieves substantial energy savings, the integrated operation actually reduces efficiency for the vapor compression portion of the operation. This suggests that there is room for alternate hybrid architecture to achieve even better savings.
Lastly, the IEC generates an outstanding temperature split from outside air to product air. There is therefore a great potential for operation with 100% OSA equipment which can struggle to achieve such sensible cooling capacity.
FIGURE 14: PSYCHROMETRIC PERFORMANCE MODE: “IEC HIGH” AT SEVERAL OUTSIDE AIR CONDITIONS. IEC PRODUCT AIRFLOW = 2,100 CFM
0.000
0.005
0.010
0.015
0.020
0.025
40 50 60 70 80 90 100 110
Hum
idity
Rat
io -
lb m
oist
ure /
lb d
ry a
ir
Dry Bulb Temperature - °F
Outside Air IEC Product Air Return Air

Southern California Edison Page 37
Customer Programs & Services April 2015
FIGURE 15: PSYCHROMETRIC PERFORMANCE MODE: “IEC LOW + DX2 + PC” AT SEVERAL OUTSIDE AIR CONDITIONS. IEC PRODUCT AIRFLOW = 1130 CFM, RETURN AIRFLOW = 1660 CFM, SUPPLY AIRFLOW = 2640 CFM
FIGURE 16: PSYCHROMETRIC PERFORMANCE MODE: “IEC HIGH + DX2+PC” AT SEVERAL OUTSIDE AIR CONDITIONS IEC PRODUCT AIRFLOW = 2460 CFM, RETURN AIRFLOW = 800 CFM, SUPPLY AIRFLOW RATE = 2780 CFM
0.000
0.005
0.010
0.015
0.020
0.025
40 50 60 70 80 90 100 110
Hum
idity
Rat
io -
lb m
oist
ure /
lb d
ry a
ir
Dry Bulb Temperature - °F
0.000
0.005
0.010
0.015
0.020
0.025
40 50 60 70 80 90 100 110
Hum
idity
Rat
io -
lb m
oist
ure /
lb d
ry a
ir
Dry Bulb Temperature - °F
Outside Air IEC Product Air Mixed Air (Evaporator Inlet) Supply Air Return Air –– adiabatic mixing
Outside Air IEC Product Air Mixed Air (Evaporator Inlet) Supply Air Return Air –– adiabatic mixing
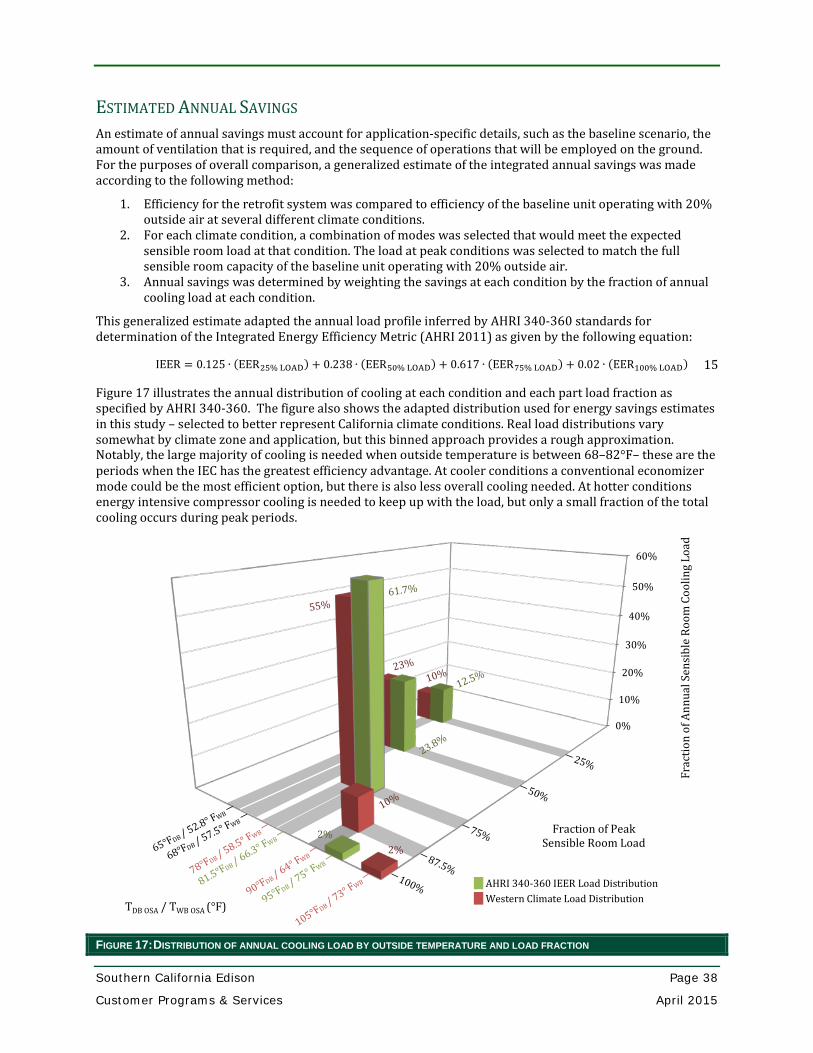
Southern California Edison Page 38
Customer Programs & Services April 2015
ESTIMATED ANNUAL SAVINGS An estimate of annual savings must account for application-specific details, such as the baseline scenario, the amount of ventilation that is required, and the sequence of operations that will be employed on the ground. For the purposes of overall comparison, a generalized estimate of the integrated annual savings was made according to the following method:
1. Efficiency for the retrofit system was compared to efficiency of the baseline unit operating with 20% outside air at several different climate conditions.
2. For each climate condition, a combination of modes was selected that would meet the expected sensible room load at that condition. The load at peak conditions was selected to match the full sensible room capacity of the baseline unit operating with 20% outside air.
3. Annual savings was determined by weighting the savings at each condition by the fraction of annual cooling load at each condition.
This generalized estimate adapted the annual load profile inferred by AHRI 340-360 standards for determination of the Integrated Energy Efficiency Metric (AHRI 2011) as given by the following equation:
IEER = 0.125 ∙ (EER25% LOAD) + 0.238 ∙ (EER50% LOAD) + 0.617 ∙ (EER75% LOAD) + 0.02 ∙ (EER100% LOAD) 15
Figure 17 illustrates the annual distribution of cooling at each condition and each part load fraction as specified by AHRI 340-360. The figure also shows the adapted distribution used for energy savings estimates in this study – selected to better represent California climate conditions. Real load distributions vary somewhat by climate zone and application, but this binned approach provides a rough approximation. Notably, the large majority of cooling is needed when outside temperature is between 68–82°F– these are the periods when the IEC has the greatest efficiency advantage. At cooler conditions a conventional economizer mode could be the most efficient option, but there is also less overall cooling needed. At hotter conditions energy intensive compressor cooling is needed to keep up with the load, but only a small fraction of the total cooling occurs during peak periods.
FIGURE 17: DISTRIBUTION OF ANNUAL COOLING LOAD BY OUTSIDE TEMPERATURE AND LOAD FRACTION
0%
10%
20%
30%
40%
50%
60%
2%2%
TDB OSA / TWB OSA (°F)
Frac
tion
of A
nnua
l Sen
sibl
e Ro
om C
oolin
g Lo
ad
Fraction of Peak Sensible Room Load
AHRI 340-360 IEER Load Distribution Western Climate Load Distribution

Southern California Edison Page 39
Customer Programs & Services April 2015
TABLE 6. OPERATING SCENARIOS, CAPACITY, AND EFFICIENCY AT CLIMATE CONDITIONS USED TO ESTIMATE ANNUAL SAVINGS
Western Peak – 105°F DB / 73° F WB
Load Scenario 100%
Sensible Room Load 4.0 tons
Baseline Sensible Room EER (mode: DX2-20% OSA) 4.0
Fraction of Annual Sensible Room Load at Condition 2%
Retr
ofit
Scen
ario
Mode Runtime Fraction Effective Sens. Room Capacity (tons) Sens. Room EER
IEC LOW 23% 0.2 19.8
IEC LOW+DX2+PC 77% 3.8 5.2
Combined Modes: 100% 4.0 5.4
Energy Savings at Condition 26%
Western Annual – 90°F DB / 64° F WB
Load Scenario 87.5%
Sensible Room Load 3.5 tons
Baseline Sensible Room EER (mode: DX2-20% OSA) 5.3
Fraction of Annual Sensible Room Load at Condition 10%
Retr
ofit
Scen
ario
Mode Runtime Fraction Effective Sens. Room Capacity (tons) Sens. Room EER
IEC HIGH 80% 2.2 18
IEC LOW+DX2+PC 20% 1.3 7.1
Combined Modes: 100% 3.5 11.6
Energy Savings at Condition 54%
Warm Dry – 78°F DB / 58.5° F WB
Load Scenario 75%
Sensible Room Load 3.0 tons
Baseline Sensible Room EER (mode: DX2-20% OSA) 7.2
Fraction of Annual Sensible Room Load at Condition 55%
Retr
ofit
Sc. Mode Runtime Fraction Effective Sens. Room
Capacity (tons) Sens. Room EER
IEC LOW 100% 2.0 32
Energy Savings at Condition 66%

Southern California Edison Page 40
Customer Programs & Services April 2015
IEER 50% – 68°F DB / 57.5° F WB
Load Scenario 50%
Sensible Room Load 2.0 tons
Baseline Sensible Room EER (mode: DX2-20% OSA) 8
Fraction of Annual Sensible Room Load at Condition 23%
Retr
ofit
Scen
ario
Mode Runtime Fraction Effective Sens. Room Capacity (tons) Sens. Room EER
IEC LOW 92% 1.75 45.1
IEC MID 8% 0.25 33.5
Combined Modes: 100% 2.0 43.2
Energy Savings at Condition 82%
IEER 25% – 65°F DB / 52.8° F WB
Load Scenario 25%
Sensible Room Load 1.0 tons
Baseline Sensible Room EER (mode: DX2-20% OSA) 8.5
Fraction of Annual Sensible Room Load at Condition 10%
Retr
ofit
Sc. Mode Runtime Fraction Effective Sens. Room
Capacity (tons) Sens. Room EER
IEC LOW 0.37 1.0 61.6
Energy Savings at Condition 86%
Since the sensible room cooling load at each condition does not always align with the capacity in each mode tested, an evaluation of the savings potential at a particular climate condition must account for the fact that the system can cycle between operation in multiple modes as long as the aggregate cooling capacity matches the cooling load, and the minimum required ventilation rate is achieved. Operating in this way allows for substantial savings at all climate conditions evaluated. This highlights the dynamic nature of the hybrid combination and the opportunity for the system to adjust to suit different cooling needs at different times.
Table 6 describes the sensible room load, capacity and efficiency for the retrofit scenario selected at each climate condition. The table summarizes the energy savings at each condition and the fraction of annual sensible room load that is assumed to occur at each condition. For the worst case hours, the retrofit reduces energy use by 26%. For typical daily high temperature conditions the hybrid combination achieves more than 50% savings, and for milder part load hours the combination can reduce energy use by as much as 86%.
These estimates:
• Do not consider energy use for ventilation during non-cooling hours • Do not consider the benefits of economizer cooling in the baseline scenario • Assume the baseline scenario is mode “DX2-20% OSA” as laboratory tested • Do not consider transient gains or losses associated with inter-mode cycling
The aggregate load–weighted assessment indicates 68% reduction in annual energy use for cooling and ventilation.
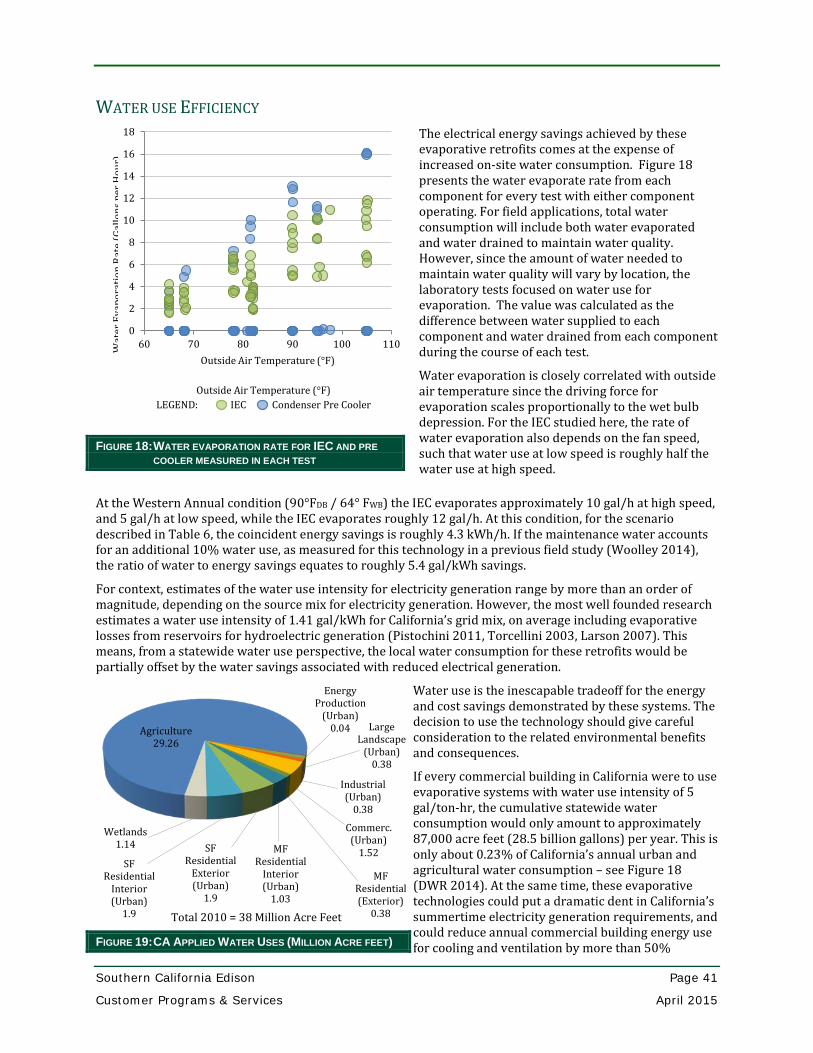
Southern California Edison Page 41
Customer Programs & Services April 2015
WATER USE EFFICIENCY W
ater
Eva
pora
tion
Rate
(Gal
lons
per
Hou
r)
Outside Air Temperature (°F) LEGEND: IEC Condenser Pre Cooler
FIGURE 18: WATER EVAPORATION RATE FOR IEC AND PRE COOLER MEASURED IN EACH TEST
The electrical energy savings achieved by these evaporative retrofits comes at the expense of increased on-site water consumption. Figure 18 presents the water evaporate rate from each component for every test with either component operating. For field applications, total water consumption will include both water evaporated and water drained to maintain water quality. However, since the amount of water needed to maintain water quality will vary by location, the laboratory tests focused on water use for evaporation. The value was calculated as the difference between water supplied to each component and water drained from each component during the course of each test.
Water evaporation is closely correlated with outside air temperature since the driving force for evaporation scales proportionally to the wet bulb depression. For the IEC studied here, the rate of water evaporation also depends on the fan speed, such that water use at low speed is roughly half the water use at high speed.
At the Western Annual condition (90°FDB / 64° FWB) the IEC evaporates approximately 10 gal/h at high speed, and 5 gal/h at low speed, while the IEC evaporates roughly 12 gal/h. At this condition, for the scenario described in Table 6, the coincident energy savings is roughly 4.3 kWh/h. If the maintenance water accounts for an additional 10% water use, as measured for this technology in a previous field study (Woolley 2014), the ratio of water to energy savings equates to roughly 5.4 gal/kWh savings.
For context, estimates of the water use intensity for electricity generation range by more than an order of magnitude, depending on the source mix for electricity generation. However, the most well founded research estimates a water use intensity of 1.41 gal/kWh for California’s grid mix, on average including evaporative losses from reservoirs for hydroelectric generation (Pistochini 2011, Torcellini 2003, Larson 2007). This means, from a statewide water use perspective, the local water consumption for these retrofits would be partially offset by the water savings associated with reduced electrical generation.
FIGURE 19: CA APPLIED WATER USES (MILLION ACRE FEET)
Water use is the inescapable tradeoff for the energy and cost savings demonstrated by these systems. The decision to use the technology should give careful consideration to the related environmental benefits and consequences.
If every commercial building in California were to use evaporative systems with water use intensity of 5 gal/ton-hr, the cumulative statewide water consumption would only amount to approximately 87,000 acre feet (28.5 billion gallons) per year. This is only about 0.23% of California’s annual urban and agricultural water consumption – see Figure 18 (DWR 2014). At the same time, these evaporative technologies could put a dramatic dent in California’s summertime electricity generation requirements, and could reduce annual commercial building energy use for cooling and ventilation by more than 50%
0
2
4
6
8
10
12
14
16
18
60 70 80 90 100 110Outside Air Temperature (°F)
Agriculture29.26
Energy Production
(Urban)0.04 Large
Landscape (Urban)
0.38
Industrial (Urban)
0.38
Commerc. (Urban)
1.52
MF Residential (Exterior)
0.38
MF Residential
Interior (Urban)
1.03
SF Residential
Exterior (Urban)
1.9
SF Residential
Interior (Urban)
1.9
Wetlands1.14
Total 2010 = 38 Million Acre Feet
Southern California Edison Page 42
Customer Programs & Services April 2015
CONCLUSIONS & RECOMMENDATIONS The indirect evaporative air conditioner evaluated here can substantially reduce energy use and peak demand for cooling and ventilation in commercial buildings. The laboratory measurements demonstrate that the IEC and condenser pre-cooler added to an existing rooftop air conditioner could reduce annual energy use for cooling and ventilation by in 68% in California commercial buildings. At peak cooling conditions (105°FDB/73°FWB) the combination demonstrated it could achieve equal capacity whilst reducing energy use for cooling by 26%. At milder conditions (65°FDB/ 52.8° FWB) the combination demonstrated savings at large as 86%.
Further, it appears that the laboratory results presented here underestimate the technical potential for the IEC because of three factors associated with the way the retrofit was configured for this laboratory test:
1. A significant amount of product air leaked out of the barometric damper and through leaks in the rooftop unit cabinet. This reduced overall system capacity and efficiency for all modes with compressor operation.
2. In all modes without the rooftop unit fan, the airflow resistance was larger than recommend by the manufacturer. This reduced product airflow rate and offset the ratio of primary–secondary airflow.
3. The sensible capacity and efficiency for the vapor compression cycle are reduced somewhat when the evaporator coil inlet has already been cooled by indirect evaporative cooling.
All three of these challenges could be avoided if the combination of indirect evaporative and vapor compression cooling were configured in a different way. We recommend the following approaches:
1. Future product evolution should target the integration of indirect evaporative cooling and vapor compression in a unitary hybrid system. This system could incorporate direct access to outside air for economizer cooling, and could utilize variable compressor control to maximize sensible cooling efficiency at any operating condition. Such a hybrid could use evaporative condenser air pre-cooling, or may benefit from locating the vapor compression condenser coil in the indirect evaporative secondary exhaust air stream.
2. The IEC should be installed in parallel with vapor compression cooling systems such as rooftop units and VRF equipment. This design strategy avoids many of the challenges associated with retrofit integration and would allow both systems to perform at their best. The approach can simplify the controls required and circumvents the factors that reduced performance for these laboratory tests.
In fact, according to these laboratory measurements, a parallel configuration for the IEC and a rooftop unit utilizing the condenser pre-cooler would achieve 41% savings at peak conditions (105°FDB/73°FWB) –the series configuration tested achieved 26% savings.
While the retrofit improves sensible efficiency at all conditions tested, it does connect new loads and subsequently increases electrical demand at every condition tested. On aggregate, the energy used during peak cooling conditions will be reduced because compressor operation will be reduced, but customer demand charges could increase because the highest instantaneous electrical draw will be larger. For regional and statewide grid management the gains in system efficiency would reduce peak generation requirements, however current demand charge structures may not pass that benefit on to the customer. Future applications could downsize vapor compression equipment in addition to these retrofit additions, our could include variable capacity controls that would limit the maximum instantaneous electrical demand for the systems.
In conclusion, results of this study strongly support the development of utility programs and other public interest efforts to advance the broader application of the technologies. The IEC and condenser pre-cooler retrofit strategies support CA-EESP goals for climate appropriate air conditioning technologies. The retrofit measure promises considerable energy benefits for end users and offers demand management benefit for utilities during the cooling season when it is needed most. Further efforts surrounding the technology should focus on design guidance to facilitate proper physical application and optimized controls integration. Surrounding resources such as codes and standards, modeling tools, and professional education are also needed to facilitate accelerated application of these strategies.

Southern California Edison Page 43
Customer Programs & Services April 2015
REFERENCES American National Standards Institute (ANSI), and Air-Conditioning, Heating, and Refrigeration Institute (AHRI). “ANSI/AHRI Standard 340/360:Standard for Performance Rating of Commercial and Industrial Unitary Air-Conditioning and Heat Pump Equipment.” Standard. Air-Conditioning, Heating, and Refrigeration Institute, October 27, 2011. http://www.ahrinet.org/App_Content/ahri/files/STANDARDS/ANSI/ANSI_AHRI _Standard_340-360-2007_with_Add_1_and_2.pdf.
American National Standards Institute (ANSI), and Air-Conditioning, Heating, and Refrigeration Institute (AHRI). “ANSI/AHRI Standard 210/240: Performance Rating of Unitary Air-Conditioning & Air-Source Heat Pump Equipment.” Standard. Air-Conditioning, Heating, and Refrigeration Institute, December 2012. http://www.ahrinet.org/App_Content/ahri/files/standards%20pdfs/ANSI%20standards%20pdfs/ANSI.AHRI%20Standard%20210.240%20with%20Addenda%201%20and%202.pdf.
American Society of Heating Refrigeration and Air Conditioning Engineers. “ANSI/ASHRAE Standard 37-2009: Methods of Testing for Rating Electrically Driven Unitary Air-Conditioning and Heat Pump Equipment,” 2009.
American Society of Heating Refrigeration and Air Conditioning Engineers. “ANSI/ASHRAE Standard 55-2010: Thermal Environmental Conditions for Human Occupancy,” 2010.
American Society of Heating Refrigeration and Air Conditioning Engineers. Special Project Committee 212. “Method of Test for Determining Energy Performance and Water-Use Efficiency of Add-On Evaporative Pre-Coolers for Unitary Air Conditioning Equipment.” American Society of Heating Refrigeration and Air Conditioning Engineers, 2015. https://www.ashrae.org/standards-research--technology/standards--guidelines/titles-purposes-and-scopes#SP212P.
California Department of Water Resources. “California Water Plan: Investing in Innovation & Infrastructure.” California Natural Resources Agency, 2014. http://www.waterplan.water.ca.gov/cwpu2013/final/index.cfm.
California Energy Commission. “California Commercial End-Use Survey.” Consultant Report. California Energy Commission, March 2006. http://www.energy.ca.gov/2006publications/CEC-400-2006-005/CEC-400-2006-005.PDF.
California ISO. Open Access Same Time Information System (OASIS). California ISO. Accessed November 6, 2015. http://oasis.caiso.com/.
California Public Utilities Commission. “California Energy Efficiency Strategic Plan, January 2011 Update.” California Public Utilities Commission, January 2011. http://www.cpuc.ca.gov/NR/rdonlyres/A54B59C2-D571-440D-9477-3363726F573A/0/CAEnergyEfficiencyStrategicPlan_Jan2011.pdf.
Davis, Robert, and Marshall Hunt. “Laboratory Testing of Performance Enhancements for Rooftop Packaged Air Conditioners.” Pacific Gas & Electric, February 5, 2015. http://www.etcc-ca.com/reports/laboratory-testing-performance-enhancements-rooftop-packaged-air-conditioners.
Larsen, Dana, Cheryl Lee, Stacy Tellinghuisen, and Arturo Keller. “California’s Energy-Water Nexus: Water Use in Electricity Generation.” Southwest Hydrology 6, no. 5 (October 2007): 20–21.
Modera, Mark, Jonathan Woolley, and Zhijun Liu. “Performance Evaluation for Dual-Evaporative Pre-Cooling Retrofit in Palmdale, California,” November 2014.
Pistochini, Theresa. “Evaporative Condenser Air Pre-Coolers.” Southern California Edison, 2014.
Pistochini, Theresa, and Mark Modera. “Water-Use Efficiency for Alternative Cooling Technologies in Arid Climates.” Energy and Buildings 43, no. 2–3 (February 2011): 631–38. doi:10.1016/j.enbuild.2010.11.004.
Torcellini, Paul, N. Long, and R Judkoff. “Consumptive Water Use for U.S. Power Production.” Technical Report. National Renewable Energy Laboratory, December 2003.
U.S. Energy Information Administration. “Commercial Building Energy Consumption Survey,” 2012. http://www.eia.gov/consumption/commercial/.

Southern California Edison Page 44
Customer Programs & Services April 2015
U.S. Energy Information Administration. “Electricity Data Browser,” n.d. Accessed November 6, 2015. http://www.eia.gov/electricity/data/browser/.
Woolley, Jonathan, and Caton Mande. “Performance Evaluation for Hybrid Rooftop Air Conditioners with Dual Evaporative Pre-Cooling.” Southern California Edison, October 2014.
Woolley, Jonathan, Caton Mande, and Mark Modera. “Side-by-Side Evaluation of Two Indirect Evaporative Air Conditioners Added to Existing Packaged Rooftop Units.” Pacific Gas & Electric, August 18, 2014. http://www.etcc-ca.com/sites/default/files/reports/et12pge3101_indirect_evap_coolers_retrofit_to_existing_rtus.pdf.
Woolley, Jonathan, and Mark Modera. “Advancing Development of Hybrid Rooftop Packaged Air Conditioners: Test Protocol and Performance Criteria for the Western Cooling Challenge.” ASHRAE Transactions 117, no. 1 (May 2011): 533–40.


