Ablation in Liquids: Structure and Sizing Synthesis of Ni ...
40
Subscriber access provided by Yale University Library The Journal of Physical Chemistry C is published by the American Chemical Society. 1155 Sixteenth Street N.W., Washington, DC 20036 Published by American Chemical Society. Copyright © American Chemical Society. However, no copyright claim is made to original U.S. Government works, or works produced by employees of any Commonwealth realm Crown government in the course of their duties. Article Synthesis of Ni Nanoparticles by Fs Laser Ablation in Liquids: Structure and Sizing David Muñetón Arboleda, Jesica María Jose Santillán, Luis Joaquín Mendoza Herrera, Marcela B. Fernández van Raap, Pedro Mendoza Zélis, Diego Muraca, Daniel Schinca, and Lucía Scaffardi J. Phys. Chem. C, Just Accepted Manuscript • DOI: 10.1021/acs.jpcc.5b03124 • Publication Date (Web): 13 May 2015 Downloaded from http://pubs.acs.org on May 15, 2015 Just Accepted “Just Accepted” manuscripts have been peer-reviewed and accepted for publication. They are posted online prior to technical editing, formatting for publication and author proofing. The American Chemical Society provides “Just Accepted” as a free service to the research community to expedite the dissemination of scientific material as soon as possible after acceptance. “Just Accepted” manuscripts appear in full in PDF format accompanied by an HTML abstract. “Just Accepted” manuscripts have been fully peer reviewed, but should not be considered the official version of record. They are accessible to all readers and citable by the Digital Object Identifier (DOI®). “Just Accepted” is an optional service offered to authors. Therefore, the “Just Accepted” Web site may not include all articles that will be published in the journal. After a manuscript is technically edited and formatted, it will be removed from the “Just Accepted” Web site and published as an ASAP article. Note that technical editing may introduce minor changes to the manuscript text and/or graphics which could affect content, and all legal disclaimers and ethical guidelines that apply to the journal pertain. ACS cannot be held responsible for errors or consequences arising from the use of information contained in these “Just Accepted” manuscripts.
Transcript of Ablation in Liquids: Structure and Sizing Synthesis of Ni ...

Subscriber access provided by Yale University Library
The Journal of Physical Chemistry C is published by the American Chemical Society.1155 Sixteenth Street N.W., Washington, DC 20036Published by American Chemical Society. Copyright © American Chemical Society.However, no copyright claim is made to original U.S. Government works, or worksproduced by employees of any Commonwealth realm Crown government in the courseof their duties.
Article
Synthesis of Ni Nanoparticles by Fs LaserAblation in Liquids: Structure and Sizing
David Muñetón Arboleda, Jesica María Jose Santillán, Luis Joaquín Mendoza Herrera, Marcela B.Fernández van Raap, Pedro Mendoza Zélis, Diego Muraca, Daniel Schinca, and Lucía Scaffardi
J. Phys. Chem. C, Just Accepted Manuscript • DOI: 10.1021/acs.jpcc.5b03124 • Publication Date (Web): 13 May 2015Downloaded from http://pubs.acs.org on May 15, 2015
Just Accepted
“Just Accepted” manuscripts have been peer-reviewed and accepted for publication. They are postedonline prior to technical editing, formatting for publication and author proofing. The American ChemicalSociety provides “Just Accepted” as a free service to the research community to expedite thedissemination of scientific material as soon as possible after acceptance. “Just Accepted” manuscriptsappear in full in PDF format accompanied by an HTML abstract. “Just Accepted” manuscripts have beenfully peer reviewed, but should not be considered the official version of record. They are accessible to allreaders and citable by the Digital Object Identifier (DOI®). “Just Accepted” is an optional service offeredto authors. Therefore, the “Just Accepted” Web site may not include all articles that will be publishedin the journal. After a manuscript is technically edited and formatted, it will be removed from the “JustAccepted” Web site and published as an ASAP article. Note that technical editing may introduce minorchanges to the manuscript text and/or graphics which could affect content, and all legal disclaimersand ethical guidelines that apply to the journal pertain. ACS cannot be held responsible for errorsor consequences arising from the use of information contained in these “Just Accepted” manuscripts.
1
Synthesis of Ni Nanoparticles by Fs Laser Ablation in Liquids: Structure and Sizing David Muñetón Arboleda,† Jesica M. J. Santillán,†,‡ Luis J. Mendoza Herrera,† Marcela B. Fernández van Raap,ǂ,ǁ Pedro Mendoza Zélis,ǂ,ǁ,§ Diego Muraca,# Daniel C. Schinca,†,§ and Lucía B. Scaffardi*,†,§
†Centro de Investigaciones Ópticas (CIOp), CONICET La Plata < CIC, Camino Centenario y 506, 1897 Gonnet, La Plata, Argentina ‡Facultad de Ciencias Exactas y Naturales, Universidad Nacional de Catamarca, Av. Belgrano 300, 4700 San Fernando del Valle de Catamarca, Catamarca, Argentina ǂInstituto de Física La Plata (IFLP), CONICET < UNLP, Calle 49 y 115, 1900 La Plata, Buenos Aires, Argentina ǁDepartamento de Física, Facultad de Ciencias Exactas, Universidad Nacional de La Plata, Calle 49 y 115, 1900 La Plata, Buenos Aires, Argentina §Departamento de Ciencias Básicas, Facultad de Ingeniería, Universidad Nacional de La Plata, Calle 115 y 49, 1900 La Plata, Buenos Aires, Argentina #Instituto de Física “Gleb Wataghin” (IFGW), Universidade Estadual de Campinas, Rua Sérgio Buarque de Holanda 777, Cidade Universitária Zeferino Vaz Barão Geraldo CEP 13083<859, Campinas, São Paulo, Brasil Supporting Information
ABSTRACT
Synthesis of nickel (Ni) nanoparticles (NPs) suspensions was performed using a
120 femtosecond (fs) pulse laser to ablate a Ni solid target in n<heptane and water.
Analysis of structure, configuration and sizing was carried out using different
independent techniques such as Optical Extinction Spectroscopy (OES), Atomic Force
Microscopy (AFM), Transmission Electron Microscopy (TEM) and Electron
Diffraction (ED), which yield interrelated information.
AFM microscopy allows determining the spherical shape and size distribution of
the NPs in the obtained colloids while TEM provides knowledge about shape, structure
and size distribution. ED allows identification of the different metal and metal oxide
composition as well as their crystallographic phase. On the other hand, OES gives
Page 1 of 39
ACS Paragon Plus Environment
The Journal of Physical Chemistry
123456789101112131415161718192021222324252627282930313233343536373839404142434445464748495051525354555657585960

2
information related to size distribution, structure, configuration and composition.
Interpretation of these spectra is based on Mie theory which, in turn, depends on Ni
dielectric function. For NPs radii smaller than 3 nm, size<dependent free and bound
electron contributions to the dielectric function must be considered. To account for the
full size span, complete Mie expansion was used for optical extinction cross<section
calculations. A theoretical analysis of the dependence of plasmon resonance of bare
core and core<shell Ni NPs with core size and shell thickness provide insight about their
spectroscopic features.
For n<heptane, species like bare core Ni and hollow Ni NPs are found in the
colloid, being the latter reported for the first time in this work. Instead, for water, the
colloid contains hollow nickel NPs and nickel oxide in different core<shell
configurations: Ni<NiO and NiO<Ni, being the latter also reported for the first time in
this paper. In both cases, size distribution agrees with that derived from TEM and AFM
analysis. The formation of the oxide species is discussed in terms of oxidation<reduction
processes during ablation. Possible mechanisms for the formation of hollow species are
proposed.
KEYWORDS: Ni Nanoparticles, Femtosecond Laser Ablation, Optical Extinction
Spectroscopy, Size<Dependent Dielectric Function, Optical Properties, Plasmon
Resonance
I. INTRODUCTION
Metal NPs studies became the focus of intense research owing to their unusual
properties compared with bulk metal, which convey many potential applications in
different science and technology fields.1 The control of physical, chemical and
Page 2 of 39
ACS Paragon Plus Environment
The Journal of Physical Chemistry
123456789101112131415161718192021222324252627282930313233343536373839404142434445464748495051525354555657585960

3
biological properties in the nanometric scale is based on the ability to manipulate the
size and shape of NPs.2–7
In recent years, Ni NPs have attracted scientific interest because of their
extensive prospects in catalysts,8, 9 conducting pastes,10 information storage,8 large<scale
batteries,11 magnetic behavior,12–15 enhanced optical properties,16 and biomedicine.17
Several works on Ni NPs generation by laser ablation using different pulsed
laser regimes and different media have appeared in the literature in the last years. Liu et
al. studied the morphological and structural properties of Ni NPs generated by 500 fs
pulse laser ablation in low pressure background gas.18 They determined that by limiting
the laser fluence below the threshold of plasma formation, large particles may be
avoided. Besides, by varying the background gases, Ni<NiO core<shell spheres were
obtained. Amoruso et al. used 300 fs laser pulses focused on a Ni target in vacuum to
study the expansion dynamics of the ablated species by fast photography and optical
emission spectroscopy.19 Dudoitis et al. generated Ni NPs in argon and air using a
Nd:YAG laser working in two different pulsed regimes, 15 ns and 10 ps, and describing
the influence of laser intensity and thermal capacities on the electron and lattice
temperature.20
On the other hand, generation of Ni NPs via laser ablation in liquids has been
recently reported by Jaleh et al., who worked with a high repetition Nd:YAG laser of
240 ns pulse width for ablating a pure Ni plate immersed in methanol with PVP as
stabilizer agent, studying their localized surface plasmon via optical spectroscopy.21
Jung and Choi have worked with a Q<switched Nd:YAG laser at its fundamental
wavelength to ablate Ni target in different solvents and have studied their final
crystallographic phase, concluding that it is related to the thermodynamic factors of the
laser<induced plasma plume and to the specific heat of the solvents.22 Musaev et al.
Page 3 of 39
ACS Paragon Plus Environment
The Journal of Physical Chemistry
123456789101112131415161718192021222324252627282930313233343536373839404142434445464748495051525354555657585960
4
fabricated colloids of Ni in water by laser ablation with a nitrogen laser of 10 ns pulse
duration and determined its composition using X<ray diffraction (XD).23
However, there are no works reporting on the fabrication and characterization of
colloids obtained using fs<regime laser ablation of Ni in liquids. In this work we analyze
the characteristics of structure (bare core or core<shell), configuration, number density
and size distribution of NPs generated when a fs pulse laser is used to ablate a Ni solid
target in n<heptane and water. Optical extinction was used to obtain the spectroscopic
characteristics of freshly fabricated suspensions. This technique is appropriate for this
type of samples since it probes a statistically relevant number of particles (about 1010 to
1011 particles) and can yield qualitative and quantitative information about particle size
distribution and number density. Extinction spectra were modeled using Mie theory24
through an appropriate modification of the bulk complex dielectric function, taking into
account a size<dependent corrective term for each free and bound electron contribution.
We theoretically explore the dependence of extinction spectrum with size for bare core
and core<shell Ni NPs. This spectrum is dominated by plasmon resonance whose
wavelength is dependent on size, shell thickness and surrounding media.
Here we report for the first time the synthesis of Ni NPs suspensions using a
120 fs pulse laser to ablate a Ni solid target in n<heptane and water, the presence of
NiO<Ni core<shell and hollow Ni NPs in these colloids and propose a possible
mechanism for the formation of different species present in the obtained suspensions.
AFM, TEM and ED analyses independently performed on the colloid samples yielded
size and structural results that agree with those obtained by OES.
Page 4 of 39
ACS Paragon Plus Environment
The Journal of Physical Chemistry
123456789101112131415161718192021222324252627282930313233343536373839404142434445464748495051525354555657585960

5
II. EXPERIMENTAL SECTION
Nickel colloidal suspension was fabricated by fs pulse laser ablation. The target
sample used to carry out these experiments was a 1 mm thick solid disk of high purity
grade nickel, immersed in a vessel filled with 4 cm3 of n<heptane or milli<Q water. This
solvent volume created a liquid column of 1 cm height over the Ni disk. Laser ablation
was performed using a Ti:Sapphire (Ti:Sa) chirped pulsed amplification (CPA) system
from Spectra Physics, emitting pulses of 120 fs with at 1 kHz repetition rate centred at
800 nm wavelength. The maximum output energy was 1 mJ per pulse, but it could be
attenuated using a classical waveplate<polarizer system. A 5 cm focal length lens was
used to focus the laser beam on the target disk surface. The pulse energy used in this
experiment was 100 �J. Considering the focal length of the focusing lens and the input
beam diameter, the corresponding fluence value was 90 J/cm2. The experimental setup
chosen to produce nickel NPs in liquid media is shown in Figure 1.
The sample was moved using a XY motorized micrometric stage. The
movement was programmed so that the laser impinged always in different points of the
sample. In this way, ablation was performed always from a fresh surface of the sample.
This process lasted 9 min, after which the large number of NPs generated in the
surfactant free suspension produced a greyish colour in n<heptane or whitish in water.
Page 5 of 39
ACS Paragon Plus Environment
The Journal of Physical Chemistry
123456789101112131415161718192021222324252627282930313233343536373839404142434445464748495051525354555657585960

6
Figure 1. Schematic diagram of experimental setup for the fabrication of nickel colloidal suspension.
AFM images were recorded in air, at room temperature, and at a scan rate of
1 Hz, using standard semicontact mode of an NT<MDT Solver Pro microscope.
Rectangular shaped semi contact<mode cantilevers coated with Al on the reflex side,
having a spring constant of 37 < 58 N/m and holding a pyramidal silicon nitride tips of
tip curvature radius of 6 nm were used for topographical measurements. APPNANO
ACTA and ACLA probes at resonant frequencies of 273 kHz and 166 kHz were used
for samples in n<heptane and in water respectively. AFM provides a three<dimensional
surface profile. Lateral dimension are distorted by tip<sample convolution effects.
However, high z accuracy is obtained when height measurements with minimum
scanning vertical step equal to 0.012 nm are recorded. For these measurements, part of
the as<prepared colloidal suspension was sonicated and diluted to 1/1000 (v/v) in
n<heptane and 1/100 (v/v) in water. A drop of such diluted sample was placed on a
freshly cleaved muscovite mica sheet V<1 grade (SPI Supplies) and dried for 12 h at
room temperature. The analysis of mica sheet measurement indicated an average
roughness of 0.0612 nm.
Page 6 of 39
ACS Paragon Plus Environment
The Journal of Physical Chemistry
123456789101112131415161718192021222324252627282930313233343536373839404142434445464748495051525354555657585960

7
Microscopy images and electron diffraction patterns were performed with a
TEM<MSC (JEOL 2100, acceleration voltage 200 KV) at Brazilian Nanotechnology
National Laboratory (LNNano). The as<prepared Ni was diluted in n<heptane or mili<Q
water and sonicated during 15 min. Samples were obtained by drying the solvent<
dispersed NPs on a carbon coated copper grids followed by plasma cleaning to avoid
possible organic residuals. Images of the samples on a single<tilt sample holder were
recorded/captured using a TV Gatan ES500W and a CCD (TVips<16MP) camera.
OES was implemented by means of a Shimadzu spectrophotometer from 250 nm
to 1100 nm wavelength range. Optical absorption measurement of the colloidal
suspension in each liquid was performed 5 min after fabrication. This in situ
measurement prevents possible NPs coalescence and provides reliable statistics.
III. THEORETICAL BACKGROUND FOR EXTINCTION SPECTRA
CALCULATION
As it is well known, Ni is a ferromagnetic metal. In accordance to the analysis
made by Rosensweig,25 the frequency dependence of monodomain magnetic NPs
complex susceptibility follows a Lorentzian law with frequency and relaxation time:
���� = ���� , where �� is the static field susceptibility, and � is the magnetic
relaxation time. For the case of single domain Ni NPs, the value of � is typically in the
range 10–2 < 10–6 s,26 which, for visible frequencies (1014 < 1015 Hz) yield ���� very
close to zero. Under these conditions, the relative permeability is unity (�� = 1)
allowing the NP extinction to be correctly described by Mie theory24 for non magnetic
NPs.
In general, light extinction is the sum of absorption and scattering processes that
can be studied using the mentioned theory. For the general case of coated spherical
Page 7 of 39
ACS Paragon Plus Environment
The Journal of Physical Chemistry
123456789101112131415161718192021222324252627282930313233343536373839404142434445464748495051525354555657585960

8
particles with core radius � and outer radius �′, the extinction cross section can be
expressed as:
where �� and �� are the scattering coefficients which depend on the first, second and
third order spherical Bessel functions. The argument of these functions depends on the
core and shell size parameters and their refractive indices (see Supporting Information).
Sometimes, the so called extinction efficiency, defined as ���� = ����/��′�, is used
for easiness of comparison.
The refractive index of materials is related to the dielectric function. For the case
of metals, the experimental bulk complex dielectric function (� !"#���) may be
modeled as an additive contribution of free and bound electrons. Free electron
contribution is usually written based on the Drude model, while bound electron
contribution may be written considering interband transitions:
� !"#��� = �$������ +� &!�'��� = �(��� + )�(′��� (2)
where free electrons contribution can be written as:
�$������ = 1 − �,��� + )-$����
(3)
and bound electron contribution as:
� &!�'��� = � !"#��� − .1 − �,��� + )-$����/
(4)
���� = 2�1� �2 34�25 + 1���� + ���6
�7�8
(1)
Page 8 of 39
ACS Paragon Plus Environment
The Journal of Physical Chemistry
123456789101112131415161718192021222324252627282930313233343536373839404142434445464748495051525354555657585960
9
In these expressions, �, is the bulk plasma frequency and -$��� is the damping constant
of the electron oscillatory movement. The latter represents the damping of electron
oscillation due to different processes: electron<electron collisions, electron<ion
collisions and electron<phonon collisions. These processes are characterized by the
mean time between two successive collisions and are taken into account altogether in
the -$��� value, since they cannot be specifically separated within the parameterization
of the bulk dielectric function.
When the size of metal NPs is smaller than the electron mean free path, the
dielectric function must be size corrected. The new expression may be written adding
size corrective terms for free and bound electrons to the experimental bulk dielectric
function:
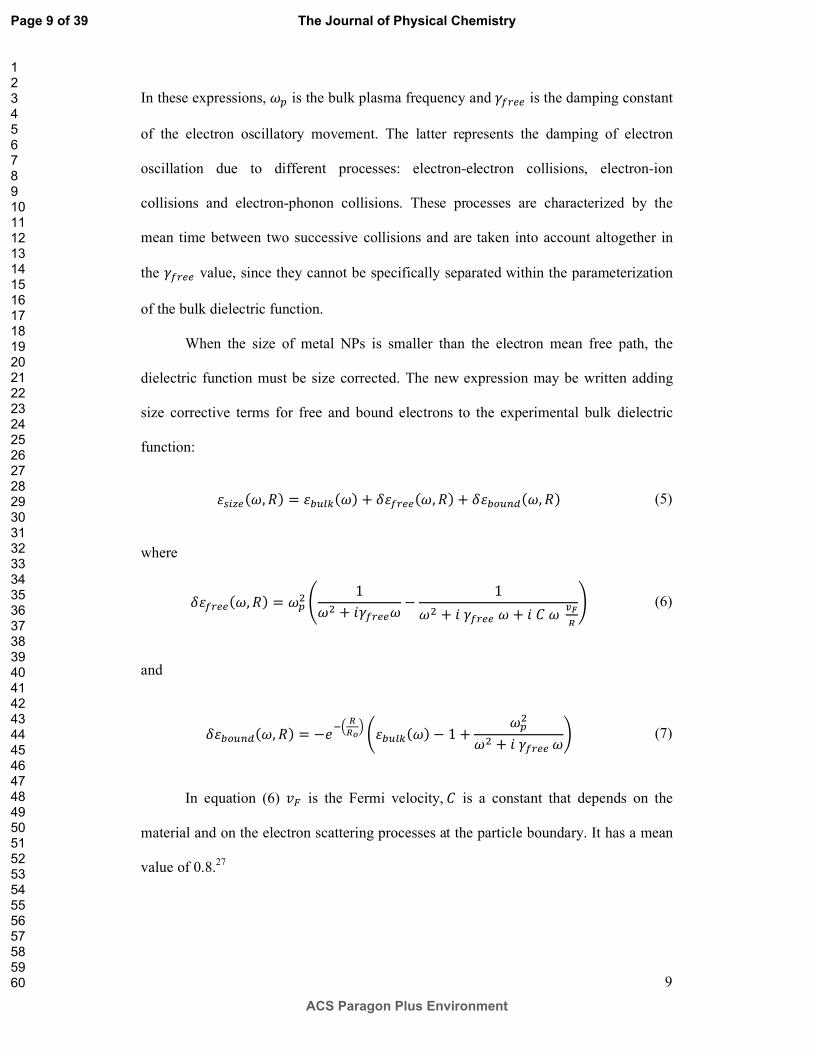
�9:���, �� = � !"#��� + <�$�����, �� + <� &!�'��, �� (5)
where
<�$�����, �� = �,� = 1�� + )-$���� − 1�� + )-$��� � + )�� >?@ A
(6)
and
<� &!�'��, �� = −2BC DDEF .� !"#��� − 1 + �,��� + )-$����/
(7)
In equation (6) GH is the Fermi velocity,� is a constant that depends on the
material and on the electron scattering processes at the particle boundary. It has a mean
value of 0.8.27
Page 9 of 39
ACS Paragon Plus Environment
The Journal of Physical Chemistry
123456789101112131415161718192021222324252627282930313233343536373839404142434445464748495051525354555657585960

10
In equation (7), the factor 2BC DDEF is related to the larger energy level separation
(and consequently a minor density of states) when the particle goes to smaller sizes
while the number of atoms decreases.28
Both size corrections <�$�����, �� and <� &!�'��, �� in equation (5) depend on
Fermi velocity and Drude model parameters �, and -$���. The procedure to determine
the two latter parameters was described in detail in the work by Mendoza Herrera et
al.29 Briefly, two linear parametric equations involving the real and imaginary parts of
�$������ can be derived from equation (3). When these equations are plotted with the
experimental frequency as a parameter, linear regressions may be obtained only for
large wavelengths where Drude model is dominant. The slopes of these regressions
yield �, and -$���. Using the experimental values for the complex refractive index of
Ni reported by Ordal et al. in the wavelength range from 670 nm to 80000 nm,30
�, = (6.41 ± 0.12) × 1015 �K and -$��� = (3.16 ± 0.35) × 1013
�K were determined.
Figure 2 shows the real and imaginary parts of Ni size<dependent dielectric
function versus wavelength for different radii considering the bulk refractive index data
given by Rakić et al.,31 which coincides with Ordal et al. in the NIR<mid IR but extends
the data to wavelengths smaller than 670 nm. Theoretical calculations were performed
based on equations (5) to (7), using �, and -$��� mentioned above, � = 0.8,
GH = 2.8 × 10¹⁴ LMK ,32 and �& = 0.35 nm.
Page 10 of 39
ACS Paragon Plus Environment
The Journal of Physical Chemistry
123456789101112131415161718192021222324252627282930313233343536373839404142434445464748495051525354555657585960

11
Figure 2. Calculated values of real and imaginary parts of Ni size<dependent dielectric function vs wavelength for different radii using equations (5) to (7).
The experimental bulk dielectric function is represented by the curve in dashed
line. The curve for 3 nm radius (full line) is almost superimposed to that for bulk,
indicating that for larger radii (� > 3 nm) size corrections are negligible. However, for
sizes smaller than 3 nm, curves depart from the bulk dielectric function in the
considered wavelength range between 200 nm and 1000 nm.
Figure 3 shows the extinction efficiency ���� of bare Ni NPs in water for radii
between 2 nm and 60 nm, plotted as a function of wavelength using equation (1). A
plasmon resonance for 7 nm radius can be observed as a small shoulder on the
extinction curve. This resonance is progressively redshifted up to 550 nm and increases
in intensity as the radius increases from 7 nm to 60 nm.
0
8
16
24
32
Wavelength [nm]
200 300 400 500 600 700 800 900 1000
ε (ω
, R)
<20
<15
<10
<5
0
0.6 nm 0.8 nm 1 nm 3 nm bulk
ε'
ε''
Page 11 of 39
ACS Paragon Plus Environment
The Journal of Physical Chemistry
123456789101112131415161718192021222324252627282930313233343536373839404142434445464748495051525354555657585960

12
Figure 3. Extinction spectra of Ni bare core NPs immersed in water. Plasmon resonance is redshifted and increases in intensity as the NPs radius increases.
A similar behavior in plasmon resonance redshift is observed when extinction is
calculated for bare Ni NPs in n<heptane.
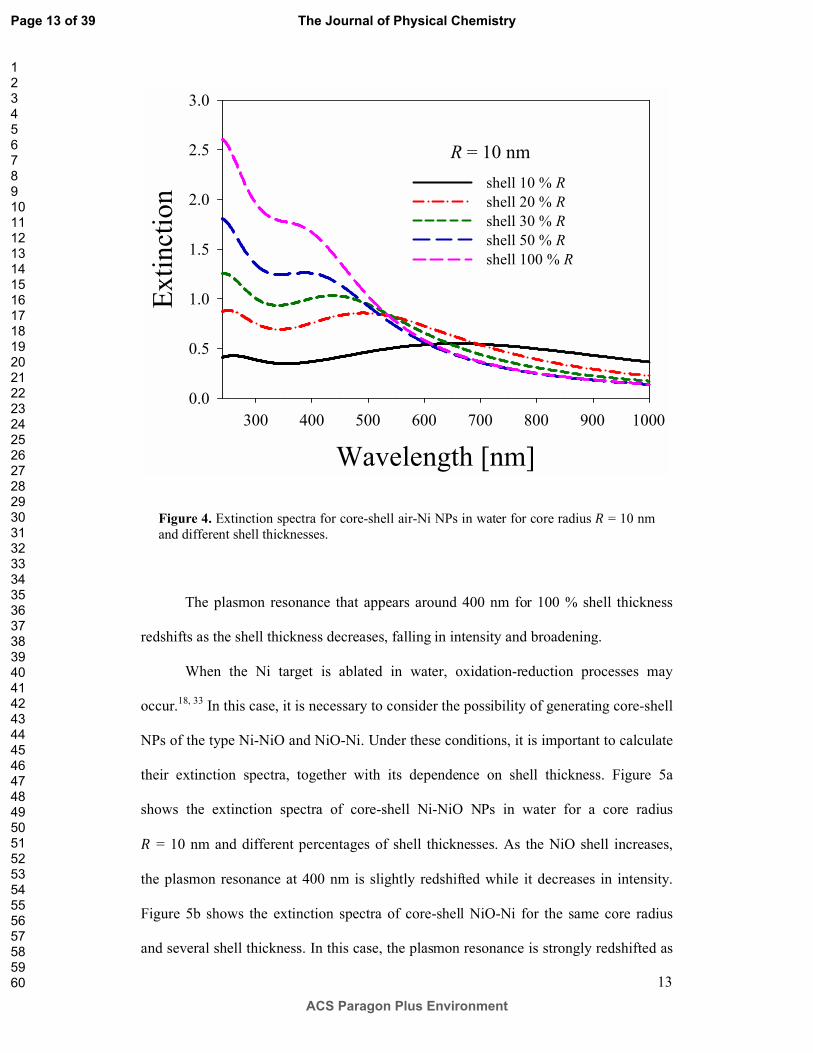
If the particles are core<shell type, the extinction efficiency depends on the inner
radius � and the outer radius �′ (see Supporting Information). Figure 4 shows the
extinction spectra of core<shell air<Ni NPs in water for a core radius � = 10 nm and
different percentages of shell thicknesses. For this particle size, the shape of the spectra
is still due mainly to absorption, since scattering contribution is negligible.
Wavelength [nm]
300 400 500 600 700 800 900 1000
Ext
inct
ion
0
1
2
3
42 nm
7 nm11 nm15 nm20 nm30 nm60 nm
Page 12 of 39
ACS Paragon Plus Environment
The Journal of Physical Chemistry
123456789101112131415161718192021222324252627282930313233343536373839404142434445464748495051525354555657585960
13
Figure 4. Extinction spectra for core<shell air<Ni NPs in water for core radius � = 10 nm and different shell thicknesses.
The plasmon resonance that appears around 400 nm for 100 % shell thickness
redshifts as the shell thickness decreases, falling in intensity and broadening.
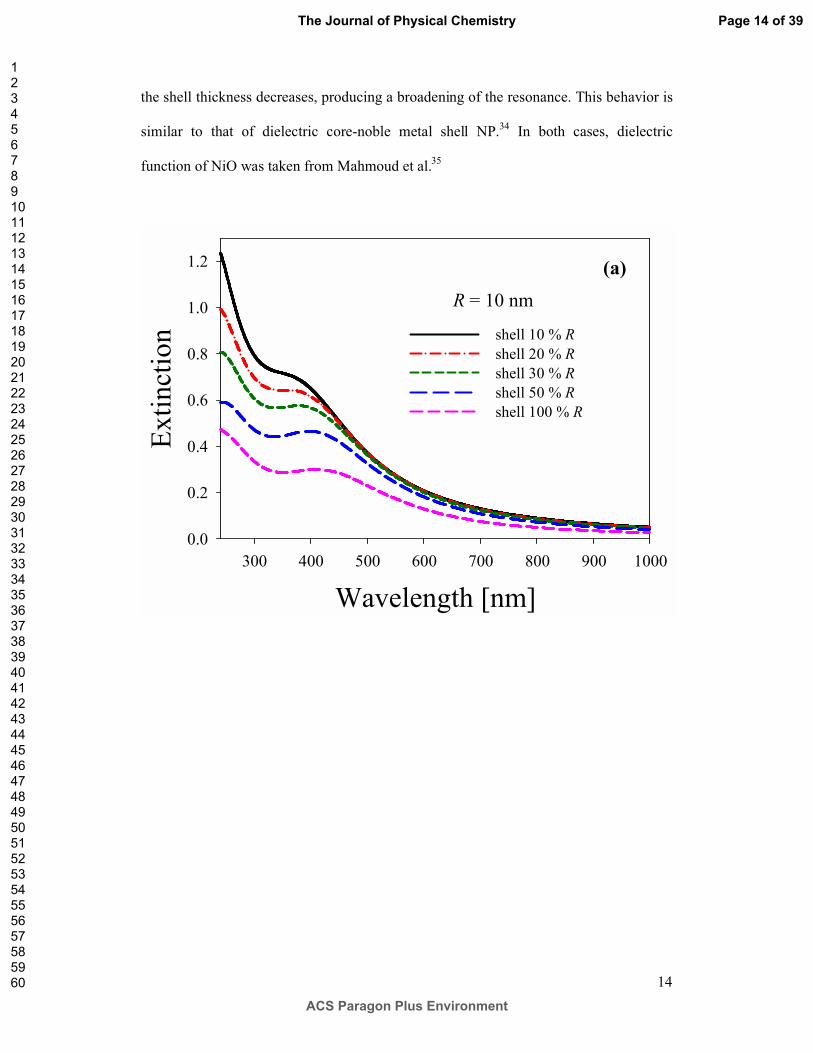
When the Ni target is ablated in water, oxidation<reduction processes may
occur.18, 33 In this case, it is necessary to consider the possibility of generating core<shell
NPs of the type Ni<NiO and NiO<Ni. Under these conditions, it is important to calculate
their extinction spectra, together with its dependence on shell thickness. Figure 5a
shows the extinction spectra of core<shell Ni<NiO NPs in water for a core radius
� = 10 nm and different percentages of shell thicknesses. As the NiO shell increases,
the plasmon resonance at 400 nm is slightly redshifted while it decreases in intensity.
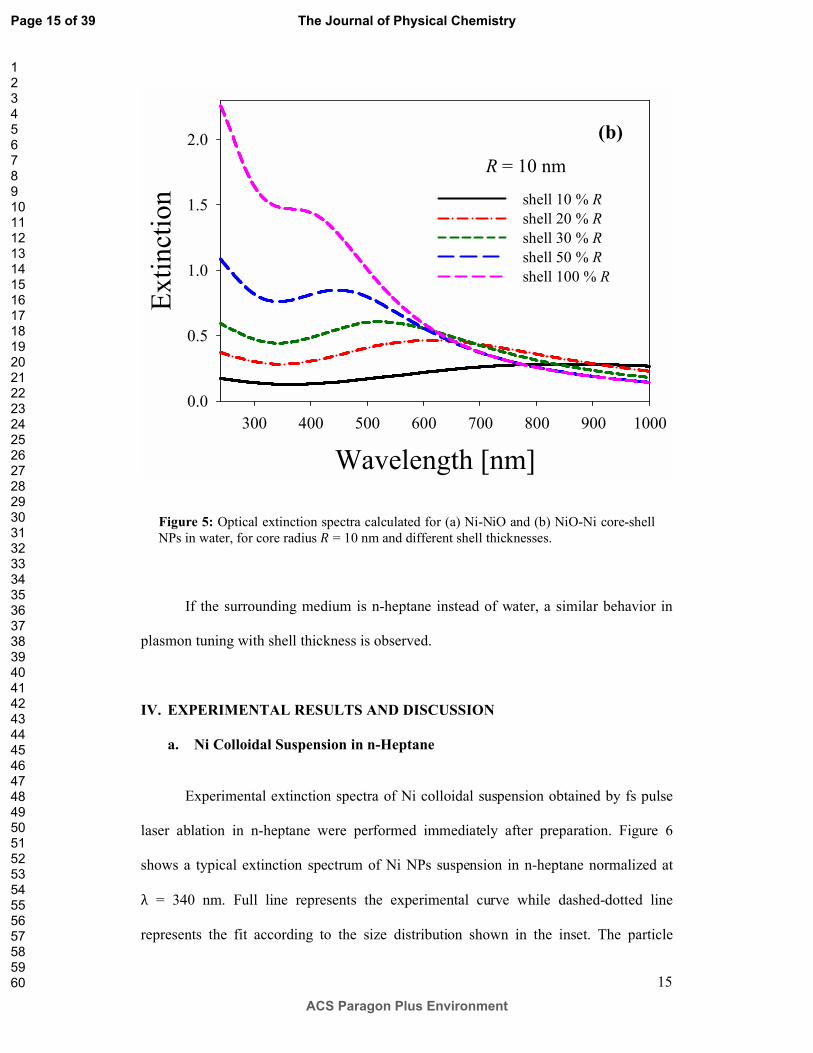
Figure 5b shows the extinction spectra of core<shell NiO<Ni for the same core radius
and several shell thickness. In this case, the plasmon resonance is strongly redshifted as
Wavelength [nm]
300 400 500 600 700 800 900 1000
Ext
inct
ion
0.0
0.5
1.0
1.5
2.0
2.5
3.0
shell 10 % Rshell 20 % R shell 30 % R shell 50 % R shell 100 % R
R = 10 nm
Page 13 of 39
ACS Paragon Plus Environment
The Journal of Physical Chemistry
123456789101112131415161718192021222324252627282930313233343536373839404142434445464748495051525354555657585960
14
the shell thickness decreases, producing a broadening of the resonance. This behavior is
similar to that of dielectric core<noble metal shell NP.34 In both cases, dielectric
function of NiO was taken from Mahmoud et al.35
Wavelength [nm]
300 400 500 600 700 800 900 1000
Ext
inct
ion
0.0
0.2
0.4
0.6
0.8
1.0
1.2
shell 10 % Rshell 20 % Rshell 30 % Rshell 50 % Rshell 100 % R
R = 10 nm
(a)
Page 14 of 39
ACS Paragon Plus Environment
The Journal of Physical Chemistry
123456789101112131415161718192021222324252627282930313233343536373839404142434445464748495051525354555657585960
15
Figure 5: Optical extinction spectra calculated for (a) Ni<NiO and (b) NiO<Ni core<shell NPs in water, for core radius � = 10 nm and different shell thicknesses.
If the surrounding medium is n<heptane instead of water, a similar behavior in
plasmon tuning with shell thickness is observed.
IV. EXPERIMENTAL RESULTS AND DISCUSSION
a. Ni Colloidal Suspension in n-Heptane
Experimental extinction spectra of Ni colloidal suspension obtained by fs pulse
laser ablation in n<heptane were performed immediately after preparation. Figure 6
shows a typical extinction spectrum of Ni NPs suspension in n<heptane normalized at
λ = 340 nm. Full line represents the experimental curve while dashed<dotted line
represents the fit according to the size distribution shown in the inset. The particle
Wavelength [nm]
300 400 500 600 700 800 900 1000
Ext
inct
ion
0.0
0.5
1.0
1.5
2.0
shell 10 % Rshell 20 % Rshell 30 % Rshell 50 % Rshell 100 % R
R = 10 nm
(b)
Page 15 of 39
ACS Paragon Plus Environment
The Journal of Physical Chemistry
123456789101112131415161718192021222324252627282930313233343536373839404142434445464748495051525354555657585960

16
sizing is represented in it by log<normal size distributions of bare core Ni NPs with
modal radii at 2.5 nm and 10 nm together with air<Ni core<shell NPs at external modal
radii of 6.6 nm (� = 6 nm; shell 10 % �), 12 nm (� = 10 nm; shell 20 % �) and 15.6 nm
(� = 15 nm; shell 4 % �).
Figure 6. Comparison between experimental (full line) and theoretical (dashed<dot line) extinction spectra of Ni colloidal suspension in n<heptane. Inset shows bare core and air<Ni relative abundance contributions that fit experimental spectrum. Long dashed line represents calculated spectrum with the same distribution without taking into account air<Ni NPs.
Based on the relative abundance curve shown in the inset of Figure 6 and taking
into account the Lambert Beer Law, we can calculate the number density (P) of each
species present in the colloidal suspension through a factor that relates the experimental
normalizing point at a given wavelength with the theoretical normalizing point at the
Wavelength [nm]
300 400 500 600 700 800 900 1000
Nor
mal
ized
ext
inct
ion
0.0
0.5
1.0
1.5
2.0
Experimental Theoretical fitTheoretical fit without air<Ni Nps
Radius [nm]0 5 10 15 20
Rel
ativ
e ab
unda
nce
0.0
0.1
0.2
0.3
0.4
0.5
Total distributionNi Nps contributionair<Ni Nps contribution
Page 16 of 39
ACS Paragon Plus Environment
The Journal of Physical Chemistry
123456789101112131415161718192021222324252627282930313233343536373839404142434445464748495051525354555657585960

17
same wavelength. The equation relating the number density P and the relative
abundance < (in cm–2 units) of the i<th species is P = QRSTU , where V is the experimental
spectrum normalization factor and W, the theoretical spectrum normalization factor. This
normalization can be carried out for any given wavelength. In our case V = 0.182 and
W = 114.95 for λ = 340 nm. In this way, it is possible to determine the number density of
bare core Ni and air<Ni NPs of different radii present in the colloidal suspension as
shown in Table 1. From OES measurements, the total number of NPs probed by the
spectrophotometer beam is approximately 2 × 10¹⁰. This value shows the high statistics
of OES technique.
Table 1. Number density and relative percentage of different species of NPs present in the colloidal suspension in n<heptane
Species Number density [cm–3
] Relative
percentage
Ni bare core 1.34 × 10¹¹ 82 %
Air<Ni core<shell 2.95 × 10¹⁰ 18 %
A key contribution for the accurate fit of the experimental extinction spectrum
from 350 nm onward can be found in the extinction behavior of hollow<type NPs. As
shown for the aqueous suspension in Figure 4, the extinction spectrum corresponding to
air<Ni NPs for 10 nm inner radius and Ni thickness smaller than 10 % of core radius
shows a very broad resonance centered at about 700 nm. This feature contributes to fit
the extinction spectra for λ > 350 nm. Calculated extinction without considering the
contribution of the air<Ni NPs is represented by the dashed line in Figure 6. It is readily
Page 17 of 39
ACS Paragon Plus Environment
The Journal of Physical Chemistry
123456789101112131415161718192021222324252627282930313233343536373839404142434445464748495051525354555657585960
18
seen that the curve fits the experimental spectrum only up to 350 nm, departing
noticeably from it for larger wavelengths.
Air<metal core<shell structures have been reported by other authors by ablating
specific materials using different kind of pulsed lasers. For example, Desarkar et al.
obtained Zn/ZnO hollow NPs using a 6 ns Nd:YAG pulsed laser ablation of zinc in
liquids.36 Yan et al. fabricated hollow Pt and Al2O3 NPs using a 50 ns pulsed excimer
laser for ablating solid Pt and Al targets in water.37–39 These authors propose that the
hollow particles are formed at the boundary of laser<produced bubbles, which provide a
preferred nucleation site and diffusion sink for self assembly of the laser<fabricated
clusters. Niu et al. obtained hollow NPs of diverse metal oxides and sulfides by laser
ablating metal targets in specific liquids, based on the Kirkendall effect after heating
with an infrared laser.40 More recently, we have found this type of hollow structures
using 120 fs pulsed laser ablation of a silver target in water,41 apart from other kind of
species present in the colloidal suspension. Our results on silver ablation and on Ni
ablation with fs regime, suggest that a similar formation mechanism about laser induced
bubbles may produce the observed hollow NPs. Although the relative abundance of Ni
hollow NPs in the colloidal suspension is small (about 18 %, as indicated by the dash
dotted line in inset of Figure 6), their influence on the shape on the extinction spectrum
in the Vis<NIR region is noticeable as can be seen in Figure 6 (dashed line curve).
AFM images of single NPs were obtained to characterize shape and size of the
Ni colloidal suspension generated in n<heptane. Figure 7a shows 50 �m × 50 �m
scanned area image where small isolated NPs are observed. Height profiles scanned in
lines 1 to 5 show NPs with typical external diameters of 15 nm, 27 nm, 5 nm, 22 nm
and 23 nm respectively, as indicated in Figure 7b. For these small size values, it is
important to consider the roughness of the mica substrate on which the drop was
Page 18 of 39
ACS Paragon Plus Environment
The Journal of Physical Chemistry
123456789101112131415161718192021222324252627282930313233343536373839404142434445464748495051525354555657585960

19
deposited. Line 3 in panels (a) and (b) shows the height profile of the mica background
across the imaged area. It can be seen that the mean roughness is about one order of
magnitude smaller than the smallest recorded particle, so there is a very good signal<to<
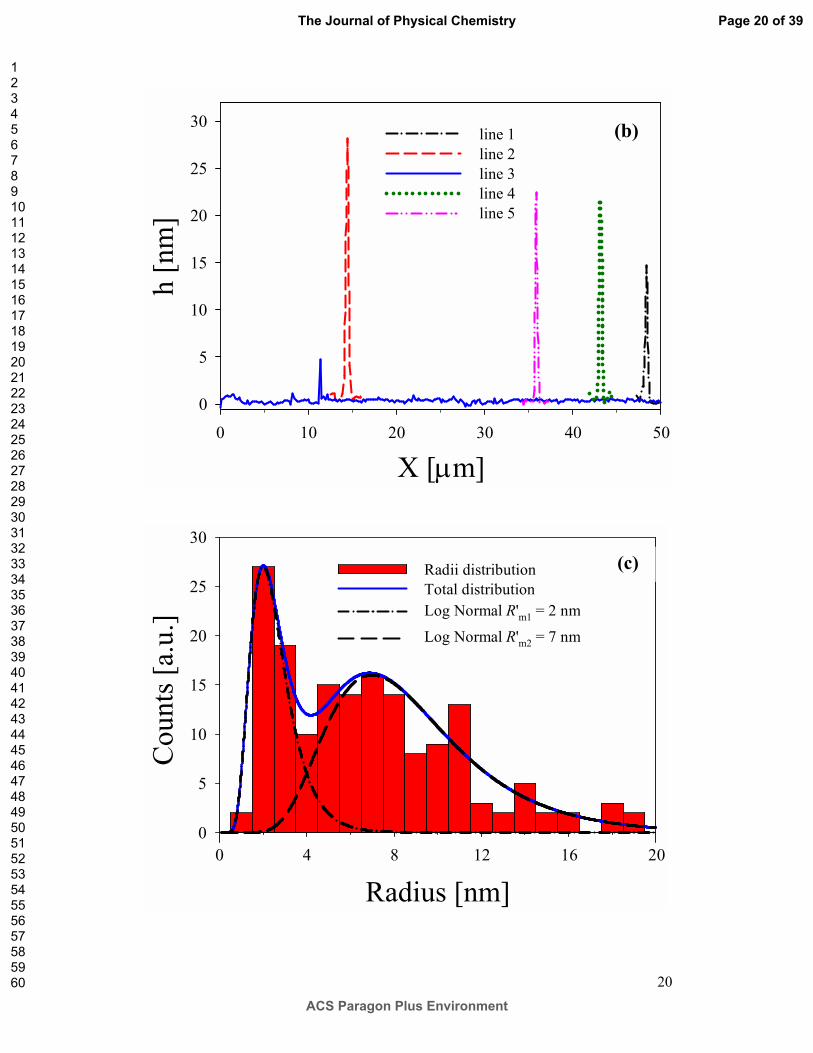
noise ratio in the nanoparticle’s profile. Panel (c) shows the radius histogram of the NPs
in the image of panel (a). The histogram can be fitted by two log<normal size
distributions centered at modal radius �′M� = 2 nm and �′M� = 7 nm.
Page 19 of 39
ACS Paragon Plus Environment
The Journal of Physical Chemistry
123456789101112131415161718192021222324252627282930313233343536373839404142434445464748495051525354555657585960
20
X [�m]0 10 20 30 40 50
h [n
m]
0
5
10
15
20
25
30line 1 line 2line 3 line 4 line 5
(b)
Radius [nm]
0 4 8 12 16 20
Cou
nts
[a.u
.]
0
5
10
15
20
25
30
Radii distributionTotal distributionLog Normal R'm1 = 2 nm; σ
1 = 0.4
Log Normal R'm2 = 7 nm; σ2 = 0.4
(c)
Page 20 of 39
ACS Paragon Plus Environment
The Journal of Physical Chemistry
123456789101112131415161718192021222324252627282930313233343536373839404142434445464748495051525354555657585960
21
Figure 7. AFM size analysis of the obtained Ni colloidal suspension in n<heptane: (a) image of isolated single Ni NPs; (b) height profiles of selected lines 1 to 5 from panel (a) which correspond to the spherical particles diameter; (c) radius histogram together with two log<normal size distributions at �′M� = 2 nm and �′M� = 7 nm. Full line represents the sum of both distributions.
Although the amount of particles observed in the AFM image is much smaller than that
probed by OES, it can be seen that the heights in panel (b) and the histogram in panel
(c) of Figure 7 are in good agreement with the external radii distribution determined
from the fit of the extinction spectrum of the sample shown in the inset of Figure 6.
To study the morphology of Ni NPs, TEM analysis was carried out. Figure 8
shows TEM images of Ni colloidal suspension fabricated by ablation in n<heptane.
Panel (a) shows a panoramic view of isolated bare core and hollow Ni NPs. Panel (b) is
an enlargement of a bare core Ni NP from panel (a). Panel (c) is another panoramic
view together with an enlargement of an air<Ni NP. Dotted line outlines the limit of the
core and shell structure. Panel (d) shows the radius histogram corresponding to a
statistics performed over several TEM images. The results can be fitted by two log<
normal size distributions which describe the most prominent features of the histogram.
Page 21 of 39
ACS Paragon Plus Environment
The Journal of Physical Chemistry
123456789101112131415161718192021222324252627282930313233343536373839404142434445464748495051525354555657585960

22
Figure 8. TEM image of NPs present in the Ni colloidal suspension in n<heptane. (a) Panoramic view; (b) single isolated bare core Ni NP; (c) detail of a hollow Ni NP and (d) radius histogram and log<normal size distributions which account for the most prominent features of the histogram.
It is interesting to notice that the sizes arising from TEM analysis (Figure 8) as
well as those obtained from AFM (Figure 7) are in agreement with results derived from
OES shown in Figure 6. Spherical bare core and core<shell structures can be seen. This
fact supports the use of Mie approach for calculating extinction spectra as well as the
inclusion of this type of hollow particles for fitting the spectrum.
b. Ni Colloidal Suspension in Water
Ni colloidal suspensions in water were studied with the same methods as before.
Figure 9 shows a typical extinction spectrum in the range UV<visible<near IR
Page 22 of 39
ACS Paragon Plus Environment
The Journal of Physical Chemistry
123456789101112131415161718192021222324252627282930313233343536373839404142434445464748495051525354555657585960

23
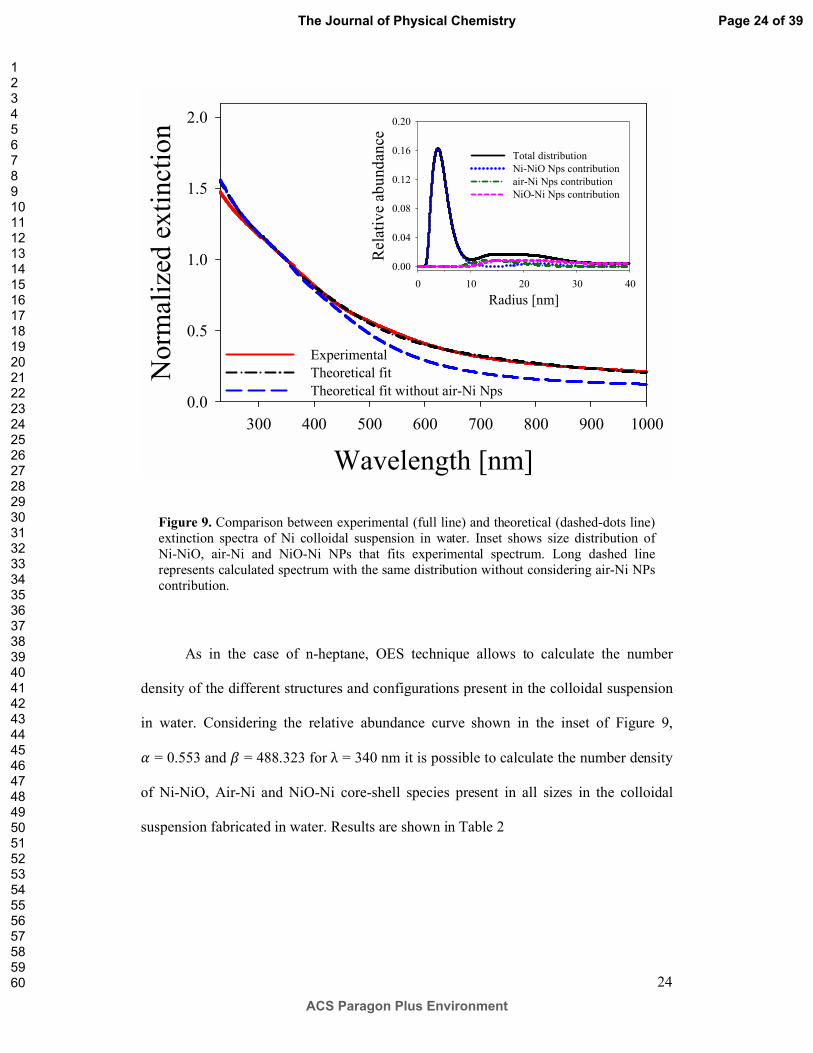
normalized at λ = 340 nm. Full line represents the experimental extinction curve, while
dashed<dotted line is the theoretical fit. In this case, since the solvent is water, some
degree of oxidation is surely to occur. Structures and configurations like bare core NiO
besides core<shell structures of Ni<NiO, NiO<Ni as well as air<Ni were considered to be
present in the colloidal suspension. The inset shows in full line the total size distribution
that yield the optimum fit of the experimental spectrum. Specific size distribution for
Ni<NiO NPs (dotted line), air<Ni NPs (dashed<dotted line) and NiO<Ni NPs (dashed
line) are also shown. The latter size distribution includes bare core NiO NPs species. It
can be noticed that the multimodal size distribution shape is similar to that determined
for n<heptane but shifted to larger values of external radii. This fact may be due to the
presence of oxide shells around the NPs. Each one of the previously mentioned species
influence the extinction spectrum in specific and distinct regions in such a way that the
combination of structures, configurations, sizes and relative abundances derived from
optimum fit constitute a unique set of fitting parameters. For instance, theoretical
calculation without considering air<Ni NPs, will not fit the experimental extinction
spectrum for wavelengths larger than 400 nm (long dashed line in Figure 9). Similarly
to the effect shown for n<heptane, the exclusion of this type of particles precludes the
correct fit of the spectrum for this wavelength range. Notice that, although the
abundance of air<Ni NPs is rather small (see inset), it has a very large effect in the
fitting procedure. A similar lack of fitting is observed when the contribution of NiO<Ni
NPs is not considered (not shown in Figure 9). For a given species type any small
variation in size or relative abundance produce a noticeable change in the shape of the
spectrum.
Page 23 of 39
ACS Paragon Plus Environment
The Journal of Physical Chemistry
123456789101112131415161718192021222324252627282930313233343536373839404142434445464748495051525354555657585960
24
Figure 9. Comparison between experimental (full line) and theoretical (dashed<dots line) extinction spectra of Ni colloidal suspension in water. Inset shows size distribution of Ni<NiO, air<Ni and NiO<Ni NPs that fits experimental spectrum. Long dashed line represents calculated spectrum with the same distribution without considering air<Ni NPs contribution.
As in the case of n<heptane, OES technique allows to calculate the number
density of the different structures and configurations present in the colloidal suspension
in water. Considering the relative abundance curve shown in the inset of Figure 9,
V = 0.553 and W = 488.323 for λ = 340 nm it is possible to calculate the number density
of Ni<NiO, Air<Ni and NiO<Ni core<shell species present in all sizes in the colloidal
suspension fabricated in water. Results are shown in Table 2
Wavelength [nm]
300 400 500 600 700 800 900 1000
Nor
mal
ized
ext
inct
ion
0.0
0.5
1.0
1.5
2.0
Experimental Theoretical fitTheoretical fit without air<Ni Nps
Radius [nm]0 10 20 30 40
Rel
ativ
e ab
unda
nce
0.00
0.04
0.08
0.12
0.16
0.20
Total distributionNi<NiO Nps contributionair<Ni Nps contributionNiO<Ni Nps contribution
Page 24 of 39
ACS Paragon Plus Environment
The Journal of Physical Chemistry
123456789101112131415161718192021222324252627282930313233343536373839404142434445464748495051525354555657585960

25
Table 2. Number density and relative percentage of different species of core<shell NPs present in the colloidal suspension in water
Species Number density [cm–3
] Relative
percentage
Ni<NiO 8.38 × 10¹⁰ 75 %
Air<Ni 1.02 × 10¹⁰ 9 %
NiO<Ni 1.77 × 10¹⁰ 16 %
As in the case of Ni NPs in n<heptane, hollow NPs are present in the water
colloidal suspension. Its formation could be related to the laser induced bubbles. The
optical breakdown induced by laser ablation in water, produces H2 gas as by<product
from the following reaction
Ni + H2O → NiO + H2 (12)
Besides, O2 and H2 may also be generated in water at the focus of the laser beam. The
gas content increases the stability of the bubbles,39 providing a larger probability for
hollow particle formation. Since during fs laser ablation high temperatures and
pressures are easily reached in the plasma plume and in the plasma<liquid interface42
during a time interval compatible with the fast oxidation kinetics at the nanoscale (about
100 ns), it is possible to argue that, under our experimental conditions, the previous
reaction may generate oxidized species in the form of NiO and Ni<NiO NPs in the
colloidal suspension.
There is another process that must be considered. Medford et al. reported that
when hollow oxidized Ni NPs in the size range 10 nm to 90 nm are exposed to a low
content H2 atmosphere at 350 ºC, they undergo a reduction process (which depends on
Page 25 of 39
ACS Paragon Plus Environment
The Journal of Physical Chemistry
123456789101112131415161718192021222324252627282930313233343536373839404142434445464748495051525354555657585960
26
the initial size of the NPs) that gives rise to a metal shell around the particles.43 As
stated above in equation (12), during fs laser ablation of Ni, H2 is produced as a by<
product that, together with the high metal surface temperature obtained in the ablation
process, allows the reduction of the formed NiO NPs, yielding a core<shell species of
the type NiO<Ni in the colloidal suspension.
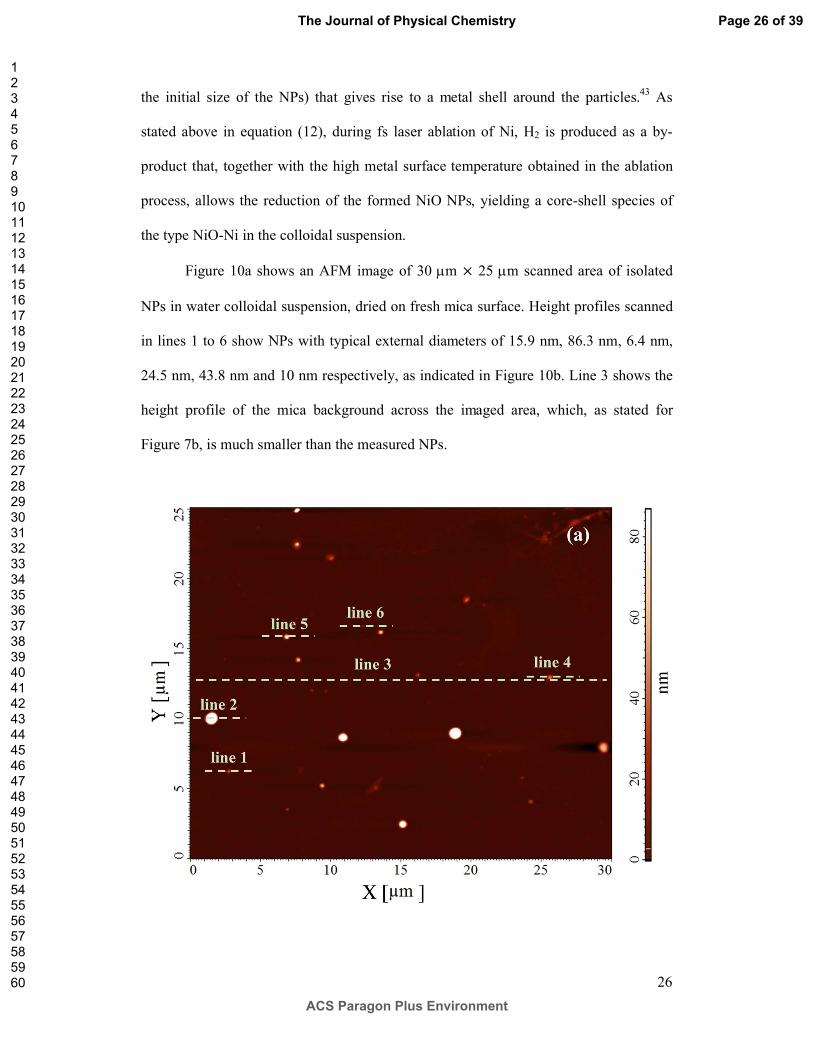
Figure 10a shows an AFM image of 30 �m × 25 �m scanned area of isolated
NPs in water colloidal suspension, dried on fresh mica surface. Height profiles scanned
in lines 1 to 6 show NPs with typical external diameters of 15.9 nm, 86.3 nm, 6.4 nm,
24.5 nm, 43.8 nm and 10 nm respectively, as indicated in Figure 10b. Line 3 shows the
height profile of the mica background across the imaged area, which, as stated for
Figure 7b, is much smaller than the measured NPs.
Page 26 of 39
ACS Paragon Plus Environment
The Journal of Physical Chemistry
123456789101112131415161718192021222324252627282930313233343536373839404142434445464748495051525354555657585960

27
Figure 10. AFM size analysis of the obtained NPs after ablation of Ni target in water: (a) image of isolated NPs; (b) height profiles of selected lines 1 to 6 from panel (a).
Figure 11 shows TEM images of Ni colloidal suspension obtained by ablation in
water. Panel (a) shows an isolated air<Ni core<shell NP. Panel (b) shows a bare core and
core<shell NPs along with their respective sizes, placed in a different plane with respect
to the other agglomerates of NPs. This is the reason why it is possible to observe other
smaller NPs beyond the particle as the TEM electrons traverse across the sample. Panel
(c) is a panoramic view where spherical particles showing different structures can be
observed. Panel (d) shows the radius histogram corresponding to a statistics performed
over several TEM images. Some isolated NPs with radius larger than 40 nm, which are
shown in these images for illustrative purposes, are not plotted on the histogram
because they represent less than 1 % of the observed number of particles.
X [�m]
0 5 10 15 20 25 30
h [n
m]
0
20
40
60
80
100
line 1line 2line 3line 4line 5line 6
(b)
Page 27 of 39
ACS Paragon Plus Environment
The Journal of Physical Chemistry
123456789101112131415161718192021222324252627282930313233343536373839404142434445464748495051525354555657585960

28
The results can be fitted by two log<normal size distributions which describe the
most prominent features of the histogram. As in the case of n<heptane, there is a good
agreement between TEM, AFM and OES results.
Figure 11. TEM image of Nps present in Ni colloidal suspension in water. (a) isolated single hollow Ni NP; (b) spherical bare core and core<shell NP. (c) panoramic view showing bare core and core<shell NPs and (d) radius histogram where two log<normal size distributions account for the most prominent features of the histogram.
TEM images of the NPs obtained by laser ablation are shown in Figure 12. Panel
(a) contains enlargements of two regions where NiO Bragg planes can be observed
Page 28 of 39
ACS Paragon Plus Environment
The Journal of Physical Chemistry
123456789101112131415161718192021222324252627282930313233343536373839404142434445464748495051525354555657585960

29
(Table 3). The NPs shown in Figure 12 are very similar to those reported by Medford et
al. at the beginning of the reduction process by exposure to H2.43
Electron diffraction patterns were measured on selected NPs for phase
identification. A representative pattern is shown in Figure 12b, which is indexed with
the reflection lines of NiO (Cubic, mFm3 , JCPDS #75<0197) and Ni (Cubic, mFm3 ,
JCPDS #04<0850). Electron diffraction rings are labeled according to Table 3, where the
Miller indices (h, k, l) and the interplanar distances (d) are indicated. No reflection
characteristics of other structures appear.
Figure 12. (a) TEM image of Ni NPs obtained by laser ablation in water; enlargements show typical regions where NiO Bragg planes can be observed, (b) Electron diffraction pattern indexed with the reflection lines of NiO (lines 1, 2 and 5) and Ni (lines 3 and 4) according to Table 3.
Page 29 of 39
ACS Paragon Plus Environment
The Journal of Physical Chemistry
123456789101112131415161718192021222324252627282930313233343536373839404142434445464748495051525354555657585960

30
Table 3. Interplanar distances (d) and Miller indices (h, k, l) for Ni (JCPDS #04<0850) and NiO (JCPDS #75<0197) used to index the electron diffraction pattern
Ring dNi (nm) dNiO (nm) (h, k, l)
1 0.2369 (1, 1, 1)
2 0.2052 (2, 0, 0)
3 0.2034 (1, 1, 1)
4 0.1762 (2, 0, 0)
5 0.1451 (2, 2, 0)
V. CONCLUSIONS
Colloidal Ni NPs were generated in n<heptane and water after fs pulsed laser
ablation on solid target. The suspensions were analyzed using spectroscopic,
microscopy and electron diffraction techniques to characterize their structure,
configuration, composition and sizing. NPs resulted spherical in shape, with bare core
or core<shell structure.
Fit of the experimental extinction spectra in each solvent using an iterative
method based on Mie theory with appropriate size correction of the bulk complex
dielectric function yielded the size distributions of bare core and core<shell NPs in the
Ni colloidal suspension. For n<heptane, the total log<normal size distribution had a
modal radius of 2.5 nm with a secondary maximum at 7 nm and 12 nm. This
Page 30 of 39
ACS Paragon Plus Environment
The Journal of Physical Chemistry
123456789101112131415161718192021222324252627282930313233343536373839404142434445464748495051525354555657585960

31
distribution consists of two different structures: bare core and hollow Ni NPs. For water,
the total log<normal size distribution had a modal radius of 4 nm with a secondary broad
distribution centered at 20 nm. In this case, only core<shell structures composed by
hollow Ni, Ni<NiO and NiO<Ni NPs contribute to the total distribution. The formation
of NiO<Ni and hollow Ni species is reported for the first time in this paper.
In spite the number of particles observed in the AFM image is much smaller
than that probed by OES (which is of about 1010), the AFM heights (diameters)
histogram is in good agreement with the external radii distribution determined from the
fit of the extinction spectrum. TEM analysis yielded spherical bare core, metal<metal
oxide core<shell structures and hollow air<Ni NPs. This fact confirms the results
obtained using Mie theory with the inclusion of core<shell and hollow particles for
fitting the spectra. Since OES provides a non local analysis of the samples, as compared
with TEM and AFM, we consider that OES yields statistically reliable results about size
distribution and structures.
Electron diffraction patterns were measured on selected NPs for phase
identification. The obtained representative pattern was indexed with the reflection lines
of NiO and Ni, thus also supporting the species distribution obtained after the optical
absorbance spectrum fitting. The formation of Ni<oxide core<shell species may be
explained by the generation of oxygen atoms during laser ablation in water and
subsequent metal oxidation processes. Metal shell formation in NiO<Ni NP may arise
due to exposure of NiO NP to a low<content H2 environment due to laser photolysis. On
the other hand, hollow Ni NPs may be produced during bubble formation in laser
ablation.
Page 31 of 39
ACS Paragon Plus Environment
The Journal of Physical Chemistry
123456789101112131415161718192021222324252627282930313233343536373839404142434445464748495051525354555657585960

32
VI. ASSOCIATED CONTENT
Supporting Information
Equations for theoretical calculations of extinction cross section, as well as full
description of references 8 and 17, have been provided. This material is available free of
charge via the Internet at http://pubs.acs.org.
VII. AUTHOR INFORMATION
Corresponding Author
*Phone: +54 221 4840280/4715249 int. 213. Fax: +54 221 4712771. E<mail:
Notes
The authors declare no competing financial interest.
VIII. ACKNOWLEDGMENTS
This work was granted by PIP 0394 and PIP 0720 of CONICET, PME2006<
00018 of ANPCyT, grant 11/I151 of Facultad de Ingeniería Universidad Nacional de La
Plata and grant 11/X680 of Facultad de Ciencias Exactas Universidad Nacional de La
Plata, Argentina. We thank C2NANO < Brazilian Nanotechnology National Laboratory
(LNNano) at Centro Nacional de Pesquisa em Energia e Materiais (CNPEM) / MCT
(#14825 and 14827) and Research Proposal TEM<16976 for the use of TEM. AFM was
carried out at LFAyM of Instituto de Física La Plata (IFLP < CONICET). We
acknowledge Dr. Francisco Sánchez from Instituto de Física La Plata (IFLP <
CONICET) for fruitful discussions on magnetic nanoparticles.
Page 32 of 39
ACS Paragon Plus Environment
The Journal of Physical Chemistry
123456789101112131415161718192021222324252627282930313233343536373839404142434445464748495051525354555657585960

33
D. C. Schinca is Member of Comisión de Investigaciones Científicas de la
Provincia de Buenos Aires (CIC). L. B. Scaffardi, M. B. Fernández van Raap, P.
Mendoza Zélis and J. M. J. Santillán are researchers of CONICET. D. Muraca is
Member of Instituto de Física “Gleb Wataghin” (IFGW), Campinas, Brazil. D. Muñetón
Arboleda and L. J. Mendoza Herrera are PhD fellows of CONICET, Argentina.
IX. REFERENCES
(1) Bönnemann, H.; Richards, R. M. Nanoscopic Metal Particles < Synthetic Methods
and Potential Applications. Eur. J. Inorg. Chem. 2001, 10, 2455–2480.
(2) Chen, C. C.; Herhold, A. B.; Johnson, C. S.; Alivisatos, A. P. Size Dependence of
Structural Metastability in Semiconductor Nanocrystals. Science 1997, 276, 398–401.
(3) Puntes, V. F.; Krishnan, K. M.; Alivisatos, A. P. Colloidal Nanocrystal Shape and
Size Control: The Case of Cobalt. Science 2001, 291, 2115–2117.
(4) Andrade, A. L.; Valente, M. A.; Ferreira, J. M. F.; Fabris, J. D. Preparation of Size<
Controlled Nanoparticles of Magnetite. J. Magn. Magn. Mater. 2012, 324, 1753–1757.
(5) Hou, Y.; Gao, S. Monodisperse Nickel Nanoparticles Prepared from a
Monosurfactant System and their Magnetic Properties. J. Mater. Chem. 2003, 13, 1510–
1512.
(6) Sun S.; Murray, C. B.; Weller, D.; Folks, L.; Moser, A. Monodisperse FePt
Nanoparticles and Ferromagnetic FePt Nanocrystal Superlattices. Science 2000, 287,
1989–1992.
(7) Beecroft, L. L.; Ober, C. K. Nanocomposite Materials for Optical Applications.
Chem. Mater. 1997, 9, 1302–1317.
(8) Park, J.; Kang, E.; Son, S. U.; Park, H. M.; Lee, M. K.; Kim, J.; Kim, K. W.; Noh,
H. J.; Park, J. H.; Bae, C.; et al. Monodisperse Nanoparticles of Ni and NiO: Synthesis,
Page 33 of 39
ACS Paragon Plus Environment
The Journal of Physical Chemistry
123456789101112131415161718192021222324252627282930313233343536373839404142434445464748495051525354555657585960

34
Characterization, Self<Assembled Superlattices, and Catalytic Applications in the
Suzuki Coupling Reaction. Adv. Mater. 2005, 17, 429–434.
(9) Xu, R.; Xie, T.; Zhao, Y.; Li, Y. Quasi<Homogeneous Catalytic Hydrogenation over
Monodisperse Nickel and Cobalt Nanoparticles. Nanotechnology 2007, 18, 055602–
055605.
(10) Bai, L.; Yuan, F.; Tang, Q. Synthesis of Nickel Nanoparticles with Uniform Size
via a Modified Hydrazine Reduction Route. Mater. Lett. 2008, 62, 2267–2270.
(11) Wessells, C. D.; Peddada, S. V.; Huggins, R. A.; Cui, Y. Nickel Hexacyanoferrate
Nanoparticle Electrodes for Aqueous Sodium and Potassium Ion Batteries. Nano Lett.
2011, 11, 5421–5425.
(12) Couto, G. G.; Klein, J. J.; Schreiner, W. H.; Mosca, D. H.; de Oliveira, A. J. A.;
Zarbin, A. J. G. Nickel Nanoparticles Obtained by a Modified Polyol Process:
Synthesis, Characterization, and Magnetic Properties. J. Colloid Interf. Sci. 2007, 311,
461–468.
(13) Ramírez<Meneses, E.; Betancourt, I.; Morales, F.; Montiel<Palma, V.; Villanueva<
Alvarado, C. C.; Hernández<Rojas, M. E. Superparamagnetic Nickel Nanoparticles
Obtained by an Organometallic Approach. J. Nanopart. Res. 2011, 13, 365–374.
(14) Ni, X.; Zhao, Q.; Zheng, H.; Li, B.; Song, J.; Zhang, D.; Zhang, X. A Novel
Chemical Reduction Route Towards the Synthesis of Crystalline Nickel Nanoflowers
from a Mixed Source. Eur. J. Inorg. Chem. 2005, 4788–4793.
(15) Cheng, J.; Zhang, X.; Ye, Y. Synthesis of Nickel Nanoparticles and Carbon
Encapsulated Nickel Nanoparticles Supported on Carbon Nanotubes. J. Solid State
Chem. 2006, 179, 91–95.
(16) Murugadoss, G.; Rajesh Kumar, M. Synthesis and Optical Properties of
Monodispersed Ni2+<Doped ZnS Nanoparticles. Appl. Nanosci. 2014, 4, 67–75.
Page 34 of 39
ACS Paragon Plus Environment
The Journal of Physical Chemistry
123456789101112131415161718192021222324252627282930313233343536373839404142434445464748495051525354555657585960

35
(17) Rodríguez<Llamazares, S.; Merchán, J.; Olmedo, I.; Marambio, H. P.; Muñoz, J.
P.; Jara, P.; Sturm, J. C.; Chornik, B.; Peña, O.; Yutronic, N.; et al. Ni/Ni Oxides
Nanoparticles with Potential Biomedical Applications Obtained by Displacement of a
Nickel<Organometallic Complex. J. Nanosci. Nanotechnol. 2008, 8, 3820–3827.
(18) Liu, B.; Hu, Z.; Che, Y.; Chen, Y.; Pan, X. Nanoparticle Generation in Ultrafast
Pulsed Laser Ablation of Nickel. Appl. Phys. Lett. 2007, 90, 044103–3.
(19) Amoruso, S.; Bruzzese, R.; Wang, X.; Nedialkov, N. N.; Atanasov, P. A.
Femtosecond Laser Ablation of Nickel in Vacuum. J. Phys. D: Appl. Phys. 2007, 40,
331–340.
(20) Dudoitis, V.; Ulevičius, V.; Račiukaitis, G.; Špirkauskaitė, N.; Plauškaitė, K.
Generation of Metal Nanoparticles by Laser Ablation. Lithuanian J. Phys. 2011, 51,
248–259.
(21) Jaleh, B.; Torkamany, M. J.; Golbedaghi, R.; Noroozi, M.; Habibi, S.; Samavat, F.;
Jaberian Hamedan, V.; Albeheshti, L. Preparation of Nickel Nanoparticles via Laser
Ablation in Liquid and Simultaneously Spectroscopy. Adv. Mater. Res. 2012, 403-408,
4440–4444.
(22) Jung, H. J.; Choi, M. Y. Specific Solvent Produces Specific Phase Ni
Nanoparticles: A Pulsed Laser Ablation in Solvents. J. Phys. Chem. C 2014, 118,
14647–14654.
(23) Musaev, O. R.; Yan, J.; Dusevich, V.; Wrobel, J. M.; Kruger, M. B. Ni
Nanoparticles Fabricated by Laser Ablation in Water. Appl. Phys. A 2014, 116, 735–
739.
(24) Bohren, C. F.; Huffmanm, D. R. Absorption and Scattering of Light by Small
Particles; Wiley: New York, 1998.
Page 35 of 39
ACS Paragon Plus Environment
The Journal of Physical Chemistry
123456789101112131415161718192021222324252627282930313233343536373839404142434445464748495051525354555657585960

36
(25) Rosensweig, R. E. Heating Magnetic Fluid with Alternating Magnetic Field. J.
Magn. Magn. Mat. 2002, 252, 370–374.
(26) Goya, G. F.; Fonseca, F. C.; Jardim, R. F.; Muccillo, R.; Carreño, N. L. V.; Longo,
E.; Leite, E. R. Magnetic Dynamics of Single Domain Ni Nanoparticles. J. Appl. Phys.
2003, 93, 6531.
(27) Kreibig, U.; Vollmer, M. Optical Properties of Metal Clusters; Springer: Berlin,
1995.
(28) Scaffardi, L. B.; Tocho, J. O. Size Dependence of Refractive Index of Gold
Nanoparticles. Nanotechnology 2006, 17, 1309–1315.
(29) Mendoza Herrera, L. J.; Muñetón Arboleda, D.; Schinca, D. C.; Scaffardi, L. B.
Determination of Plasma Frequency, Damping Constant, and Size Distribution from the
Complex Dielectric Function of Noble Metal Nanoparticles. J. Appl. Phys. 2014, 116,
233105–8.
(30) Ordal, M. A.; Bell, R. J.; Alexander, R. W. Jr.; Long, L. L.; Querry, M. R. Optical
Properties of Au, Ni, and Pb at Submillimeter Wavelengths. Appl. Opt. 1987, 26, 744–
752.
(31) Rakić, A. D.; Djurišic, A. B.; Elazar, J. M.; Majewski, M. L. Optical Properties of
Metallic Films for Vertical<Cavity Optoelectronic Devices. Appl. Opt. 1998, 37, 5271–
5283.
(32) Petrovykh, D. Y.; Altmann, K. N.; Hochst, H.; Laubscher, M.; Maat, S.; Mankey,
G. J.; Himpse, F. J. Spin<dependent Band Structure, Fermi Surface, and Carrier Lifetime
of Permalloy. Appl. Phys. Lett. 1998, 73, 3459–3461.
(33) Khan, S. Z.; Yuan, Y.; Abdolvand, A.; Schmidt, M.; Crouse, P.; Li, L.; Liu, Z.;
Sharp, M.; Watkins, K. G. Generation and Characterization of NiO Nanoparticles by
Page 36 of 39
ACS Paragon Plus Environment
The Journal of Physical Chemistry
123456789101112131415161718192021222324252627282930313233343536373839404142434445464748495051525354555657585960

37
Continuous Wave Fiber Laser Ablation in Liquid. J. Nanopart. Res. 2009, 11, 1421–
1427.
(34) Prodan, E.; Norlander, P. Structural Tunability of the Plasmon Resonances in
Metallic Nanoshells. Nano Lett. 2003, 3, 543–547.
(35) Mahmoud, S. A.; Alshomer, S.; Tarawnh, M. A. Structural and Optical Dispersion
Characterization of Sprayed Nickel Oxide Thin Films. J. Modern Phys. 2011, 2, 1178–
1186.
(36) Desarkar, H. S.; Kumbhakar, P.; Mitra, A. K. One<step Synthesis of Zn/ZnO
Hollow Nanoparticles by the Laser Ablation in Liquid Technique. Laser Phys. Lett.
2013, 10, 055903–8.
(37) Yan, Z.; Bao, R.; Chrisey, D. B. Excimer Laser Ablation of a Pt Target in Water:
The Observation of Hollow Particles. Nanotechnology 2010, 21, 145609–8.
(38) Yan, Z.; Bao, R.; Huang, Y.; Chrisey, D. B. Hollow Particles Formed on Laser<
Induced Bubbles by Excimer Laser Ablation of Al in Liquid. J. Phys. Chem. C 2010,
114, 11370–11374.
(39) Yan, Z.; Bao, R.; Wright, R. N.; Chrisey, D. B. Hollow nanoparticle generation on
Laser<Induced Cavitation Bubbles via Bubble Interface Pinning. Appl. Phys. Lett. 2010,
97, 124106–3.
(40) Niu, K. Y.; Yang, J.; Kulinich, S. A.; Sun, J.; Du, X. W. Hollow Nanoparticles of
Metal Oxides and Sulfides: Fast Preparation via Laser Ablation in Liquid. Langmuir
2010, 26, 16652–16657.
(41) Santillán, J. M. J.; Videla, F. A.; Fernández van Raap, M. B.; Muraca, D.;
Scaffardi, L. B.; Schinca, D. C. Influence of Size<Corrected Bound<Electron
Contribution on Nanometric Silver Dielectric Function. Sizing through Optical
Extinction Spectroscopy. J. Phys. D: Appl. Phys. 2013, 46, 435301–10.
Page 37 of 39
ACS Paragon Plus Environment
The Journal of Physical Chemistry
123456789101112131415161718192021222324252627282930313233343536373839404142434445464748495051525354555657585960
38
(42) Nath, A.; Khare, A. Size Induced Structural Modifications in Copper Oxide
Nanoparticles Synthesized via Laser Ablation in Liquids. J. Appl. Phys. 2011, 110,
043111.
(43) Medford, J. A.; Johnston<Peck, A. C.; Tracy, J. B. Nanostructural Transformations
During the Reduction of Hollow and Porous Nickel Oxide Nanoparticles. Nanoscale
2013, 5, 155–159.
Page 38 of 39
ACS Paragon Plus Environment
The Journal of Physical Chemistry
123456789101112131415161718192021222324252627282930313233343536373839404142434445464748495051525354555657585960
39
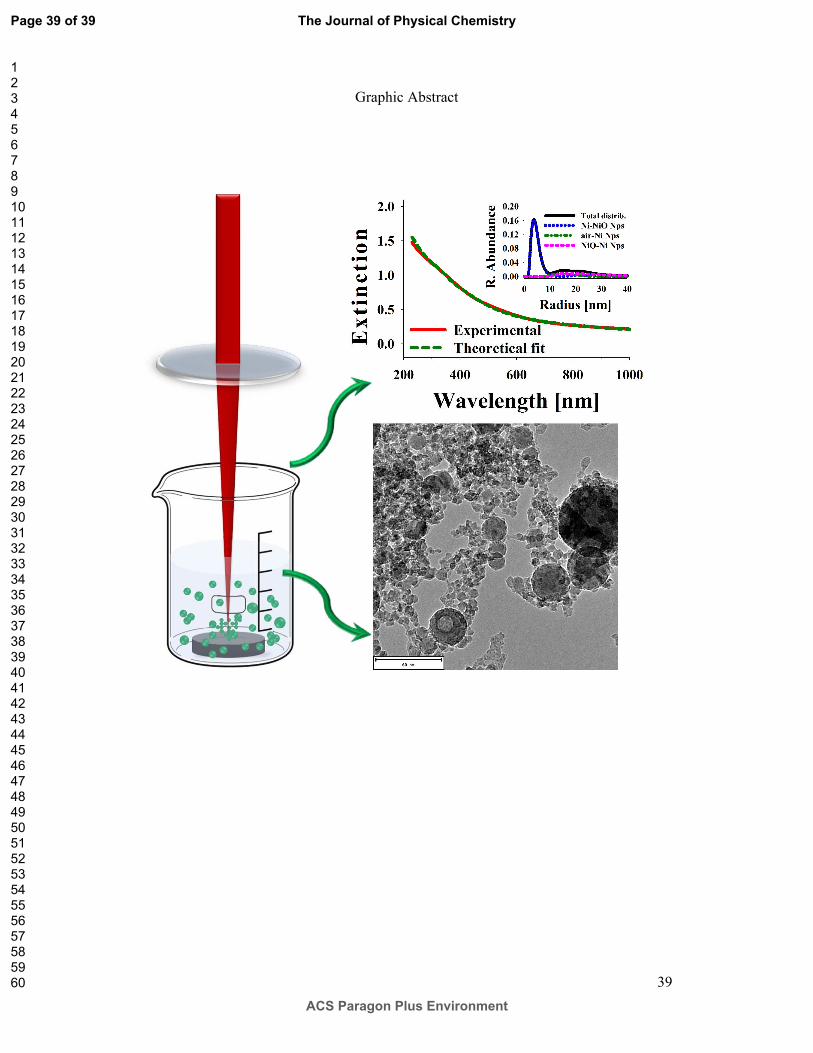
Graphic Abstract
Page 39 of 39
ACS Paragon Plus Environment
The Journal of Physical Chemistry
123456789101112131415161718192021222324252627282930313233343536373839404142434445464748495051525354555657585960