Aberdeen Standard Select Portfolio - Fundsupermart.com€¦ · Interim report to 31 March 2019...
104
Aberdeen Standard Select Portfolio Semi-Annual Report and Financial Statements 1 October 2018 to 31 March 2019
Transcript of Aberdeen Standard Select Portfolio - Fundsupermart.com€¦ · Interim report to 31 March 2019...

Aberdeen Standard Select PortfolioSemi-Annual Report and Financial Statements 1 October 2018 to 31 March 2019
Contents
Review for the half year ended 31 March 2019
Aberdeen Standard Asian Smaller Companies Fund 3Aberdeen Standard China Opportunities Fund 5Aberdeen Standard European Opportunities Fund 6Aberdeen Standard Global Emerging Markets Fund 7Aberdeen Standard Global Opportunities Fund 8Aberdeen Standard Global Technology Fund 9Aberdeen Standard India Opportunities Fund 10Aberdeen Standard Indonesia Equity Fund 12Aberdeen Standard Japan Equity Fund 13Aberdeen Standard Malaysian Equity Fund 15Aberdeen Standard Pacific Equity Fund 16Aberdeen Standard Singapore Equity Fund 18Aberdeen Standard Thailand Equity Fund 19
Report to Unitholders for the half year ended 31 March 2019
Aberdeen Standard Asian Smaller Companies Fund 21Aberdeen Standard China Opportunities Fund 25Aberdeen Standard European Opportunities Fund 29Aberdeen Standard Global Emerging Markets Fund 33Aberdeen Standard Global Opportunities Fund 37Aberdeen Standard Global Technology Fund 41Aberdeen Standard India Opportunities Fund 44Aberdeen Standard Indonesia Equity Fund 47Aberdeen Standard Japan Equity Fund 50Aberdeen Standard Malaysian Equity Fund 53Aberdeen Standard Pacific Equity Fund 56Aberdeen Standard Singapore Equity Fund 59Aberdeen Standard Thailand Equity Fund 62
Financial Statements for the half year ended 31 March 2019 (unaudited)
Statements of Total Return for the period ended 31 March 2019 66Statements of Financial Position as at 31 March 2019 71Statements of Movements of Unitholders’ Funds for the period ended 31 March 2019 74Statements of Portfolio as at 31 March 2019 79
3Source: Aberdeen Standard Investments (Asia) Limited The performance returns are sourced from Lipper, based on percentage growth, calculated on a NAV-to-NAV basis with gross income reinvested.
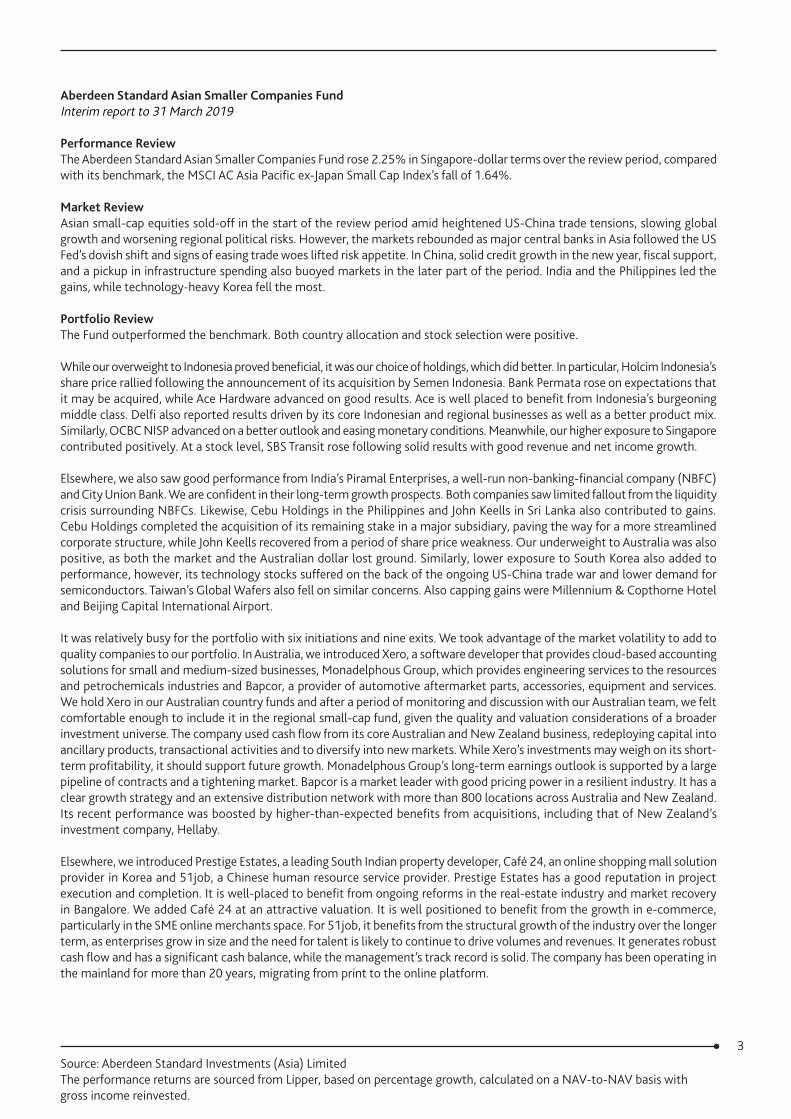
Aberdeen Standard Asian Smaller Companies FundInterim report to 31 March 2019
Performance ReviewThe Aberdeen Standard Asian Smaller Companies Fund rose 2.25% in Singapore-dollar terms over the review period, compared with its benchmark, the MSCI AC Asia Pacific ex-Japan Small Cap Index’s fall of 1.64%.
Market ReviewAsian small-cap equities sold-off in the start of the review period amid heightened US-China trade tensions, slowing global growth and worsening regional political risks. However, the markets rebounded as major central banks in Asia followed the US Fed’s dovish shift and signs of easing trade woes lifted risk appetite. In China, solid credit growth in the new year, fiscal support, and a pickup in infrastructure spending also buoyed markets in the later part of the period. India and the Philippines led the gains, while technology-heavy Korea fell the most.
Portfolio ReviewThe Fund outperformed the benchmark. Both country allocation and stock selection were positive.
While our overweight to Indonesia proved beneficial, it was our choice of holdings, which did better. In particular, Holcim Indonesia’s share price rallied following the announcement of its acquisition by Semen Indonesia. Bank Permata rose on expectations that it may be acquired, while Ace Hardware advanced on good results. Ace is well placed to benefit from Indonesia’s burgeoning middle class. Delfi also reported results driven by its core Indonesian and regional businesses as well as a better product mix. Similarly, OCBC NISP advanced on a better outlook and easing monetary conditions. Meanwhile, our higher exposure to Singapore contributed positively. At a stock level, SBS Transit rose following solid results with good revenue and net income growth.
Elsewhere, we also saw good performance from India’s Piramal Enterprises, a well-run non-banking-financial company (NBFC) and City Union Bank. We are confident in their long-term growth prospects. Both companies saw limited fallout from the liquidity crisis surrounding NBFCs. Likewise, Cebu Holdings in the Philippines and John Keells in Sri Lanka also contributed to gains. Cebu Holdings completed the acquisition of its remaining stake in a major subsidiary, paving the way for a more streamlined corporate structure, while John Keells recovered from a period of share price weakness. Our underweight to Australia was also positive, as both the market and the Australian dollar lost ground. Similarly, lower exposure to South Korea also added to performance, however, its technology stocks suffered on the back of the ongoing US-China trade war and lower demand for semiconductors. Taiwan’s Global Wafers also fell on similar concerns. Also capping gains were Millennium & Copthorne Hotel and Beijing Capital International Airport.
It was relatively busy for the portfolio with six initiations and nine exits. We took advantage of the market volatility to add to quality companies to our portfolio. In Australia, we introduced Xero, a software developer that provides cloud-based accounting solutions for small and medium-sized businesses, Monadelphous Group, which provides engineering services to the resources and petrochemicals industries and Bapcor, a provider of automotive aftermarket parts, accessories, equipment and services. We hold Xero in our Australian country funds and after a period of monitoring and discussion with our Australian team, we felt comfortable enough to include it in the regional small-cap fund, given the quality and valuation considerations of a broader investment universe. The company used cash flow from its core Australian and New Zealand business, redeploying capital into ancillary products, transactional activities and to diversify into new markets. While Xero’s investments may weigh on its short-term profitability, it should support future growth. Monadelphous Group’s long-term earnings outlook is supported by a large pipeline of contracts and a tightening market. Bapcor is a market leader with good pricing power in a resilient industry. It has a clear growth strategy and an extensive distribution network with more than 800 locations across Australia and New Zealand. Its recent performance was boosted by higher-than-expected benefits from acquisitions, including that of New Zealand’s investment company, Hellaby.
Elsewhere, we introduced Prestige Estates, a leading South Indian property developer, Café 24, an online shopping mall solution provider in Korea and 51job, a Chinese human resource service provider. Prestige Estates has a good reputation in project execution and completion. It is well-placed to benefit from ongoing reforms in the real-estate industry and market recovery in Bangalore. We added Café 24 at an attractive valuation. It is well positioned to benefit from the growth in e-commerce, particularly in the SME online merchants space. For 51job, it benefits from the structural growth of the industry over the longer term, as enterprises grow in size and the need for talent is likely to continue to drive volumes and revenues. It generates robust cash flow and has a significant cash balance, while the management’s track record is solid. The company has been operating in the mainland for more than 20 years, migrating from print to the online platform.

4Source: Aberdeen Standard Investments (Asia) Limited The performance returns are sourced from Lipper, based on percentage growth, calculated on a NAV-to-NAV basis with gross income reinvested.
Aberdeen Standard Asian Smaller Companies FundInterim report to 31 March 2019
Portfolio Review (continued)Against these, we exited Malaysian developers SP Setia and YHN Property, as their recent results reflected weakening prospects amid a challenging operating environment. We also sold Beijing Capital International Airport on concerns over the impact of the new Daxing airport on passenger volumes and airport fees; we also exited Dah Sing Financial and Public Financial given their deteriorating prospects. In addition, we exited ComfortDelgro following a good run in its share price. While ComfortDelgro’s bus business contributed to revenues after the introduction of the contracting model, we found it hard to envisage a structural turnaround in its core taxi business given the increased competition from Grab and Go-Jek. We also sold LPI Capital, Siam City Cement, Q Technology, Towngas China to fund more compelling opportunities elsewhere. Likewise, we tied up a small position in Hanssem on disappointing results.
5Source: Aberdeen Standard Investments (Asia) Limited The performance returns are sourced from Lipper, based on percentage growth, calculated on a NAV-to-NAV basis with gross income reinvested.
Aberdeen Standard China Opportunities FundInterim report to 31 March 2019
Performance ReviewThe Aberdeen Standard China Opportunities Fund rose 6.23% in Singapore-dollar terms over the review period, compared to the benchmark MSCI Zhong Hua Index’s total return of 5.40%.
Market ReviewChinese and Hong Kong stocks ended higher after a challenging half-year. Through late-2018, worries over the worsening US-China trade spat, rising US interest rates and China’s slowdown triggered broad-based selloffs. However, markets rebounded in the new year. Major central banks’ dovish shift amid increasing signals of faltering global growth, along with growing hopes of a trade deal, boosted sentiment. Index-provider MSCI’s move to raise the weighting of A shares in its indices provided another fillip. Meanwhile, China’s full-year economic growth slowed to a 28-year low in 2018. In response, Beijing reaffirmed its pro-growth pledge, and expectations for further stimulus lifted mainland real estate and consumer stocks. Hong Kong property names also rose, benefiting from easing financial conditions and improving sentiment. Elsewhere, previously-battered technology stocks recovered on the back of easing trade tensions. However, domestic policy changes hampered the healthcare sector.
Portfolio ReviewThe Fund outperformed the benchmark, thanks to positive contributions from our financial and technology holdings. In the financial sector, our lower exposure to banks was positive as concerns about earnings and asset quality weighed on the segment. Smaller banks were also more resilient than their larger peers on expectations for pressures on credit costs to ease. Hence, our position in China Merchants Bank was helpful, with the lender also delivering solid full-year results.
Stock selection in the technology and internet sectors also boosted the Fund. Hangzhou Hikvision was among the top-performing holdings over the period. Fears of potential US sanctions buffeted the surveillance-product maker’s shares in 2018. However, we retained a positive view of the company, noting that the bulk of its earnings were still generated domestically. Our conviction paid off as the stock bounced back sharply from January. In the internet sector, not holding Baidu proved beneficial. The search-engine company retreated on tougher competition for its core advertising business.
Performance from the consumer sector was mixed. Not holding Alibaba, which was recently re-classified as a consumer discretionary stock, hurt as good results boosted its shares. We still harbour concerns about the quality of corporate governance, including its partnership structure and past treatment of minority shareholders. Auto-linked names Nexteer and Fuyao Glass also dented performance due to continued weakness in the sector. However, our exposure to staples was positive. High-end distiller Kweichow Moutai recovered from an October sell-off as investors grew more upbeat about its earnings outlook.
Overall, we are still optimistic about China’s consumer sector over the longer term. We believe that structural growth of domestic demand will be driven by an expanding middle class and its increasing wealth. Therefore, we introduced two more consumer holdings over the period. Health & Happiness is a provider of adult nutrition, paediatric nutritional and baby care products. The company’s execution has been solid, and we are upbeat on its positioning in the under-penetrated adult nutrition market. We also initiated soy sauce maker Foshan Haitian Food and Flavouring. It has built a popular brand and successfully expanded into making other condiments, and is backed by steady financials.
Our underweight to the real estate sector was costly, given the Fund’s lack of exposure to several mainland and Hong Kong-based developers. But losses were mitigated by China Resources Land, which rallied as income from investment properties underpinned steady earnings growth. Also detracting from returns was the healthcare sector, which declined on fears that the new centralised drug procurement policy would squeeze drugmakers’ margins. Our holding, CSPC Pharmaceutical, tracked the sector’s weakness. However, we feel that the competitive landscape for its core drugs appears more favourable compared to its peers.
In other key portfolio activity, we established a position in online job portal 51job. The company has operated in China for over 20 years, and offers human resource outsourcing and online recruitment services. We think it should benefit from the growth of the industry over the long term. As businesses grow, demand for talent is likely to drive its volumes and revenues. The company also generates robust cash flow and management has a solid track record.
Against this, we sold out of Greka Drilling on concerns of its deteriorating prospects. We also exited lender Standard Chartered, e-books business China Literature and conglomerates Jardine Strategic and Swire Pacific. We felt there were more attractive investment opportunities elsewhere.
6Source: Aberdeen Standard Investments (Asia) Limited The performance returns are sourced from Lipper, based on percentage growth, calculated on a NAV-to-NAV basis with gross income reinvested.
Aberdeen Standard European Opportunities FundInterim report to 31 March 2019
Performance ReviewThe Aberdeen Standard European Opportunities Fund fell by 4.87% in Singapore-dollar terms over the review period, compared with a decrease in the benchmark, the FTSE World – Europe Index, of 4.01%.
Market ReviewEuropean equities ended lower in Singapore dollar terms at the end of the half year under review, despite recovering from a brutal fourth quarter in 2018. The period began with a global sell off in October that took a toll on the stock market all the way past Christmas. The backdrop of sustained trade tensions between China and the US, and the US Federal Reserve’s pace of rate hikes, culminating in a total of four rate increases by the end of the year, hampered stocks. The first quarter of 2019, however, offered welcome relief for the market, which managed to recover most of its losses following the Fed’s move to a more dovish policy stance and signs that progress was being made in Sino-US trade talks.
Rome and Brussels ended a two-month standoff over Italy’s 2019 budget after agreeing to a narrower deficit. However, the discord dragged the market lower and took a toll on Italy’s economy, which fell into recession, compounded by the slowdown of its major trading partners. In France, President Macron was forced to abandon his planned fuel-tax hike after the "yellow-vests" protests disrupted the market. Despite this France managed to post stable GDP growth, whereas its larger counterpart, Germany, just managed to avoid a technical recession. Germany’s export driven economy contracted as its manufacturing sector suffered owing to disruptions in supply chains for producers due to global trade tensions. The domestic consumer market, however, helped to cap losses, while unemployment, as well as inflation remained low. The European Central Bank re-iterated its commitment to easier monetary policy and the provision of low-cost funding to the banking sector amid the disappointing economic data in Europe and concerns over a faltering global economy. In the UK, Brexit continued to dominate politics, with the future of the UK and its continental peers post-Brexit still remaining unclear after Prime Minister Theresa May’s unpopular deal was voted down three times in Parliament. The uncertainty began to make an impact on business confidence; however employment and consumer spending remained resilient.
Portfolio ReviewAgainst this backdrop, the Fund underperformed its benchmark, but benefited from positive stock selection.
Costing the Fund, was healthcare holding EssilorLuxottica, due to weaknesses stemming from a lack of clarity on synergy guidance for this year and leadership disputes around the merger agreement. Life sciences company Abcam also detracted due to share price weaknesses, but we continue to like this company based on its dominant market position and superior technology that has the potential to drive robust growth. Oilfield equipment maker Schoeller-Bleckmann also impacted the Fund due to the oil price decline at the end of last year and ensuing concerns over its more cyclical end markets. Finally, Julius Baer was another key detractor, and we exited the holding on concerns over a weaker trading environment.
Conversely, leading gains were our choice holdings in the consumer goods and industrials sectors. Our long-held position in industrial support services provider Edenred contributed, due to a combination of good operational performance, an acquisition in its nascent corporate payments division, and exposure to Brazil. In consumer goods, our overweight in the beverage sub-sector, through holdings such as Heineken, Campari and Pernod-Ricard added significantly to performance due to continued compound growth in profits. These also have significant runway for future expansion. Finally, outperformance was also driven by our holdings in the information technology sector, with the likes of engineering and industrial software multinational Aveva and architectural software company Nemetschek among the top contributors. Aveva continued its robust performance with the announcement of additional growth and margin improvement opportunities for the group post merger, while Nemetschek had a good recovery after being caught up in the broader technology sell-off late last year despite its excellent operational delivery.
In key portfolio activity, besides Julius Baer, we also exited Bayer and Henkel in favour of more attractive, better quality opportunities elsewhere. Positions in UBS, Fuchs Petrolub and Grandvision were also sold in order to reallocate capital into other companies with more attractive return potential.
As a result, we used the proceeds to introduce spirits company Pernod-Ricard, given its reasonable valuation amid improving quality and its portfolio of well-established brands. Other introductions were Ubisoft, which offers strong growth prospects from its exciting franchise of games and proven development capability, as well as RELX, a high quality data and analytics business with solid market positions and customer relationships and a strong recurring revenue profile.
7Source: Aberdeen Standard Investments (Asia) Limited The performance returns are sourced from Lipper, based on percentage growth, calculated on a NAV-to-NAV basis with gross income reinvested.
Aberdeen Standard Global Emerging Markets FundInterim report to 31 March 2019
Performance ReviewThe Aberdeen Standard Global Emerging Markets Fund returned 4.34% in Singapore-dollar terms over the six months under review, ahead of the benchmark MSCI Emerging Markets Index’s rise of 0.94%.
Market ReviewEmerging markets posted gains in the six months under review to outperform their developed counterparts. This was despite sharp losses in October amid persistent US dollar strength, rising energy prices and escalating US-China trade tensions. Heightened political risks, such as elections in Brazil and Mexico, the UK’s Brexit misstep and Italy’s budget stand-off, also unnerved investors. Nevertheless, optimism about headway in trade talks and a dovish shift in major central banks’ policy stance, prompted by signs of a global economic slowdown, provided a boost.
Brazilian stocks rallied in anticipation of President Jair Bolsonaro’s election win and his pledge for pension reform. India recouped early losses after oil prices pulled back from their peak in October. Sentiment also improved, following easing tensions with neighbour Pakistan, fuelling expectations that the Bharatiya Janata Party could retain its power to ensure policy continuity. In China, fiscal stimulus to boost the domestic economy appeared to gain traction, with latest leading indicators pointing to a recovery in the manufacturing sector.
In contrast, Mexico was lifted by the conclusion of the revamped North American trade pact but subsequently lost steam, due to concerns over President Lopez Obrador’s controversial policies. Home to several chipmakers, Korea and Taiwan remained subdued on the back of waning demand and trade-related supply chain disruption.
In politics, the outcome of Thailand’s first general elections in almost five years was indeterminate, with neither the Pheu Thai nor Palang Pracharath securing a simple lower-house majority. Turkey’s ruling party AKP lost ground in major cities, due to voters’ discontent over the government’s economic policies.
Portfolio ReviewThe Fund’s outperformance was primarily driven by good stock selection in China. Underlying holdings of the Aberdeen Standard SICAV I – China-A Share Equity Fund rebounded on hopes of resolution to the US-China trade talks. Other holdings also fared well. China Resources Land rose on robust results and earnings upgrades, as well as expectations that Beijing’s stimulus would boost the property sector. Yum China’s results were lifted by better performance from its KFC franchise, and we were pleased by the growing penetration of digital payments. Meanwhile, the lack of exposure to Baidu proved beneficial, as most software and internet firms de-rated amid fears of a domestic slowdown.
Elsewhere, the large exposure to Brazil added to relative returns, but our choice of holdings detracted. Vale’s shares plunged after the tailings dam at its Feijao iron ore mine collapsed and caused significant output disruption. We have been engaging with the miner extensively on its risk-management framework and were encouraged by its responsiveness, which included a commitment to accelerate the decommissioning of over ten upstream dams. The underweight to Petrobras cost performance, as the stock rose on elevated oil prices and optimism about the government’s reform. Capping losses were Lojas Renner and Multiplan.
At the sectoral level, our choice of holdings among financials outperformed. Banco Bradesco posted upbeat results and earnings forecast. In India, Housing Development Finance Corp and Kotak Mahindra Bank remained resilient, despite a liquidity crunch after the default of Infrastructure Leasing & Financial Services.
Conversely, the overweight to Mexico detracted, as it was one of the worst-performing markets in the review period. Airport operator Asur retreated, following President Lopez Obrador’s decision to cancel the ongoing construction of the much-needed new Mexico city airport. Meanwhile, lender Banorte was hampered by his proposal to reduce banking fees.
In key activity, we initiated Tenaris, which will be a beneficiary of the recovering capex cycle for the oil industry with significant operating leverage. We introduced Petrobras on improving confidence in its deleveraging process, higher forecast for operating-expense optimisation and a two-fold increase in its return-on-capital-employed target.
Against this, we exited Standard Chartered, as its outlook remains difficult, characterised by weak credit growth and burdensome regulatory pressures, and its profitability has been increasingly challenged. We divested Magnit on concerns over its strategic outlook and governance, as well as Gedeon Richter, given its lacklustre results and earnings forecast. We sold out of Ultrapar, due to intensifying competitive pressure on fuel retailer Ipiranga, its core business. Finally, we chose not to hold Naspers’s spin-off, Multichoice Group, on a standalone basis, given the challenging commercial environment.
8Source: Aberdeen Standard Investments (Asia) Limited The performance returns are sourced from Lipper, based on percentage growth, calculated on a NAV-to-NAV basis with gross income reinvested.
Aberdeen Standard Global Opportunities FundInterim report to 31 March 2019
Performance ReviewThe Aberdeen Standard Global Opportunities Fund –declined by 2.10% in Singapore-dollar terms over the review period, compared with its benchmark, the MSCI World Index’s total return of -3.20%.
Market ReviewThe period under review was one of two halves. In the first, a spike in US Treasury yields compelled investors to re-assess global stock valuations and pressured share prices. Contracting economies in Japan and Germany, along with China’s slower-than-expected growth, also raised concerns over a global economic slowdown. In the second, stocks climbed steadily as progress in the US-China trade talks, as well as the US Federal Reserve’s pivot towards a dovish policy stance, cheered investors. Upbeat manufacturing data from the US and China in end-March led to a brightening growth outlook, and spurred another rally. Oil prices reached 15- month lows in December on fears of expanding US shale output before rising again, underpinned by Opec-led supply cuts and US sanctions against Iran and Venezuela.
Portfolio ReviewThe non-benchmark exposures to Brazil, China and India contributed to the Fund’s outperformance. In Brazil, lender Banco Bradesco rose in tandem with the broader market that was boosted by optimism around President Jair Bolsonaro’s reform agenda. In China, fast-food chain operator Yum China advanced as its earnings were aided by good performance in its KFC business; we took some profits following its share-price strength. Internet giant Tencent also held up well on better-than-expected results that was driven by healthy growth in its advertising, mobile payments and cloud businesses. In India, mortgage provider Housing Development Finance Corporation climbed after the default of a non-banking financial company spurred investors to seek out quality names. Stock selection in Switzerland also benefited performance, with drugmakers Novartis and Roche rising on healthy earnings.
On the flipside, the Fund’s stock picks in Germany hampered returns. Fresenius Medical Care declined after it lowered its earnings target for the year. The firm recorded slower-than-expected growth in dialysis services in its largest market of North America, partly due to a delay in new clinics being opened. Following the recent string of profit warnings that hurt the management’s credibility, we divested the stock. Meanwhile, its peer, consumer goods firm Henkel, fell following disappointing annual earnings and management’s warning that profitability could suffer in 2019. Elsewhere, US oilfield services provider Schlumberger and oil producer EOG Resources slipped in tandem with the weaker oil price. We took advantage of attractive valuations to add to Schlumberger.
In other portfolio activity, we introduced the following companies: British speciality chemicals company Croda, a high-quality business well-positioned to benefit from increasing demand for natural ingredients; global beauty products company Estee Lauder which has a well-diversified brand portfolio and attractive long-term growth opportunities; First Republic Bank, a domestically-focused US lender with a healthy capital position and attractive growth prospects; Australia’s CSL Behring, which manufactures human plasma products and possesses a competitive advantage in its plasma collection network; PRA Health Sciences, a US contract research organisation that will benefit from the global pharmaceutical trend of outsourced testing and research; Australia-based winemaker Treasury Wine Estates which is well-positioned to grow internationally and expand its premium range; tech firm Microsoft which should continue to benefit from the structural shift to cloud-based services; and luxury firm LVMH, which has a diverse portfolio of brands that lends it resilience and a good execution track record.
Against these, we divested Australian mining giant BHP Billiton, Swedish industrial equipment maker Epiroc, Hong Kong-listed Swire Pacific, Japanese construction and real estate firm Daito Trust Construction as well as tobacco firm Philip Morris and tech firms Cognizant and Oracle in the US, in favour of better opportunities elsewhere.
9Source: Aberdeen Standard Investments (Asia) Limited The performance returns are sourced from Lipper, based on percentage growth, calculated on a NAV-to-NAV basis with gross income reinvested.
Aberdeen Standard Global Technology FundInterim report to 31 March 2019
Performance ReviewThe Aberdeen Standard Global Technology Fund fell by 1.12% in Singapore-dollar terms in the half-year under review, outperforming the benchmark MSCI ACWI Information Technology Index’s return of -2.22%.
Market ReviewIt was a challenging half-year for global equities, including technology stocks, which fell in tandem with the broader market. China-US trade tensions and concerns over growth fuelled an inauspicious start as industry bellwethers, including several of our holdings, tempered their earnings outlooks in the face of potentially weaker demand. After double-digit gains over the previous 12 months, investors started questioning the sector’s elevated valuations. The FAANGS – Facebook, Amazon, Apple, Netflix and Google’s owner Alphabet – all suffered sharp share-price declines in November; some US$1 trillion was wiped off their combined market value at one stage. Separately, Facebook sustained one data-privacy scandal after another. December saw share prices beaten down further after the US issued an arrest warrant for the CFO of Chinese telecoms giant Huawei for alleged violation of Iranian sanctions. Meanwhile, the Federal Reserve’s rate hike sparked fears that businesses would be hurt by higher borrowing costs. Sentiment turned more positive in the new calendar year. The sector rebounded and recouped most of the losses. Part of this was due to the Fed’s sudden pivot towards a pause in rate hikes. Investors also cheered perceived progress in trade talks as both the US and China returned to the negotiating table, which benefited growth stocks such as those in the tech sector.
Portfolio ReviewAt the stock level, Wirecard was the biggest detractor. The share price of the Germany-listed internet company fell sharply in February following news reports of alleged fraud. We sold the stock subsequently, given doubts over its internal controls. The non-benchmark holding in Alphabet weighed on relative performance. Its share price sustained steep losses in the first three months amid widespread concerns that tech companies would struggle to grow profits if the trade war dragged on and the Fed sped up the pace of rate hikes. Our exposure to Renesas Electronics also detracted as the Japanese company announced plans to cut nearly 1,000 jobs overseas to compensate for a shrinking domestic market.
On a positive note, Apple’s share price fell on worries over profitability as it struggled to grow iPhone sales, so the Fund gained relative outperformance from being underweight the stock. Nvidia’s share price also took a tumble as revenues and forecasts missed expectations, with the US graphic-card company highlighting weak demand and surplus inventory. Nevertheless, we like Nvidia as it is expected to benefit from the transition to autonomous driving and artificial intelligence. We introduced the stock after it fell sharply, so the Fund profited from avoiding the price correction. Meanwhile, Chinese online car portal Autohome rallied on good results. Despite declining mainland auto sales, its earnings were resilient, thanks largely to its strong platform value and jump in revenues from its online marketplace business. We introduced the company during the reporting period.
Besides the portfolio changes mentioned above, we initiated several holdings over the half year after the market correction brought valuations down to more attractive levels. Electronic Arts is a US video game company that we like for its compelling growth outlook and under-appreciated brands, while its French counterpart Ubisoft has potential for margin improvement. American software firm Adobe is expected to post durable growth and solid recurring revenue over the long term; while cloud-based firm Salesforce has a high-quality franchise. We also introduced New Zealand accounting software provider Xero following a positive meeting with management. Conversely, we sold South Korean internet content service firm Naver, US semiconductor manufacturer Intel, as well as tech firms Cognizant and Oracle.
10Source: Aberdeen Standard Investments (Asia) Limited The performance returns are sourced from Lipper, based on percentage growth, calculated on a NAV-to-NAV basis with gross income reinvested.
Aberdeen Standard India Opportunities FundInterim report to 31 March 2019
Performance ReviewThe Aberdeen Standard India Opportunities Fund rose by 4.12% in Singapore-dollar terms over the half-year ended 31 March 2019. This compares with a total return of the benchmark, the MSCI India Index, of 8.92%.
Market ReviewThe Indian stock market rose during the period under review and was one of the better-performing markets in Asia. It initially fell on concerns over tighter liquidity stemming from the IL&FS debt default, but subsequently recovered after oil prices fell and the Reserve Bank of India (RBI) intervened to ease the liquidity crunch and support the currency. Reduced tension with Pakistan also boosted investor sentiment. The financial sector advanced the most during the six months. In addition to the RBI’s monetary actions, the appointment of its new market-friendly governor fuelled optimism.
The RBI cut rates twice in the first quarter of the year, in line with the US Fed’s dovish stance citing slowing growth and a benign inflationary environment. Investors also cheered the interim budget, which offered tax incentives for the middle class and grants to rural households and the goods and services tax (GST) rate cuts. This should boost consumption and bode well for our consumer holdings and private banks.
Portfolio Review The portfolio underperformed the benchmark, mainly due to our stock selection in financials. While not holding Axis Bank, ICICI Bank and Yes Bank hurt relative performance, our exposure to Piramal Enterprises, Kotak Mahindra Bank and HDFC Bank contributed positively. Piramal Enterprises, a non-banking-finance company (NBFC), was the best performer. We believe that it is one of the better-managed companies. We built our position in the stock when it sold off indiscriminately along with others and has since enjoyed a good recovery. Meanwhile, Kotak Mahindra Bank and HDFC Bank advanced on robust retail lending and deposit franchises. These banks will continue to benefit from the liquidity challenges faced by NBFCs.
Elsewhere, the information technology sector, notably Mphasis, detracted due to the strengthening rupee and wage increases, which dampened margins. The lighter exposure to energy also dragged performance. Not holding Reliance Industries hurt performance, as the group was boosted by improvements in its petrochemical and telecom businesses. We remain unconvinced that its governance standards and capital discipline have improved.
At a stock level, healthcare company Sun Pharmaceuticals fell on the back of governance allegations against its promoters. We exited the stock. In addition, auto holding Hero MotoCorp saw a slowdown in motorcycle sales, though we expect it to benefit from a recovery in rural spending.
More positively, our choice of companies within materials capped losses. Asian Paints advanced on lower input cost, better margins and GST rate cuts for affordable housing, which could boost demand.
In portfolio activities, we initiated a position in Gruh Finance. It is a well-run affordable housing finance company that will benefit from growth opportunities and improving funding franchise after it merges with Bandhan Bank.
We also participated in Bosch’s buyback programme, given the attractive valuation and in Mphasis’ share buyback at a 45% premium to market. Meanwhile, we continued to add to SBI Life, Maruti Suzuki and Bandhan Bank, given the market volatility. All three stocks were recent introductions to the portfolio.
We funded this by exiting Sun Pharmaceutical, dampened by a difficult regulatory environment. We also sold Emami as the brand portfolio and acquisition strategy did not meet our expectations and Bharti Airtel, given the tough operating environment.
During the review period, our fund managers visited India to touch base with the management of several existing and prospective holdings. The key takeaways from the trip included the following: high-quality companies were unaffected by the liquidity crunch following the IL&FS debt default; consumer demand remains solid; and reform measures implemented to tackle corporate insolvency and non-performing assets of banks will be beneficial in the long run.
11Source: Aberdeen Standard Investments (Asia) Limited The performance returns are sourced from Lipper, based on percentage growth, calculated on a NAV-to-NAV basis with gross income reinvested.
Aberdeen Standard India Opportunities FundInterim report to 31 March 2019
Portfolio Review (continued)Our fund managers returned with greater conviction to stay invested in companies that cater to Indian consumers. Consumption is expected to increase supported by higher wage levels. We believe our holdings, such as Hindustan Unilever, stand to benefit. The company is well positioned, with a solid distribution network, targeted region-specific products and an efficient cost base. HDFC Bank is optimistic on loan growth prospects and is better placed than many in the current tougher climate for deposits. The materials sector’s outlook also improved. Infrastructure development and affordable housing, combined with tax and interest-rate cuts, benefited the real estate and materials companies, including Asian Paints and Ultratech Cement.
12Source: Aberdeen Standard Investments (Asia) Limited The performance returns are sourced from Lipper, based on percentage growth, calculated on a NAV-to-NAV basis with gross income reinvested.
Aberdeen Standard Indonesia Equity FundInterim report to 31 March 2019
Performance ReviewThe Aberdeen Standard Indonesia Equity Fund returned 12.80% in Singapore-dollar terms over the review period, compared with a return in the benchmark Jakarta Composite Index of 12.62%.
Market ReviewIndonesian equities rose over the half year under review, despite the high volatility in the market due to global trade tensions, unstable energy prices and the pace of interest rate hikes by the US Federal Reserve, which pressured the Bank of Indonesia (BI) to raise its rates a total of six times in seven months. This took a toll on the country’s foreign reserves, as the central bank was forced to defend the depreciating rupiah against high US Treasury yields and the persistent strength of the US dollar. However, in the latter half of the period, optimism about headway in the Sino-US trade talks and a dovish shift in the Fed’s policy stance supported a rebound in the market. The rupiah corrected after sliding to its lowest since 1998 in October. Lower crude prices towards the end of 2018 presented favourable oil-and-gas foreign exchange revenues for the net-oil importer, reducing the country’s external debt and allowing foreign reserves to recover.
Encouraging local economic data also propelled the market. The economy was forecast to grow at its fastest pace in seven years, bucking the gloom of a global economic slowdown. While external insecurities remained, the stable local political climate and positive sentiment in the run up to the April 17 elections drew in foreign investors. As election incentives, the government’s planned stimulus packages to lower income tax and offer tax breaks for commodities exporters who kept their revenues within the domestic banking system, helped boost consumer and banking stocks. Continued fuel and electricity subsidies, as well as the decision to keep excise tariffs for tobacco products unchanged also helped boost consumer confidence and supported domestic spending. However, the robust domestic consumer sentiment also fuelled higher imports, which coupled with sluggish demand in exports due to concerns over a slowing Chinese economy, caused the country’s trade deficit to persist. Headline inflation remained below the government’s 3.5% year-on-year target, and the labour market was robust. Under these conditions, expectations were that incumbent President Jokowi would succeed in his bid to remain in office.
Portfolio ReviewAgainst this backdrop, the Fund marginally outperformed its benchmark due to positive stock selection.
The biggest contributor was our overweight in the materials sector and our good stock selection there, as non-benchmark holding Holcim Indonesia, renamed Solusi Bangun after its acquisition by state-owned cement producer PT Semen Indonesia, was our top performer. The acquisition and resulting industry consolidation also benefited Indocement, which posted good earnings and added to performance. In industrials, AKR Corporindo, also a non-benchmark holding, contributed as its share price rallied following weaker global oil prices. The lower oil price pressured the energy sector, hence our underweight proved beneficial for the Fund. Not-holding Adaro Energy and our underweight to United Tractors contributed. In banking, non-benchmark holding Bank Permata contributed as its shares performed well on the back of M&A-related speculation, robust nine-month results and an increase in net profits, attributed to good loan growth and lower provisions.
That said, our underweight to the financial sector hampered performance as banking stocks rallied from the easing credit environment and higher loan growth. Not holding Bank Negara detracted, as did the underweight to both Bank Rakyat and Bank Central Asia. Also capping gains was our choice of holdings in consumer staples. Palm-oil producer MP Evans, cosmetics manufacturer Mandom, food and beverage producer Ultrajaya Milk and footwear manufacturer Sepatu Bata detracted amid sluggish export demand that negatively affected local manufacturing output.
13Source: Aberdeen Standard Investments (Asia) Limited The performance returns are sourced from Lipper, based on percentage growth, calculated on a NAV-to-NAV basis with gross income reinvested.
Aberdeen Standard Japan Equity FundInterim report to 31 March 2019
Performance ReviewThe Aberdeen Standard Japan Equity Fund fell by 12.54% in Singapore-dollar terms, compared with the benchmark, MSCI Japan Index’s fall of 9.12%.
Market ReviewThe Japanese market fell in the six months under review marked by two distinct halves. At first, the stock market retreated along with the decline across most global markets. Fears of a slowing global economy, trade worries and tighter monetary conditions dampened sentiment. Increased foreign selling and a stronger yen added more pressure. This was despite the benchmark reaching a 27-year high early in the period although the cautious tone was obvious. Officials revised the third-quarter GDP figure lower because of a string of natural disasters. In the latter half, the market snapped back from the sell-off at the end of 2018. Initially, the rebound was boosted by the US Federal Reserve’s more dovish outlook, rosy US data, and perceived progress in US-China trade talks. These outweighed worries about a slowdown in China as well as concerns over slowing global growth.
On the data front, fourth-quarter GDP exceeded forecasts as capital investments bounced back from a string of natural disasters last year. However, the outlook remained clouded given tepid data on exports and factory output. Core machinery orders, a leading signal of capital spending, fell in January as US-China tariffs hit global trade. Confidence among large manufacturers dipped to its lowest in two years as reflected in the March Tankan survey. The Bank of Japan held its policy rate steady as inflation edged higher but remained below forecasts.
Portfolio ReviewAt the stock level, detracting from performance was online fashion retailer Zozo, as its shares weakened on the back of an uncertain outlook and concerns over slower profit growth. We divested the holding in favour of more attractive opportunities elsewhere. Also costing the Fund was Pigeon, which retreated amid concerns over a Chinese economic slowdown, coupled with lacklustre fourth-quarter results. We believe the earnings weakness was due to one-off issues and we expect baby products to remain resilient in the face of consumer down-trading, leaving the company well positioned for any deterioration in mainland consumer sentiment.
Among our holdings that mitigated the loss was Chugai Pharmaceutical, whose shares were lifted by solid export sales of its rheumatoid arthritis drug Actemra, and upbeat expectations for its haemophilia treatment Hemlibra. Also benefiting the Fund was Keyence, which posted robust profit growth, as its direct-sales network and automation solutions that offer immediate, tangible savings to clients, positioned it well in a worsening economic climate.
In portfolio activity, apart from exiting Zozo mentioned earlier, we also sold commercial kitchen equipment manufacturer Hoshizaki Electric amid uncertainty surrounding its listing status after regulators rejected a deadline extension to file its accounts. Against this, we introduced Tokio Marine Holdings that was trading at an attractive valuation. It is the most progressive of the three largest local property and casualty insurers. The trio’s dominance allows each to produce stable cashflow. Tokio Marine uses its cash pile to fuel its overseas forays in niche segments. Almost half of its profits are derived abroad, while its overseas operations allow it to spread its risks. Of note is its positive view on shareholder returns, which we expect will grow gradually as it makes further inroads abroad that add value to its business. We also initiated a position in leading drugstore operator Welcia Holdings, a subsidiary of retail group Aeon. Welcia continually posts above-industry growth rates for both customer spending and traffic through its tailored stores, the intelligent use of promotions and a dedicated focus on in-store pharmacies, a structural trend stemming from Japan’s ageing society. The company also has a solid track record in M&As and subsequently, in improving the profitability of acquired stores. With the drugstore segment still comparatively more fragmented than other retail formats domestically, more dominant players, such as Welcia, are able to target opportunistic acquisitions. This, we believe, should continue to complement its organic growth.
14Source: Aberdeen Standard Investments (Asia) Limited The performance returns are sourced from Lipper, based on percentage growth, calculated on a NAV-to-NAV basis with gross income reinvested.
Aberdeen Standard Malaysian Equity FundInterim report to 31 March 2019
Performance ReviewThe Aberdeen Standard Malaysian Equity Fund fell by 3.80% in Singapore-dollar terms over the period under review, compared with the benchmark FTSE Bursa Malaysia KLCI index’s 5.96% decline.
Market ReviewIt was a difficult half-year for Malaysian equities, which ended lower and lagged their Asian peers. Tepid corporate earnings and uncertainty over the new government policies dampened sentiment. A gloomier economic outlook further compounded matters. Macro readings continued to soften, while the central bank downgraded its growth forecasts for 2019. Bank Negara also left its policy rate unchanged and pledged to keep policy accommodative. Given the downbeat mood, selling pressure persisted and foreign fund outflows increased. As a result, the market remained in the doldrums even as easing US-China trade tensions and major central banks’ dovish shift fuelled a broad-based rally.
Portfolio ReviewThe Fund ended lower, but proved more resilient than the benchmark. Our choice of holdings in the consumer sector was a key driver of performance. In particular, brewers Carlsberg Malaysia and Heineken Malaysia did well. Both continued to reap benefits from a temporary tax holiday in 2018, alongside effective brand marketing and reports of alcohol poisoning from contraband products. They also gained on the back of solid earnings growth. Not holding casino operator Genting was another positive as its shares tumbled following the government’s hike on casino duties.
The exposure to financials boosted Fund returns. Notably, the ongoing opening of the insurance segment and the under-penetrated nature of the life-insurance market bode well for Allianz Malaysia. A solid agency channel and attractive employee-benefit offerings further support its prospects. Its shares were also buoyed by its declaration of a higher dividend, which we believe can be sustained. Meanwhile, Axis Reit rose after posting good results. Full-year profits rose on higher revenues, driven by lease commencements and contributions from several new assets. Its distribution per unit for 2018 was also close to its 2013 peak.
Among the key detractors was online government-services provider My EG Services. The stock was volatile, initially declining on news that the government was reviewing its core foreign-worker permit renewal business, before subsequently recovering. Condom-maker Karex also weighed on performance amid sagging earnings and a more challenging operating environment. Our non-benchmark exposure to the technology sector, via Inari Amertron, also proved costly. The chipmaker’s shares pulled back after key client Apple lowered its first-quarter revenue forecasts.
It was a busy period for portfolio activity. Following a review of the portfolio, we exited several holdings where our conviction had weakened, owing to fundamental changes at either the company or industry level. For instance, we sold Lafarge Malaysia, given the challenging market dynamics for cement with no near-term catalysts for improvement. We also divested Petronas Chemicals as we foresaw a fall in petrochemical prices that would hurt its earnings. Other names that we exited included beverage company Fraser & Neave, plantations group United Malacca and developer YNH Property, given their challenging outlooks.
We also adjusted our energy and financial exposures. Among our energy holdings, we exited our position in Bumi Armada on fears about its financial position as poor execution led to disappointing performance. In its place, we initiated drilling and oilfield services provider Velesto Energy. We believe the rig-building cycle is at the early stage of a recovery, and the company is well-positioned to gain given expectations for drilling activity to improve in 2019. This, coupled with rising utilisation rates, will drive its earnings higher. Its balance sheet appears healthier following its restructuring, while it generates comfortable cash flow to service existing liabilities.
In the financial sector, we sold Hong Leong Bank (HLB) in favour of focusing our exposure in its parent, Hong Leong Financial Group (HLFG). While HLB contributes the lion’s share of its parents’ earnings, we felt higher contributions from its insurance business could be a key long-term growth driver for HLFG.
Over the half-year, we initiated positions in four new holdings. Astro Malaysia is the dominant satellite pay-TV provider in Malaysia. We think its recent subscriber decline could be stabilising, while its capabilities in producing and distributing quality local content are underappreciated. Additionally, it generates robust cashflows, which support its decent dividend yield. ATA IMS is an electronic manufacturing services (EMS) company with a proven track record of quality and consistency. It is well-positioned to grow alongside major client Dyson, while vertical integration of its production processes will drive margin expansion.
15Source: Aberdeen Standard Investments (Asia) Limited The performance returns are sourced from Lipper, based on percentage growth, calculated on a NAV-to-NAV basis with gross income reinvested.
Aberdeen Standard Malaysian Equity FundInterim report to 31 March 2019
Portfolio Review (continued)Another addition was Kelington, which designs and installs ultra-high purity gas and chemicals delivery systems. We think its venture into the industrial gas segment could potentially boost earnings and cash flow. Last, we introduced Westports, which operates the strategically-located Port Klang shipping hub. Most of its earnings are generated from gateway throughput, which makes its cash flows and profitability highly resilient.
16Source: Aberdeen Standard Investments (Asia) Limited The performance returns are sourced from Lipper, based on percentage growth, calculated on a NAV-to-NAV basis with gross income reinvested.
Aberdeen Standard Pacific Equity FundInterim report to 31 March 2019
Performance ReviewThe Aberdeen Standard Pacific Equity Fund rose by 2.77% in Singapore-dollar terms over the review period. This compares with a total return of its benchmark, the MSCI AC Asia Pacific ex-Japan Index, which returned 0.76%.
Market ReviewAsian equities ended the period higher, as a rally in 2019’s first quarter erased losses suffered in the sell-off of the preceding three months. Through late 2018, a confluence of macro risks proved a toxic brew for regional markets. These included worries over rising US interest rates and shrinking global liquidity, along with worsening US-China trade tensions. However, sentiment rebounded from January. Amid increasing signals of slowing global growth, major central banks shifted to a more dovish stance. The Federal Reserve held its benchmark rate steady and abandoned plans for further rate hikes. Investors were also upbeat about prospects for a US-China trade deal as talks appeared to progress. This, coupled with expectations of further stimulus from Beijing, lifted previously-battered Chinese and technology stocks. Meanwhile, Indonesia, the Philippines and India benefited from moderating oil prices and more stable currencies.
Portfolio ReviewThe Fund outperformed the benchmark, with stock selection in China contributing the most to relative performance. Our strategy of investing in high-quality businesses that have a firm foothold in their respective industries continued to bear fruit. Developer and mall-operator China Resources Land rose as income from its investment properties underpinned steady earnings growth. Fast-food chain operator Yum China rallied on good results that showed better-than-expected performance from its KFC franchise. While we remain underweight China, we have gradually increased our exposure as we gained greater comfort around mainland corporates’ improving quality and capital allocation. We are also upbeat about the market’s long-term potential, given rising wealth and a huge domestic market.
Sector wise, our exposure to the financials proved rewarding, with the rising rate environment in 2018 benefiting banks. Indonesian lender Bank Central Asia was a standout, thanks to its robust deposit franchise and lower cost of funds. It also delivered higher net-interest margins and double-digit loan growth, alongside healthy asset quality. India’s HDFC Bank was also resilient. Investors favoured higher-quality lenders amid a cash crunch within the non-bank financial sector, reaffirming our investment case for HDFC.
Elsewhere, our choice of holdings in Australia was positive. Rio Tinto and BHP rallied as iron ore prices remained elevated due to supply disruptions following a dam disaster in Brazil. Improving shareholder returns, following efforts to reduce debt and slash non-core assets, also buoyed both miners’ shares.
We remain comfortable with our light exposure to Australia, preferring to hold other regional companies that offer better growth opportunities. That said, over the period we took advantage of market volatility to introduce two holdings that we believe have compelling long-term prospects. Woodside Petroleum is a liquefied natural gas (LNG) producer that has an attractive growth profile with key projects in its pipeline. While we have a longstanding underweight to the energy sector, we are optimistic about the outlook for LNG given rising demand for cleaner fuel sources. Woodside has also sensibly reduced exploration spending amid rising capital expenditure. We also initiated Cochlear, the leading maker of hearing implants globally. It possesses significant intellectual property, has a well-established distribution network and an embedded relationship with surgeons. Although near-term competitive pressures have pressured the company’s shares recently, we believe management’s investments in technology and product innovation gives it a sustainable long-term edge.
On the flip side, our heavier exposures to Singapore and Thailand detracted as they lagged the wider region. Notably, the position in the Aberdeen Standard Thailand Equity Fund was costly as external worries were compounded by growing concern over political gridlock following an inconclusive election. Elsewhere, our weakness in India was driven by a poor choice of holdings. Conglomerate Grasim Industries was a notable laggard despite positive results and forecasts. It pulled back on worries that fundraising plans from its telco affiliate may strain its balance sheet. However, management indicated that the outlook for its cement business is improving on expectations for higher prices, while valuations remain attractive.
Meanwhile, the lack of exposure to Alibaba, which was recently reclassified as a retail stock, hurt the Fund. The internet giant rebounded after posting solid growth in gross merchandise value and revenues, coupled with higher margins. However, we still harbour concerns about the quality of corporate governance, including its partnership structure and past treatment of minority shareholders. Another detractor was Beijing Capital International Airport, which was weak on concerns about the impact of a new airport on passenger volumes and fees.
17Source: Aberdeen Standard Investments (Asia) Limited The performance returns are sourced from Lipper, based on percentage growth, calculated on a NAV-to-NAV basis with gross income reinvested.
Aberdeen Standard Pacific Equity FundInterim report to 31 March 2019
Portfolio Review (continued)Over the period, we also established a direct position in well-managed Indonesian conglomerate Astra International. It is the industry-leader in the two and four-wheeler markets, and also has interests in auto financing, mining services, plantations and infrastructure. While its core auto business grapples with near-term competitive pressures, inventory levels are adjusting, and it has a new model in the pipeline. Its valuations are also attractive with high single-digit earnings growth.
Against this, we exited Korean cosmetics group AmorePacific. Our investment thesis that it would benefit from the consumption potential of the mainland’s growing middle classes, failed to play out. Revenues and margins remained soft, despite better tourism numbers and improving sales from travel-retail channels. Its business in China also appeared to be stalling, reflecting its limited exposure to the better-performing luxury segment. We still see significant execution risks, and felt that things could get worse, given its eroding competitive advantage in Korea and intensifying competition in China.
18Source: Aberdeen Standard Investments (Asia) Limited The performance returns are sourced from Lipper, based on percentage growth, calculated on a NAV-to-NAV basis with gross income reinvested.
Aberdeen Standard Singapore Equity FundInterim report to 31 March 2019
Performance ReviewThe Aberdeen Standard Singapore Equity Fund decreased by 0.92% in Singapore-dollar terms in the six months under review, underperforming the benchmark FTSE Straits Times Index which slipped by 0.67%.
Market ReviewIt was a period of two halves for Singapore equities. In the first, shares fell amid a litany of fears ranging from rising interest rates, faltering economic growth and simmering trade tensions. They then staged a recovery in the second half, supported by warming US-China trade relations and the US Federal Reserve’s dovish policy stance. Consumer goods stocks rallied the most while utilities were the biggest losers.
At home, the Monetary Authority of Singapore tightened its policy stance for the second time in 2018, as expected. The economy moderated over the two quarters, as the manufacturing sector contracted. The Budget unveiled in the latter quarter was focused on policies to drive medium-term economic restructuring. However, this does not affect our approach, as we continue to build the portfolio with a bottom-up process than a thematic one.
Portfolio ReviewAt the stock level, Keppel Corp detracted from performance. The conglomerate declined on disappointing third-quarter results due to lower contributions from its property and investment divisions, despite a better performance in the offshore and marine segment. Investors have also tapered expectations for contract wins, which were low in 2018. We are more optimistic about order momentum, as we think offshore drilling could be at the start of a recovery and orders have been increasing for vessels related to offshore production. Meanwhile, recruitment firm HRnetgroup succumbed to profit-taking following a rally in the preceding months. Not holding Thai Beverage, Hongkong Land, Ascendas Reit, Yangzijiang Shipbuilding, Capitaland Mall and Capitaland Commercial also hurt the Fund, as they rose for company-specific reasons.
Conversely, our exposure to test-handling machine supplier AEM Holdings proved beneficial as it rose on the back of better-than-expected order momentum from a key client. The firm’s test solution was also selected by telecom company Huawei for use in qualifying cables in its 5G network. We took some profits following share-price strength. Public transport operator SBS Transit and its parent ComfortDelgro were among the top contributors as well. The latter rose on market speculation that the revenue model for its Downtown Line could be changed to the more favourable one currently enjoyed by the North-East Line. Nevertheless, even without that, we believe the business is fundamentally on the right track and could break-even in the next one to two years. We added to SBS Transit which is seeing improved cashflow generation and was trading on an attractive valuation. Our underweight to UOB also boosted returns; the lender’s shares slid on weaker net interest margins.
In other portfolio activity, we initiated Sembcorp Marine (SMM) after a period of share-price weakness, as fundamentals indicate that the offshore and marine sector may be reaching an inflection point. Specifically, work enquiries for SMM have increased, and its order book for production equipment is at an all-time high. Operating leverage tends to be high in this sector, and since SMM has invested in its integrated yards during the down cycle, its profitability should improve as the cycle turns upward.
Adding to the appeal of the investment case is SMM’s ongoing expansion into the natural gas supply chain. While still a relatively nascent venture, the dynamics of the natural gas sector are favourable over the long term and would further bolster and diversify SMM’s business profile, if executed well.
19Source: Aberdeen Standard Investments (Asia) Limited The performance returns are sourced from Lipper, based on percentage growth, calculated on a NAV-to-NAV basis with gross income reinvested.
Aberdeen Standard Thailand Equity FundInterim report to 31 March 2019
Performance ReviewFor the review period ended 31 March 2019, the value of Aberdeen Standard Thailand Equity Fund shares fell by 7.22% in Singapore-dollar terms, compared to a decrease of 4.49% in the benchmark, the SET Index.
Market ReviewThai equities fell in the six months under review, marked by a period of increased volatility. The global sell off in October dragged the market lower and for the rest of the year, stocks were hampered by worries over slowing global growth, the Sino-US trade dispute and a raft of policy tightening in the region. The US Federal Reserve raised rates for a fourth time by the end of 2018, and the Bank of Thailand (BOT), like many of its peers, felt compelled to raise its policy rate to curb financial risks and protect its currency. Despite a sudden dovish turnaround in the Fed’s policy stance in the new year that eased pressure on the BOT’s pace of rate hikes, the baht lost ground against a stronger US dollar. The second half of the period was dominated by domestic politics, which culminated in the first general elections held in almost six years turning out to be indeterminate. Although the Pheu Thai and Palang Pracharath parties gained the most votes, neither could secure a simple lower-house majority. This caused a net outflow of funds as investors were concerned about the political gridlock, since any coalition will only have a slim majority in the lower house. Official election results will be declared in early May.
On the economic front, concerns over a global economic slowdown and an expected slump in exports prompted the BOT to downgrade its 2019 GDP growth forecast from 4% to 3.8%. Lower export demand over the period was due to the ripple-effect of China’s softening economy. This in turn hampered industrial output. However, domestic consumption and tourism supported the market. The recovery in tourism after it took a hit in August was due to the government’s introduction of visa-fee waivers for targeted countries for a limited period, as well as an increase in non-Chinese tourists due to new direct flight routes to Thailand from the region. Volatility in the energy sector also affected the market due to oil price instability over the period. While several large Thai holdings in the energy sector tend to benefit from high crude prices, the relative currency weakness proved unfavourable to domestic market dynamics.
Portfolio ReviewAgainst this backdrop, the Fund underperformed its benchmark, with both asset allocation and stock selection negatively affecting the Fund.
The biggest detractor was the lack of exposure to Airports of Thailand, as Thailand’s airport operator, which manages Bangkok’s main international gateway Suvarnabhumi airport, performed well on the back of healthy tourist arrivals. However, valuations appeared lofty and capital outlay requirements significant, while governance concerns have been an issue for us over the years. Not holding CPALL, the operator of Thailand’s 7-11 franchise, also detracted as the company benefited from robust earnings and more positive sentiment over the expansion of its subsidiary Siam Makro in India and China. LPN Development, a reputable condominium developer, was the third largest detractor as the company faced a difficult macro environment, in particular, rising interest rates, sluggish consumer demand and tightening mortgage restrictions by the central bank. Thaire Life Assurance and AEON Thana also cost the Fund. Thaire faced increasing costs from rising health-related claims amid sluggish top line growth, while Aeon’s shares saw profit taking following a sharp rise; fundamentals nevertheless remained solid for the consumer lender.
Conversely, the top contributor was Electricity Generating, a power producer with a portfolio of operating assets across the region, as the company executed several value-accretive M&A transactions, including a sizable investment in Korea. Also contributing was Tesco Lotus Retail Growth, a property fund that owns rental rights to 23 Tesco Lotus hypermarkets, the majority of which are freehold. In this low-interest environment, the company continued to deliver steady profit growth and dividends, as well as regular asset revaluations. Osotspa, the largest energy drink distributor and market leader in personal care products in Thailand, which we introduced over the period, also helped the Fund through its healthy market-share growth, especially due to its exposure to the fast growing Cambodia-Laos-Myanmar-Vietnam (CLMV) markets.

20
Aberdeen Standard Select Portfolio
Report to Unitholders for the half year ended 31 March 2019
21
Report to Unitholders for the half year ended 31 March 2019 Aberdeen Standard Asian Smaller Companies Fund
a) Classification of InvestmentsPlease refer to the Statement of Portfolio in the Semi-Annual Financial Statements.
b) Credit Rating of Debt SecuritiesN/A
c) Top 10 HoldingsPlease refer to the Key Information on the underlying scheme.
d) Exposure to derivativesNil
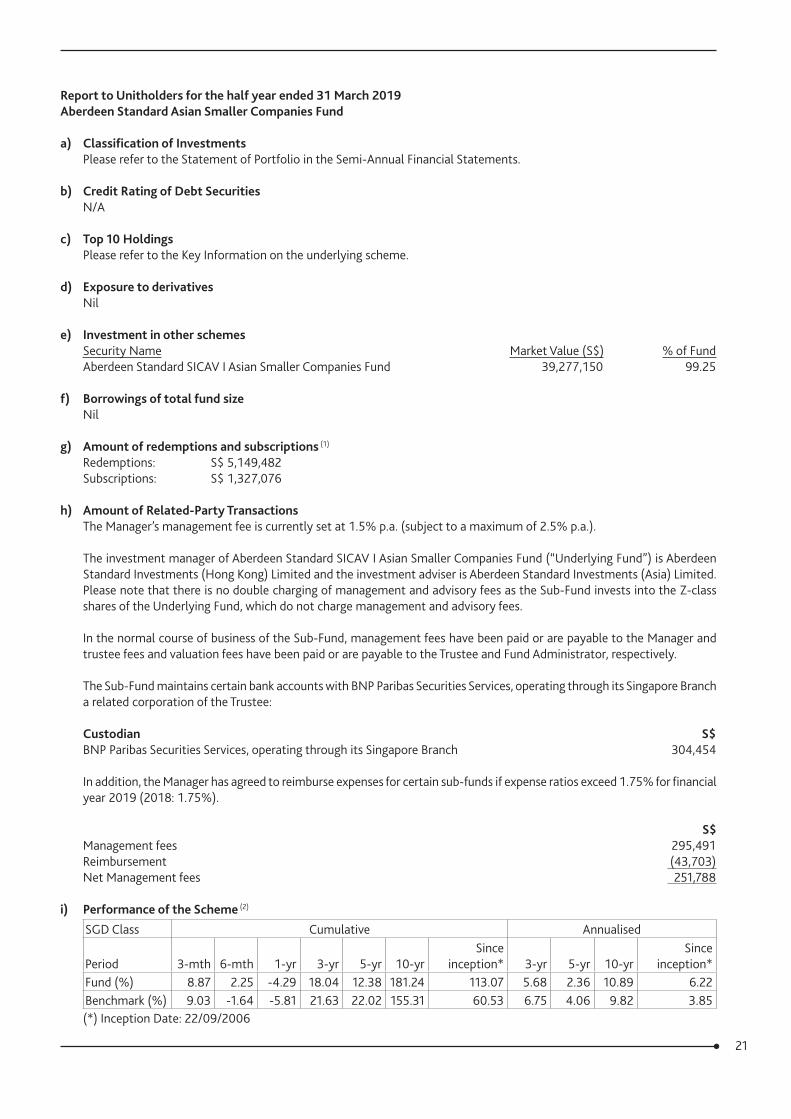
e) Investment in other schemesSecurity Name Market Value (S$) % of FundAberdeen Standard SICAV I Asian Smaller Companies Fund 39,277,150 99.25
f) Borrowings of total fund sizeNil
g) Amount of redemptions and subscriptions (1)
Redemptions: S$ 5,149,482Subscriptions: S$ 1,327,076
h) Amount of Related-Party TransactionsThe Manager’s management fee is currently set at 1.5% p.a. (subject to a maximum of 2.5% p.a.).
The investment manager of Aberdeen Standard SICAV I Asian Smaller Companies Fund (“Underlying Fund”) is Aberdeen Standard Investments (Hong Kong) Limited and the investment adviser is Aberdeen Standard Investments (Asia) Limited. Please note that there is no double charging of management and advisory fees as the Sub-Fund invests into the Z-class shares of the Underlying Fund, which do not charge management and advisory fees.
In the normal course of business of the Sub-Fund, management fees have been paid or are payable to the Manager and trustee fees and valuation fees have been paid or are payable to the Trustee and Fund Administrator, respectively.
The Sub-Fund maintains certain bank accounts with BNP Paribas Securities Services, operating through its Singapore Branch a related corporation of the Trustee:
Custodian S$BNP Paribas Securities Services, operating through its Singapore Branch 304,454
In addition, the Manager has agreed to reimburse expenses for certain sub-funds if expense ratios exceed 1.75% for financial year 2019 (2018: 1.75%).
S$Management fees 295,491Reimbursement (43,703)Net Management fees 251,788
i) Performance of the Scheme (2)
SGD Class Cumulative Annualised
Period 3-mth 6-mth 1-yr 3-yr 5-yr 10-yrSince
inception* 3-yr 5-yr 10-yrSince
inception*Fund (%) 8.87 2.25 -4.29 18.04 12.38 181.24 113.07 5.68 2.36 10.89 6.22Benchmark (%) 9.03 -1.64 -5.81 21.63 22.02 155.31 60.53 6.75 4.06 9.82 3.85(*) Inception Date: 22/09/2006
22
USD Class Cumulative Annualised
Period 3-mth 6-mth 1-yr 3-yr 5-yr 10-yrSince
inception** 3-yr 5-yr 10-yrSince
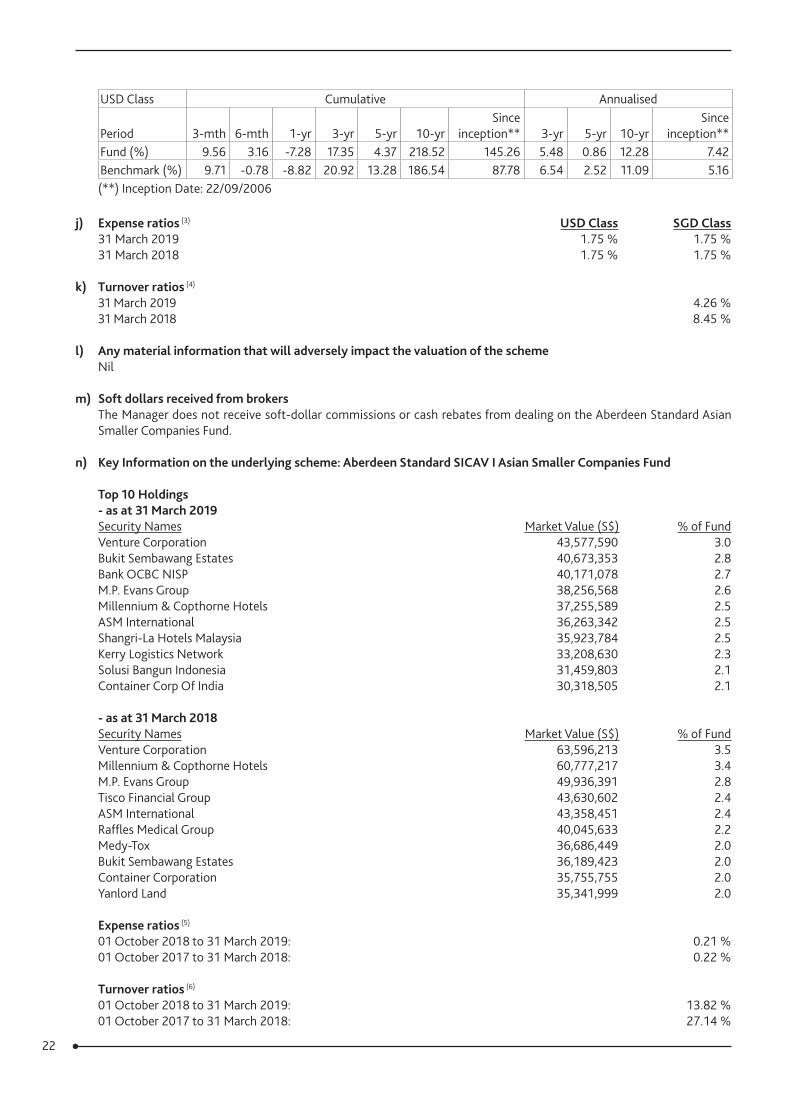
inception**Fund (%) 9.56 3.16 -7.28 17.35 4.37 218.52 145.26 5.48 0.86 12.28 7.42Benchmark (%) 9.71 -0.78 -8.82 20.92 13.28 186.54 87.78 6.54 2.52 11.09 5.16(**) Inception Date: 22/09/2006
j) Expense ratios (3) USD Class SGD Class31 March 2019 1.75 % 1.75 %31 March 2018 1.75 % 1.75 %
k) Turnover ratios (4)
31 March 2019 4.26 %31 March 2018 8.45 %
l) Any material information that will adversely impact the valuation of the schemeNil
m) Soft dollars received from brokersThe Manager does not receive soft-dollar commissions or cash rebates from dealing on the Aberdeen Standard Asian Smaller Companies Fund.
n) Key Information on the underlying scheme: Aberdeen Standard SICAV I Asian Smaller Companies Fund
Top 10 Holdings- as at 31 March 2019Security Names Market Value (S$) % of FundVenture Corporation 43,577,590 3.0Bukit Sembawang Estates 40,673,353 2.8Bank OCBC NISP 40,171,078 2.7M.P. Evans Group 38,256,568 2.6Millennium & Copthorne Hotels 37,255,589 2.5ASM International 36,263,342 2.5Shangri-La Hotels Malaysia 35,923,784 2.5Kerry Logistics Network 33,208,630 2.3Solusi Bangun Indonesia 31,459,803 2.1Container Corp Of India 30,318,505 2.1
- as at 31 March 2018Security Names Market Value (S$) % of FundVenture Corporation 63,596,213 3.5Millennium & Copthorne Hotels 60,777,217 3.4M.P. Evans Group 49,936,391 2.8Tisco Financial Group 43,630,602 2.4ASM International 43,358,451 2.4Raffles Medical Group 40,045,633 2.2Medy-Tox 36,686,449 2.0Bukit Sembawang Estates 36,189,423 2.0Container Corporation 35,755,755 2.0Yanlord Land 35,341,999 2.0
Expense ratios (5)
01 October 2018 to 31 March 2019: 0.21 %01 October 2017 to 31 March 2018: 0.22 %
Turnover ratios (6)
01 October 2018 to 31 March 2019: 13.82 %01 October 2017 to 31 March 2018: 27.14 %

23
Additional Information (7)
Distribution of Investments by- Country (as at 31 March 2019) % of FundIndia 18.4Singapore 12.9Indonesia 10.6China 9.2Malaysia 7.7Thailand 7.1South Korea 6.2Hong Kong 5.5United Kingdom 5.2Taiwan 3.5Philippines 2.9Netherlands 2.5Australia 2.2Sri Lanka 1.8Myanmar 1.1New Zealand 1.0Pakistan 0.5Cash 1.7Total 100.0
- Industry (as at 31 March 2019) % of FundIndustrials 18.2Consumer Discretionary 16.8Information Technology 16.4Healthcare 11.4Consumer Staples 9.9Financials 8.6Real Estate 7.6Materials 7.4Communication Services 1.0Energy 0.9Cash 1.8Total 100.0
(1) The total amount (S$ and US$) of redemptions and subscriptions include both CPF (for SGD Class only) and Cash funds.
(2) Source: Aberdeen Standard Asset Managers, Bloomberg, Lipper and Russell Mellon. The fund's returns are based on percentage growth, calculated on a NAV-to-NAV basis with gross income reinvested. Benchmark was changed from the MSCI AC Asia Pacific ex Japan Index to the MSCI AC Asia Pacific ex Japan Small Cap Index with effect from 01 October 2007.
(3) The expense ratio has been computed based on the guidelines laid down by the Investment Management Association of Singapore (“IMAS”). The calculation of USD Class expense ratio at 31 March 2019 was based on total operating expenses of $20,072 (2018: $47,532) divided by the average net asset value of $1,200,722 (2018: $2,837,205) for the year. The calculation of SGD Class expense ratio at 31 March 2019 was based on total operating expenses of $695,488 (2018: $911,841) divided by the average net asset value of $42,330,689 (2018: $54,819,454) for the year.
The total operating expenses do not include (where applicable) brokerage and other transactions costs, performance fee, interest expense, distribution paid out to unitholders, foreign exchange gains/losses, front or back end loads arising from the purchase or sale of other funds and tax deducted at source or arising out of income received. Expenses are reimbursed by the Manager if expense ratios exceed 1.75% (2018: 1.75%). The Sub-Fund does not pay any performance fee. The average net asset value is based on the daily balances.
24
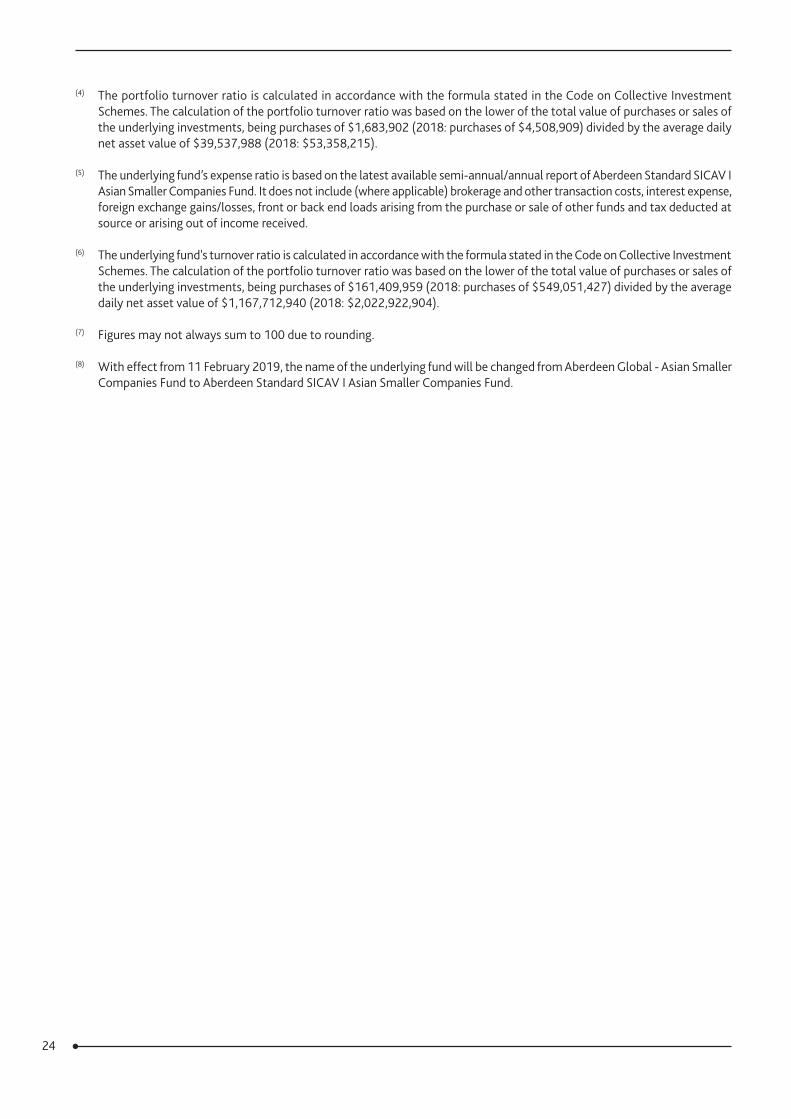
(4) The portfolio turnover ratio is calculated in accordance with the formula stated in the Code on Collective Investment Schemes. The calculation of the portfolio turnover ratio was based on the lower of the total value of purchases or sales of the underlying investments, being purchases of $1,683,902 (2018: purchases of $4,508,909) divided by the average daily net asset value of $39,537,988 (2018: $53,358,215).
(5) The underlying fund’s expense ratio is based on the latest available semi-annual/annual report of Aberdeen Standard SICAV I Asian Smaller Companies Fund. It does not include (where applicable) brokerage and other transaction costs, interest expense, foreign exchange gains/losses, front or back end loads arising from the purchase or sale of other funds and tax deducted at source or arising out of income received.
(6) The underlying fund's turnover ratio is calculated in accordance with the formula stated in the Code on Collective Investment Schemes. The calculation of the portfolio turnover ratio was based on the lower of the total value of purchases or sales of the underlying investments, being purchases of $161,409,959 (2018: purchases of $549,051,427) divided by the average daily net asset value of $1,167,712,940 (2018: $2,022,922,904).
(7) Figures may not always sum to 100 due to rounding.
(8) With effect from 11 February 2019, the name of the underlying fund will be changed from Aberdeen Global - Asian Smaller Companies Fund to Aberdeen Standard SICAV I Asian Smaller Companies Fund.
25
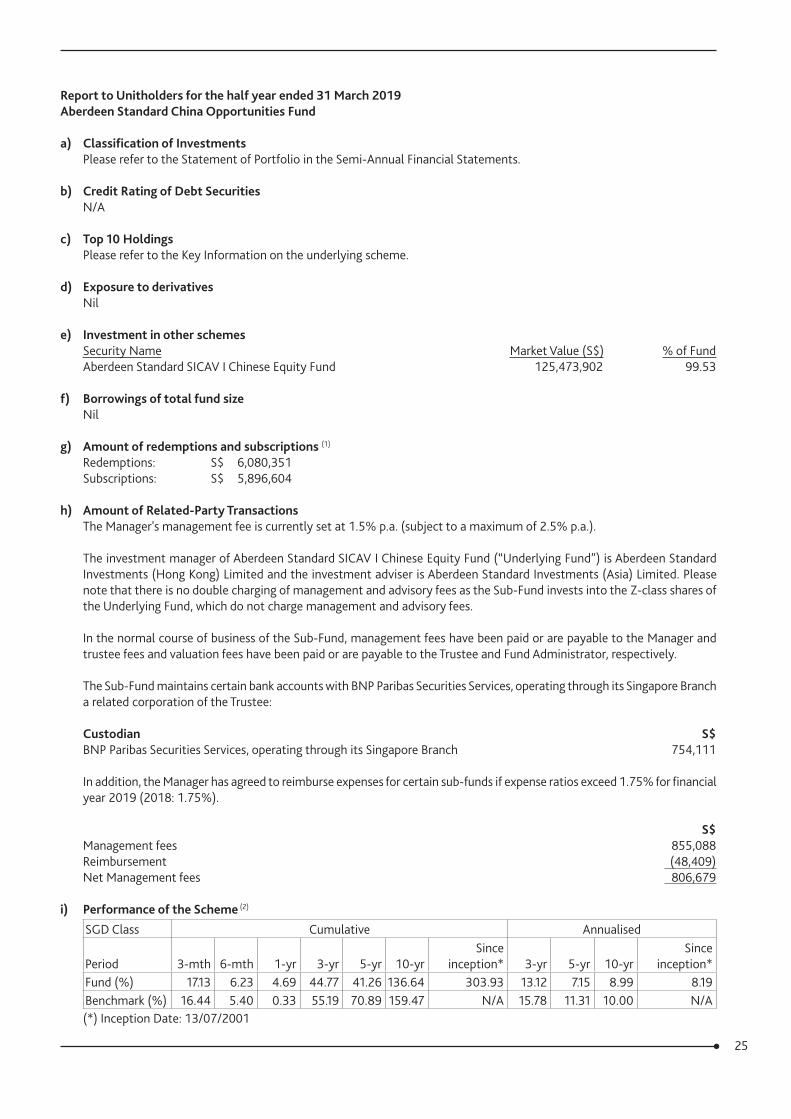
Report to Unitholders for the half year ended 31 March 2019Aberdeen Standard China Opportunities Fund
a) Classification of InvestmentsPlease refer to the Statement of Portfolio in the Semi-Annual Financial Statements.
b) Credit Rating of Debt SecuritiesN/A
c) Top 10 HoldingsPlease refer to the Key Information on the underlying scheme.
d) Exposure to derivativesNil
e) Investment in other schemesSecurity Name Market Value (S$) % of FundAberdeen Standard SICAV I Chinese Equity Fund 125,473,902 99.53
f) Borrowings of total fund sizeNil
g) Amount of redemptions and subscriptions (1)
Redemptions: S$ 6,080,351Subscriptions: S$ 5,896,604
h) Amount of Related-Party TransactionsThe Manager's management fee is currently set at 1.5% p.a. (subject to a maximum of 2.5% p.a.).
The investment manager of Aberdeen Standard SICAV I Chinese Equity Fund (“Underlying Fund”) is Aberdeen Standard Investments (Hong Kong) Limited and the investment adviser is Aberdeen Standard Investments (Asia) Limited. Please note that there is no double charging of management and advisory fees as the Sub-Fund invests into the Z-class shares of the Underlying Fund, which do not charge management and advisory fees.
In the normal course of business of the Sub-Fund, management fees have been paid or are payable to the Manager and trustee fees and valuation fees have been paid or are payable to the Trustee and Fund Administrator, respectively.
The Sub-Fund maintains certain bank accounts with BNP Paribas Securities Services, operating through its Singapore Branch a related corporation of the Trustee:
Custodian S$BNP Paribas Securities Services, operating through its Singapore Branch 754,111
In addition, the Manager has agreed to reimburse expenses for certain sub-funds if expense ratios exceed 1.75% for financial year 2019 (2018: 1.75%).
S$Management fees 855,088Reimbursement (48,409)Net Management fees 806,679
i) Performance of the Scheme (2)
SGD Class Cumulative Annualised
Period 3-mth 6-mth 1-yr 3-yr 5-yr 10-yrSince
inception* 3-yr 5-yr 10-yrSince
inception*Fund (%) 17.13 6.23 4.69 44.77 41.26 136.64 303.93 13.12 7.15 8.99 8.19Benchmark (%) 16.44 5.40 0.33 55.19 70.89 159.47 N/A 15.78 11.31 10.00 N/A(*) Inception Date: 13/07/2001
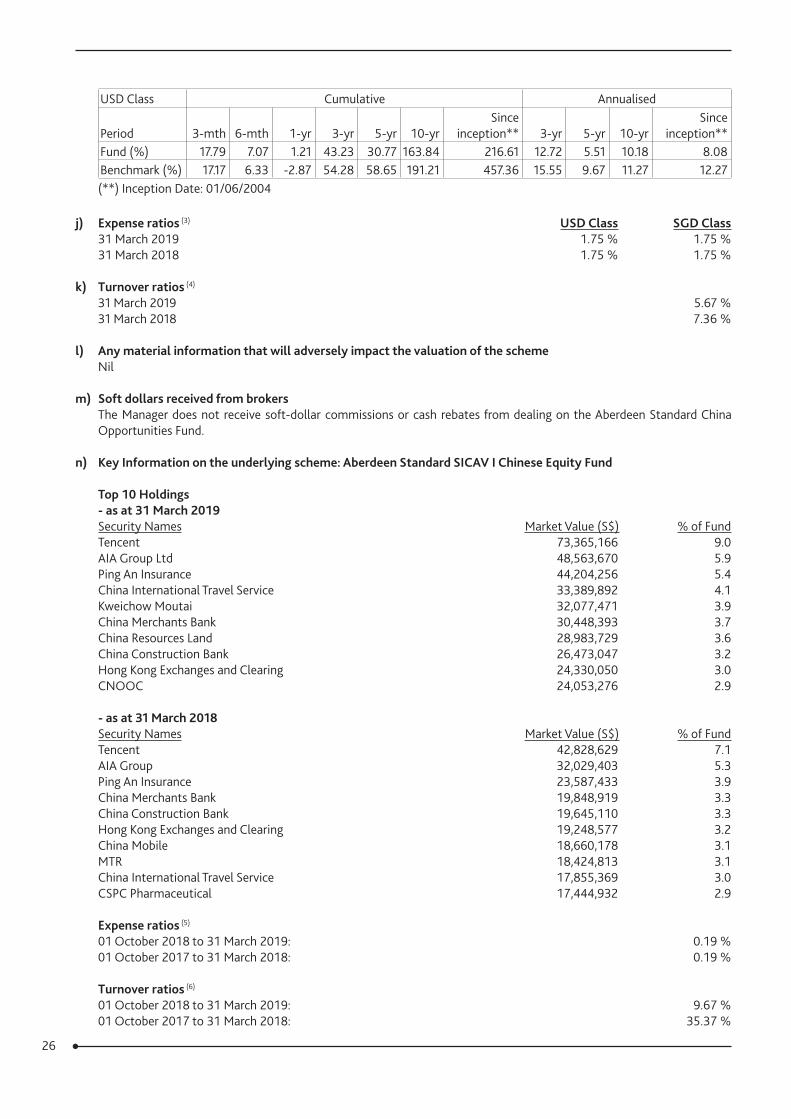
26
USD Class Cumulative Annualised
Period 3-mth 6-mth 1-yr 3-yr 5-yr 10-yrSince
inception** 3-yr 5-yr 10-yrSince
inception**Fund (%) 17.79 7.07 1.21 43.23 30.77 163.84 216.61 12.72 5.51 10.18 8.08Benchmark (%) 17.17 6.33 -2.87 54.28 58.65 191.21 457.36 15.55 9.67 11.27 12.27(**) Inception Date: 01/06/2004
j) Expense ratios (3) USD Class SGD Class31 March 2019 1.75 % 1.75 %31 March 2018 1.75 % 1.75 %
k) Turnover ratios (4)
31 March 2019 5.67 %31 March 2018 7.36 %
l) Any material information that will adversely impact the valuation of the schemeNil
m) Soft dollars received from brokersThe Manager does not receive soft-dollar commissions or cash rebates from dealing on the Aberdeen Standard China Opportunities Fund.
n) Key Information on the underlying scheme: Aberdeen Standard SICAV I Chinese Equity Fund
Top 10 Holdings - as at 31 March 2019Security Names Market Value (S$) % of FundTencent 73,365,166 9.0AIA Group Ltd 48,563,670 5.9Ping An Insurance 44,204,256 5.4China International Travel Service 33,389,892 4.1Kweichow Moutai 32,077,471 3.9China Merchants Bank 30,448,393 3.7China Resources Land 28,983,729 3.6China Construction Bank 26,473,047 3.2Hong Kong Exchanges and Clearing 24,330,050 3.0CNOOC 24,053,276 2.9
- as at 31 March 2018Security Names Market Value (S$) % of FundTencent 42,828,629 7.1AIA Group 32,029,403 5.3Ping An Insurance 23,587,433 3.9China Merchants Bank 19,848,919 3.3China Construction Bank 19,645,110 3.3Hong Kong Exchanges and Clearing 19,248,577 3.2China Mobile 18,660,178 3.1MTR 18,424,813 3.1China International Travel Service 17,855,369 3.0CSPC Pharmaceutical 17,444,932 2.9
Expense ratios (5)
01 October 2018 to 31 March 2019: 0.19 %01 October 2017 to 31 March 2018: 0.19 %
Turnover ratios (6)
01 October 2018 to 31 March 2019: 9.67 %01 October 2017 to 31 March 2018: 35.37 %

27
Additional Information (7)
Distribution of Investments by- Country (as at 31 March 2019) % of FundChina 67.4Hong Kong 29.7Singapore 0.3Cash 2.6Total 100.0
- Industry (as at 31 March 2019) % of FundFinancials 21.9Consumer Discretionary 17.9Communication Services 13.7Industrials 10.0Real Estate 9.6Information Technology 7.5Healthcare 5.9Consumer Staples 5.9Energy 3.5Utilities 1.5Cash 2.6Total 100.0
(1) The total amount (S$ and US$) of redemptions and subscriptions include both CPF (for SGD Class only) and Cash funds.
(2) Source: Aberdeen Standard Asset Managers, Bloomberg, CLSA, Lipper and Russell Mellon. The fund's returns are based on percentage growth, calculated on a NAV-to-NAV basis with gross income reinvested. Benchmark was changed from the CLSA China World Index to MSCI China Index with effect from 1 June 2005 and from the MSCI China Index to the MSCI Zhong Hua Index with effect from 1 October 2007. Benchmark data is only available from 31 July 2001.
(3) The expense ratio has been computed based on the guidelines laid down by the Investment Management Association of Singapore (“IMAS”). The calculation of USD Class expense ratio at 31 March 2019 was based on total operating expenses of $13,418 (2018: $21,311) divided by the average net asset value of $820,605 (2018: $1,276,620) for the year. The calculation of SGD Class expense ratio at 31 March 2019 was based on total operating expenses of $1,886,266 (2018: $2,626,556) divided by the average net asset value of $118,464,931 (2018: $163,820,373) for the year.
The total operating expenses do not include (where applicable) brokerage and other transactions costs, performance fee, interest expense, distribution paid out to unitholders, foreign exchange gains/losses, front or back end loads arising from the purchase or sale of other funds and tax deducted at source or arising out of income received. Expenses are reimbursed by the Manager if expense ratios exceed 1.75% (2018: 1.75%). The Sub-Fund does not pay any performance fee. The average net asset value is based on the daily balances.
(4) The portfolio turnover ratio is calculated in accordance with the formula stated in the Code on Collective Investment Schemes. The calculation of the portfolio turnover ratio was based on the lower of the total value of purchases or sales of the underlying investments, being purchases of $6,477,352 (2018: purchases of $10,543,007) divided by the average daily net asset value of $114,302,042 (2018: $143,239,918).
(5) The underlying fund’s expense ratio is based on the latest available semi-annual/annual report of Aberdeen Standard SICAV I Chinese Equity Fund. It does not include (where applicable) brokerage and other transaction costs, interest expense, foreign exchange gains/losses, front or back end loads arising from the purchase or sale of other funds and tax deducted at source or arising out of income received.

28
(6) The underlying fund's turnover ratio is calculated in accordance with the formula stated in the Code on Collective Investment Schemes. The calculation of the portfolio turnover ratio was based on the lower of the total value of purchases or sales of the underlying investments, being sales of $50,980,903 (2018: purchases of $229,551,662) divided by the average daily net asset value of $526,938,522 (2018: $648,940,164).
(7) Figures may not always sum to 100 due to rounding.
(8) With effect from 11 February 2019, the name of the underlying fund will be changed from Aberdeen Global - Chinese Equity Fund to Aberdeen Standard SICAV I Chinese Equity Fund.
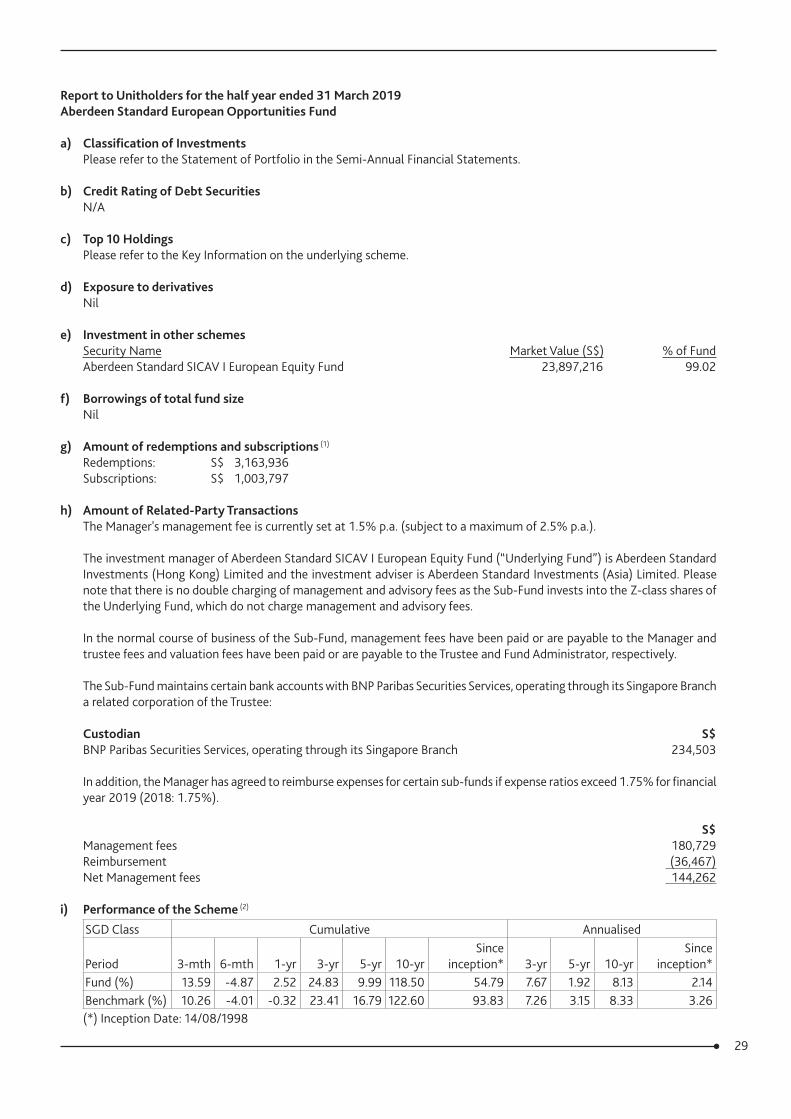
29
Report to Unitholders for the half year ended 31 March 2019 Aberdeen Standard European Opportunities Fund
a) Classification of InvestmentsPlease refer to the Statement of Portfolio in the Semi-Annual Financial Statements.
b) Credit Rating of Debt SecuritiesN/A
c) Top 10 HoldingsPlease refer to the Key Information on the underlying scheme.
d) Exposure to derivativesNil
e) Investment in other schemesSecurity Name Market Value (S$) % of FundAberdeen Standard SICAV I European Equity Fund 23,897,216 99.02
f) Borrowings of total fund sizeNil
g) Amount of redemptions and subscriptions (1)
Redemptions: S$ 3,163,936Subscriptions: S$ 1,003,797
h) Amount of Related-Party TransactionsThe Manager's management fee is currently set at 1.5% p.a. (subject to a maximum of 2.5% p.a.).
The investment manager of Aberdeen Standard SICAV I European Equity Fund (“Underlying Fund”) is Aberdeen Standard Investments (Hong Kong) Limited and the investment adviser is Aberdeen Standard Investments (Asia) Limited. Please note that there is no double charging of management and advisory fees as the Sub-Fund invests into the Z-class shares of the Underlying Fund, which do not charge management and advisory fees.
In the normal course of business of the Sub-Fund, management fees have been paid or are payable to the Manager and trustee fees and valuation fees have been paid or are payable to the Trustee and Fund Administrator, respectively.
The Sub-Fund maintains certain bank accounts with BNP Paribas Securities Services, operating through its Singapore Branch a related corporation of the Trustee:
Custodian S$BNP Paribas Securities Services, operating through its Singapore Branch 234,503
In addition, the Manager has agreed to reimburse expenses for certain sub-funds if expense ratios exceed 1.75% for financial year 2019 (2018: 1.75%).
S$Management fees 180,729Reimbursement (36,467)Net Management fees 144,262
i) Performance of the Scheme (2)
SGD Class Cumulative Annualised
Period 3-mth 6-mth 1-yr 3-yr 5-yr 10-yrSince
inception* 3-yr 5-yr 10-yrSince
inception*Fund (%) 13.59 -4.87 2.52 24.83 9.99 118.50 54.79 7.67 1.92 8.13 2.14Benchmark (%) 10.26 -4.01 -0.32 23.41 16.79 122.60 93.83 7.26 3.15 8.33 3.26(*) Inception Date: 14/08/1998
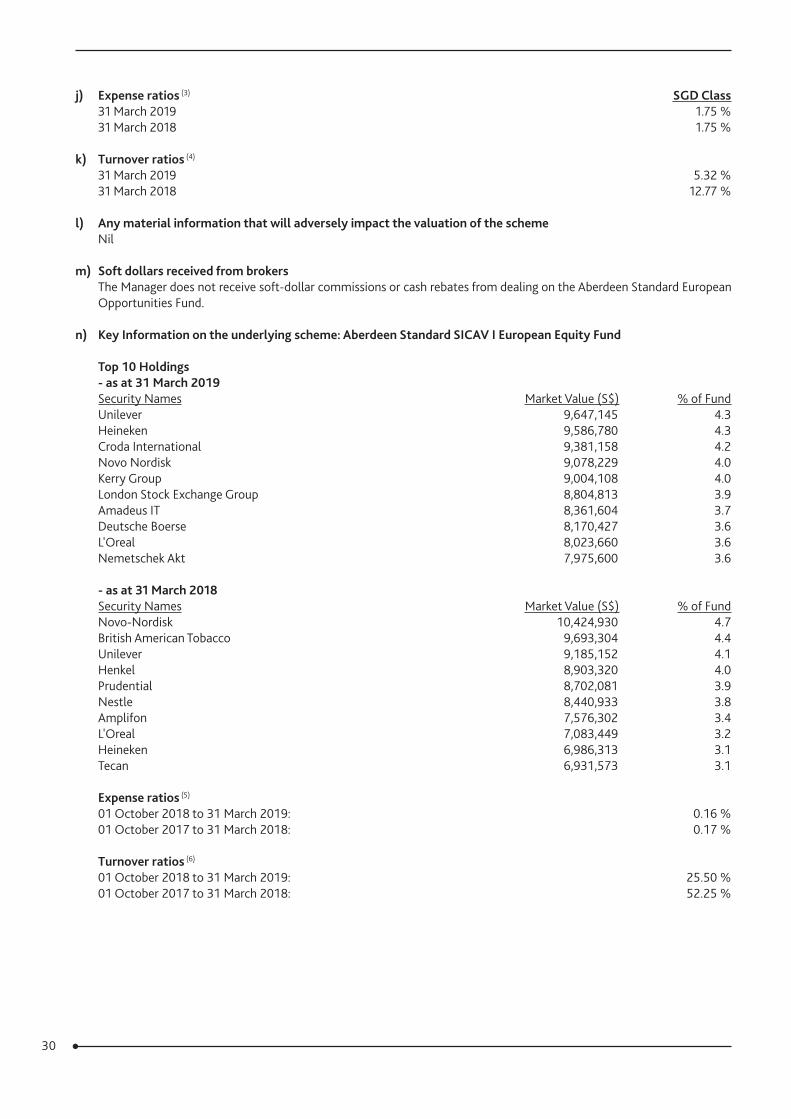
30
j) Expense ratios (3) SGD Class31 March 2019 1.75 %31 March 2018 1.75 %
k) Turnover ratios (4)
31 March 2019 5.32 %31 March 2018 12.77 %
l) Any material information that will adversely impact the valuation of the schemeNil
m) Soft dollars received from brokersThe Manager does not receive soft-dollar commissions or cash rebates from dealing on the Aberdeen Standard European Opportunities Fund.
n) Key Information on the underlying scheme: Aberdeen Standard SICAV I European Equity Fund
Top 10 Holdings- as at 31 March 2019Security Names Market Value (S$) % of FundUnilever 9,647,145 4.3Heineken 9,586,780 4.3Croda International 9,381,158 4.2Novo Nordisk 9,078,229 4.0Kerry Group 9,004,108 4.0London Stock Exchange Group 8,804,813 3.9Amadeus IT 8,361,604 3.7Deutsche Boerse 8,170,427 3.6L'Oreal 8,023,660 3.6Nemetschek Akt 7,975,600 3.6
- as at 31 March 2018Security Names Market Value (S$) % of FundNovo-Nordisk 10,424,930 4.7British American Tobacco 9,693,304 4.4Unilever 9,185,152 4.1Henkel 8,903,320 4.0Prudential 8,702,081 3.9Nestle 8,440,933 3.8Amplifon 7,576,302 3.4L'Oreal 7,083,449 3.2Heineken 6,986,313 3.1Tecan 6,931,573 3.1
Expense ratios (5)
01 October 2018 to 31 March 2019: 0.16 %01 October 2017 to 31 March 2018: 0.17 %
Turnover ratios (6)
01 October 2018 to 31 March 2019: 25.50 %01 October 2017 to 31 March 2018: 52.25 %

31
Additional Information (7)
Distribution of Investments by- Country (as at 31 March 2019) % of FundUnited Kingdom 29.1France 14.9Germany 10.0Switzerland 9.7Netherlands 8.6Italy 7.0Denmark 5.7Ireland 4.0Spain 3.7Sweden 2.2Finland 2.0Austria 1.8Cash 1.3Total 100.0
- Industry (as at 31 March 2019) % of FundConsumer Goods 29.2Industrials 18.9Healthcare 15.5Financials 13.4Technology 12.8Basic Materials 4.2Consumer Services 2.9Oil & Gas 1.8Cash 1.3Total 100.0
(1) The total amount of subscriptions and redemptions includes both CPF and Cash funds.
(2) Source: Aberdeen Standard Asset Managers, Bloomberg, Lipper and Russell Mellon. The fund's returns are based on percentage growth, calculated on a NAV-to-NAV basis with gross income reinvested. Benchmark was changed from the FTSE Europe ex UK Index to FTSE World - Europe Index with effect from 1 July 2005.
(3) The expense ratio has been computed based on the guidelines laid down by the Investment Management Association of Singapore (“IMAS”). The calculation of the expense ratio at 31 March 2019 is based on total operating expenses of $456,114 (2018: $625,000) divided by the average net asset value of $26,858,716 (2018: $36,383,801) for the year.
The total operating expenses do not include (where applicable) brokerage and other transactions costs, performance fee, interest expense, distribution paid out to unitholders, foreign exchange gains/losses, front or back end loads arising from the purchase or sale of other funds and tax deducted at source or arising out of income received. Expenses are reimbursed by the Manager if expense ratios exceed 1.75% (2018: 1.75%). The Sub-Fund does not pay any performance fee. The average net asset value is based on the daily balances.
(4) The portfolio turnover ratio is calculated in accordance with the formula stated in the Code on Collective Investment Schemes. The calculation of the portfolio turnover ratio was based on the lower of the total value of purchases or sales of the underlying investments, being purchases of $1,286,562 (2018: purchases of $4,224,549) divided by the average daily net asset value of $24,198,155 (2018: $33,077,003).
(5) The underlying fund’s expense ratio is based on the latest available semi-annual/annual report of Aberdeen Standard SICAV I European Equity Fund. It does not include (where applicable) brokerage and other transaction costs, interest expense, foreign exchange gains/losses, front or back end loads arising from the purchase or sale of other funds and tax deducted at source or arising out of income received.

32
(6) The underlying fund's turnover ratio is calculated in accordance with the formula stated in the Code on Collective Investment Schemes. The calculation of the portfolio turnover ratio was based on the lower of the total value of purchases or sales of the underlying investments, being purchases of $37,407,289 (2018: purchases of $91,417,122) divided by the average daily net asset value of $146,701,294 (2018: $174,971,773).
(7) Figures may not always sum to 100 due to rounding.
(8) With effect from 11 February 2019, the name of the underlying fund will be changed from Aberdeen Global - European Equity Fund to Aberdeen Standard SICAV I European Equity Fund.
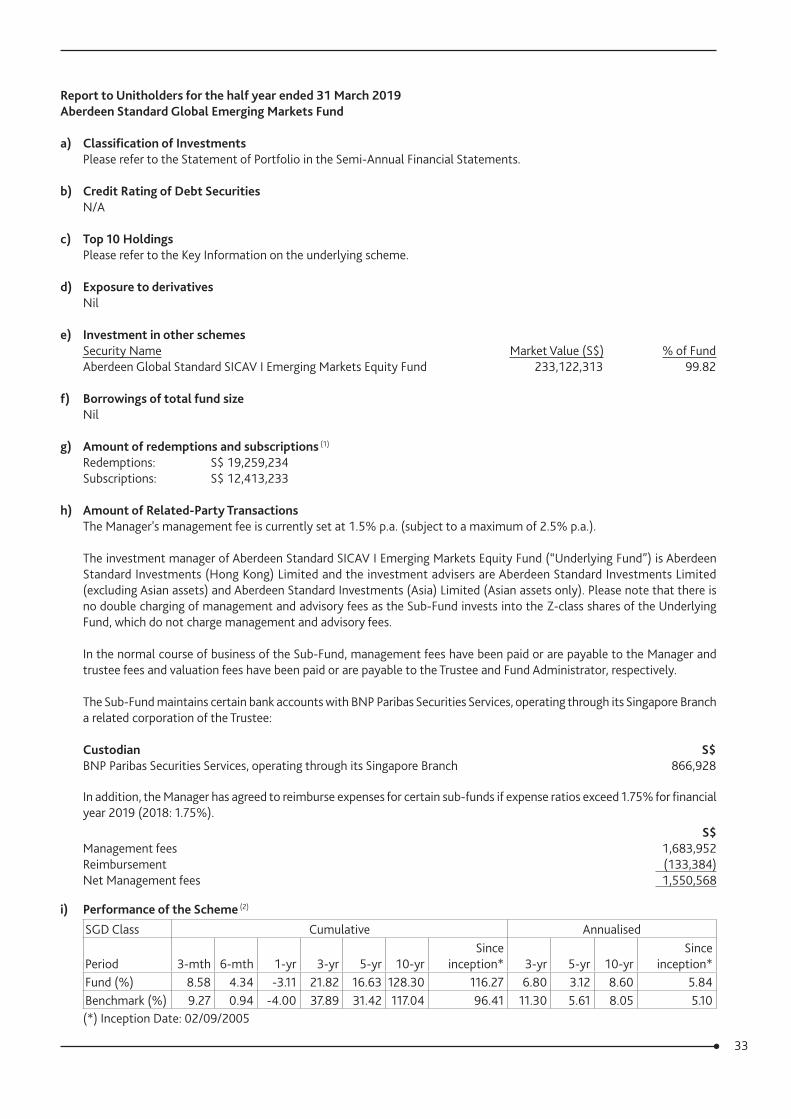
33
Report to Unitholders for the half year ended 31 March 2019Aberdeen Standard Global Emerging Markets Fund
a) Classification of InvestmentsPlease refer to the Statement of Portfolio in the Semi-Annual Financial Statements.
b) Credit Rating of Debt SecuritiesN/A
c) Top 10 HoldingsPlease refer to the Key Information on the underlying scheme.
d) Exposure to derivativesNil
e) Investment in other schemesSecurity Name Market Value (S$) % of FundAberdeen Global Standard SICAV I Emerging Markets Equity Fund 233,122,313 99.82
f) Borrowings of total fund sizeNil
g) Amount of redemptions and subscriptions (1)
Redemptions: S$ 19,259,234Subscriptions: S$ 12,413,233
h) Amount of Related-Party TransactionsThe Manager's management fee is currently set at 1.5% p.a. (subject to a maximum of 2.5% p.a.).
The investment manager of Aberdeen Standard SICAV I Emerging Markets Equity Fund (“Underlying Fund”) is Aberdeen Standard Investments (Hong Kong) Limited and the investment advisers are Aberdeen Standard Investments Limited (excluding Asian assets) and Aberdeen Standard Investments (Asia) Limited (Asian assets only). Please note that there is no double charging of management and advisory fees as the Sub-Fund invests into the Z-class shares of the Underlying Fund, which do not charge management and advisory fees.
In the normal course of business of the Sub-Fund, management fees have been paid or are payable to the Manager and trustee fees and valuation fees have been paid or are payable to the Trustee and Fund Administrator, respectively.
The Sub-Fund maintains certain bank accounts with BNP Paribas Securities Services, operating through its Singapore Branch a related corporation of the Trustee:
Custodian S$BNP Paribas Securities Services, operating through its Singapore Branch 866,928
In addition, the Manager has agreed to reimburse expenses for certain sub-funds if expense ratios exceed 1.75% for financial year 2019 (2018: 1.75%). S$Management fees 1,683,952Reimbursement (133,384)Net Management fees 1,550,568
i) Performance of the Scheme (2)
SGD Class Cumulative Annualised
Period 3-mth 6-mth 1-yr 3-yr 5-yr 10-yrSince
inception* 3-yr 5-yr 10-yrSince
inception*Fund (%) 8.58 4.34 -3.11 21.82 16.63 128.30 116.27 6.80 3.12 8.60 5.84Benchmark (%) 9.27 0.94 -4.00 37.89 31.42 117.04 96.41 11.30 5.61 8.05 5.10(*) Inception Date: 02/09/2005
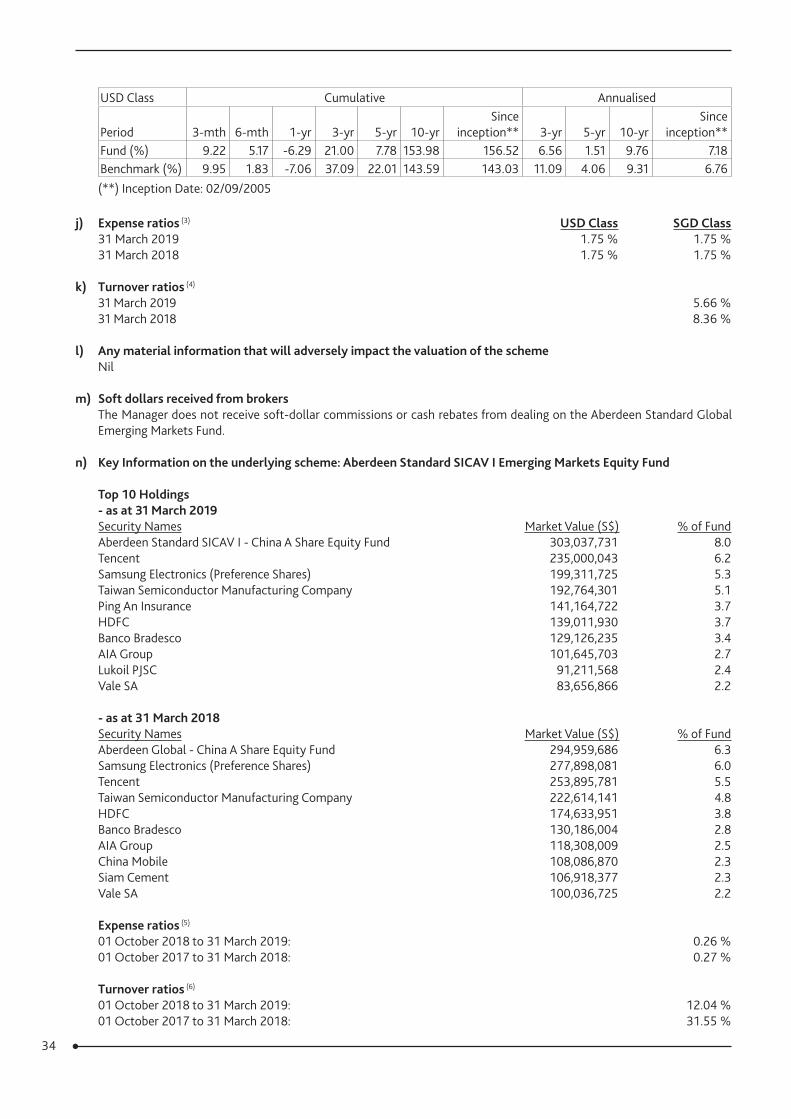
34
USD Class Cumulative Annualised
Period 3-mth 6-mth 1-yr 3-yr 5-yr 10-yrSince
inception** 3-yr 5-yr 10-yrSince
inception**Fund (%) 9.22 5.17 -6.29 21.00 7.78 153.98 156.52 6.56 1.51 9.76 7.18Benchmark (%) 9.95 1.83 -7.06 37.09 22.01 143.59 143.03 11.09 4.06 9.31 6.76(**) Inception Date: 02/09/2005
j) Expense ratios (3) USD Class SGD Class31 March 2019 1.75 % 1.75 %31 March 2018 1.75 % 1.75 %
k) Turnover ratios (4)
31 March 2019 5.66 %31 March 2018 8.36 %
l) Any material information that will adversely impact the valuation of the schemeNil
m) Soft dollars received from brokersThe Manager does not receive soft-dollar commissions or cash rebates from dealing on the Aberdeen Standard Global Emerging Markets Fund.
n) Key Information on the underlying scheme: Aberdeen Standard SICAV I Emerging Markets Equity Fund
Top 10 Holdings - as at 31 March 2019Security Names Market Value (S$) % of FundAberdeen Standard SICAV I - China A Share Equity Fund 303,037,731 8.0Tencent 235,000,043 6.2Samsung Electronics (Preference Shares) 199,311,725 5.3Taiwan Semiconductor Manufacturing Company 192,764,301 5.1Ping An Insurance 141,164,722 3.7HDFC 139,011,930 3.7Banco Bradesco 129,126,235 3.4AIA Group 101,645,703 2.7Lukoil PJSC 91,211,568 2.4Vale SA 83,656,866 2.2
- as at 31 March 2018Security Names Market Value (S$) % of FundAberdeen Global - China A Share Equity Fund 294,959,686 6.3Samsung Electronics (Preference Shares) 277,898,081 6.0Tencent 253,895,781 5.5Taiwan Semiconductor Manufacturing Company 222,614,141 4.8HDFC 174,633,951 3.8Banco Bradesco 130,186,004 2.8AIA Group 118,308,009 2.5China Mobile 108,086,870 2.3Siam Cement 106,918,377 2.3Vale SA 100,036,725 2.2
Expense ratios (5)
01 October 2018 to 31 March 2019: 0.26 %01 October 2017 to 31 March 2018: 0.27 %
Turnover ratios (6)
01 October 2018 to 31 March 2019: 12.04 %01 October 2017 to 31 March 2018: 31.55 %
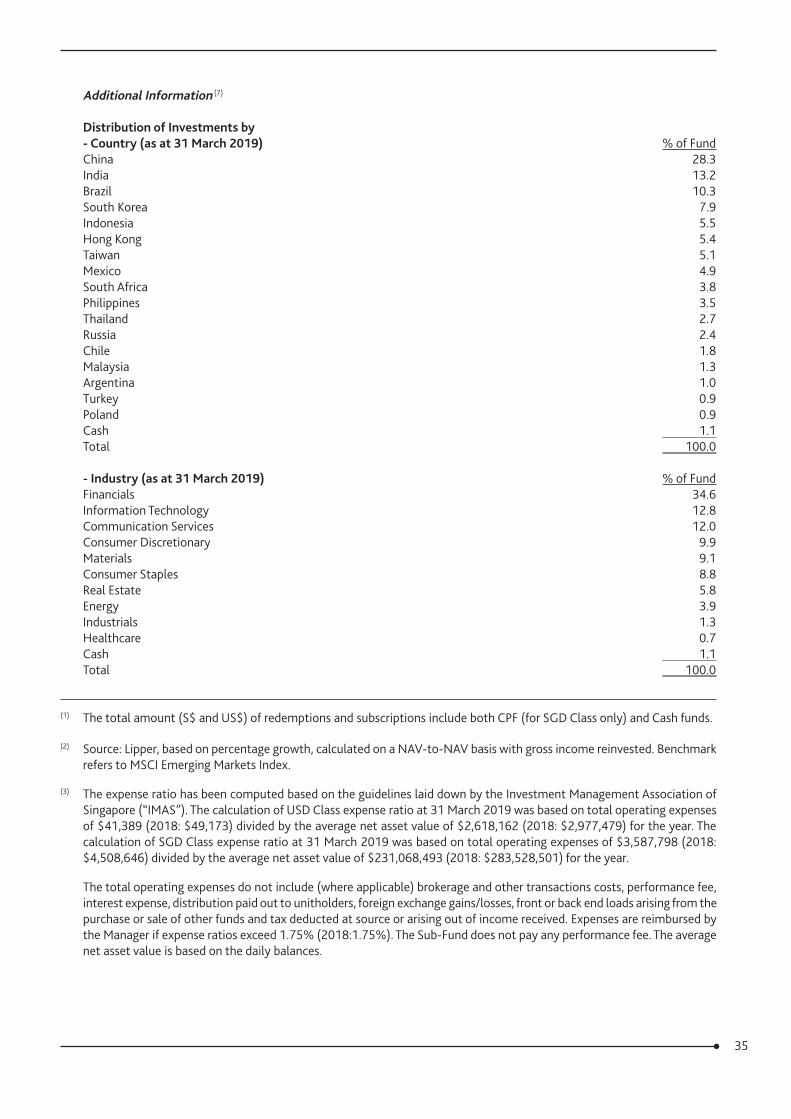
35
Additional Information (7)
Distribution of Investments by- Country (as at 31 March 2019) % of FundChina 28.3India 13.2Brazil 10.3South Korea 7.9Indonesia 5.5Hong Kong 5.4Taiwan 5.1Mexico 4.9South Africa 3.8Philippines 3.5Thailand 2.7Russia 2.4Chile 1.8Malaysia 1.3Argentina 1.0Turkey 0.9Poland 0.9Cash 1.1Total 100.0
- Industry (as at 31 March 2019) % of FundFinancials 34.6Information Technology 12.8Communication Services 12.0Consumer Discretionary 9.9Materials 9.1Consumer Staples 8.8Real Estate 5.8Energy 3.9Industrials 1.3Healthcare 0.7Cash 1.1Total 100.0
(1) The total amount (S$ and US$) of redemptions and subscriptions include both CPF (for SGD Class only) and Cash funds.
(2) Source: Lipper, based on percentage growth, calculated on a NAV-to-NAV basis with gross income reinvested. Benchmark refers to MSCI Emerging Markets Index.
(3) The expense ratio has been computed based on the guidelines laid down by the Investment Management Association of Singapore (“IMAS”). The calculation of USD Class expense ratio at 31 March 2019 was based on total operating expenses of $41,389 (2018: $49,173) divided by the average net asset value of $2,618,162 (2018: $2,977,479) for the year. The calculation of SGD Class expense ratio at 31 March 2019 was based on total operating expenses of $3,587,798 (2018: $4,508,646) divided by the average net asset value of $231,068,493 (2018: $283,528,501) for the year.
The total operating expenses do not include (where applicable) brokerage and other transactions costs, performance fee, interest expense, distribution paid out to unitholders, foreign exchange gains/losses, front or back end loads arising from the purchase or sale of other funds and tax deducted at source or arising out of income received. Expenses are reimbursed by the Manager if expense ratios exceed 1.75% (2018:1.75%). The Sub-Fund does not pay any performance fee. The average net asset value is based on the daily balances.
36
(4) The portfolio turnover ratio is calculated in accordance with the formula stated in the Code on Collective Investment Schemes. The calculation of the portfolio turnover ratio was based on the lower of the total value of purchases or sales of the underlying investments, being purchases of $12,734,039 (2018: purchases of $23,729,873) divided by the average daily net asset value of $225,121,425 (2018: $283,721,920).
(5) The underlying fund’s expense ratio is based on the latest available semi-annual/annual report of Aberdeen Standard SICAV I Emerging Markets Equity Fund. It does not include (where applicable) brokerage and other transaction costs, interest expense, foreign exchange gains/losses, front or back end loads arising from the purchase or sale of other funds and tax deducted at source or arising out of income received.
(6) The underlying fund's turnover ratio is calculated in accordance with the formula stated in the Code on Collective Investment Schemes. The calculation of the portfolio turnover ratio was based on the lower of the total value of purchases or sales of the underlying investments, being purchases of $359,762,571 (2018: purchases of $1,843,830,467) divided by the average daily net asset value of $2,987,599,961 (2018: $5,843,720,424).
(7) Figures may not always sum to 100 due to rounding.
(8) With effect from 11 February 2019, the name of the underlying fund will be changed from Aberdeen Global - Emerging Markets Equity Fund to Aberdeen Standard SICAV I Emerging Markets Equity Fund.

37
Report to Unitholders for the half year ended 31 March 2019Aberdeen Standard Global Opportunities Fund
a) Classification of InvestmentsPlease refer to the Statement of Portfolio in the Semi-Annual Financial Statements.
b) Credit Rating of Debt SecuritiesN/A
c) Top 10 HoldingsPlease refer to the Key Information on the underlying scheme.
d) Exposure to derivativesNil
e) Investment in other schemesSecurity Name Market Value (S$) % of FundAberdeen Global Standard SICAV I World Equity Fund 178,739,692 99.40
f) Borrowings of total fund sizeNil
g) Amount of redemptions and subscriptions (1)
Redemptions: S$ 11,940,546Subscriptions: S$ 12,923,186
h) Amount of Related-Party TransactionsThe Manager's management fee is currently set at 1.5% p.a. (subject to a maximum of 2.5% p.a.).
The investment manager of Aberdeen Standard SICAV I World Equity Fund (“Underlying Fund”) is Aberdeen Standard Investments (Hong Kong) Limited and the investment adviser is Aberdeen Standard Investments Limited. Please note that there is no double charging of management and advisory fees as the Sub-Fund invests into the Z-class shares of the Underlying Fund, which do not charge management and advisory fees.
In the normal course of business of the Sub-Fund, management fees have been paid or are payable to the Manager and trustee fees and valuation fees have been paid or are payable to the Trustee and Fund Administrator, respectively.
The Sub-Fund maintains certain bank accounts with BNP Paribas Securities Services, operating through its Singapore Branch a related corporation of the Trustee:
Custodian S$BNP Paribas Securities Services, operating through its Singapore Branch 803,028
In addition, the Manager has agreed to reimburse expenses for certain sub-funds if expense ratios exceed 1.75% for financial year 2019 (2018: 1.75%).
S$Management fees 1,300,373Reimbursement (15,497)Net Management fees 1,284,876
i) Performance of the Scheme (2)
SGD Class Cumulative Annualised
Period 3-mth 6-mth 1-yr 3-yr 5-yr 10-yrSince
inception* 3-yr 5-yr 10-yrSince
inception*Fund (%) 9.73 -2.10 2.06 23.71 15.17 109.76 25.13 7.35 2.86 7.68 1.21Benchmark (%) 11.94 -3.20 8.05 38.71 53.76 202.83 87.92 11.52 8.98 11.71 3.45(*) Inception Date: 25/08/2000
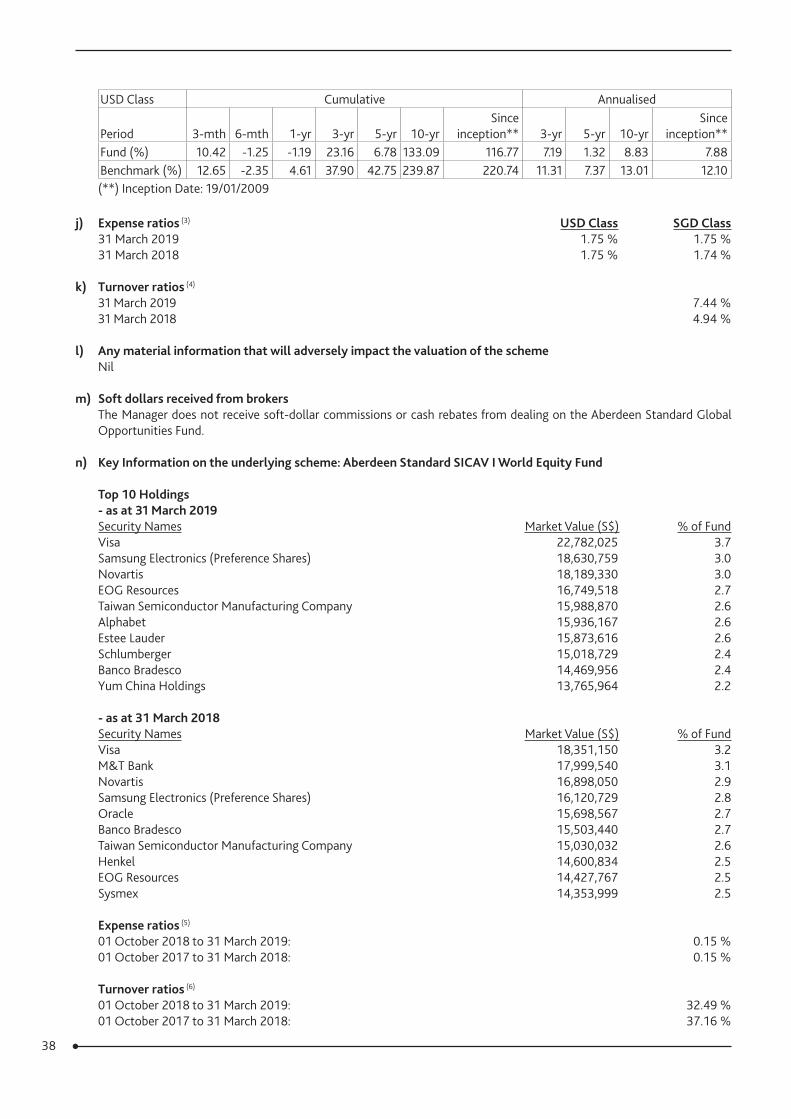
38
USD Class Cumulative Annualised
Period 3-mth 6-mth 1-yr 3-yr 5-yr 10-yrSince
inception** 3-yr 5-yr 10-yrSince
inception**Fund (%) 10.42 -1.25 -1.19 23.16 6.78 133.09 116.77 7.19 1.32 8.83 7.88Benchmark (%) 12.65 -2.35 4.61 37.90 42.75 239.87 220.74 11.31 7.37 13.01 12.10(**) Inception Date: 19/01/2009
j) Expense ratios (3) USD Class SGD Class31 March 2019 1.75 % 1.75 %31 March 2018 1.75 % 1.74 %
k) Turnover ratios (4)
31 March 2019 7.44 %31 March 2018 4.94 %
l) Any material information that will adversely impact the valuation of the schemeNil
m) Soft dollars received from brokersThe Manager does not receive soft-dollar commissions or cash rebates from dealing on the Aberdeen Standard Global Opportunities Fund.
n) Key Information on the underlying scheme: Aberdeen Standard SICAV I World Equity Fund
Top 10 Holdings- as at 31 March 2019Security Names Market Value (S$) % of FundVisa 22,782,025 3.7Samsung Electronics (Preference Shares) 18,630,759 3.0Novartis 18,189,330 3.0EOG Resources 16,749,518 2.7Taiwan Semiconductor Manufacturing Company 15,988,870 2.6Alphabet 15,936,167 2.6Estee Lauder 15,873,616 2.6Schlumberger 15,018,729 2.4Banco Bradesco 14,469,956 2.4Yum China Holdings 13,765,964 2.2
- as at 31 March 2018Security Names Market Value (S$) % of FundVisa 18,351,150 3.2M&T Bank 17,999,540 3.1Novartis 16,898,050 2.9Samsung Electronics (Preference Shares) 16,120,729 2.8Oracle 15,698,567 2.7Banco Bradesco 15,503,440 2.7Taiwan Semiconductor Manufacturing Company 15,030,032 2.6Henkel 14,600,834 2.5EOG Resources 14,427,767 2.5Sysmex 14,353,999 2.5
Expense ratios (5)
01 October 2018 to 31 March 2019: 0.15 %01 October 2017 to 31 March 2018: 0.15 %
Turnover ratios (6)
01 October 2018 to 31 March 2019: 32.49 %01 October 2017 to 31 March 2018: 37.16 %
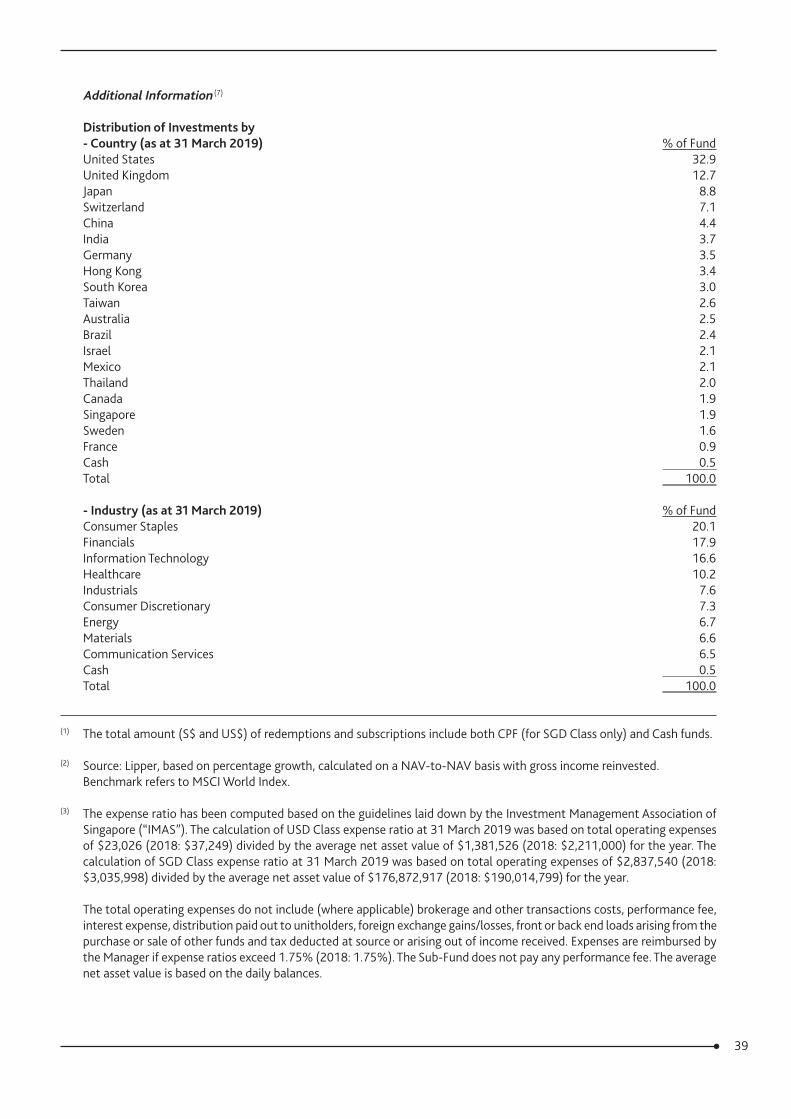
39
Additional Information (7)
Distribution of Investments by- Country (as at 31 March 2019) % of FundUnited States 32.9United Kingdom 12.7Japan 8.8Switzerland 7.1China 4.4India 3.7Germany 3.5Hong Kong 3.4South Korea 3.0Taiwan 2.6Australia 2.5Brazil 2.4Israel 2.1Mexico 2.1Thailand 2.0Canada 1.9Singapore 1.9Sweden 1.6France 0.9Cash 0.5Total 100.0
- Industry (as at 31 March 2019) % of FundConsumer Staples 20.1Financials 17.9Information Technology 16.6Healthcare 10.2Industrials 7.6Consumer Discretionary 7.3Energy 6.7Materials 6.6Communication Services 6.5Cash 0.5Total 100.0
(1) The total amount (S$ and US$) of redemptions and subscriptions include both CPF (for SGD Class only) and Cash funds.
(2) Source: Lipper, based on percentage growth, calculated on a NAV-to-NAV basis with gross income reinvested. Benchmark refers to MSCI World Index.
(3) The expense ratio has been computed based on the guidelines laid down by the Investment Management Association of Singapore (“IMAS”). The calculation of USD Class expense ratio at 31 March 2019 was based on total operating expenses of $23,026 (2018: $37,249) divided by the average net asset value of $1,381,526 (2018: $2,211,000) for the year. The calculation of SGD Class expense ratio at 31 March 2019 was based on total operating expenses of $2,837,540 (2018: $3,035,998) divided by the average net asset value of $176,872,917 (2018: $190,014,799) for the year.
The total operating expenses do not include (where applicable) brokerage and other transactions costs, performance fee, interest expense, distribution paid out to unitholders, foreign exchange gains/losses, front or back end loads arising from the purchase or sale of other funds and tax deducted at source or arising out of income received. Expenses are reimbursed by the Manager if expense ratios exceed 1.75% (2018: 1.75%). The Sub-Fund does not pay any performance fee. The average net asset value is based on the daily balances.
40
(4) The portfolio turnover ratio is calculated in accordance with the formula stated in the Code on Collective Investment Schemes. The calculation of the portfolio turnover ratio was based on the lower of the total value of purchases or sales of the underlying investments, being purchases of $12,941,182 (2018: purchases of $9,423,532) divided by the average daily net asset value of $174,013,760 (2018: $190,830,316).
(5) The underlying fund’s expense ratio is based on the latest available semi-annual/annual report of Aberdeen Standard SICAV I World Equity Fund. It does not include (where applicable) brokerage and other transaction costs, interest expense, foreign exchange gains/losses, front or back end loads arising from the purchase or sale of other funds and tax deducted at source or arising out of income received.
(6) The underlying fund's turnover ratio is calculated in accordance with the formula stated in the Code on Collective Investment Schemes. The calculation of the portfolio turnover ratio was based on the lower of the total value of purchases or sales of the underlying investments, being purchases of $150,057,205 (2018: purchases of $244,494,461) divided by the average daily net asset value of $461,811,820 (2018: $657,907,377).
(7) Figures may not always sum to 100 due to rounding.
(8) With effect from 11 February 2019, the name of the underlying fund will be changed from Aberdeen Global - World Equity Fund to Aberdeen Standard SICAV I World Equity Fund.
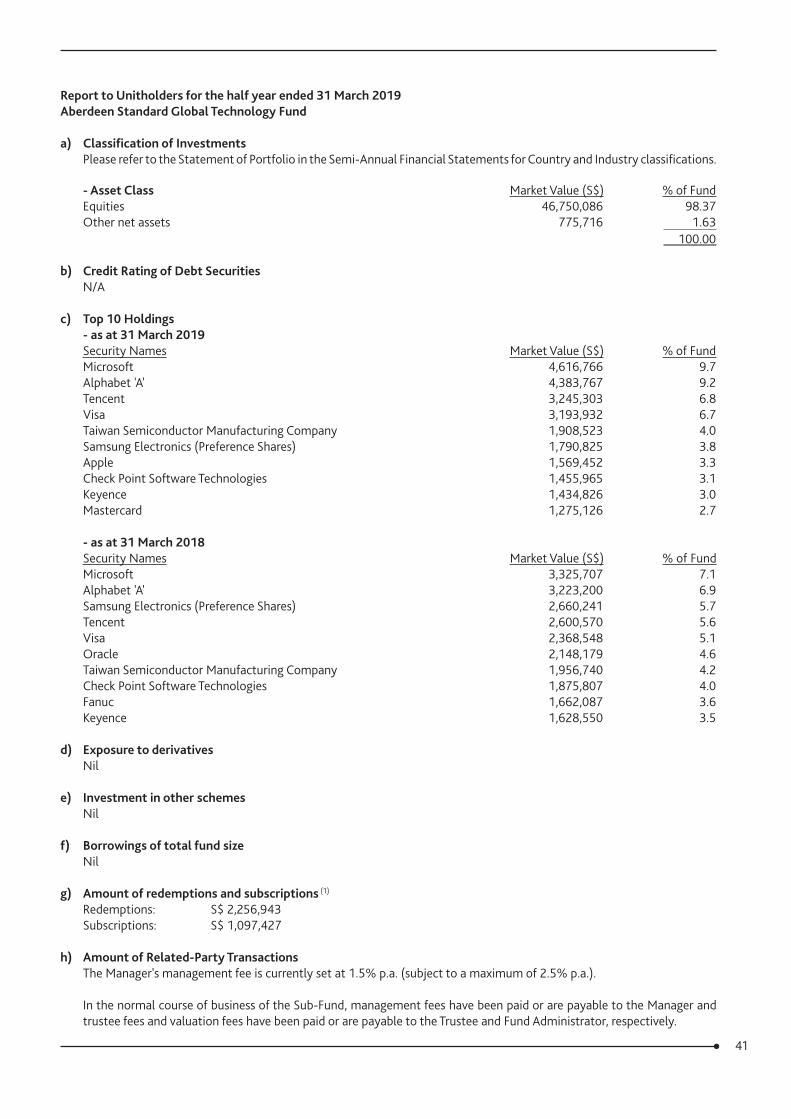
41
Report to Unitholders for the half year ended 31 March 2019Aberdeen Standard Global Technology Fund
a) Classification of InvestmentsPlease refer to the Statement of Portfolio in the Semi-Annual Financial Statements for Country and Industry classifications.
- Asset Class Market Value (S$) % of FundEquities 46,750,086 98.37Other net assets 775,716 1.63 100.00
b) Credit Rating of Debt SecuritiesN/A
c) Top 10 Holdings- as at 31 March 2019Security Names Market Value (S$) % of FundMicrosoft 4,616,766 9.7Alphabet 'A' 4,383,767 9.2Tencent 3,245,303 6.8Visa 3,193,932 6.7Taiwan Semiconductor Manufacturing Company 1,908,523 4.0Samsung Electronics (Preference Shares) 1,790,825 3.8Apple 1,569,452 3.3Check Point Software Technologies 1,455,965 3.1Keyence 1,434,826 3.0Mastercard 1,275,126 2.7
- as at 31 March 2018Security Names Market Value (S$) % of FundMicrosoft 3,325,707 7.1Alphabet 'A' 3,223,200 6.9Samsung Electronics (Preference Shares) 2,660,241 5.7Tencent 2,600,570 5.6Visa 2,368,548 5.1Oracle 2,148,179 4.6Taiwan Semiconductor Manufacturing Company 1,956,740 4.2Check Point Software Technologies 1,875,807 4.0Fanuc 1,662,087 3.6Keyence 1,628,550 3.5
d) Exposure to derivativesNil
e) Investment in other schemesNil
f) Borrowings of total fund sizeNil
g) Amount of redemptions and subscriptions (1)
Redemptions: S$ 2,256,943Subscriptions: S$ 1,097,427
h) Amount of Related-Party TransactionsThe Manager's management fee is currently set at 1.5% p.a. (subject to a maximum of 2.5% p.a.).
In the normal course of business of the Sub-Fund, management fees have been paid or are payable to the Manager and trustee fees and valuation fees have been paid or are payable to the Trustee and Fund Administrator, respectively.
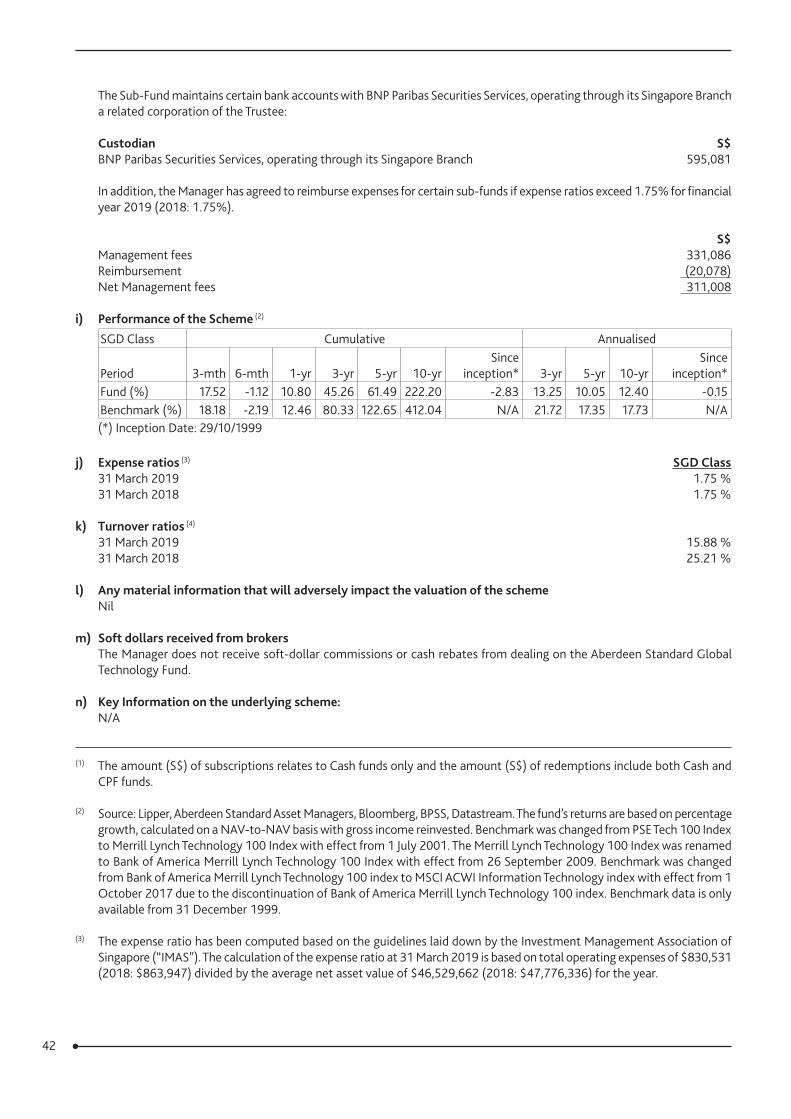
42
The Sub-Fund maintains certain bank accounts with BNP Paribas Securities Services, operating through its Singapore Branch a related corporation of the Trustee:
Custodian S$BNP Paribas Securities Services, operating through its Singapore Branch 595,081
In addition, the Manager has agreed to reimburse expenses for certain sub-funds if expense ratios exceed 1.75% for financial year 2019 (2018: 1.75%).
S$Management fees 331,086Reimbursement (20,078)Net Management fees 311,008
i) Performance of the Scheme (2)
SGD Class Cumulative Annualised
Period 3-mth 6-mth 1-yr 3-yr 5-yr 10-yrSince
inception* 3-yr 5-yr 10-yrSince
inception*Fund (%) 17.52 -1.12 10.80 45.26 61.49 222.20 -2.83 13.25 10.05 12.40 -0.15Benchmark (%) 18.18 -2.19 12.46 80.33 122.65 412.04 N/A 21.72 17.35 17.73 N/A(*) Inception Date: 29/10/1999
j) Expense ratios (3) SGD Class 31 March 2019 1.75 % 31 March 2018 1.75 %
k) Turnover ratios (4)
31 March 2019 15.88 % 31 March 2018 25.21 %
l) Any material information that will adversely impact the valuation of the schemeNil
m) Soft dollars received from brokersThe Manager does not receive soft-dollar commissions or cash rebates from dealing on the Aberdeen Standard Global Technology Fund.
n) Key Information on the underlying scheme:N/A
(1) The amount (S$) of subscriptions relates to Cash funds only and the amount (S$) of redemptions include both Cash and CPF funds.
(2) Source: Lipper, Aberdeen Standard Asset Managers, Bloomberg, BPSS, Datastream. The fund’s returns are based on percentage growth, calculated on a NAV-to-NAV basis with gross income reinvested. Benchmark was changed from PSE Tech 100 Index to Merrill Lynch Technology 100 Index with effect from 1 July 2001. The Merrill Lynch Technology 100 Index was renamed to Bank of America Merrill Lynch Technology 100 Index with effect from 26 September 2009. Benchmark was changed from Bank of America Merrill Lynch Technology 100 index to MSCI ACWI Information Technology index with effect from 1 October 2017 due to the discontinuation of Bank of America Merrill Lynch Technology 100 index. Benchmark data is only available from 31 December 1999.
(3) The expense ratio has been computed based on the guidelines laid down by the Investment Management Association of Singapore (“IMAS”). The calculation of the expense ratio at 31 March 2019 is based on total operating expenses of $830,531 (2018: $863,947) divided by the average net asset value of $46,529,662 (2018: $47,776,336) for the year.
43
The total operating expenses do not include (where applicable) brokerage and other transactions costs, performance fee, interest expense, distribution paid out to unitholders, foreign exchange gains/losses, front or back end loads arising from the purchase or sale of other funds and tax deducted at source or arising out of income received. Expenses are reimbursed by the Manager if expense ratios exceed 1.75% (2018: 1.75%). The Sub-Fund does not pay any performance fee. The average net asset value is based on the daily balances.
(4) The portfolio turnover ratio is calculated in accordance with the formula stated in the Code on Collective Investment Schemes. The calculation of the portfolio turnover ratio was based on the lower of the total value of purchases or sales of the underlying investments, being purchases of $7,046,646 (2018: purchases of $12,241,414) divided by the average daily net asset value of $44,367,130 (2018: $48,554,111).
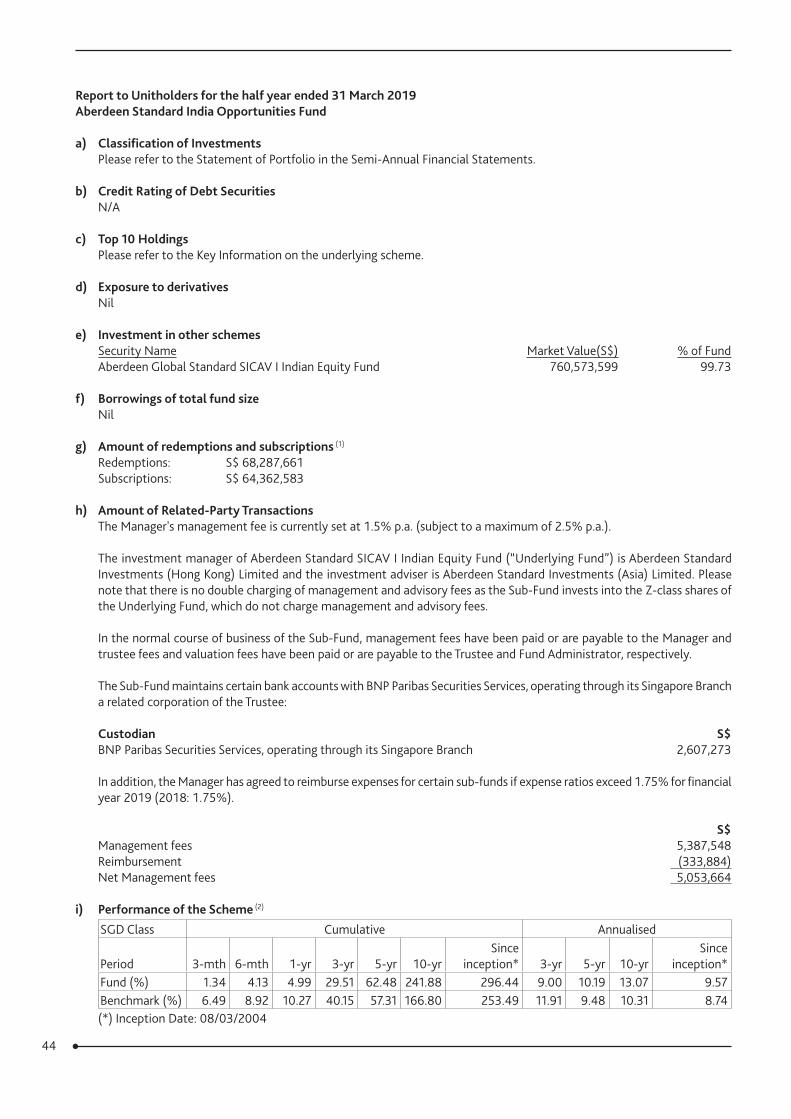
44
Report to Unitholders for the half year ended 31 March 2019 Aberdeen Standard India Opportunities Fund
a) Classification of InvestmentsPlease refer to the Statement of Portfolio in the Semi-Annual Financial Statements.
b) Credit Rating of Debt SecuritiesN/A
c) Top 10 HoldingsPlease refer to the Key Information on the underlying scheme.
d) Exposure to derivativesNil
e) Investment in other schemesSecurity Name Market Value(S$) % of FundAberdeen Global Standard SICAV I Indian Equity Fund 760,573,599 99.73
f) Borrowings of total fund sizeNil
g) Amount of redemptions and subscriptions (1)
Redemptions: S$ 68,287,661 Subscriptions: S$ 64,362,583
h) Amount of Related-Party TransactionsThe Manager's management fee is currently set at 1.5% p.a. (subject to a maximum of 2.5% p.a.).
The investment manager of Aberdeen Standard SICAV I Indian Equity Fund (“Underlying Fund”) is Aberdeen Standard Investments (Hong Kong) Limited and the investment adviser is Aberdeen Standard Investments (Asia) Limited. Please note that there is no double charging of management and advisory fees as the Sub-Fund invests into the Z-class shares of the Underlying Fund, which do not charge management and advisory fees.
In the normal course of business of the Sub-Fund, management fees have been paid or are payable to the Manager and trustee fees and valuation fees have been paid or are payable to the Trustee and Fund Administrator, respectively.
The Sub-Fund maintains certain bank accounts with BNP Paribas Securities Services, operating through its Singapore Branch a related corporation of the Trustee:
Custodian S$BNP Paribas Securities Services, operating through its Singapore Branch 2,607,273
In addition, the Manager has agreed to reimburse expenses for certain sub-funds if expense ratios exceed 1.75% for financial year 2019 (2018: 1.75%).
S$Management fees 5,387,548Reimbursement (333,884)Net Management fees 5,053,664
i) Performance of the Scheme (2)
SGD Class Cumulative Annualised
Period 3-mth 6-mth 1-yr 3-yr 5-yr 10-yrSince
inception* 3-yr 5-yr 10-yrSince
inception*Fund (%) 1.34 4.13 4.99 29.51 62.48 241.88 296.44 9.00 10.19 13.07 9.57Benchmark (%) 6.49 8.92 10.27 40.15 57.31 166.80 253.49 11.91 9.48 10.31 8.74(*) Inception Date: 08/03/2004
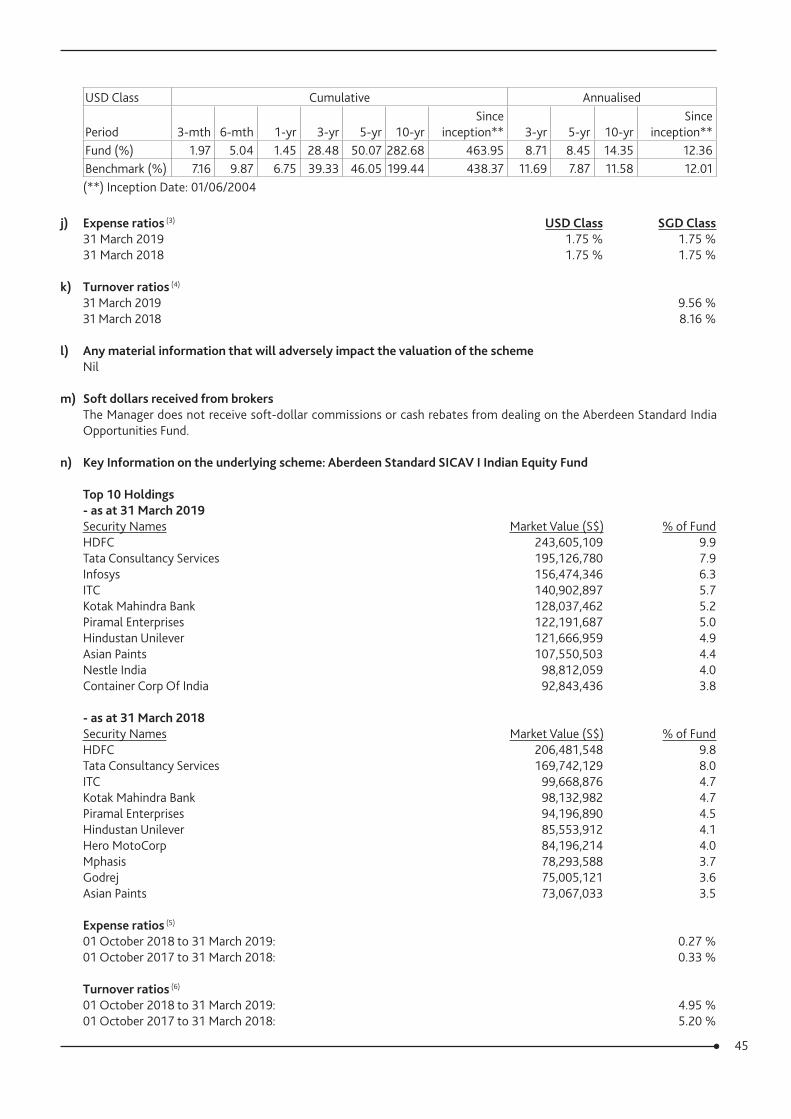
45
USD Class Cumulative Annualised
Period 3-mth 6-mth 1-yr 3-yr 5-yr 10-yrSince
inception** 3-yr 5-yr 10-yrSince
inception**Fund (%) 1.97 5.04 1.45 28.48 50.07 282.68 463.95 8.71 8.45 14.35 12.36Benchmark (%) 7.16 9.87 6.75 39.33 46.05 199.44 438.37 11.69 7.87 11.58 12.01(**) Inception Date: 01/06/2004
j) Expense ratios (3) USD Class SGD Class31 March 2019 1.75 % 1.75 %31 March 2018 1.75 % 1.75 %
k) Turnover ratios (4)
31 March 2019 9.56 %31 March 2018 8.16 %
l) Any material information that will adversely impact the valuation of the schemeNil
m) Soft dollars received from brokersThe Manager does not receive soft-dollar commissions or cash rebates from dealing on the Aberdeen Standard India Opportunities Fund.
n) Key Information on the underlying scheme: Aberdeen Standard SICAV I Indian Equity Fund
Top 10 Holdings - as at 31 March 2019Security Names Market Value (S$) % of FundHDFC 243,605,109 9.9Tata Consultancy Services 195,126,780 7.9Infosys 156,474,346 6.3ITC 140,902,897 5.7Kotak Mahindra Bank 128,037,462 5.2Piramal Enterprises 122,191,687 5.0Hindustan Unilever 121,666,959 4.9Asian Paints 107,550,503 4.4Nestle India 98,812,059 4.0Container Corp Of India 92,843,436 3.8
- as at 31 March 2018Security Names Market Value (S$) % of FundHDFC 206,481,548 9.8Tata Consultancy Services 169,742,129 8.0ITC 99,668,876 4.7Kotak Mahindra Bank 98,132,982 4.7Piramal Enterprises 94,196,890 4.5Hindustan Unilever 85,553,912 4.1Hero MotoCorp 84,196,214 4.0Mphasis 78,293,588 3.7Godrej 75,005,121 3.6Asian Paints 73,067,033 3.5
Expense ratios (5)
01 October 2018 to 31 March 2019: 0.27 %01 October 2017 to 31 March 2018: 0.33 %
Turnover ratios (6)
01 October 2018 to 31 March 2019: 4.95 %01 October 2017 to 31 March 2018: 5.20 %
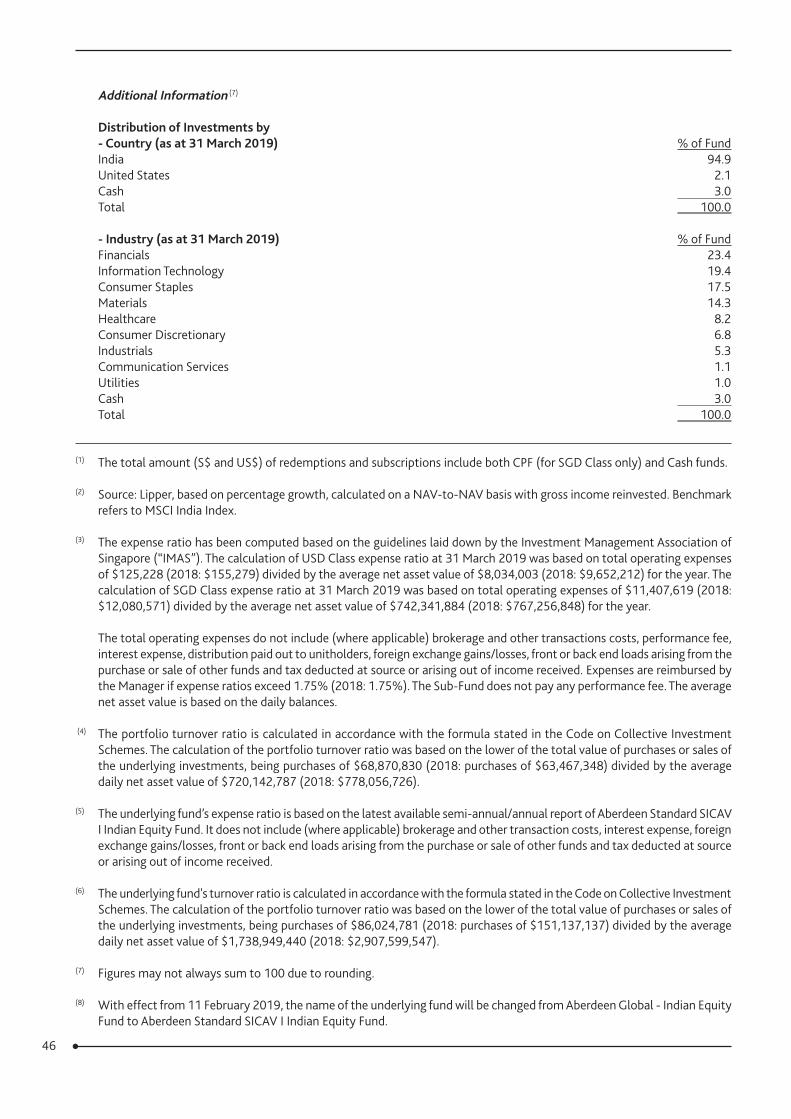
46
Additional Information (7)
Distribution of Investments by- Country (as at 31 March 2019) % of FundIndia 94.9United States 2.1Cash 3.0Total 100.0
- Industry (as at 31 March 2019) % of FundFinancials 23.4Information Technology 19.4Consumer Staples 17.5Materials 14.3Healthcare 8.2Consumer Discretionary 6.8Industrials 5.3Communication Services 1.1Utilities 1.0Cash 3.0Total 100.0
(1) The total amount (S$ and US$) of redemptions and subscriptions include both CPF (for SGD Class only) and Cash funds.
(2) Source: Lipper, based on percentage growth, calculated on a NAV-to-NAV basis with gross income reinvested. Benchmark refers to MSCI India Index.
(3) The expense ratio has been computed based on the guidelines laid down by the Investment Management Association of Singapore (“IMAS”). The calculation of USD Class expense ratio at 31 March 2019 was based on total operating expenses of $125,228 (2018: $155,279) divided by the average net asset value of $8,034,003 (2018: $9,652,212) for the year. The calculation of SGD Class expense ratio at 31 March 2019 was based on total operating expenses of $11,407,619 (2018: $12,080,571) divided by the average net asset value of $742,341,884 (2018: $767,256,848) for the year.
The total operating expenses do not include (where applicable) brokerage and other transactions costs, performance fee, interest expense, distribution paid out to unitholders, foreign exchange gains/losses, front or back end loads arising from the purchase or sale of other funds and tax deducted at source or arising out of income received. Expenses are reimbursed by the Manager if expense ratios exceed 1.75% (2018: 1.75%). The Sub-Fund does not pay any performance fee. The average net asset value is based on the daily balances.
(4) The portfolio turnover ratio is calculated in accordance with the formula stated in the Code on Collective Investment Schemes. The calculation of the portfolio turnover ratio was based on the lower of the total value of purchases or sales of the underlying investments, being purchases of $68,870,830 (2018: purchases of $63,467,348) divided by the average daily net asset value of $720,142,787 (2018: $778,056,726).
(5) The underlying fund’s expense ratio is based on the latest available semi-annual/annual report of Aberdeen Standard SICAV I Indian Equity Fund. It does not include (where applicable) brokerage and other transaction costs, interest expense, foreign exchange gains/losses, front or back end loads arising from the purchase or sale of other funds and tax deducted at source or arising out of income received.
(6) The underlying fund's turnover ratio is calculated in accordance with the formula stated in the Code on Collective Investment Schemes. The calculation of the portfolio turnover ratio was based on the lower of the total value of purchases or sales of the underlying investments, being purchases of $86,024,781 (2018: purchases of $151,137,137) divided by the average daily net asset value of $1,738,949,440 (2018: $2,907,599,547).
(7) Figures may not always sum to 100 due to rounding.
(8) With effect from 11 February 2019, the name of the underlying fund will be changed from Aberdeen Global - Indian Equity Fund to Aberdeen Standard SICAV I Indian Equity Fund.
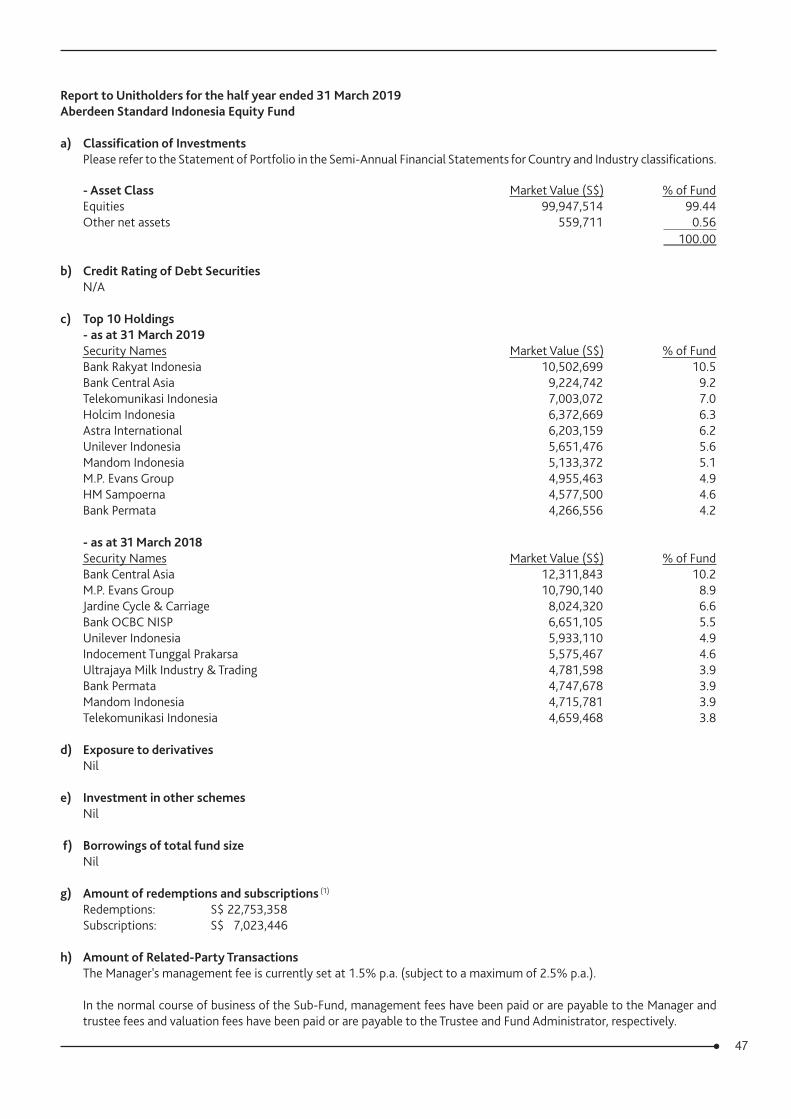
47
Report to Unitholders for the half year ended 31 March 2019 Aberdeen Standard Indonesia Equity Fund
a) Classification of InvestmentsPlease refer to the Statement of Portfolio in the Semi-Annual Financial Statements for Country and Industry classifications.
- Asset Class Market Value (S$) % of FundEquities 99,947,514 99.44Other net assets 559,711 0.56 100.00
b) Credit Rating of Debt SecuritiesN/A
c) Top 10 Holdings- as at 31 March 2019Security Names Market Value (S$) % of FundBank Rakyat Indonesia 10,502,699 10.5Bank Central Asia 9,224,742 9.2Telekomunikasi Indonesia 7,003,072 7.0Holcim Indonesia 6,372,669 6.3Astra International 6,203,159 6.2Unilever Indonesia 5,651,476 5.6Mandom Indonesia 5,133,372 5.1M.P. Evans Group 4,955,463 4.9HM Sampoerna 4,577,500 4.6Bank Permata 4,266,556 4.2
- as at 31 March 2018Security Names Market Value (S$) % of FundBank Central Asia 12,311,843 10.2M.P. Evans Group 10,790,140 8.9Jardine Cycle & Carriage 8,024,320 6.6Bank OCBC NISP 6,651,105 5.5Unilever Indonesia 5,933,110 4.9Indocement Tunggal Prakarsa 5,575,467 4.6Ultrajaya Milk Industry & Trading 4,781,598 3.9Bank Permata 4,747,678 3.9Mandom Indonesia 4,715,781 3.9Telekomunikasi Indonesia 4,659,468 3.8
d) Exposure to derivativesNil
e) Investment in other schemesNil
f) Borrowings of total fund sizeNil
g) Amount of redemptions and subscriptions (1)
Redemptions: S$ 22,753,358Subscriptions: S$ 7,023,446
h) Amount of Related-Party TransactionsThe Manager's management fee is currently set at 1.5% p.a. (subject to a maximum of 2.5% p.a.).
In the normal course of business of the Sub-Fund, management fees have been paid or are payable to the Manager and trustee fees and valuation fees have been paid or are payable to the Trustee and Fund Administrator, respectively.
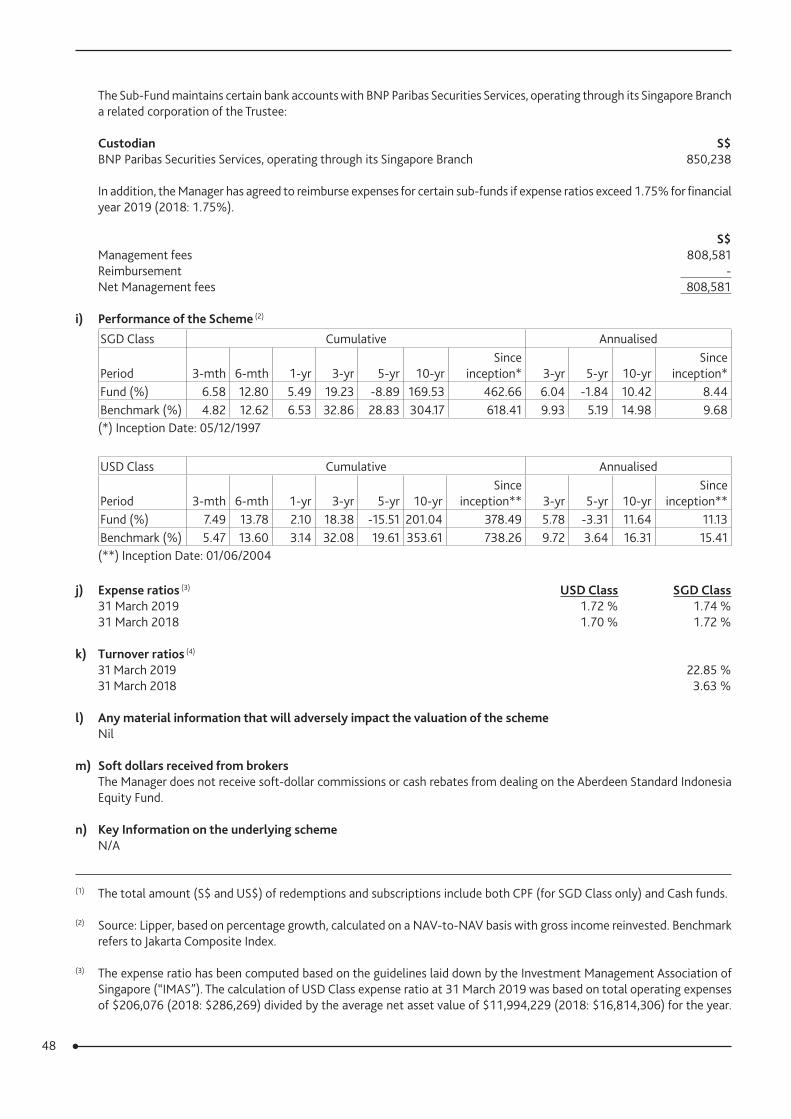
48
The Sub-Fund maintains certain bank accounts with BNP Paribas Securities Services, operating through its Singapore Branch a related corporation of the Trustee:
Custodian S$BNP Paribas Securities Services, operating through its Singapore Branch 850,238
In addition, the Manager has agreed to reimburse expenses for certain sub-funds if expense ratios exceed 1.75% for financial year 2019 (2018: 1.75%).
S$Management fees 808,581Reimbursement - Net Management fees 808,581
i) Performance of the Scheme (2)
SGD Class Cumulative Annualised
Period 3-mth 6-mth 1-yr 3-yr 5-yr 10-yrSince
inception* 3-yr 5-yr 10-yrSince
inception*Fund (%) 6.58 12.80 5.49 19.23 -8.89 169.53 462.66 6.04 -1.84 10.42 8.44Benchmark (%) 4.82 12.62 6.53 32.86 28.83 304.17 618.41 9.93 5.19 14.98 9.68(*) Inception Date: 05/12/1997
USD Class Cumulative Annualised
Period 3-mth 6-mth 1-yr 3-yr 5-yr 10-yrSince
inception** 3-yr 5-yr 10-yrSince
inception**Fund (%) 7.49 13.78 2.10 18.38 -15.51 201.04 378.49 5.78 -3.31 11.64 11.13Benchmark (%) 5.47 13.60 3.14 32.08 19.61 353.61 738.26 9.72 3.64 16.31 15.41(**) Inception Date: 01/06/2004
j) Expense ratios (3) USD Class SGD Class31 March 2019 1.72 % 1.74 %31 March 2018 1.70 % 1.72 %
k) Turnover ratios (4)
31 March 2019 22.85 %31 March 2018 3.63 %
l) Any material information that will adversely impact the valuation of the schemeNil
m) Soft dollars received from brokersThe Manager does not receive soft-dollar commissions or cash rebates from dealing on the Aberdeen Standard Indonesia Equity Fund.
n) Key Information on the underlying schemeN/A
(1) The total amount (S$ and US$) of redemptions and subscriptions include both CPF (for SGD Class only) and Cash funds.
(2) Source: Lipper, based on percentage growth, calculated on a NAV-to-NAV basis with gross income reinvested. Benchmark refers to Jakarta Composite Index.
(3) The expense ratio has been computed based on the guidelines laid down by the Investment Management Association of Singapore (“IMAS”). The calculation of USD Class expense ratio at 31 March 2019 was based on total operating expenses of $206,076 (2018: $286,269) divided by the average net asset value of $11,994,229 (2018: $16,814,306) for the year.
49
The calculation of SGD Class expense ratio at 31 March 2019 was based on total operating expenses of $1,728,317 (2018: $2,152,347) divided by the average net asset value of $99,541,156 (2018: $125,269,812) for the year.
The total operating expenses do not include (where applicable) brokerage and other transactions costs, performance fee, interest expense, distribution paid out to unitholders, foreign exchange gains/losses, front or back end loads arising from the purchase or sale of other funds and tax deducted at source or arising out of income received. Expenses are reimbursed by the Manager if expense ratios exceed 1.75% (2018: 1.75%). The Sub-Fund does not pay any performance fee. The average net asset value is based on the daily balances.
(4) The portfolio turnover ratio is calculated in accordance with the formula stated in the Code on Collective Investment Schemes. The calculation of the portfolio turnover ratio was based on the lower of the total value of purchases or sales of the underlying investments, being purchases of $24,680,867 (2018: purchases of $4,875,520) divided by the average daily net asset value of $108,027,045 (2018: $134,219,406).
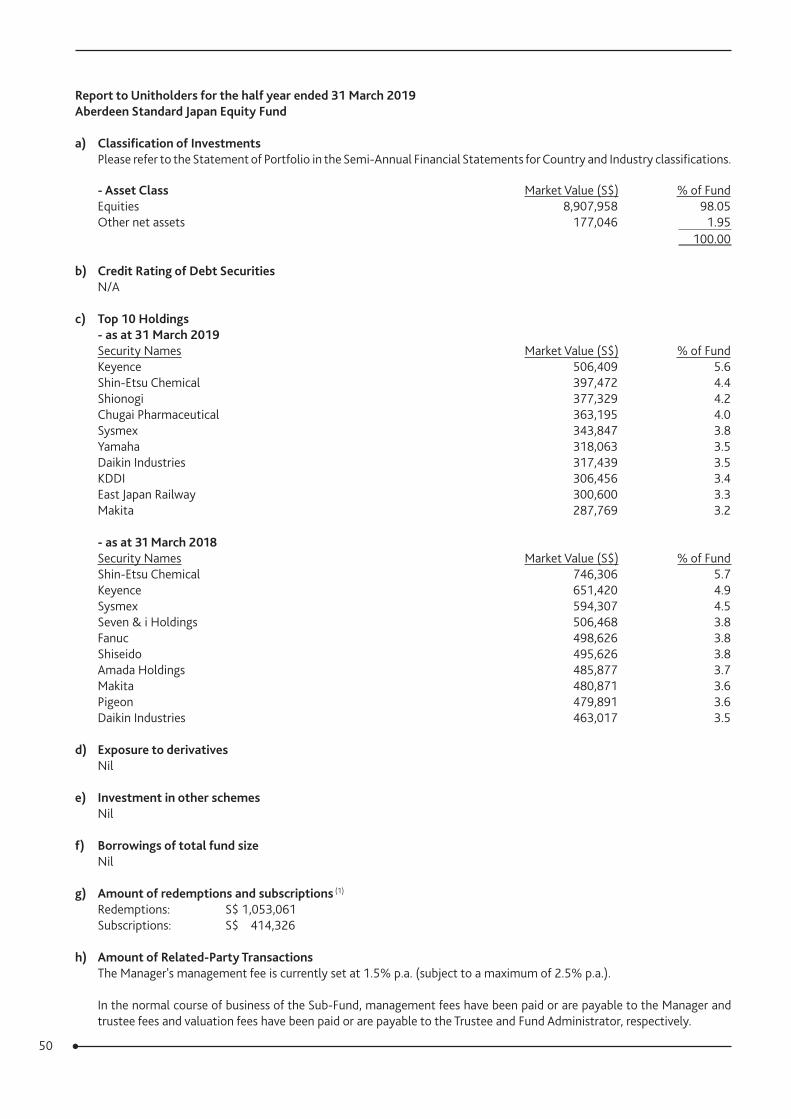
50
Report to Unitholders for the half year ended 31 March 2019Aberdeen Standard Japan Equity Fund
a) Classification of InvestmentsPlease refer to the Statement of Portfolio in the Semi-Annual Financial Statements for Country and Industry classifications.
- Asset Class Market Value (S$) % of FundEquities 8,907,958 98.05Other net assets 177,046 1.95 100.00
b) Credit Rating of Debt SecuritiesN/A
c) Top 10 Holdings- as at 31 March 2019Security Names Market Value (S$) % of FundKeyence 506,409 5.6Shin-Etsu Chemical 397,472 4.4Shionogi 377,329 4.2Chugai Pharmaceutical 363,195 4.0Sysmex 343,847 3.8Yamaha 318,063 3.5Daikin Industries 317,439 3.5KDDI 306,456 3.4East Japan Railway 300,600 3.3Makita 287,769 3.2
- as at 31 March 2018Security Names Market Value (S$) % of FundShin-Etsu Chemical 746,306 5.7Keyence 651,420 4.9Sysmex 594,307 4.5Seven & i Holdings 506,468 3.8Fanuc 498,626 3.8Shiseido 495,626 3.8Amada Holdings 485,877 3.7Makita 480,871 3.6Pigeon 479,891 3.6Daikin Industries 463,017 3.5
d) Exposure to derivativesNil
e) Investment in other schemesNil
f) Borrowings of total fund sizeNil
g) Amount of redemptions and subscriptions (1)
Redemptions: S$ 1,053,061Subscriptions: S$ 414,326
h) Amount of Related-Party TransactionsThe Manager's management fee is currently set at 1.5% p.a. (subject to a maximum of 2.5% p.a.).
In the normal course of business of the Sub-Fund, management fees have been paid or are payable to the Manager and trustee fees and valuation fees have been paid or are payable to the Trustee and Fund Administrator, respectively.
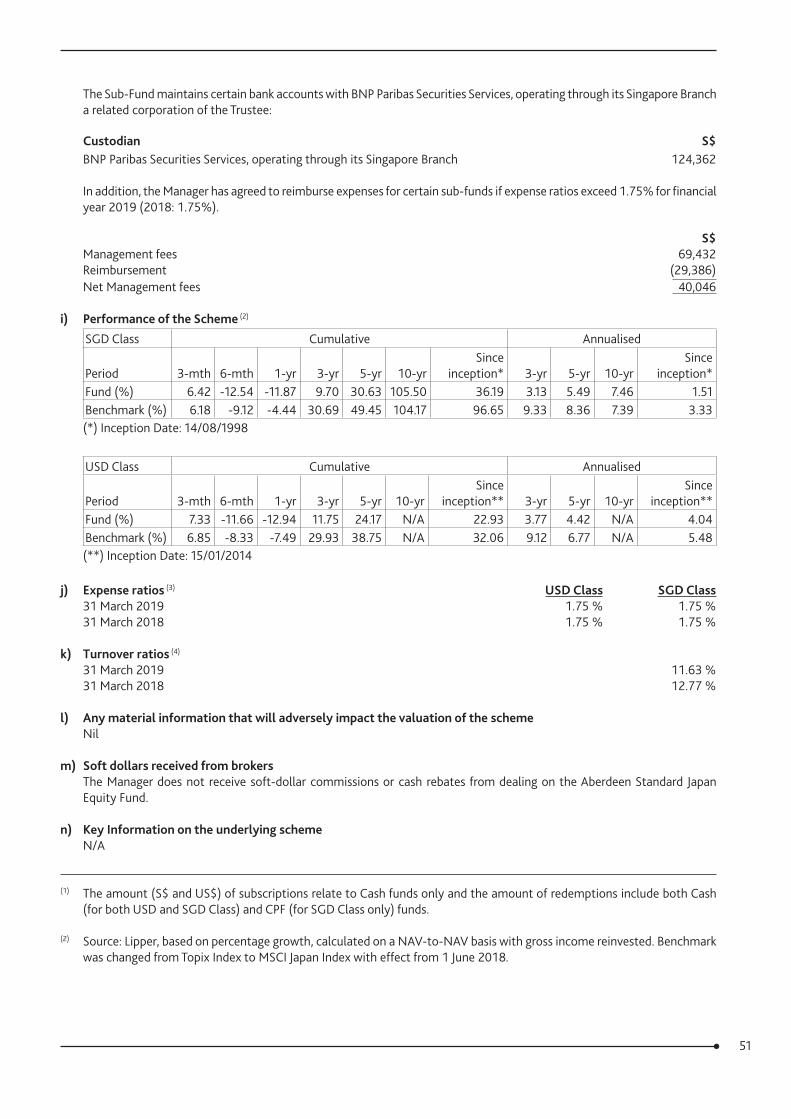
51
The Sub-Fund maintains certain bank accounts with BNP Paribas Securities Services, operating through its Singapore Branch a related corporation of the Trustee:
Custodian S$BNP Paribas Securities Services, operating through its Singapore Branch 124,362
In addition, the Manager has agreed to reimburse expenses for certain sub-funds if expense ratios exceed 1.75% for financial year 2019 (2018: 1.75%).
S$Management fees 69,432Reimbursement (29,386)Net Management fees 40,046
i) Performance of the Scheme (2)
SGD Class Cumulative Annualised
Period 3-mth 6-mth 1-yr 3-yr 5-yr 10-yrSince
inception* 3-yr 5-yr 10-yrSince
inception*Fund (%) 6.42 -12.54 -11.87 9.70 30.63 105.50 36.19 3.13 5.49 7.46 1.51Benchmark (%) 6.18 -9.12 -4.44 30.69 49.45 104.17 96.65 9.33 8.36 7.39 3.33(*) Inception Date: 14/08/1998
USD Class Cumulative Annualised
Period 3-mth 6-mth 1-yr 3-yr 5-yr 10-yrSince
inception** 3-yr 5-yr 10-yrSince
inception**Fund (%) 7.33 -11.66 -12.94 11.75 24.17 N/A 22.93 3.77 4.42 N/A 4.04Benchmark (%) 6.85 -8.33 -7.49 29.93 38.75 N/A 32.06 9.12 6.77 N/A 5.48(**) Inception Date: 15/01/2014
j) Expense ratios (3) USD Class SGD Class31 March 2019 1.75 % 1.75 %31 March 2018 1.75 % 1.75 %
k) Turnover ratios (4)
31 March 2019 11.63 %31 March 2018 12.77 %
l) Any material information that will adversely impact the valuation of the schemeNil
m) Soft dollars received from brokersThe Manager does not receive soft-dollar commissions or cash rebates from dealing on the Aberdeen Standard Japan Equity Fund.
n) Key Information on the underlying schemeN/A
(1) The amount (S$ and US$) of subscriptions relate to Cash funds only and the amount of redemptions include both Cash (for both USD and SGD Class) and CPF (for SGD Class only) funds.
(2) Source: Lipper, based on percentage growth, calculated on a NAV-to-NAV basis with gross income reinvested. Benchmark was changed from Topix Index to MSCI Japan Index with effect from 1 June 2018.
52
(3) The expense ratio has been computed based on the guidelines laid down by the Investment Management Association of Singapore (“IMAS”). The calculation of USD Class expense ratio at 31 March 2019 was based on total operating expenses of $817 (2018: $2,475) divided by the average net asset value of $41,461 (2018: $123,677) for the year. The calculation of SGD Class expense ratio at 31 March 2019 was based on total operating expenses of $217,564 (2018: $240,662) divided by the average net asset value of $10,995,969 (2018: $11,905,490) for the year.
The total operating expenses do not include (where applicable) brokerage and other transactions costs, performance fee, interest expense, distribution paid out to unitholders, foreign exchange gains/losses, front or back end loads arising from the purchase or sale of other funds and tax deducted at source or arising out of income received. Expenses are reimbursed by the Manager if expense ratios exceed 1.75% (2018: 1.75%). The Sub-Fund does not pay any performance fee. The average net asset value is based on the daily balances.
(4) The portfolio turnover ratio is calculated in accordance with the formula stated in the Code on Collective Investment Schemes. The calculation of the portfolio turnover ratio was based on the lower of the total value of purchases or sales of the underlying investments, being purchases of $1,085,568 (2018: sales of $1,587,509) divided by the average daily net asset value of $9,335,689 (2018: $12,434,464).
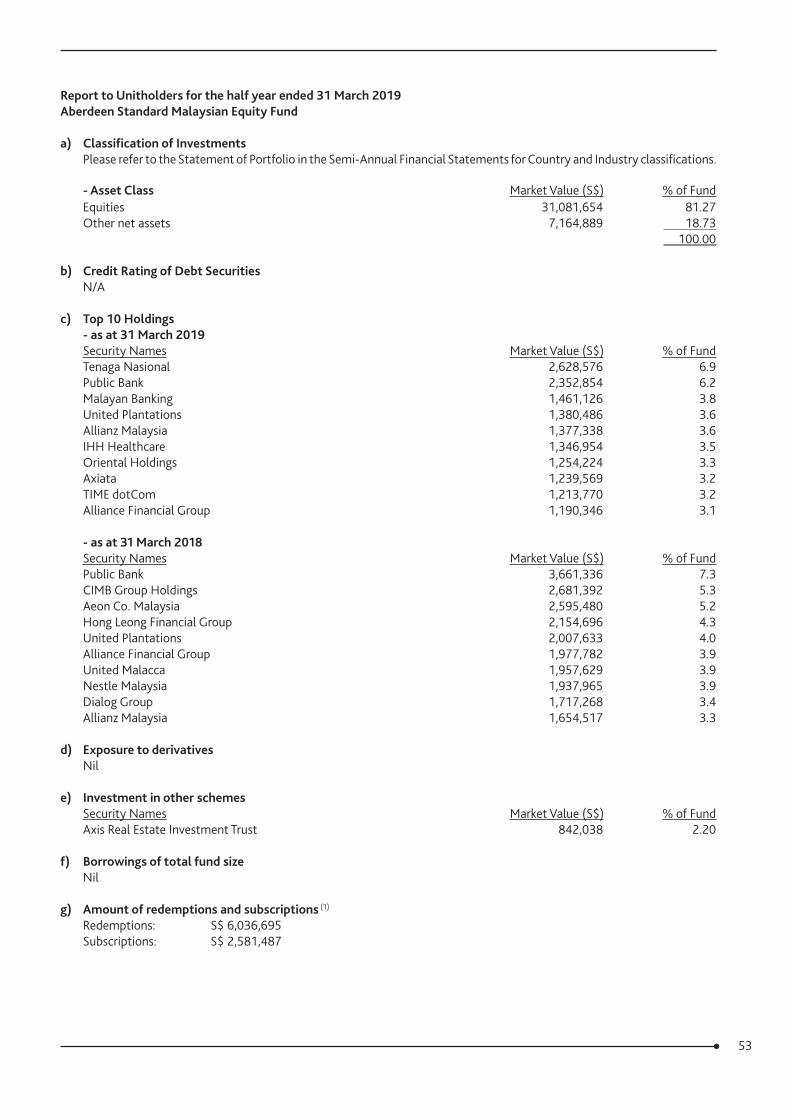
53
Report to Unitholders for the half year ended 31 March 2019Aberdeen Standard Malaysian Equity Fund
a) Classification of InvestmentsPlease refer to the Statement of Portfolio in the Semi-Annual Financial Statements for Country and Industry classifications.
- Asset Class Market Value (S$) % of FundEquities 31,081,654 81.27Other net assets 7,164,889 18.73 100.00
b) Credit Rating of Debt SecuritiesN/A
c) Top 10 Holdings- as at 31 March 2019Security Names Market Value (S$) % of FundTenaga Nasional 2,628,576 6.9Public Bank 2,352,854 6.2Malayan Banking 1,461,126 3.8United Plantations 1,380,486 3.6Allianz Malaysia 1,377,338 3.6IHH Healthcare 1,346,954 3.5Oriental Holdings 1,254,224 3.3Axiata 1,239,569 3.2TIME dotCom 1,213,770 3.2Alliance Financial Group 1,190,346 3.1
- as at 31 March 2018Security Names Market Value (S$) % of FundPublic Bank 3,661,336 7.3CIMB Group Holdings 2,681,392 5.3Aeon Co. Malaysia 2,595,480 5.2Hong Leong Financial Group 2,154,696 4.3United Plantations 2,007,633 4.0Alliance Financial Group 1,977,782 3.9United Malacca 1,957,629 3.9Nestle Malaysia 1,937,965 3.9Dialog Group 1,717,268 3.4Allianz Malaysia 1,654,517 3.3
d) Exposure to derivativesNil
e) Investment in other schemesSecurity Names Market Value (S$) % of FundAxis Real Estate Investment Trust 842,038 2.20
f) Borrowings of total fund sizeNil
g) Amount of redemptions and subscriptions (1)
Redemptions: S$ 6,036,695Subscriptions: S$ 2,581,487
54
h) Amount of Related-Party TransactionsThe Manager's management fee is currently set at 1.5% p.a. (subject to a maximum of 2.5% p.a.).
In the normal course of business of the Sub-Fund, management fees have been paid or are payable to the Manager and trustee fees and valuation fees have been paid or are payable to the Trustee and Fund Administrator, respectively.
The Sub-Fund maintains certain bank accounts with BNP Paribas Securities Services, operating through its Singapore Branch a related corporation of the Trustee:
Custodian S$BNP Paribas Securities Services, operating through its Singapore Branch 7,112,978
In addition, the Manager has agreed to reimburse expenses for certain sub-funds if expense ratios exceed 1.75% for financial year 2019 (2018: 1.75%). S$Management fees 290,846Reimbursement (19,380)Net Management fees 271,466
i) Performance of the Scheme (2)
SGD Class Cumulative Annualised
Period 3-mth 6-mth 1-yr 3-yr 5-yr 10-yrSince
inception* 3-yr 5-yr 10-yrSince
inception*Fund (%) 4.00 -4.62 -7.79 -4.32 -12.89 119.39 312.49 -1.46 -2.72 8.17 6.87Benchmark (%) -1.35 -6.78 -10.82 1.33 -10.17 108.08 328.62 0.44 -2.12 7.60 7.06(*) Inception Date: 05/12/1997
USD Class Cumulative Annualised
Period 3-mth 6-mth 1-yr 3-yr 5-yr 10-yrSince
inception** 3-yr 5-yr 10-yrSince
inception**Fund (%) 4.66 -3.80 -10.80 -5.17 -19.56 143.29 212.43 -1.75 -4.26 9.29 7.98Benchmark (%) -0.73 -5.96 -13.66 0.74 -16.60 133.53 223.41 0.25 -3.56 8.85 8.23(**) Inception Date: 01/06/2004
j) Expense ratios (3) USD Class SGD Class31 March 2019 1.75 % 1.75 %31 March 2018 1.75 % 1.75 %
k) Turnover ratios (4)
31 March 2019 18.73 %31 March 2018 14.72 %
l) Any material information that will adversely impact the valuation of the schemeNil
m) Soft dollars received from brokersThe Manager does not receive soft-dollar commissions or cash rebates from dealing on the Aberdeen Standard Malaysian Equity Fund.
n) Key Information on the underlying schemeN/A
(1) The total amount (S$ and US$) of redemptions and subscriptions include both CPF (for SGD Class only) and Cash funds.
(2) Source: Lipper, based on percentage growth, calculated on a NAV-to-NAV basis with gross income reinvested. Benchmark was renamed from KLSE Composite Index to FTSE Bursa Malaysia KLCI with effect from 6 July 2009.
55
(3) The expense ratio has been computed based on the guidelines laid down by the Investment Management Association of Singapore (“IMAS”). The calculation of the USD Class expense ratio at 31 March 2019 was based on total operating expenses of $11,170 (2018: $8,131) divided by the average net asset value of $608,414 (2018: $420,244) for the year. The calculation of the SGD Class expense ratio at 31 March 2019 was based on total operating expenses of $774,187 (2018: $873,546) divided by the average net asset value of $43,426,106 (2018: $48,744,129) for the year.
The total operating expenses do not include (where applicable) brokerage and other transactions costs, performance fee, interest expense, distribution paid out to unitholders, foreign exchange gains/losses, front or back end loads arising from the purchase or sale of other funds and tax deducted at source or arising out of income received. Expenses are reimbursed by the Manager if expense ratios exceed 1.75% (2018: 1.75%). The Sub-Fund does not pay any performance fee. The average net asset value is based on the daily balances.
(4) The portfolio turnover ratio is calculated in accordance with the formula stated in the Code on Collective Investment Schemes. The calculation of the portfolio turnover ratio was based on the lower of the total value of purchases or sales of the underlying investments, being purchases of $7,291,372 (2018: purchases of $7,035,296) divided by the average daily net asset value of $38,929,852 (2018: $47,790,901).
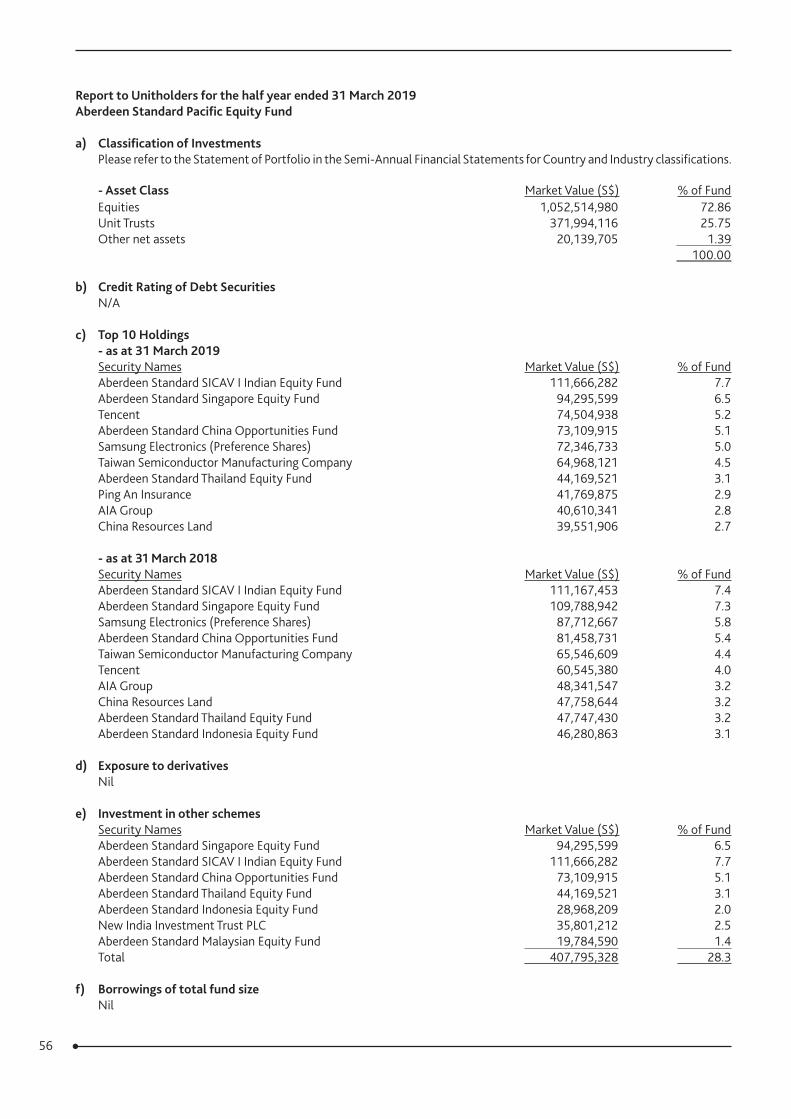
56
Report to Unitholders for the half year ended 31 March 2019 Aberdeen Standard Pacific Equity Fund
a) Classification of InvestmentsPlease refer to the Statement of Portfolio in the Semi-Annual Financial Statements for Country and Industry classifications.
- Asset Class Market Value (S$) % of FundEquities 1,052,514,980 72.86Unit Trusts 371,994,116 25.75Other net assets 20,139,705 1.39 100.00
b) Credit Rating of Debt SecuritiesN/A
c) Top 10 Holdings- as at 31 March 2019Security Names Market Value (S$) % of FundAberdeen Standard SICAV I Indian Equity Fund 111,666,282 7.7Aberdeen Standard Singapore Equity Fund 94,295,599 6.5Tencent 74,504,938 5.2Aberdeen Standard China Opportunities Fund 73,109,915 5.1Samsung Electronics (Preference Shares) 72,346,733 5.0Taiwan Semiconductor Manufacturing Company 64,968,121 4.5Aberdeen Standard Thailand Equity Fund 44,169,521 3.1Ping An Insurance 41,769,875 2.9AIA Group 40,610,341 2.8China Resources Land 39,551,906 2.7
- as at 31 March 2018Security Names Market Value (S$) % of FundAberdeen Standard SICAV I Indian Equity Fund 111,167,453 7.4Aberdeen Standard Singapore Equity Fund 109,788,942 7.3Samsung Electronics (Preference Shares) 87,712,667 5.8Aberdeen Standard China Opportunities Fund 81,458,731 5.4Taiwan Semiconductor Manufacturing Company 65,546,609 4.4Tencent 60,545,380 4.0AIA Group 48,341,547 3.2China Resources Land 47,758,644 3.2Aberdeen Standard Thailand Equity Fund 47,747,430 3.2Aberdeen Standard Indonesia Equity Fund 46,280,863 3.1
d) Exposure to derivativesNil
e) Investment in other schemesSecurity Names Market Value (S$) % of FundAberdeen Standard Singapore Equity Fund 94,295,599 6.5Aberdeen Standard SICAV I Indian Equity Fund 111,666,282 7.7Aberdeen Standard China Opportunities Fund 73,109,915 5.1Aberdeen Standard Thailand Equity Fund 44,169,521 3.1Aberdeen Standard Indonesia Equity Fund 28,968,209 2.0New India Investment Trust PLC 35,801,212 2.5Aberdeen Standard Malaysian Equity Fund 19,784,590 1.4Total 407,795,328 28.3
f) Borrowings of total fund sizeNil
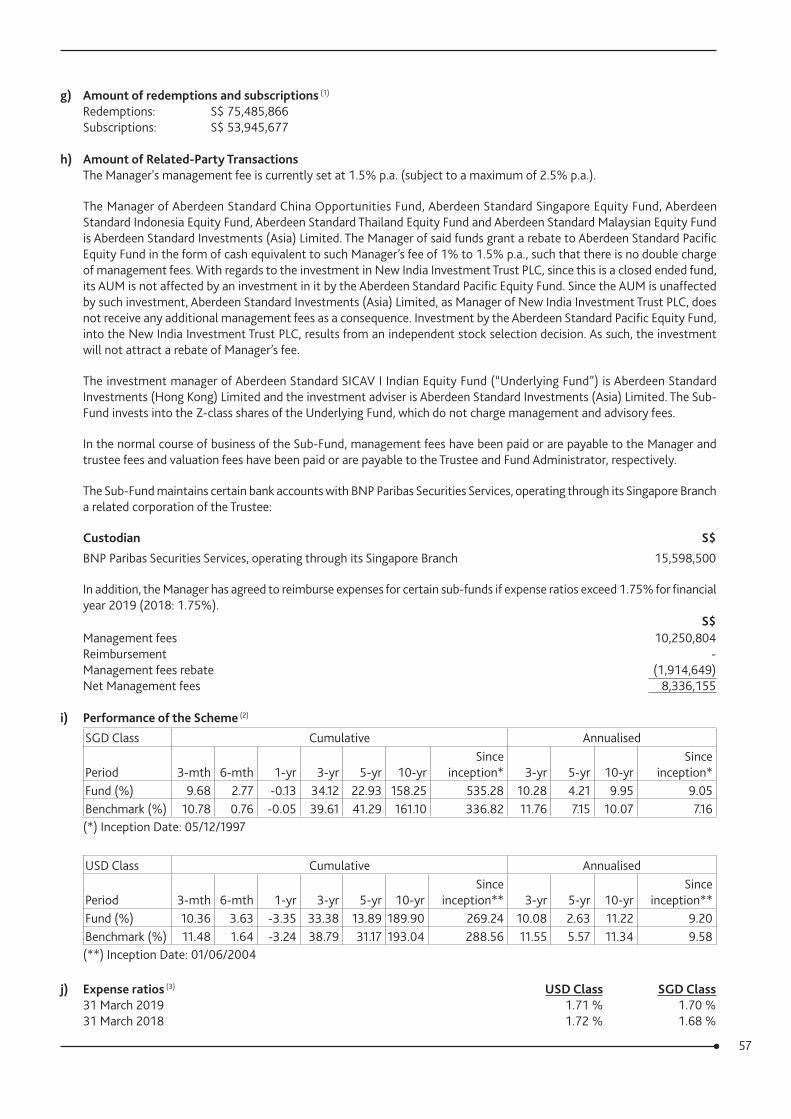
57
g) Amount of redemptions and subscriptions (1)
Redemptions: S$ 75,485,866 Subscriptions: S$ 53,945,677
h) Amount of Related-Party TransactionsThe Manager's management fee is currently set at 1.5% p.a. (subject to a maximum of 2.5% p.a.).
The Manager of Aberdeen Standard China Opportunities Fund, Aberdeen Standard Singapore Equity Fund, Aberdeen Standard Indonesia Equity Fund, Aberdeen Standard Thailand Equity Fund and Aberdeen Standard Malaysian Equity Fund is Aberdeen Standard Investments (Asia) Limited. The Manager of said funds grant a rebate to Aberdeen Standard Pacific Equity Fund in the form of cash equivalent to such Manager’s fee of 1% to 1.5% p.a., such that there is no double charge of management fees. With regards to the investment in New India Investment Trust PLC, since this is a closed ended fund, its AUM is not affected by an investment in it by the Aberdeen Standard Pacific Equity Fund. Since the AUM is unaffected by such investment, Aberdeen Standard Investments (Asia) Limited, as Manager of New India Investment Trust PLC, does not receive any additional management fees as a consequence. Investment by the Aberdeen Standard Pacific Equity Fund, into the New India Investment Trust PLC, results from an independent stock selection decision. As such, the investment will not attract a rebate of Manager’s fee.
The investment manager of Aberdeen Standard SICAV I Indian Equity Fund (“Underlying Fund”) is Aberdeen Standard Investments (Hong Kong) Limited and the investment adviser is Aberdeen Standard Investments (Asia) Limited. The Sub-Fund invests into the Z-class shares of the Underlying Fund, which do not charge management and advisory fees.
In the normal course of business of the Sub-Fund, management fees have been paid or are payable to the Manager and trustee fees and valuation fees have been paid or are payable to the Trustee and Fund Administrator, respectively.
The Sub-Fund maintains certain bank accounts with BNP Paribas Securities Services, operating through its Singapore Branch a related corporation of the Trustee:
Custodian S$BNP Paribas Securities Services, operating through its Singapore Branch 15,598,500
In addition, the Manager has agreed to reimburse expenses for certain sub-funds if expense ratios exceed 1.75% for financial year 2019 (2018: 1.75%). S$Management fees 10,250,804Reimbursement -Management fees rebate (1,914,649)Net Management fees 8,336,155
i) Performance of the Scheme (2)
SGD Class Cumulative Annualised
Period 3-mth 6-mth 1-yr 3-yr 5-yr 10-yrSince
inception* 3-yr 5-yr 10-yrSince
inception*Fund (%) 9.68 2.77 -0.13 34.12 22.93 158.25 535.28 10.28 4.21 9.95 9.05Benchmark (%) 10.78 0.76 -0.05 39.61 41.29 161.10 336.82 11.76 7.15 10.07 7.16(*) Inception Date: 05/12/1997
USD Class Cumulative Annualised
Period 3-mth 6-mth 1-yr 3-yr 5-yr 10-yrSince
inception** 3-yr 5-yr 10-yrSince
inception**Fund (%) 10.36 3.63 -3.35 33.38 13.89 189.90 269.24 10.08 2.63 11.22 9.20Benchmark (%) 11.48 1.64 -3.24 38.79 31.17 193.04 288.56 11.55 5.57 11.34 9.58(**) Inception Date: 01/06/2004
j) Expense ratios (3) USD Class SGD Class31 March 2019 1.71 % 1.70 %31 March 2018 1.72 % 1.68 %
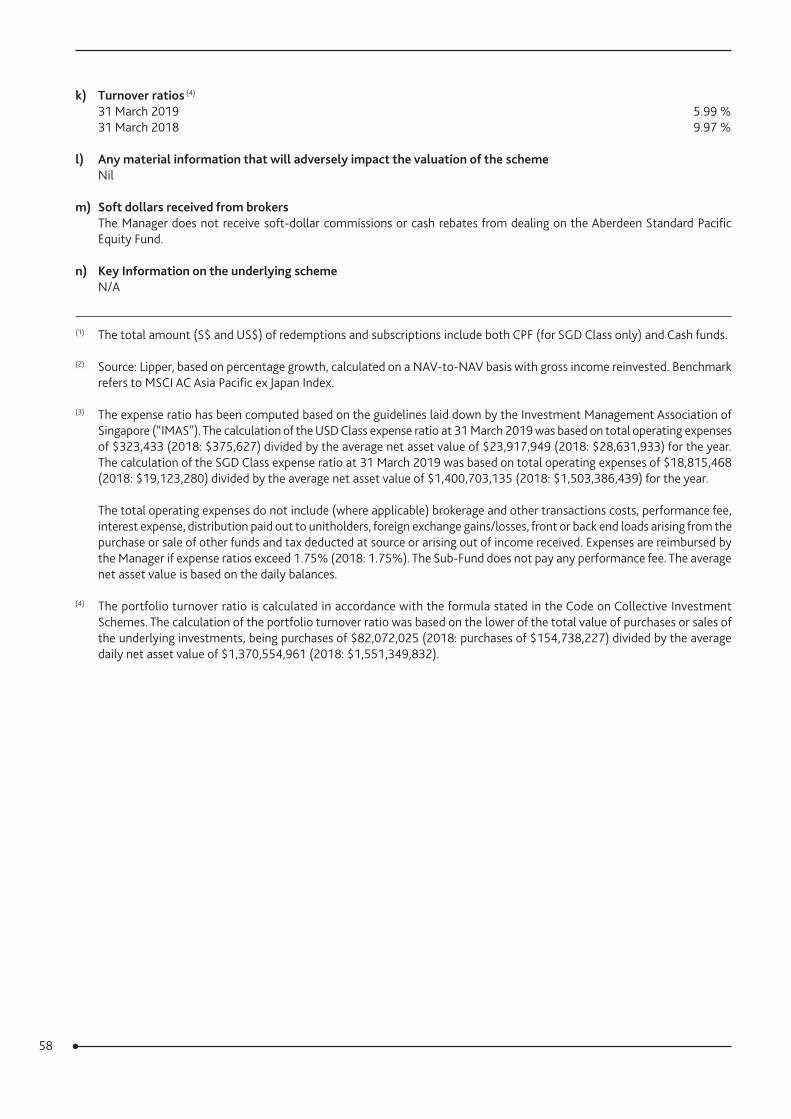
58
k) Turnover ratios (4)
31 March 2019 5.99 %31 March 2018 9.97 %
l) Any material information that will adversely impact the valuation of the schemeNil
m) Soft dollars received from brokersThe Manager does not receive soft-dollar commissions or cash rebates from dealing on the Aberdeen Standard Pacific Equity Fund.
n) Key Information on the underlying schemeN/A
(1) The total amount (S$ and US$) of redemptions and subscriptions include both CPF (for SGD Class only) and Cash funds.
(2) Source: Lipper, based on percentage growth, calculated on a NAV-to-NAV basis with gross income reinvested. Benchmark refers to MSCI AC Asia Pacific ex Japan Index.
(3) The expense ratio has been computed based on the guidelines laid down by the Investment Management Association of Singapore (“IMAS”). The calculation of the USD Class expense ratio at 31 March 2019 was based on total operating expenses of $323,433 (2018: $375,627) divided by the average net asset value of $23,917,949 (2018: $28,631,933) for the year. The calculation of the SGD Class expense ratio at 31 March 2019 was based on total operating expenses of $18,815,468 (2018: $19,123,280) divided by the average net asset value of $1,400,703,135 (2018: $1,503,386,439) for the year.
The total operating expenses do not include (where applicable) brokerage and other transactions costs, performance fee, interest expense, distribution paid out to unitholders, foreign exchange gains/losses, front or back end loads arising from the purchase or sale of other funds and tax deducted at source or arising out of income received. Expenses are reimbursed by the Manager if expense ratios exceed 1.75% (2018: 1.75%). The Sub-Fund does not pay any performance fee. The average net asset value is based on the daily balances.
(4) The portfolio turnover ratio is calculated in accordance with the formula stated in the Code on Collective Investment Schemes. The calculation of the portfolio turnover ratio was based on the lower of the total value of purchases or sales of the underlying investments, being purchases of $82,072,025 (2018: purchases of $154,738,227) divided by the average daily net asset value of $1,370,554,961 (2018: $1,551,349,832).

59
Report to Unitholders for the half year ended 31 March 2019 Aberdeen Standard Singapore Equity Fund
a) Classification of InvestmentsPlease refer to the Statement of Portfolio in the Semi-Annual Financial Statements for Country and Industry classifications.
- Asset Class Market Value (S$) % of FundEquities 790,973,855 98.79Other net assets 9,692,000 1.21 100.00
b) Credit Rating of Debt SecuritiesN/A
c) Top 10 Holdings- as at 31 March 2019Security Names Market Value (S$) % of FundDBS Group Holdings 119,029,968 14.9Oversea-Chinese Banking Corporation 110,967,139 13.9United Overseas Bank 61,821,474 7.7Singapore Telecommunications 47,996,437 6.0Jardine Strategic Holdings 44,732,875 5.6CapitaLand 42,271,745 5.3Venture Corporation 40,321,944 5.0Keppel Corporation 37,955,684 4.7SATS 29,433,600 3.7ComfortDelGro 25,496,600 3.2
- as at 31 March 2018Security Names Market Value (S$) % of FundDBS Group Holdings 98,449,862 11.6Oversea-Chinese Banking Corporation 96,869,830 11.4United Overseas Bank 65,978,192 7.8Venture Corporation 56,220,000 6.6Singapore Telecommunications 52,932,792 6.2Keppel Corporation 46,152,246 5.4City Developments 42,890,900 5.1CapitaLand 37,961,595 4.5Jardine Strategic Holdings 32,936,474 3.9Raffles Medical Group 30,415,938 3.6
d) Exposure to derivativesNil
e) Investment in other schemesSecurity Names Market Value (S$) % of FundKeppel REIT 13,538,941 1.7Mapletree Commercial Trust 8,505,000 1.1CDL Hospitality Trust 8,340,547 1.0Keppel DC REIT 7,950,000 1.0Total 38,334,488 4.8
f) Borrowings of total fund sizeNil
g) Amount of redemptions and subscriptions (1)
Redemptions: S$ 27,866,996Subscriptions: S$ 28,565,472
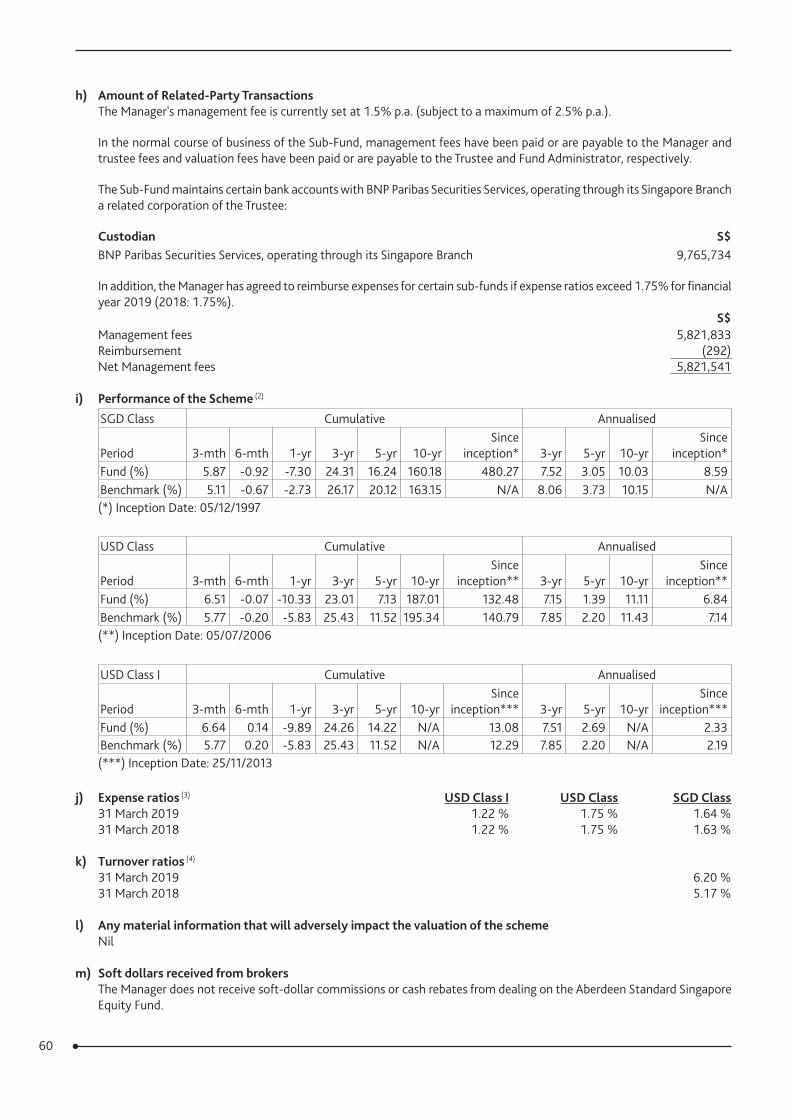
60
h) Amount of Related-Party TransactionsThe Manager's management fee is currently set at 1.5% p.a. (subject to a maximum of 2.5% p.a.).
In the normal course of business of the Sub-Fund, management fees have been paid or are payable to the Manager and trustee fees and valuation fees have been paid or are payable to the Trustee and Fund Administrator, respectively.
The Sub-Fund maintains certain bank accounts with BNP Paribas Securities Services, operating through its Singapore Branch a related corporation of the Trustee:
Custodian S$BNP Paribas Securities Services, operating through its Singapore Branch 9,765,734
In addition, the Manager has agreed to reimburse expenses for certain sub-funds if expense ratios exceed 1.75% for financial year 2019 (2018: 1.75%). S$Management fees 5,821,833Reimbursement (292)Net Management fees 5,821,541
i) Performance of the Scheme (2)
SGD Class Cumulative Annualised
Period 3-mth 6-mth 1-yr 3-yr 5-yr 10-yrSince
inception* 3-yr 5-yr 10-yrSince
inception*Fund (%) 5.87 -0.92 -7.30 24.31 16.24 160.18 480.27 7.52 3.05 10.03 8.59Benchmark (%) 5.11 -0.67 -2.73 26.17 20.12 163.15 N/A 8.06 3.73 10.15 N/A(*) Inception Date: 05/12/1997
USD Class Cumulative Annualised
Period 3-mth 6-mth 1-yr 3-yr 5-yr 10-yrSince
inception** 3-yr 5-yr 10-yrSince
inception**Fund (%) 6.51 -0.07 -10.33 23.01 7.13 187.01 132.48 7.15 1.39 11.11 6.84Benchmark (%) 5.77 -0.20 -5.83 25.43 11.52 195.34 140.79 7.85 2.20 11.43 7.14(**) Inception Date: 05/07/2006
USD Class I Cumulative Annualised
Period 3-mth 6-mth 1-yr 3-yr 5-yr 10-yrSince
inception*** 3-yr 5-yr 10-yrSince
inception***Fund (%) 6.64 0.14 -9.89 24.26 14.22 N/A 13.08 7.51 2.69 N/A 2.33Benchmark (%) 5.77 0.20 -5.83 25.43 11.52 N/A 12.29 7.85 2.20 N/A 2.19(***) Inception Date: 25/11/2013
j) Expense ratios (3) USD Class I USD Class SGD Class31 March 2019 1.22 % 1.75 % 1.64 %31 March 2018 1.22 % 1.75 % 1.63 %
k) Turnover ratios (4)
31 March 2019 6.20 %31 March 2018 5.17 %
l) Any material information that will adversely impact the valuation of the schemeNil
m) Soft dollars received from brokersThe Manager does not receive soft-dollar commissions or cash rebates from dealing on the Aberdeen Standard Singapore Equity Fund.
61
n) Key Information on the underlying schemeN/A
(1) The total amount (S$ and US$) of redemptions and subscriptions include both CPF (for SGD Class only) and Cash funds.
(2) Source: Lipper based on percentage growth; and calculated on a NAV-to-NAV basis with gross income reinvested. Benchmark refers to Straits Times Index. Benchmark data is only available from 31 August 1999 following the takeover of index calculation by FTSE on 10 January 2008.
(3) The expense ratio has been computed based on the guidelines laid down by the Investment Management Association of Singapore (“IMAS”). The calculation of the USD Class I expense ratio at 31 March 2019 was based on operating expenses of $1,164 (2018: $1,181) divided by the average net asset value of $95,305 (2018: $96,725) for the year. The calculation of the USD Class expense ratio at 31 March 2019 was based on total operating expenses of $17,335 (2018: $20,401) divided by the average net asset value of $976,911 (2018: $1,150,559) for the year. The calculation of the SGD Class expense ratio at 31 March 2019 was based on total operating expenses of $13,059,306 (2018: $13,644,839) divided by the average net asset value of $798,109,624 (2018: $836,516,501) for the year.
The total operating expenses do not include (where applicable) brokerage and other transactions costs, performance fee, interest expense, distribution paid out to unitholders, foreign exchange gains/losses, front or back end loads arising from the purchase or sale of other funds and tax deducted at source or arising out of income received. Expenses are reimbursed by the Manager if expense ratios exceed 1.75% (2018: 1.75%). The Sub-Fund does not pay any performance fee. The average net asset value is based on the daily balances.
(4) The portfolio turnover ratio is calculated in accordance with the formula stated in the Code on Collective Investment Schemes. The calculation of the portfolio turnover ratio was based on the lower of the total value of purchases or sales of the underlying investments, being sales of $48,295,825 (2018: purchases of $43,751,393) divided by the average daily net asset value of $778,526,595 (2018: $846,309,577).
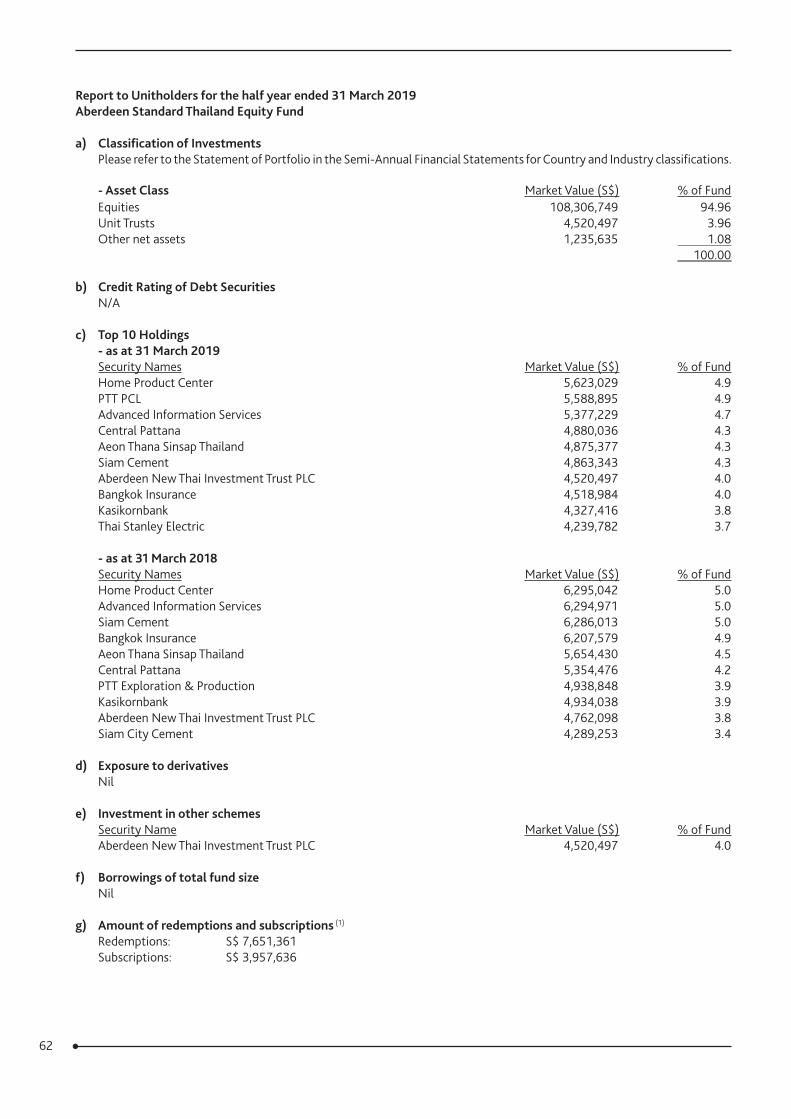
62
Report to Unitholders for the half year ended 31 March 2019Aberdeen Standard Thailand Equity Fund
a) Classification of InvestmentsPlease refer to the Statement of Portfolio in the Semi-Annual Financial Statements for Country and Industry classifications.
- Asset Class Market Value (S$) % of FundEquities 108,306,749 94.96Unit Trusts 4,520,497 3.96Other net assets 1,235,635 1.08 100.00
b) Credit Rating of Debt SecuritiesN/A
c) Top 10 Holdings- as at 31 March 2019Security Names Market Value (S$) % of FundHome Product Center 5,623,029 4.9PTT PCL 5,588,895 4.9Advanced Information Services 5,377,229 4.7Central Pattana 4,880,036 4.3Aeon Thana Sinsap Thailand 4,875,377 4.3Siam Cement 4,863,343 4.3Aberdeen New Thai Investment Trust PLC 4,520,497 4.0Bangkok Insurance 4,518,984 4.0Kasikornbank 4,327,416 3.8Thai Stanley Electric 4,239,782 3.7
- as at 31 March 2018Security Names Market Value (S$) % of FundHome Product Center 6,295,042 5.0Advanced Information Services 6,294,971 5.0Siam Cement 6,286,013 5.0Bangkok Insurance 6,207,579 4.9Aeon Thana Sinsap Thailand 5,654,430 4.5Central Pattana 5,354,476 4.2PTT Exploration & Production 4,938,848 3.9Kasikornbank 4,934,038 3.9Aberdeen New Thai Investment Trust PLC 4,762,098 3.8Siam City Cement 4,289,253 3.4
d) Exposure to derivativesNil
e) Investment in other schemesSecurity Name Market Value (S$) % of FundAberdeen New Thai Investment Trust PLC 4,520,497 4.0
f) Borrowings of total fund sizeNil
g) Amount of redemptions and subscriptions (1)
Redemptions: S$ 7,651,361Subscriptions: S$ 3,957,636
63
h) Amount of Related-Party TransactionsThe Manager's management fee is currently set at 1.5% p.a. (subject to a maximum of 2.5% p.a.).
The Manager of Aberdeen New Thai Investment Trust PLC is Aberdeen Standard Investments (Hong Kong) Limited and the delegated investment manager is Aberdeen Standard Investments (Asia) Limited. With regards to the investment in Aberdeen New Thai Investment Trust PLC, since this is a closed ended fund, its AUM is not affected by an investment in it by the Aberdeen Standard Thailand Equity Fund. Since the AUM is unaffected by such investment, Aberdeen Standard Investments (Asia) Limited, as delegated investment manager of Aberdeen New Thai Investment Trust PLC, does not receive any additional management fees as a consequence. Investment by the Aberdeen Standard Thailand Equity Fund, into the Aberdeen New Thai Investment Trust PLC, results from an independent stock selection decision. As such, the investment will not attract a rebate of Manager’s fee.
In the normal course of business of the Sub-Fund, management fees have been paid or are payable to the Manager and trustee fees and valuation fees have been paid or are payable to the Trustee and Fund Administrator, respectively.
The Sub-Fund maintains certain bank accounts with BNP Paribas Securities Services, operating through its Singapore Branch a related corporation of the Trustee:
Custodian S$BNP Paribas Securities Services, operating through its Singapore Branch 779,400
In addition, the Manager has agreed to reimburse expenses for certain sub-funds if expense ratios exceed 1.75% for financial year 2019 (2018: 1.75%). S$Management fees 862,010Reimbursement (334)Management fees rebate -Net Management fees 861,676
i) Performance of the Scheme (2)
SGD Class Cumulative Annualised
Period 3-mth 6-mth 1-yr 3-yr 5-yr 10-yrSince
inception* 3-yr 5-yr 10-yrSince
inception*Fund (%) 5.85 -7.22 -3.00 25.24 28.06 332.23 1,154.69 7.79 5.07 15.75 12.59Benchmark (%) 7.86 -4.49 -3.09 42.71 53.61 443.74 N/A 12.59 8.96 18.44 N/A(*) Inception Date: 05/12/1997
USD Class Cumulative Annualised
Period 3-mth 6-mth 1-yr 3-yr 5-yr 10-yrSince
inception** 3-yr 5-yr 10-yrSince
inception**Fund (%) 6.72 -6.40 -6.17 24.19 18.27 387.00 422.88 7.49 3.41 17.14 11.79Benchmark (%) 8.54 -3.65 -6.18 41.88 42.62 510.26 479.66 12.37 7.35 19.81 12.57(**) Inception Date: 01/06/2004
j) Expense ratios (3) USD Class SGD Class31 March 2019 1.75 % 1.72 %31 March 2018 1.73 % 1.69 %
k) Turnover ratios (4)
31 March 2019 5.59 %31 March 2018 3.37 %
l) Any material information that will adversely impact the valuation of the schemeNil
64
m) Soft dollars received from brokersThe Manager does not receive soft-dollar commissions or cash rebates from dealing on the Aberdeen Standard Thailand Equity Fund.
n) Key Information on the underlying scheme:N/A
(1) The total amount (S$ and US$) of redemptions and subscriptions include both CPF (for SGD Class only) and Cash funds.
(2) Source: Lipper, based on percentage growth, calculated on a NAV-to-NAV basis with gross income reinvested. Benchmark refers to Thailand SET Index. Benchmark data is only available from 2 January 2002.
(3) The expense ratio has been computed based on the guidelines laid down by the Investment Management Association of Singapore (“IMAS”). The calculation of the USD Class expense ratio at 31 March 2019 was based on total operating expenses of $93,192 (2018: $122,470) divided by the average net asset value of $5,313,292 (2018: $7,059,851) for the year. The calculation of the SGD Class expense ratio at 31 March 2019 was based on total operating expenses of $1,936,720 (2018: $2,071,188) divided by the average net asset value of $112,874,262 (2018: $122,642,910) for the year.
The total operating expenses do not include (where applicable) brokerage and other transactions costs, performance fee, interest expense, distribution paid out to unitholders, foreign exchange gains/losses, front or back end loads arising from the purchase or sale of other funds and tax deducted at source or arising out of income received. Expenses are reimbursed by the Manager if expense ratios exceed 1.75% (2018: 1.75%). The Sub-Fund does not pay any performance fee. The average net asset value is based on the daily balances.
(4) The portfolio turnover ratio is calculated in accordance with the formula stated in the Code on Collective Investment Schemes. The calculation of the portfolio turnover ratio was based on the lower of the total value of purchases or sales of the underlying investments, being purchases of $6,454,042 (2018: purchases of $4,358,469) divided by the average daily net asset value of $115,356,417 (2018: $129,166,366).
65
Aberdeen Standard Select Portfolio Financial Statements
for the half year ended 31 March 2019 (unaudited)
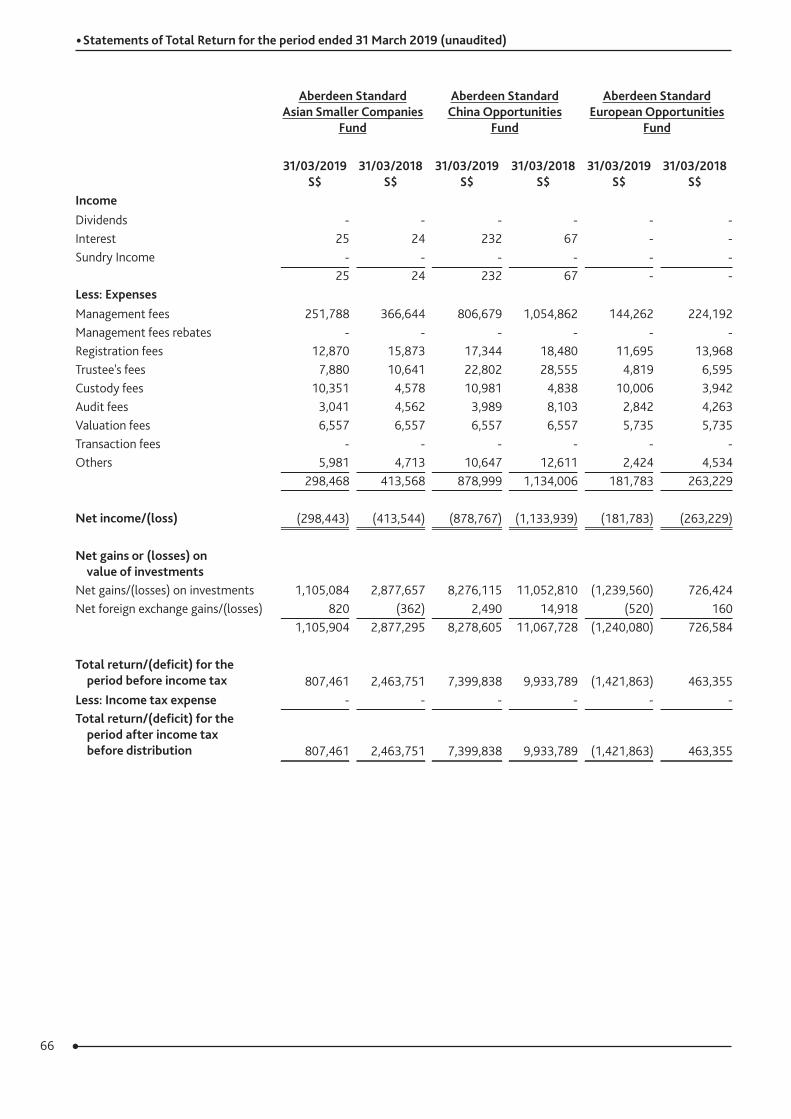
66
Aberdeen Standard Asian Smaller Companies
Fund
Aberdeen Standard China Opportunities
Fund
Aberdeen Standard European Opportunities
Fund
31/03/2019 S$
31/03/2018 S$
31/03/2019 S$
31/03/2018 S$
31/03/2019 S$
31/03/2018 S$
IncomeDividends - - - - - -Interest 25 24 232 67 - -Sundry Income - - - - - -
25 24 232 67 - -Less: ExpensesManagement fees 251,788 366,644 806,679 1,054,862 144,262 224,192Management fees rebates - - - - - -Registration fees 12,870 15,873 17,344 18,480 11,695 13,968Trustee's fees 7,880 10,641 22,802 28,555 4,819 6,595Custody fees 10,351 4,578 10,981 4,838 10,006 3,942Audit fees 3,041 4,562 3,989 8,103 2,842 4,263Valuation fees 6,557 6,557 6,557 6,557 5,735 5,735Transaction fees - - - - - -Others 5,981 4,713 10,647 12,611 2,424 4,534
298,468 413,568 878,999 1,134,006 181,783 263,229
Net income/(loss) (298,443) (413,544) (878,767) (1,133,939) (181,783) (263,229)
Net gains or (losses) on value of investmentsNet gains/(losses) on investments 1,105,084 2,877,657 8,276,115 11,052,810 (1,239,560) 726,424Net foreign exchange gains/(losses) 820 (362) 2,490 14,918 (520) 160
1,105,904 2,877,295 8,278,605 11,067,728 (1,240,080) 726,584
Total return/(deficit) for the period before income tax 807,461 2,463,751 7,399,838 9,933,789 (1,421,863) 463,355Less: Income tax expense - - - - - -Total return/(deficit) for the period after income tax before distribution 807,461 2,463,751 7,399,838 9,933,789 (1,421,863) 463,355
• Statements of Total Return for the period ended 31 March 2019 (unaudited)

67
• Statements of Total Return for the period ended 31 March 2019 (unaudited)
Aberdeen Standard Global Emerging Markets
Fund
Aberdeen Standard Global Opportunities
Fund
Aberdeen Standard Global Technology
Fund
31/03/2019 S$
31/03/2018 S$
31/03/2019 S$
31/03/2018 S$
31/03/2019 S$
31/03/2018 S$
IncomeDividends - - - - 171,209 223,016Interest 85 108 292 42 187 8Sundry Income - - - - - -
85 108 292 42 171,396 223,024Less: ExpensesManagement fees 1,550,568 1,957,639 1,284,876 1,426,207 311,008 356,552Management fees rebates - - - - - -Registration fees 28,204 32,694 19,789 22,069 29,452 31,637Trustee's fees 44,905 56,576 34,677 38,053 13,795 15,131Custody fees 11,325 4,938 11,463 4,904 8,597 5,514Audit fees 5,385 5,485 4,587 6,731 4,537 6,532Valuation fees 6,557 6,558 6,557 6,558 8,761 8,953Transaction fees - - - - 11,250 15,773Others 21,525 22,967 17,039 17,046 9,216 7,355
1,668,469 2,086,857 1,378,988 1,521,568 396,616 447,447
Net income/(loss) (1,668,384) (2,086,749) (1,378,696) (1,521,526) (225,220) (224,423)
Net gains or (losses) on value of investmentsNet gains/(losses) on investments 11,406,939 876,685 (2,414,506) (165,854) (452,724) 2,221,865Net foreign exchange gains/(losses) 3,662 (11,845) (901) (2,357) (5,495) 532
11,410,601 864,840 (2,415,407) (168,211) (458,219) 2,222,397
Total return/(deficit) for the period before income tax 9,742,217 (1,221,909) (3,794,103) (1,689,737) (683,439) 1,997,974Less: Income tax expense - - - - (37,016) (51,130)Total return/(deficit) for the period after income tax before distribution 9,742,217 (1,221,909) (3,794,103) (1,689,737) (720,455) 1,946,844
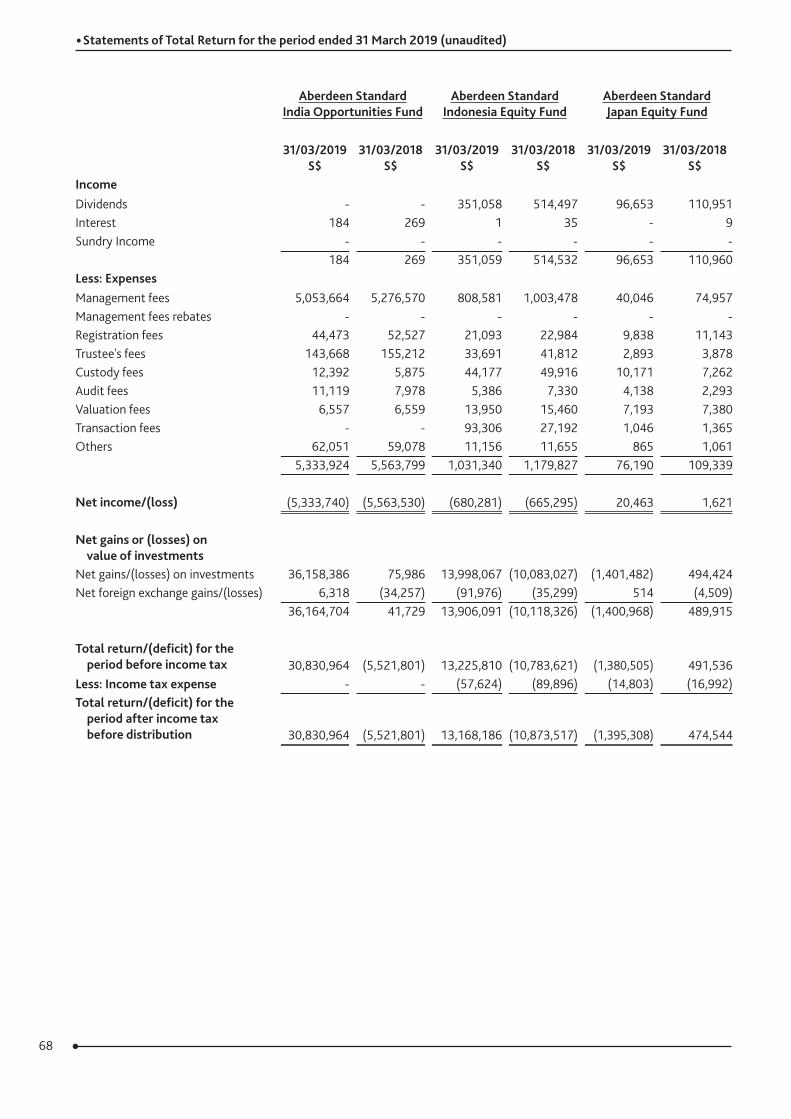
68
• Statements of Total Return for the period ended 31 March 2019 (unaudited)
Aberdeen Standard India Opportunities Fund
Aberdeen Standard Indonesia Equity Fund
Aberdeen Standard Japan Equity Fund
31/03/2019 S$
31/03/2018 S$
31/03/2019 S$
31/03/2018 S$
31/03/2019 S$
31/03/2018 S$
IncomeDividends - - 351,058 514,497 96,653 110,951Interest 184 269 1 35 - 9Sundry Income - - - - - -
184 269 351,059 514,532 96,653 110,960Less: ExpensesManagement fees 5,053,664 5,276,570 808,581 1,003,478 40,046 74,957Management fees rebates - - - - - -Registration fees 44,473 52,527 21,093 22,984 9,838 11,143Trustee's fees 143,668 155,212 33,691 41,812 2,893 3,878Custody fees 12,392 5,875 44,177 49,916 10,171 7,262Audit fees 11,119 7,978 5,386 7,330 4,138 2,293Valuation fees 6,557 6,559 13,950 15,460 7,193 7,380Transaction fees - - 93,306 27,192 1,046 1,365Others 62,051 59,078 11,156 11,655 865 1,061
5,333,924 5,563,799 1,031,340 1,179,827 76,190 109,339
Net income/(loss) (5,333,740) (5,563,530) (680,281) (665,295) 20,463 1,621
Net gains or (losses) on value of investmentsNet gains/(losses) on investments 36,158,386 75,986 13,998,067 (10,083,027) (1,401,482) 494,424Net foreign exchange gains/(losses) 6,318 (34,257) (91,976) (35,299) 514 (4,509)
36,164,704 41,729 13,906,091 (10,118,326) (1,400,968) 489,915
Total return/(deficit) for the period before income tax 30,830,964 (5,521,801) 13,225,810 (10,783,621) (1,380,505) 491,536Less: Income tax expense - - (57,624) (89,896) (14,803) (16,992)Total return/(deficit) for the period after income tax before distribution 30,830,964 (5,521,801) 13,168,186 (10,873,517) (1,395,308) 474,544
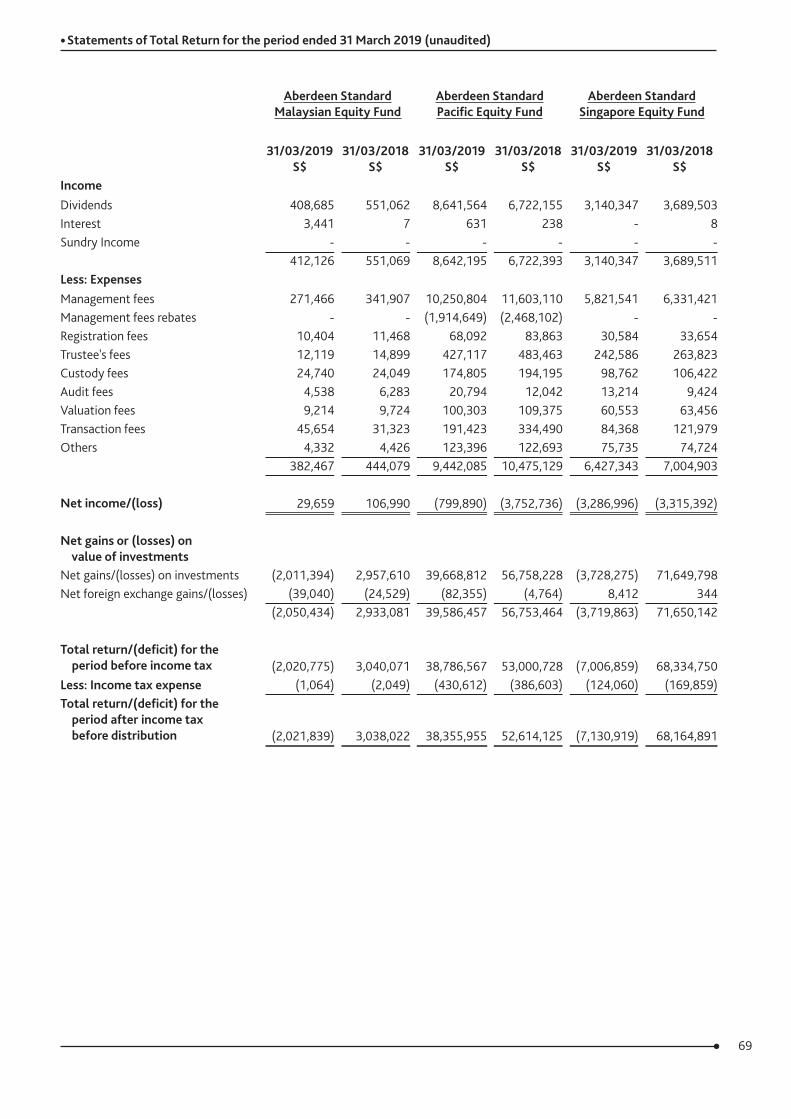
69
• Statements of Total Return for the period ended 31 March 2019 (unaudited)
Aberdeen Standard Malaysian Equity Fund
Aberdeen Standard Pacific Equity Fund
Aberdeen Standard Singapore Equity Fund
31/03/2019 S$
31/03/2018 S$
31/03/2019 S$
31/03/2018 S$
31/03/2019 S$
31/03/2018 S$
IncomeDividends 408,685 551,062 8,641,564 6,722,155 3,140,347 3,689,503Interest 3,441 7 631 238 - 8Sundry Income - - - - - -
412,126 551,069 8,642,195 6,722,393 3,140,347 3,689,511Less: ExpensesManagement fees 271,466 341,907 10,250,804 11,603,110 5,821,541 6,331,421Management fees rebates - - (1,914,649) (2,468,102) - -Registration fees 10,404 11,468 68,092 83,863 30,584 33,654Trustee's fees 12,119 14,899 427,117 483,463 242,586 263,823Custody fees 24,740 24,049 174,805 194,195 98,762 106,422Audit fees 4,538 6,283 20,794 12,042 13,214 9,424Valuation fees 9,214 9,724 100,303 109,375 60,553 63,456Transaction fees 45,654 31,323 191,423 334,490 84,368 121,979Others 4,332 4,426 123,396 122,693 75,735 74,724
382,467 444,079 9,442,085 10,475,129 6,427,343 7,004,903
Net income/(loss) 29,659 106,990 (799,890) (3,752,736) (3,286,996) (3,315,392)
Net gains or (losses) on value of investmentsNet gains/(losses) on investments (2,011,394) 2,957,610 39,668,812 56,758,228 (3,728,275) 71,649,798Net foreign exchange gains/(losses) (39,040) (24,529) (82,355) (4,764) 8,412 344
(2,050,434) 2,933,081 39,586,457 56,753,464 (3,719,863) 71,650,142
Total return/(deficit) for the period before income tax (2,020,775) 3,040,071 38,786,567 53,000,728 (7,006,859) 68,334,750Less: Income tax expense (1,064) (2,049) (430,612) (386,603) (124,060) (169,859)Total return/(deficit) for the period after income tax before distribution (2,021,839) 3,038,022 38,355,955 52,614,125 (7,130,919) 68,164,891
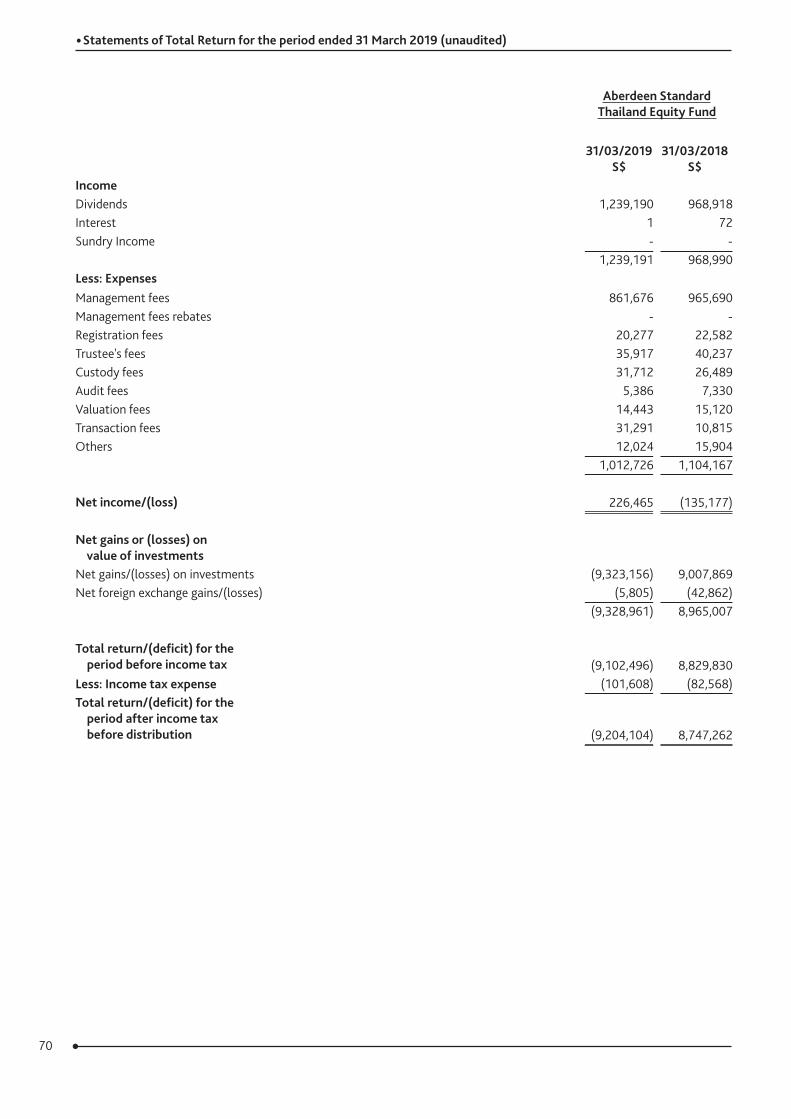
70
• Statements of Total Return for the period ended 31 March 2019 (unaudited)
Aberdeen Standard Thailand Equity Fund
31/03/2019 S$
31/03/2018 S$
IncomeDividends 1,239,190 968,918Interest 1 72Sundry Income - -
1,239,191 968,990Less: ExpensesManagement fees 861,676 965,690Management fees rebates - -Registration fees 20,277 22,582Trustee's fees 35,917 40,237Custody fees 31,712 26,489Audit fees 5,386 7,330Valuation fees 14,443 15,120Transaction fees 31,291 10,815Others 12,024 15,904
1,012,726 1,104,167
Net income/(loss) 226,465 (135,177)
Net gains or (losses) on value of investmentsNet gains/(losses) on investments (9,323,156) 9,007,869Net foreign exchange gains/(losses) (5,805) (42,862)
(9,328,961) 8,965,007
Total return/(deficit) for the period before income tax (9,102,496) 8,829,830Less: Income tax expense (101,608) (82,568)Total return/(deficit) for the period after income tax before distribution (9,204,104) 8,747,262
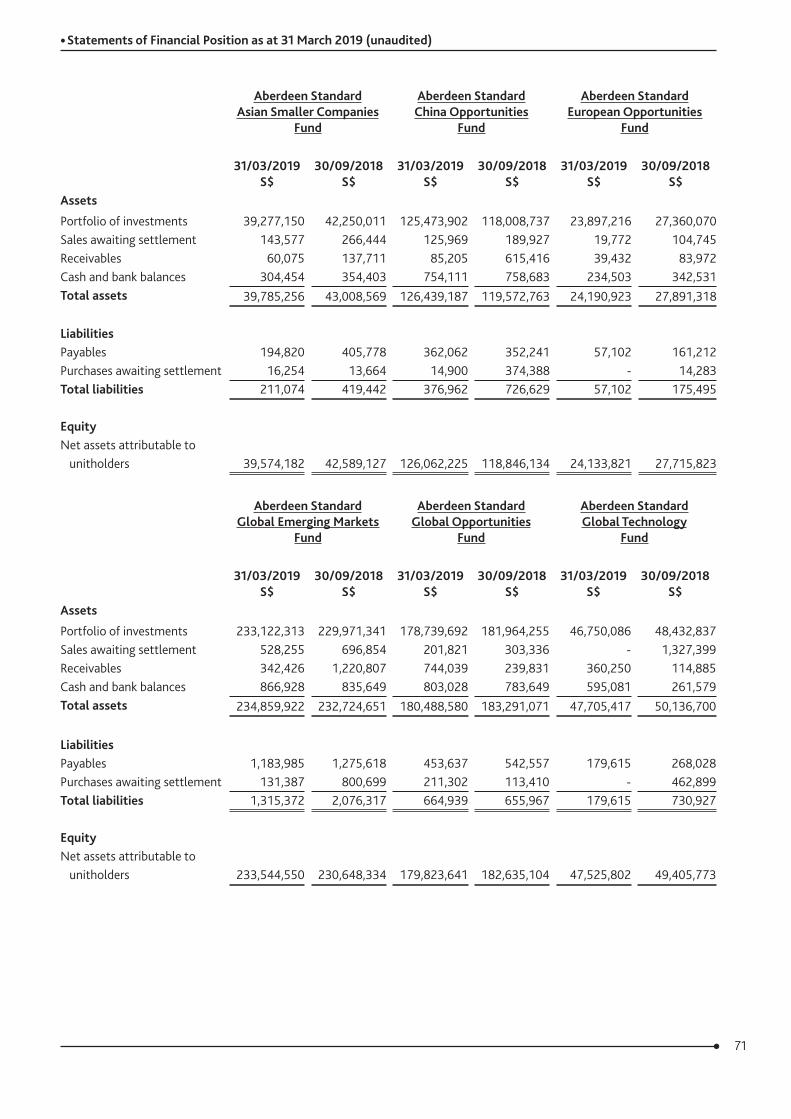
71
Aberdeen Standard Asian Smaller Companies
Fund
Aberdeen Standard China Opportunities
Fund
Aberdeen Standard European Opportunities
Fund
31/03/2019 S$
30/09/2018 S$
31/03/2019 S$
30/09/2018 S$
31/03/2019 S$
30/09/2018 S$
Assets
Portfolio of investments 39,277,150 42,250,011 125,473,902 118,008,737 23,897,216 27,360,070Sales awaiting settlement 143,577 266,444 125,969 189,927 19,772 104,745Receivables 60,075 137,711 85,205 615,416 39,432 83,972Cash and bank balances 304,454 354,403 754,111 758,683 234,503 342,531Total assets 39,785,256 43,008,569 126,439,187 119,572,763 24,190,923 27,891,318
LiabilitiesPayables 194,820 405,778 362,062 352,241 57,102 161,212Purchases awaiting settlement 16,254 13,664 14,900 374,388 - 14,283Total liabilities 211,074 419,442 376,962 726,629 57,102 175,495
EquityNet assets attributable to
39,574,182 42,589,127 126,062,225 118,846,134 24,133,821 27,715,823 unitholders
Aberdeen Standard Global Emerging Markets
Fund
Aberdeen Standard Global Opportunities
Fund
Aberdeen Standard Global Technology
Fund
31/03/2019 S$
30/09/2018 S$
31/03/2019 S$
30/09/2018 S$
31/03/2019 S$
30/09/2018 S$
Assets
Portfolio of investments 233,122,313 229,971,341 178,739,692 181,964,255 46,750,086 48,432,837Sales awaiting settlement 528,255 696,854 201,821 303,336 - 1,327,399Receivables 342,426 1,220,807 744,039 239,831 360,250 114,885Cash and bank balances 866,928 835,649 803,028 783,649 595,081 261,579Total assets 234,859,922 232,724,651 180,488,580 183,291,071 47,705,417 50,136,700
LiabilitiesPayables 1,183,985 1,275,618 453,637 542,557 179,615 268,028Purchases awaiting settlement 131,387 800,699 211,302 113,410 - 462,899Total liabilities 1,315,372 2,076,317 664,939 655,967 179,615 730,927
EquityNet assets attributable to
233,544,550 230,648,334 179,823,641 182,635,104 47,525,802 49,405,773 unitholders
• Statements of Financial Position as at 31 March 2019 (unaudited)
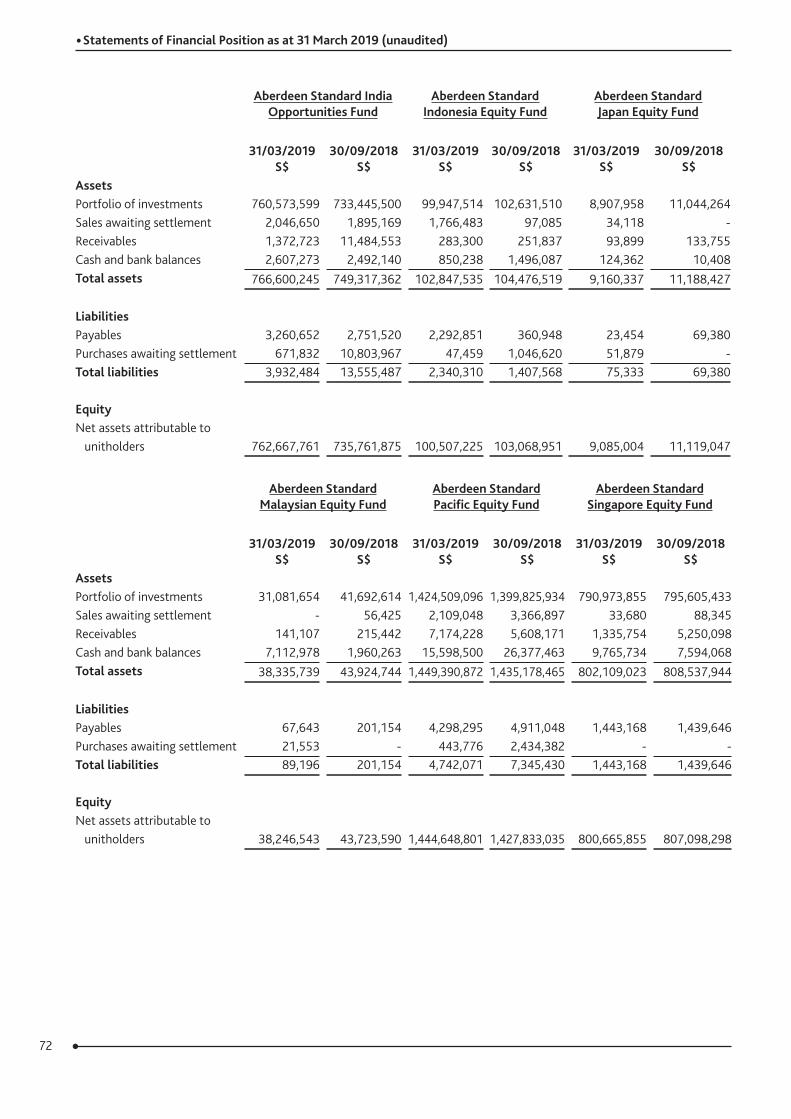
72
• Statements of Financial Position as at 31 March 2019 (unaudited)
Aberdeen Standard India Opportunities Fund
Aberdeen Standard Indonesia Equity Fund
Aberdeen Standard Japan Equity Fund
31/03/2019 S$
30/09/2018 S$
31/03/2019 S$
30/09/2018 S$
31/03/2019 S$
30/09/2018 S$
AssetsPortfolio of investments 760,573,599 733,445,500 99,947,514 102,631,510 8,907,958 11,044,264Sales awaiting settlement 2,046,650 1,895,169 1,766,483 97,085 34,118 -Receivables 1,372,723 11,484,553 283,300 251,837 93,899 133,755Cash and bank balances 2,607,273 2,492,140 850,238 1,496,087 124,362 10,408Total assets 766,600,245 749,317,362 102,847,535 104,476,519 9,160,337 11,188,427
LiabilitiesPayables 3,260,652 2,751,520 2,292,851 360,948 23,454 69,380Purchases awaiting settlement 671,832 10,803,967 47,459 1,046,620 51,879 -Total liabilities 3,932,484 13,555,487 2,340,310 1,407,568 75,333 69,380
EquityNet assets attributable to
762,667,761 735,761,875 100,507,225 103,068,951 9,085,004 11,119,047 unitholders
Aberdeen Standard Malaysian Equity Fund
Aberdeen Standard Pacific Equity Fund
Aberdeen Standard Singapore Equity Fund
31/03/2019 S$
30/09/2018 S$
31/03/2019 S$
30/09/2018 S$
31/03/2019 S$
30/09/2018 S$
AssetsPortfolio of investments 31,081,654 41,692,614 1,424,509,096 1,399,825,934 790,973,855 795,605,433Sales awaiting settlement - 56,425 2,109,048 3,366,897 33,680 88,345Receivables 141,107 215,442 7,174,228 5,608,171 1,335,754 5,250,098Cash and bank balances 7,112,978 1,960,263 15,598,500 26,377,463 9,765,734 7,594,068Total assets 38,335,739 43,924,744 1,449,390,872 1,435,178,465 802,109,023 808,537,944
LiabilitiesPayables 67,643 201,154 4,298,295 4,911,048 1,443,168 1,439,646Purchases awaiting settlement 21,553 - 443,776 2,434,382 - -Total liabilities 89,196 201,154 4,742,071 7,345,430 1,443,168 1,439,646
EquityNet assets attributable to
38,246,543 43,723,590 1,444,648,801 1,427,833,035 800,665,855 807,098,298 unitholders
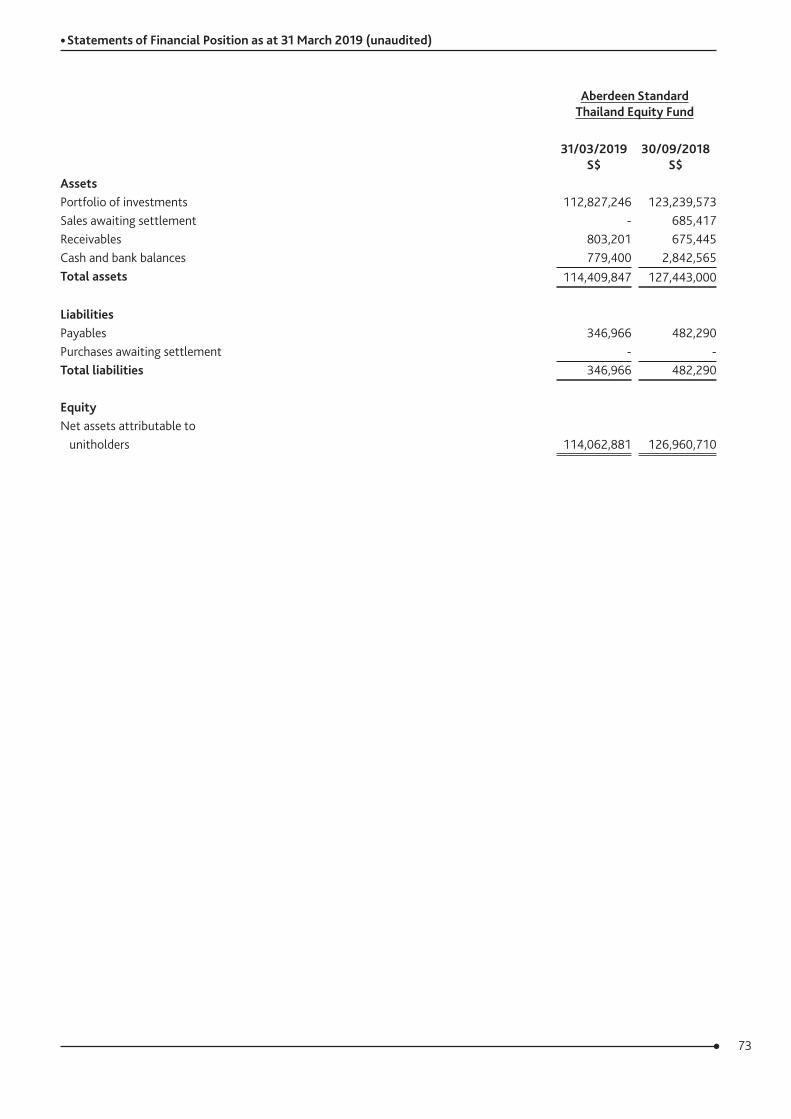
73
• Statements of Financial Position as at 31 March 2019 (unaudited)
Aberdeen Standard Thailand Equity Fund
31/03/2019 S$
30/09/2018 S$
AssetsPortfolio of investments 112,827,246 123,239,573Sales awaiting settlement - 685,417Receivables 803,201 675,445Cash and bank balances 779,400 2,842,565Total assets 114,409,847 127,443,000
LiabilitiesPayables 346,966 482,290Purchases awaiting settlement - -Total liabilities 346,966 482,290
EquityNet assets attributable to
114,062,881 126,960,710 unitholders
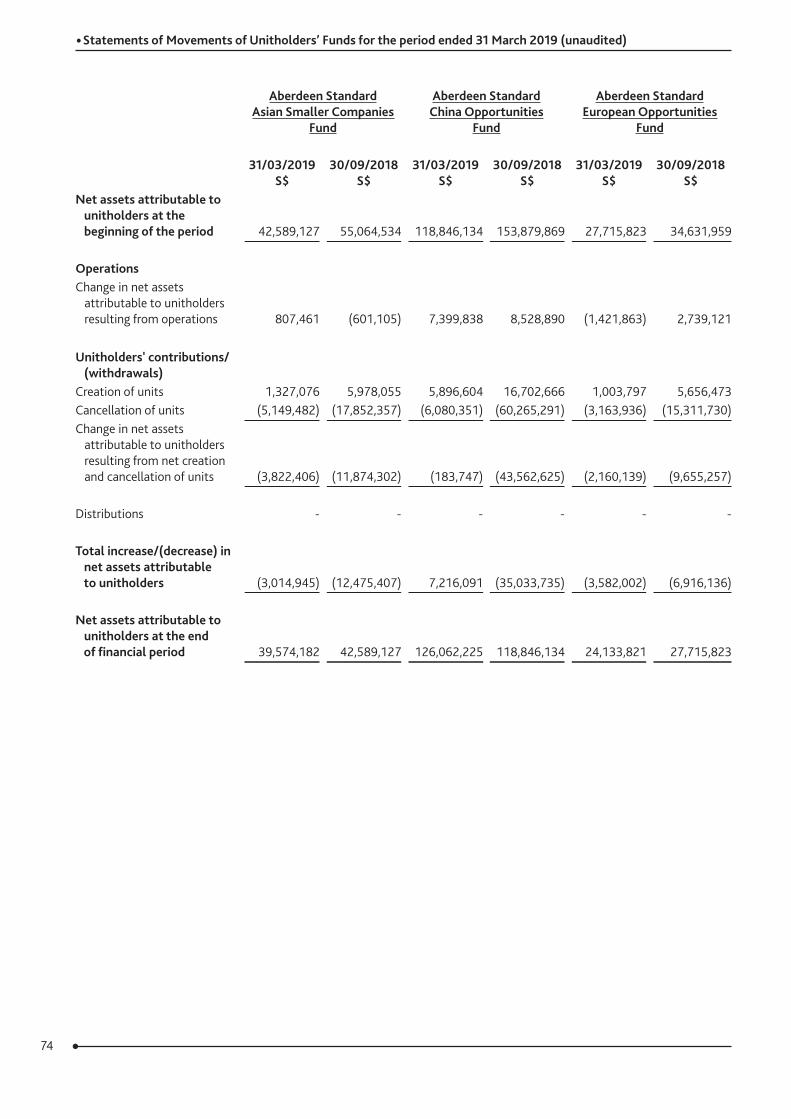
74
Aberdeen Standard Asian Smaller Companies
Fund
Aberdeen Standard China Opportunities
Fund
Aberdeen Standard European Opportunities
Fund
31/03/2019 S$
30/09/2018 S$
31/03/2019 S$
30/09/2018 S$
31/03/2019 S$
30/09/2018 S$
Net assets attributable to unitholders at the beginning of the period 42,589,127 55,064,534 118,846,134 153,879,869 27,715,823 34,631,959
OperationsChange in net assets attributable to unitholders resulting from operations 807,461 (601,105) 7,399,838 8,528,890 (1,421,863) 2,739,121
Unitholders' contributions/ (withdrawals)Creation of units 1,327,076 5,978,055 5,896,604 16,702,666 1,003,797 5,656,473Cancellation of units (5,149,482) (17,852,357) (6,080,351) (60,265,291) (3,163,936) (15,311,730)Change in net assets attributable to unitholders resulting from net creation and cancellation of units (3,822,406) (11,874,302) (183,747) (43,562,625) (2,160,139) (9,655,257)
Distributions - - - - - -
Total increase/(decrease) in net assets attributable to unitholders (3,014,945) (12,475,407) 7,216,091 (35,033,735) (3,582,002) (6,916,136)
Net assets attributable to unitholders at the end of financial period 39,574,182 42,589,127 126,062,225 118,846,134 24,133,821 27,715,823
• Statements of Movements of Unitholders’ Funds for the period ended 31 March 2019 (unaudited)
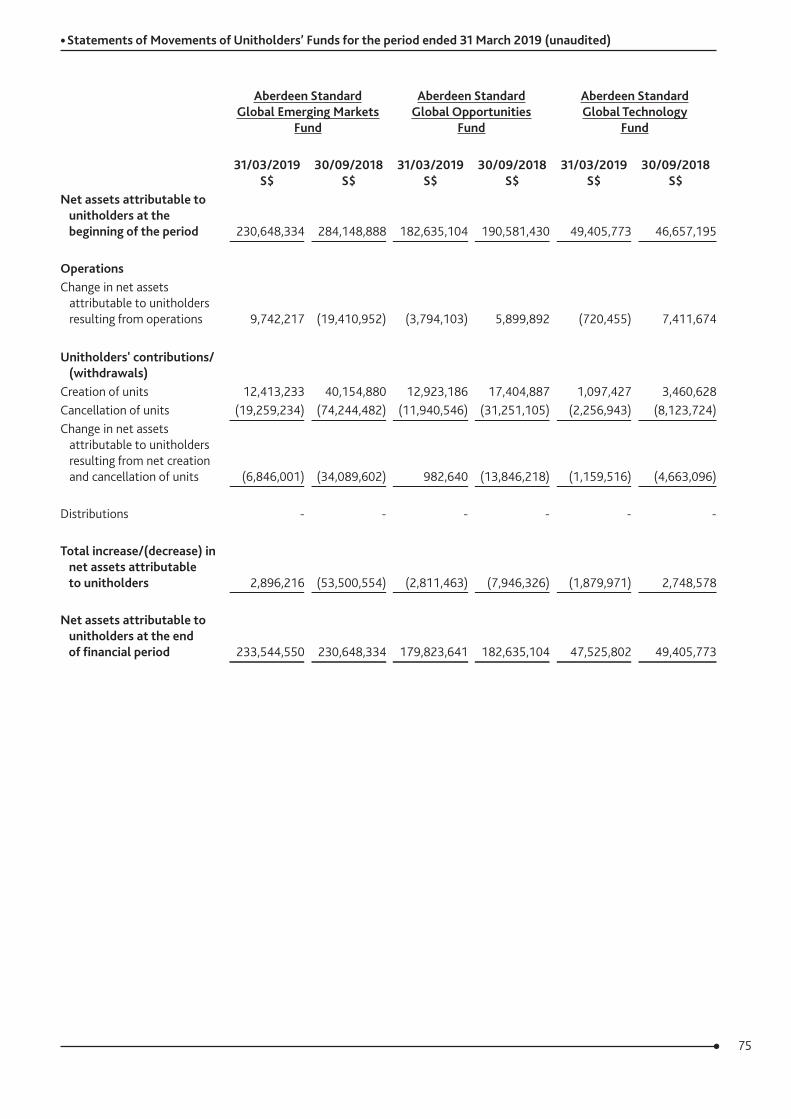
75
• Statements of Movements of Unitholders’ Funds for the period ended 31 March 2019 (unaudited)
Aberdeen Standard Global Emerging Markets
Fund
Aberdeen Standard Global Opportunities
Fund
Aberdeen Standard Global Technology
Fund
31/03/2019 S$
30/09/2018 S$
31/03/2019 S$
30/09/2018 S$
31/03/2019 S$
30/09/2018 S$
Net assets attributable to unitholders at the beginning of the period 230,648,334 284,148,888 182,635,104 190,581,430 49,405,773 46,657,195
OperationsChange in net assets attributable to unitholders resulting from operations 9,742,217 (19,410,952) (3,794,103) 5,899,892 (720,455) 7,411,674
Unitholders' contributions/ (withdrawals)Creation of units 12,413,233 40,154,880 12,923,186 17,404,887 1,097,427 3,460,628Cancellation of units (19,259,234) (74,244,482) (11,940,546) (31,251,105) (2,256,943) (8,123,724)Change in net assets attributable to unitholders resulting from net creation and cancellation of units (6,846,001) (34,089,602) 982,640 (13,846,218) (1,159,516) (4,663,096)
Distributions - - - - - -
Total increase/(decrease) in net assets attributable to unitholders 2,896,216 (53,500,554) (2,811,463) (7,946,326) (1,879,971) 2,748,578
Net assets attributable to unitholders at the end of financial period 233,544,550 230,648,334 179,823,641 182,635,104 47,525,802 49,405,773
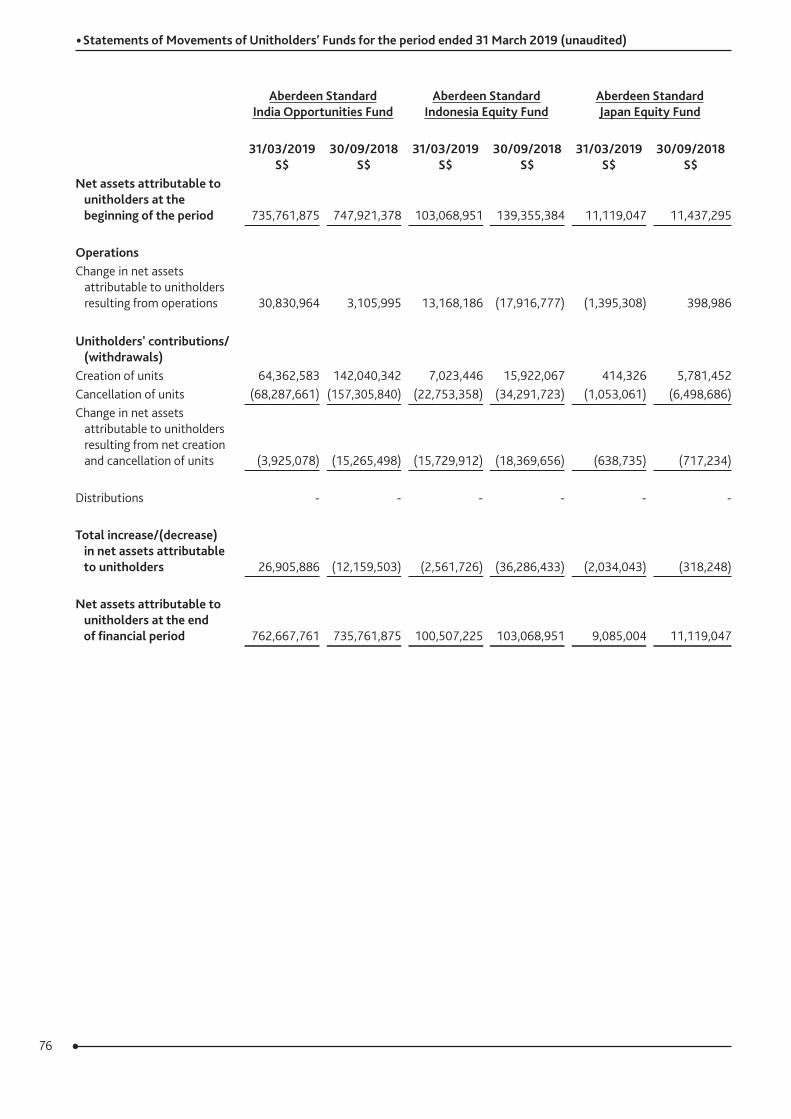
76
• Statements of Movements of Unitholders’ Funds for the period ended 31 March 2019 (unaudited)
Aberdeen Standard India Opportunities Fund
Aberdeen Standard Indonesia Equity Fund
Aberdeen Standard Japan Equity Fund
31/03/2019 S$
30/09/2018 S$
31/03/2019 S$
30/09/2018 S$
31/03/2019 S$
30/09/2018 S$
Net assets attributable to unitholders at the beginning of the period 735,761,875 747,921,378 103,068,951 139,355,384 11,119,047 11,437,295
OperationsChange in net assets attributable to unitholders resulting from operations 30,830,964 3,105,995 13,168,186 (17,916,777) (1,395,308) 398,986
Unitholders' contributions/ (withdrawals)Creation of units 64,362,583 142,040,342 7,023,446 15,922,067 414,326 5,781,452Cancellation of units (68,287,661) (157,305,840) (22,753,358) (34,291,723) (1,053,061) (6,498,686)Change in net assets attributable to unitholders resulting from net creation and cancellation of units (3,925,078) (15,265,498) (15,729,912) (18,369,656) (638,735) (717,234)
Distributions - - - - - -
Total increase/(decrease) in net assets attributable to unitholders 26,905,886 (12,159,503) (2,561,726) (36,286,433) (2,034,043) (318,248)
Net assets attributable to unitholders at the end of financial period 762,667,761 735,761,875 100,507,225 103,068,951 9,085,004 11,119,047
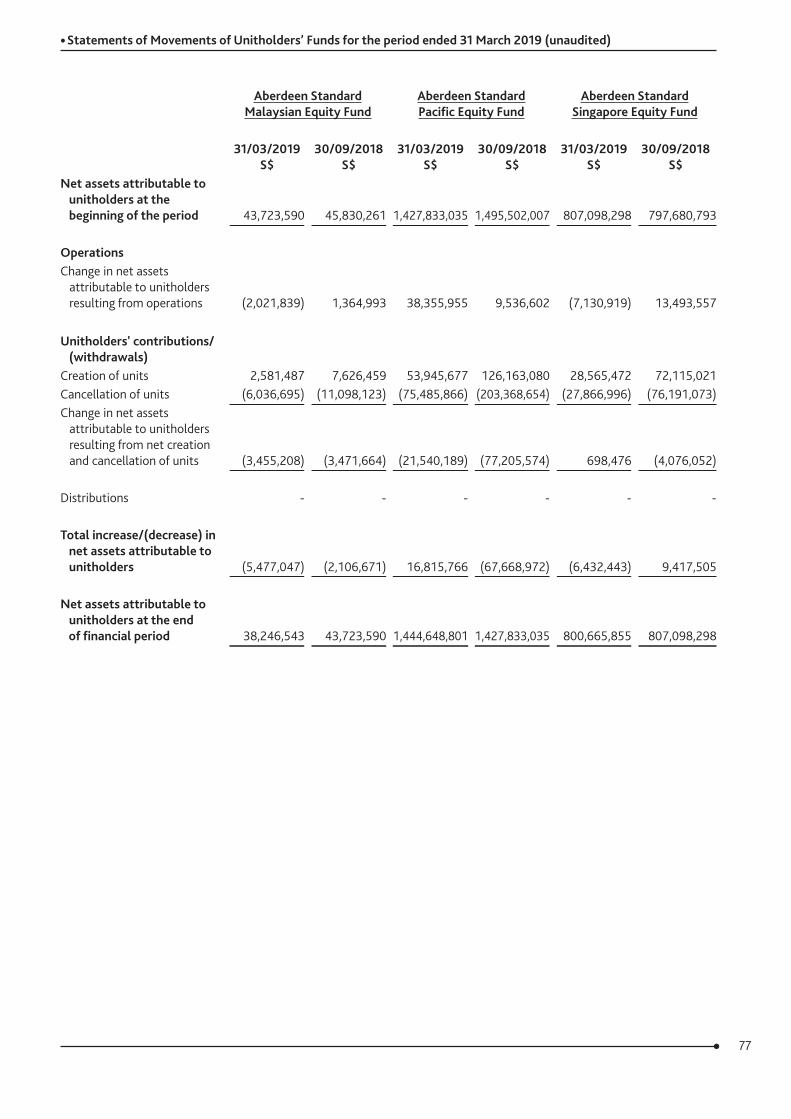
77
• Statements of Movements of Unitholders’ Funds for the period ended 31 March 2019 (unaudited)
Aberdeen Standard Malaysian Equity Fund
Aberdeen Standard Pacific Equity Fund
Aberdeen Standard Singapore Equity Fund
31/03/2019 S$
30/09/2018 S$
31/03/2019 S$
30/09/2018 S$
31/03/2019 S$
30/09/2018 S$
Net assets attributable to unitholders at the beginning of the period 43,723,590 45,830,261 1,427,833,035 1,495,502,007 807,098,298 797,680,793
OperationsChange in net assets attributable to unitholders resulting from operations (2,021,839) 1,364,993 38,355,955 9,536,602 (7,130,919) 13,493,557
Unitholders' contributions/ (withdrawals)Creation of units 2,581,487 7,626,459 53,945,677 126,163,080 28,565,472 72,115,021Cancellation of units (6,036,695) (11,098,123) (75,485,866) (203,368,654) (27,866,996) (76,191,073)Change in net assets attributable to unitholders resulting from net creation and cancellation of units (3,455,208) (3,471,664) (21,540,189) (77,205,574) 698,476 (4,076,052)
Distributions - - - - - -
Total increase/(decrease) in net assets attributable to unitholders (5,477,047) (2,106,671) 16,815,766 (67,668,972) (6,432,443) 9,417,505
Net assets attributable to unitholders at the end of financial period 38,246,543 43,723,590 1,444,648,801 1,427,833,035 800,665,855 807,098,298
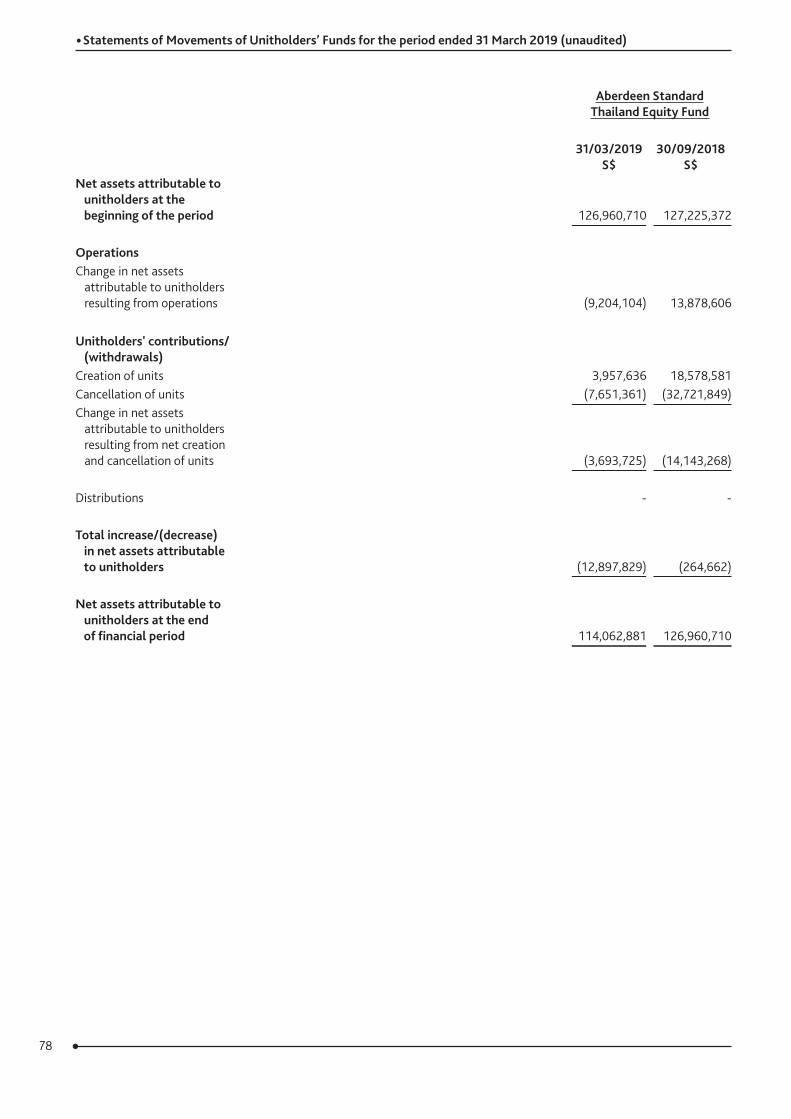
78
• Statements of Movements of Unitholders’ Funds for the period ended 31 March 2019 (unaudited)
Aberdeen Standard Thailand Equity Fund
31/03/2019 S$
30/09/2018 S$
Net assets attributable to unitholders at the beginning of the period 126,960,710 127,225,372
OperationsChange in net assets attributable to unitholders resulting from operations (9,204,104) 13,878,606
Unitholders' contributions/ (withdrawals)Creation of units 3,957,636 18,578,581Cancellation of units (7,651,361) (32,721,849)Change in net assets attributable to unitholders resulting from net creation and cancellation of units (3,693,725) (14,143,268)
Distributions - -
Total increase/(decrease) in net assets attributable to unitholders (12,897,829) (264,662)
Net assets attributable to unitholders at the end of financial period 114,062,881 126,960,710
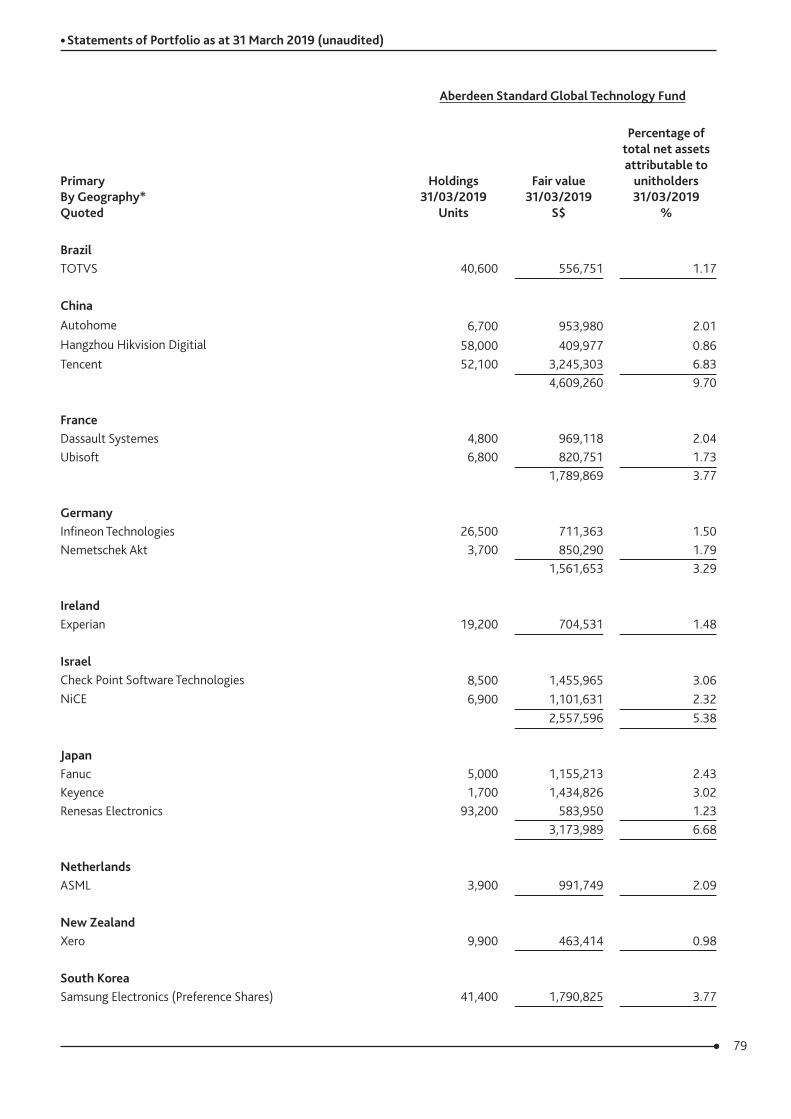
79
Aberdeen Standard Global Technology Fund
Primary By Geography* Quoted
Holdings 31/03/2019
Units
Fair value 31/03/2019
S$
Percentage of total net assets attributable to
unitholders 31/03/2019
%
BrazilTOTVS 40,600 556,751 1.17
ChinaAutohome 6,700 953,980 2.01Hangzhou Hikvision Digitial 58,000 409,977 0.86Tencent 52,100 3,245,303 6.83
4,609,260 9.70
FranceDassault Systemes 4,800 969,118 2.04Ubisoft 6,800 820,751 1.73
1,789,869 3.77
GermanyInfineon Technologies 26,500 711,363 1.50Nemetschek Akt 3,700 850,290 1.79
1,561,653 3.29
IrelandExperian 19,200 704,531 1.48
Israel Check Point Software Technologies 8,500 1,455,965 3.06NiCE 6,900 1,101,631 2.32
2,557,596 5.38
Japan Fanuc 5,000 1,155,213 2.43Keyence 1,700 1,434,826 3.02Renesas Electronics 93,200 583,950 1.23
3,173,989 6.68
Netherlands ASML 3,900 991,749 2.09
New Zealand Xero 9,900 463,414 0.98
South KoreaSamsung Electronics (Preference Shares) 41,400 1,790,825 3.77
• Statements of Portfolio as at 31 March 2019 (unaudited)
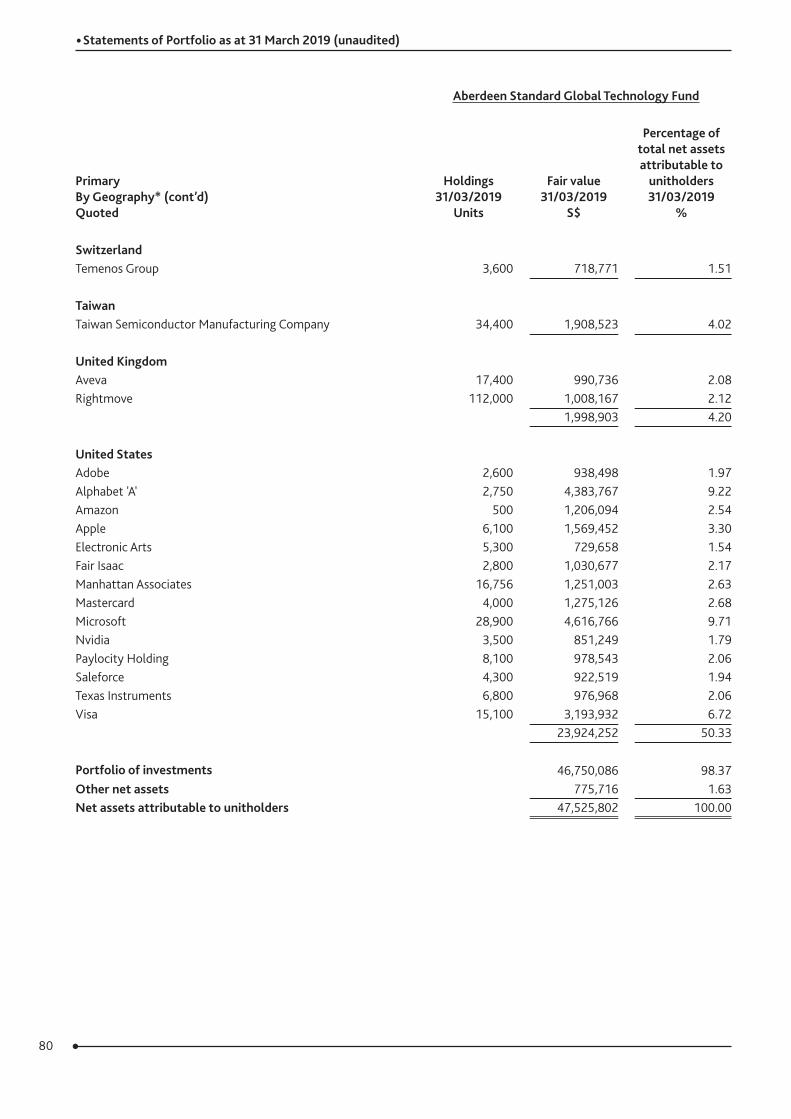
80
• Statements of Portfolio as at 31 March 2019 (unaudited)
Aberdeen Standard Global Technology Fund
Primary By Geography* (cont’d) Quoted
Holdings 31/03/2019
Units
Fair value 31/03/2019
S$
Percentage of total net assets attributable to
unitholders 31/03/2019
%
Switzerland Temenos Group 3,600 718,771 1.51
Taiwan Taiwan Semiconductor Manufacturing Company 34,400 1,908,523 4.02
United KingdomAveva 17,400 990,736 2.08Rightmove 112,000 1,008,167 2.12
1,998,903 4.20
United StatesAdobe 2,600 938,498 1.97Alphabet 'A' 2,750 4,383,767 9.22Amazon 500 1,206,094 2.54Apple 6,100 1,569,452 3.30Electronic Arts 5,300 729,658 1.54Fair Isaac 2,800 1,030,677 2.17Manhattan Associates 16,756 1,251,003 2.63Mastercard 4,000 1,275,126 2.68Microsoft 28,900 4,616,766 9.71Nvidia 3,500 851,249 1.79Paylocity Holding 8,100 978,543 2.06Saleforce 4,300 922,519 1.94Texas Instruments 6,800 976,968 2.06Visa 15,100 3,193,932 6.72
23,924,252 50.33
Portfolio of investments 46,750,086 98.37Other net assets 775,716 1.63Net assets attributable to unitholders 47,525,802 100.00
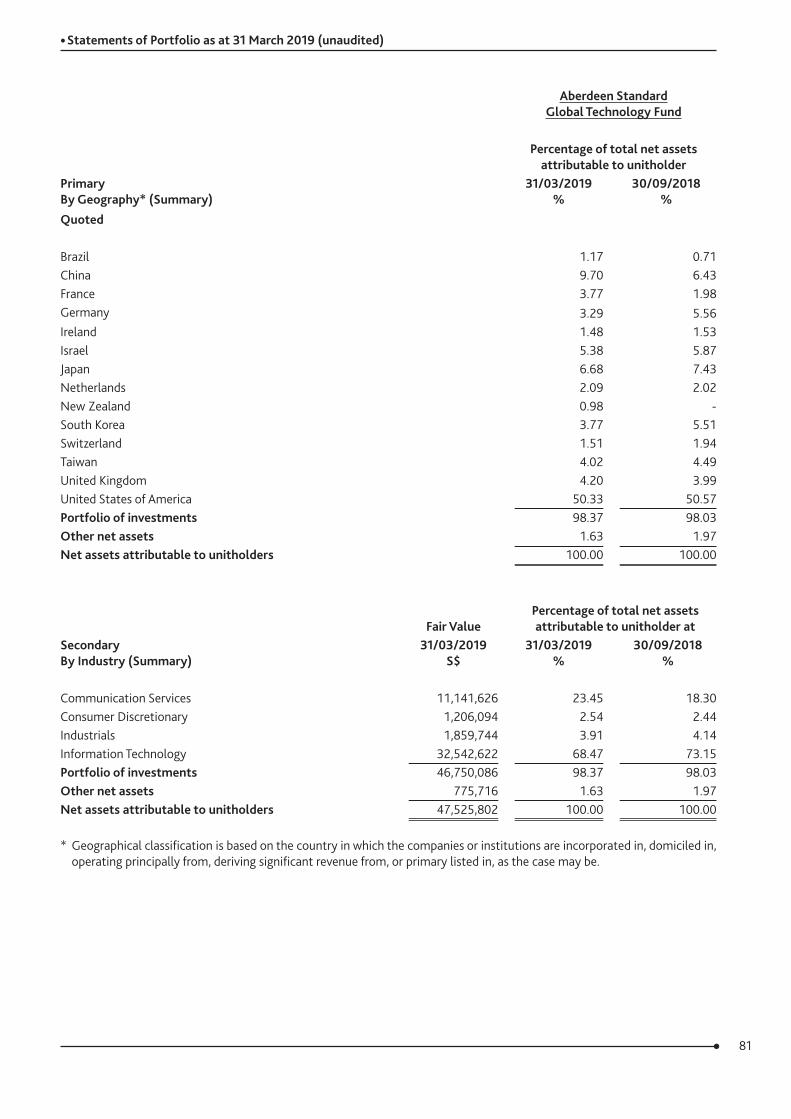
81
• Statements of Portfolio as at 31 March 2019 (unaudited)
Aberdeen Standard Global Technology Fund
Percentage of total net assets attributable to unitholder
Primary By Geography* (Summary)
31/03/2019 %
30/09/2018 %
Quoted
Brazil 1.17 0.71China 9.70 6.43France 3.77 1.98Germany 3.29 5.56Ireland 1.48 1.53Israel 5.38 5.87Japan 6.68 7.43Netherlands 2.09 2.02New Zealand 0.98 -South Korea 3.77 5.51Switzerland 1.51 1.94Taiwan 4.02 4.49United Kingdom 4.20 3.99United States of America 50.33 50.57 Portfolio of investments 98.37 98.03Other net assets 1.63 1.97 Net assets attributable to unitholders 100.00 100.00
Secondary By Industry (Summary)
Fair ValuePercentage of total net assets attributable to unitholder at
31/03/2019 S$
31/03/2019 %
30/09/2018 %
Communication Services 11,141,626 23.45 18.30Consumer Discretionary 1,206,094 2.54 2.44Industrials 1,859,744 3.91 4.14Information Technology 32,542,622 68.47 73.15 Portfolio of investments 46,750,086 98.37 98.03Other net assets 775,716 1.63 1.97 Net assets attributable to unitholders 47,525,802 100.00 100.00
* Geographical classification is based on the country in which the companies or institutions are incorporated in, domiciled in, operating principally from, deriving significant revenue from, or primary listed in, as the case may be.
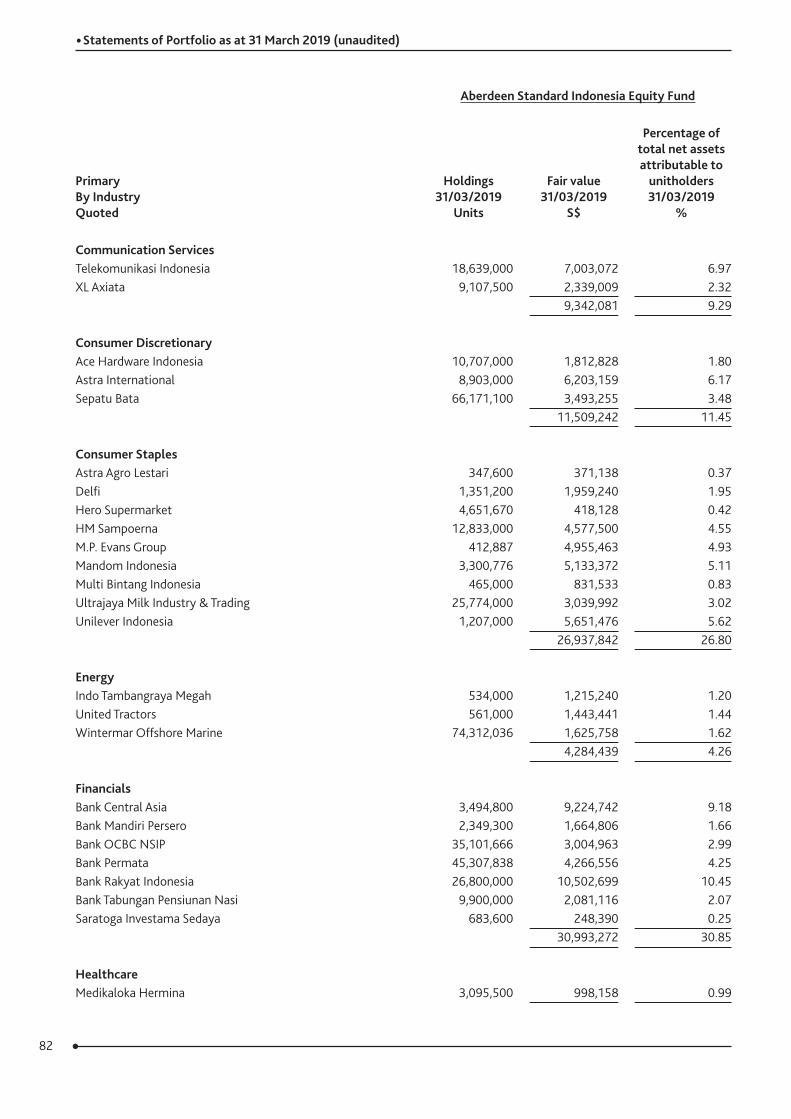
82
• Statements of Portfolio as at 31 March 2019 (unaudited)
Aberdeen Standard Indonesia Equity Fund
Primary By Industry Quoted
Holdings 31/03/2019
Units
Fair value 31/03/2019
S$
Percentage of total net assets attributable to
unitholders 31/03/2019
%
Communication ServicesTelekomunikasi Indonesia 18,639,000 7,003,072 6.97XL Axiata 9,107,500 2,339,009 2.32
9,342,081 9.29
Consumer DiscretionaryAce Hardware Indonesia 10,707,000 1,812,828 1.80Astra International 8,903,000 6,203,159 6.17Sepatu Bata 66,171,100 3,493,255 3.48
11,509,242 11.45
Consumer StaplesAstra Agro Lestari 347,600 371,138 0.37Delfi 1,351,200 1,959,240 1.95Hero Supermarket 4,651,670 418,128 0.42HM Sampoerna 12,833,000 4,577,500 4.55M.P. Evans Group 412,887 4,955,463 4.93Mandom Indonesia 3,300,776 5,133,372 5.11Multi Bintang Indonesia 465,000 831,533 0.83Ultrajaya Milk Industry & Trading 25,774,000 3,039,992 3.02Unilever Indonesia 1,207,000 5,651,476 5.62
26,937,842 26.80
EnergyIndo Tambangraya Megah 534,000 1,215,240 1.20United Tractors 561,000 1,443,441 1.44Wintermar Offshore Marine 74,312,036 1,625,758 1.62
4,284,439 4.26
FinancialsBank Central Asia 3,494,800 9,224,742 9.18Bank Mandiri Persero 2,349,300 1,664,806 1.66Bank OCBC NSIP 35,101,666 3,004,963 2.99Bank Permata 45,307,838 4,266,556 4.25Bank Rakyat Indonesia 26,800,000 10,502,699 10.45Bank Tabungan Pensiunan Nasi 9,900,000 2,081,116 2.07Saratoga Investama Sedaya 683,600 248,390 0.25
30,993,272 30.85
HealthcareMedikaloka Hermina 3,095,500 998,158 0.99
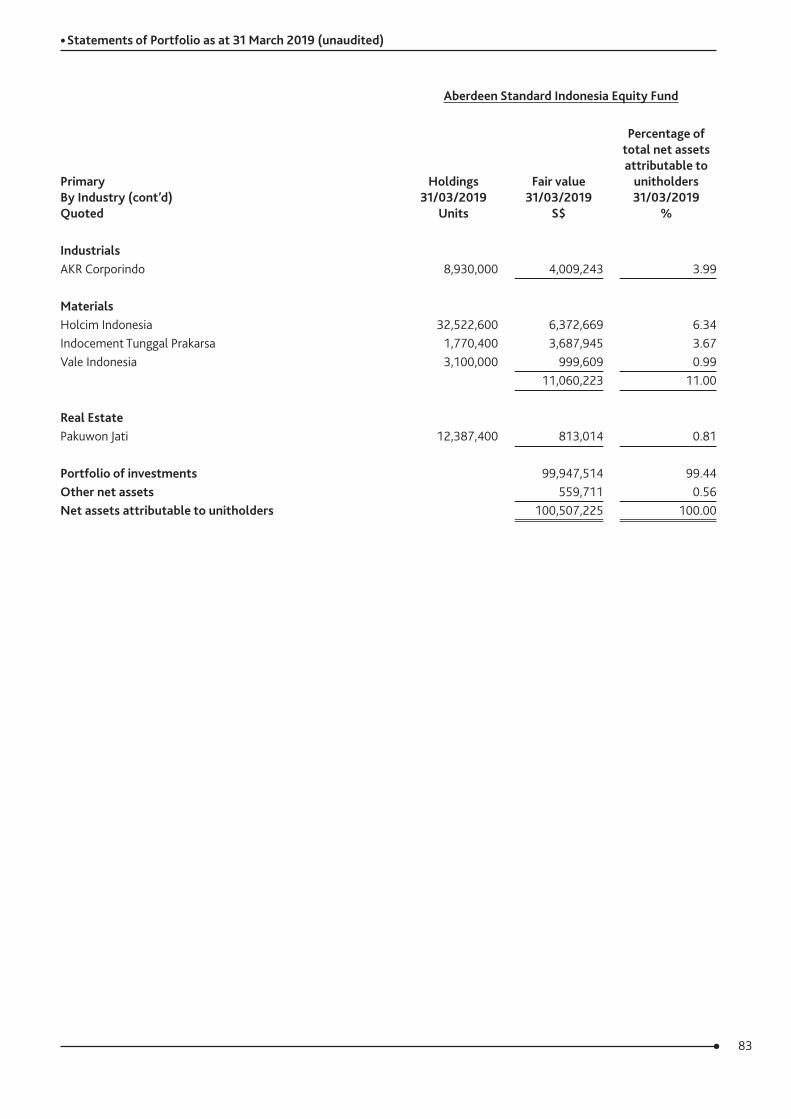
83
• Statements of Portfolio as at 31 March 2019 (unaudited)
Aberdeen Standard Indonesia Equity Fund
Primary By Industry (cont’d) Quoted
Holdings 31/03/2019
Units
Fair value 31/03/2019
S$
Percentage of total net assets attributable to
unitholders 31/03/2019
%
IndustrialsAKR Corporindo 8,930,000 4,009,243 3.99
MaterialsHolcim Indonesia 32,522,600 6,372,669 6.34Indocement Tunggal Prakarsa 1,770,400 3,687,945 3.67Vale Indonesia 3,100,000 999,609 0.99
11,060,223 11.00
Real EstatePakuwon Jati 12,387,400 813,014 0.81
Portfolio of investments 99,947,514 99.44Other net assets 559,711 0.56Net assets attributable to unitholders 100,507,225 100.00
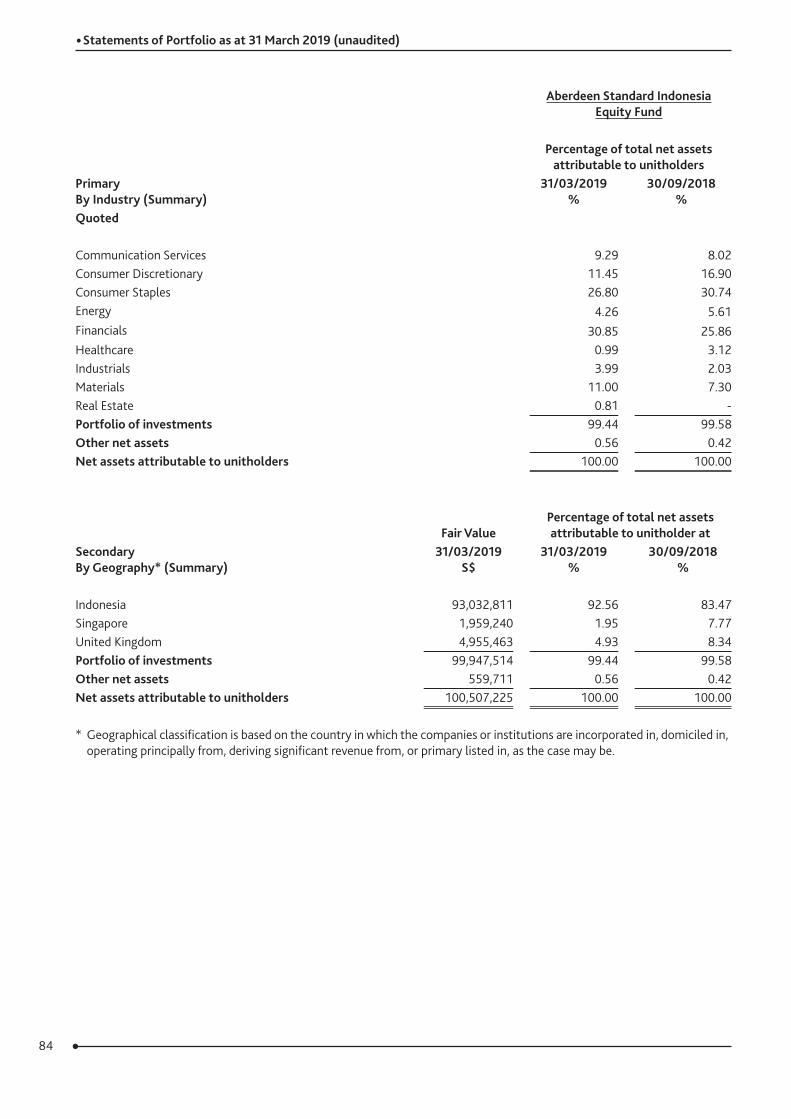
84
• Statements of Portfolio as at 31 March 2019 (unaudited)
Aberdeen Standard Indonesia Equity Fund
Percentage of total net assets attributable to unitholders
Primary By Industry (Summary)
31/03/2019 %
30/09/2018 %
Quoted
Communication Services 9.29 8.02Consumer Discretionary 11.45 16.90Consumer Staples 26.80 30.74Energy 4.26 5.61Financials 30.85 25.86Healthcare 0.99 3.12Industrials 3.99 2.03Materials 11.00 7.30Real Estate 0.81 - Portfolio of investments 99.44 99.58Other net assets 0.56 0.42 Net assets attributable to unitholders 100.00 100.00
Secondary By Geography* (Summary)
Fair ValuePercentage of total net assets attributable to unitholder at
31/03/2019 S$
31/03/2019 %
30/09/2018 %
Indonesia 93,032,811 92.56 83.47Singapore 1,959,240 1.95 7.77United Kingdom 4,955,463 4.93 8.34 Portfolio of investments 99,947,514 99.44 99.58Other net assets 559,711 0.56 0.42 Net assets attributable to unitholders 100,507,225 100.00 100.00
* Geographical classification is based on the country in which the companies or institutions are incorporated in, domiciled in, operating principally from, deriving significant revenue from, or primary listed in, as the case may be.
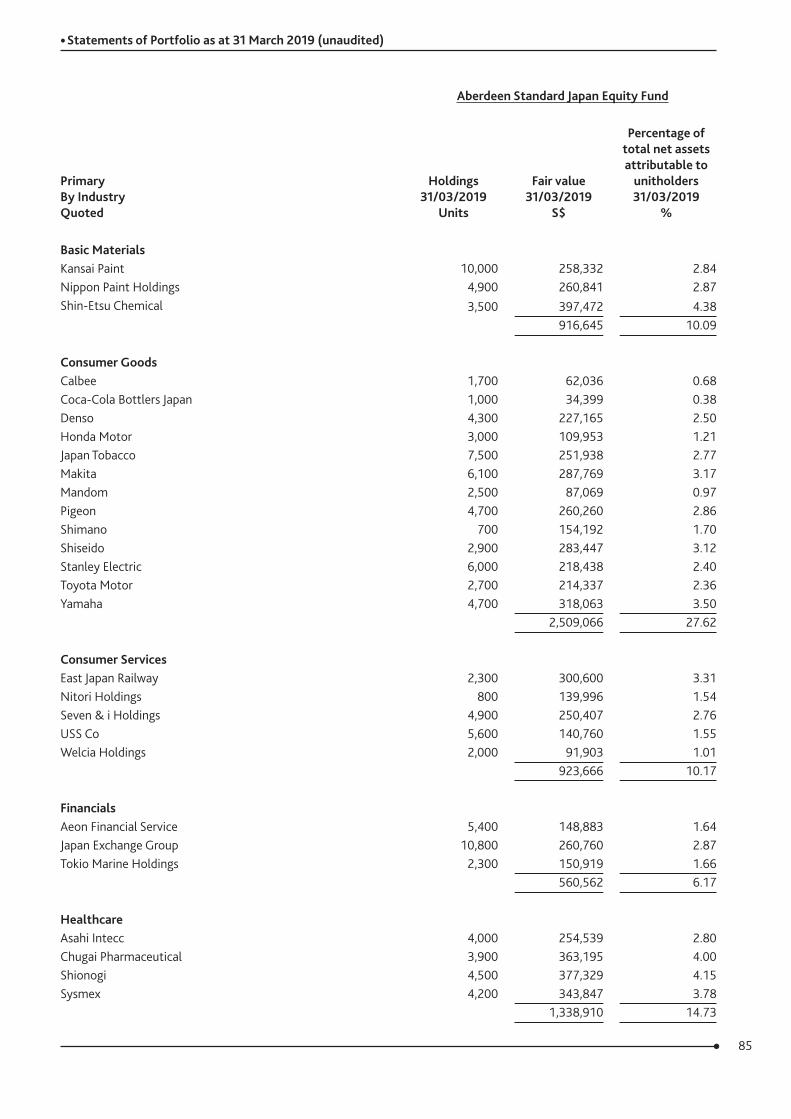
85
• Statements of Portfolio as at 31 March 2019 (unaudited)
Aberdeen Standard Japan Equity Fund
Primary By Industry Quoted
Holdings 31/03/2019
Units
Fair value 31/03/2019
S$
Percentage of total net assets attributable to
unitholders 31/03/2019
%
Basic MaterialsKansai Paint 10,000 258,332 2.84Nippon Paint Holdings 4,900 260,841 2.87Shin-Etsu Chemical 3,500 397,472 4.38
916,645 10.09
Consumer GoodsCalbee 1,700 62,036 0.68Coca-Cola Bottlers Japan 1,000 34,399 0.38Denso 4,300 227,165 2.50Honda Motor 3,000 109,953 1.21Japan Tobacco 7,500 251,938 2.77Makita 6,100 287,769 3.17Mandom 2,500 87,069 0.97Pigeon 4,700 260,260 2.86Shimano 700 154,192 1.70Shiseido 2,900 283,447 3.12Stanley Electric 6,000 218,438 2.40Toyota Motor 2,700 214,337 2.36Yamaha 4,700 318,063 3.50
2,509,066 27.62
Consumer ServicesEast Japan Railway 2,300 300,600 3.31Nitori Holdings 800 139,996 1.54Seven & i Holdings 4,900 250,407 2.76USS Co 5,600 140,760 1.55Welcia Holdings 2,000 91,903 1.01
923,666 10.17
FinancialsAeon Financial Service 5,400 148,883 1.64Japan Exchange Group 10,800 260,760 2.87Tokio Marine Holdings 2,300 150,919 1.66
560,562 6.17
HealthcareAsahi Intecc 4,000 254,539 2.80Chugai Pharmaceutical 3,900 363,195 4.00Shionogi 4,500 377,329 4.15Sysmex 4,200 343,847 3.78
1,338,910 14.73
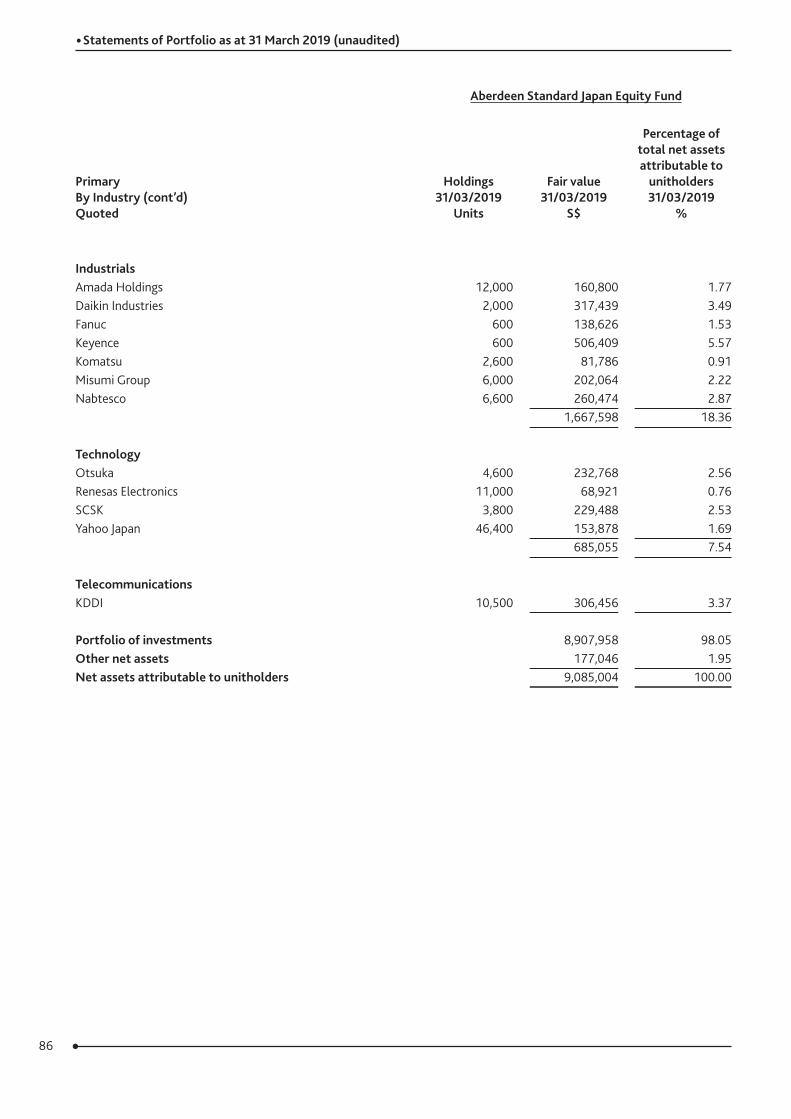
86
• Statements of Portfolio as at 31 March 2019 (unaudited)
Aberdeen Standard Japan Equity Fund
Primary By Industry (cont’d) Quoted
Holdings 31/03/2019
Units
Fair value 31/03/2019
S$
Percentage of total net assets attributable to
unitholders 31/03/2019
%
IndustrialsAmada Holdings 12,000 160,800 1.77Daikin Industries 2,000 317,439 3.49Fanuc 600 138,626 1.53Keyence 600 506,409 5.57Komatsu 2,600 81,786 0.91Misumi Group 6,000 202,064 2.22Nabtesco 6,600 260,474 2.87
1,667,598 18.36
TechnologyOtsuka 4,600 232,768 2.56Renesas Electronics 11,000 68,921 0.76SCSK 3,800 229,488 2.53Yahoo Japan 46,400 153,878 1.69
685,055 7.54
TelecommunicationsKDDI 10,500 306,456 3.37
Portfolio of investments 8,907,958 98.05Other net assets 177,046 1.95Net assets attributable to unitholders 9,085,004 100.00
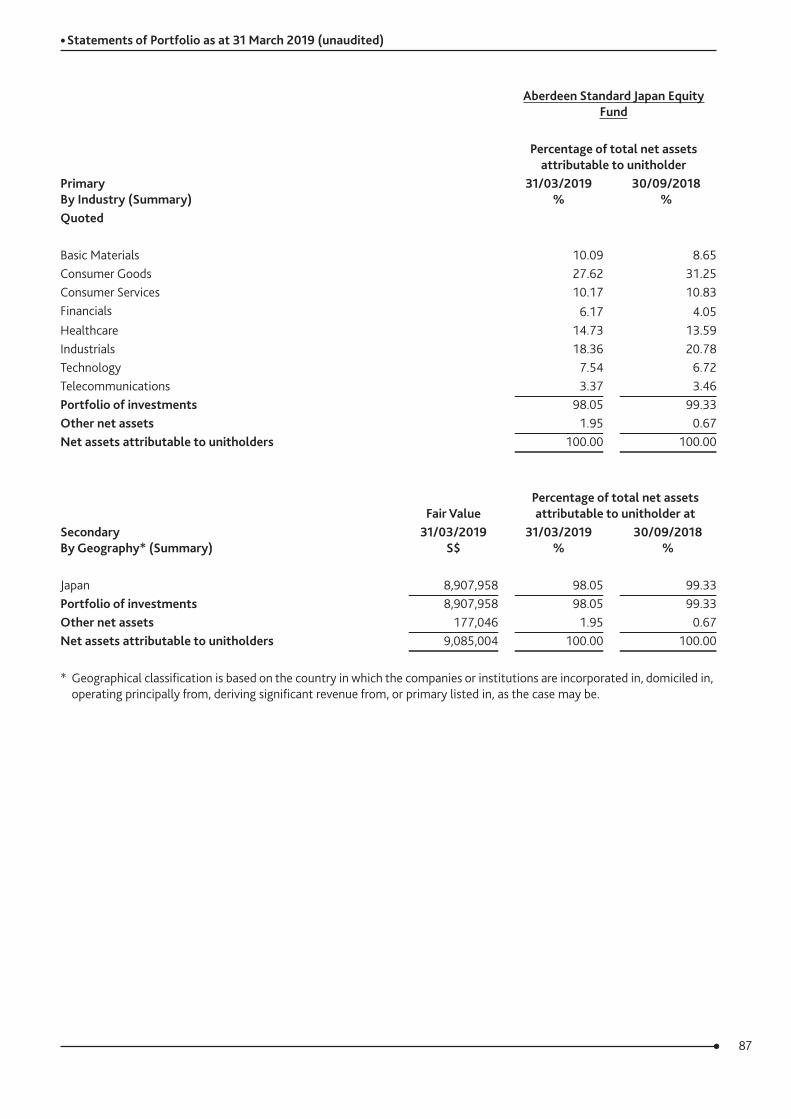
87
• Statements of Portfolio as at 31 March 2019 (unaudited)
Aberdeen Standard Japan Equity Fund
Percentage of total net assets attributable to unitholder
Primary By Industry (Summary)
31/03/2019 %
30/09/2018 %
Quoted
Basic Materials 10.09 8.65Consumer Goods 27.62 31.25Consumer Services 10.17 10.83Financials 6.17 4.05Healthcare 14.73 13.59Industrials 18.36 20.78Technology 7.54 6.72Telecommunications 3.37 3.46 Portfolio of investments 98.05 99.33Other net assets 1.95 0.67 Net assets attributable to unitholders 100.00 100.00
Secondary By Geography* (Summary)
Fair ValuePercentage of total net assets attributable to unitholder at
31/03/2019 S$
31/03/2019 %
30/09/2018 %
Japan 8,907,958 98.05 99.33Portfolio of investments 8,907,958 98.05 99.33Other net assets 177,046 1.95 0.67Net assets attributable to unitholders 9,085,004 100.00 100.00
* Geographical classification is based on the country in which the companies or institutions are incorporated in, domiciled in, operating principally from, deriving significant revenue from, or primary listed in, as the case may be.
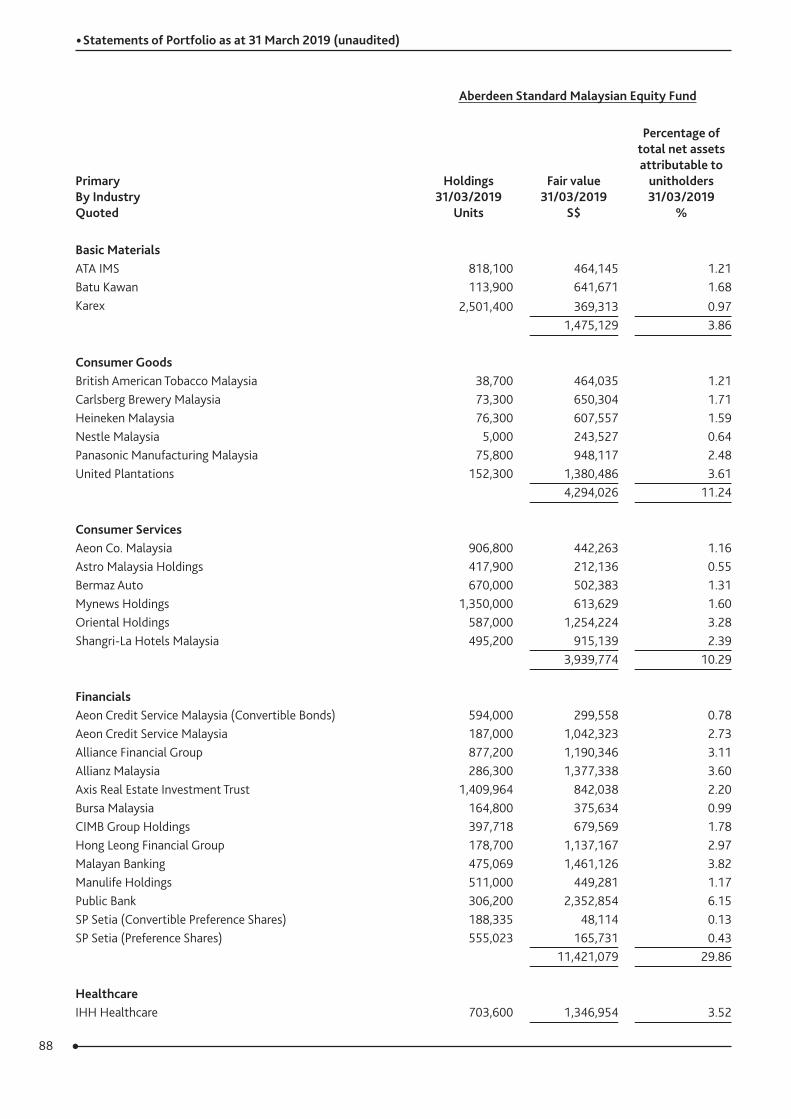
88
• Statements of Portfolio as at 31 March 2019 (unaudited)
Aberdeen Standard Malaysian Equity Fund
Primary By Industry Quoted
Holdings 31/03/2019
Units
Fair value 31/03/2019
S$
Percentage of total net assets attributable to
unitholders 31/03/2019
%
Basic MaterialsATA IMS 818,100 464,145 1.21Batu Kawan 113,900 641,671 1.68Karex 2,501,400 369,313 0.97
1,475,129 3.86
Consumer GoodsBritish American Tobacco Malaysia 38,700 464,035 1.21Carlsberg Brewery Malaysia 73,300 650,304 1.71Heineken Malaysia 76,300 607,557 1.59Nestle Malaysia 5,000 243,527 0.64Panasonic Manufacturing Malaysia 75,800 948,117 2.48United Plantations 152,300 1,380,486 3.61
4,294,026 11.24
Consumer ServicesAeon Co. Malaysia 906,800 442,263 1.16Astro Malaysia Holdings 417,900 212,136 0.55Bermaz Auto 670,000 502,383 1.31Mynews Holdings 1,350,000 613,629 1.60Oriental Holdings 587,000 1,254,224 3.28Shangri-La Hotels Malaysia 495,200 915,139 2.39
3,939,774 10.29
FinancialsAeon Credit Service Malaysia (Convertible Bonds) 594,000 299,558 0.78Aeon Credit Service Malaysia 187,000 1,042,323 2.73Alliance Financial Group 877,200 1,190,346 3.11Allianz Malaysia 286,300 1,377,338 3.60Axis Real Estate Investment Trust 1,409,964 842,038 2.20Bursa Malaysia 164,800 375,634 0.99CIMB Group Holdings 397,718 679,569 1.78Hong Leong Financial Group 178,700 1,137,167 2.97Malayan Banking 475,069 1,461,126 3.82Manulife Holdings 511,000 449,281 1.17Public Bank 306,200 2,352,854 6.15SP Setia (Convertible Preference Shares) 188,335 48,114 0.13SP Setia (Preference Shares) 555,023 165,731 0.43
11,421,079 29.86
HealthcareIHH Healthcare 703,600 1,346,954 3.52
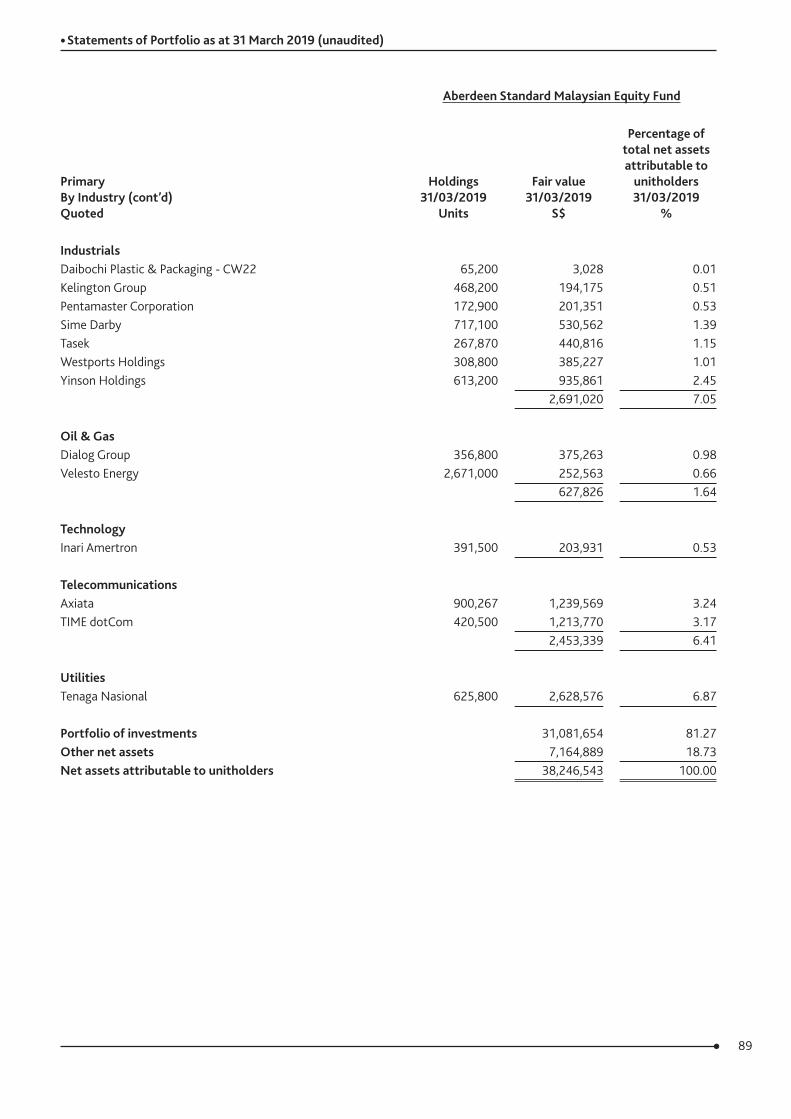
89
• Statements of Portfolio as at 31 March 2019 (unaudited)
Aberdeen Standard Malaysian Equity Fund
Primary By Industry (cont’d) Quoted
Holdings 31/03/2019
Units
Fair value 31/03/2019
S$
Percentage of total net assets attributable to
unitholders 31/03/2019
%
IndustrialsDaibochi Plastic & Packaging - CW22 65,200 3,028 0.01Kelington Group 468,200 194,175 0.51Pentamaster Corporation 172,900 201,351 0.53Sime Darby 717,100 530,562 1.39Tasek 267,870 440,816 1.15Westports Holdings 308,800 385,227 1.01Yinson Holdings 613,200 935,861 2.45
2,691,020 7.05 Oil & GasDialog Group 356,800 375,263 0.98Velesto Energy 2,671,000 252,563 0.66
627,826 1.64
TechnologyInari Amertron 391,500 203,931 0.53
TelecommunicationsAxiata 900,267 1,239,569 3.24TIME dotCom 420,500 1,213,770 3.17
2,453,339 6.41
UtilitiesTenaga Nasional 625,800 2,628,576 6.87
Portfolio of investments 31,081,654 81.27Other net assets 7,164,889 18.73Net assets attributable to unitholders 38,246,543 100.00
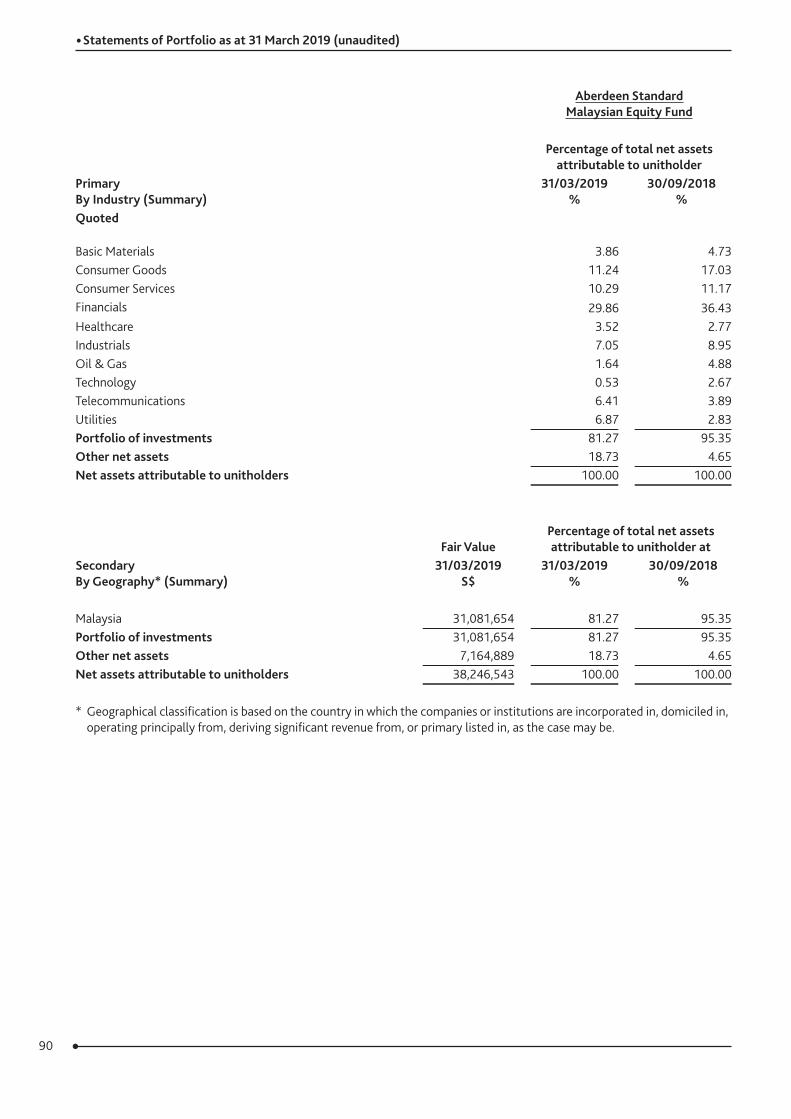
90
• Statements of Portfolio as at 31 March 2019 (unaudited)
Aberdeen Standard Malaysian Equity Fund
Percentage of total net assets attributable to unitholder
Primary By Industry (Summary)
31/03/2019 %
30/09/2018 %
Quoted
Basic Materials 3.86 4.73Consumer Goods 11.24 17.03Consumer Services 10.29 11.17Financials 29.86 36.43Healthcare 3.52 2.77Industrials 7.05 8.95Oil & Gas 1.64 4.88Technology 0.53 2.67Telecommunications 6.41 3.89Utilities 6.87 2.83 Portfolio of investments 81.27 95.35Other net assets 18.73 4.65 Net assets attributable to unitholders 100.00 100.00
Secondary By Geography* (Summary)
Fair ValuePercentage of total net assets attributable to unitholder at
31/03/2019 S$
31/03/2019 %
30/09/2018 %
Malaysia 31,081,654 81.27 95.35 Portfolio of investments 31,081,654 81.27 95.35Other net assets 7,164,889 18.73 4.65 Net assets attributable to unitholders 38,246,543 100.00 100.00
* Geographical classification is based on the country in which the companies or institutions are incorporated in, domiciled in, operating principally from, deriving significant revenue from, or primary listed in, as the case may be.
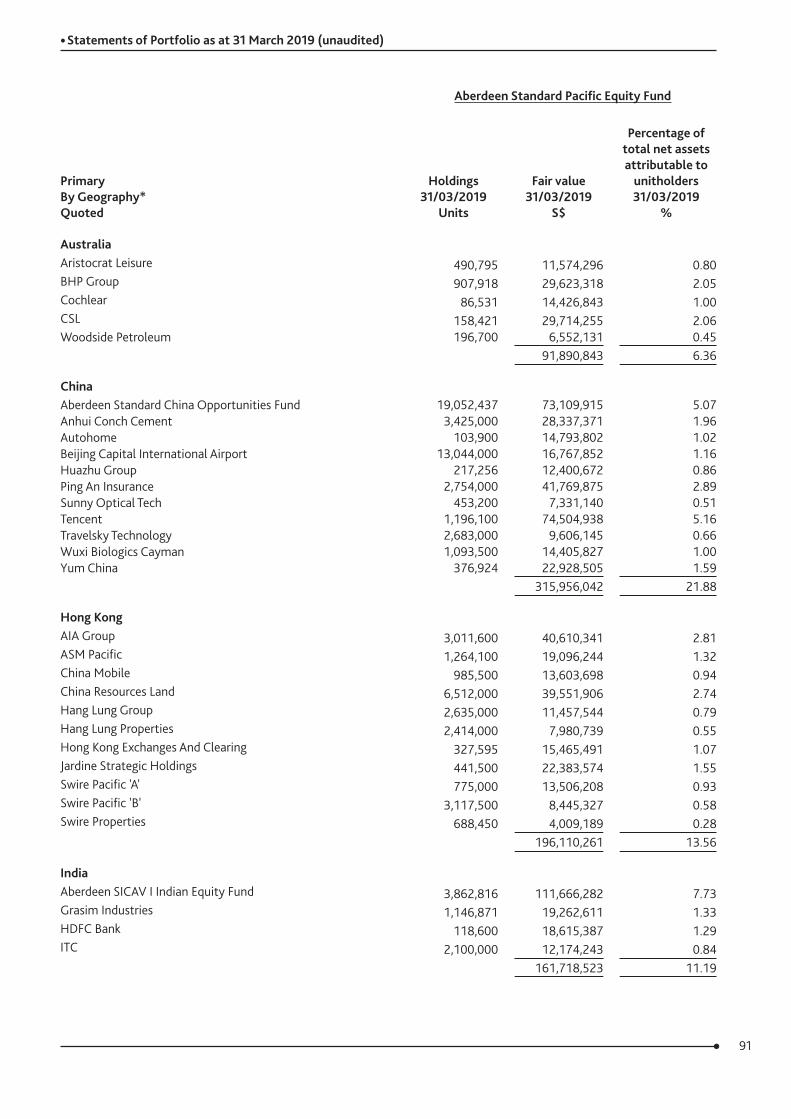
91
• Statements of Portfolio as at 31 March 2019 (unaudited)
Aberdeen Standard Pacific Equity Fund
Primary By Geography* Quoted
Holdings 31/03/2019
Units
Fair value 31/03/2019
S$
Percentage of total net assets attributable to
unitholders 31/03/2019
%
AustraliaAristocrat Leisure 490,795 11,574,296 0.80BHP Group 907,918 29,623,318 2.05Cochlear 86,531 14,426,843 1.00CSL 158,421 29,714,255 2.06Woodside Petroleum 196,700 6,552,131 0.45
91,890,843 6.36
ChinaAberdeen Standard China Opportunities Fund 19,052,437 73,109,915 5.07Anhui Conch Cement 3,425,000 28,337,371 1.96Autohome 103,900 14,793,802 1.02Beijing Capital International Airport 13,044,000 16,767,852 1.16Huazhu Group 217,256 12,400,672 0.86Ping An Insurance 2,754,000 41,769,875 2.89Sunny Optical Tech 453,200 7,331,140 0.51Tencent 1,196,100 74,504,938 5.16Travelsky Technology 2,683,000 9,606,145 0.66Wuxi Biologics Cayman 1,093,500 14,405,827 1.00Yum China 376,924 22,928,505 1.59
315,956,042 21.88
Hong KongAIA Group 3,011,600 40,610,341 2.81ASM Pacific 1,264,100 19,096,244 1.32China Mobile 985,500 13,603,698 0.94China Resources Land 6,512,000 39,551,906 2.74Hang Lung Group 2,635,000 11,457,544 0.79Hang Lung Properties 2,414,000 7,980,739 0.55Hong Kong Exchanges And Clearing 327,595 15,465,491 1.07Jardine Strategic Holdings 441,500 22,383,574 1.55Swire Pacific 'A' 775,000 13,506,208 0.93Swire Pacific 'B' 3,117,500 8,445,327 0.58Swire Properties 688,450 4,009,189 0.28
196,110,261 13.56
IndiaAberdeen SICAV I Indian Equity Fund 3,862,816 111,666,282 7.73Grasim Industries 1,146,871 19,262,611 1.33HDFC Bank 118,600 18,615,387 1.29ITC 2,100,000 12,174,243 0.84
161,718,523 11.19
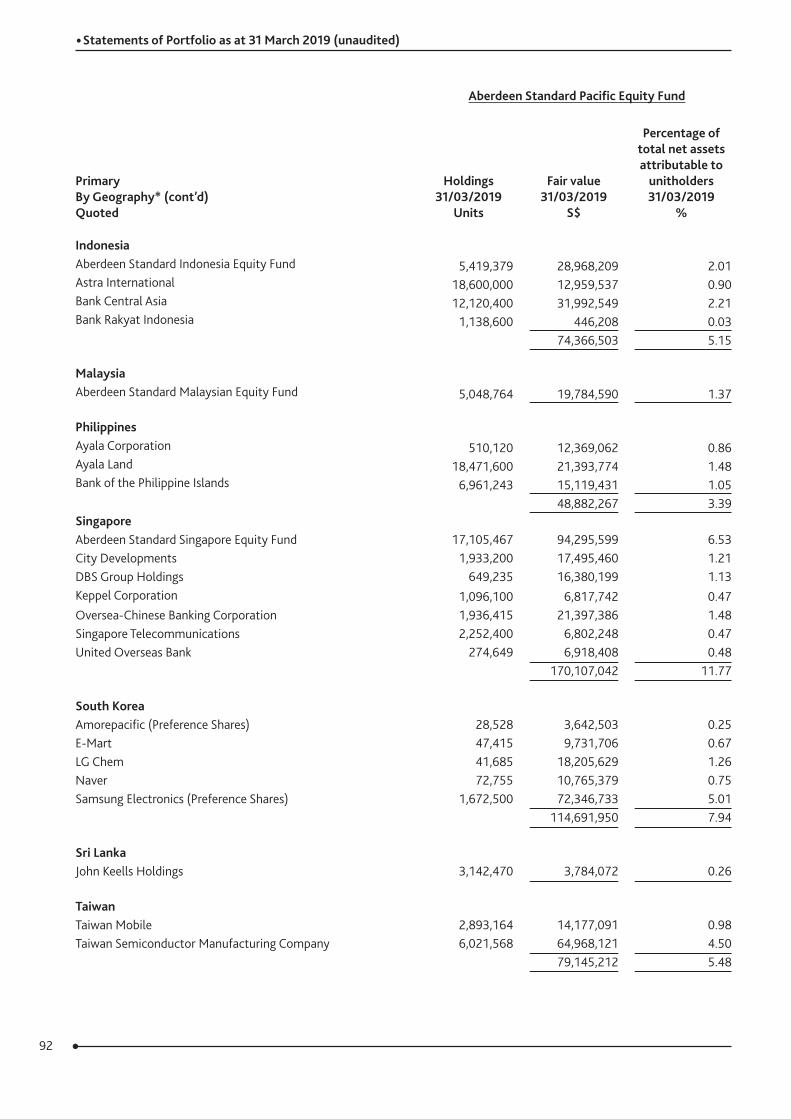
92
• Statements of Portfolio as at 31 March 2019 (unaudited)
Aberdeen Standard Pacific Equity Fund
Primary By Geography* (cont’d) Quoted
Holdings 31/03/2019
Units
Fair value 31/03/2019
S$
Percentage of total net assets attributable to
unitholders 31/03/2019
%
IndonesiaAberdeen Standard Indonesia Equity Fund 5,419,379 28,968,209 2.01Astra International 18,600,000 12,959,537 0.90Bank Central Asia 12,120,400 31,992,549 2.21Bank Rakyat Indonesia 1,138,600 446,208 0.03
74,366,503 5.15
MalaysiaAberdeen Standard Malaysian Equity Fund 5,048,764 19,784,590 1.37
PhilippinesAyala Corporation 510,120 12,369,062 0.86Ayala Land 18,471,600 21,393,774 1.48Bank of the Philippine Islands 6,961,243 15,119,431 1.05
48,882,267 3.39SingaporeAberdeen Standard Singapore Equity Fund 17,105,467 94,295,599 6.53City Developments 1,933,200 17,495,460 1.21DBS Group Holdings 649,235 16,380,199 1.13Keppel Corporation 1,096,100 6,817,742 0.47Oversea-Chinese Banking Corporation 1,936,415 21,397,386 1.48Singapore Telecommunications 2,252,400 6,802,248 0.47United Overseas Bank 274,649 6,918,408 0.48
170,107,042 11.77 South KoreaAmorepacific (Preference Shares) 28,528 3,642,503 0.25E-Mart 47,415 9,731,706 0.67LG Chem 41,685 18,205,629 1.26Naver 72,755 10,765,379 0.75Samsung Electronics (Preference Shares) 1,672,500 72,346,733 5.01
114,691,950 7.94
Sri LankaJohn Keells Holdings 3,142,470 3,784,072 0.26
TaiwanTaiwan Mobile 2,893,164 14,177,091 0.98Taiwan Semiconductor Manufacturing Company 6,021,568 64,968,121 4.50
79,145,212 5.48
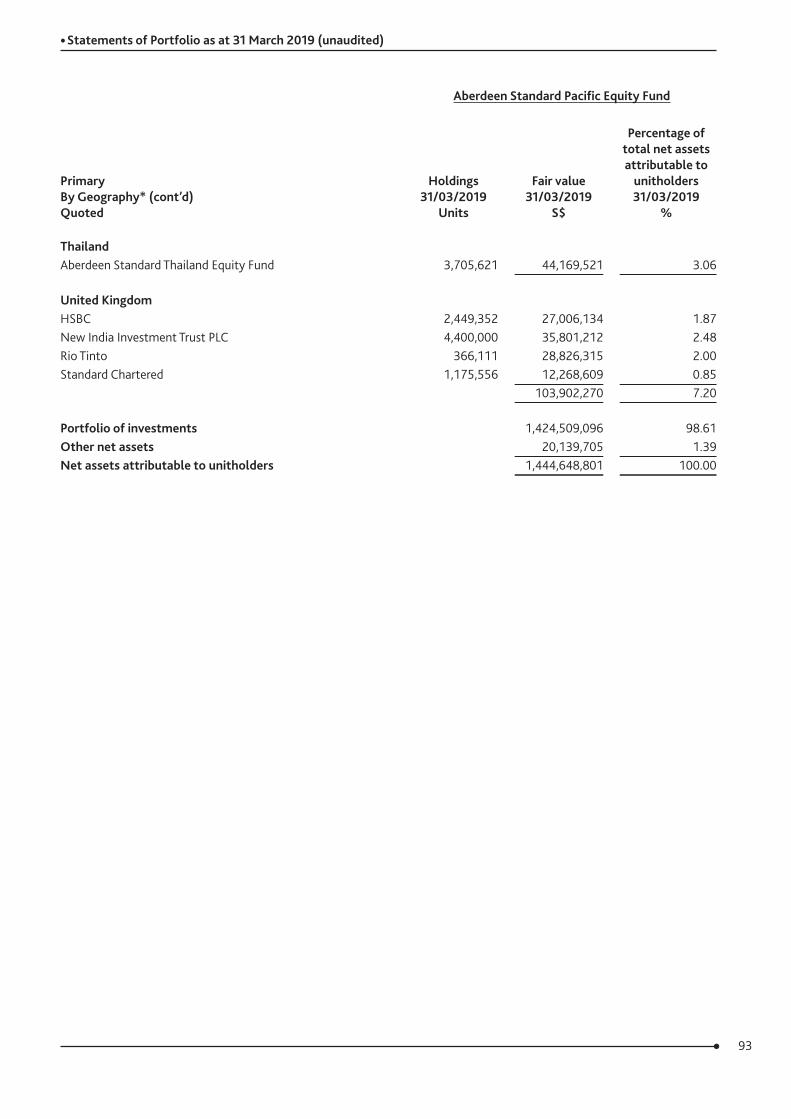
93
• Statements of Portfolio as at 31 March 2019 (unaudited)
Aberdeen Standard Pacific Equity Fund
Primary By Geography* (cont’d) Quoted
Holdings 31/03/2019
Units
Fair value 31/03/2019
S$
Percentage of total net assets attributable to
unitholders 31/03/2019
%
ThailandAberdeen Standard Thailand Equity Fund 3,705,621 44,169,521 3.06
United KingdomHSBC 2,449,352 27,006,134 1.87New India Investment Trust PLC 4,400,000 35,801,212 2.48Rio Tinto 366,111 28,826,315 2.00Standard Chartered 1,175,556 12,268,609 0.85
103,902,270 7.20
Portfolio of investments 1,424,509,096 98.61Other net assets 20,139,705 1.39Net assets attributable to unitholders 1,444,648,801 100.00
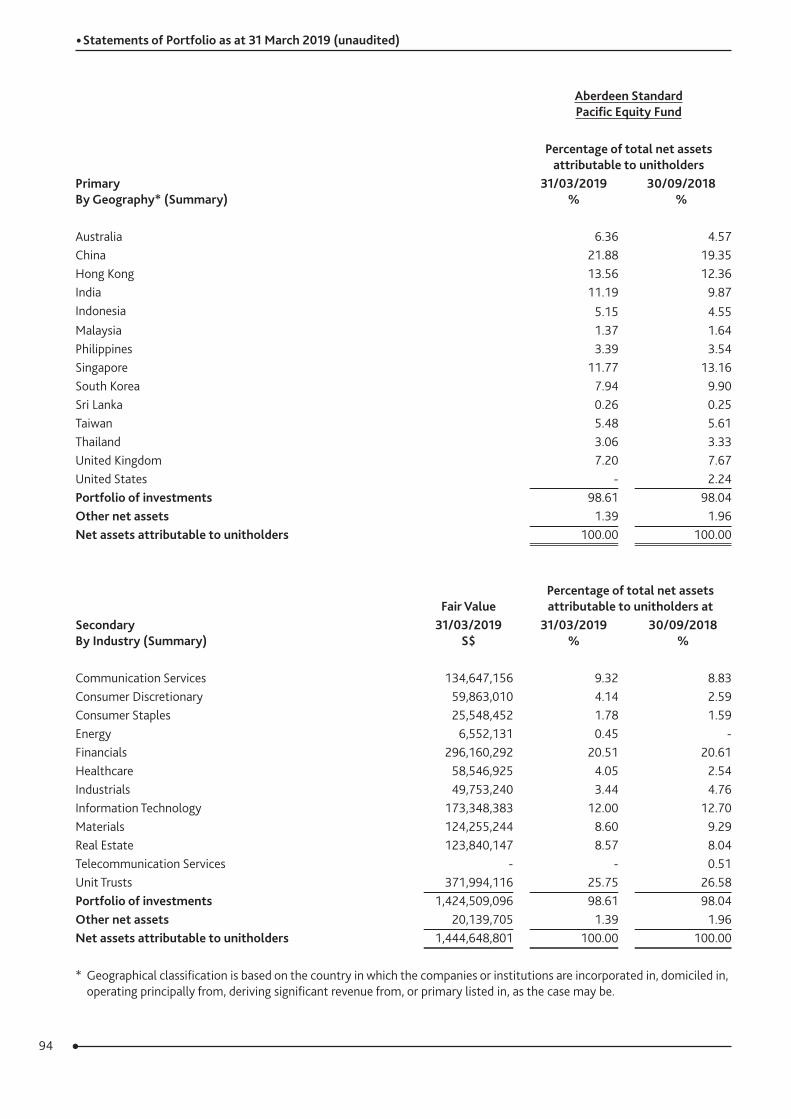
94
• Statements of Portfolio as at 31 March 2019 (unaudited)
Aberdeen Standard Pacific Equity Fund
Percentage of total net assets attributable to unitholders
Primary By Geography* (Summary)
31/03/2019 %
30/09/2018 %
Australia 6.36 4.57China 21.88 19.35Hong Kong 13.56 12.36India 11.19 9.87Indonesia 5.15 4.55Malaysia 1.37 1.64Philippines 3.39 3.54Singapore 11.77 13.16South Korea 7.94 9.90Sri Lanka 0.26 0.25Taiwan 5.48 5.61Thailand 3.06 3.33United Kingdom 7.20 7.67United States - 2.24 Portfolio of investments 98.61 98.04Other net assets 1.39 1.96 Net assets attributable to unitholders 100.00 100.00
Secondary By Industry (Summary)
Fair ValuePercentage of total net assets attributable to unitholders at
31/03/2019 S$
31/03/2019 %
30/09/2018 %
Communication Services 134,647,156 9.32 8.83Consumer Discretionary 59,863,010 4.14 2.59Consumer Staples 25,548,452 1.78 1.59Energy 6,552,131 0.45 -Financials 296,160,292 20.51 20.61Healthcare 58,546,925 4.05 2.54Industrials 49,753,240 3.44 4.76Information Technology 173,348,383 12.00 12.70Materials 124,255,244 8.60 9.29Real Estate 123,840,147 8.57 8.04Telecommunication Services - - 0.51Unit Trusts 371,994,116 25.75 26.58 Portfolio of investments 1,424,509,096 98.61 98.04Other net assets 20,139,705 1.39 1.96 Net assets attributable to unitholders 1,444,648,801 100.00 100.00
* Geographical classification is based on the country in which the companies or institutions are incorporated in, domiciled in, operating principally from, deriving significant revenue from, or primary listed in, as the case may be.
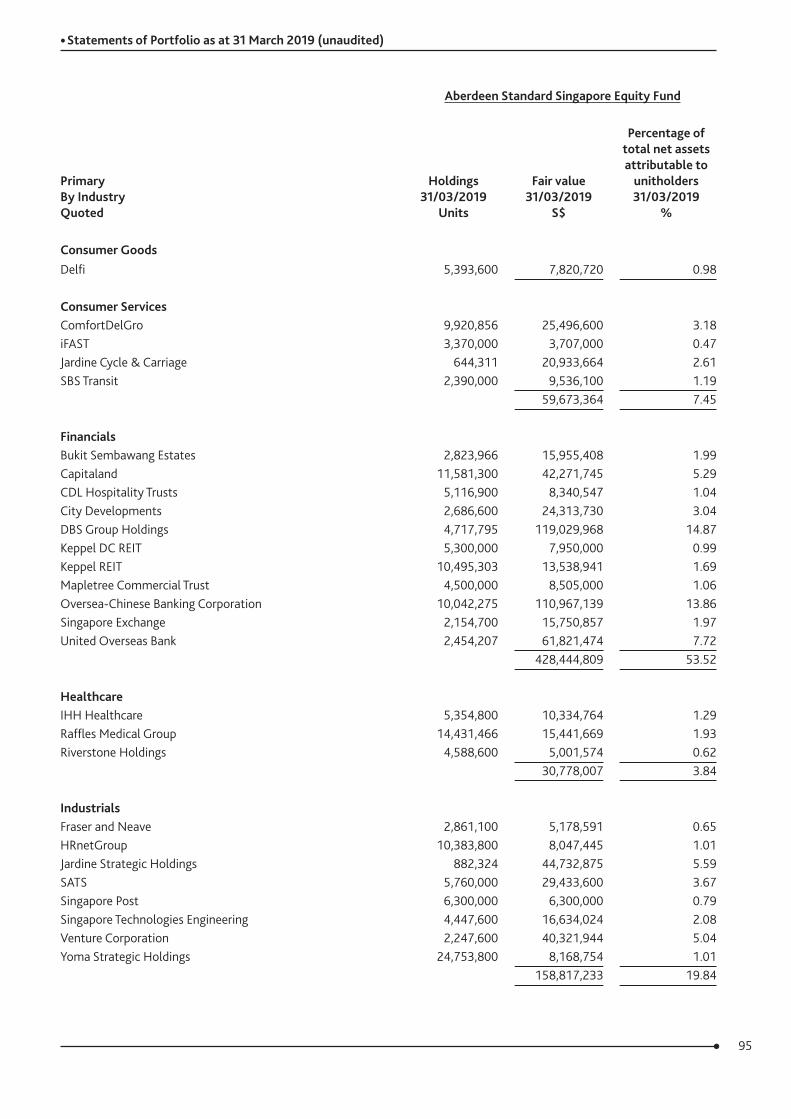
95
• Statements of Portfolio as at 31 March 2019 (unaudited)
Aberdeen Standard Singapore Equity Fund
Primary By Industry Quoted
Holdings 31/03/2019
Units
Fair value 31/03/2019
S$
Percentage of total net assets attributable to
unitholders 31/03/2019
%
Consumer GoodsDelfi 5,393,600 7,820,720 0.98
Consumer ServicesComfortDelGro 9,920,856 25,496,600 3.18iFAST 3,370,000 3,707,000 0.47Jardine Cycle & Carriage 644,311 20,933,664 2.61SBS Transit 2,390,000 9,536,100 1.19
59,673,364 7.45
FinancialsBukit Sembawang Estates 2,823,966 15,955,408 1.99Capitaland 11,581,300 42,271,745 5.29CDL Hospitality Trusts 5,116,900 8,340,547 1.04City Developments 2,686,600 24,313,730 3.04DBS Group Holdings 4,717,795 119,029,968 14.87Keppel DC REIT 5,300,000 7,950,000 0.99Keppel REIT 10,495,303 13,538,941 1.69Mapletree Commercial Trust 4,500,000 8,505,000 1.06Oversea-Chinese Banking Corporation 10,042,275 110,967,139 13.86Singapore Exchange 2,154,700 15,750,857 1.97United Overseas Bank 2,454,207 61,821,474 7.72
428,444,809 53.52
HealthcareIHH Healthcare 5,354,800 10,334,764 1.29Raffles Medical Group 14,431,466 15,441,669 1.93Riverstone Holdings 4,588,600 5,001,574 0.62
30,778,007 3.84
IndustrialsFraser and Neave 2,861,100 5,178,591 0.65HRnetGroup 10,383,800 8,047,445 1.01Jardine Strategic Holdings 882,324 44,732,875 5.59SATS 5,760,000 29,433,600 3.67Singapore Post 6,300,000 6,300,000 0.79Singapore Technologies Engineering 4,447,600 16,634,024 2.08Venture Corporation 2,247,600 40,321,944 5.04Yoma Strategic Holdings 24,753,800 8,168,754 1.01
158,817,233 19.84
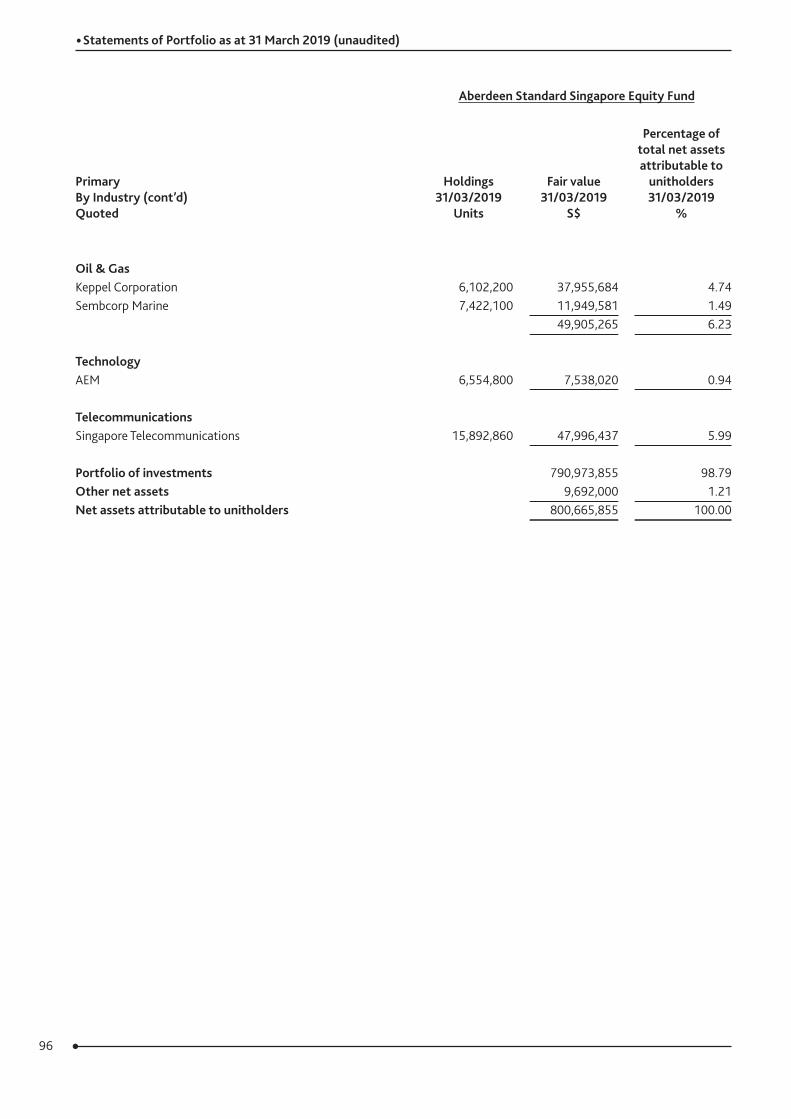
96
• Statements of Portfolio as at 31 March 2019 (unaudited)
Aberdeen Standard Singapore Equity Fund
Primary By Industry (cont’d) Quoted
Holdings 31/03/2019
Units
Fair value 31/03/2019
S$
Percentage of total net assets attributable to
unitholders 31/03/2019
%
Oil & GasKeppel Corporation 6,102,200 37,955,684 4.74Sembcorp Marine 7,422,100 11,949,581 1.49
49,905,265 6.23
TechnologyAEM 6,554,800 7,538,020 0.94
TelecommunicationsSingapore Telecommunications 15,892,860 47,996,437 5.99
Portfolio of investments 790,973,855 98.79Other net assets 9,692,000 1.21Net assets attributable to unitholders 800,665,855 100.00
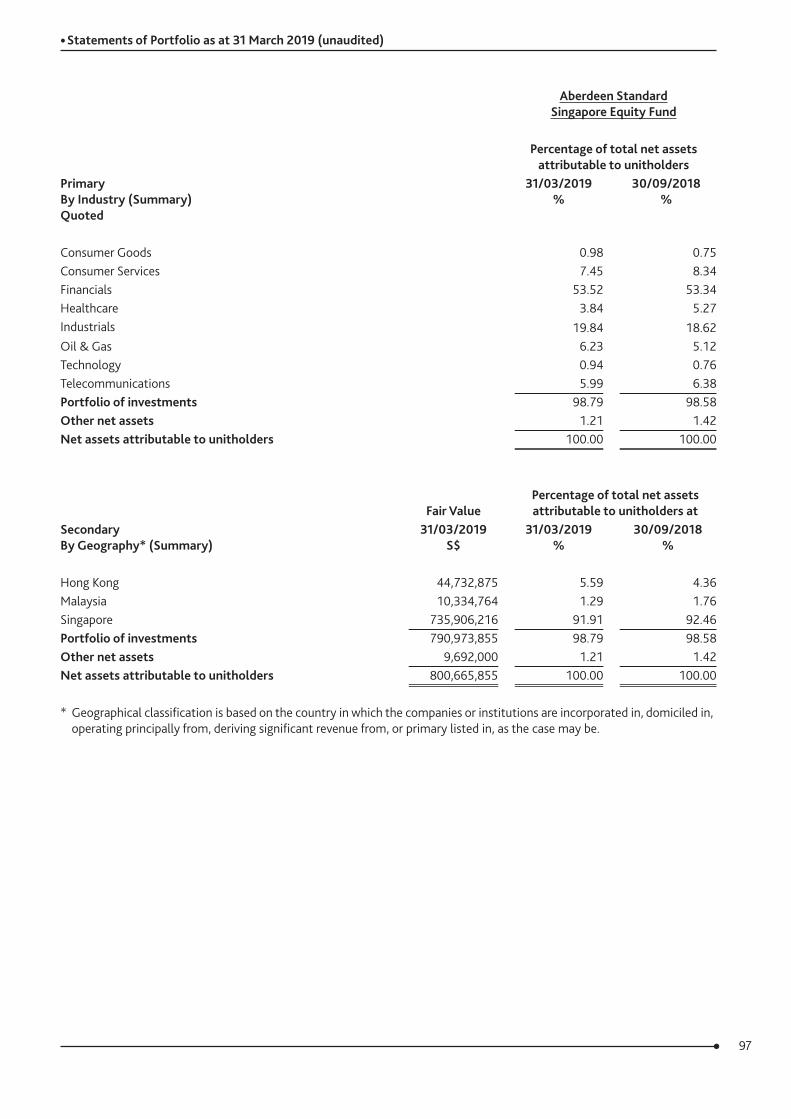
97
• Statements of Portfolio as at 31 March 2019 (unaudited)
Aberdeen Standard Singapore Equity Fund
Percentage of total net assets attributable to unitholders
Primary By Industry (Summary) Quoted
31/03/2019 %
30/09/2018 %
Consumer Goods 0.98 0.75Consumer Services 7.45 8.34Financials 53.52 53.34Healthcare 3.84 5.27Industrials 19.84 18.62Oil & Gas 6.23 5.12Technology 0.94 0.76Telecommunications 5.99 6.38 Portfolio of investments 98.79 98.58Other net assets 1.21 1.42 Net assets attributable to unitholders 100.00 100.00
Secondary By Geography* (Summary)
Fair ValuePercentage of total net assets attributable to unitholders at
31/03/2019 S$
31/03/2019 %
30/09/2018 %
Hong Kong 44,732,875 5.59 4.36Malaysia 10,334,764 1.29 1.76Singapore 735,906,216 91.91 92.46 Portfolio of investments 790,973,855 98.79 98.58Other net assets 9,692,000 1.21 1.42 Net assets attributable to unitholders 800,665,855 100.00 100.00
* Geographical classification is based on the country in which the companies or institutions are incorporated in, domiciled in, operating principally from, deriving significant revenue from, or primary listed in, as the case may be.
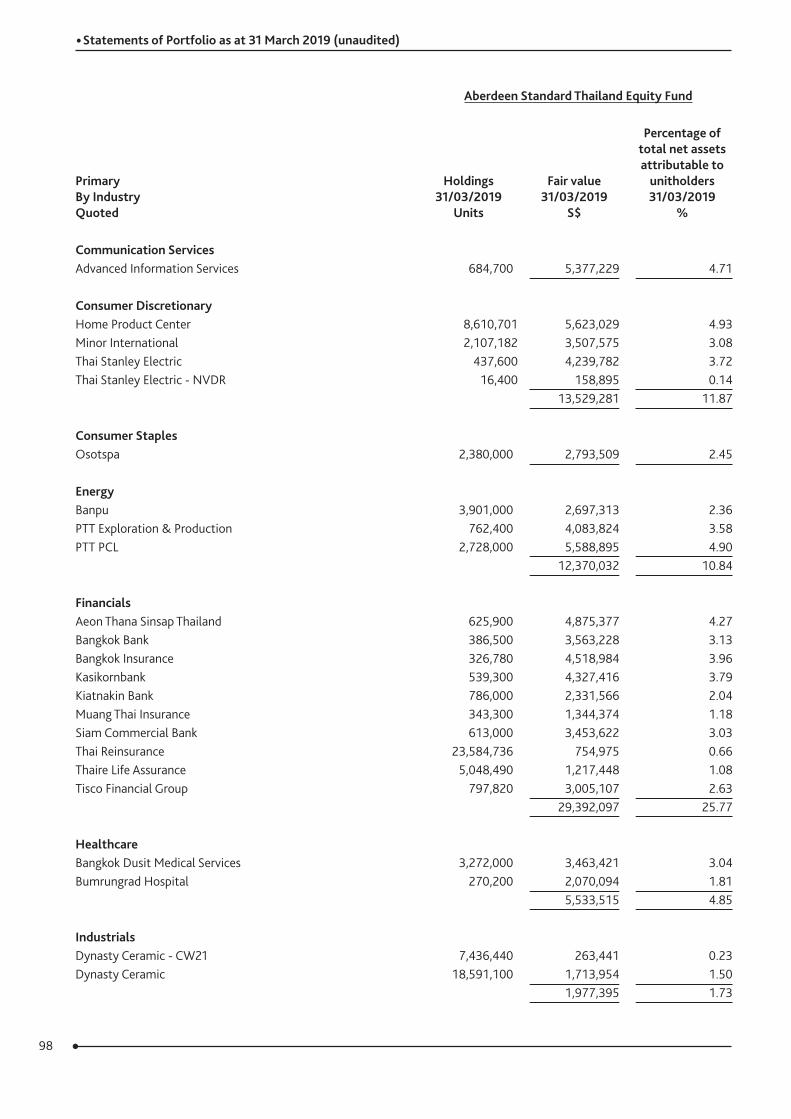
98
• Statements of Portfolio as at 31 March 2019 (unaudited)
Aberdeen Standard Thailand Equity Fund
Primary By Industry Quoted
Holdings 31/03/2019
Units
Fair value 31/03/2019
S$
Percentage of total net assets attributable to
unitholders 31/03/2019
%
Communication ServicesAdvanced Information Services 684,700 5,377,229 4.71
Consumer DiscretionaryHome Product Center 8,610,701 5,623,029 4.93Minor International 2,107,182 3,507,575 3.08Thai Stanley Electric 437,600 4,239,782 3.72Thai Stanley Electric - NVDR 16,400 158,895 0.14
13,529,281 11.87
Consumer StaplesOsotspa 2,380,000 2,793,509 2.45
EnergyBanpu 3,901,000 2,697,313 2.36PTT Exploration & Production 762,400 4,083,824 3.58PTT PCL 2,728,000 5,588,895 4.90
12,370,032 10.84
FinancialsAeon Thana Sinsap Thailand 625,900 4,875,377 4.27Bangkok Bank 386,500 3,563,228 3.13Bangkok Insurance 326,780 4,518,984 3.96Kasikornbank 539,300 4,327,416 3.79Kiatnakin Bank 786,000 2,331,566 2.04Muang Thai Insurance 343,300 1,344,374 1.18Siam Commercial Bank 613,000 3,453,622 3.03Thai Reinsurance 23,584,736 754,975 0.66Thaire Life Assurance 5,048,490 1,217,448 1.08Tisco Financial Group 797,820 3,005,107 2.63
29,392,097 25.77
HealthcareBangkok Dusit Medical Services 3,272,000 3,463,421 3.04Bumrungrad Hospital 270,200 2,070,094 1.81
5,533,515 4.85
IndustrialsDynasty Ceramic - CW21 7,436,440 263,441 0.23Dynasty Ceramic 18,591,100 1,713,954 1.50
1,977,395 1.73
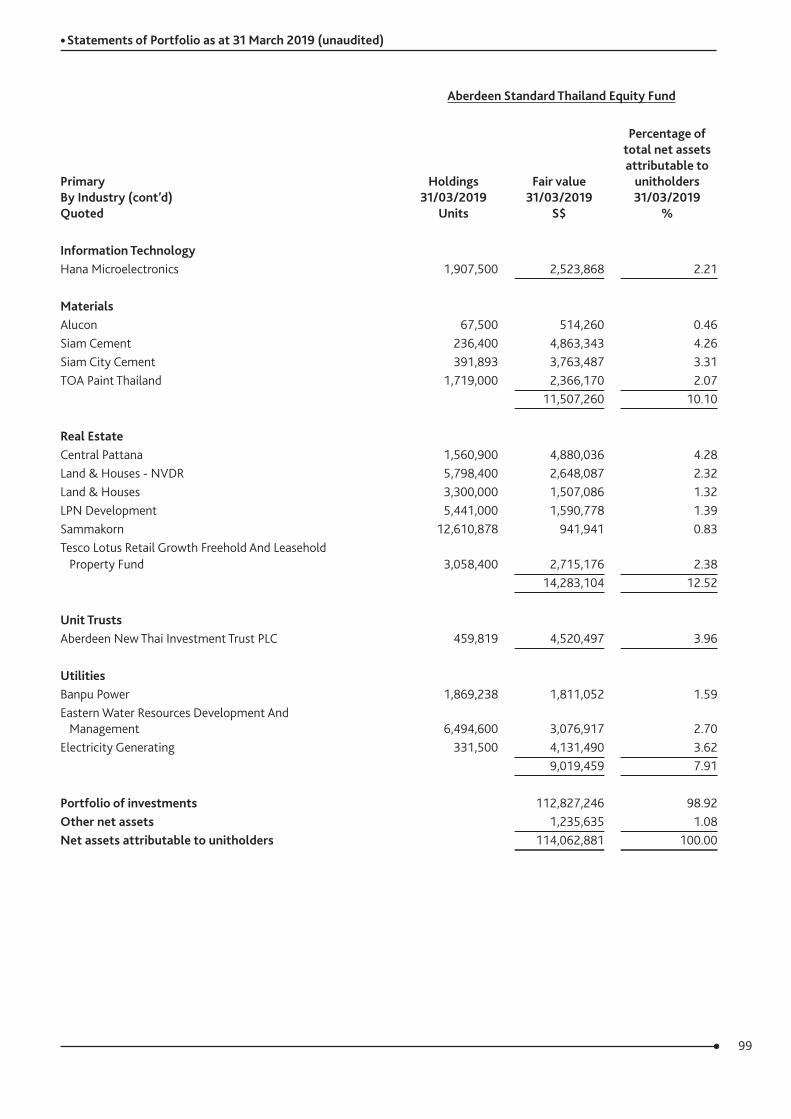
99
• Statements of Portfolio as at 31 March 2019 (unaudited)
Aberdeen Standard Thailand Equity Fund
Primary By Industry (cont’d) Quoted
Holdings 31/03/2019
Units
Fair value 31/03/2019
S$
Percentage of total net assets attributable to
unitholders 31/03/2019
%
Information TechnologyHana Microelectronics 1,907,500 2,523,868 2.21
MaterialsAlucon 67,500 514,260 0.46Siam Cement 236,400 4,863,343 4.26Siam City Cement 391,893 3,763,487 3.31TOA Paint Thailand 1,719,000 2,366,170 2.07
11,507,260 10.10
Real EstateCentral Pattana 1,560,900 4,880,036 4.28Land & Houses - NVDR 5,798,400 2,648,087 2.32Land & Houses 3,300,000 1,507,086 1.32LPN Development 5,441,000 1,590,778 1.39Sammakorn 12,610,878 941,941 0.83Tesco Lotus Retail Growth Freehold And Leasehold Property Fund 3,058,400 2,715,176 2.38
14,283,104 12.52
Unit TrustsAberdeen New Thai Investment Trust PLC 459,819 4,520,497 3.96
UtilitiesBanpu Power 1,869,238 1,811,052 1.59Eastern Water Resources Development And Management 6,494,600 3,076,917 2.70Electricity Generating 331,500 4,131,490 3.62
9,019,459 7.91
Portfolio of investments 112,827,246 98.92Other net assets 1,235,635 1.08Net assets attributable to unitholders 114,062,881 100.00
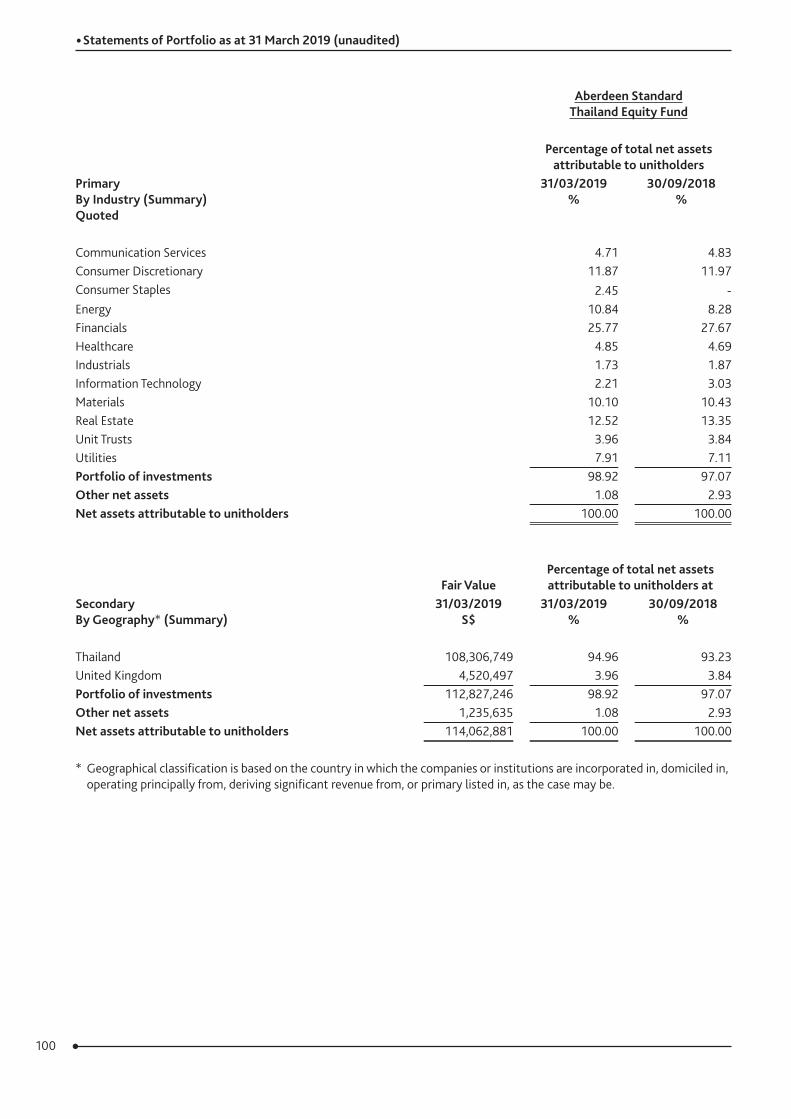
100
• Statements of Portfolio as at 31 March 2019 (unaudited)
Aberdeen Standard Thailand Equity Fund
Percentage of total net assets attributable to unitholders
Primary By Industry (Summary) Quoted
31/03/2019 %
30/09/2018 %
Communication Services 4.71 4.83Consumer Discretionary 11.87 11.97Consumer Staples 2.45 -Energy 10.84 8.28Financials 25.77 27.67Healthcare 4.85 4.69Industrials 1.73 1.87Information Technology 2.21 3.03Materials 10.10 10.43Real Estate 12.52 13.35Unit Trusts 3.96 3.84Utilities 7.91 7.11 Portfolio of investments 98.92 97.07Other net assets 1.08 2.93 Net assets attributable to unitholders 100.00 100.00
Secondary By Geography* (Summary)
Fair ValuePercentage of total net assets attributable to unitholders at
31/03/2019 S$
31/03/2019 %
30/09/2018 %
Thailand 108,306,749 94.96 93.23United Kingdom 4,520,497 3.96 3.84 Portfolio of investments 112,827,246 98.92 97.07Other net assets 1,235,635 1.08 2.93 Net assets attributable to unitholders 114,062,881 100.00 100.00
* Geographical classification is based on the country in which the companies or institutions are incorporated in, domiciled in, operating principally from, deriving significant revenue from, or primary listed in, as the case may be.
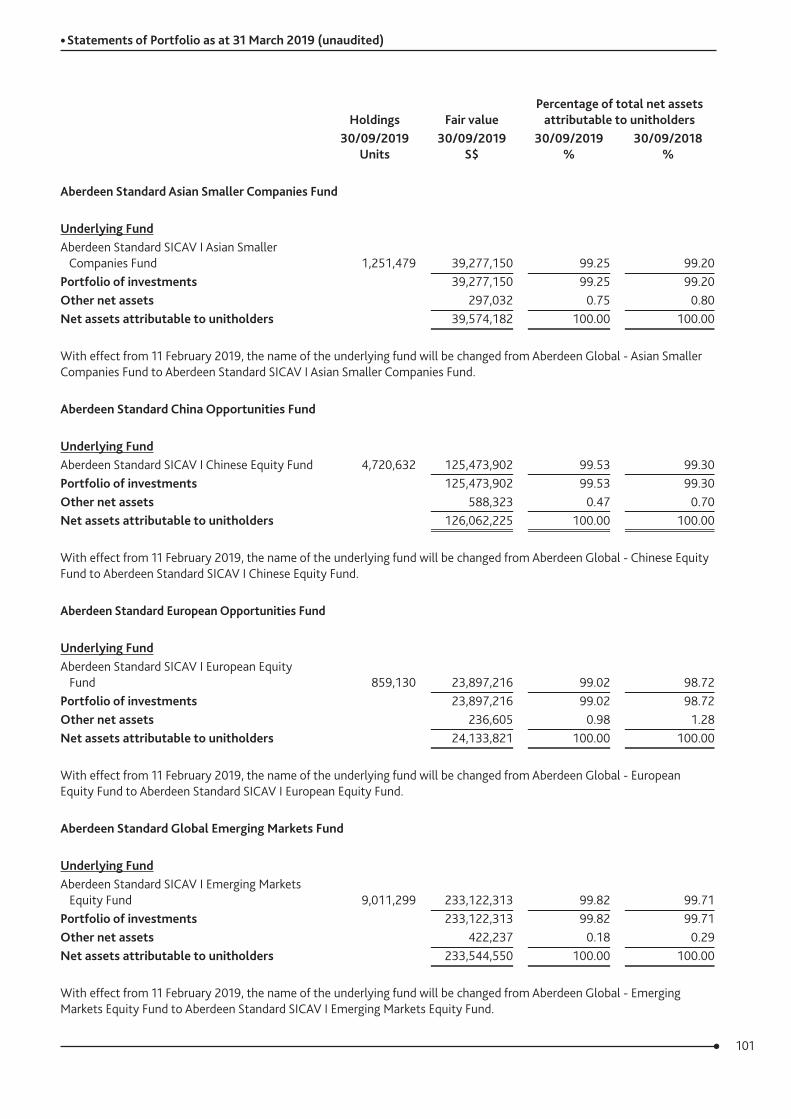
101
• Statements of Portfolio as at 31 March 2019 (unaudited)
Holdings Fair valuePercentage of total net assets
attributable to unitholders30/09/2019
Units30/09/2019
S$30/09/2019
%30/09/2018
%
Aberdeen Standard Asian Smaller Companies Fund
Underlying FundAberdeen Standard SICAV I Asian Smaller Companies Fund 1,251,479 39,277,150 99.25 99.20Portfolio of investments 39,277,150 99.25 99.20Other net assets 297,032 0.75 0.80Net assets attributable to unitholders 39,574,182 100.00 100.00
With effect from 11 February 2019, the name of the underlying fund will be changed from Aberdeen Global - Asian Smaller Companies Fund to Aberdeen Standard SICAV I Asian Smaller Companies Fund.
Aberdeen Standard China Opportunities Fund
Underlying FundAberdeen Standard SICAV I Chinese Equity Fund 4,720,632 125,473,902 99.53 99.30Portfolio of investments 125,473,902 99.53 99.30Other net assets 588,323 0.47 0.70Net assets attributable to unitholders 126,062,225 100.00 100.00
With effect from 11 February 2019, the name of the underlying fund will be changed from Aberdeen Global - Chinese Equity Fund to Aberdeen Standard SICAV I Chinese Equity Fund.
Aberdeen Standard European Opportunities Fund
Underlying FundAberdeen Standard SICAV I European Equity Fund 859,130 23,897,216 99.02 98.72Portfolio of investments 23,897,216 99.02 98.72Other net assets 236,605 0.98 1.28Net assets attributable to unitholders 24,133,821 100.00 100.00
With effect from 11 February 2019, the name of the underlying fund will be changed from Aberdeen Global - European Equity Fund to Aberdeen Standard SICAV I European Equity Fund.
Aberdeen Standard Global Emerging Markets Fund
Underlying FundAberdeen Standard SICAV I Emerging Markets Equity Fund 9,011,299 233,122,313 99.82 99.71Portfolio of investments 233,122,313 99.82 99.71Other net assets 422,237 0.18 0.29Net assets attributable to unitholders 233,544,550 100.00 100.00
With effect from 11 February 2019, the name of the underlying fund will be changed from Aberdeen Global - Emerging Markets Equity Fund to Aberdeen Standard SICAV I Emerging Markets Equity Fund.
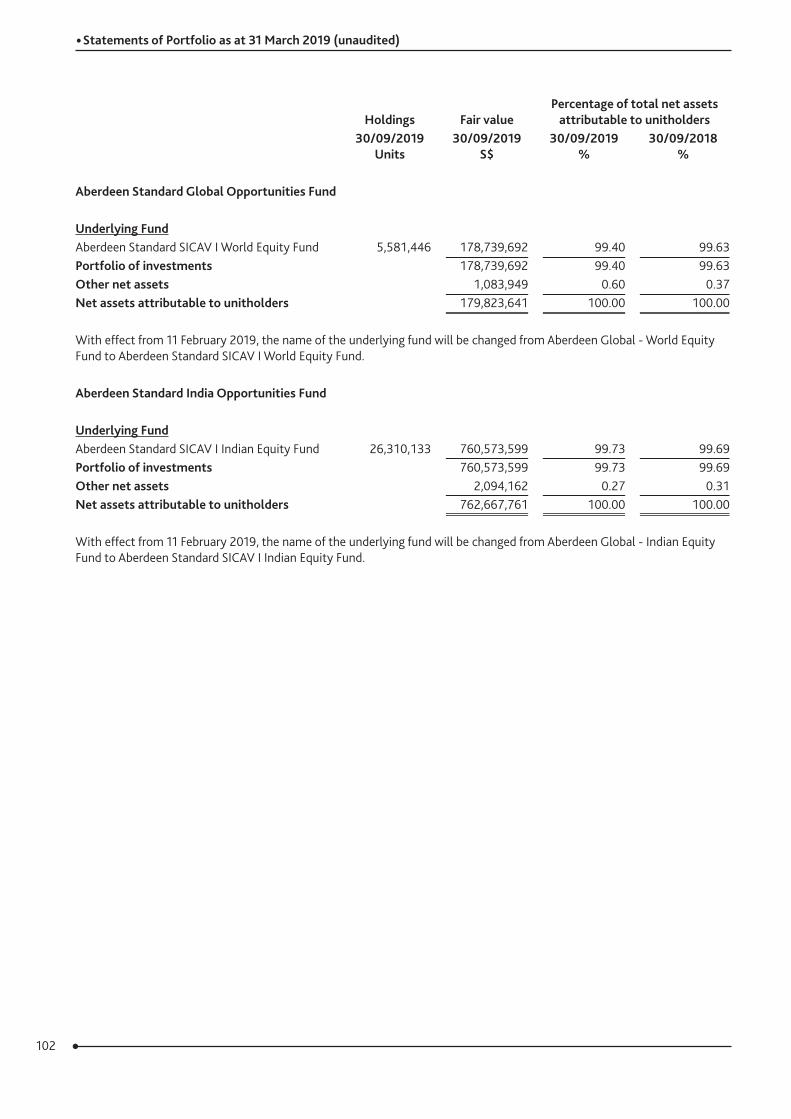
102
• Statements of Portfolio as at 31 March 2019 (unaudited)
Holdings Fair valuePercentage of total net assets
attributable to unitholders30/09/2019
Units30/09/2019
S$30/09/2019
%30/09/2018
%
Aberdeen Standard Global Opportunities Fund
Underlying FundAberdeen Standard SICAV I World Equity Fund 5,581,446 178,739,692 99.40 99.63Portfolio of investments 178,739,692 99.40 99.63Other net assets 1,083,949 0.60 0.37Net assets attributable to unitholders 179,823,641 100.00 100.00
With effect from 11 February 2019, the name of the underlying fund will be changed from Aberdeen Global - World Equity Fund to Aberdeen Standard SICAV I World Equity Fund.
Aberdeen Standard India Opportunities Fund
Underlying FundAberdeen Standard SICAV I Indian Equity Fund 26,310,133 760,573,599 99.73 99.69Portfolio of investments 760,573,599 99.73 99.69Other net assets 2,094,162 0.27 0.31Net assets attributable to unitholders 762,667,761 100.00 100.00
With effect from 11 February 2019, the name of the underlying fund will be changed from Aberdeen Global - Indian Equity Fund to Aberdeen Standard SICAV I Indian Equity Fund.

Important: The contents of this report is strictly for information purposes only and should not be considered an offer, or solicitation, to deal in any of the mentioned funds.
Aberdeen Standard Investments (Asia) Limited (formerly known as Aberdeen Asset Management Asia Limited) (“ASI Asia”) does not warrant the accuracy, adequacy or completeness of the information provided and expressly disclaims liability for any errors or omissions. Any projections or other forward-looking statement regarding future events or performance of countries, markets or companies are not necessarily indicative of, and may differ from, actual events or results. No regard to the investment objectives, financial situation or particular needs of any specific investor has been taken into account in the preparation of the information provided.
Investments in and the rates of returns for any of the mentioned funds are not deposits in, obligations of, guaranteed or insured by ASI Asia, its affiliates, or any of its appointed distributors, and are subject to investment risks, including the possible loss of any principal amount invested. Unit values and any income therefrom for any of the mentioned funds may fall or rise. Past performance is not indicative of future performance.
Investors should read the prospectus and the product highlights sheet of the relevant funds, available from ASI Asia or its website at www.aberdeenstandard.com/singapore/investor, and consider the suitability of any fund for his or her own needs or seek independent advice from a financial adviser, before making any investment commitment. Any person acting upon or in reliance of the information provided does so entirely at his or her own risk.
The fund(s) as well as their underlying fund(s) may use or invest in financial derivative instruments. Please refer to the prospectus of the fund(s) for more information.
The copyright in this report is owned by ASI Asia. No part or parts hereof may be reproduced, copied, broadcast or transmitted in any manner or by any means or stored in any information retrieval systems without the written permission of ASI Asia. The right to make any changes and corrections to the above information at any time and without notice, is hereby reserved.
Aberdeen Standard Investments (Asia) Limited (formerly known as Aberdeen Asset Management Asia Limited), Registration Number 199105448E

Aberdeen Standard Investments (Asia) Limited(Registration Number 199105448E)
21 Church Street, #01-01 Capital Square TwoSingapore 049480Tel: 1800 395 2709Fax: +65 6632 2993
www.aberdeenstandard.com/singapore/investor