ABDALA, AHMED A. Solution rheology and microstructure of ...
219
ABDALA, AHMED A. Solution rheology and microstructure of associative polymers (under the direction of Dr. Saad Khan and Dr. Alan Tonelli) Water-soluble associative polymers are widely used in a variety of applications because of their ability to modulate rheology and material microstructures. This study focuses on understanding the structure-property relationship for hydrophobically modified alkali soluble emulsion (HASE) polymers with emphasis on their microstructure and rheological properties. These polymers have a complex comb-like structure that is a polyelectrolyte backbone, a copolymer of acrylic or methacrylic acid and alkyl acrylate, with a few hydrophobic macromonomers randomly grafted to this backbone. The hydrophobic macromonomer consists of hydrophobic groups that are separated from the polymer chains by polyethylene oxide (PEO) spacers. Upon neutralization, the polymer backbone adopts a more extended conformation allowing the hydrophobic groups to associate forming a transient network structure that enhances the solution rheological properties. In the first part of this study, we investigate the effect of the polymer composition on their microstructures and rheological properties. In particular, the effects of the concentrations of methacrylic acid (MAA) and macromonomers on the solution rheology are examined. We find that polymers with low MAA content have smaller hydrodynamic size and weaker network structures compared to larger hydrodynamic size and stronger network structure for polymers with high MAA content. However, due to chain increased stiffness at higher MAA and the lower contribution from the aggregation of ethyl-acrylate groups, a broad maximum in the viscoelastic properties of the polymer solution is observed at about 40
Transcript of ABDALA, AHMED A. Solution rheology and microstructure of ...

ABDALA, AHMED A. Solution rheology and microstructure of associative polymers
(under the direction of Dr. Saad Khan and Dr. Alan Tonelli)
Water-soluble associative polymers are widely used in a variety of applications
because of their ability to modulate rheology and material microstructures. This study
focuses on understanding the structure-property relationship for hydrophobically modified
alkali soluble emulsion (HASE) polymers with emphasis on their microstructure and
rheological properties. These polymers have a complex comb-like structure that is a
polyelectrolyte backbone, a copolymer of acrylic or methacrylic acid and alkyl acrylate, with
a few hydrophobic macromonomers randomly grafted to this backbone. The hydrophobic
macromonomer consists of hydrophobic groups that are separated from the polymer chains
by polyethylene oxide (PEO) spacers. Upon neutralization, the polymer backbone adopts a
more extended conformation allowing the hydrophobic groups to associate forming a
transient network structure that enhances the solution rheological properties.
In the first part of this study, we investigate the effect of the polymer composition on
their microstructures and rheological properties. In particular, the effects of the
concentrations of methacrylic acid (MAA) and macromonomers on the solution rheology are
examined. We find that polymers with low MAA content have smaller hydrodynamic size
and weaker network structures compared to larger hydrodynamic size and stronger network
structure for polymers with high MAA content. However, due to chain increased stiffness at
higher MAA and the lower contribution from the aggregation of ethyl-acrylate groups, a
broad maximum in the viscoelastic properties of the polymer solution is observed at about 40

mole% MAA. Moreover, the material functions of polymers with different MAA content
show different concentration dependences.
In the second part of this study, co-solvents of water and propylene glycol (PG) in
different proportions are used to investigate the effect of the solvent quality on the solution
rheology of these polymers. The steady and dynamic properties show the presence of two
regimes with respect to the solvent composition. In “water-rich” solvents, the hydrophobic
association dominates the solution rheology. In contrast, in “PG-rich” solvents, the
hydrophobic association is suppressed due to the lower tendency of the hydrophobes to
aggregate, the smaller coil size of the polymer chains and changes in the PEO spacer
conformations. These two different types of behavior are discussed and confirmed by the
different concentration dependences in each regime.
In the third part of the study, the ability of using diffusing wave spectroscopy (DWS)
to probe the dynamics of HASE polymers is examined. We find that DWS accurately probes
the structural changes induced by the change in the solvent quality or the polymer
concentration. Moreover, comparison with conventional mechanical rheometry data reveals
excellent qualitative agreement between the data obtained from the two techniques.
Quantitatively, however, there is a discrepancy between the data obtained from each
technique. Several reasons for the discrepancy are discussed, including the possibility that the
dynamics at the micro-level could be different from the bulk properties. The scaling of the
creep compliance, high–frequency elastic modulus and relaxation time with polymer
concentration show power-law dependences. The power-law exponents are discussed in light
of theoretical predictions and available experimental data.

An approach to modulate the hydrophobic association is presented in the last part of
the study. The first step in this approach involves the addition of inclusion compound
forming hosts (α- or β- cyclodextrin) to the polymer solution. The encapsulation of the
hydrophobic groups leads to significant reduction in the solution viscosity and viscoelastic
properties The second step requires the addition of surfactants to reactivate the hydrophobic
groups and thus recover the solution rheological properties. We are able to recover the
solution properties using different nonionic surfactants.

SOLUTION RHEOLOGY AND MICROSTRUCTURE
OF ASSOCIATIVE POLYMERS
Ahmed A. Abdala
A dissertation submitted to the Graduate Faculty of North Carolina State University in partial fulfillment of the requirements for the degree of Doctor of Philosophy
December 2002
Department of Chemical Engineering &
Fiber and Polymer Science Program
North Carolina State University
Raleigh, NC 27695-7905
APPROVED BY:
______________________ ______________________ ______________________ Dr. Richard J. Spontak Dr. Sam S. Hudson Dr. John van Zanten
__________________________
__________________________
Dr. Alan E. Tonelli Co-chairman of Advisory Committee
Dr. Saad A. Khan Chairman of Advisory Committee

ii
Dedication
This work is entirely dedicated to my parents, my brothers, my sisters, my wife and
my son for their sacrifices, never-ending support and encouragement during the course of my
educational endeavors and pursuit of life.

iii
Personal Biography
Ahmed Abdel-Hay Ahmed Abdala was born in Albehara, Egypt on March 31st, 1968.
A few years later, he moved with his family to a small town near Alexandria, Egypt. In May
1990, he received his undergraduate degree with honors in Petroleum Refining Engineering
from Suez Canal University, Egypt. In August 1995, he received an MS degree in
Petrochemistry from the same university.
In 1998, he joined North Carolina State University to start his Ph. D. from a
scholarship provided by the Egyptian government. Initially, he started in the Fiber and
Polymer science program of the College of Textiles and later switched his Ph. D. to a co-
major Ph. D. in Chemical Engineering and Fiber & Polymer Science. His Ph. D. research is
focused on the rheology of associative polymers. In December 2001, he was awarded his
second MS degree from the Department of Chemical Engineering, NCSU.
Upon completion of all education in the USA, Ahmed will return to Egypt as a
faculty member in the Department of Petroleum and Chemical Engineering, Suez Canal
University.

iv
Acknowledgments
I would like to express my deepest gratitude to all of those people, without whose
help, this manuscript would not have been completed. First, I am very grateful to my
advisors, Dr. Saad Khan for his guidance and mentorship during the course of the study and
Dr. Alan Tonelli for his assistance and helpful discussions with my project. I would also like
to thank Dr. John van Zanten for his assistance and valuable discussion with the tracer
microrheology part of the project and for taking the time to serve on my committee. In
addition, I would like to thank Dr. Richard Spontak and Dr. Sam Hudson for their
contribution to my project. I would also like to acknowledge the financial support I received
from the Egyptian government.
I also would like to acknowledge the assistance of those who provided me with help
during the course of the study. In particular, thanks are due to Dr. Hanna Gracz, NMR
facilities at North Carolina State University, for her assistance with NMR work, Dr. Srinivasa
Raghavan, University of Maryland, and Dr. Robert English, Northeast Wales Institute, for
their very valuable discussions and encouragement throughout the course of the study.
Lastly, but certainly not the least, thanks to the people whom I enjoyed working with
and sharing light moments for the past five years. I have indeed enjoyed working with the
past and current members of the Rheology Group, including Jenny Shay, Bor-Sen Chiou,
Vandita Pai, Mathew Burke, Jeremy Walls, Jeff Yarian, Deola Ali, Ahmed Eissa, Collins
Apaw, Shamsheer, and Angelica Sanchez. Thanks also to Dr. Samiul Amin, Chris Kloxin,
and Francis Probeni. I am especially indebted to my family for their love and support and I
could not have completed this dissertation without their encouragement through the years.

v
TABLE OF CONTENTS
List of Tables ……………………………………………………………………… ix
List of Figures x
CHAPTER 1. INTRODUCTION & OVERVIEW ………………………………………
Abstract ……………………………………………………………………….
1.1 Introduction ……………………………………………………………….
1.2 Project Goals ……………………………………………………………...
1.3 Thesis Overview …………………………………………………………
1.4 References ………………………………………………………………..
CHAPTER 2. BACKGROUND AN D LITERATURE REVIEW …………………………
Abstract ……………………………………………………………………….
2.1 Introduction ………………………………………………………………
2.2 Hydrophobically Modified Polymers …………………………………….
2.3 Applications of HASE Polymers ………………………………………...
2.4 Structure of HASE Polymers …………………………………………….
2.5 Thickening Mechanisms of HASE Polymers ……………………………
2.6 Structural and Environmental Factors Affecting the Rheology
of HASE Polymers ………………………………………………………
2.6.1. Effect of the Solution pH ……………………………………….
2.6.2 Effect of the Solution Ionic strength …………………………….
2.6.3 Effect of the Size of Hydrophobic Groups ……………………...
2.6.4 Effect of the PEO Spacer Length ………………………………..
2.7 Cyclodextrin ……………………………………………………………..
2.8 References ...……………………………………………………………..
CHAPTER 3. EXPERIMENTAL TECHNIQUES ……………………………………….
Abstract ……………………………………………………………………...
3. 1 Rheological Characterization …………………………………………...
1
2
3
5
8
10
13
14
15
16
16
17
18
19
19
20
21
21
22
25
37
38
39

vi
3.1. 1 Dilute Solution Measurement ………………………………….
3. 1. 2. Steady-State or Simple Shear Flow ……………………………
3. 1. 3. Dynamic or Small Amplitude Oscillatory Shear Flow ………...
3. 1. 4. Transient Shear Flow …………………………………………..
3.2 Diffusing Wave Spectroscopy …………………………………………..
3.3 Nuclear Magnetic Resonance …………………………………………….
3.4 Differential Scanning Calorimetry ……………………………………….
3. 5 Thermal Gravimetric Analysis …………………………………………..
3.6 References ...……………………………………………………………..
CHAPTER 4. EFFECT OF POLYMER COMPOSITION ON MICROSTRUCTURE AND
SOLUTION RHEOLOGY …………………………………………………
Abstract ………………………………………………………………………
4.1 Introduction ………………………………………………………………
4.2 Experimental Materials and Method ……………………………………..
4.2.1 Polymers ………………………………………………………….
4.2.2 Solution Preparation ……………………………………………...
4.2.3 Rheological measurements ………………………………………
4.2.4.Glass transition temperaure (Tg) measurements ……...………….
4.3 Results and Discussion …………………………………………………...
4.3.1 Effects of MAA content ………………………………………….
4.3.2 Concentration Effects …………………………………………….
4.3.4 Effects of macromonomer concentration ………………………...
4.4 Summary …………………………………………………………………
4.5 References ………………………………………………………………..
CHAPTER 5. SOLUTION RHEOLOGY OF HYDROPHOBICALLY MODIFIED
ASSOCIATIVE POLYMERS: SOLVENT QUALITY AND HYDROPHOBIC
INTERACTIONS …………………………………………………………
Abstract ………………………………………………………………………
39
40
40
42
43
45
46
47
48
52
53
55
56
56
57
57
58
59
59
62
65
67
69
83
84

vii
5.1 Introduction ………………………………………………………………
5.2 Experimental Materials and Method ……………………………………..
5.3 Results and Discussion .………………………………………………….
5.3.1 Effects of solvent quality ………………………………………...
5.3.2 Concentration effects …………………………………………….
5.3.3 Solvent quality and polymer interaction modes ………………….
5.4 Conclusions ………………………………………………………………
5.5 Acknowledgment ………………………………………………………...
5.6 References ………………………………………………………………..
CHAPTER 6. A TRACER MICRORHEOLOGY STUDY OF ASSOCIATIVE POLYMER
SOLUTIONS ……………………………………………………………
Abstract ………………………………………………………………………
6.1 Introduction ………………………………………………………………
6.2 Materials and Methods …………………………………………………..
6.3 Results and Discussion .………………………………………………….
6.3.1 Solvent quality effects …………………………………………...
6.3.2 Concentration effects …………………………………………….
6.3.2.1 Scaling behavior .………………………………...……….
6.3.2.2 Time dependent Diffusion Coefficient .………...……….
6.4 Conclusions ………………………………………………………………
6.5 References ………………………………………………………………..
CHAPTER 7. MODULATION OF HYDROPHOBIC INTERACTIONS IN ASSOCIATIVE
POLYMERS WITH INCLUSION COMPOUNDS AND SURFACTANTS …...…
Abstract ………………………………………………………………………
7.1 Introduction ………………………………………………………………
7.2 Experimental …………………………………………………………….
7.2.1 Materials ………………………………………………………….
7.2.2 Methods …………………………………………………………..
86
88
90
90
94
96
98
99
100
113
114
115
116
119
119
124
126
128
130
131
152
153
154
157
157
158
viii
7.3 Results and Discussion ……….………………………………………….
7.3.1 Effect of CDs on solution rheology …...………………………...
7.3.2 Macromonomer-cyclodextrin complexation …………………….
7.3.2.1 Characterization and interaction modes of CD-
macromonomer ICs ………………………………………
7.3.4 Recovery of solution rheology ………………………………….
7.4 Conclusions ………………………………………………………………
7.6 References ………………………………………………………………..
CHAPTER 8. CONCLUSIONS AND RECOMMENDATIONS FOR FUTURE WORK ……
8.1 Conclsuions ………………………………………………………………
8.2 Future work Recommendations …..…………………………………….
8.2.1 Tracer microrheology measurements …………………………….
8.2.2 Recovery of solution rheology after deactivation of the
hydrophobic groups…………………... …………………………..
8.3 References ………………………………………………………………..
159
159
161
163
166
168
170
187
188
191
191
192
195

ix
LIST OF TABLES
CHAPTER 5
Table 1. Solvent’s composition, solubility parameter components and
solubility parameter……………………………………………. Table 2: Intrinsic viscosity ([η]), Huggins coefficient (kH) and the
difference between Huggins and Kramer Coefficent (kH-kK) for modified and unmodified polymers in water/propylene glycol (PG) co-solvent, with different compositions…………………...
CHAPTER 6
Table 1. Solvent’s composition, solubility parameter components and
solubility parameter. ……………………………………………
104 105 138

x
LIST OF FIGURES CHAPTER 1
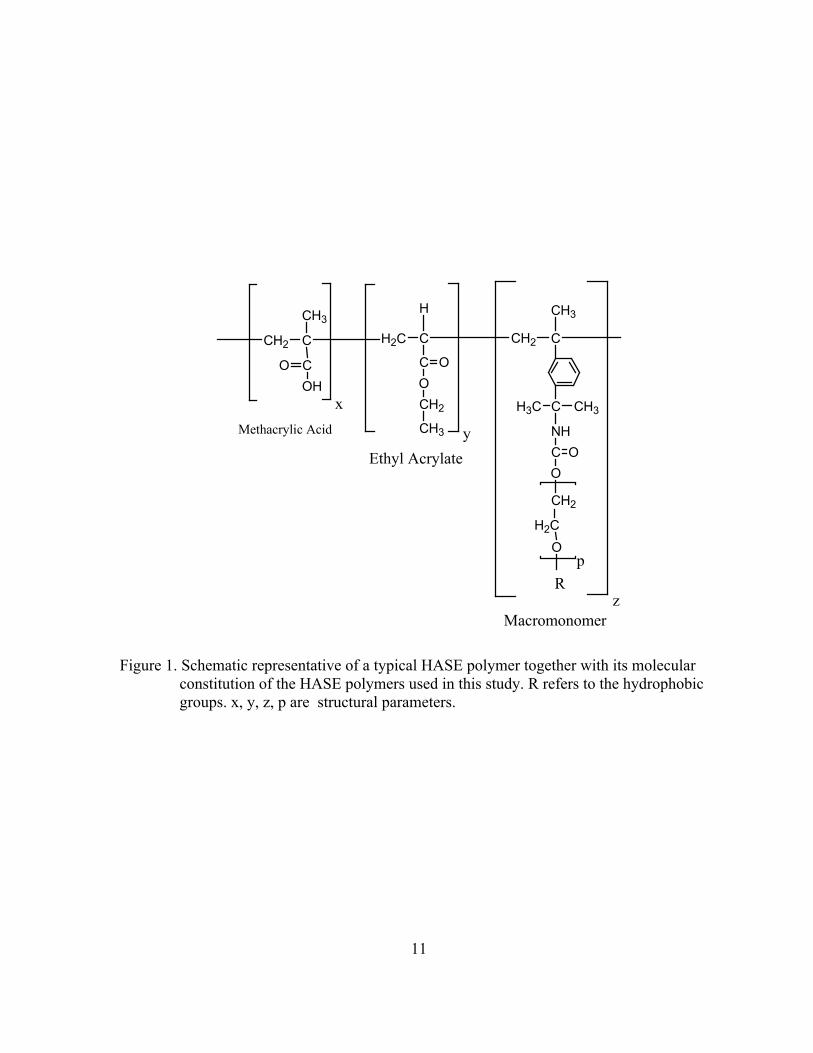
Figure 1. Schematic for the architecture of a typical HASE polymer and
molecular constitution of the HASE polymers used in this study.……………………………………………………………...
Figure 2: Schematic representation of possible hydrophobic interaction
modes…………………………………………………………….. CHAPTER 2
Figure 1. Molecular structure of a hydrophobically modified associative
polymer. The structure shown is for a hydrophobically modified alkali-soluble emulsion (HASE) polymer ……………………….
Figure 2. Effect of solution pH on the network structure, radius of gyration
and viscosity of a HASE polymer solution ……………...……... Figure 3. Effect of salt (NaCl) concentration on the steady shear viscosity of
a 1% polymer solution. ……………………………………….… Figure 4. Schematic representation of HASE polymer aggregates for (a)
short PEO spacer length and (b) long PEO spacer length ……....
CHAPTER 3 Figure 1. Viscosity as a function of shear rate showing different material
response; Newtonian, shear thinning and shear thickening …….. Figure 2. Elastic (G’) and viscous (G”) moduli as functions of angular
frequency (ω) showing the typical behavior of polymer solutions (melts) and elastic gels. …………………………………...……..
Figure 3. Time profile of shear creep and creep recovery experiments for (a)
elastic solid, (b) Newtonian fluid, and (c) viscoelastic material. ...
CHAPTER 4 Figure 1. Schematic representation of a typical HASE polymer together with
its molecular constitution of the HASE polymers used in this study. R refers to the hydrophobic groups. x, y, z, p are structural parameters …………………………………………….
11 12 32 33 34 35 49 50 51 70

xi
Figure 2. Composition of the polymers used in this study. A total of 18 samples have been used, including 4 non-associative ASE samples that have no macromonomers. …………………….…...
Figure 3. Steady shear data for 3% solution of HASE polymers with
different MAA concentration. Polymers have 0.22 mole% macromonomers with C18 hydrophobes and 40 EO units: Viscosity is shown as function of shear rate……………………...
Figure 4. Dynamic frequency spectrum of a) the elastic modulus (G’) and b)
dynamic frequency spectrum for 3% solution of HASE polymers with different MAA content and 0.22 mole% macromonomer.
Figure 5. Creep compliance, J(t), as function of time for 3% solution of
HASE polymers with different MAA content and 0.22 mole% macromonomer: compliance as function of time is shown ……...
Figure 6. Intrinsic viscosity ([η]) and glass transition temperature (Tg) for
polymers with different MAA content. All polymers have 0.22 mole% macromonomer with C18 hydrophobes and 40 EO units ..
Figure 7. Steady shear viscosity versus shear rate for the non-associative
ASE polymers with different MAA acid. Inset shows the zero shear viscosity as a function of MAA mole%. ………………….
Figure 8. Effect of MAA content and polymer concentration on a) the steady
shear viscosity at shear rate =0.01 s-1 b) the elastic modulus at angular frequency =100 rad/s, and c) the creep compliance at t=100 s. Macromonomer concentration = 0.22 mole%, C18 hydrophobes and 40 units EO. …………………………………..
Figure 9. Concentration dependence of steady shear viscosity (η) at 0.01 s-1,
elastic modulus (G’) at 100 rad/s and the creep compliance J(t) at t=100 s for polymer with .a) 43 mole% and b) 23 mole% MAA ..
Figure 10. Effect of MAA content on the transition concentrations (cL and
cU) and the overlap concentration (c*). …………………………. Figure 11. Possible hydrophobic interaction modes at difference
concentration regimes. ………………………………………….. Figure 12: Effect of MAA content on the steady shear viscosity of 3%
solution of polymers with a) 0.3 mole%, b) 1.0 mole% and c) 1.9 mole% macromonomer. ………………………………………….
71 72 73 74 75 76 77 78 79 80 81

xii
CHAPTER 5 Figure 1: Chemical constitution of the HASE polymer. Here p=40 and R
corresponds to C22H44; x/y/z = 43.57/56.21/0.22 by mole. ...…… Figure 2. Effect of solvent composition on the relative viscosity of a 3%
HASE polymer solution. The numbers after PG (propylene glycol) correspond to the weight percent of PG in the water-propylene glycol co-solvent. …………………………………….
Figure 3. Comparison of the steady (filled symbols) and complex (open symbol) viscosity of a 3% HASE polymer solution shown for different co-solvent compositions. The numbers after PG (propylene glycol) correspond to the weight percent of PG in the water-propylene glycol co-solvent ………………… …………...
Figure 4. Effect of solvent composition on (a) the storage modulus G’,and,
(b) the storage (G’) and loss (G’’) moduli of a 3% HASE polymer solution. ………………………………………………..
Figure 5. Effect of the solvent solubility parameter on the (a) relative
viscosity, and, (b) elastic modulus G’ at a fixed frequency (1 rad/sec) of HASE polymer solutions. The numbers (in %) correspond to different polymer concentrations. Lines are for guidance only and have no further justification ………………....
Figure 6. Concentration dependence of the relative viscosity of HASE
polymer solutions in “water-rich” solvents. Results are shown for different compositions of the co-solvent. …………………..……
Figure 7. Concentration dependence of the relative viscosity of HASE
polymer solutions in “PG-rich” solvents. Results are depicted for different co-solvent compositions. .…………………………….
Figure 8. Effect of addition of β-cyclodextrin on the relative viscosity of a
1% HASE polymer solution. The numbers correspond to the moles of cyclodextrin added per mole of the hydrophobe. The unmodified polymer reflects the same polymer as the HASE polymer but without the hydrophobes. ………………………….
Figure 9. Concentration dependence of the relative viscosity for unmodified
polymer (without hydrophobe) in water and in PG, and the HASE polymer with the hydrophobes deactivated through the addition of 20 moles β-cyclodextrin/mole hydrophobe. ………...
106 107 108 109 110 111 112 113 114

xiii
CHAPTER 6 Figure 1. Schematic representation of the architecture of a typical HASE
polymer and its molecular structure. Here, p=40 and R correspond to C22H44; x/y/z = 43.57/56.21/0.22 by mole.. ……...
Figure 2. Diffusing wave spectroscopy (DWS) experimental setup in the
transmission mode. The beam is focused and incident upon flat scattering cell containing the sample and spherical optical probes. The light is multiply scattered and collected by two photomultiplier tubes.. ………………………………..…………
Figure 3. Evolution of the mean square displacement for water, PG/water
91/9 (w/w) mixture, and 0.9% HASE polymer in PG/water co-solvents at different PG ratios. …….……………………………
Figure 4. Comparison of the creep compliance obtained from mechanical
rheometry (symbols) and tracer microrheology (lines) for 0.9% HASE polymer in PG/water co-solvents at different PG ratios. ...
Figure 5. Frequency dependence of a) the complex modulus, G*, and b) the
elastic (G’) and viscous (G”) moduli obtained from tracer microrheology for 0.9% HASE polymer solutions in PG/water cosolvent with different PG ratios. ..………….………………...
Figure 6. Frequency dependence of the elastic (G’) and viscous (G”) moduli
obtained from mechanical rheometry measurements for 0.9% HASE polymer solutions in PG/water co-solvent at different PG ratios. ……………………………………………………………
Figure 7 Comparison of a) elastic (G’) and b) viscous (G”) moduli obtained
from mechanical rheometry (symbols) and tracer microrheology (lines) for 0.9% HASE polymer in PG/water co-solvent at different PG ratios. ………………………………………………
Figure 8. Comparison of the creep compliance obtained from tracer
microrheology using different sphere sizes embedded in 0.9% aqueous polymer solution. The line represents the creep compliance obtained from mechanical rheometry measurement. .
Figure 9. Evolution of the mean square displacement of 0.996 mm PS
spheres in aqueous solution of HASE polymer at different concentrations.. …………………………………………………
139 140 141 142 143 144 145 146 147
xiv
Figure 10. Comparison of the creep compliance obtained from mechanical
rheometry (symbols) and tracer microrheology (lines) for aqueous solution of HASE polymer at different concentrations. ..
Figure 11. Comparison of a) the elastic (G’) and b) the viscous (G”) moduli
obtained from mechanical rheometry (symbols) and tracer microrheology (lines) for aqueous solution of HASE polymer at different concentrations. …………………………………………
Figure 42. Scaling of the elastic modulus (G’), the creep Compliance (J(t)),
and the longest relaxation time (τL) with the polymer concentrations. G’ is taken at a fixed frequency 10 rad/s and J(t) at a fixed time 10 sec. ………..…………………………………..
Figure 13. Time dependent diffusion coefficient of 0.966 mm spheres
embedded in HASE polymer solution at different concentrations as a function of (a) time and (b) the average sphere displacement.
CHAPTER 7
Figure 1. Schematic representation of the architecture of a typical HASE
polymer and its molecular structure. Here, p=40 and R correspond to C22H44; x/y/z = 43.57/56.21/0.22 by mole. …….
Figure 2: Effects of addition of a) α-CD and b) β-CD on the steady shear
viscosity of 3% HASE associative polymer solution. Numbers correspond to the moles of cyclodextrin per moles of hydrophobes ……………………………………………………..
Figure 3: Effects of addition of a) α-CD and b) β-CD on the dynamic elastic
(G’) and viscous (G”) moduli of a 3% HASE associative polymer solution. Numbers correspond to moles of cyclodextrin per hydrophobes …………...………………………………………...
Figure 4: Effect of addition of various amounts of β-CD amount on the a)
steady shear viscosity and b) dynamic elastic (G’) and viscous (G”) moduli of 1% unmodified polymer that is analogous to the HASE polymer in this study but with the hydrophobic groups replaced by CH3 groups. ………………………………………...
Figure 5.Yield of macromonomer-CD inclusion complexes as a function of
the molar ratio of CD/macromonomers. …………………………
148 149 150 151
175 176 177 178 179

xv
Figure 6. Effect of the CD/hydrophobe molar ratio on the % of active macromonomers present, calculated based on the yield data in Figure 2 …………………………………………………………
Figure 7. DSC scans of a) α-CD, macromonomer, and their inclusion
compound and b). β-CD, macromonomer, and their inclusion compound. The scans shown are the second heatings taken after heating the samples at 200° C for 3 minutes to erase any thermal history. ………………………………………………………….
Figure 8. TGA scans for a) α-CD, macromonomer and their inclusion
compound and b) β-CD, Macromonomer and their inclusion compound. Samples were heated at 20° C/min under nitrogen. ....
Figure 9. 500 MHz 1H NMR spectra of a) macromonomer, α-CD and their
inclusion compound and b) macromonomer, β-CD and their inclusion compound. All spectra were acquired in DMSO-d6. …
Figure 10. Part of the 500 MHz 1H NMR spectra showing a) the aliphatic
CH2 protons of the macromonomer and its inclusion compounds with α-CD and β-CD and b) the CH2-CH2-O protons of the macromonomer and its inclusion compounds with α-CD and β-CD. All spectra were acquired in DMSO-d6. …………………..
Figure 11. Effect of adding macromonomer to a 3% HASE polymer solution
that has the hydrophobic groups deactivated by 20 moles βCD on the (a) steady shear viscosity and (b) dynamic elastic (G’) and viscous (G”) moduli of the polymer solution. Numbers in figure denote amounts of macromonomer added to solution in mM. …..
Figure 12. Effect of NP4 surfactant addition to a 3% HASE polymer
solution that has the hydrophobic groups deactivated by 20 βCD/macromonomer on the (a) steady shear viscosity and (b) dynamic elastic (G’) and viscous (G”) moduli of the polymer solution. Numbers in figure denotes amount of NP4 surfactant added to solution in mM. ………………………………………...
CHAPTER 8
Figure 1. Effect of CDase enzyme on the (a) steady shear viscosity and (b)
dynamic elastic (G’) and viscous (G”) moduli of 3% polymer solution encapsulated with 20 moles α-CD/hydrophobes. pH 9, incubation temperature 50°C, incubation time 24 hrs. ……………..
180
181 182 183 184 185 186 198

xvi
Figure 2. Effect of solution pH on the (a) steady shear viscosity and (b) dynamic elastic (G’) and viscous (G”) moduli of 3% polymer solution. ……………………………………………………………..
Figure 3. Effect of CDase enzyme on the (a) steady shear viscosity and (b)
dynamic elastic (G’) and viscous (G”) moduli of a 3% polymer solution encapsulated with 20 moles α-CD/hydrophobes. pH 7.5, incubation temperature 50°C, incubation times 1 and 10 hr. ………
Figure 4. Effect of Clarase enzyme on the (a) steady shear viscosity and (b)
dynamic elastic (G’) and viscous (G”) moduli of a 3% polymer solution encapsulated with 20 moles α-CD/hydrophobes. pH 7.5, incubation temperature 50°C, incubation time 30 hrsFigure 4. Effect of Clarase enzyme on the (a) steady shear viscosity and (b) dynamic elastic (G’) and viscous (G”) moduli of a 3% polymer solution encapsulated with 20 moles α-CD/hydrophobes. pH 7.5, incubation temperature 50°C, incubation time 30 hrs ………………………….
199
197 200

CHAPTER 1
INTRODUCTION & OVERVIEW

2
Abstract
In this chapter, we introduce the reader to the complex and fascinating world of an
interesting class of water-soluble associative polymers, that of the hydrophobically modified
alkali soluble emulsion (HASE) polymers. These comb-like polymers consist of an alkyl
hydrophobe attached to a hydrophilic backbone. We also motivate the topic of this
dissertation –solution rheology and microstructures of associative polymers. HASE polymers
are currently being used as rheology modifiers in a variety of applications, from coatings to
anti-icing fluids. While many of these applications involve the use of polymers in aqueous
medium, some also require the use of glycols as cosolvent. The efficient use of these
polymers requires both an understanding of their structure-property relationship and the
ability to tailor their rheological behavior. In this regard, we study the effects of the polymer
structure and the use of cosolvent on solution rheology and other properties. We also discuss
a way to tailor the rheological properties through interactions with inclusion compound
forming hosts and surfactants.

3
1.1 Introduction
Associative polymers have recently drawn considerable interest due to their original
and specific rheological properties that distinguish them from other polymers in terms of
their viscosity enhancement and reversibility of their associative phenomena.
Hydrophobically modified alkali soluble emulsion (HASE) polymers are one class of water-
soluble associative polymers. These polymers have a comb-like structure with pendant
hydrophobic groups randomly grafted to the polyelectrolyte backbone. HASE polymers have
several advantages over other associative polymers in terms of cost and wide formulation
latitude1. They are currently being used as rheology modifiers in a wide range of
applications, including paint formulations, paper coatings, personal and home care products,
UV-photoprotecting and aerated emulsions, fabric softeners, and as glycol based aircraft anti-
icing fluids.
The structure of HASE polymers can be thought of as a hybrid of the conventional
alkali soluble emulsion (ASE) polymers and the hydrophobically modified ethoxylate
urethane (HEUR). HEUR polymers have a simple structure composed of a PEO backbone
capped with one hydrophobic group at each end. The polyelectrolyte backbone of HASE
polymers has the structure of the nonassociative ASE polymers while the hydrophobic
macromonomer has a structure similar to HEUR polymers. In fact, the earlier name of HASE
polymers was HEURASE polymers2. A typical structure of a HASE polymer is shown in
Figure 1.
Similar to surfactants in aqueous media, these polymers are capable of non-specific
hydrophobic interactions3. These hydrophobic interactions include inter- and intra-molecular
4
associations, giving rise to network structures assuming the concentration is sufficient, and a
range of rheological behaviors. A schematic drawing for possible hydrophobic interactions
are shown in Figure 2. Due to their complex structure, the rheological properties of this
polymer system are expected to be very sensitive to both structural and environmental
parameters. Examples of the structural parameters include the polymer molecular weight and
molecular weight distribution, the polymer backbone composition, PEO spacer length, and
the type and concentration of the hydrophobic groups. On the other hand, polymer
concentration, temperature, medium pH and ionic strength, and the solvent quality are
examples of the environmental parameters.
Although the associative nature of HASE polymers, which makes them attractive
from a rheological standpoint, is the result of the hydrophobic interactions, the ability to
control these interactions is often an advantageous feature. In this regard, the ability to
deactivate and reactivate the hydrophobic groups is always desirable. Two reasons for the
removal of hydrophobic interactions are ease of handling during solution preparation and
prior to the end use stage, and, extraction of useful information from characterization of these
polymers using techniques such as light scattering and gel permeation chromatography
(GPC). In the latter case, the presence of hydrophobic association makes extraction of
information from these techniques complicated and less accurate.
The dynamics of HASE polymers and their viscoelastic characteristics are in general
usually characterized using traditional mechanical rheometery. Nevertheless, the information
gained from rheological measurements is of macroscopic nature and one has to guess their
structure at the micro-level. The use of light scattering is one approach to extract information

5
about the dynamics of such systems at the micro-level. However, traditional dynamic light
scattering techniques limit the range of the polymer concentrations to very dilute
concentration due to the limiting condition of single scattering. A recent light scattering
technique known as diffusing wave spectroscopy (DWS), however, extends the concentration
range by working at the multiple scattering limit4. This technique has advantages over both
conventional rheometry and traditional dynamic light scattering in terms of the time scale,
the strain applied on the material and the amount of the sample required. This technique has
been used quite extensively to study the dynamics of simple polymeric and bio systems such
as polyethylene oxide (PEO) and actin filaments. In spite of the success of this technique to
study the dynamics of simple polymeric systems, its validity and the range of frequency over
which it can apply for systems where local inhomogeneity is expected to be present are still
debatable issues. In this research we test the applicability of this technique to a complex
associative system. Direct comparison between the results obtained using the DWS technique
with those from traditional mechanical rheometry would help in resolving this debate.
1.2 Projects Goals
The overarching objective of this research is to gain a fundamental understanding of
the structure-property relationship of a complex class of associative polymers, namely HASE
polymers, and develop an approach to modulate the rheological properties of these polymers.
In particular, this research has the following specific goals:
1. Investigate the effects of polymer structure on the association behavior and solution
rheology
The chemical composition and polymer architecture can have a profound influence on

6
the behavior of associative polymers. These architectural parameters include the (a) structure
of the backbone that dictates the water solubility and flexibility of the polymer chain, (b)
structure of the macromonomer including the type of hydrophobic groups and the length of
polyethylene oxide spacer, and (c) concentration of the hydrophobic macromonomer. In our
study, we specifically investigate the effects of the polymer backbone composition and the
concentration of the macromonomer on the microstructure and rheology of the polymer
solution. Based on the structure of the polymer used in this study, the polymer backbone is a
copolymer of a water-soluble monomer, methyl metha-acrylic acid (MAA), and a water
insoluble monomer, ethyl acrylate (EA). The concentration of each monomer will affect the
polymer solubility and stability as well as the accessibility of the hydrophobic groups. We
investigate the effect of MAA/EA ratio on the solution properties. We also examine the
effects of the macromonomer concentration on the solution properties and the associative
nature of these polymers. By comparing the behavior of these sets of samples we investigate
the effect of the concentration of the hydrophobic macromonomer on the solution properties.
2. Understand the effects of solvent quality on hydrophobic interactions and solution
rheology
The continuous phase in which the associative polymer is solvated plays a major role
in the association behavior of these polymers. In this regard, the effects of the medium pH
and ionic strength on the association mechanism of HASE polymers have been the focus of a
number of previous studies5-9. However, almost all these studies were carried out in aqueous
media and the effects of solvent quality or non-aqueous co-solvents on the solution behavior
have been overlooked. This becomes particularly important in deciphering the modes of

7
hydrophobic associations and developing new applications involving non-aqueous media,
such as anti-icing fluids. We study the effect of solvent quality on the hydrophobic
interactions and rheology of HASE polymers by using cosolvents of water and propylene
glycol in different proportions. In this regard, the solvent solubility parameter is used to
quantify the solvent quality.
3. Examine the applicability of the diffusing wave spectroscopy (DWS) technique to
associative polymers
The goal of this part of the study is to test the validity of a new light scattering
technique, known as diffusing wave spectroscopy (DWS), in extracting the rheological
properties of HASE polymers. DWS provides information about the properties of viscoelastic
media by tracking the motion of microspheres embedded in this medium. It has been recently
used extensively to extract the mechanical properties of polyethylene oxide and F-actin
filaments. However, the ability of DWS to extract the viscoelastic properties of more
complex systems has not been proven. We choose to test the validity of DWS because it has
advantages over both conventional light scattering and mechanical rheometry. For example,
it provides information over a very wide range of frequency, including very high frequencies
that are not accessible with conventional mechanical rheometry. In addition, the viscoelastic
properties of the material are extracted without disrupting the material as the strain applied to
the material is of the order kBT.
4. Develop approaches to modulate hydrophobic association
Our main focus during this portion of the research work is to uncover a method to
modulate the hydrophobic interactions. The hydrophobic interactions can be removed by

8
deactivating the hydrophobic groups. One way to achieve that is to encapsulate the
hydrophobic groups using inclusion compound forming hosts, such as cyclodextrins, which
are cyclic oligoaccharides consisting of 6, 7, or 8 glucose units corresponding to α, β, and γ-
CD joined by α-1,4-glycosidic linkages. Two scenarios for reactivation of the hydrophobic
groups are considered. In the first scenario, the addition of a suitable surfactant would be
expected to shift the equilibrium between the hydrophobic groups and the cyclodextrin away
from complexation, thereby reactivating these groups. In the second scenario, the
cyclodextrin is enzymatically degraded and the hydrophobic groups are re-exposed and
reactivated.
1.3 Thesis Overview
At this point, we provide a brief summary of the contents of the following chapters.
In Chapter 2, we provide a detailed literature review about the rheology of HASE associative
polymers. Chapter 3 presents a summary of the experimental techniques utilized through the
course of this research. Chapter 4 focuses on the effect of the polymer
composition/architecture on the microstructure and rheology of their polymer solution.
Chapter 5 provides a detailed rheological study of the effect of the solvent quality on the
hydrophobic interactions and the behavior of the polymer solutions. Chapter 6 presents
another approach to study the effect of the solvent quality and the polymer concentration on
the microstructure and solution rheology of HASE polymers using a tracer microrheology
technique, diffusing wave spectroscopy. This chapter also presents a direct comparison
between rheological data obtained from the tracer microrheology measurement and those

9
obtained using tradition mechanical rheometery. Chapter 7 provides an approach to tailor the
rheological properties of the polymer solution by deactivation/reactivation of the
hydrophobic groups. Encapsulation of the hydrophobic groups by forming inclusion
compounds using cyclodextrins hosts deactivates the hydrophobic groups while addition of
nonionic surfactants or possibly enzymatic degradation of cyclodextrins, can reversibly
activate these groups. This approach provides ease of handling of concentrated solution and
provides a way to decouple the hydrophobic interactions from the polymer backbone effects.
Finally, research conclusions and our recommendations for future research are presented in
Chapter 8.

10
1.4 References
1. Tirtaatmadja, V.T.; Tam, K. C.; Jenkins, R. D.; Bassett, D. R. Stability of a Model Alkali-Soluble Associative Polymer in The Presence of a Weak and a Strong Base, Colloid and Polymer Science 1999, 277, 276-281.
2. Shay, G.D.; Rich, A. F. Urethan-Functional Alkali-Soluble Associative Latex
Thickeners, J. Coat. Tech. 1986, 58, 43-53.
3. Ng, W.K.; Tam., K. C.; Jenkins, R. D. Evalution of Intrinsic Viscosity Measurements of Hydrophobically Modified Polyelectrolyte Solutions, European Polymer Journal 1999, 35, 1245-1252.
4. Weitz, D.A.; Pine D.J. Diffusing-Wave Spectroscopy, In Dynamic Light Scattering:
The Method and Some Applications, Vol. 60, 652-720, Oxford University Press, Oxford, 1993.
5. Wang, C.T.; Tam, K.C.; Jenkins, R.D.; Bassett, D.R. Potentiometric Titration and
Dynamic Light Scattering of Hydrophobically Modified Alkali Soluble Emulsion (HASE) Polymer Solutions, Phys. Chem. Chem. Phys. 2000, 2, 1967-1972.
6. Kumacheva, E.R.; Rharbi, Y.; Winnik, M A.; Guo, L.; Tam, K. C.; Jenkins, R. D.
Fluorescence Studies of an Alkaline Swellable Associative Polymer in Aqueous Solution, Langmuir1997, 13, 182-186.
7. Horiuchi, K.R.; Rharbi, Y.; Yekta, A.; Winnik, M.A.; Jenkins, R.D.; Bassett, D.R.
Dissolution Behavior in Water of a Model Hydrophobic Alkali- Swellable Emulsion (HASE) Polymer with C20H41 Groups, Canadian Journal of Chemistry-Revue Canadienne De Chimie 1998, 76, 1779-1787.
8. Tirtaatmadja, V.; Tam, K.C.; Jenkins, R. D. Rheological Properties of Model Alkali-
Soluble Associative (HASE) Polymers: Effect of Varying Hydrophobe Chain Length, Macromolecules 1997, 30, 3271-3282.
9. Tan, H.; Tam, K.C.; Tirtaatmadja, V.; Jenkins, R. D.; Bassett, D. R. Extensional
Properties of Model Hydrophobically Modified Alkali-Soluble Associative (HASE) Polymer Solutions, J. Non-Newtonian Fluid Mech. 2000., 92, 167-185.
11
CH2 C
CH3
COOH
H2C C
H
C OOCH2CH3
CH2 C
CH3
CH3C CH3NHCOO
CH2H2CO
x
y
Rp
z
Methacrylic Acid
Ethyl Acrylate
Macromonomer
Figure 1. Schematic representative of a typical HASE polymer together with its molecular constitution of the HASE polymers used in this study. R refers to the hydrophobic groups. x, y, z, p are structural parameters.

12
Figure 2: Schematic representation of possible hydrophobic interaction modes
Intermolecular association
Intramolecular association

13
CHAPTER 2
BACKGROUND AN D LITERATURE REVIEW

14
Abstract
In this chapter, we provide the reader background information on the hydrophobically
modified alkali soluble emulsion (HASE) associative polymers. Although these polymers are
currently used in a variety of applications, there is a scarcity of scientific research that allows
for a complete understanding of their fundamental structure-property relationships. We
summarize the findings of previous research that deal with the structure of HASE polymers
and the factors that affect their solution microstructures and solution rheology.

15
2.1 Introduction
Associative polymers are macromolecules with attractive groups that form an
interesting class of polymeric systems with numerous applications. These applications
include rheology modifiers, adhesives, adsorbents, coatings, surfactants and stabilizers for
heterogonous polymerization, cosmetics, paper coatings, enhanced oil recovery, flocculants
for waste-water treatment, biomedical implants, suspending agents for pharmaceutical
delivery systems, and in aircraft anti-icing fluids. The association of their attractive groups
leads to formation of physical bonds. The structures formed by these polymers in solutions
depend on many factors including polymer concentration, number of attractive groups per
chain and the strength of the physical bond. This class of polymers includes charged
polymers, block copolymers in strongly selective solvents, and polymers with hydrogen
bonding1, 2.
Block copolymers consist of either block(s) of one type of homopolymer attached
sequentially to block(s) of another type or grafted onto the main chain of a different
polymer3. Examples of block copolymers in selective solvents are amphiphilic copolymers,
such as poly(ethylene-oxides) poly(propylene-oxides) poly(ethylene oxide) (PEO-PPO-PEO)
copolymers, and hydrophobically modified polymers. Poly(acryloylglycinamide) co-
poly(acrylic acid)4 and blends of poly(4-vinylphenol) with poly(Bu acrylate), poly(Bu
methacrylate), or poly(vinyl Bu ether)5,6 are examples for the hydrogen bonding polymers
Our interest in this research, however, lies with polymers with attached hydrobphobes that
form associations in aqueous solvents.

16
2.2 Hydrophobically Modified Polymers
Hydrophobically modified associative polymers are synthetically derived, water
soluble polymers that contain a small numbers of hydrophobic groups7. These hydrophobic
groups aggregate in order to minimize their exposure to water, in a fashion analogous to
surfactants, above the critical micelle concentration. Several hydrophobically modified
polymers are currently available commercially and utilized in a wide range of applications, as
rheology modifiers. Examples of those polymers are: hydrohpobically modified
(hydroxyethyl) cellulose8, 9, hydrophobically modified ethoxylate urethane (HEUR)10-12,
hydrophobically modified polyacrylamide (HMAM)13,14, and hydrophobically modified
alkali soluble emulsion (HASE) polymers.
These hydrophobically modified polymers have either a telechelic structure in which the
chains are end-capped with the hydrophobic groups, or more complicated comb-like
structures in which the hydrophobic groups are randomly grafted to the polymer backbone.
HEUR polymers are one example of the telechelic polymers and HASE polymers are an
example of the polymers with comb-like structures. HEUR polymer structure can be
described as a polyethylene oxide backbone end capped with hydrophobic groups. On the
other hand, HASE polymers have more complex structures. The ionic charges on the
polymer backbone add more complexity to the structure.
2.3 Applications of HASE Polymers
HASE polymers have several advantages over other associative polymers in terms of
cost and wide formulation latitude14. Compared to other hydrophobically modified polymers,
HASE polymers have a unique ability to dramatically modify the solution properties.
17
In particular, a few percent of the polymer can increase the solution zero-shear viscosity up
to several decades. On the other hand and due to their shear thinning property, the high shear
rate viscosity is very low. A viscosity profile with a large zero-shear viscosity and a low
high-shear viscosity is ideal for many applications. The superior rheological properties of
HASE polymers make them attractive candidates as rheology modifiers in a multitude of
applications, including paint formulations15-17, paper coatings18, personal and home care
products19-22, UV-photprotecting and aerated emulsions23, 24, fabric softeners25, 26 and as
glycol based aircraft anti-icing fluids27-31.
2.4 Structure of HASE Polymers
The structure of HASE polymers can be thought of as a hybrid of the conventional
alkali-soluble emulsion polymers (ASE), a polyelectrolyte backbone composed of a
copolymer of one hydrophilic and one hydrophobic monomer, and low molecular weight
HEUR polymer attached to such a backbone. Therefore, HASE polymers provide the
performance of the HEUR systems and the pH sensitivity of ASE. However, the
microstructure and rheological properties of these polymers are more complex and yet have
to be fully understood.
Figure 1 represents the chemical structure of a typical HASE polymer. The polymer
backbone has a polyelectrolyte nature and is composed of a copolymer of methacrylic acid,
the water soluble segments of the backbone, and ethylacrylate, as the somewhat water
insoluble segments. The acid monomer provides the solubility of the polymer and the slightly
water insoluble monomer enhances the thickening performance and promotes adsorption of

18
the polymer to a hydrophobic latex, which is part of the solution formulation in many
applications. The polymer is hydrophobically modified by randomly grafting a small number
of hydrophobic macromonomers to the polymer backbone. The hydrophobic macromonomer
is composed of hydrophobic groups, C8-C30 alkyl or alkyl aryl. These groups are separated
from the polymer backbone by a polyethylene oxide (PEO) spacer, with 5-40 moles of
ethoxylation. The macromonomer is usually attached to the polymer backbone via a urethane
linkage.
2.5 Thickening Mechanisms of HASE Polymers
As discussed in the previous sections, HASE polymers are considered to be chemical
hybrids of ASE and HEUR polymers of intermediate molecular weight. Because of their
hybrid structure, HASE polymers enhance the solution properties via several thickening
mechanisms. The main contribution comes from the hydrophobic interaction between either
hydrophobic groups that are attached to the same polymer chain (intra-molecular association)
or hydrophobic groups that are attached to different polymer chains (inter-molecular
association). A moderate degree of hydrodynamic thickening is contributed by the relatively
long polymer backbone. The hydrodynamic volume expansion is accentuated by their
electrostatic repulsion of the carboxylic anions along the backbone upon the neutralization
with a base at pH above 6. Below this pH, the polymer is assumed to have a compact
conformation and show no thickening behavior. Theoretically, some hydrogen bonding
between the PEO ether oxygen and the carboxylic groups of the backbone may also occur.
The bulky backbone ethyl acrylate groups may also aggregate due to their hydrophobic
nature. Among these different mechanisms, the hydrophobic association has been

19
established to be the dominant thickening mechanism for these polymers.
2.6 Structural and Environmental Factors Affecting the Rheology of HASE Polymers
With the complex architecture of HASE polymers, the association behavior of these
polymers would be expected to be quite diverse and dependent on many factors such as, the
structure of the backbone that dictates their water solubility and flexibility, the structure and
concentration of the macromonomer, which include the type of the hydrophobic groups and
the length of their polyethylene oxide spacers. The continuous phase in which the HASE
polymer is solvated also plays a major role in the association behavior of these polymers. In
this regard, the effects of the medium pH and ionic strength on the association mechanism of
HASE polymers have been the focus of a number of studies15, 32-36
In the next few section, we summarize the findings of the research work that deals
with the factors that affect the microstructure and rheology of aqueous solution of HASE
polymers. These factors include the solution pH and ionic strength, the hydrophobe size and
the PEO spacer length. Other factors such as the composition of the backbone and the solvent
quality are part of the current research and will be summarized in their relevant chapters.
2.6.1. Effect of the Solution pH
Due to the polyelectrolyte nature of the HASE polymer’s backbone, the polymer
microstructure and solution rheology is highly dependent on the pH. Therefore, the effects of
solution pH on the behavior of HASE polymer have been studied using probe fluorescence,
dynamic light scattering and potentimetric titration -32-35. The collective findings of these
results can be summarized in the next paragraph.

20
The HASE polymers are usually prepared and supplied as an insoluble latex at low
pH (~3); the hydrodynamic radius (RH) of these polymer latexes is of the order of 75 nm.
These latexes have water-like viscosity. The addition of a base ionizes the COOH backbone
groups, the backbone extends, and the polymer swell to a larger size (RH ~ 225 nm) due to
the repulsion between the negative charges on the backbone. At a pH around 6.5, the polymer
starts to dissolve and the solution viscosity increases rapidly. At this point both inter- and
intra-molecular associations are possible and the polymer forms aggregates in a manner
similar to the micellization of a surfactant. With further addition of base, the particles
dissociate into several smaller clusters, RH ~ 100 nm, and the solution viscosity continues to
increase. As the solution reaches a pH ~7.5, the polymer is completely neutralized and the
solution viscosity remains constant at a maximum level. Figure 2 summarizes the effect of
the solution pH on the polymer microstructure, solution viscosity, and the polymer
hydrodynamic size.
2.6.2 Effect of the Solution Ionic strength
The neutralization of the polymer solution at high pH expands and solubilizes the
polymer chains due to the repulsion of the negative charges distributed along the backbone.
In the extended conformation, the hydrophobic groups associate to form both inter- and intra-
molecular association. This association makes the polymer backbone stiff. The addition of a
salt would shield the electrostatic charges and reduce the stiffness of the backbone and
transform some of the inter-molecular associations to intra-molecular association. Tan et.
al.36 report that increasing the salt (NaCl) concentration reduces the shear viscosity; however,
the shear-induced structure becomes more pronounced with an increase of the salt
21
concentration up to a specific level. The appearance of the shear-induced structure is also
shifted to higher shear rates (Figure 3). At large salt concentrations (>0.6 M), the polymer
backbone collapses due to the shielding of the electrostatic charges and the disruption of the
hydrophobic interaction; thus, both viscosity and the degree of the shear-induced structure
are reduced.
2.6.3 Effect of the Size of Hydrophobic Groups
The effect of the hydrophobic group type and size has been the focus of several
publications. Tirtaatmadja et al. used alkyl hydrophobes with varied size, C12, C16 and C2035
.
They reported an increase in the hydrophobic association strength with the increase of the
hydrophobe size. Both the association number, the number of hydrophobes that form a
network junction, and the junction density were increased with the hydrophobe size. In
another study37 in which the hydrophobe size was increased from C1 –to- C20, dynamic light
scattering data also showed an increase in the association number. These findings were also
confirmed using pulsed-gradient spin-echo (PGSE) nuclear magnetic resonance (NMR)
measurements38. Extensional flow measurements also revealed similar findings; the network
strength was proportional to the hydrophobe length35. The hydrophobe length has an impact
on the network strength, not only through association number or density, but also through the
difference in the molecular associations. Shorter hydrophobes will tend to form intra-
molecular association rather than inter-molecular association.
2.6.4 Effect of the PEO Spacer Length
The viscoelastic properties of HASE polymer are highly dependent on the

22
chemical structures of the hydrophobic macromonomer. The spacer length that extends the
hydrophobic moiety from the polymer backbone dictates the accessibility of the hydrophobic
group. Dai, et al used dynamic light scattering to examine the effect of the PEO spacer length
on the microstructure of dilute HASE polymer solutions37. They found that increasing the
PEO length results in a decrease in the hydrophobicity of the macromonomer. Thus, the
number of junctions will decrease, but the aggregation number will increase. This conclusion
is supported by the results of another study from the same group39. In this latter study,
increasing the length of PEO spacer was associated with an increase of the activation energy,
extracted from the temperature dependence of the viscosity based on the Arrhenius equation.
This implies that with longer PEO spacers, the network structure becomes stronger which
may be attributed to the increase of the aggregation number as suggested by Dai’s study. The
microstructures of the HASE polymer with shorter and longer PEO spacer as described by
those studies are shown in Figure 4.
2.7 Cyclodextrin
Cyclodextrins are seminatural products that are produced enzymatically from a
renewable natural material, starch. They are torus-like macrorings that are cyclic
oligosaccharides consisting of 6, 7, or 8 glucose units (corresponding to α, β, and γ-CD)
joined by α-1,4-glycosidic linkages. The structure and dimension of different cyclodextrins is
shown in Figure 5. Their torus-like structure enables them to include a variety of substances
in their annular gap in different arrangements. Through their inclusion complex forming
ability, the properties of the complexed substances can be modified significantly40.

23
Cyclodextrins have shown superior tendencies to interact with the hydrophobic
segments of different hydrophobically modified water soluble associative polymers,
including: hydrophobically end capped polyethylene oxide41-46, poly(ethylene glycol)s
(PEGs) bearing hydrophobic ends (naphtyl and phenyladamantyl)47, N,N-
dimethylacrylamide-hydroxyethyl methacrylate copolymer hydrophobically modified with
adamantyl groups48-50, hydrophobically modified ethyl(hydroxy ethyl) cellulose51,
hydrophobically modified, degradable, poly(malic acid)52, isobutene maleate polymer with
pendant hydrophobic 4-tert-butylanilide53,54, hydrophobically modified ethoxylated
urethanes55, hydrophobically modified alkali soluble emulsion polymers56,57, and
hydrophobically modified Dextran58. Cyclodextrins has also been reported to form inclusion
compounds with many nonionic surfactants59-75. The interaction between cyclodextrins and
the hydrophobically modified polymers usually leads to the deactivation of the hydrophobic
nature of these polymers.
Gupta et al56 used methylated β-cyclodextrin (m-βCD) to encapsulate the
hydrophobic moiety of HASE polymers. The addition of up to 3% m-βCD to polymer with
short hydrophobes, C1-C8 showed no change in the solution viscosity. On the other hand, a
reduction in the solution viscosity was observed when longer hydrophobes, C12-C20, were
used. However, no details about possible stochiometric ratio for the interaction between the
polymer and m-βCD were given. In another study57, Islam et al also used m-βCD to
deactivate the hydrophobic moiety of dilute HASE solution. Due to light scattering
measurements the polymer concentration used in the study was limited to very dilute
concentrations, ~5x10⁴ g/ml. The amount of m-βCD required to completely remove the

24
hydrophobic association was about 1500 moles/ hydrophobes.
In spite of the successful use of cyclodextrins in the deactivation of the hydrophobic
groups of HASE polymers, detailed studies on the mechanism of deactivation and its effect
on the solution rheology is needed. Other techniques are also needed to understand the nature
of the interaction at the molecular level. Some of these techniques are nuclear magnetic
resonance (NMR), differential scanning calorimetry (DSC) and thermal gravimetric analysis.
(TGA). Moreover, no approach has been presented for the reversible recovery of the activity
of hydrophobic groups. These issues are part of this current study and will be fully addressed
in Chapter 7.

25
2.8 References
1. Rubinstein, M.; Dobrynin, A. V. Association Leading to the Formation of Reversible Network and Gels, Current Opinion in Colloid & Interface Science. 1999, 4, 83-87.
2. Rubinstein, M.; Dobrynin, A. V., Solution of Associative Polymers. TRIP 1997, 5(6),
181-186.
3. Alexandrids, P. Amphiphilic Copolymers and Their Applications. Current Opinion in Colloid & Interface Science 1996, 1, 490-501.
4. Sasase, H.; Aoki, T.; Katono, H.; Sanui, K.; Ogata, N.; Ohta, R.; Kondo, T.; Okano,
T.; Sakurai, Y. Regulation of Temperature-Response Swelling Behavior of Interpenetrating Polymer Networks Composed Of Hydrogen Bonding Polymers. Makromolekulare Chemie, Rapid Communications 1992, 13, 577-581.
5. French, R. N.; Walsh, J. M.; Machado, J. M. Relating The Heat-of-Mixing of Analog
Mixtures to the Miscibility of Hydrogen-Bonding Polymers. Polymer Engineering and Science 1994, 34, 42-58.
6. Graf, J. F.; Painter, P. C.; Coleman, M. M. Free Volume in Hydrogen Bonding
Polymer Blends. Polymer Preprints (American Chemical Society, Division Of Polymer Chemistry) 1990, 31, 537-538.
7. Bock, J.; Siano, D. B.; Valint, P. L. (Jr.); Pace, S. J. Structure and Properties of
Hydrophobically Modified Associating Polymers. In Polymers in Aqueous Media Performance Through Association. Glass, J. E., ed.; Advances in Chemistry Series 223; American Chemical Society: Washington, DC, 1989.
8. Sau, A. C.; Landoll, L.M. Synthesis and Properties of Hydrophobically Modified
(Hydroxyethyl)cellulose. In Polymers in Aqueous Media Performance Through Association. Glass, J. E., ed.; Advances in Chemistry Series 223; American Chemical Society: Washington, DC, 1989.
9. Goodwin, J.W.; Hughes, R.W.; Lam, C.K.; Miles, J.A.; Warren, B. C. H. The
Rheological Properties of Hydrophobically Modified Cellulose. In Polymers in Aqueous Media Performance Through Association. Glass, J. E., ed.; Advances in Chemistry Series 223; American Chemical Society: Washington, DC, 1989.
10. Kraunasena, A.; Brown, R.G.; Glass, J.E. Hydrophobically Modified Ethoxylate
Urethane Architecture: Importance of Aqueou-and Dispersed-Phase Properties. In Polymers in Aqueous Media Performance Through Association. Glass, J. E., ed.; Advances in Chemistry Series 223; American Chemical Society: Washington, DC, 1989.

26
11. Jenkins, R.D.; Silebi, C.A.; El-Aasser, M.S. Steady-Shear and Linera-Viscoelastic Material Properties of Model Associative Polymer Solutions. In Polymers as Rheology Modifiers. Schultz, D.N.; Glass, J. E., eds.; ASC Symposium Series 462; American Chemical Society: Washington, DC, 1991.
12. Jenkins, R.D.; Bassett, D.R.; Silebi, C.A.; El-Aasser, M.S. Synthesis and
Characterization of Model Associative Polymers. Journal of Applied Polymer Science 1995, 58(2), 209-230.
13. Miffleton, J.C. Cummins, D.F.; McCormick, C.L. Rheological Properties of
Hydrophobically Modified Acrylamide-Based Polyelectrolytes. In Water-Soluble Polymers Synthesis, Solution Properties and Applications; Shalaby, S. W.; McCormick, C.L. and Butler, G.B., eds.; ASC Symposium Series 467; American Chemical Society: Washington, DC, 1991.
14. Regalado, E.; Selb, J.; Candau, F. Viscoelastic Behavior of Semidilute Solutions of MultiSticker Polymer Chains. Macromolecules 1999, 32, 8580-8588.
15. Tirtaatmadja, V. T., K. C. Jenkins, R. D. Bassett, D. R. Stability of a Model Alkali-
Soluble Associative Polymer in the Presence of a Weak and a Strong Base. Colloid and Polymer Science 1999, 277, 276-281.
16. Rich, A. F.; Benes, P. C.; Adams, L. E. Combinations of Polymeric Associative
Thickeners for Aqueous Latex Paints. US Patent 4735981, 1988.
17. Jones, C. E.; Reeve, P. F. D. Mixed Surfactant and Hydrophobically-Modified Polymer Compositions for Thickeners for Aqueous Systems. EP Patent 875557, 1998.
18. Jenkins, R. D.; Bassett, D. R.; Shay, G. D. Water-Soluble Polymers Containing
Complex Hydrophobic Groups. US Patent 5292828, 1994.
19. Harrington, J. C.; Zhang, H. T. Using Hydrophobically Associative Polymers in Preparing Cellulosic Fiber Compositions. WO Patent 0140578, 2001.
20. Marchant, N. S.; Yu, S. Rheology Modifying Copolymer Composition. US Patent
06433061, 2002.
21. Brooks, A.; Du Reau, C. M. A. Cleansing Compositions Containing Polar Oils and Skin Conditioners. WO Patent 9800495, 1998.
22. Herd, H. E.; Williams, R. Preparation and Properties of Shear-Thinning, Thickened
Cleaning Composition. GB Patent 2346891, 2000.

27
23. Alan, B.; Du Reau, C. M. A. Cleansing Compositions. US Patent 6191083, 2001.
24. Veronique, R.; Therese, D. Aerated Composition, Process for its Manufacture and its Use. US Patent 6251954, 2001.
25. Didier, C.; Serge, F.; Anne-Marie, P. UV-photoprotecting Emulsions Comprising
Micronized Insoluble Screening Agents and Associative Polymers. US Patent 6409998, 2002.
26. Ewbank, E.; Collard, C.; Tummers, D.; Breuer, E.; Thibert, E. Liquid Fabric
Softening Compositions Containing a Fatty Alcohol Ethoxylate Diurethane Polymer as a Thickener. US Patent 6001797, 1999.
27. Alfons, C. R. A.; Madeleine, D. B. F. J.; Jean, H. B. A. Fabric Softener
Compositions. US Patent 6020304, 1999.
28. Jenkins, R. D.; Bassett, D. R.; Lightfoot, R. H.; Boluk, M. Y. Glycol-Based Aircraft Anti-Icing Fluids Thickened by Associative Polymers Containing Hydrophobe-Bearing Macromonomers. US Patent 5681882, 1997.
29. Jenkins, R. D.; Bassett, D. R.; Lightfoot, R. H.; Boluk, M. Y. Aircraft Anti-icing
Fluids Thickened by Associative Polymers. WO Patent 9324543, 1993.
30. Carder, C. H.; Garska, D. C.; Jenkins, R. D.; McGuiness, M. J. Aircraft Deicing/Anti-icing Fluids Thickened by Associative Polymers. US Patent 5708068, 1998.
31. Carder, C. H.; Garska, D. C.; Jenkins, R. D.; McGuiness, M. J. Aircraft Deicing/anti-
icing Universal Fluids. JP Patent 10237428, 1998.
32. Wang, C.; Tam, K.C.; Jenkins, R.D.; Bassett, D.R. Potentiometric Titration and Dynamic Light Scattering of Hydrophobically Modified Alkali Soluble Emulsion (HASE) Polymer Solutions. Phys. Chem. Chem. Phys. 2000, 2, 1967-1972.
33. Kumacheva, E.; Rharbi, Y.; Winnik, M A.; Guo, L.; Tam, K. C.; Jenkins, R. D.
Fluorescence Studies of an Alkaline Swellable Associative Polymer in Aqueous Solution. Langmuir 1997, 13, 182-186.
34. Horiuchi, K.; Rharbi, Y.; Yekta, A.; Winnik, M.A.; Jenkins, R.D.; Bassett, D.R.
Dissolution Behavior in Water of a Model Hydrophobic Alkali- Swellable Emulsion (HASE) Polymer with C20H41 Groups. Canadian Journal of Chemistry-Revue Canadienne De Chimie 1998, 76, 1779-1787.

28
35. Tirtaatmadja, V.; Tam, K.C.; Jenkins, R.D. Rheological Properties of Model Alkali-Soluble Associative (HASE) Polymers: Effect of Varying Hydrophobe Chain Length. Macromolecules 1997, 30, 3271-3282.
36. Tan, H.; Tam, K.C.; Tirtaatmadja, V.; Jenkins, R.D.; Bassett, D.R. Extensional
Properties of Model Hydrophobically Modified Alkali-Soluble Associative (HASE) Polymer Solutions. J. Non-Newtonian Fluid Mech. 2000, 92, 167-185.
37. Dai, S. T., Tam, K.C.; Jenkins, R.D.; Bassett, D.R. Light Scattering of Dilute
Hydrophobically Modified Alkali-Soluble Emulsion Solutions: Effect of Hydrophobicity and Spacer Length of Macromonomer. Macromolecules 2000, 33, 7021-7028.
38. Nagashima, K.; Strashko, V.; Macdonald, P.M.; Jenkins, R.D.; Bassett, D.R.
Diffusion of Model Hydrophobic Alkali-Swellable Emulsion Associative Thickeners. Macromolecules 2000, 33(25), 9329-9339.
39. Tam, K.C.; NG, W.K.; Jenkins, R.D; Bassett, D.R. Viscoelastic Behavior of Model
HASE Associative Polymer Solutions. Proceedings of the XIIIth International Congress on Rheology, Cambridge, UK, 2000. 329-331.
40. Szejtli, J. Introduction and General Overview of Cyclodextrin Chemistry. Chem. Rev.
1998, 98, 1743-1753.
41. Amiel, C.; David, C.; Renard, E.; Sebille, B. Macromolecular Assemblies Generated by Inclusion Complexes between Amphipathic Polymers and β-Cyclodextrin Polymers in Aqueous Media, Polymer Preprints (American Chemical Society, Division of Polymer Chemistry) 1999, 40, 207-208.
42. Amiel, C.; Moine, L.; Brown, W.; Renard, E.; Guerin, P.; Sebille, B. Associations of
Amphiphilic Degradable Polymers with Β-Cyclodextrin Polymers: pH-Dependent Network, Proceedings of the International Symposium on Cyclodextrins, 9th, Santiago de Comostela, Spain, May 31-June 3, 1998, 1999, 81-84.
43. Amiel, C.; Sebille, B. New Associating Polymer Systems Involving Water-Soluble β-
Cyclodextrin Polymers, Rev. Inst. Fr. Pet. 1997, 52(2), 248-250.
44. Amiel, C.; Sebille, B. New Associating Polymer Systems Involving Water-Soluble β-Cyclodextrin Polymers, J. Inclusion Phenom. Mol. Recognit. Chem. 1996, 25, 61-67.
45. Amiel, C.; Sandier, A; Sebille, B.; Valvvat, P.; Wintagens, V. Association Between
Hydrophobically End-Capped Polyethylene Oxide and Water Soluble β-Cyclodextrin Polymers, int. J. Polymers Analysis & Characterization 1995, 1, 289-300.

29
46. Sandier, A.; Brown, W.; Mays, H.; Amiel, C. Interaction between an Adamantane End-Capped Poly(ethylene oxide) and a β-Cyclodextrin Polymer, Langmuir 2000, 16, 1634-1642.
47. Amiel, C.; Moine, L.; Sandier, A.; Brown, W.; David, C.; Hauss, F.; Renard, E.;
Gosselet, M.; Sebille, B. Macromolecular Assemblies Generated by Inclusion Complexes between Amphipathic Polymers and β-Cyclodextrin Polymers in aqueous media, ACS Symposium Series 2001, 780, 58-81.
48. Gosselet, N. M.; Naranjo, H.; Renard, E. Amiel, C.; Sebille, B. Association of Poly-
N-[tris(hydroxymethyl)methyl] Acrylamide with a Water Soluble β-Cyclodextrin Polymer, European Polymer Journal 2002, 38, 649-654.
49. Gosselet, N. M.; Borie, C.; Amiel, C.; Sebille, B. Aqueous Two Phase Systems from
Cyclodextrin Polymers and Hydrophobically Modified Acrylic Polymers, J. Dispersion Sci. Technol. 1998, 19, 805-820.
50. Gosselet, N. M.; Beucler, F.; Renard, E.; Amiel, C.; Sebille, B. Association of
Hydrophobically Modified Poly (N,N-dimethylacrylamide hydroxyethyl methacrylate) with Water Soluble β-Cyclodextrin Polymers, Colloids and Surfaces, A: Physicochemical and Engineering Aspects 1999, 155, 177-188.
51. Karlson, L.; Thuresson, K. and Lindman, B. Investigation of the Complex Formation
between Hydrophobically Modified Ethyl(hydroxy ethy) Cellulose and Cyclodextrin. Carbohydrate Polymers 2002, 50(3), 219-226.
52. Moine, L.; Amiel, C.; Brown, W.; Guerin, P. Associations between a hydrophobically
modified, degradable, poly(malic acid) and a .β.-cyclodextrin polymer in solution, Polymer International 2001, 50, 663-676.
53. Wenz, G.; Weickenmeier, M.; Huff, J. Association thickener by host-guest interaction
of .β.-cyclodextrin polymers and guest polymers, ACS Symposium Series 2000, 765, 271-283.
54. Weickenmeier, M.; Wenz, G.; Huff, J. Association Thickener by Host Guest
Interaction of a β-Cyclodextrin Polymer and Polymer with Hydrophobic Side-Groups., Macromol. Rapid Commun., 1997,. 18(12), 1117-1123.
55. Ma, Z.; Glass, J. E. Complexations of β-Cyclodextrin with Surfactants and
Hydrophobically Modified Ethoxylated Urethanes. In Analytical application in adsorption measurements. ACS Symposium Series, 2000. 765(Associative Polymers in Aqueous Media): p. 254-270.

30
56. Gupta, R.K.; Tam, K. C.; Ong, S. H.; Jenkins, R. D. Interactions of Methylated β-Cyclodextrin with Hydrophobically Modified Alkali-Soluble Associative Polymers (HASE): Effect of Varying Carbon Chain Length. In Proc. Int. Congr. Rheol., 13th. 2000.
57. Islam, M. F.; Jenkins, R. D.; Bassett, D. R; Lau, W.; Ou-Yang, H. D. Single Chain
Characterization of Hydrophobically Modified Polyelectrolytes Using Cyclodextrin/Hydrophobe Complexes, Macromolecules, 2000, 2480-2485.
58. Amiel, C., Renard, E.; Sandier, A.; Moine, L.; Gosselet, M.; Sebille, B.
Macromolecular assemblies generated by inclusion complexes between amphipathic polymers and b-cyclodextrin polymers in aqueous media. Book of Abstracts, 218th ACS National Meeting, New Orleans, Aug. 22-26, 1999.
59. Ahmed, M.O. Comparison of Impact of the Different Hydrophilic Carriers on the
Properties of Piperazine-Containing Drug. European Journal of Pharmaceutics and Biopharmaceutics, 2001, 51(3), 221-225.
60. Alexandridis, Paschalis; Tsianou, M.; Ahn, S. Effect of Cyclodextrins on Polymer-
Surfactant Interactions in Aqueous Solution. Proceedings of the International Symposium on Controlled Release of Bioactive Materials, 2000, 1134-1135.
61. Alvarez, A. R; Garcia-Rio, L.; Herves, P.; Leis, J. R.; Mejuto, J. C.; Perez-Juste, J.
Basic Hydrolysis of Substituted Nitrophenyl Acetates in β-Cyclodextrin/Surfactant Mixed Systems. Evidence of Free Cyclodextrin in Equilibrium with Micellized Surfactant. Langmuir, 1999, 15(24), 8368-8375.
62. Buschmann, H. J.; Cleve, E.; Schollmeyer, E. The Interactions between Nonionic
Surfactants and Cyclodextrins Studied by Fluorescence Measurements. Journal of Inclusion Phenomena and Macrocyclic Chemistry, 1999, 33(2), 233-241.
63. Cserhati, T.; Oros, G.; Szejtli, J. Effect of Cyclodextrins of Nonionic Surfactants:
Reduction of Surface Activity and Phytotoxicity, Tenside, Surfactants, Deterg., 1992, 29(1), 52-57.
64. Cserhati, T.; Forgacs, E. Charge-Transfer Chromatographic Study of the Interaction
of Non-ionic Surfactants with Hydroxypropyl-β-Cyclodextrin. J. Chromatogr., A, 1994, 665(1), 17-25.
65. Eli, W.; Chen, W.; Xue, Q. Determination of Association Constants of Cyclodextrin-
Nonionic Surfactant Inclusion Complexes by a Partition Coefficient Method, Journal of Inclusion Phenomena and Macrocyclic Chemistry, 2000, 38(1-4), 37-43.
31
66. Hodul, P.; Duris, M.; Kralik, M. Inclusion Complexes of β-Cyclodextrin with Non-ionic Surfactants in Textile Preparation Processes., Vlakna Text., 1996, 3(1), 15-19.
67. Katougi, Y.; Saito, Y.; Hashizaki, K.; Taguchi, H.; Ogawa, N. Comparison of the
Solubilizing Ability of Cyclodextrins and Surfactants for (+)-α.-pinene. Journal of Dispersion Science and Technology, 2001, 22(2 & 3), 185-190.
68. Oros, G.; Cserhati, T.; Szejtli, J. Cyclodextrins Decrease the Phytotoxicity of
Nonionic Tensides. Acta Agron. Hung., 1989, 38(3-4), 211-17.
69. Rohrbach, R. P.; Allenza, P.; Schollmeyer, J.; Oltmann, H. D. Biodegradable Polymeric Materials and Articles Fabricated Therefrom, US Patent 9106601, 1991.
70. Saito, Y.; Katougi, Y.; Hashizaki, K.; Taguchi, H.; Ogawa, N. Solubilization of (+)-
.α-Pinene by Cyclodextrin/Surfactant Mixed Systems. Journal of Dispersion Science and Technology, 2001, 22(2 & 3), 191-195.
71. Saket, M. Improvement of Solubility and Dissolution Rate of Meclozine
Hydrochloride Utilizing Cyclodextrins and Non-ionic Surfactant Solutions Containing Cosolvents and Additives. Acta Technol. Legis Med., 1997, 8(1), 33-48.
72. Topchieva, I. N.; Karezin, K. I. Molecular Self-assembly in Nonionic Surfactant-
Cyclodextrin Systems. Colloid Journal (Translation of Kolloidnyi Zhurnal), 1999, 61(4), 514-519.
73. Topchieva, I.; Karezin, K. Self-Assembled Supramolecular Micellar Structures Based
on Non-ionic Surfactants and Cyclodextrins. Journal of Colloid and Interface Science, 1999, 213(1), 29-35.
74. Wilson, L. D.; Verral, R. E. 1H NMR Study of Cyclodextrin-Hydrocarbon Surfactant
Inclusion Complexes in Aqueous Solutions. Canadian Journal of Chemistry, 1998, 76(1), 25-34.
75. Woo, R. A.; Trinh, T.; Cobb, D. S.; Schneiderman, E.; Wolff, A. M.; Ward, T. E.;
Chung, A. H.; Reece, S.; Rosenbalm, E. L. Uncomplexed Cyclodextrin Compositions for Odor Control and Refreshening of Garments. US Patent 9,856,888, 1998.

32
CH2 C
CH3
COOH
H2C C
H
C OOCH2CH3
CH2 C
CH3
CH3C CH3NHCOO
CH2H2CO
x
y
Rp
z
Methacrylic Acid
Ethyl Acrylate
Macromonomer
Figure 1. Molecular structure of a hydrophobically modified associative polymer. The structure shown is for a hydrophobically modified alkali-soluble emulsion (HASE) polymer
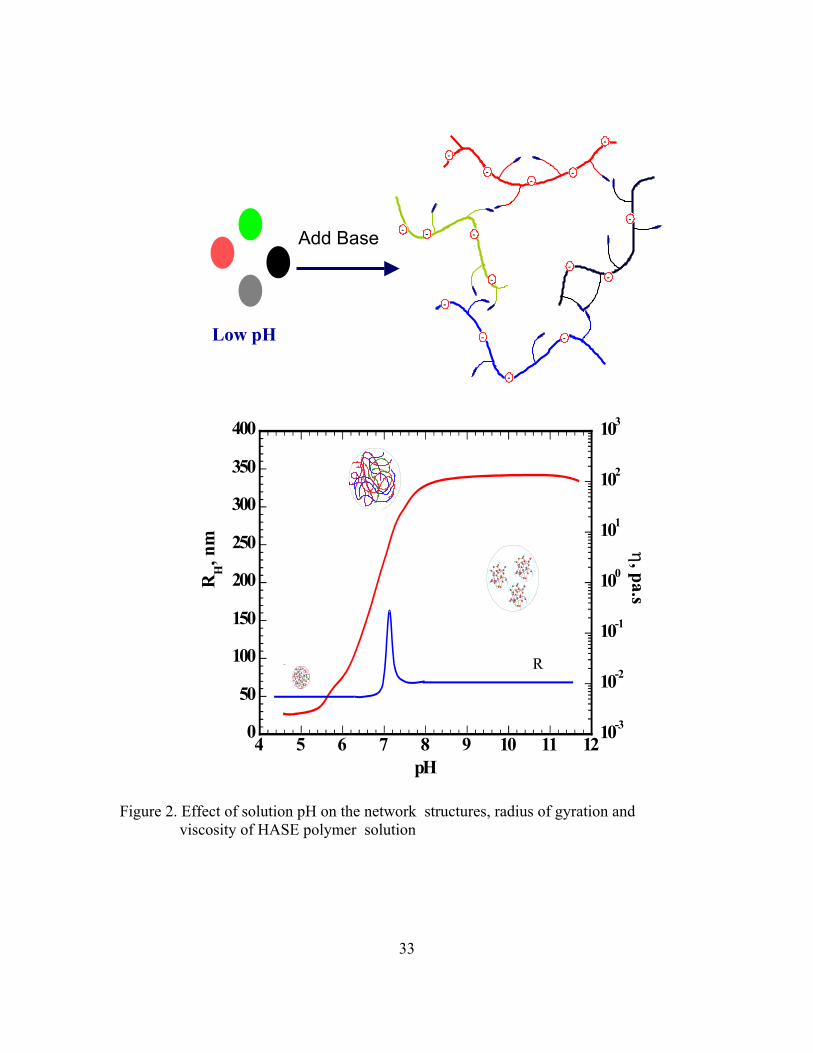
33
Figure 2. Effect of solution pH on the network structures, radius of gyration and
viscosity of HASE polymer solution
- - -
-
-
-
-
-
--
-
-
--
--
Add Base
Low pH
0
50
100
150
200
250
300
350
400
10-3
10-2
10-1
100
101
102
103
4 5 6 7 8 9 10 11 12
RH, n
m η, pa.s
pH
R

34
10-2
10-1
100
101
102
103
10-3 10-2 10-1 100 101 102
No Salt0.2 M0.3 M0.4 M0.55 M0.6 M0.7 M1 M
η, p
oise
γ, s-1.
[NaCl]
Figure 3. Effect of salt (NaCl) concentration on the steady shear viscosity of a 1% polymer
solution33.

35
Figure 4. Schematic representation of HASE polymer aggregates for (a) short PEO spacer
length and (b) long PEO spacer length34.

36
Figure 5. Structure of β-cyclodextrin and approximate geometric dimension of α−, β− and
γ−cyclodextrin molecules
7.8Å
5.7 Å 13.7Å
α-cyclodextrin
7.8Å
7.8 Å 15.3Å
β-cyclodextrin
7.8Å
9.6 Å 16.9Å
γ-cyclodextrin

CHAPTER 3
EXPERIMENTAL TECHNIQUES

38
Abstract
Many experimental techniques can be used to characterize the structure and
rheological properties of hydrophobically modified associative polymers. This chapter
summarizes the theoretical principles behind the techniques that are utilized during the
course of this study. These techniques include rheology, diffusing wave spectroscopy
(DWS), nuclear magnetic resonance (NMR), differential scanning calorimetry (DSC), and
thermal gravimetric analysis (TGA).

39
3. 1 Rheological Characterization:
Rheology is defined as the science that deals with the deformation of materials as a
result of an applied stress1. It is a powerful tool that is capable of characterizing the
properties and microstructure of many polymeric and non-polymeric systems. Rheology
provides information that is important in designing and optimizing material properties2. In
the next few sections, we give a brief summary to different rheological techniques that have
been used in this study.
3.1. 1 Dilute Solution Measurement
The rheology of dilute solution is one of the widely used techniques for
characterizing polymers2. In dilute solution experiments, the viscosity of very dilute solutions
is measured and the intrinsic viscosity, [η], is determined by extrapolating to zero
concentration. The mathematical definition of [η] is:
0[ ] lim
o
c o cη η
ηη→
−=
(1)
where η is the viscosity of solution of concentration c and ηo is the viscosity of the solvent.
Dilute solution experiments also gives information about the polymer dimension, the
polymer-solvent interactions and the crossover concentration (c*). c* is defined as the
concentration at which the polymer coils begin to overlap and span the entire solution
volume, and is usually taken as the reciprocal of [η].
In our study, the viscosities of the solvent and dilute polymer solutions wer measured
with Ubbelhode dilution viscometers situated in a thermostated water bath at 25°C. The
efflux times of the polymer solutions were converted to reduced and inherent

40
viscosities. Using the familiar Huggins and Kraemer equations, the intrinsic viscosity was
obtained by plotting the resulting reduced and inherent viscosities against concentration and
extrapolating to zero concentration1.
3. 1. 2. Steady-State or Simple Shear Flow
In a steady shear experiment, a steady shear stress is applied on the sample and the
resultant shear rate is measured. The apparent viscosity is defined as the ratio of the shear
stress to the shear and reported as a function of the shear rate (or shear stress):
( ) τη γγ
= (2)
According to the behavior of η as function of γ , the fluid can be classified as Newtonian
(constant viscosity), pseudoplastic/shear thinning (viscosity decreases with shear rate), or
dilatants/shear thickening (viscosity increases with shear rate). The different material
responses are shown in Figure 1.
3. 1. 3. Dynamic or Small Amplitude Oscillatory Shear Flow
The dynamic rheological technique is a useful tool in probing microstructures of
materials without disrupting these structures. In dynamic (oscillatory) shear flow, a
sinusoidally varying strain of amplitude γο is applied to the sample:
γ=γo sin(ωt) (3)
where ω is the frequency of oscillation. The dynamic experiment is usually carried out using
very small strain amplitude and the sample is said to be within the linear viscoelastic (LVE)
region. In the LVE region the sample response is independent of the applied strain amplitude

41
and the stress generated due to the sinusoidal shear will again be sinusoidal:
τ=τo sin(ωt+δ) (4)
Here, δ is the phase angle. For elastic solids both stress and strain will be in phase (δ=0°)
while for Newtonian fluids, the stress and strain will be completely out of phase (δ=90°).
Correspondingly, viscoelastic materials exhibit a phase angle between 0 and 90°. Using
trigonometric identities, the stress wave can be decomposed into an in-phase and out-of-
phase component.
τ=τo cos(δ)sin (ωt)+ τo sin(δ)cos (ωt) (5)
The in-phase component corresponds to the ability of the material to elastically store energy
and the out-of-phase component corresponds to its ability to dissipate energy. Moreover, the
shear storage (elastic) modulus (G’) and the shear loss (viscous) modulus (G”) is defined as
the ratio of the corresponding stress component to the strain amplitude, as follows:
G' = τo cos(δ)/γo (6)
G’’ = τo sin(δ)/γo (7)
The complex viscosity (η*) can be defined as the ratio of the complex modulus
(G*=(G’2+G”2)½) to the frequency of deformation:
2 2** ' "( ) G G Gη ω
ω ω ω = = +
(8)
The frequency dependence of G’ and G”, the dynamic mechanical spectrum, provides the
most important information about the microstructure of a material. For example, gels exhibit
G’ that is larger than G” with both moduli independent of frequency. Polymer melts show G’
and G” at low frequencies that are dependent on ω2 and ω, respectively. For viscoelastic

42
materials, the overlap frequency (the frequency at which G’ and G’ curves intersect) gives
information about the relaxation time of the system. The plateau modulus, the value of G’ at
high frequency, gives information about the strength of the structures formed in the material.
Typical dynamic spectra for gels and common polymer solution or melts are shown in
Figure 2.
3. 1. 1. Transient Shear Flow
In our study, we consider only one type of transient shear flow experiments, the creep
recovery experiment. In a creep experiment, the material that is initially at rest is subjected to
a sudden constant stress and the deformation is measured as a function of time1. The creep
experiment is composed of creep step(s) followed by a recovery step where the applied stress
is removed. The behavior of elastic, viscoelastic and Newtonian materials during a creep and
creep recovery experiment is shown in Figure 3. The creep compliance, J(t) is often used to
describe the deformation during a creep experiment and is defined as the ratio between the
strain and the constant stress; it has dimensions of reciprocal modulus3.
The steady, dynamic and transient rheological properties of the polymer solutions
were measured using a stress-controlled rheometer (Rheometrics DSR II) fitted with
appropriate cone and plate, parallel plates or couette geometries. The linear viscoelastic
region (LVE) was determined for each sample by running a dynamic sweep experiment. Both
the dynamic frequency sweep and the stress creep experiments were conducted by applying
stresses within the LVE.

43
3. 2 Diffusing Wave Spectroscopy
Diffusing Wave Spectroscopy (DWS) is a dynamic light scattering technique that
extends dynamic light scattering to very highly multiple scattering media. DWS is very
similar to conventional dynamic light scattering. Both techniques measure the temporal
fluctuation of the intensity of a single speckle spot of the scattered light. These intensity
fluctuations in turn reflect the dynamics of the scattering medium4. Using DWS, the
viscoelastic properties of complex fluids and polymeric systems can be extracted from the
measurements of the means square displacement of microspheres embedded in the
viscoelastic medium5. The measured electric field autocorrelation function can be related to
the mean square displacement of the scattering particles through4:
( ) ( ) ( )2 21
0
1exp3 *o
sg t P s k r t dsl
∞ = − ∆ ∫ (9)
where g1(t) is the electric field autocorrelation function, P(s) is the path length distribution
function, ko is the wave vector, ∆r 2 t( ) is the particle mean squared displacement and l* is
the distance over which light becomes completely randomized.
The viscoelastic properties of the media can be extracted using one of two
approaches. The first approach uses the Stokes-Einstein equation (6
Bk TD
aπ η= ) then
generalizes it using the mean field assumption to a frequency dependent form6:
2( )
6 ( )Bk TG s
as r sπ≈
∆ (10)
where ( ) G s is the viscoelastic modulus in the frequency domain, s is the Laplace frequency.

44
( )G s can be transformed to the more familiar complex shear modulus, G*(ω), using
analytical continuation and the substitution s = i ω . The storage G’(ω) and loss G”(ω) moduli
are taken as the real and imaginary parts of G*(ω)7.
The second approach is simpler and does not require any transformation from the
time to the frequency domain. Instead, it involves direct transformation of the mean square
diaplacement, <∆r2(t)>, to the creep compliance J(t) through the following relation8:
2 ( ) ( )Bk Tr t J ta
∆ =π
(11)
The loss and storage moduli can be calculated using the retardation spectrum
L(τ) determined by regularized fit of the creep compliance using a set of impartial basis9:
1
( ) expN
nnn
t tJ t Je Lη τ=
= + − ∑
(12)
where N is the number of terms and τn are fixed to be logarithmically spaced.
1*
1( )
1
Nn n
n n
LG
iτ
ωωτ
−
=
= +
∑ (13)
The last equation is an exact equation; thus, the uncertainty in the transformation from the
time to frequency domain lies only in the compromise between the degree of smoothing of Ln
and the quality of the fit9.
A DWS setup operating in the transmission mode was utilized in carrying out all
measurements. In this setup, the beam from a diode pumped solid state (DPSS) Nd-YAG
laser operating at a wavelength of 532 nm in vacuo was incident upon a 2 or 3 mm width flat
scattering cell, containing the HASE polymer solution with spherical optical probes (1%

45
monodispersed polystyrene (PS) spheres added to insure a highly scattering medium). The
size of the PS spheres was varied from 0.195 µm to 1.55 µm to check for presence of
heterogeneity. The multiply scattered light was collected by an ALV SI/SIPD photon
detector via a single mode optical fiber. The output from the ALV SI/SIPD photon detector
was fed into a correlator working in the cross correlation mode. The measured intensity auto
correlation function was converted into the electric field autocorrelation function using the
Siegert relationship.
3. 3 Nuclear Magnetic Resonance
Nuclear Magnetic Resonance is a phenomenon that occurs when the nuclei of certain
atoms are immersed in a static magnetic field Bo and exposed to a second transverse rotating
magnetic field B1. Some nuclei experience this phenomenon, and others do not, depending
upon whether they possess a property called spin. When the spin of the protons and the
neutrons comprising the nuclei are not paired, the overall spin of the charged nuclei generates
a magnetic dipole along the spin axis. The magnitude of this dipole is known as the nuclear
magnetic moment, µ. For atoms with spherically symmetric charge distribution, the nucleus
is said to have a spin number (I) of ½. Examples are nuclei of 1H, 13C, 15N, 19F, 31P.
In the presence of an external magnetic field of strength Bo, the nuclear magnetic
moment can align with this external field in 2I+1 ways, reinforcing or opposing Bo. Nuclei
with I=½ have 2 ways to align with the external field either parallel, energetically favored, or
anti-parallel to the external field and the spinning nucleus will precess about the magnetic
field with a frequency ωo (Larmor frequency ωo = γ Bo). γ is called the magnetogyric ratio
and it relates the spin number I to the magnetic momentum (γ = 2πµ/h I), h is

46
Plank’s constant. At a specific rotating frequency of the transverse magnetic field B1, the
nucleus will resonate or flip from parallel to anti-parallel or vice-versa. The exact frequency
of the spin flip identifies the kind of atom that is involved and the other atoms to which it is
connected in the molecule. By measuring all of the frequencies, the molecular structure can
be determined. The NMR spectrometer identifies spin-flip transitions by detecting the energy
change that is associated with the transition process, ∆E = hγBo/2π. The NMR spectrometer
detects, amplifies, and displays this magnetic interaction to identify the structure of the
molecule10.
All 1H NMR spectra in this study were obtained using a 500 MHz Bruker DRX NMR
spectrometer. All spectra were acquired in DMSO-d6 as solvent at 298°K using
Tetramethylsilane (TMS) as internal standard. The instrumental parameters for acquisition of
the one-dimensional proton spectra are as follow: tuning frequency 500.128 MHz, Spectral
Width 13.2 ppm, number of data points 32K, relaxation and acquisition times 1 and 2.47 sec
(respectively), pulse width 10.5 µm, tip angle 90° and number of transients 16.
3. 4 Differential Scanning Calorimetry
Differential Scanning Calorimetry (DSC) is a thermal analysis technique that is
concerned with the energy changes in a substance11. Each DSC instrument has two separate-
heating circuits- the average temperature controller and the differential heating circuit. The
sample and a reference are heated in separate well-isolated chambers and the temperature of
both these chambers are measured and averaged. The heat output of the heater is
automatically adjusted so that the average temperature of the sample and the reference is
changed in a predefined manner. The temperature between the sample and the

47
reference adjusts the power to either the reference or the sample chamber to keep both at the
same temperature. The power supplied to the two differential heaters is plotted versus the
sample temperature. DSC gives information about both first and second order energy
transitions, such as glass transition temperature, crystallization, recrystallization, melting, and
thermal degradation12.
The DSC experiments in this study were carried out on 3-8 mg samples with a
Perkin-Elmer DSC-7 thermal analyzer equipped with a cooler system. A heating rate of
10°C/min was used and an indium standard was used for calibration. Before each scan,
samples were annealed at 200°C for 3 minutes to erase thermal history, followed by a flash
quenching to -100°C at 500°C/min.
3. 5 Thermal Gravimetric Analysis
Thermal Gravimetric Analysis (TGA) is a thermal analysis technique that examines
the mass changes of a sample as a function of temperature or time. It is used to characterize
decomposition and thermal stability of materials under a variety of condition and to examine
the kinetics of the physicochemical processes occurring within a sample12.
TGA measurements in this study were carried out on Perkin-Elmer Pyris1
Thermogravimetric Analyzer. Approximately 20 mg samples were heated from 25-600°C at
rate of 20°C/min and the sample weight was recorded as a function of sample temperature.

48
III.6 References:
1. Carreau, P.J.; De Kee, D.C.R.; Chhabra, R.P. Rheology of Polymeric Systems Principles and Applications; Hanser Gardner Publications, Inc.: Cincinnati, 1997.
2. Rohn, C. L. Analytical Polymer Rheology: Structure-Processing-Property Relationships,
Hanser Gardner Publications, Inc.: Cincinnati, 1995. 3. Ferry, J. D. Viscoelastic Properties of Polymers, 3rd ed.; John Wiley and Sons, Inc.: New
York, 1980. 4. Weitz, D.A.; Pine, D. J. Diffusing-Wave Spectroscopy. In Dynamic Light Scattering, B.
Wyn, ed.; Oxford University Press: Oxford, 1993. 5. Rufener, K.; Almer, A.; Xu, J.; Wirtz, D. High Frequency Dynamic and Microrheology
of Macromolecular Solution Probed by Diffusing Wave Spectroscopy: the Case of Concentrated Solutions of F-actin. J. Non-Newtonian Fluid Mech. 1999, 82, 303-314.
6. Mason, T.G.; Gang, H.; Weitz, D.A. Diffusing-wave-spectroscopy Measurement of
Visco-elasticity of Complex Fluids. Journal of Optical Society of America 1997, 14(1), 139-149.
7. Mason, T.G. Estimation the Viscoelastic Moduli of Complex Fluid using the Generalized
Stokes-Einstein Equation. Rheol. Acta 2000, 39, 371-378. 8. Xu, J.; Viasnoff, V.; Wirtz, D. Compliance of Actin Filament Networks Measured by
Particle Tracking Microrheology and Diffusing Wave Spectroscopy. Rheol. Acta 1998, 37, 387-398.
9. Mason, T.G.; Gisler, T. ; Kroy, K.; Frey, E.; Weitz, D.A. Rheology of F-actin Solution
Determined from Thermally Driven Tracer Motion. J. Rheol. 2000, 44(4), 917-928. 10. Abraham, R.J.; Fisher, D.A.; Loftus, P. Introduction to NMR spectroscopy; Wiley: New
York, 1988. 11. Griffin, V. J.; Laye, P. G. Differential Thermal Analysis and Differential Scanning
Calorimetry. In Thermal Analysis-Techniques & Applications; Charsley, E.L.; Warrington, S.B., eds.; Hartnolls Ltd.: Bodmin, 1992.
12. Hatakeyama, T.; Quinn, F.X. Thermal Analysis Fundamentals and Applications to
Polymer Science, 2nd ed.; Wiley: New York, 1999.

49
10-2
10-1
100
100 101 102 103
η, P
a.s
γ, s-1.
Shear Thickening
Newtonian
Shear Thinning
Figure 1: Viscosity as a function of shear rate showing different material response; Newtonian, shear thinning and shear thickening.

50
100
101
102
103
104
10-3 10-2 10-1 100 101 102 103
G' o
r G
", P
a
ω, rad/s
Elastic gel
Polymer solution (melts)
G'
G'
G"
G"
Figure 2: Elastic (G’) and viscous (G”) moduli as function of angular frequency (ω) showing
the typical behavior of polymer solutions (melts) and elastic gels

51
Figure 3: Time profile of shear creep and creep recovery experiments for (a) elastic solid, (b) Newtonian fluid, and (c) viscoelastic material.
Stress applied Stress removed Time
Strain
a)
Stress applied Stress removed Time
Strain Permanent deformation
b
Stress applied Stress removed Time
Strain
Permanent deformation
c)

CHAPTER 44
EFFECT OF POLYMER COMPOSITION ON MICROSTRUCTURE AND
SOLUTION RHEOLOGY
Chapter 4 is essentially a manuscript by Ahmed Abdala, Keith Olesen, Wenjun Wu and Saad
Khan prepared for submission to Journal of Rheology.

53
Effect of Polymer Composition on Microstructure and Solution Rheology
Ahmed A. Abdala1, Keith Olesen2, Wenjun Wu2, and Saad A. Khan1*
1Department of Chemical Engineering, North Carolina State University, Raleigh NC 27695-7905 2The Dow Chemical Company, UCAR Emulsion Systems, 410 Gregson Drive, Cary, NC 27511
Abstract
We investigate the effects of polymer molecular structure on the solution rheology of
a hydrophobically modified associative polymer comprised of macromonomers with alkyl
hydrophobes attached to a poly(ethyl acrylate-co-methacrylic acid) backbone. In particular,
the effects of polymer backbone composition of varying proportions of methylacrylic acid
(MAA) and ethyl acrylate (EA) are examined. We find that the concentration of the MAA
monomer has a large impact on polymer viscoelasticity. Polymers with low MAA content
have smaller chain size that results in lower viscosity and dynamic elastic modulus compared
to polymers with high MAA content. Moreover, the balance between the polymer chain size,
the chain flexibility and the aggregation of the bulky EA groups yields a maximum in all
these material functions with respect to the MAA concentration. The scaling of the shear
viscosity, the high frequency elastic modulus and the creep compliance with polymer
concentration exhibit a power-law behavior with different exponents. In all cases, three
power-law regimes are observed, regardless of the MAA content. However, the transitions
shift to lower concentrations as the MAA content increases. The scaling behavior in the three
regions can be attributed to the presence of different hydrophobic interaction modes and are
compared to theoretical predictions based on the sticky Rouse and sticky reptation models.
Variation in the macromonomer concentration reveals a substantial increase in viscosity at
* corresponding author; phone: 919-515-4519; fax: 919-515-3465; email: [email protected]

54
intermediate macromonomer concentration (1 mole%) possibly due to an increase in the
number of intermolecular junctions as the number of hydrophobes per chain increases. This
is in contrast to low macromonomer concentration (0.3 mole%) behavior that reveals low
viscosity due to weak hydrophobic associations, and, high macromonomer concentration (1.9
mole%) behavior that favors more intramolecular association resulting in lower viscoelastic
properties compared to intermediate macromonomer concentration.

55
4.1 Introduction
Alkali soluble emulsion (ASE) polymers are carboxylic functional copolymers
produced by free-radical emulsion polymerization of ethylenically unsaturated monomers.
These ASE polymers are insoluble in water at low pH but exhibit thickening upon dissolution
in aqueous media at higher degree of ionization, usually at pH greater than 61. These non-
associative polymers can be hydrophobically modified by incorporation of small number of
hydrophobic macromonomers, usually nonionic surfactants that have been end-capped with
an unsaturated double bond2. The hydrophobically modified alkali-soluble emulsion (HASE)
polymers exhibit the nature of both the ASE polymers, swelling upon neutralization, and the
associative nature of hydrophobically modified ethoxylate urethane (HEUR) polymers,
forming transient networks through molecular associations. Due to their hybrid nature,
HASE polymers have been increasingly used as rheology modifiers in a variety of
applications including cosmetic and personal care products, painting, paper coatings and anti-
icing fluids. However, optimal use of these polymers requires controlling the structure and
composition of these polymers.
The structure of a typical HASE polymer is shown in Figure 1. This structure can be
described as a polyelectrolyte backbone with number of hydrophobic macromonomers
randomly grafted to the backbone. The backbone is composed of a copolymer of a
hydrophilic segment that provides solubility of the polymer and a slightly water insoluble
segment that enhances the thickening performance and promotes adsorption of the polymer
to hydrophobic latex in many applications. The hydrophilic polymer is usually an acrylic acid
or alkyl acrylic acid polymer while the water insoluble polymer is an acrylate or alkyl
acrylate polymer. In most studies of HASE polymers including this, the hydrophilic
56
segment is methacrylic acid (MAA) whereas the other segment is ethyl acrylate. The
hydrophobic macromonomers are attached to the polymer backbone through urethane linkage
and end capped with alkyl of alkyl aryl groups that are separated from the backbone by 5-100
polyethylene oxide (PEO) units. The complexity of the HASE polymer structures can be seen
in Figure 1, which shows the chemical structure of the polymers used in this study. With such
a complex architecture, the association behavior of these polymers would be expected to be
quite diverse and dependent on many factors such as, the structure of the backbone that
dictates their water solubility and flexibility, the structure and concentration of the
macromonomer that include the type of the hydrophobic groups and the length of
polyethylene oxide spacer2.
The effects of polymer-architectural parameters such as the PEO spacer length, and
the type and concentration of the hydrophobic groups on the solution behavior have thus
been the subject of many recent studies2-12. However, the effects of the composition of the
polymer backbone have received little attention2, 13. An understanding of how the polymer
backbone composition affects polymer flexibility, hydrophobic associations and the
rheological properties is important not only from a fundamental standpoint but also in
tailoring polymers with controlled bulk properties. In this study, we examine this issue using
polymers that contain different proportions of MAA and EA in its backbone.
4.2 Experimental Materials and Method
4.2.1 Polymers
Two sets of model HASE polymers (DOW Chemical Company, Cary, NC) were
used in this study. The macromonomer on the first set of polymers have C20 hydrophobes

57
with PEO spacers of 32-35 units. The second set of samples has macromonomers with C18
hydrophobes and 40 units of EO spacers. The composition of these polymers is shown in
Figure 2. As seen from the figure, the MAA acid content was varied between 18 and 73
mole%. The lower limit of MAA, 18%, is bounded by the solubility of the polymer. On the
other hand, the upper limit, 73%, was chosen to maintain the colloidal stability of the
polymer in the latex form. The macromonomer level was varied between 0.2 to 1.9 mole%
and was chosen based on the colloidal stability and the polymer performance as a thickener.
4.2.2 Solution Preparation
The polymer latexes were dialyzed against de-ionized water using cellulosic tubular
membranes for at least three weeks with daily change of water. After dialysis, the polymer
was freeze-dried and 5% solutions were prepared and neutralized to pH of 9.0 ± 0.1 with
NaOH, with the ionic strength adjusted to 10-4 M with KCl. Other concentrations were
subsequently prepared by the dilution of the 5% solution with both the pH and the ionic
strength kept at the same level.
4.2.3 Rheological measurements
The rheological properties of the polymer solution were measured using stress-
controlled rheometers (Rheometrics DSR II or TA Advanced rheometer RA2000) fitted with
appropriate cone and plate or couette geometries. The rheological properties of HASE
polymers have been shown to be dependent on their previous shear history; therefore, a pre-
shear regime was necessary to be considered. Prior to any measurement, the sample was
subjected to a shear rate of 1 s-1 for 5 min followed by a 10 minute-rest period. This protocol

58
was found to be sufficient for structure recovery in the sample as noticed from dynamic time
sweep experiments. In this study we employed three rheological techniques, steady shear,
dynamic oscillatory, and transient creep techniques. Both the dynamic frequency oscillation
and the transient creep experiments were carried out using small stresses, so that the sample
was within the linear viscoelastic region, where the dynamic properties are independent of
the applied stress.
The intrinsic viscosity of the polymer solutions was measured with Ubbelhode
dilution viscometers situated in a thermostated water bath. The efflux times of the polymer
solutions were converted to reduced and inherent viscosities from the following definitions:
;specific sreduced
s
t tc ct
ηη −
= = (1)
ln( ) ln( / )relative sinherent
t tc c
ηη = = (2)
where ts is the solvent efflux time. Using the familiar Huggins and Kraemer equations,
[ ] [ ]² creduced HKη η η= + (3)
[ ] [ ]² cinherent KKη η η= + (4)
the intrinsic viscosity was obtained by plotting the resulting reduced and inherent viscosities
against concentration and extrapolating to zero concentration.
4.2.4. Glass Transition Temperature (Tg) Measurements
The second order transition temperature, Tg, was measured using a Perkin-Elmer
DSC-7 thermal analyzer equipped with a cooler system. Measurements were carried out on
3-8 mg samples at a heating rate of 10° C/min and an indium standard was used for
calibration. Before each scan, samples were annealed at 200° C for 3 minutes to erase
thermal history, followed by a flash quenching to -100° C at 500° C/min. Tg was taken as the
midpoint of the glass transition.

59
4.3 Results and Discussion
4.3.1 Effect of MAA content
The steady shear viscosity profiles of polymers with different MAA mole% at a fixed
level of macromonomer are shown in Figure 3. We find all samples to exhibit strong shear
thinning with a small or nominal zero shear plateau indicating that all samples maintain their
associative behavior. One of the functions of the MAA group is to render the polymer soluble
(and not be a latex) and we find that even at a low MAA content of 18 mole% the polymer is
sufficiently soluble and expanded to allow hydrophobic associations. This implies that even
the lower MAA content, 18mole %, was high enough to render the polymer solubility . The
figure also reveals a large increase in the steady shear viscosity as the MAA content is
increased from 18 to 35 mole%, with a substantial jump observed between 24 and 35 mole%.
Further increase of the MAA content to 46% shows a moderate increase in viscosity. With
MAA molar% higher than 46%, the viscosity shows a slight decrease. A maximum in
Brookfield viscosity has been reported previously for an analogous polymer system at a
MAA composition of 40-mole%2.
Similar behavior is observed when we examine the dynamic behavior of these
samples as probed by an oscillatory shear experiment. In Figure 4a, which shows the elastic
modulus (G’) as function of frequency, we observe a significant increase in G’ as the MAA
increases up to 35% followed by a slight increase as the MAA content is increased to 46%.
Further increase in the MAA acid content to 54% leads to a slight decrease in G’. In addition,
a jump in G’ is observed when the MAA concentration is increased from 25 to 35%. All
these characteristics are reminiscent of the steady shear behavior. Moreover, there is a

60
change in the dependence of G’ on frequency as the MAA content increase. With low MAA,
G’ ~ω1.3 in the terminal region followed by a less dependence at high frequencies as G’~ω0.4.
In contrast, at high MAA content, there is less dependence on frequency as G’~w0.6 in the
terminal region and reaches a plateau at higher frequency. It is very interesting that the slope
at the terminal region for the sample with 54% MAA increases to 0.7 which suggests the
presence of an optimum MAA concentration that yield the lowest dependence on frequency.
Another interesting behavior is the change in the longest relaxation time (taken as the
reciprocal of the angular frequency where G’ and G” are equal) with MAA content. Figure 4-
b shows the dynamic frequency spectrum for one sample with low MAA (23%) and another
sample with high MAA (46%). G’, G” crossover shifts to higher frequency as the MAA
increases. The slower dynamics for the samples with low MAA is unexpected because of
their weaker network structures. However, the only possible explanation seems to be that
polymers with low and high MAA acid may have different relaxation mechanisms.
We have probed the effect of increasing MMA content further through transient creep
experiments. Figure 5 shows the time evolution of the creep compliance (J(t)) for samples
with different MAA content. We observe J(t) to decrease with increasing MAA content and
show a minimum, consistent with the behavior observed in steady and dynamic experiments.
The fact that J(t) decreases with MAA concentration, and not increases, is because increased
hydrophobic interactions impede creep in opposition to the what they do to viscosity or
modulus.
The large increase in the viscosity and moduli as well as the large decrease in the
creep compliance as the MAA content increases in the range of 18 to 34 mole% may be

61
attributed to the increase in the hydrodynamic size of the polymer chain as the MAA content
increases. This increase in the hydrodynamic size would be the result of an increase in the
hydrophilicity of the polymer backbone. To verify this hypothesis, experiments were
conducted to measure the intrinsic viscosity [η] of various samples. Figure 6 shows a
representative plot of polymers with different MAA proportion for a fixed macromonomer
content. This change in the hydrodynamic size is evident from the observed increase in the
intrinsic viscosity [η]. To further examine how changes in hydrodynamic size alone would
affect viscosity, we measured the viscosity of a 5% solution of the non-associative ASE
polymers which are copolymers of MAA and EA We find the viscosity of such polymers,
shown in Figure 7, to increase with MAA content and plateau out at large MAA
concentration, similar to the behavior observed in the associative polymers.
For associative polymers, we envision other factors to play a role, as well, in dictating
rheology as the MAA content is increased. At low MAA concentrations, the smaller chain
size will limit the hydrophobic interaction to only intramolecular association. As the MAA
content is increased, the polymer hydrophilicity increases and the chains become more
extended, and the solution viscosity and viscoelastic properties could be further enhanced by
the ability of the hydrophobes to form intermolecular association. On the other hand,
increasing the MAA content would increase the inherent chain stiffness and hinder
accessibility of the hydrophobic groups. The loss of chain flexibility as a result of increasing
the MAA is corroborated from the increase in the glass temperature (Tg) values as MAA
content increases, as seen in Figure 6. Another factor that would contribute to the rheology
would be the EA groups. The contribution from the aggregation of the bulky EA groups

62
would decrease due to the relative decrease of the EA content. The balance among these
three factors (hydrodynamic size, the chain flexibility and the aggregation of EA groups)
possibly leads to a maximum in G’ and η, and a minimum in J(t) behavior as a function of
increased MAA content.
4.3.2 Concentration Effects
To determine if the observed trends in viscosity, modulus and creep compliance with
increasing MAA content carries over to other polymer concentrations, we examine in Figure
8 the viscoelastic characteristics of polymers at four different concentrations (1, 2, 3 and
5%). Figure 8a shows the steady shear viscosity at a fixed shear rate of 0.01 s-1 as function of
MAA mole% for the different polymer concentrations. We find all four polymer
concentrations to show the same dependence on MAA content with a broad maximum
around 40 mole% MAA. Similar results are obtained when the high frequency elastic
modulus (G’at ω=100 rad/s) is plotted versus MAA content for the different polymer
concentrations, as shown in Figure 8b. On the other hand, a broad minimum is observed
when the creep compliance at t=100 is plotted versus the MAA content for different
concentrations (Figure 8c). It is interesting to point out that all three material functions are
consistent in that the maximum or minimum occur approximately at the same MAA content
of 40 mole%.
The change in the polymer behavior and [η] values at low and high MAA should
manifest themselves in different concentration dependence of the rheological material
functions. Figure 9 shows the concentration dependence of the low shear viscosity (shear rate
= 0.01 s-1), the high-frequency elastic modulus (at 100 rad/s), and the creep

63
compliance (at t=100 s) for two representative polymers of different MAA content. In both
cases we find η, G’ and J(t) to exhibit power-law behavior, albeit with different exponents. In
fact, we observe three distinct power-law regimes for all three material functions regardless
of the MAA content. However, the concentration at which these transition occur shifts to
lower values as the MAA acid content increases. Interestingly, three concentration regimes
have been observed recently for similar HASE polymer14 and other hydrophobically modified
polymers15. It also has been predicted by te sticky Rouse model16.
For unmodified polymers, concentration transitions are typically attributed to a
change from dilute, to unentangled and entangled semidilute regimes and occur at
concentrations relative to the overlap concentration, c*. For associative polymers, on the
contrary, the parameter c* is not the relevant variable. This can be demonstrated by
comparing the concentration at which the transitions occur. For simplicity we denote the
lower transition concentration as cL and the upper transition concentration cU. Figure 10
shows the transition concentrations cL and cU for samples with different MAA content. To
compare the transition concentration with the overlap concentration (c*), the figure includes
data for 10 times c*. As shown in this figure, the transition concentration shifts to lower
values as the MAA content increases. Moreover, the lower transition concentration changes
from about 20 times c* at low MAA to less than 10 times c* at high MAA. This confirm the
irrelevance of c* as the parameter for any concentration transitions.
We believe that the three concentration regimes in Figure 9 can be explained in terms
of different modes of hydrophobic associations. Figure 11 shows schematically the expected
hydrophobic associations possible in these different regions. In Regime 1 in which c<cL, the

64
polymer chains are isolated and as a result only intramolecular associations are possible. The
solution viscosity in this region is similar to that of unmodified polymer analogs. In this
regime, the scaling exponent for each material function varied with MAA. At low MAA
content (18 mole%), scaling exponents of 1.2, 2.0, and -1.3 are observed for η, G and J(t),
respectively. These exponents decrease with MAA content and reach values of 0.60 and –
0.65 corresponding to viscosity and creep compliance, respectively. The change in the
scaling exponent can be attributed to the change in the polymer solvent interactions. There is
an increase in the polymer hydrophilicity as the MAA content increases which leads to a
relative change in solvent quality towards being a good solvent. The scaling exponent for η is
in full agreement with an exponent of 1.3 for unentangled un-associative polymers in good
solvents.
In Regime 2 in which cL<c<cU, the polymer chains become overlapped and the
hydrophobes are engaged in intra and inter-molecular association. Therefore, this region is
characterized by a very rapid increase in viscosity due to the transformation from intra- to
inter-molecular association and a strong dependence on concentration is be expected. In fact,
η, G’ and J(t) exhibit very large dependence on concentration for all samples. The scaling
exponents, however, changes as the MAA content changes. For samples with low MAA
content (18 mole%), exponent factors as high as 9.0 for η, 4.6 for G’ and –8.9 for J(t) are
obtained, as compared to 4.3 for η and – 4.3 for J(t) for sample with 54% MAA. Regaldo et
al. also obtained varied scaling exponents in this region for a solution of hydrophobically
modified polyacrylamide polymers15. Scaling exponents varied below and above 4.3 based
on the number of stickers (hydrophobes) per chain. Our result of a viscosity exponent (4.3) at

65
high MAA is in excellent agreement with the theoretical value of 4.2 based on the sticky
Rouse model for an associative polymer in a good solvent16. On the other hand, the higher
value (9.0) at low MAA content is in good agreement with the theoretical values (8.5) based
on the sticky reptation Model16 and with the reported exponent (7.9) for similar HASE
polymer17. The change in the polymer behavior from sticky Rouse to sticky reptation implies
that in this regime the polymer chains are unenetangled at high MAA content and become
entangled at low MAA. This can be supported by the fact that the transition starts at
concentrations more than 20 times c* for low MAA samples compared to less than 10 times
for samples with high MAA.
In Regime 3 for c>cU, the hydrophobes are engaged in mostly intermolecular
interactions. Thus, a weaker dependence on concentration is expected. We obtained scaling
exponents of 2.6, 1.8 and –2.4 for η, G’ and J(t), respectively. The viscosity scaling exponent
is full agreement with the reported value of 2.7 for similar HASE polymers17. However, it is
lower than the 3.75 predicted by the sticky reptation model16 and observed experimentally for
hydrophobically modified polyacrylamide 15.
4.3.4 Effect of macromonomer concentration
To examine the effect of macromonomer concentration on rheology, we used a set of
9 polymers each having macromonomers with C20 hydrophobe and a degree of ethoxylation
of 33 EO units. Every 3 polymers in this set have the same macromonomer concentration and
varied MAA and EA content, as shown in Figure 2. Figure 12 compares the viscosity versus
shear rate profiles for 3% polymer solutions using samples with different MAA content.
Regardless of the concentration of the macromonomers, there is an optimum MAA

66
concentration that leads to a maximum in steady shear viscosity, similar to what has we have
discussed for Figures 3 and 8. This optimum concentration lies between 43 to 60 mole%
MAA. However, the viscosity increase for these samples is much weaker than the samples of
the other polymer set (with C18 hydrophobes and 40 EO units) in Figure 2 that had been used
in the previous sections. This difference could be attributed to different molecular weight
and/or molecular weight distribution. Currently, there is no confirmed data about the Mw and
Mw distribution of the samples used in this study. It also worth mentioning that the two set of
samples, although both prepared by Dow Chemical Company, were prepared at 2 different
locations.
The effect of the concentration of the macromonomers on the steady shear data can
also be observed from Figure 12. At a low macromonomer concentration (0.3%), we observe
the viscosity to be low and almost Newtonian indicating the presence of weak hydrophobic
associations (Fig. 12a). It is clear that the highest viscosity in this set of samples is obtained
with 1.0 mole% macromonomers, Figure 12b. The steady shear viscosity of a 3% solution of
samples with 1.0% macromonomers and low or moderate content of MAA is about 2 orders
of magnitude higher than that of any of the other samples. This indicates that there is also an
optimum macromonomer concentration that yields the highest enhancement in viscosity.
Such a result can be explained in the light of the similarity between our polymer system and
surfactants. The optimum concentration of the macromonomer is analogous to the
concentration of surfactant between the lower and higher critical micelle concentration. The
higher steady shear viscosity of the samples with 1% macromonomer concentration
compared to those with 0.3% macromonomer can be attributed to the increase in the number

67
of intermolecular junctions as the number of hydrophobes per chain increases. On the other
hand, if there are too many hydrophobes per chain such that the distance between every 2
hydrophobes is less than polyethylene oxide spacer, larger numbers of the hydrophobes will
engage in intramolecular association rather than form active junction through intermolecular
association. This would lead to a decrease in viscosity as is observed in Figure 12c for the
sample with 1.9% macromonomer.
The steady shear viscosity and the viscoelastic properties of this polymer system are
largely dependent on the number of active intermolecular association. The transient network
theory17 predicts that the plateau modulus is proportional to number of active junctions and
the steady shear viscosity is the product of the plateau modulus and the microscopic
relaxation time corresponding to the reciprocal of bond breaking and reformation rate. Thus
increasing the number of active junctions will increase the steady shear viscosity through
both increasing the plateau modulus and slowing the relaxation process.
4.4 Summary
This study provides a comprehensive analysis of the effects of polymer composition
on the rheology of associative polymers. The effect of the polymer backbone composition is
elucidated by varying the relative proportion of methyl acrylic acid (MAA) and ethyl acrylic
(EA) while that of the macromonomer is examined by varying its concentration. An increase
in the proportion of MAA in the backbone reveals a higher viscosity and enhancement in
viscoelastic characteristics (G’, J) consistent with a concomitant increase in chain size. At
higher MAA concentration, a maxima in viscosity and viscoelastic properties are observed.
Such a behavior can be attributed to the combined effects of increased chain dimension, loss

68
of chain flexibility and reduced contribution from the aggregation of EA bulky groups that
occurs with increased MAA content. The scaling of viscosity, elastic modulus and creep
compliance with polymer concentration revealed the presence of three transitional regimes,
each with a power-law dependence. These regimes were attributed to changes in the
hydrophobic interactions with concentration.
The macromonomer concentration also has a strong influence on polymer behavior
with a maximum in viscosity observed at intermediate macromonomer concentrations. At
low macromonomer concentration, low viscosity resulting from weak associative behavior
was observed. On the other hand, high concentration favors the formation of intra over inter
molecular association leading to a reduction in solution viscosity from that observed at
intermediate macromonomer concentrations.

69
4.5 References
1. Shay, G. D., "Alkali-Swellable and Alkali-Soluble Thickener Technology. A Review," In Water Soluble Polymers, Edited by. J. E. Glass (ACS Advances in Chemistry Series No 223 American Chemical Society, Washington, DC, 457-494 (1989).
2. Jenkins, R. D., L. M. Delong, and D. R. Bassett, “Influence of Alkali-Soluble
Associative Emulsion Polymer Architecture on Rheology,” in Hydrophilic Polymers: Performance with Environmental Acceptance, edited by J. E. Glass (ACS Advances in Chemistry Series No 248 American Chemical Society, Washington, DC, 425-447 (1996).
3. Lau, A. K., C. Tiu, C. and K. C. Tam, "Rheology of Hydrophobically-Alkali-
Soluble-Emulsions (HASE)," In 6th World Congress of Chemical Engineering: Melbourne, Australia (2001).
4. Seng, W. P., K. C. Tam, R. D. Jenkins and D. R. Basset, "Calorimetric Studies of a
Model Hydrophobically Alkali-Soluble Emulsion Polymers with Varying Spacer Chain Length," Macromolecules, 33, 1727-1733 (2000).
5. Tan, H. T., K. C. Tam, and R. D. Jenkins, "Network Structures of a Model HASE
Polymer in Semidilute Salt Solutions," Journal of applied polymer science, 79, 1486-1496 (2001).
6. Tan, H., K. C. Tam, V. Tirtaatmadja, R. D. Jenkins, R. D. and D. R. Bassett,
"Extensional Properties of Model Hydrophobically Modified Alkali-Soluble Associative (HASE) Polymer Solutions," J. Non-Newtonian Fluid Mech., 92, 167-185 (2000).
7. English, R. J., S. R. Raghavan, R. D. Jenkins and S. A. Khan, "Associative Polymers
Bearing n-Alkyl Hydrophobes: Rheological Evidence for Microgel-Like Behavior?," J. Rheol., 43, 1175-1194 (1999).
8. English, R. J., H. S. Gulati, R. D. Jenkins and Khan, S. A., "Solution Rheology of a
Hydrophobically Modified Alkali-Soluble Associative Polymer," J. Rheol., 41, 427-444 (1997).
9. Olesen, K. R., D. R. Bassett, D. R. and C. L. Wilkerson, "Surfactant co-Thickening in
Model Associative Polymers," In Proc. - Int. Conf. Org. Coat.: Waterborne, High Solids, Powder Coat., 24th307-322 (1998).
10. Tirtaatmadja, V., K. C. Tam, and R. D. Jenkins, "Rheological Properties of Model
Alkali-Soluble Associative (HASE) Polymers: Effect of Varying Hydrophobe Chain Length," In Macromolecules30,3271-3282 (1997).

70
11. Tam, K. C., M. L. Farmer, R. D. Jenkins and D. R. Bassett, "Rheological Properties of Hydrophobically Modified Alkali-Soluble Polymers-Effects of Ethylene-Oxide Chain Length," J. Polym. Sci., Part B: Polym. Phys., 36, 2275-2290 (1998).
12. Tam, K. C., W. K. Ng, R. D. Jenkins and D. R. Bassett, "Viscoelastic Behavior of
Model HASE Associative Polymer Solutions," In Proc. Int. Congr. Rheol., 13th1,329-331 (2000).
13. Gupta, R. K., K. C. Tam and R. D. Jenkins, "Rheological Properties of Model Alkali-
Soluble Associative (HASE) Polymers: Effect of Varying Acid Monomer and Macromonomer Composition," In Proc. Int. Congr. Rheol., 13th1,340-342 (2000).
14. Knaebel, A., R., Skouri, J. P. Munch and S. J. Candau, "Structural and Rheological
Properties of Hydrophobically Modified Alkali-Soluble Emulsion Solutions," Journal of Applied Polymer Science: Part B: Polymer Physics, 40, 1985-1994 (2002).
15. Regalado, E. J., J. Selb and F. Candau, "Viscoelastic Behavior of Semidilute
Solutions of Multisticker Polymer Chains," Macromolecules, 32, 8580-8588 (1999). 16. Rubinstein, M., A. N. Semenov, "Dynamic of Entangled Solution of Associating
Polymers," Macromolecules, 34, 1058-1068 (2001). 17. English, R. J., J. H. Laurer , R. J. Spontak and S. A., "Hydrophobically Modified
Associative Polymer Solutions: Rheology and Microstructure in the Presence of Nonionic Surfactant," Ind. Eng. Chem. Res, ASAP article (2002).
18. Tanaka, F. and S. F. Edwards, "Viscoelastic Properties of Physically Crosslinked
Networks. 1. Transient Network Theory," Macromolecules, 25, 1516-1523 (1992).

71
CH2 C
CH3
COOH
H2C C
H
C OOCH2CH3
CH2 C
CH3
CH3C CH3NHCOO
CH2H2CO
x
y
Rp
z
Methacrylic Acid
Ethyl Acrylate
Macromonomer Figure 1. Schematic representation of a typical HASE polymer together with its molecular
constitution of the HASE polymers used in this study. R refers to the hydrophobic groups. x, y, z, p are structural parameters.
Hydrophobic groups PEO Spacers
Polyelectrolyte backbone

72
0.0
0.4
0.8
1.2
1.6
2.0
10 20 30 40 50 60 70 80
EO33
C20
EO40
C18
None
Mac
rom
onom
er, m
ole%
MAA, mole%
Macromonomer
Figure 2. Composition of the polymers used in this study. A total of 18 samples have been used, including 4 non-associative ASE samples that have no macromonomers.
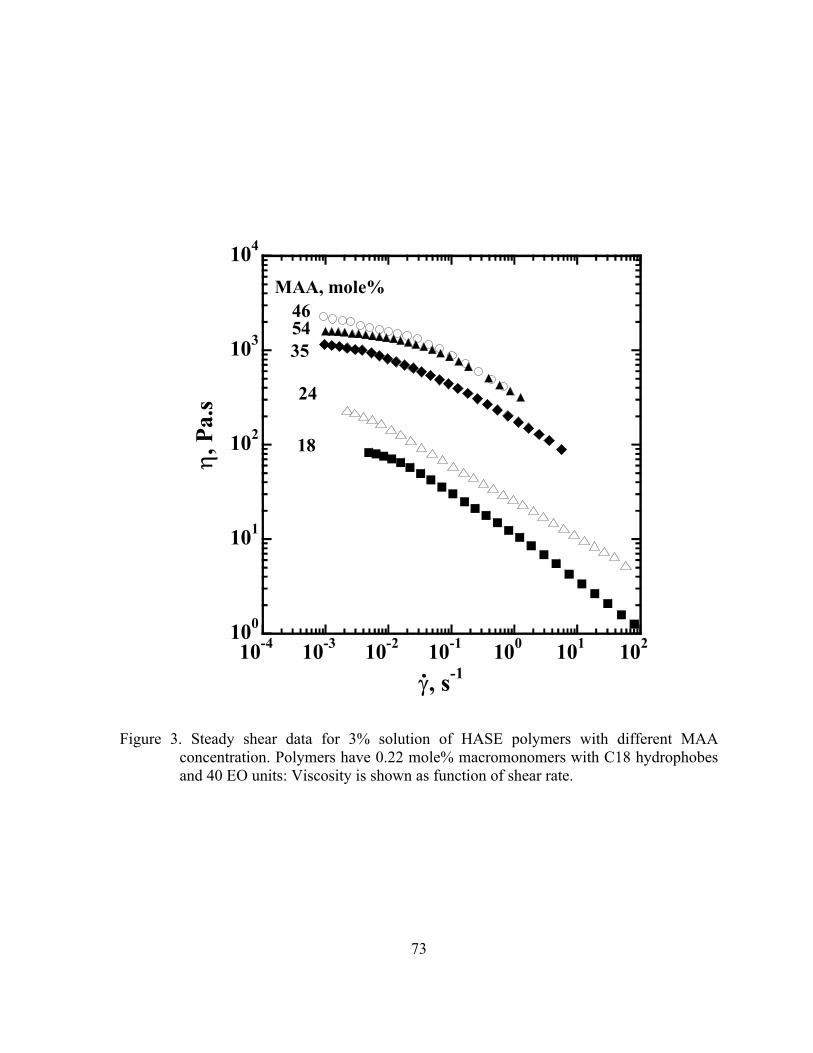
73
100
101
102
103
104
10-4 10-3 10-2 10-1 100 101 102
η, P
a.s
γ, s-1.
MAA, mole%465435
24
18
Figure 3. Steady shear data for 3% solution of HASE polymers with different MAA concentration. Polymers have 0.22 mole% macromonomers with C18 hydrophobes and 40 EO units: Viscosity is shown as function of shear rate.
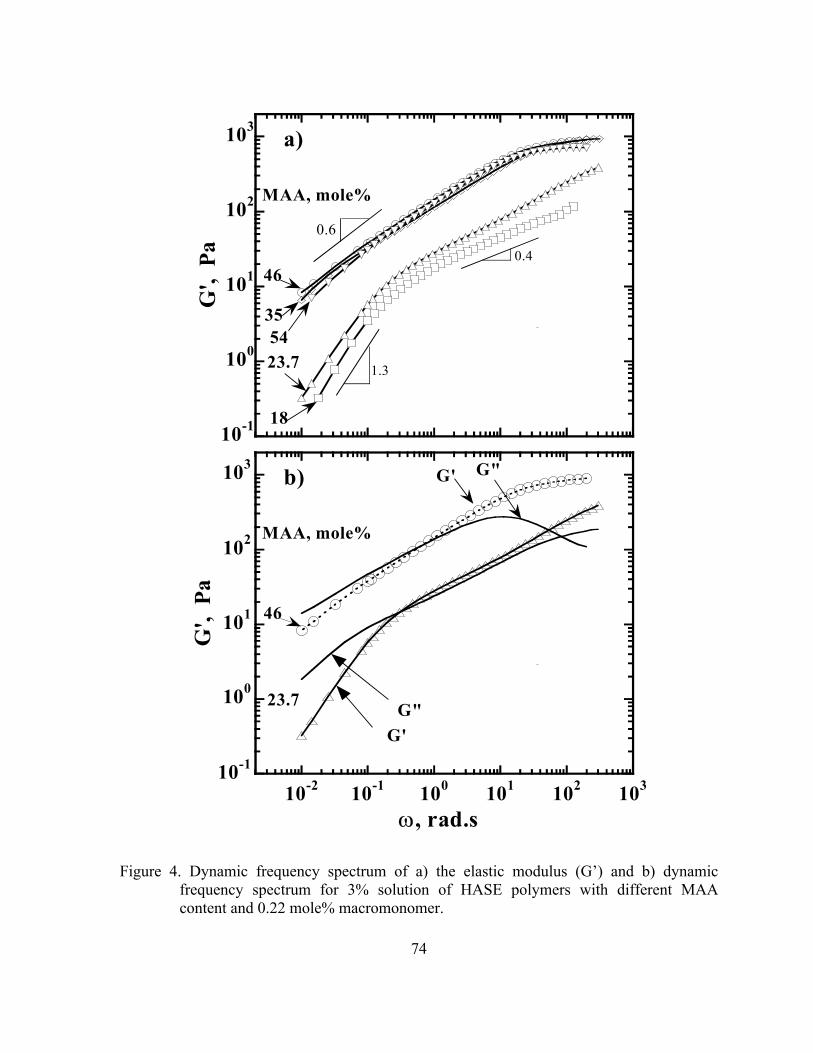
74
10-1
100
101
102
103
G',
Pa
18
23.7
35
46
54
MAA, mole%
a)
1.3
0.4
0.6
10-1
100
101
102
103
10-2 10-1 100 101 102 103
G',
Pa
23.7
46
MAA, mole%
b)
G'G"
G' G"
ω, rad.s
Figure 4. Dynamic frequency spectrum of a) the elastic modulus (G’) and b) dynamic frequency spectrum for 3% solution of HASE polymers with different MAA content and 0.22 mole% macromonomer.

75
10-1 100 101 102 10310-3
10-2
10-1
100
J(t)
, m
2 /N
time, sec
18
54
35
24
44
MAA, mole%
Figure 5. Creep compliance, J(t), as function of time for 3% solution of HASE polymers with different MAA and 0.22 mole% macromonomer: compliance as function of time is shown

76
0
10
20
30
40
50
0
20
40
60
80
100
10 20 30 40 50 60
[η],
dl/g T
g, °C
MAA, mole%
Figure 6. Intrinsic viscosity ([η]) and glass transition temperature (Tg) for polymers with different MAA content. All polymers have 0.22 mole% macromonomer with C18 hydrophobes and 40 EO units

77
10-1
100
100 101 102 103
η, p
oise
γ, s-1.
MAA, mole%
30
40
5070
10-1
100
20 30 40 50 60 70 80η
, poi
seMAA, mole%
Figure 7. Steady shear viscosity versus shear rate for the non-associative ASE polymers with different MAA acid. Inset shows the zero shear viscosity as function of MAA mole%.

78
10-2
10-1
100
101
102
103
104
10 20 30 40 50 60
η,
Pa.s
MAA, mole%
2%
3%
1%
5%a)
b)
c)
10-1
100
101
102
103
104
10 20 30 40 50 60
G',
Pa
MAA, mole%
2%
3%
1%
5%
10-2
10-1
100
101
102
103
104
10 20 30 40 50 60
J(t), m2/N
MAA, mole%
2%
3%
1%
5%
Figure 8. Effect of MAA content and polymer concentration on a) the steady shear viscosity at shear rate =0.01 s-1 b) the elastic modulus at angular frequency =100 rad/s, and c) the creep compliance at t=100 s. Macromonomer concentration = 0.22 mole%, C18 hydrophobes and 40 units EO.
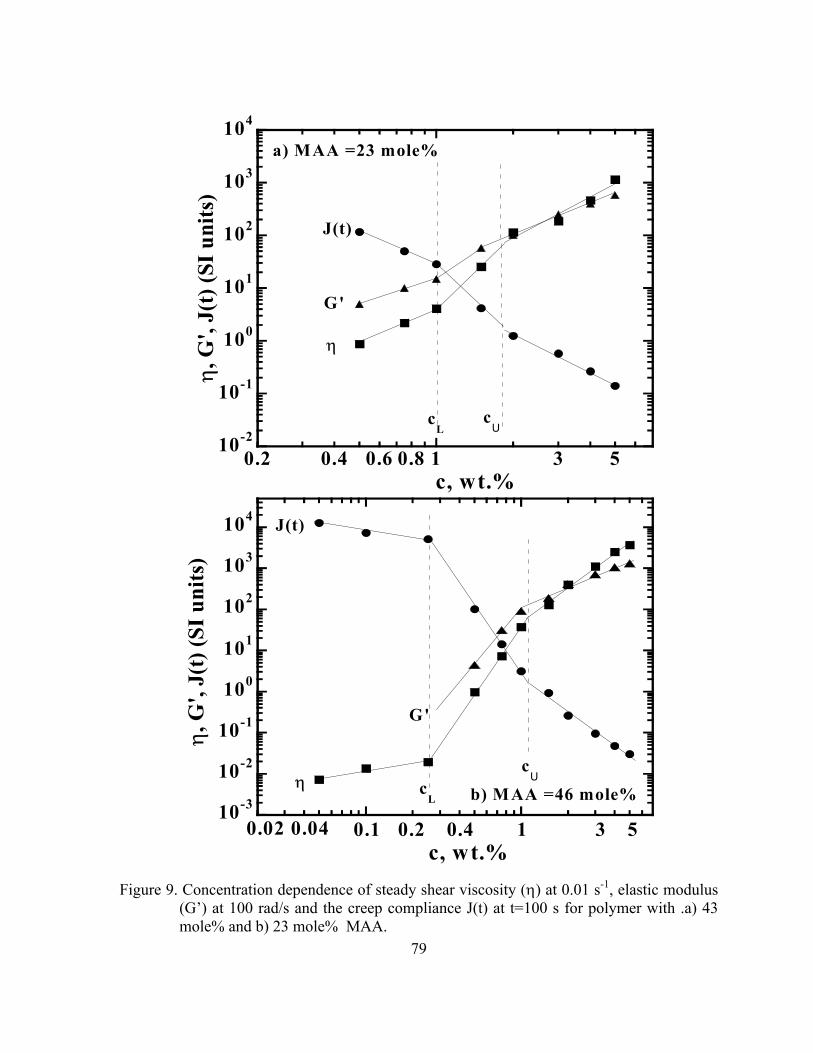
79
10-3
10-2
10-1
100
101
102
103
104
0.1 1
η, G
', J(
t) (S
I uni
ts)
J(t)
G'
η
a) MAA =23 mole%
cL
cU
b) MAA =46 mole%
0.02 0.04 0.2 0.4 3 5
cL
cU
c, wt.%
10-2
10-1
100
101
102
103
104
0.2 0.4 0.6 0.8 1 3 5
η, G
', J(
t) (S
I uni
ts)
c, wt.%
J(t)
G'
η
Figure 9. Concentration dependence of steady shear viscosity (η) at 0.01 s-1, elastic modulus
(G’) at 100 rad/s and the creep compliance J(t) at t=100 s for polymer with .a) 43 mole% and b) 23 mole% MAA.

80
0.0
0.5
1.0
1.5
2.0
2.5
3.0
0 10 20 30 40 50 60
c L, cU, 1
0c* (
%)
MAA, mole%
cU
cL
10c*
Figure 10. Effect of MAA content on the transition concentrations (cL and cU) and the
overlap concentration (c*).

81
Figure 11. Possible hydrophobic interaction modes at difference concentration regimes.
c << cL
Only intramolecular association
cL< c < cU
Both intra & intermolecular Association.
c > cU
Only intermoelcular association

82
10-3
10-2
10-1
100
101
102
100 101 102 103
η, P
a.s
MAA, mole%
57
0.3% MacromonomerConc 3%
γ, s-1.
3144
b)a) c)
10-2 10-1 100 101 102 103
50MAA, mole%
1.0% MacromonomerConc 3%
γ, s-1.
64
35
10-1 100 101 102 103
73
57
40
1.9% MacromonomerConc 3%
γ, s-1.
MAA, mole%
Figure 12: Effect of MAA content on the steady shear viscosity of 3% solution of polymers with a) 0.3 mole%, b) 1.0 mole% and c) 1.9 mole% macromonomer.

CHAPTER 5
SOLUTION RHEOLOGY OF HYDROPHOBICALLY MODIFIED
ASSOCIATIVE POLYMERS: SOLVENT QUALITY AND HYDROPHOBIC
INTERACTIONS
Chapter 5 is essentially a manuscript by Ahmed A. Abdala, Keith Olesen and Saad Khan
submitted to the Journal of Rheology.

84
Solution Rheology of Hydrophobically modified Associative
Polymers: Solvent Quality and Hydrophobic Interactions
Ahmed A. Abdala1, Keith Olesen2 and Saad A. Khan1*
1Department of Chemical Engineering, North Carolina State University, Raleigh NC 27695-7905 2The Dow Chemical Company, UCAR Emulsion Systems, 410 Gregson Drive, Cary, NC 27511
Abstract The rheological behavior of a model hydrophobically modified alkali soluble
emulsion (HASE) polymer, comprising a random copolymer backbone of methacrylic acid
(MAA) and ethylacrylate (EA) with grafted pendant hydrophobic macromonomers is
examined in co-solvents of water and propylene glycol (PG) of different proportions. We
find the solvent solubility parameter to have a direct impact on both the steady and dynamic
behavior of the polymer solutions. In particular, scaling of the relative viscosity (ηrel) and the
elastic modulus at a fixed frequency (G’) with the solvent solubility parameter (δs) reveal the
presence of two distinct regimes with different dependences on δs. In “water-rich” solvents,
both ηrel and G′ show a strong dependence on δs in contrast to “PG-rich” solvents, in which
there is slight or no dependence on δs. The concentration dependences of both ηrel and G′ are
also found to be different in “water-rich” solvents from that in “PG-rich” solvents. In “water-
rich” solvents, ηrel and G′ reveal power-law dependences with exponents of 2.5 and 3.2
respectively compared to exponents of 1.4 and 2.3 in “PG-rich” solvents. The different
behavior in “PG-rich” solvents is ascribed to the presence of minimal hydrophobic
associations, with the polymer behavior analogous to that of unmodified polymers without
* corresponding author; phone: 919-515-4519; fax: 919-515-3465; email: [email protected]

85
hydrophobes. This hypothesis is supported by the similarity in ηrel scaling with concentration
observed for both the HASE polymer in “PG-rich” solvents and a similar polymer without
the hydrophobes in both solvents. The lack of hydrophobic interactions in the “PG-rich”
solvents may be attributed to the observed decrease in polymer coil dimension together with
a lower tendency of the hydrophobes to form micelles in less polar media.

86
5.1 Introduction
Associative polymers are macromolecules with attractive groups either attached to the
ends or randomly distributed along the backbone [Rubinstein and Dobrynin (1997)].
Hydrophobically modified alkali soluble emulsion (HASE) polymers are one class of the
water-soluble associative polymers. These polymers have a comb-like structure with pendant
hydrophobic groups randomly grafted to the polyelectrolyte backbone. HASE polymers have
several advantages over other associative polymers in terms of cost and wide formulation
latitude [Tirtaatmadja et al. (1999)]. They are currently being used in a range of applications,
including paint formulations, paper coatings, and recently as glycol based aircraft anti-icing
fluids [Carder et al. (1998; 1999); Jenkins et al. (1993; 1997)] and have potential for use in
enhanced oil recovery and personal care products.
Similar to surfactants in aqueous media, these polymers are capable of non-specific
hydrophobic interactions [Ng et al. (1999)]. These hydrophobic interactions include both
inter- and intra-molecular associations, giving rise to network structures, and a range of
rheological behavior [English et al. (1997; 1999); Tirtaamadja et al. (1997)] and
morphologies [English et al. (2002)]. With such a complex architecture, the association
behavior of these polymers would be expected to be quite diverse and dependent on many
factors such as, the structure of the backbone that dictates their water solubility and
flexibility, the structure and concentration of the macromonomer which include the type of
hydrophobic groups and the length of polyethylene oxide spacers [Jenkins et al. (1996)]. The
effects of these polymer-architectural parameters, including the backbone composition, the
PEO spacer length and the type and concentration of the hydrophobic groups, on the solution

87
behavior has thus been the subject of many recent studies [Lau et al. (2001); Dai et al.
(2000); Gupta et al. (2000a, b); Seng et al. (2000); Tan et al. (2000; English et al. (1999);
Olesen et al. (1998); Tam et al. (1998); English et al. (1997); Tirtaatmadja et al. (1997);
Jenkins et al. (1996)].
The continuous phase in which the HASE polymer is solvated also plays a major role
in the association behavior of these polymers. In this regard, the effects of the medium pH
and ionic strength on the association mechanism of HASE polymers have been the focus of a
number of studies [Dai et al. (2001); Tan et al. (2001); Kaczmarski et al. (1999);
Tirtaatmadja et al. (1999); Horiuchi et al. (1998); Shay et al. (1998)]. Nevertheless, almost
all these studies were carried out in aqueous media and the effect of the solvent quality or
non-aqueous co-solvents on the solution behavior has been rarely studied [Olesen et al.
(1998); Schaller (1985); Thibeault et al. (1986)]. This becomes particularly important in
deciphering the modes of hydrophobic associations and developing new applications
involving non-aqueous media, such as anti-icing fluids.
In this study, we investigate the steady and dynamic rheological behavior of a model
HASE polymer in a co-solvent of water and propylene glycol. We quantify solvent quality in
terms of the solubility parameter and examine the dependence of the relative viscosity and
the plateau modulus on both the solvent solubility parameter and the polymer concentration.
The role of the hydrophobic interactions are further ferreted by comparing the results of the
HASE polymer with (i) an analogous polymer but without the hydrophobe and with (ii) the
HASE polymer in which the hydrophobes are encapsulated using an inclusion compound
forming host, β-cylcodextrin [Szejti (1998)]. The results of this study should help better

88
understand the mechanism of rheology modification by this class of associative polymers and
their behavior in the presence of co-solvents.
5.2 Experimental Materials and Method
The model associative polymer used in this study is a hydrophobically modified
alkali-soluble (HASE) polymer synthesized by UCAR Emulsion Systems (Dow Chemical,
NC) via emulsion polymerization of methacrylic acid (MAA), ethylacrylate (EA) and a
hydrophobic macromonomer (Figure 1). This macromonomer is end capped with a C22H45
alkyl hydrophobe that is separated from the backbone by 40 units of polyethylene oxide
(PEO). Details of the preparation method can be found in a previous publication [Shay et al.
(1985)]. In addition to the hydrophobically modified polymer, an unmodified polymer that
has the same structure as the modified polymer with the C22H45 hydrophobes replaced by
equivalent amount of methyl groups was also used. Both the modified and the unmodified
polymers were prepared in an identical manner and are believed to have the same molecular
weight. The polymer latexes were dialyzed against de-ionized water using cellulosic tubular
membrane for at least three weeks with daily change of water. After dialysis, the polymer
was freeze-dried and 5% solutions were prepared and neutralized to pH of 9.0 ±0.1 using
28% NH4OH with the ionic strength adjusted to 10-4 M KCl. Other concentrations were
subsequently prepared by the dilution of the 5% solution with the appropriate solvent
composition, while maintaining the pH and ionic strength constant.
In this study, eight different mixtures of water and propylene glycol (PG) were used
as co-solvents. The composition of these mixtures expressed as weight% of PG in the solvent

89
mixture is shown in Table 1. Throughout this manuscript, these solvent mixtures will be
called PGXX, with XX corresponding to the wt.% of PG in the mixture. The solubility
parameter of these mixtures was calculated using the Hansen three-dimensional solubility
parameter approach [Hansen (1999); Hansen and Beerbower (1971); Hansen (1967)]. In this
method, the solubility parameter (δ) is given by the sum of the dispersion (δd), polar (δp) and
hydrogen bonding (δh) contribution as follows:
2 2 2 2d p hδ =δ + δ + δ (1)
Here δd, δp and δh for each mixture were calculated as volume average, x x i iδ = (δ ) φ∑ ; with x
standing for d, p or h, i referring to PG or water and φi to the volume fraction of component i
in the solvent mixture. The solubility parameter as well as the dispersion, polar and hydrogen
bonding contribution for each solvent mixture are also shown in Table 1.
The intrinsic viscosities of the polymer solutions were measured with Ubbelhode
dilution viscometers situated in a thermostated water bath at 25°C. The efflux times of the
polymer solutions were converted to reduced and inherent viscosities from the following
definitions:
;specific sreduced
s
t tc ct
ηη −
= = (2)
ln( ) ln( / )relative sinherent
t tc c
ηη = = (3)
where ts is the solvent efflux time. Using the familiar Huggins and Kraemer equations,
[ ] [ ]² creduced HKη η η= + (4)
[ ] [ ]² cinherent KKη η η= + (5)
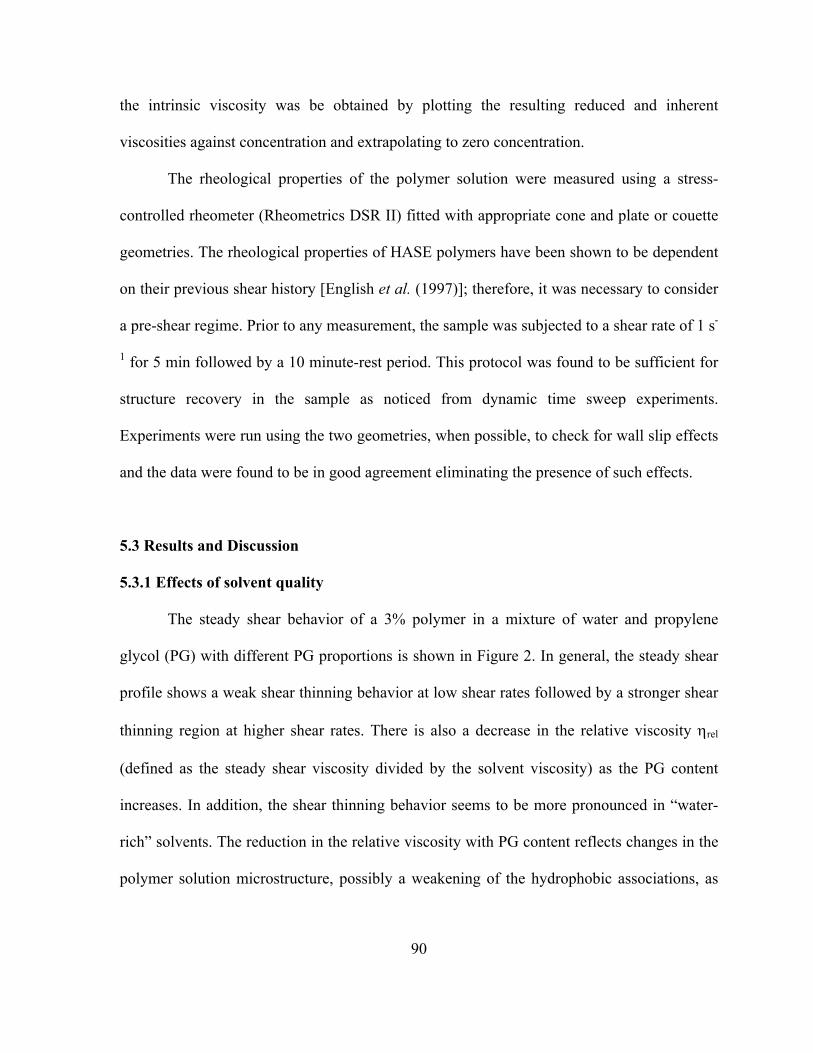
90
the intrinsic viscosity was be obtained by plotting the resulting reduced and inherent
viscosities against concentration and extrapolating to zero concentration.
The rheological properties of the polymer solution were measured using a stress-
controlled rheometer (Rheometrics DSR II) fitted with appropriate cone and plate or couette
geometries. The rheological properties of HASE polymers have been shown to be dependent
on their previous shear history [English et al. (1997)]; therefore, it was necessary to consider
a pre-shear regime. Prior to any measurement, the sample was subjected to a shear rate of 1 s-
1 for 5 min followed by a 10 minute-rest period. This protocol was found to be sufficient for
structure recovery in the sample as noticed from dynamic time sweep experiments.
Experiments were run using the two geometries, when possible, to check for wall slip effects
and the data were found to be in good agreement eliminating the presence of such effects.
5.3 Results and Discussion
5.3.1 Effects of solvent quality
The steady shear behavior of a 3% polymer in a mixture of water and propylene
glycol (PG) with different PG proportions is shown in Figure 2. In general, the steady shear
profile shows a weak shear thinning behavior at low shear rates followed by a stronger shear
thinning region at higher shear rates. There is also a decrease in the relative viscosity ηrel
(defined as the steady shear viscosity divided by the solvent viscosity) as the PG content
increases. In addition, the shear thinning behavior seems to be more pronounced in “water-
rich” solvents. The reduction in the relative viscosity with PG content reflects changes in the
polymer solution microstructure, possibly a weakening of the hydrophobic associations, as

91
the solvent quality changes.
Figure 3 compares the complex and steady shear viscosities of a 3% polymer solution
with different proportions of the co-solvents. There is a decrease in the magnitude of the
complex viscosity as the solvent PG content increases, consistent with the steady shear
results. In addition for the “PG-rich” solvents, both steady and complex viscosity overlay
well obeying the Cox-Merz rule [Cox et. al. (1958)]. However, for “water rich” solvents
there is deviation from the Cox-Merz rule with the complex viscosity lower than the steady
viscosity especially at intermediate and high shear rates. This deviation from the Cox-Merz
rule in “water-rich” solvents has previously been observed with HASE polymer in aqueous
medium and can be attributed to the formation of shear-induced structures [English et al.
(1997); English et al. (1999)]. Please note that the viscosity of the PG sample is higher than
that of PG70 in Figure 3. The reverse trend is observed because PG has a higher viscosity
than PG70, and the solution viscosity is dominated by the solvent for these compositions. If
the data ares plotted in terms of relative viscosity, the expected trend is observed (e.g., Figure
2).
Figure 4a shows the storage modulus (G’) of a 3% polymer solution as a function of
co-solvent composition. We find the magnitude of G’ to decrease as the PG content of the
solvent increases while the slope of the terminal region shows an opposite trend, increasing
as PG content increases. These results also suggest changes in the sample microstructure with
changing solvent composition. As PG content increases, the behavior changes from a
relatively elastic-like behavior to a solution-like behavior, with G’~ω0.5 in water and G’~ ω1.5
in PG. This transition could be related to the changes in the solvent-hydrophobe interactions

92
and thus the network structures. Similar findings are observed when we examine the
composite dynamic elastic and loss moduli of representative samples in Figure 4b. The G”
decreases and the slope of the terminal region increases as PG content increases. A shift in
the crossover point is also observed (or suggested) as the solvent quality changes. For the
case of water, we observe a crossover frequency of approximately 10-2 s-1 followed by a
plateau region. The crossover frequency increases by more than two orders of magnitude
reflecting a decrease in the longest relaxation time, τ =1/ωcross over, as the PG content of the
solvent increases. In fact, in the case of the sample containing 85% PG, the crossover
frequency is not even accessible within the experimental frequency limit.
Both steady and dynamic data suggest a change in the network structure as the
solvent changes from being “water-rich” to “PG-rich”. To further probe the effects of solvent
quality on rheology, we plot in Figure 5 the relative viscosity (ηrel) and the plateau modulus
as a function of the solvent solubility parameter (δs) for different polymer concentrations.
Figure 5a reveals that the relative viscosity increases with increasing polymer concentration
or solubility parameter. More importantly, we observe the presence of two distinct regimes
with different dependence of ηrel on δs. Referring to these regimes as regime 1 corresponding
to “water rich” solvents with higher solubility parameter and regime 2 corresponding to “PG-
rich” solvents with lower solubility parameter, we observe the relative viscosity to show a
much stronger dependence on δs in regime 1. In addition, the dependence of the relative
viscosity on the solubility parameter seems to be independent of concentration for either
regime. This behavior is observed for all concentrations above 0.5%, which shows only
regime 2-type dependence. The point where the two regions meet shifts towards a lower δs

93
3ith concentration. A plot of the elastic modulus at a fixed frequency (1 rad/s) versus the
solvent solubility parameter (Figure 5b) also shows the presence of two regimes, indicating
that this behavior is not material-function specific. The plateau modulus for samples in “PG-
rich” solvents is almost independent of the solvent composition, while in "water-rich"
solvents the plateau modulus increases sharply with the solvent solubility parameter. These
data are consistent with the results of the scaling of ηrel with the solvent solubility parameter
δs.
It is interesting to note that the inflection point occurs at a lower δs for the elastic
modulus compared to the relative viscosity. The difference can be attributed to the fact that
we do not reach the plateau regime for the dynamic experiments. Had we been able to access
that, the “PG-rich” samples would have had a higher G’; this would have shifted the
transition point to a higher δs, consistent with the steady data. The two-regime behavior is
also observed when either ηrel or the elastic modulus at fixed frequency is plotted versus the
individual components of the solubility parameter (data not shown). The same trend is
observed when the polar or hydrogen bonding components are used. On the other hand, an
opposite trend is observed when the dispersion component is used instead, as the PG has a
higher dispersion component than water.
The two-regime behavior could be explained based on changes in solution
microstructure as the solvent quality changes. In regime 1 at high solubility parameters, the
dominant mode of interaction is hydrophobic associations. With increases in PG content of
the solution in this regime, there is a reduction in the hydrophobic interactions due to the
reduced tendencies of the hydrophobes to associate and this leads to lower ηrel and G’p In
94
regime 2, there may be a lack of hydrophobic association and the polymers are behaving as
regular entangled polymer chains. At the inflection point, we are assuming that the
hydrophobic interactions are suppressed. Such an explanation is supported by the work of
Jenkins et al [1995] who reported that a 40/60 mixture of Butyl Carbitol and water
suppressed the formation of an association network for 2.5% linear water-soluble
poly(oxyethylene) end capped with the hexadecyl alkyl group.
5.3.2 Concentration effects
The different modes of interaction in the “water-rich” and “PG-rich” solvents should
manifest themselves in different concentration dependences of rheological material functions
in these regimes. We probe this effect by plotting the concentration dependence of the
relative viscosity for “water-rich” solvents at different co-solvent compositions in Figures 6.
For the concentration range studied, we observe a power-law behavior for the relative
viscosity (ηrel ~cn) with a scaling exponent n of about 2.5, independent of the solvent
composition. This value of n is consistent with the reported value of 2.68 for HASE polymer
with C16 hydrophobes [Tan et al. (2000)]. However, this value is lower than the theoretically
predicted values of 3.75 in the entangled semi-dilute regime using the Sticky-Reptation
model of associative polymers [Rubinstein and Semenov (2001)]. The value of the scaling
exponent is dependent on the transition from intra- to inter-molecular association as the
polymer concentration increases. With very few hydrophobes per polymer chain (the
macromonomer concentration is only 0.22 mole%), we expect a low value for the scaling
exponent as there is a lower chance for the hydrophobes to form intra-molecular association

95
and thus a very low fraction of the hydrophobes will undergo transition from intra- to inter-
molecular association.
Figure 7 shows scaling of the relative viscosity with concentration for “PG-rich”
solvents. A scaling factor of 1.4 independent of the solvent is obtained. The lower value of
the scaling factor in “PG-rich” solvents should be the result of the absence of hydrophobic
association. Similar scaling of the elastic modulus at fixed frequency (1 rad/s) with
concentration (data not shown) also revealed two different dependencies. In "water-rich”
solvent, a scaling factor of 3.2 was observed while in “PG-rich” solvents a lower scaling
factor of 2.3 was observed. The scaling factor within each region was independent of the
solvent.
To support our hypothesis that the behavior in regime 2 is due to the lack of
hydrophobic association, we investigated the dependence of the relative viscosity on
concentration for solutions where no hydrophobic association is possible. This was done
using two approaches. First, an unmodified polymer with the same structure and molecular
weight as the HASE polymer, but with no hydrophobic groups at the end of the
macromonomer, was used in our study. With this unmodified polymer, no hydrophobic
association is possible. The second approach entailed using the same HASE polymer in our
study but after deactivating the hydrophobic groups. We deactivated the hydrophobic groups
using an inclusion compound forming host(β-cyclodextrin). Cyclodextrins have a unique ring
shaped structure with a hydrophobic annular core and a hydrophilic exterior. Because of the
hydrophobicity of the annular core of cyclodextrin, it can encapsulate the hydrophobic part of
a HASE polymer resulting in deactivation of the hydrophobes. In this regard, cyclodextrins

96
have been used for the removal of hydrophobic association of HASE solutions [Islam et al.
(2000), Gupta et al. (2002a, 2002c)]. The effect of adding β-cyclodextrin on the viscosity of
a 1% polymer solution is shown in Figure 8. With the addition of β-cyclodextrin more
hydrophobes are deactivated resulting in reduction in the solution viscosity. At about 15
moles β-cyclodextrin/hydrophobe, the addition of more β-cyclodextrin seems to have no
effect on the solution viscosity.
Figure 9 shows the dependence of the relative viscosity on the concentration for
unmodified polymer (without hydrophobe) in water and PG as well as for the HASE polymer
after encapsulation of the hydrophobes with 20 moles β-cyclodextrin/hydrophobe. A constant
exponent factor of 1.4 is observed for the unmodified polymer (without hydrophobes) in both
water and PG consistent with results of the HASE polymer in “PG-rich” solvents (Figure 7).
These results prove the lack of association in “PG-rich” solvents. For the HASE polymer
with the hydrophobic groups deactivated with β-cyclodextrin, an exponent of 1.2 is obtained,
which again supports the lack of hydrophobic association in regime 2.
5.3.3 Solvent quality and polymer interaction modes
The lower viscosity and moduli of the polymer solution as the PG content of the co-
solvent increases as well as the display of two-regime behavior can be attributed to reduced
hydrophobic associations. Several factors contribute to this phenomenon. First, the
hydrophobic groups have a lower tendency to associate as the solvent become less polar. The
hydrophobes are not forced out of the solvent media as strongly as in the case of the aqueous
solution. The lower affinity of the hydrophobes to form micelles would result in weaker or

97
negligible network structure and therefore lower viscosity and viscoelastic properties.
Secondly, the effective length of the PEO spacer becomes shorter due to the dehydration of
the PEO by the glycol, as reported for nonionic surfactants [Penfold et al. (1997); Aramaki et
al. (1999)]. Shorter PEO spacer length will also reduce intermolecular associations [Dai et al.
(2000)]; the possibility of intra-molecular association is always low because our polymer has
very few hydrophobes (~3) per chain. Finally, the polymer coil dimensions decrease as the
solvent becomes “PG-rich”, as shown by a decrease in [η] values (Table 2). The less
expanded chains will hinder the formation of any intermolecular associations. At some
solvent composition, these factors together will completely prevent the hydrophobic
association. In summary, we contribute the 2-regime behavior to the absence of the
hydrophobic association in regime-2.
The change in [η] may imply change in the concentration regime from entangled to
un-entangled semi-dilute regime. However, contrary to regular polymer solutions this is not
an issue here. For associative polymers, at concentrations below c* only intramolecular
association is possible [Candau et al. (1998); Regalado et al. (1999)]. At concentrations
higher than c* both inter and intramolecular association contribute to the solution rheology.
At higher concentrations, entanglement occurs in addition to hydrophobic association.
However, the physical entanglement of the polymer chains does not affect the rheological
properties of the semi-dilute solutions [Ng, et al. (2001)]. Thus, a distinct change in the
dependence of viscosity on concentration only occurs at c* when intermolecular associations
appear, and not with the addition of entanglements. Since the overlap concentration, c*
calculated as 1/[η], for this polymer solution is about 0.02% in water and 0.45% in PG, all

98
samples examined in this study are above c*. This information, together with the similarity in
behavior observed among the unmodified polymer (without hydrophobes), the HASE
polymers encapsulated with β-cyclodextrin and the HASE polymer in “PG-rich” solvents, all
lend credence to the fact that the two-regime behavior is due to changes in hydrophobic
associations. This is also supported by the values of kH-kK shown in Table 2. In “PG-rich”
solvents, this value approaches the theoretical value of 0.5 similar to the unmodified
polymer. In contrast, the kH-kK values deviate substantially from the theoretical value in
“water-rich” solvents, suggestive of the presence of strong hydrophobic interactions.
5.4 Conclusions
The effect of solvent quality on the rheological behavior of a hydrophobically
modified associative polymer has been examined using co-solvents of water and propylene
glycol (PG) with different proportions. Two distinct modes of behavior are observed
depending on whether the co-solvent is “water rich” or “PG rich”. In both regimes, the
relative viscosity and plateau modulus reveal power-law dependences with the solvent
solubility parameter; however, the dependence is much stronger in the “water rich” regime.
In addition, the concentration dependence of the viscosity is very different for the two
regimes with the “water rich” regime revealing stronger power-law dependence consistent
with that observed in associative systems. In the “PG-rich” solvents, on the other hand, the
polymer shows behavior akin to that of the same polymer without the hydrophobe or to
polymers with the hydrophobes deactivated by inclusion compound formation with β-
cyclodextrin. This leads us to attribute the dual-mode behavior to a lessening in the ability of

99
the hydrophobic groups for micellization as the solvent quality changes. This lack or
reduction of hydrophobic interactions in the “PG-rich” solvents is possibly induced by less
expanded polymer chains and conformational changes in PEO spacers, together with a lower
tendency of the hydrophobes to form micelles in less polar medium.
5.5 Acknowledgements
The authors gratefully acknowledge the comments and suggestions of Srinivasa R.
Raghavan (U. Maryland) and Robert J. English (Northeast Wales Institute) during the
preparation of the manuscript.

100
5.6 References
Aramaki, K., U. Olson, Y. Yamaguci and H. Kunieda, "Effect of Water Soluble Alcohols on Surfactant Aggregation in The C12EO8 System," Langmuir 15, 6226-6232 (1999).
Candau, F., J. R. Regalado and J. Selb, “Scaling Behavior of the Zero Shear Viscosity of
Hydrophobically Modified Poly(acrylamide)s,” Macromolecues 31, 5550-5552 (1998). Carder, C. H., D. C. Garska, R. D. Jenkins and M. J. Mcguiness, “Aircraft Deicing/Anti-Icing
Fluids Thickened By Associative Polymers," US 5708068 (1998). Carder, C. H., D. C. Garska, R. D. Jenkins and M. J. Mcguiness, “Process of Making Aircraft
Deicing/anti-icing Fluids Thickened by Associative Polymers” US 5,863,973 (1999). Cox, W. P. and E. H. Merz, “Correlation of Dynamic and Steady State flow Viscosity,”
Journal of polymer Science 28, 619-622 (1958). Dai, S. T., K. C. Tam, R. D. Jenkins and D. R. Bassett, "Light Scattering of Dilute
Hydrophobically Modified Alkali-Soluble Emulsion Solutions: Effect of Hydrophobicity and Spacer Length of Macromonomer," Macromolecules 33, 7021-7028 (2000).
English, R. J., H. S. Gulati, R. D. Jenkins and S. A. Khan, "Solution rheology of a
hydrophobically modified alkali-soluble associative polymer," J. Rheol., 41, 427-444 (1997).
English, R. J., S. R. Raghavan, R. D. Jenkins and S. A. Khan, "Associative Polymers
Bearing N-Alkyl Hydrophobes: Rheological Evidence for Microgel-Like Behavior," J. Rheol. of Rheology 43, 1175-1194 (1999).
English, R. J., J.H. Laurer, R.J. Spontak and S. A. Khan, "Hydrophobically Modified
Associative Polymer Solutions: Rheology and Microstructure in the Presence of Nonionic Surfactants" Industrial and Engineering Chemistry Research , Nov. web release (2002).
Gupta, R. K., K. C. Tam, S. H. Ong, and R. D. Jenkins “Interactions of Methylated β-
cyclodextrin with Hydrophobically Modified Alkali-Soluble Associative Polymers (HASE): Effect of Varying Carbon Chain Length,” Proc. 13th Int. Congr. Rheol, Cambridge, UK, Vol 1, 335-337 (2000a).
Gupta, R. K., K. C. Tam, and R. D. Jenkins “Rheological Properties of Model Alkali Soluble
Associative (HASE) Polymers: Effect of Varying Acid Monomer and Macromonomer Composition,” Proc. 13th Int. Congr. Rheol, Cambridge, UK, Vol 1, 340-342 (2000b).
Gupta, R. K., K. C. Tam, S. H. Ong, and R. D. Jenkins, “Interactions of Methylated β-
cyclodextrin and Hydrophobically Modified Alkali-Soluble Associative Polymers

101
(HASE): a Rheological Study,” Korea-Australia Rheology Journal, 12, 93-100, (2000c). Hansen, C. M., “ The Three Dimensional Solubility Parameter- Key to Paint Component
Affinities: I. Solvents Plasticizers, Polymers, and Resins,” Journal of Paint Technology
39, 104-117 (1967).
Hansen, C. M. and A. Beerbower, “ Solubility Parameters,” Encyclopedia of Chemical
Technology, Wiley: New York, 889-909 (1971). Hansen, C. M., “ Hansen Solubility Parameters: a user’s Handbook,” CRC Press: Boca Raton
(1999). Horiuchi, K., Y. Rharbi, A.Yekta, M. A. Winnik, R. D. Jenkins and D. R. Bassett,
“Dissolution Behavior in Water of a Model Hydrophobically Alkali- Swellable Emulsion (HASE) Polymer With C20H41 Groups,” Canadian Journal of Chemistry 76, 1779-1787 (1998).
Islam, M. F., R. D. Jenkins, D. R. Bassett, W. Lau and H. D. Ou-Yang, “Single Chain
Characterization of Hydrophobically Modified Polyelectrolytes Using Cyclo-dextrin/ Hydrophobe Complexes,” Macromolecules 33(7), 2480-2485 (2000).
Jenkins, R. D., D. R. Bassett, R. H. Lightfoot and M. Y. Boluk, “Aircraft Anti-icing Fluids
Thickened by Associative Polymers," WO Patent 9,324,543 (1993). Jenkins, R. D., D. R. Bassett, C. A. Silebi and M. S. El-Aasser, “Synthesis and
Characterization of Model Associative Polymers,” Journal of Applied Polymer Science 58, 209-230 (1995).
Jenkins, R. D., L. M. Delong and D. R. Bassett, “Influence of alkali-soluble associative
emulsion polymer architecture on Rheology,” in Hydrophilic Polymers: Performance with Environmental Acceptance, edited by J. E. Glass (ACS Advances in Chemistry Series No 248 American Chemical Society, Washington, DC, 425-447 (1996)
Jenkins, R. D., D. R. Bassett, R. H. Lightfoot and M. Y. Boluk, “Glycol-Based Aircraft Anti-
icing Fluids Thickened by Associative Polymers Containing Hydrophobe-Bearing Macromonomers,” US Patent 5,681,882 (1997).
Kaczmarski, J. P., M. R. Tarng, Z. Y. Ma and J. E. Glass, “Surfactant and Salinity Influences
on Associative Thickener Aqueous Solution Rheology,” Colloids and Surfaces A-Physicochemical and Engineering Aspects 147, 39-53 (1999).
Lau, A. K. M., C. Tiu and K. C. Tam, ”Rheology of hydrophobically-alkali-soluble-
emulsions (HASE),” 6th World Congress of Chemical Engineering, Melbourne, Australia (2001).

102
Ng, W. K., K. C. Tam and R. D. Jenkins, “Evaluation of Intrinsic Viscosity Measurements of
Hydrophobically Modified Polyelectrolyte Solutions,” European Polymer Journal 35, 1245-1252 (1999).
Ng, W. K., K. C. Tam and R. D. Jenkins, “Rheological Properties of Methacrylic Acid/Ethyl
Acrylate Co-Polymer: Comparison Between Unmodified and Hydrophobically Modified System,” Polymer 42, 249-259 (2001).
Olesen, K. R., D. R. Bassett and C. L. Wilkerson, “Surfactant co-thickening in model
associative polymers,” Progress in Organic Coatings 35, 165-170 (1999) Penfold, J. S., E, I Tucker and P. Cummins, “The Structure of Non-Ionic Micelles in Less
Polar Solvents,” Journal of Colloid and Interface Science 185, 424-431 (1997). Rubinstein, M. and A. N. Semenov, “Dynamic of Entangled Solution of Associating
Polymers,” Macromolecules 34, 1058-1068 (2001). Regalado, E. J., J. Selb and F. Canadu, “Viscoelastic Behavior of Semidilute Solutions of
Multisticker Polymer Chains,” Macromolecules 32, 8580-8588 (1999). Rubinstein, M. and A. V. Dobrynin, “Solutions of Associative Polymers,” Trends Polym.
Sci. 5, 181-186 (1997) Schaller, E. J. "Rheology Modifiers for Water-Borne Paints." Surf. Coat. Aust. 22(10): 6-10,
12-13, 1985. Seng, W. P., K. C. Tam, R. D. Jenkins and D. R. Bassett, ”Calorimetric Studies of Model
Hydrophobically Modified Alkali-Soluble Emulsion Polymers with Varying Spacer Chain Length in Ionic Surfactant Solutions,” Macromolecules, 33, 1727-1733 (2000)
Shay, G. D., E. Eldridge and J. E. Kail, “Alkali-Soluble Latex Thickener,” US Patent
4,514,552 (1985) Shay, G. D. K. R. Olesen and C. M. Miller, “Observance and Characterization of the
Viscosity Spike Exhibited at Lower Degrees of Neutralization in HASE Polymers,” 216th ACS National Meeting, Boston, August 23-27 (1998)
Szejtli, J, “Introduction and General Overview of Cyclodextrin Chemistry,” Chemical
Reviews 98, 1743-1753, (1998) Tam, K. C., M. L. Farmer, R. D. Jenkins and D. R. Bassett, “Rheological Properties of
Hydrophobically Modified Alkali-soluble Polymers: Effects of Ethylene-Oxide Chain Length,” J. Polym. Sci., Part B: Polym. Phys. 36, 2275-2290 (1998)

103
Tan, H., K.C. Tam, V. Tirtaatmadja, R. D. Jenkins and D. R. Bassett, “Extensional Properties of Model Hydrophobically Modified Alkali-Soluble Associative (HASE) Polymer Solutions,” J. Non-Newtonian Fluid Mech. 92, 167-185 (2000)
Tan, H. T., K. C. Tam and R. D. Jenkins, “Network Structures of a Model HASE Polymer in
Semidilute Salt Solutions,” Journal of Applied Polymer Science 79, 1486-1496 (2001) Thibeault, J. C., P. R. Sperry and E. J. Schaller, "Effect of surfactants and Cosolvents on the
Behavior of Associative Thickeners in Latex Systems," In Water-Soluble Polymers: Beauty with Performance Edited by J. E. Glass (ACS Advances Chemistry . Series No. 213, American Chemical Society, Washington, D. C., 375-89, (1986).
Tirtaatmadja, V., K. C. Tam and R. D. Jenkins, “Rheological Properties of Model Alkali-
Soluble Associative (HASE) Polymers: Effect of Varying Hydrophobe Chain Length,” Macromolecules 30, 3271-3282 (1997)
Tirtaatmadja, V. T., K. C. Tam, R. D. Jenkins and D. R. Bassett, “Stability of a Model
Alkali-Soluble Associative Polymer in The Presence of a Weak and a Strong Base,” Colloid and Polymer Science 277, 276-281 (1999)

104
Table 1. Solvent’s composition, solubility parameter components and solubility parameter.
Solvent
PG,
wt.%
δd
MP1/2
δp
MP1/2
δh
MP1/2
δ
MP1/2
Water 0 12.3 31.3 34.1 47.8
PG15 15 12.9 28.0 32.5 44.8
PG25 25 13.3 26.0 31.5 42.7
PG35 35 13.9 22.9 30.7 40.7
PG50 50 14.5 20.4 28.8 38.2
PG70 70 15.3 16.2 26.6 34.8
PG85 85 16.2 12.9 24.9 32.1
PG 100 16.8 9.4 23.3 30.3
* Hansen (1967)

105
Table 2: Intrinsic viscosity ([η]), Huggins coefficient (kH) and the difference between
Huggins and Kramer coefficient (kH-kK) for modified and unmodified polymers in water/propylene glycol (PG) co-solvent with different compositions.
Modified Polymer Unmodified Polymer
Solvent δs
Mpa1/2 [η] dl/g kH kH- kK [η] kH kH- kK
Water 47.9 42.2 3.22 2.11 55.8 0.37 0.50
PG25 43.0 14.4 3.26 3.03
PG50 38.3 4.1 2.73 2.21 13.5 0.41 0.52
PG70 34.8 3.1 0.61 0.63
PG85 32.4 2.7 0.34 0.51 4.1 0.38 0.52
PG 30.3 2.3 0.41 0.51 1.4 0.36 0.51

106
CH2 C
CH3
COOH
H2C C
H
C OOCH2
CH3
CH2 C
CH3
CH3C CH3
NHCO
O
CH2
H2CO
x
y
Rp
z
Methacrylic Acid
Ethyl Acrylate
Macromonomer
Figure 1: Chemical constitution of the HASE polymer. Here p=40 and R corresponds to C22H44; x/y/z = 43.57/56.21/0.22 by mole.

107
101
102
103
104
105
106
107
10-3 10-2 10-1 100 101 102
η rel
γ (s-1).
Water
PG15
PG25
PG35
PG50
PG70PG
Figure 2. Effect of solvent composition on the relative viscosity of a 3% HASE polymer
solution. The numbers after PG (propylene glycol) correspond to the weight percent of PG in the water-propylene glycol co-solvent.

108
101
102
103
104
105
10-3 10-2 10-1 100 101 102
η or
η*,
Pa.
s
ω (rad/s) or γ (s-1).
Water
PG15
PG70
PG35
PG
η(γ) filled symbolsη∗(ω) open symbols
.
Figure 3. Comparison of the steady (filled symbols) and complex (open symbol) viscosity of
a 3% HASE polymer solution shown for different co-solvent compositions. The numbers after PG (propylene glycol) correspond to the weight percent of PG in the water-propylene glycol co-solvent.

109
10-3
10-2
10-1
100
101
102
103
G',
PaWater
PG15
PG35
PG85
PG25
PG50
PG70
a)
10-3
10-2
10-1
100
101
102
103
10-3 10-2 10-1 100 101 102
G',
G",
Pa
Water
PG35
PG85
PG25
ω, rad/s
G' Filled Symbols G" Open Symbols
b)
Figure 4. Effect of solvent composition on (a) the storage modulus G’,and, (b) the storage
(G’) and loss (G’’) moduli of a 3% HASE polymer solution.

110
10 1
10 2
10 3
10 4
10 5
10 6
10 7
ηre
l
3 %
0 .5 %
1 %
2%
(a )
1 0-1
100
101
102
103
30 3 5 40 45 5 0
G',
Pa
δs, M P a1 /2
1%
2%
3%
(b )
Figure 5. Effect of the solvent solubility parameter on the (a) relative viscosity, and, (b)
elastic modulus G’ at a fixed frequency (1 rad/sec) of HASE polymer solutions. The numbers (in %) correspond to different polymer concentrations. Lines are for guidance only and have no further justification.

111
102
103
104
105
106
107
0.6 0.8 1 2 3 4
ηre
l
c, wt.%
Water
PG15
PG25
PG35
ηrel
~ c2.5
Figure 6. Concentration dependence of the relative viscosity of HASE polymer solutions in
“water-rich” solvents. Results are shown for different compositions of the co-solvent.

112
101
102
103
104
0.1 1 10
ηre
l
c, wt.%
PG50
PG
PG85
PG70
ηrel
~ c1.4
Figure 7. Concentration dependence of the relative viscosity of HASE polymer solutions in
“PG-rich” solvents. Results are depicted for different co-solvent compositions.

113
10-1
100
101
102
103
104
10-3 10-2 10-1 100 101 102 103
η rel
γ, s-1
02
8
1525
Unmodified polymer
β-CD/Hydrophobe
.
Figure 8. Effect of addition of β-cyclodextrin on the relative viscosity of a 1% HASE polymer solution. The numbers correspond to the moles of cyclodextrin added per mole of the hydrophobe. The unmodified polymer reflects the same polymer as the HASE polymer but without the hydrophobes.
114
100
101
102
103
104
0.1 1 10
η rel
c (wt.%)
Unmodifed polymer (no hydrophobes) in Water
HASE + β-CD
n1.4
1.4
1.2
ηrel
~ cn
Unmodifed polymer (no hydrophobes) in PG
Figure 9. Concentration dependence of the relative viscosity for unmodified polymer
(without hydrophobe) in water and in PG, and the HASE polymer with the hydrophobes deactivated through the addition of 20 moles β-cyclodextrin/mole hydrophobe.

CCHHAAPPTTEERR 66
A TRACER MICRORHEOLOGY STUDY OFASSOCIATIVE POLYMER
SOLUTIONS
A revised version of Chapter 6 by Ahmed A. Abdala, Samiul Amin, John van Zanten, and
Saad Khan is being prepared for submission to Macromolecules
116
Abstract
In this study, we investigate the ability of diffusing wave spectroscopy (DWS) to
probe the dynamics of comb-like hydrophobically modified associative polymers. The effect
of both solvent quality and polymer concentration on the dynamics of the polymer solution
are examined. The creep compliance and dynamic moduli data extracted from DWS are
compared to those measured using conventional rheometry. We find that DWS accurately
probes the structural changes induced by the change in the solvent quality or the polymer
concentration. The comparison with conventional mechanical rheometry data reveals
excellent qualitative agreement between the data obtained from the two techniques.
Quantitatively, however, the dynamic moduli extracted from DWS measurements are
consistently higher than those obtained using conventional rheology. Several reasons for the
discrepancy are discussed including the possibility that the dynamics at the micro-level could
be different from the bulk properties. The scaling of the creep compliance, high–frequency
elastic modulus and relaxation time with polymer concentration show power-law
dependence. The power-law exponents are discussed in light of theoretical predictions and
available experimental data. Finally, the time dependent diffusion coefficient have been
obtained using DWS and reveal information about the length scales associated with changes
from elastic to glassy behavior of the polymer.

117
6.1 Introduction
Hydrophobically modified alkali soluble emulsion (HASE) polymers are water-
soluble associative polymers that have a comb-like structure with pendant hydrophobic
groups randomly grafted to a polyelectrolyte backbone. They have several advantages over
other associative polymers in terms of cost and wide formulation latitude1. They are currently
being used as rheology modifiers in a wide range of applications, including paint
formulations2-4-, paper coatings5, personal and home care products6-9, UV-photprotecting and
aerated emulsions10, 11, fabric softeners12, 13 and as glycol based aircraft anti-icing fluids14-17.
The dynamics of HASE polymers, and associative polymers in general, is usually
characterized using traditional mechanical rheometry measurements. However, a multiple
light scattering technique was introduced recently by Pine et. al.19 as a method to study the
dynamical processes in turbid media and has since been used to study collective dynamic
properties in a wide variety of materials, including polymer solutions and gels 19-22,
biopolymers23,24, colloidal suspensions and gels25-27, concentrated emulsions28,29, associative
polymers22, 30, foams31-35, nematic liquid crystals36, actin filaments37-42, magnetorheological
suspensions43, surfactants44-46, and proteins46,47.
Compared to conventional rheology, DWS has several advantages. First, the dynamic
properties are measured by applying a very small strain. Secondly, it requires very small
amounts of sample. Thirdly, it provides dynamic data over a very wide range of frequency.
Finally, and most importantly, owing to the multiple scattering nature of DWS, this technique
is capable of resolving angstrom-scale particle motions and thereby short-time dynamics.
Because the use of DWS to probe the dynamics of polymers requires the addition of

118
optical probes that insure highly scattering medium, polystyrene spheres are usually used as
the optical probes. This resembles a practical application of HASE associative polymers well,
because these polymers are used in paints and coatings in conjunction with colloidal
particles.
In this study, we explore the ability of DWS to examine the behavior of associative
polymers. We investigate the effect of the solvent quality on the behavior of a HASE
polymer through using a co-solvent of water and propylene glycol (PG). The solution
dynamics in water-rich and “PG-rich” solvents is extracted by tracking the Brownian motion
of polystyrene spheres embedded in the polymer solution. The data obtained using the DWS
technique are compared to those obtained using conventional rheometry. In addition, we
examine the behavior of the polymer solution at very high frequencies that is not accessible
using conventional rheometry, which is of industrial relevance.
6.2 Materials and Methods
The associative polymer used in this study is a model hydrophobically modified
alkali-soluble (HASE) polymer synthesized by Dow Chemicals, via emulsion polymerization
of methacrylic acid (MAA), ethylacrylate (EA) and a hydrophobic macromonomer. Figure 1
shows a schematic representation of its structure together with its molecular constituents..
The macromonomers in Figure 1 is end capped with C22H45 alkyl hydrophobes that are
separated from the polymer backbone by 40 units of polyethylene oxide (PEO). Details of the
preparation method can be found in a previous publication48.
The polymer latexes were dialyzed against de-ionized water using cellulosic tubular

119
membranes for at least three weeks with daily change of water. After dialysis, the polymer
was freeze-dried and 0.9% solutions were prepared and neutralized to pH of 9 ±0.1 using 1N
NaOH with the ionic strength adjusted to 10-4 M KCl. In this study, mixtures of water and
propylene glycol were used as co-solvents. The composition of these mixtures expressed as
weight% of PG in the solvent mixture is shown in Table 1. Throughout the article, these
solvent mixtures will be called PGXX, with XX corresponding to the wt.% of PG in the
mixture.
The steady and dynamic properties of the HASE polymer solutions were measured
using a stress-controlled rheometer (Rheometrics DSR II). A 40-mm cone and plate
geometry with 0.04 radians cone angle was utilized for all the reported measurements. The
linear viscoelastic region (LVE), the region where both G’ and G” are independent of the
applied stress, was determined by carrying out a dynamic stress sweep experiment. Both the
creep and the frequency sweep experiments were carried out using a stress within the LVE.
A DWS setup operating in the transmission mode was utilized in carrying out all
measurements. A schematic diagram for the setup used in the DWS experiments is shown in
Figure 2. In this setup, the beam from a diode pumped solid state (DPSS) Nd-YAG laser
operating at a wavelength of 532 nm in vacuo was incident upon a flat scattering cell
containing the polymer solutions with polystyrene spheres as the optical probes. The
multiply scattered light was collected using an ALV SI/SIPD photon detector via a single
mode optical fiber. In order to ensure point-to-point geometry, the single mode optical fiber
has a Gradient Refractive Index (GRIN) lens with a very narrow angle of acceptance,
attached to it. The output from the ALV SI/SIPD photon detector is fed into a correlator

120
working in the cross correlation mode. The measured intensity auto correlation function was
converted into the electric field autocorrelation function using the Siegert relationship.
The electric field autocorrelation function obtained from a DWS measurement can be
related to the mean square displacement through49:
( ) ( ) ( )2 21
0
1exp3 *o
sg t P s k r t dsl
∞ = − ∆ ∫ (1)
where g1(t) is the electric field autocorrelation function, P(s) is the path length distribution
function, ko is the wave vector, ∆r 2 t( ) is the particle mean squared displacement and l* is
the distance over which light becomes completely randomized. The mean square
displacement of the probing spheres was extracted pointwise from the electric field
autocorrelation function through a bisection root-searching program. It is to be noted that in
contrast to dynamic light scattering (DLS) in which the length scale over which particle
motion is probed can be adjusted by varying the scattering angle and/or the wavevector the
length scale over which the motion is probed in DWS is adjusted by varying the cell
thickness L. In this study we used 2 mm and 10 mm cells.
The viscoelastic properties of a medium can be extracted from the mean square
displacement data obtained from tracer microrheology either through direct comparison of
the complex viscoelastic modulus (G*) or through comparison of the creep compliance. The
complex viscoelastic modulus is obtained from tracer microrheology experiments through
application of the generalized Stokes-Einstein relation29:
2( )
6 ( )Bk T
G sas r sπ
≈∆
(2)

121
However, this expression involves a transformation of the data from the time domain to the
frequency domain. A more direct method and one that has been shown to give better results
is the use of the creep compliance. The time domain creep compliance, J(t), is directly
proportional to the mean square displacement and is given by41,42:
( ) ( )2
B
aJ t r tk Tπ
= ∆ (3)
The linear frequency-dependent storage and loss moduli can be obtained from the creep
compliance using various methods50. However, it is difficult to implement some of these
methods, in particular the direct transformation methods, due to the very large temporal
dynamic range and logarithmic spacing of the measured mean square displacement.
Moreover, the accuracy of estimation methods can be reduced by the noise in the mean
square displacement and rapid changes in the logarithmic slope of the mean square42. To
avoid these potential problems, the storage and loss moduli are calculated using the
retardation spectrum L(τ) as determined by a regularized fit of the creep compliance using a
set of impartial basis function, following the method described by Mason et al.42.
6.3 Results and Discussion
6.3.1 Solvent Quality Effects
Our initial efforts focused on extracting information about the effects of the solvent quality
on the behavior of HASE polymers from DWS by tracking the motion of 0.966-µm
polystyrene spheres in 0.9 wt.% polymer solutions in different solvents. In this regard, Figure
3 compares the mean square displacement of the 0.966 µm spheres in pure water and that in a
mixture of 91% PG and 10%with that of 0.9 wt.% HASE polymer solutions in co-

122
solvents of water and PG of different proportions. The observed Brownian motion of the
spheres intimately reflects the dynamics of the suspending medium. In the purely viscous
solvents of PG/water mixture and/or water, the behavior is diffusive as expected; this is
confirmed by the linear dependence of the mean square displacement with time. In the
viscoelastic medium (with polymer), the behavior becomes sub-diffusive, <∆r²(t)> ~ tn with n
< 1 as shown for the polymer solutions in all solvent composition. The effect of the co-
solvent on the mean square displacement at shorter times seems to be very different from that
at longer times. At longer times, the behavior of the polymer solution is controlled by the
viscoelastic nature of the polymer. In this limit, the solution exhibits more elastic character as
the water content of the solvent increases as evident from the lower <∆r²(t)> in water-rich
solvents as well as the lower dependence of <∆r²(t)> on time. On the other hand, at short
times, the behavior is controlled by the viscous nature of the medium and approaches that of
the solvent. This can be noticed from the lower <∆r²(t)> for polymer solutions in “PG-rich”
solvent which can be attributed to the high viscosity of “PG-rich” solvents compared to that
of water-rich solvents, (PG viscosity is about 40 times the viscosity of water). It should be
pointed out that this very short time behavior can never be probed by conventional
rheometers.
The behavior of the polymer solutions, as obtained from DWS, can be directly
compared to that obtained by conventional mechanical rheometry through the transformation
of <∆r²(t)> to the creep compliance, J(t), using equation 3. Figure 4 compares the creep
compliance of 0.9wt.% HASE polymer solutions in different solvents obtained using tracer
microrheology and mechanical rheometry. The effect of the solvent on the behavior of the

123
polymer solution can be seen from the lower compliance (in both mechanical rheometry and
DWS measurements) for the polymer in water-rich than in “PG-rich” solvents. Figure 4 also
reveals excellent qualitative agreement between the mechanical and DWS compliance.
However, quantitatively the compliance obtained from the DWS measurements is always
lower than that obtained from mechanical measurement using stress values in the linear
viscoelastic region (LVE).
By decomposing the creep data using the Voigt model, the complex modulus (G*)
and thus the elastic (G’) and viscous moduli can be obtained. This is illustrated in Figures 5
which reflects the advantage of DWS; data over a very wide frequency range (6 decades) is
obtained. Figure 5b shows both G’ and G” for 0.9% HASE solution in PG14 and PG77
solvents. From the figure, we observe the difference in the behavior of the solution rheology
in water-rich and “PG-rich” solvents. In the “PG-rich” solvent (PG77), the behavior
corresponds to that of a viscous fluid with G” dominating G’ over the entire frequency range.
On the other hand, in the water-rich solvent (PG14), the G’ and G” response is that of a
typical viscoelastic material; at short times the material response is relatively elastic
compared to the viscous response at longer times. These same features are obtained using
mechanical rheometry as well. This is illustrated in Figure 6 which shows G’ and G” for a
0.9% HASE solution in PG14 and PG77 solvents.. These similar qualitative features seen in
Figures 5 and 6 are a testament to the feasibility of DWS for probing the behavior of our
complex associative polymers. These findings are in full accordance with the results of our
previous study where hydrophobic interaction played a major role in the solution behavior in
“water-rich” solvents. In contrast, the lack of hydrophobic association in “PG-rich” solvents

124
was evident from the similarity of the polymer dynamics in “PG-rich” solvent to the behavior
of unmodified polymer analog with no hydrophobes51.
A systematic comparison of the data obtained using both DWS and mechanical
rheometry is illustrated in Figures 7 which shows the frequency spectrum of both G’ and G”
for a 0.9 wt.% polymer in PG14 and PG 77 solvents. We observe excellent qualitative
agreement between the data obtained using DWS and that obtained from mechanical
rheometry. Quantitatively, the moduli obtained from DWS measurements are consistently
higher than those measured using traditional rheometry. This discrepancy between DWS and
mechanical rheometry could arise from different factors including the range of validity of the
Generalized Stokes-Einstein relation (GSER), the presence of structural inhomogeneity, and
possible interactions between the probe particles and the viscoelastic medium, which may
include absorption or depletion effects. The range of validity of the GSER has been the focus
of recent publications39, 52-55. Levine and Lubensky found that there is a large frequency
range over which the GSER is valid in many systems. The upper frequency range is bounded
by the inertial effects that typically become significant at frequencies higher than 1 MHz. and
thus may be safely ignored. On the other hand, the lower frequency range is bounded by a
characteristic frequency, ωc, below which the effective decoupling of network and fluid
dynamics becomes significant. An order of magnitude estimate of ωc can be determined form
the following relation39:
2
2cG
Rξ
ωη
(4)
where G is the shear modulus and can be taken as G*(ω=0), η is the solvent viscosity, ξ is
the network mesh size and R is the probe particle radius. There is no good estimate
125
for the mesh size of our system, yet. The decoupling between the solvent and the network
would be highly dependent on the solvent quality and is expected to be enhanced with
“water-rich” solvents compared to “PG-rich” solvents.
To approximate the lower frequency limit, we consider the worst-case scenario, i.e.,
when the solvent is pure water. Since the G/η ratio is on the order of 100 s-1,
G*(ω=0.01)=0.2 Pa and η=1 mPa.s, a sphere radius that is 10 times larger than the mesh size
gives an estimate for ωc of about 1 Hz. On the other hand an estimate of 0.001 Hz would
result in the case of PG91 as the solvent. Thus, the discrepancy between DWS and
mechanical rheometry measurements cannot be fully attributed to the validity range of the
GSER.
Another factor that may be responsible for the deviation between the DWS and the
mechanical rheology measurements is the presence of local inhomogeneity in the system.
This can be examined by changing the probe size and comparing the extracted rheological
properties. In addition, changing the sphere size can provide information on the range of
frequency over which the GSER is valid. Figure 8 shows the creep compliance obtained by
DWS measurement of a 0.9% HASE polymer in water using PS spheres of different sizes.
The data extracted using mid size spheres (0.511-0.966 µm) seem to collapse perfectly to a
single master curve that is in an acceptable agreement with the data obtained from the
mechanical rheology measurements However, the data extracted using the smallest and the
largest spheres show deviation. The agreement between the data obtained using mid size
spheres illustrates both the validity of the GSER and the absence of any local inhomogeneity.
Close examination of Figure 8 shows that the data obtained using the smallest spheres

126
are still in good agreement with those obtained using the mid size sphere at times <10-3 s.
This would imply that the lower frequency limit where the GSER is valid for this size
spheres is on the order of 100 Hz. By simple back calculation we would get an average mesh
size on the order of 0.1 µm. The deviation in the case of the largest spheres may be attributed
to inter-particle interactions or aggregation.
In general, the deviation between the data measured using DWS and mechanical
rheometry could be attributed to the perturbation of the polymer matrix by the probe spheres
or to measurement errors. For example, DWS requires independent measurement of * (the
distance at which the light becomes completely randomized); any error in the value of * will
affect the calculated mean square displacement. Based on these discussion, we can surmise
that the GSER is valid when spheres of suitable sizes are used,; the microstructure of the
polymer solution is insensitive to the probe size, and the decoupling between the solvent and
the network does not play any significant role on the dynamics of the system. It is therefore
possible that the discrepancy could be a result of actual difference between the micro- versus
macro rheological properties.
6.3.2 Concentration Effects
Here, we change the polymer concentration and examine the effect of the polymer
concentration on the dynamics of the polymer solution. The microstructure and thus the
dynamics of HASE polymer solutions are known to be highly dependent on the polymer
concentration and their behavior can go through many transitions within a limited range of
concentrations55. In this regard, we examine the effects of the polymer concentration on

127
the dynamics of the polymer solution using DWS. Figure 9 shows the mean square
displacement of 0.966 mm sphere embedded in aqueous solutions of a HASE polymer with
different concentrations. As observed from the figure, the motion of the spheres becomes
slower with increasing polymer concentration. This behavior is expected since the medium
viscosity and viscoelastic properties are enhanced by increasing the polymer concentration.
Moreover, the same <∆r²(t)>-time profile is observed for all polymer concentrations. This
profile can be described as an initial subdiffusive behavior at short times followed by the
development of a plateau at intermediate times and another subdiffusive behavior at very
long times. The similarity in <∆r²(t)>-time profiles, in spite of different polymer
concentrations, indicates that the dynamics probed by the spheres are of the same origin. A
similar <∆r²(t)>-time profile has recently been observed in a micellar soft crystal structure of
a triblock copolymer of polyethylene oxide-polypropylene oxide-polyethylene oxide (PEO-
PPO-PEO) known as PluronicTM 56. In our figure, there are however two minor differences in
the <∆r²(t)>-time profile for different polymer concentrations. First, the onset of the plateau
and the final subdiffusive regions shift to shorter times as the polymer concentration increase.
Second, the slope of the short time subdiffusive region decreases with polymer concentration.
These differences could be attributed to the change in relaxation time as the polymer
concentration increases. Indeed solutions with higher polymer concentration would have
slower relaxation processes, because of the enhancement in the system viscoelasticity.
The <∆r²(t)>-time profile can be explained as follows. At short times, the spheres
diffuse in the viscoelastic media (initial subdiffusive region) before they are entrapped inside
the polymer network (the plateau region), and finally escape after the relaxation of the

128
network (final subdiffusive region). It should be noted that although our polymer and soft
crystal PluronicTM coplymers exhibit similar <∆r²(t)>-time profiles, the relaxation mechanism
is very different for them. While the PluronicTM coplymers relaxe by the micellar
rearrangment 56, our polymer system relaxes by disengagement of associating sequencing.
Figure 10 shows the creep compliance data obtained from DWS measurements for
different polymer concentrations and the analogous data obtained from stress-controlled
rheometery. The figure reveals one advantage of combining data from DWS and mechanical
rheometry measurements, i.e., data over a very wide range of time scale (8 decades) can be
obtained. Note also that while mechanical rheometry measurements can never probe the short
time behavior, DWS can probe both the long time and short time behavior by using cells of
variable width. Figure 10 reveals excellent qualitative and good quantitative agreement
between the compliance data for various concentrations.
To further examine the feasibility of the DWS technique and its ability to correctly
probe the dynamics of the viscoelastic medium, the creep compliance was converted to the
corresponding dynamic moduli. Figure 11 shows the elastic and viscous moduli as functions
of angular frequency for the aqueous polymer solutions at different concentrations. As seen
from Figure 11, and as expected from the J(t) comparison, there is excellent qualitative
agreement between the moduli extracted from the DWS data with that from mechanical
rheometry, regardless of the polymer concentration.
6.3.2.1 Scaling behavior
The concentration dependence of material functions often reveals valuable

129
structural information about a polymer. The rheology of associative polymers are usually
strongly dependent on concentration such that they can undergo several structural transitions.
At low concentrations, intramolecular associations are the dominant hydrophobic interaction
mode; as the concentration increases some of the intramolecular associations are converted to
intermolecular association. At high enough concentrations, the intermolecular associations
are the dominant mode of interaction. In this regard, we examine the high frequency elastic
modulus (G’) and the creep compliance J(t) as a function of concentration in Figure 12. We
find both these material functions to exhibit power-law behavior within the concentration
regime studied. In this figure, the high frequency elastic modulus is taken at a fixed angular
frequency of 10 rad/s; this is bounded by the highest frequency accessible by the mechanical
rheometer for the lowest concentration. J(t),on the other hand, was taken at a time of 50
seconds as bounded by the longest time accessible by the DWS technique. The error bars in
the figure represent the standard deviation for the DWS and mechanical rheometry data. As
observed from Figure 12, G’ and J(t) scale as G’~c1.7 and J(t)~ c–1.8. It is worth mentioning
that while the scaling of the elastic modulus at various frequencies with concentration yield
the same scaling exponent, scaling of the J(t) at different times yield scaling exponents that
vary from -1.4 at short times to -1.9 at long times. The observed dependence of G’ on
concentration is somewhat weaker than the theoretical prediction of the sticky reptation
model56. The sticky reptation model predicts a scaling exponent of 2.2 for good solvent that
increases slightly to 2.3 in θ solvents. Nevertheless, different exponents have been reported
for similar associative polymers. English et al57 reported scaling exponents 1.4, 2.8 and 6.5
for HASE polymers with C8, C16 and C20 hydrophobes, respectively. In fact, we obtained a

130
scaling exponent of 1.8 for several HASE polymers that is in full agreement with the 1.7
obtained here58. The scaling exponent 1.8 observed for J(t) is similar to that observed by Ng
et. al for Hydrophobically modified Ethoxylate Urethane (HEUR) polymers59.
Figure12 also shows the scaling of the longest relaxation time (τlong), defined as the
reciprocal of the frequency at which G’ and G” crossover, versus the polymer concentration.
τlong values in the plot are the average of τlong obtained from DWS and mechanical rheometry
measurements and the error bars represent the standard deviation. The small error bars
demonstrate the ability of DWS to accurately probe the dynamics of HASE polymers. The
scaling shows that τlong ~c0.84. This scaling along with G’ scaling suggests a scaling exponent
2.6 for the steady shear viscosity (η) based on the transient network theory prediction60,
η=G∞ τ. This exponent is in full agreement with that obtained in our laboratory for similar
polymers58.
6.3.2.2 Time dependent Diffusion Coefficient
The mean square displacement data can be further analyzed in terms of a time
dependent diffusion coefficient , D(t), defined as:
2 ( )( )
6
r tD t
t
∆= (4)
Figure 13 shows the evolution of D(t) for different polymer concentrations. Regardless of the
concentration, the diffusion coefficient decreases continuously and the motion of the spheres
cannot be described by a single diffusion coefficient. Higher polymer concentrations result in
a lower diffusion coefficient, as expected, due to the increase in the solution viscoelasticity.

131
At very short times and small length scales, the spheres are subjected to small amplitude,
high frequency lateral fluctuation of the polymer network41. In this limit, the medium
behavior is dominated by the glassy nature of the polymer and the diffusion coefficient
approaches that of the spheres in pure water (Do), 0.46 µm2/s. At long times or long length
scales, the medium behavior is dominated by its elastic nature and microspheres becomes
elastically trapped by the network structures. Therefore, a very small diffusion coefficient is
expected at long times and higher concentrations. The very small diffusion coefficient, up to
7 order of magnitude lower than the diffusion coefficient of the 0.966 µm spheres in water,
correspond to near arrest of the sphere by the network41. Moreover, from the values of the
diffusion coefficient as presented in Figure 13, one would expected the sphere size to be
much larger compared to the network mesh. Hence, if the sphere size were smaller than the
network mesh, a diffusion coefficient similar to Do would be expected.
Information about the dynamic of the medium at different length scales can be
extracted form the behavior of the diffusion coefficient as function of the sphere
displacement, 2 ( )r t∆ as shown in Figure 13b. This figure shows three distinct dynamical
regions for all concentrations studied. In the first region at short displacements, the diffusion
coefficient shows a near plateau behavior. This region is followed by a sharp downward
transition and finally a near plateau region is established at longer displacements. The length
scale for the sharp transition decreases from 10 to 2.5 nm as the concentration is increased
from 1 to 5%. Similar behavior has been reported for an actin filaments network41. The
dynamics in the early near plateau region corresponds to a behavior dominated by the
hydrodynamic interactions. As the spheres approach the polymer network, they

132
experience the dynamics of the elastic medium and finally become entrapped in the elastic
cage formed by the network.
6.4 Conclusions
In this study, we use diffusing wave spectroscopy to probe the structural changes induced by
the change of solvent quality and polymer concentration on a HASE associative polymer. In
addition, we compare DWS results to those obtained using conventional rheometry. We find
that cosolvents of water and propylene glycol (PG) impart significant changes in rheology
depending on the composition. In “water-rich” solvents, the polymer behavior is dominated
by hydrophobic associations; in contrast, in “PG-rich” solvents, the solution behavior is
similar to that of an unmodified polymer without hydrophobes. In addition, comparison of
DWS results with those obtained using conventional rheometry reveals excellent qualitative
agreement. Further, DWS provided information on the polymer dynamics over a very wide
frequency range, including high frequencies that are not accessible by mechanical rheometry.
Finally, the concentration dependence of the creep compliance, high–frequency elastic
modulus and relaxation time obtained using DWS or rheometry reveal power-law
dependence with the same exponents regardless of the technique. However, the power-law
exponents were different for the different materials functions, and are discussed in light of
theoretical predictions and other available experimental results. These results taken together
suggest diffusing wave spectroscopy (DWS) as a viable technique to probe the dynamics of
associative polymers.

133
6.5 References
1. Tirtaatmadja; V. T.; Tam, K. C.; Jenkins, R. D.; Bassett, D. R. Stability of a Model Alkali-Soluble Associative Polymer in the Presence of a Weak and a Strong Base, Colloid and Polymer Science 1999, 277, 276-281.
2. Rich, A. F.; Benes, P. C.; Adams, L. E. Combinations of Polymeric Associative
Thickeners for Aqueous Latex Paints. US Patent 4735981, 1988. 3. Jones, C. E.; Reeve, P. F. D. Mixed Surfactant and Hydrophobically-Modified
Polymer Compositions for Thickeners for Aqueous Systems. EP Patent 875557, 1998.
4. Jenkins, R. D.; Bassett, D. R.; Shay, G. D. Water-soluble Polymers Containing
Complex Hydrophobic Groups. US Patent 5292828, 1994. 5. Harrington, J. C.; Zhang, H. T. Using Hydrophobically Associative Polymers in
Preparing Cellulosic Fiber Compositions. WO Patent 0140578, 2001.
6. Marchant, N. S.; Yu, S. Rheology Modifying Copolymer Composition. US Patent 06433061, 2002.
7. Brooks, A.; Du Reau, C. M. A. Cleansing Compositions Containing Polar Oils and
Skin Conditioners. WO Patent 9800495, 1998.
8. Herd, H. E.; Williams, R. Preparation and Properties of Shear-thinning, Thickened Cleaning Composition. GB Patent 2346891, 2000.
9. Alan, B.; Du Reau, C. M. A. Cleansing Compositions. US Patent 6191083, 2001.
10. Vorobyova, O.; Winnik, M. A. Determination of Aggregation Numbers in Aqueous
Solutions of Hydrophobically Modified Polymers by Fluorescent Probe Techniques. In Associative Polymers in Aqueous Media; ACS, 2000; Vol. 765, pp 143-162.
11. Didier, C.; Serge, F.; Anne-Marie, P. UV-Photoprotecting Emulsions Comprising
Micronized Insoluble Screening Agents and Associative Polymers. US Patent 6409998, 2002.
12. Ewbank, E.; Collard, C.; Tummers, D.; Breuer, E.; Thibert, E. Liquid Fabric
Softening Compositions Containing a Fatty Alcohol Ethoxylate diurethane Polymer as a Thickener. US Patent 6001797, 1999.
13. Alfons, C. R. A.; Madeleine, D. B. F. J.; Jean, H. B. A. Fabric Softener
Compositions. US Patent 6020304, 1999.

134
14. Jenkins, R. D. B., D. R.; Lightfoot, R. H.; Boluk, M. Y. Glycol-Based Aircraft Anti-Icing Fluids Thickened by Associative Polymers Containing Hydrophobe-Bearing Macromonomers. US Patent 5681882, 1997.
15. Jenkins, R. D. B., D. R.; Lightfoot, R. H.; Boluk, M. Y. Aircraft Anti-Icing Fluids
Thickened by Associative Polymers. WO Patent 9324543, 1993.
16. Carder, C. H.; Garska, D. C.; Jenkins, R. D.; McGuiness, M. J. Aircraft Deicing/Anti-Icing Fluids Thickened by Associative Polymers. US Patent 5708068, 1998.
17. Carder, C. H.; Garska, D. C.; Jenkins, R. D.; McGuiness, M. J. Aircraft
Deicing/Anti-Icing Universal Fluids. JP Patent 10237428, 1998.
18. Pine, D. J.; Weitz, D. A.; Chaikin, P. M.; Herbolzheimer, E. Diffusing-Wave Spectroscopy, Phys. Rev. Lett. 1988, 60, 1134-1137.
19. Mason, T. G.; Ganesan, K.; van Zanten, J. H.; Wirtz, D.; Kuo, S. C. Particle
Tracking Microrheology of Complex Fluids, Physical Review Letters 1997, 79, 3282-3285.
20. Nisato, G.; Hebraud, P.; Munch, J. P.; Candau, S. J. Diffusing-Wave-Spectroscopy
Investigation of Latex Particle Motion in Polymer Gels, Phys. Rev. E: Stat. Phys., Plasmas, Fluids, Relat. Interdiscip. Top. 2000, 61, 2879-2887.
21. Dasgupta, B. R.; Tee, S. Y.; Crocker, J. C.; Frisken, B. J.; Weitz, D. A.
Microrheology of Polyethylene Oxide using Diffusing Wave Spectroscopy and Single Scattering, Physical Review E: Statistical, Nonlinear, and Soft Matter Physics 2002, 65, 051505/051501-051505/051510.
22. Solomon, M. J.; Lu, Q. Rheology and Dynamics of Particles in Viscoelastic Media,
Current Opinion in Colloid & Interface Science 2001, 6, 430-437.
23. Crocker, J. C.; Valentine, M. T.; Weeks, E. R.; Gisler, T.; Kaplan, P. D.; Yodh, A. G.; Weitz, D. A. Two-Point Microrheology of Inhomogeneous Soft Materials, Physical Review Letters 2000, 85, 888-891.
24. Schmitt, C.; Sanchez, C.; Lamprecht, A.; Renard, D.; Lehr, C. M.; de Kruif, C. G.;
Hardy, J. Study of .Beta.-lactoglobulin/acacia Gum Complex Coacervation by Diffusing-Wave Spectroscopy and Confocal Scanning Laser Microscopy, Colloids Surf., B 2001, 20, 267-280.

135
25. Ladd, A. J. C.; Gang, H.; Zhu, J. X.; Weitz, D. A. Temporal and Spatial Dependence of Hydrodynamic Correlations: Simulation and Experiment, Physical Review E: Statistical Physics, Plasmas, Fluids, and Related Interdisciplinary Topics 1995, 52, 6550-6572.
26. Ladd, A. J. C.; Gang, H.; Zhu, J. X.; Weitz, D. A. Time-dependent Collective
Diffusion of Colloidal Particles, Physical Review Letters 1995, 74, 318-321.
27. Rojas-Ochoa, L. F.; Romer, S.; Scheffold, F.; Schurtenberger, P. Diffusing Wave Spectroscopy and Small-angle Neutron Scattering from Concentrated Colloidal Suspensions, Physical Review E: Statistical, Nonlinear, and Soft Matter Physics 2002, 65, 051403/051401-051403/051408.
28. Mason, T. G. Estimating the Viscoelastic Moduli of Complex Fluids using the
Generalized Stokes-Einstein equation, Rheologica Acta 2000, 39, 371-378.
29. Mason, T. G.; Gang, H.; Weitz, D. A. Diffusing-Wave-Spectroscopy Measurements of Viscoelasticity of Complex Fluids, Journal of the Optical Society of America A: Optics, Image Science, and Vision 1997, 14, 139-149.
30. Knaebel, A. S., R.; Munch, J. P.; Candau, S. J. Structural and Rheological Proerties
of Hydrophobically Modified Alkali-Soluble Emulsion Solutions, Journal of Applied Polymer Science: Part B: Polymer Physics 2002, 40, 1985-1994.
31. Maret, G. Diffusing-Wave Spectroscopy, Curr. Opin. Colloid Interface Sci. 1997, 2,
251-257.
32. Fawcett, A.; Uhomoibhi, J. O. Diffuse Wave Spectroscopy Finds that PEG Delays the Aging of a Foam, Polym. Prepr. (Am. Chem. Soc., Div. Polym. Chem.) 2001, 42, 442-443.
33. Earnshaw, J. C.; Wilson, M. A Diffusing Wave Spectroscopy Study of Constrictive
Flow of Foam, J. Phys. II 1996, 6, 713-722.
34. Earnshaw, J. C.; Jaafar, A. H. Diffusing-Wave Spectroscopy of a Flowing Foam, Phys. Rev. E: Stat. Phys., Plasmas, Fluids, Relat. Interdiscip. Top. 1994, 49, 5408-5411.
35. Cohen-Addad, S.; Hohler, R. Bubble Dynamics Relaxation in Aqueous Foam Probed
by Multispeckle Diffusing-Wave Spectroscopy, Phys. Rev. Lett. 2001, 86, 4700-4703.
36. Stark, H.; Kao, M. H.; Jester, K. A.; Lubensky, T. C.; Yodh, A. G.; Collings, P. J. Light Diffusion and Diffusing-Wave Spectroscopy in Nematic Liquid Crystals, J. Opt. Soc. Am. A 1997, 14, 156-178.
136
37. Rufener, K.; Palmer, A.; Xu, J.; Wirtz, D. High-Frequency Dynamics and Microrheology of Macromolecular Solutions Probed by Diffusing Wave Spectroscopy: the Case of Concentrated Solutions of F-actin, Journal of Non-Newtonian Fluid Mechanics 1999, 82, 303-314.
38. Schnurr, B. Semiflexible Biopolymers: Microrheology and Single Filament
Condensation, Ph.D. Dissertation, Univ. of Michigan, Ann Arbor, MI, 2000.
39. Schnurr, B.; Gittes, F.; MacKintosh, F. C.; Schmidt, C. F. Determining Microscopic Viscoelasticity in Flexible and Semiflexible Polymer Networks from Thermal Fluctuations, Macromolecules 1997, 30, 7781-7792.
40. Xu, J.; Viasnoff, V.; Wirtz, D. Compliance of Actin Filament Networks Measured by
Particle-Tracking Microrheology and Diffusing Wave Spectroscopy, Rheol. Acta 1998, 37, 387-398.
41. Xu, J.; Palmer, A.; Wirtz, D. Rheology and Microrheology of Semiflexible Polymer
Solutions: Actin Filament Networks, Macromolecules 1998, 31, 6486-6492.
42. Mason, T. G.; Gisler, T.; Kroy, K.; Frey, E.; Weitz, D. A. Rheology of F-actin Solutions Determined from Thermally Driven Tracer Motion, J. Rheol. 2000, 44, 917-928.
43. Furst, E. M.; Gast, A. P. Particle Dynamics in Magnetorheological Suspensions using
Diffusing-Wave Spectroscopy, Phys. Rev. E: Stat. Phys., Plasmas, Fluids, Relat. Interdiscip. Top. 1998, 58, 3372-3376.
44. van Zanten, J. H.; Rufener, K. P. Brownian Motion in a Single Relaxation Time
Maxwell Fluid, Phys. Rev. E: Stat. Phys., Plasmas, Fluids, Relat. Interdiscip. Top. 2000, 62, 5389-5396.
45. Amin, S.; Kermis, T. W.; van Zanten, R. M.; Dees, S. J.; van Zanten, J. H.
Concentration Fluctuations in CTAB/NaSal Solutions, Langmuir 2001, 17, 8055-8061.
46. Vasbinder, A. J.; van Mil, P. J. J. M.; Bot, A.; de Kruif, K. G. Acid-Induced Gelation
of Heat-Treated Milk Studied by Diffusing Wave Spectroscopy, Colloids Surf., B 2001, 21, 245-250.
47. Dalgleish, D. G.; Horne, D. S. Different Coagulation and Gelation Modes of Casein
Micelles Followed by Diffusing Wave Spectroscopy, Protein Interact., Symp. 201st Annu. Meet. Am. Chem. Soc. 1992, 87-101.

137
48. Shay, G. D.; Kail, J. E. Alkali-Soluble Latex Thickener. US Patent 4514552, 1985.
49. Weitz, D. A.; Pine., D.J. Diffusing-Wave Spectroscopy. In Dynamic Light Scattering: the Method and Some Applications; Oxford University Press: Oxford, 1993; Vol. 60, 652-720. Ferry, J. D. Viscoelastic Properties of Polymers, Third ed.; John Wiley & Sons, Inc.: New York, 1980.
50. Abdala, A. A.; Olesen, K.; Khan, S. A. Solution Rheology of Hydrophobically
Modified Associative Polymers: Solvent Quality and Hydrophobic Interactions, submitted to J. Rheol. 2002.
51. Levine, A. J.; Lubensky, T. C. One- and Two-Particle Microrheology, Phys. Rev.
Lett. 2000, 85, 1774-1777.
52. Levine, A. J.; Lubensky, T. C. Response Function of a Sphere in a Viscoelastic Two-Fluid Medium, Phys. Rev. E: Stat., Nonlinear, Soft Matter Phys. 2001, 63, 041510/041511-041510/041512.
53. Levine, A. J.; Lubensky, T. C. Two-Point Microrheology and the Electrostatic
Analogy, Physical Review E: Statistical, Nonlinear, and Soft Matter Physics 2002, 65, 011501/011501-011501/011513.
54. Rubinstein, M., Semenov, A. N.,. Dynamic of Entangled Solution of Associating
Polymers, Macromolecules 2001, 34, 1058-1068.
55. Amin, S. Brownian Motion in Viscoelastic Media, Ph. D. Dissertation, North Carolina State University, Raleigh, NC, 2002.
56. English, R. J.; Gulati, H. S.; Jenkins, R. D.; Khan, S. A. Solution Rheology of a
Hydrophobically Modified Alkali-Soluble Associative Polymer, Journal of Rheology 1997, 41, 427-444.
57. Abdala, A. A.; Olesen, K.; Wu, W.; Khan, S. A. Effect of Polymer Composition on
Microstructure and solution Rheology of Associative Polymers, to be published.
58. Ng, W. K.; Tam, K. C.; Jenkins, R. D. Lifetime and Network Relaxation Time of a HEUR-C20 Associative Polymer System, J. Rheol. 2000, 44, 137-147.

138
Table 1. Solvent’s composition, solubility parameter components and solubility parameter.
Solvent
PG, wt.%
δd MPa0.5
δp MPa0.5
δH MPa0.5
δ MPa0.5
Water 0 12.3 31.3 34.2 47.9 PG14 14 12.9 28.0 32.7 45.0 PG23 23 13.3 26.0 31.9 43.2 PG32 32 13.7 23.7 31.1 41.5 PG46 46 14.3 20.5 29.7 38.7 PG64 64 15.1 16.2 27.8 35.6 PG77 77 15.7 12.9 26.6 33.3 PG91 91 16.4 9.4 25.2 31.5

139
CH2 C
CH3
COOH
H2C C
H
C OOCH2
CH3
CH2 C
CH3
CH3C CH3
NHCO
O
CH2
H2CO
x
y
Rp
z
Methacrylic Acid
Ethyl Acrylate
Macromonomer
Figure 1. Schematic representation of the architecture of a typical HASE polymer and its molecular structure. Here, p=40 and R correspond to C22H44; x/y/z = 43.57/56.21/0.22 by mole.
Hydrophobic groups PEO Spacers
Polyelectrolyte backbone

140
Figure 2. Diffusing wave spectroscopy (DWS) experimental setup in the transmission mode.
The beam is focused and incident upon flat scattering cell containing the sample and spherical optical probes. The light is multiply scattered and collected by two photomultiplier tubes.
PMT kN-1
kN
kN-2
Fiber Optic Collimator
Collection optics
PMT
PMT
Sample Cell
Laser light
r0 r1 r2
k0
k1 k2

141
10-7
10-6
10-5
10-4
10-3
10-2
10-6 10-5 10-4 10-3 10-2 10-1 100 101
<∆r2 (t
)>, µ
m2
time, sec
Pure waterPG/Water (91/9)
HASE in PG46
HASE in PG91
HASE in PG23
HASE in PG14
Figure 3. Evolution of the mean square displacement for water, PG/water 91/9 (w/w)
mixture, and 0.9% HASE polymer in PG/water co-solvents at different PG ratios.
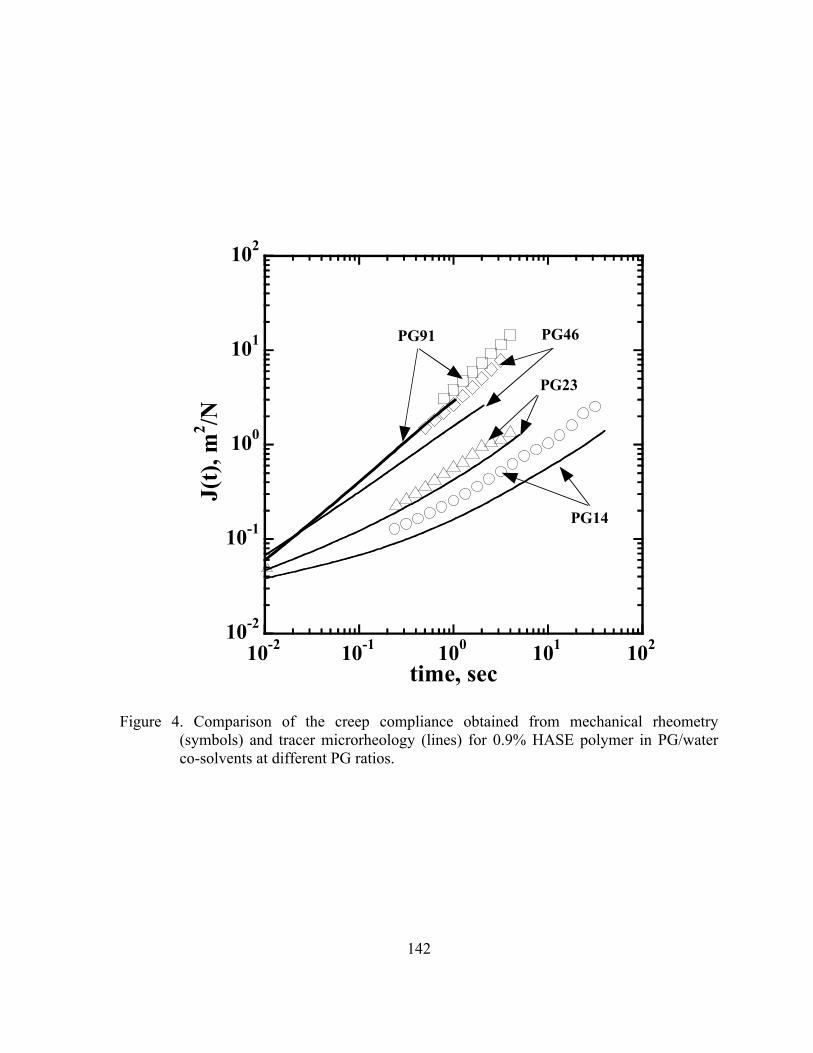
142
10-2
10-1
100
101
102
10-2 10-1 100 101 102
J(t)
, m2 /N
time, sec
PG14
PG23
PG91 PG46
Figure 4. Comparison of the creep compliance obtained from mechanical rheometry
(symbols) and tracer microrheology (lines) for 0.9% HASE polymer in PG/water co-solvents at different PG ratios.
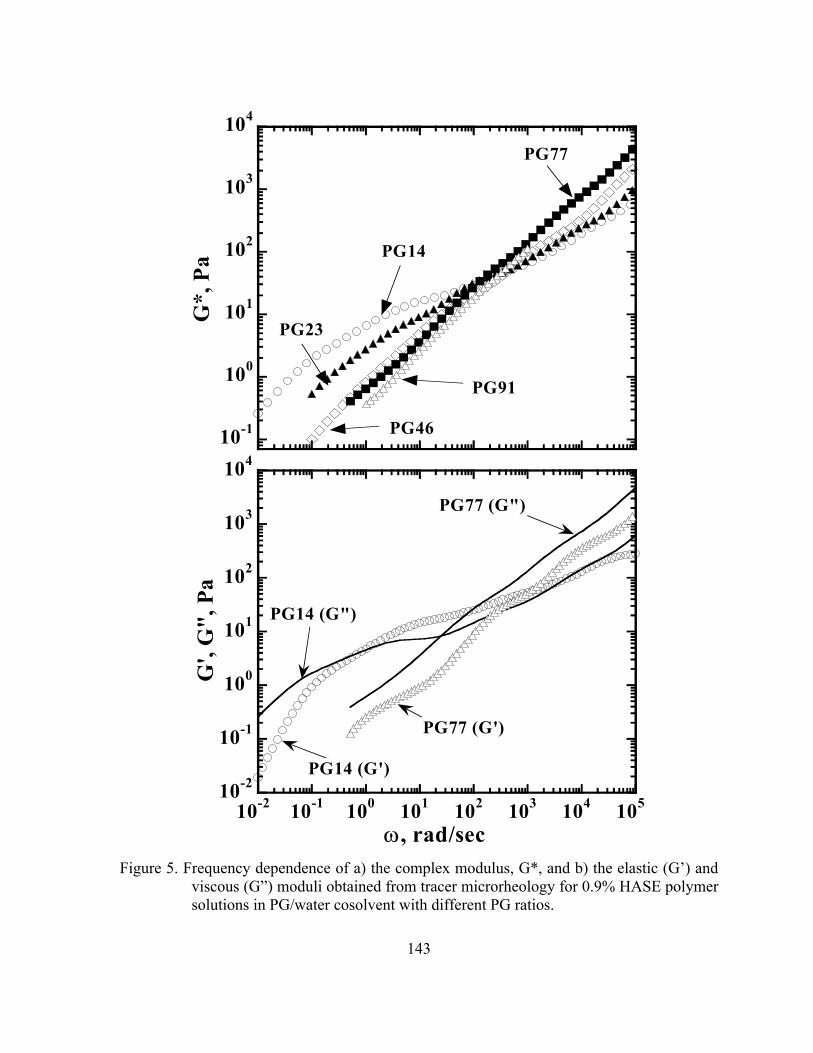
143
10-1
100
101
102
103
104
G*,
Pa PG14
PG46
PG91
PG23
PG77
10-2
10-1
100
101
102
103
104
10-2 10-1 100 101 102 103 104 105
G',
G",
Pa
ω, rad/sec
PG14 (G")
PG14 (G')
PG77 (G')
PG77 (G")
Figure 5. Frequency dependence of a) the complex modulus, G*, and b) the elastic (G’) and
viscous (G”) moduli obtained from tracer microrheology for 0.9% HASE polymer solutions in PG/water cosolvent with different PG ratios.

144
10-4
10-3
10-2
10-1
100
101
102
10-2 10-1 100 101 102
G',
G",
Pa
ω, rad/sec
PG77 (G")
PG77 (G')
PG14 (G")
PG14 (G')
Figure 6. Frequency dependence of the elastic (G’) and viscous (G”) moduli obtained from
mechanical rheometry measurements for 0.9% HASE polymer solutions in PG/water co-solvent at different PG ratios.

145
10-3
10-2
10-1
100
101
102
G',
Pa
PG46
PG23
PG14
a)
10-2
10-1
100
101
102
10-2 10-1 100 101 102
G",
Pa
ω, rad/sec
PG14
PG14
PG23PG46
b)
Figure 7 Comparison of a) elastic (G’) and b) viscous (G”) moduli obtained from mechanical
rheometry (symbols) and tracer microrheology (lines) for 0.9% HASE polymer in PG/water co-solvent at different PG ratios.

146
10-3
10-2
10-1
100
101
10-5 10-4 10-3 10-2 10-1 100 101 102 103
0.1950.5110.7390.9661.55
J(t)
, m2 /N
time, sec
Sphere Size, µm Rheology
Figure 8. Comparison of the creep compliance obtained from tracer microrheology using
different sphere sizes embedded in 0.9% aqueous polymer solution. The line represents the creep compliance obtained from mechanical rheometry measurement.

147
10-6
10-5
10-4
10-3
10-5 10-4 10-3 10-2 10-1 100 101 102
<∆r2 (t
)> µ
m2
time, sec
1%
5%
3%
2%0.54
0.44
0.39
0.31
0.520.55
0.53
0.54
<∆r2(t)>~tn
n
Figure 9. Evolution of the mean square displacement of 0.996 mm PS spheres in aqueous solution of HASE polymer at different concentrations.

148
10-4
10-3
10-2
10-1
100
101
10-5 10-3 10-1 101 103
J(t)
, m
2 /N
time, sec
1%
5%
3%
2%
Figure 10. Comparison of the creep compliance obtained from mechanical rheometry (symbols) and tracer microrheology (lines) for aqueous solution of HASE polymer at different concentrations.

149
100
101
102
103
104
G',
Pa
1%
2%3%5%
a)
100
101
102
103
10-2 10-1 100 101 102 103 104 105
G",
Pa
ω, rad/sec
1%
2%
3%
5%
b)
Figure 11. Comparison of a) the elastic (G’) and b) the viscous (G”) moduli obtained from
mechanical rheometry (symbols) and tracer microrheology (lines) for aqueous solution of HASE polymer at different concentrations.

150
100
101
102
103
10-2
10-1
100
0.8 1 2 3 4 5 6 7
G' (
Pa) a
nd τ
L (s
ec)
J(t), m2/N
conc, wt.%
τL ~ c0.85
G' ~ c1.74
J(t) ~ c-1.84
Figure 12. Scaling of the elastic modulus (G’), the creep Compliance (J(t)), and the longest relaxation time (τL) with the polymer concentrations. G’ is taken at a fixed frequency 10 rad/s and J(t) at a fixed time 10 sec..

151
10-7
10-6
10-5
10-4
10-3
10-2
10-1
100
10-5 10-4 10-3 10-2 10-1 100 101 102 103
D(t
), µm
2 /sec
time, sec
1%
2%3%5%
(a)
10-7
10-6
10-5
10-4
10-3
10-2
10-1
100
10-3 10-2 10-1
D(t
), µm
2 /sec
<∆r2(t)>1/2, µm
2%
1%
3%5%
(b)
Figure 13. Time dependent diffusion coefficient of 0.966 mm spheres embedded in HASE
polymer solution at different concentrations as a function of (a) time and (b) the average sphere displacement.

CHAPTER 7
MODULATION OF HYDROPHOBIC INTERACTIONS IN ASSOCIATIVE
POLYMERS WITH THROUGH INCLUSION COMPOUNDS AND
SURFACTANTS
Chapter 7 is essentially a manuscript by Ahmed A. Abdala, Alan E. Tonelli and Saad Khan
prepared for submission to Macromolecules

153
Modulation of Hydrophobic Interactions in Associative Polymers with
Inclusion Compounds and Surfactants
Ahmed A. Abdala1 , Alan E. Tonelli2 and Saad A. Khan1*
1 Department of Chemical Engineering, North Carolina State University, Raleigh NC 27695, USA
2 Fiber and Polymer Science Program, North Carolina State University, Raleigh NC 27695, USA
Abstract
In aqueous solution, the hydrophobic segments of a hydrophobically modified alkali-soluble
emulsion (HASE) polymer usually associate forming physically cross-linked networks that
enhance the solution viscosity and viscoelastic properties. While this enhancement attracts
many technological applications, the ability to control the rheology is often desirable. In this
study, we modulate the rheology of a model HASE polymer through the interaction of the
hydrophobic groups with α- and β-cyclodextrin (CDs). The complexation between the
hydrophobic segment (C22-EO40) and CDs are investigated using 1H NMR, differential
thermal analysis (DSC), and thermal gravimetric analysis (TGA). The stoichiometric ratio of
complexation between CDs and the hydrophobic macromonomer is determined from NMR
and the yield data and found to be 5 moles CD/mole hydrophobe. This interaction between
the hydrophobic segment of the HASE polymer and the CD’s reduced the polymer solution
viscosity and dynamic moduli by several orders of magnitude. This reduction in
viscoelasticity is reversibly recovered by the addition of different surfactants that have a
higher propensity to complex with the CD than the hydrophobic segment of the polymer.
* corresponding author; phone: 919-515-4519; fax: 919-515-3465; email: [email protected]

154
7.1 Introduction
Associative polymers are macromolecules with attractive groups either attached to the
ends or randomly distributed along the backbone1. Hydrophobically modified alkali soluble
emulsion (HASE) polymers are one class of water-soluble associative polymers that have a
comb-like structure with pendant hydrophobic groups randomly grafted to a polyelectrolyte
backbone. HASE polymers have several advantages over other associative polymers in terms
of cost and wide formulation latitude2. Consequently, they are currently being used in a range
of applications, including paint formulations, paper coatings, and recently as glycol based
aircraft anti-icing fluids3-5 and also have potential for use in enhanced oil recovery and
personal care products. These polymers are usually added to either modify the rheology of
aqueous solutions or increase the stability of dispersions. Because of their high thickening
ability, a few percent of HASE polymers can increase the solution viscosity by several orders
of magnitude. This thickening ability is predominantly the result of the molecular
hydrophobic associations that occur to minimize contact between the aqueous media and the
hydrophobic segments of the polymer; the hydrodynamic volume expansion upon
neutralization of the carboxylic groups on the polymer backbone also plays a minor role in
this regard.
Despite the importance of hydrophobic interactions to promote viscosity
enhancement in this polymer system, there is also a need to remove these interactions in
many instances. For example, the very high solution viscosity of a concentrated solution is
always associated with difficulty in handling during solution preparation and prior to the end
use stage. The hydrophobic interaction also makes extracting information from

155
characterization techniques, such as light scattering and gel permeation chromatography
(GPC), cumbersome and less accurate. The removal of the hydrophobic interactions would
simplify the information gained from these techniques and assist in understanding the
behavior of these polymers. In addition, the properties of the hydrophobically modified
polymers are usually compared to those of the unmodified parent polymer without
hydrophobes to gain understanding about their microstructures and associating abilities.
However, such an assessment may not be realistic, because modified and unmodified
polymers may differ by more than just the hydrophobic modification6. The ability to compare
modified polymers with that in which the hydrophobes are deactivated would provide a
plausible basis for understanding their behavior.
In this study, we examine a powerful method to control the solution rheology of
HASE polymers by means of removing the hydrophobic interactions using cyclodextrins to
form inclusion compounds6 with the macromonomer part of the HASE polymer.
Cyclodextrins (CDs) are ring-shaped oligosaccharides consisting of 6, 7, or 8 glucose units
(corresponding to α, β, and γ-CD) joined by α-1,4-glycosidic linkages. They have a
hydrophobic inner-core and a hydrophilic outer-shell thus making it possible for the
hydrophobic segments of the polymer to reside inside them and form a complex referred to
as an inclusion compound. Such a notion is supported from previous studies which reveal
cyclodextrins to have superior tendencies to interact with the hydrophobic segments of
different hydrophobically modified water soluble associative polymers, including:
hydrophobically end capped polyethylene oxide7-12, poly(ethylene glycol)s (PEGs) bearing
hydrophobic ends (naphtyl and phenyladamantyl)13, N,N-dimethylacrylamide-hydroxyethyl
156
methacrylate copolymer hydrophobically modified with adamantyl groups14-16,
hydrophobically modified ethyl(hydroxy ethyl) cellulose6, hydrophobically modified,
degradable, poly(malic acid)17, isobutene maleate polymer with pendant hydrophobic 4-tert-
butylanilide18,19, hydrophobically modified ethoxylated urethanes20, hydrophobically
modified alkali soluble emulsion polymers21,22, and hydrophobically modified Dextran23.
Cyclodextrins have also been reported to form inclusion compounds with many nonionic
surfactants24-40.
In this work, we focus on investigating the effects of α- and β- cyclodextrin addition
on rheology of HASE polymer solutions, understanding the mechanism of cyclodextrin
polymer complexation and evaluating the reversibility of these interactions. As such, we
examine initially the extent of rheology changes upon CD addition and the existence, if any,
of quantitative relationship between the molar ratio of CDs to the polymer hydrophobes on
solution rheology. In order to isolate whether the observed changes are due to interactions of
the CD with the macromonomer containing the hydrophobes or with the polymer backbone,
we take a two-prong approach. The interaction between the CDs and the polymer backbone
is studied using the unmodified parent polymer without hydropobes. On the other hand, a
commercially available surfactant, RhodaSurf, was modified to resemble the macromonomer
part and used to simulate the interaction between the macromonomer part of the HASE
polymer with the CDs. A range of techniques including NMR, DSC and TGA are used to
study the complexation and formation of an inclusion compound between the CDs and the
hydrophobic macromonomer Finally, the reversibility of the CD-polymer complexation and
ability to recover the original solution rheology was investigated through addition of
157
nonionic surfactants. A higher affinity of the CD to form inclusion compound with the
surfactant would lead to the release of the polymer from the CD and a concomitant reversal
of rheology.
7.2 Experimental
7.2.1 Materials
The model associative polymer used in this study is a hydrophobically modified
alkali-soluble (HASE) polymer synthesized by UCAR Emulsion Systems (Dow Chemical,
NC) via emulsion polymerization of methacrylic acid (MAA), ethylacrylate (EA) and a
hydrophobic macromonomer (Figure 1). This macromonomer is end capped with C22H45
alkyl hydrophobes that is separated from the backbone by 40 polyethylene oxide (PEO) units.
Details of the preparation method can be found in a previous publication41. In addition to the
hydrophobically modified polymer, an unmodified polymer that has the same structure as the
modified polymer with the C22H45 hydrophobes replaced by an equivalent amount of methyl
groups was also used. Both the modified and the unmodified polymers were prepared in an
identical manner and are believed to have the same molecular weight. The polymer latexes
were dialyzed against de-ionized water using a cellulosic tubular membrane for at least three
weeks with daily change of water. After dialysis, the polymer was freeze-dried and 5%
solutions were prepared and neutralized to pH of 9 ±0.1 using 1 N NaOH with the ionic
strength adjusted to 0.1 M KCl.
C22EO40 surfactant under the commercial name of RhodaSurf was provided by DOW
Chemical Company. The surfactant was modified to resemble the macromonomer part of the
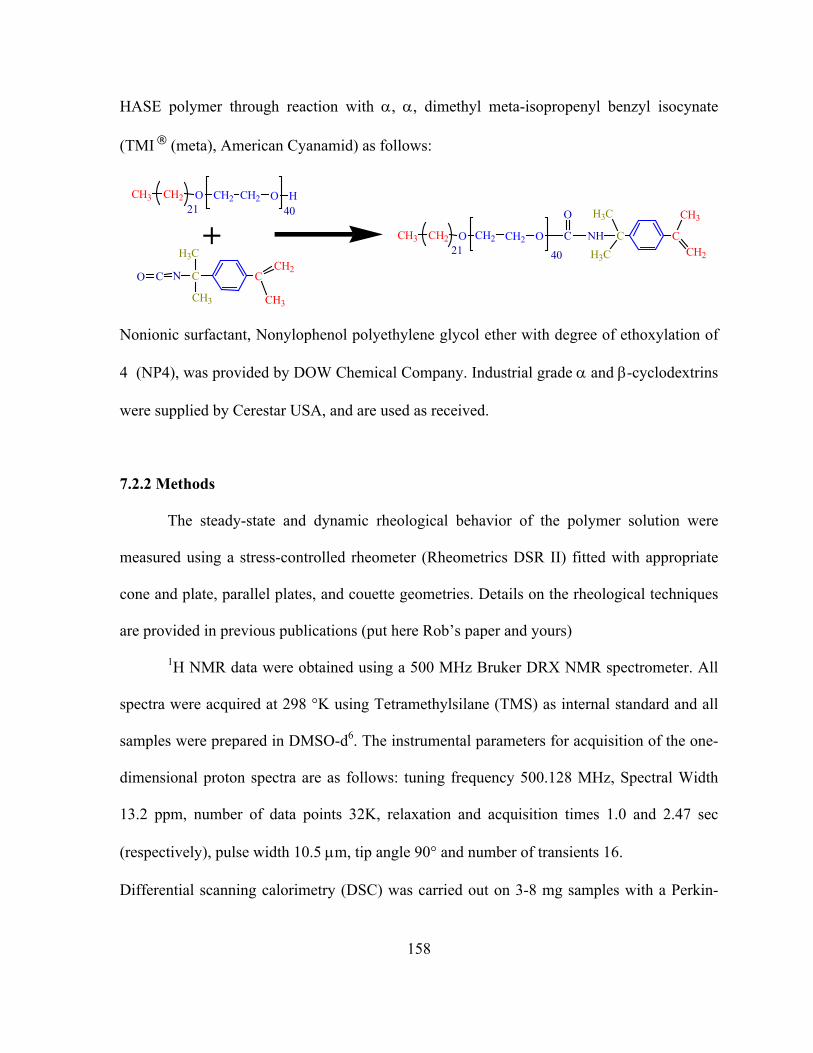
158
HASE polymer through reaction with α, α, dimethyl meta-isopropenyl benzyl isocynate
(TMI ® (meta), American Cyanamid) as follows:
CH3 CH2 O CH2 CH221 40
O H
C
CH3
CH2C
CH3
H3C
NCO
CH3 CH2 O CH2 CH221 40
O C
CH3
CH2
C
H3C
H3CNHC
O
+
Nonionic surfactant, Nonylophenol polyethylene glycol ether with degree of ethoxylation of
4 (NP4), was provided by DOW Chemical Company. Industrial grade α and β-cyclodextrins
were supplied by Cerestar USA, and are used as received.
7.2.2 Methods
The steady-state and dynamic rheological behavior of the polymer solution were
measured using a stress-controlled rheometer (Rheometrics DSR II) fitted with appropriate
cone and plate, parallel plates, and couette geometries. Details on the rheological techniques
are provided in previous publications (put here Rob’s paper and yours)
1H NMR data were obtained using a 500 MHz Bruker DRX NMR spectrometer. All
spectra were acquired at 298 °K using Tetramethylsilane (TMS) as internal standard and all
samples were prepared in DMSO-d6. The instrumental parameters for acquisition of the one-
dimensional proton spectra are as follows: tuning frequency 500.128 MHz, Spectral Width
13.2 ppm, number of data points 32K, relaxation and acquisition times 1.0 and 2.47 sec
(respectively), pulse width 10.5 µm, tip angle 90° and number of transients 16.
Differential scanning calorimetry (DSC) was carried out on 3-8 mg samples with a Perkin-

159
Elmer DSC-7 thermal analyzer equipped with a cooler system. A heating rate of 10° C/min
was employed and an indium standard was used for calibration. Before each scan, samples
were annealed at 200° C for 3 minutes to erase thermal history, followed by a flash
quenching to -100° C at 500° C/min. Thermal gravimetric analysis (TGA) measurements
were carried out on a Perkin-Elmer Pyris 1 Thermogravimetric Analyzer. Approximately 20
mg samples were heated from 25-600° C and the weight loss was recorded as function of
sample temperature.
7.3 Results and Discussion
7.3.1 Effect of CDs on solution rheology
The effects of both α- and β-CD on the steady shear viscosities of a 3% HASE
solution are shown in Figures 2a and b, respectively. With the addition of CDs, the steady
shear viscosities of the polymer solutions decrease dramatically. Moreover, at about 15 moles
of CD per hydrophobe, it seems that there is no further reduction in the solution viscosity for
both α− and β-CD; however, the final viscosity obtained using α-CD is about one decade
lower that that obtained using β-CD.
Similar findings are obtained from dynamic rheological measurements. Figures 3a
and b demonstrate the effect of α and β-CD on the frequency spectrum of the elastic (G’) and
viscous (G’’) loss moduli of 3% HASE polymer solutions. The addition of either α or β-CD
reduces both the elastic and viscous moduli and increases their dependence on frequency.
The decrease in the elastic modulus reflects a reduction in the number of active junctions
between HASE polymer chains due to the deactivation of the hydrophobic groups; transient

160
network theory predicts that the elastic modulus is directly proportional to the number of
active junctions46. The higher dependence on the frequency is a sign of weaker network
structures due to the reduction of the number of active hydrophobes. Additional CD above
that of 15 moles of CD per mole of hydrophobe has no effect on either the level of the
moduli or on their dependence on frequency. Moreover, the maximum reduction in the
moduli, vis a vis the final moduli values, are about 2 decades lower with α−CD han those
obtained with β-CD. These results are consistent with the steady shear findings.
The decrease in solution viscoelasticity upon addition of CD suggests that the CD
interacts with either the polymer backbone, the hydrophobic macromonomer or both. To
determine if any interactions occur between the CDs and the polymer backbone, an
unmodified polymer with similar structure and molecular weight to those of the HASE
polymer was used. The unmodified polymer was synthesized in the same manner that the
HASE polymer was synthesized, but with the C22 hydrophobes replaced with an equivalent
amount of CH3 groups. Figures 4a and b illustrates the effects of adding varying amounts of
β-CD to an 1% unmodified polymer solution on both the steady shear viscosity and the
dynamic moduli, respectively. We find that the addition of β-CD, regardless of the amount
added, has no effect on the steady shear viscosity of the unmodified polymer solution nor on
the frequency spectrum of the dynamic moduli. This suggests that that there are no
interactions between the β-CD and the polymer backbone, and any effect of CDs on the
rheology of the HASE solution occurs primarily from the interaction between the CDs and
the hydrophobic segments of the HASE polymer.

161
7.3.2 Macromonomer-cyclodextrin complexation
An extensive array of experiments were undertaken to decipher the interaction
between α and β-CD and the macromonomer part of the polymer, the structure of which
resembles that of a nonionic surfactant with the C22 alkyl group as the hydrophobic segments
and the 40 EO units as the hydrophilic segment of the surfactant. As a first step, a
macromonomer -CD inclusion compound (IC) was formed by mixing 1% macromonomer
aqueous solution with 1% α or β−CD aqueous solution to yield different CD/macromonomer
molar ratios (0.5 to 50). Upon the addition of α-CD to the macromonomer solution, a cloudy
solution was formed immediately. In contrast it took several hours after the addition of β-CD
for the solution to become cloudy. The cloudiness of the solution is a sign of complexation
between the CD and the hydrophobic macromolecule. Three days after mixing the two
components, the complexes were isolated by centrifugation, filtration, washing with water,
re-centrifugation, re-filtration, and freeze-drying.
Figure 5 shows the IC yield as function of the CD to macromonomer molar ratio for
α-CD and β-CD. The IC yield was calculated as the weight of the dried IC divided by the
total weight of the surfactant and the CD. As seen from the figure that the IC yield increases
with increasing CD to macromonomer molar ratio reaching a maximum at a ratio of about 5
moles of CD to one mole of macromonomer before starting to decrease. This behavior is
suggestive of the complexation process being stoichiometric. Figure 5 also reveals that α-
CD gives a higher yield compared to β-CD. The difference in the yield between α and β-CD
can be attributed to the difference in the annular size of the two. α-CD has a ring size of
about 5.7 Å in which the hydrophobic segments of the macromonomer would have

162
a snug fit. On the other hand, the annular size of β-CD is larger (~ 7.8 Å)42, giving the
macromonomer sufficient room to move in and out In fact, it has been reported by others as
well that while α-CD was able to form inclusion compounds with polyethylene glycol and
oligoethylene, β-CD was not 43.
A larger maximum yield value of the α-CD-macromonomer complex (~65%)
compared to the β-CD-macromonomer complex (~54%) is consistent with the rheology data
in Figures 2 and 3 which indicate that α-CD is more effective in deactivating the
hydrophobic groups and reducing viscosity and modulus. However, the ratio of CD to
hydrophobes where the maximum viscosity/modulus reduction occurs, 15 to 1, is different
than the stiochiometric ratio, 5 to 1, where the maximum yield is obtained. This can
nonetheless be easily explained if the yield is calculated based on the macromonomer weight
rather than weight of both the macromonomer and the cyclodextrin. If we do this, the yield
increases continuously rather than passing through a maximum.
In order to interpret the CD/hydrophobe ratio at which the maximum reduction in
viscosity/moduli occurs, we can calculate the % of active hydrophobes (hydrophobes that are
not complexed with CD) as function of the molar ratio of added CD/hydrophobes. This can
be done following the scheme:
22 40 5 (CD C EO Cn Dm ∼+ 22 40 (( -5 ) * ) (1 - )C EO m n CD n∼ + + 22 40 )C EO ∼
Using the initial molar ratio of CD/macromonomer (m) and the yield of their complex
(y), the % active hydrophobes can be calculated by assuming a 5/1 stoichiometric
complexation ratio as follows:

163
Moles
Moles
1 1 , ( ) ( * )
, ( ) (5* )
%
macroCD
macroCD
Moles of macromonomer in gram of feed Fm M M
yMoles of complexed macromonomer pM M
Active hydrophobes
=+
=+
*100F PF
−=
where, MCD is the molecular weight of the CD and Mmacro is the macromonomer molecular
weight. The % active hydrophobes based on the yield data and calculated according to the
this scheme is shown in Figure 6. We observe a rapid initial decrease in the % active
hydrophobes followed by a very slow decrease at CD/macromonomer molar ratios above 15.
We also find that the % active hydrophobe at a CD/ hydrophobe molar ratio of about 15 is
less than 10% for α-CD compared to about 20% for β-CD. These results explain the
difference in the effects produced by α- and β-CD on the steady shear viscosity and dynamic
moduli of the concentrated HASE solutions.
7.3.2.1 Characterization and interaction modes of CD-macromonomer ICs
The DSC technique was used to confirm complex formation and to determine
whether the “inclusion compound” separated via centrifugation yielded a compound with no
free macromonomer. Figures 7a and b show the DSC thermograms of the macromonomer, α-
CD, β -CD and their ICs. The DSC thermograms of the macromonomer-α-CD and
macromonomer-β-CD complexes show no endothermic peak where the melting point of the
free macromonomer is expected. This confirms the absence of the free macromonomer in the
ICs38.

164
The complexation between CDs and the macromonomer also impacted the thermal
stability of both CD’s and the macromonomer. Figures 8a and b show the TGA data of α-
CD, β –CD, macromonomer and their ICs. The TGA data for α- and β-CD show the onset of
weight loss at about 315° C and 325° C, respectively. Both α and β-CD have a residue of
about 20% at 500°C. On the other hand, the macromonomer has a higher temperature onset
for weight loss of about 400° C and much lower residue, about 1% at 500° C. The
macromonomer-CD ICs have an onset between that of the macromonomer and the CDs
(about 340° C) and a residue of about 10% at 500° C. The improved thermal stability of the
CDs due to the complexation as compared to the CDs by themselves has been observed in
other cyclodextrin ICs 44,45.
Figure 8 also reveals that the macromonomer-CD ICs have a multistep decomposition
profile. After the onset of weight loss, there is a rapid decomposition up to about 40%
residue. This is followed by a very slow but small decomposition regime for a few weight %
at about 400° C, and a final rapid decomposition until a final residue of about 10% is
reached. Similar multistep profiles have been observed with 4-arm polyethylene glycol-α-CD
IC, 4-arm polyethylene glycol-γ-CD IC45 and C4π C4EO8-α-CD IC44 and has been attributed
to the dethreading of the guest (macromonomer) during the TGA run 44.
Further insights into the complexation between the CDs and the macromonomer has
been obtained using 1H NMR. Figures 9a and b show the 1H NMR spectra for α-CD, β-CD
the macromonomer and their IC recorded in DMSO-d6. Both the methylene protons in the
alkyl C22 and EO40 in the ICs are shifted downfield as shown in Figures 9 and 10. The
complexation stoichiometric ratio can be obtained by comparing the integral area under the

165
H1 proton for the CD (4.80 - 4.82 ppm) with that of the methylene protons of the alkyl C22
from the surfactant (1.20 ppm) in the IC spectrum. These peaks are fully resolved and free
from any overlap with other peaks. The stoichiometric ratio obtained from the 1H NMR data
is about 5, which is consistent with that obtained from the yield data (Figure 5). Moreover,
the formation of inclusion compounds is confirmed by the 1H NMR spectra;. a very
significant shift is observed for cyclodextrin protons labeled as OH2 and OH3. A smaller
shift is observed for the other cyclodextrin protons and both the aliphatic and the ethylene
oxide protons on the macromonomer (Figure 10).
Two intriguing issues that remain to be resolved are how much of the macromonomer
is encapsulated by the CD and whether such complexation is static or dynamic in nature.
Because the height of each CD bracelet is ~7.9Å42, a fully extended macromonomer would
require ~20-25 threaded CDs for complete coverage. However, as noted above we observe a
CD-macromonomer complex stoichiometry of ~5, so only roughly 1 15 4− of the C22-EO40
chain is complexed by the CDs. Although tentative, we can offer further suggestions
regarding the complexation of the macromonomer with CDs based on the 1H NMR
observations presented in Figures 9 and 10. Let us consider the following two scenarios:(i)
all CDs are moving along and possibly threading onto and off of the C22-EO40-
macromonomer chains rapidly on the NMR timescale (MHz), and (ii) some of the CDs are
rapidly moving along and possibly threading and dethreading onto and off of the
macromonomer as in (i), whereas the remaining CDs remain complexed with the
macromonomer for longer times. If we reasonably suppose that CDs may only thread the
macromonomer chain from the C22 end, and not from the bulky TMI, (meta) end (see the

166
macromonomer structure in Figure 1)), then scenario (i) would be expected to evidence 1H
NMR spectra for the macromonomer-CD complexes with CH2 protons from both the C22 and
EO40 portions of the macromonomer chains resonating downfield from their positions in the
free macromonomer. This appears to be the case for the C22 CH2 protons as seen in Figure
10a. However, in Figure 10b we note that the CH2 protons belonging to the EO40 portion of
the complexed macromonomers, while also shifted downfield from their uncomplexed
resonance frequencies, exhibit even higher field shoulders on their main resonance peaks.
This is suggestive of two different populations of EO40 CH2 protons, with the majority of EO
units experiencing rapidly moving CDs, while the smaller remaining population are
complexed and covered by the CDs for a longer period of time, as described in scenario (ii.).
We therefore suggest, that at any given time 1 15 4− of the C22EO40 macromonomer
chain is complexed and therefore covered by CDs, with CDs able to rapidly move along most
of the C22EO40 chain and possibly thread/unthread onto/from the C22 end. In addition, a
minor population of the EO40 macromonomer units, which are likely those closest to the
bulky TMI, (meta) end, remain complexed and covered by CDs for longer times. Future
NMR relaxation studies will be necessary to substantiate the suggestions we have tentatively
offered here concerning the detailed characteristics of the macromonomer - and HASE-CD
complexes.
7.3.3 Recovery of Solution Rheology
In the previous sections, we present an approach to reduce the viscoelasticity of
HASE solutions through complexation with CDs to form inclusion compounds. This

167
complexation yields a solution with a final viscosity or dynamic modulus several orders of
magnitude lower than the original solution. The question that needs to be resolved is whether
the HASE solution can recover its viscoelastic characteristics and to what extent. Since the
macromonomer part of the HASE polymer interacts with the CDs, the addition of more
macromonomers to the HASE solution that is complexed with CD would shift the
equilibrium between the polymer and the CDs away from their complexed state, as CD-
macromonomer complexes are formed. This in turn would free some of the hydrophobic
groups in the polymer and enhance solution viscoelasticity.
To test this hypothesis, we have added different amounts of macromonomer to a
HASE solution complexed with CD. Figures 11a and b show the effect of macromonomer
addition on the steady shear viscosity and dynamic moduli, respectively, of a 3% HASE that
was complexed with 20 moles β-CD per hydrophobes. The addition of the macromonomer
increases the solution viscosity and a complete recovery of the zero shear viscosity is reached
with about 4.5 mM macromonomer. The macromonomer addition also increases both the
elastic and loss modulus and reduced their dependence on frequency. In fact, with 4.5 mM
macromonomer the plateau elastic modulus reaches that of the original solution. Further
macromonomer addition yields a decrease in the steady and viscoelastic properties possibly
because the free macromonomer concentration reached its upper critical limit.
The effect of a nonionic surfactant, nonylophenol surfactant with 4 EO units (NP4),
on the steady shear viscosity and the dynamic moduli of 3% HASE solution complexed with
20 moles α-CD per hydrophobes was also examined and is illustrated in Figure 12. With
about 40 mM surfactant the zero shear viscosity is fully recovered, but the viscosity profile is

168
different than that of the original solution. With added surfactant, the solution shows a higher
degree of shear thinning compared to the original solution. Similar findings are also obtained
from the dynamic measurements, with an increase in the level of the dynamic moduli and
lower dependence on frequency with the addition of NP4 surfactant. A complete recovery of
the plateau modulus has not been reached in this case.
Despite the recovery of the zero shear viscosity and the plateau modulus, there are,
however, differences in the steady shear profile and dynamic spectrum of the recovered and
the original solutions. The differences that are observed in either the macromonomer or NP4
surfactant case is a result of the fact that the added macromonomer or NP4 interacts with the
HASE polymer47.
7.4 Conclusions
The rheology of aqueous HASE solutions can be controlled by complexation of the
normally associating hydrophobic macromonomer components with α- and β-cyclodextrins.
The steady shear viscosity and dynamic moduli of the HASE solutions can be reduced by
several orders of magnitude upon addition of the cyclodextrins. Furthermore, it is possible to
reversibly recover the high viscoelastic characteristics of HASE solutions containing
cyclodextrins by treatment with surfactants that compete with the hydrophobic portions of
HASE for complexation with the cyclodextrins. As a consequence, cyclodextrins and
surfactants in combination can be judiciously employed to lower the viscoelasticity of HASE
solutions during processing, while subsequently recovering the high viscosity and
viscoelastic properties that are sought in their applications.

169
Acknowledgement:
The authors gratefully acknowledge the support and help of Dow Chemical
Company, UCAR Emulsions, for providing various samples for this study.

170
7.5 References:
1. Rubinstein, M.; Dobrynin, A. V. Solutions of Associative Polymers. Trends in Polymer Science, 1997. 5(6): p. 181-186.
2. Tirtaatmadja, V.; Tam, K. C.; Jenkins, R. D. Effects of Temperature on the Flow
Dynamics of a Model HASE Associative Polymer in Nonionic Surfactant Solutions. Langmuir, 1999. ASAP.
3. Jenkins, R. D. B., D. R.; Lightfoot, R. H.; Boluk, M. Y. Aircraft Anti-Icing Fluids
Thickened by Associative Polymers. WO Patent 9324543, 1993.
4. Jenkins, R. D. B., D. R.; Lightfoot, R. H.; Boluk, M. Y. Glycol-Based Aircraft Anti-Icing Fluids Thickened by Associative Polymers Containing Hydrophobe-Bearing Macromonomers. US Patent 5681882, 1997.
5. Carder, C. H.; Garska, D. C.; Jenkins, R. D.; McGuiness, M. J. Aircraft Deicing/Anti-
Icing Fluids Thickened by Associative Polymers. US Patent 5708068, 1998. 6. Karlson, L.; Thuresson, K. and Lindman, B. Investigation of the Complex Formation
between Hydrophobically Modified Ethyl(hydroxy ethy) Cellulose and Cyclodextrin. Carbohydrate Polymers 2002, 50(3), 219-226.
7. Amiel, C.; David, C.; Renard, E.; Sebille, B. Macromolecular Assemblies Generated
by Inclusion Complexes between Amphipathic Polymers and β-Cyclodextrin Polymers in Aqueous Media, Polymer Preprints (American Chemical Society, Division of Polymer Chemistry) 1999, 40, 207-208.
8. Amiel, C.; Moine, L.; Brown, W.; Renard, E.; Guerin, P.; Sebille, B Associations of
Amphiphilic Degradable Polymers with Β-Cyclodextrin Polymers: pH-Dependent Network, Proceedings of the International Symposium on Cyclodextrins, 9th, Santiago de Comostela, Spain, May 31-June 3, 1998 1999, 81-84.
9. Amiel, C.; Sebille, B. New Associating Polymer Systems Involving Water-Soluble β-
Cyclodextrin Polymers, J. Inclusion Phenom. Mol. Recognit. Chem. 1996, 25, 61-67.
10. Amiel, C.; Sandier, A; Sebille, B.; Valvvat, P.; Wintagens, V. Association Between Hydrophobically End-Capped Polyethylene Oxide and Water Soluble β-Cyclodextrin Polymers, int. J. Polymers Analysis & Characterization 1995, 1, 289-300.
11. Sandier, A.; Brown, W.; Mays, H.; Amiel, C. Interaction between an Adamantane
End-Capped Poly(ethylene oxide) and a β-Cyclodextrin Polymer, Langmuir 2000, 16, 1634-1642.

171
12. Amiel, C.; Moine, L.; Sandier, A.; Brown, W.; David, C.; Hauss, F.; Renard, E.; Gosselet, M.; Sebille, B. Macromolecular Assemblies Generated by Inclusion Complexes between Amphipathic Polymers and β-Cyclodextrin Polymers in aqueous media, ACS Symposium Series 2001, 780, 58-81.
13. Gosselet, N. M.; Naranjo, H.; Renard, E. Amiel, C.; Sebille, B. Association of Poly-
N-[tris(hydroxymethyl)methyl] Acrylamide with a Water Soluble β-Cyclodextrin Polymer, European Polymer Journal 2002, 38, 649-654.
14. Gosselet, N. M.; Borie, C.; Amiel, C.; Sebille, B. Aqueous Two Phase Systems from
Cyclodextrin Polymers and Hydrophobically Modified Acrylic Polymers, J. Dispersion Sci. Technol. 1998, 19, 805-820.
15. Gosselet, N. M.; Beucler, F.; Renard, E.; Amiel, C.; Sebille, B. Association of
Hydrophobically Modified Poly (N,N-dimethylacrylamide hydroxyethyl methacrylate) with Water Soluble β-Cyclodextrin Polymers, Colloids and Surfaces, A: Physicochemical and Engineering Aspects 1999, 155, 177-188.
16. Moine, L.; Amiel, C.; Brown, W.; Guerin, P. Associations between a hydrophobically
modified, degradable, poly(malic acid) and a .β.-cyclodextrin polymer in solution, Polymer International 2001, 50, 663-676.
17. Wenz, G.; Weickenmeier, M.; Huff, J. Association thickener by host-guest interaction
of .β.-cyclodextrin polymers and guest polymers, ACS Symposium Series 2000, 765, 271-283
18. Weickenmeier, M.; Wenz, G.; Huff, J. Association Thickener by Host Guest
Interaction of a β-Cyclodextrin Polymer and Polymer with Hydrophobic Side-Groups., Macromol. Rapid Commun., 1997,. 18(12), 1117-1123.
19. Ma, Z.; Glass, J. E. Complexations of β-Cyclodextrin with Surfactants and
Hydrophobically Modified Ethoxylated Urethanes. In Analytical application in adsorption measurements. ACS Symposium Series, 2000. 765(Associative Polymers in Aqueous Media): p. 254-270.
20. Gupta, R.K.; Tam, K. C.; Ong, S. H.; Jenkins, R. D. Interactions of Methylated β-
Cyclodextrin with Hydrophobically Modified Alkali-Soluble Associative Polymers (HASE): Effect of Varying Carbon Chain Length. In Proc. Int. Congr. Rheol., 13th. 2000.
21. Islam, M. F.; Jenkins, R. D.; Bassett, D. R; Lau, W.; Ou-Yang, H. D. Single Chain
Characterization of Hydrophobically Modified Polyelectrolytes Using Cyclodextrin/Hydrophobe Complexes, Macromolecules, 2000, 2480-2485.

172
22. Amiel, C., Renard, E.; Sandier, A.; Moine, L.; Gosselet, M.; Sebille, B. Macromolecular assemblies generated by inclusion complexes between amphipathic polymers and b-cyclodextrin polymers in aqueous media. Book of Abstracts, 218th ACS National Meeting, New Orleans, Aug. 22-26, 1999.
23. Ahmed, M.O. Comparison of Impact of the Different Hydrophilic Carriers on the
Properties of Piperazine-Containing Drug. European Journal of Pharmaceutics and Biopharmaceutics, 2001, 51(3), 221-225.
24. Alexandridis, Paschalis; Tsianou, M.; Ahn, S. Effect of Cyclodextrins on Polymer-
Surfactant Interactions in Aqueous Solution. Proceedings of the International Symposium on Controlled Release of Bioactive Materials, 2000, 1134-1135.
25. Alvarez, A. R; Garcia-Rio, L.; Herves, P.; Leis, J. R.; Mejuto, J. C.; Perez-Juste, J.
Basic Hydrolysis of Substituted Nitrophenyl Acetates in β-Cyclodextrin/Surfactant Mixed Systems. Evidence of Free Cyclodextrin in Equilibrium with Micellized Surfactant. Langmuir, 1999, 15(24), 8368-8375.
26. Buschmann, H. J.; Cleve, E.; Schollmeyer, E. The Interactions between Nonionic
Surfactants and Cyclodextrins Studied by Fluorescence Measurements. Journal of Inclusion Phenomena and Macrocyclic Chemistry, 1999, 33(2), 233-241.
27. Cserhati, T.; Oros, G.; Szejtli, J. Effect of Cyclodextrins of Nonionic Surfactants:
Reduction of Surface Activity and Phytotoxicity, Tenside, Surfactants, Deterg., 1992, 29(1), 52-57.
28. Cserhati, T.; Forgacs, E. Charge-Transfer Chromatographic Study of the Interaction
of Non-ionic Surfactants with Hydroxypropyl-β-Cyclodextrin. J. Chromatogr., A, 1994, 665(1), 17-25.
29. Eli, W.; Chen, W.; Xue, Q. Determination of Association Constants of Cyclodextrin-
Nonionic Surfactant Inclusion Complexes by a Partition Coefficient Method, Journal of Inclusion Phenomena and Macrocyclic Chemistry, 2000, 38(1-4), 37-43.
30. Hodul, P.; Duris, M.; Kralik, M. Inclusion Complexes of β-Cyclodextrin with Non-
ionic Surfactants in Textile Preparation Processes., Vlakna Text., 1996, 3(1), 15-19. 31. Katougi, Y.; Saito, Y.; Hashizaki, K.; Taguchi, H.; Ogawa, N. Comparison of the
Solubilizing Ability of Cyclodextrins and Surfactants for (+)-α.-pinene. Journal of Dispersion Science and Technology, 2001, 22(2 & 3), 185-190.
32. Oros, G.; Cserhati, T.; Szejtli, J. Cyclodextrins Decrease the Phytotoxicity of
Nonionic Tensides. Acta Agron. Hung., 1989, 38(3-4), 211-17.
173
33. Rohrbach, R. P.; Allenza, P.; Schollmeyer, J.; Oltmann, H. D. Biodegradable Polymeric Materials and Articles Fabricated Therefrom, US Patent 9106601, 1991.
34. Saito, Y.; Katougi, Y.; Hashizaki, K.; Taguchi, H.; Ogawa, N. Solubilization of (+)-
.α-Pinene by Cyclodextrin/Surfactant Mixed Systems. Journal of Dispersion Science and Technology, 2001, 22(2 & 3), 191-195.
35. Saket, M. Improvement of Solubility and Dissolution Rate of Meclozine
Hydrochloride Utilizing Cyclodextrins and Non-ionic Surfactant Solutions Containing Cosolvents and Additives. Acta Technol. Legis Med., 1997, 8(1), 33-48.
36. Topchieva, I. N.; Karezin, K. I. Molecular Self-assembly in Nonionic Surfactant-
Cyclodextrin Systems. Colloid Journal (Translation of Kolloidnyi Zhurnal), 1999, 61(4), 514-519.
37. Topchieva, I.; Karezin, K. Self-Assembled Supramolecular Micellar Structures Based
on Non-ionic Surfactants and Cyclodextrins. Journal of Colloid and Interface Science, 1999, 213(1), 29-35.
38. Wilson, L. D.; Verral, R. E. 1H NMR Study of Cyclodextrin-Hydrocarbon Surfactant
Inclusion Complexes in Aqueous Solutions. Canadian Journal of Chemistry, 1998, 76(1), 25-34.
39. Woo, R. A.; Trinh, T.; Cobb, D. S.; Schneiderman, E.; Wolff, A. M.; Ward, T. E.;
Chung, A. H.; Reece, S.; Rosenbalm, E. L. Uncomplexed Cyclodextrin Compositions for Odor Control and Refreshening of Garments. US Patent 9,856,888, 1998.
40. Shay, G. D.; Kail, J. E. Alkali-Soluble Latex Thickener. US Patent 4514552, 1985. 41. Szejtli, J. Introduction and General Overview of Cyclodextrin Chemistry. Chem. Rev.,
1998, 98, 1743-1753. 42. Harada, A.; Suzuki, S; Okada, M.; Kamachi, M. Preparation and Characterization of
Inclusion Complexes of Polyisobutylene with Cyclodextrins. Macromolecules, 1996, 29, 5611-5614.
43. Olosn, K.; Chen, Y.; Baker, G. L. Inclusion Complexes of α-Cyclodextrin and (AB)n
Block Copolymers. Journal of Polymer Science, Part A: Polymer Chemistry, 2001, 39(16), 2731-2739.
44. Jia, H.; Goh, S. H.; Valiyaveettil, S. Inclusion Complexrs of Multiarm Poly(ethylene
glycol) with Cyclodextrins. Macromolecules 2002, 35(5), 1980-1983.

174
45. Tanaka, F.; Edwards, S. F. Viscoelastic Properties of Physically Crosslinked Networks. 1. Transient Network Theory, Macromolecules 1992, 25 (5), 1516-23.
46. English, R. J.; Laurer , J. H.; Spontak, R. J.; Khan, S. A. Hydrophobically Modified
Associative Polymer Solutions: Rheology and Microstructure in the Presence of Nonionic Surfactant, Ind. Eng. Chem. Res. 2002, ASAP article.

175
CH2 C
CH3
COOH
H2C C
H
C OOCH2CH3
CH2 C
CH3
CH3C CH3NHCOO
CH2H2CO
x
y
Rp
z
Methacrylic Acid
Ethyl Acrylate
Macromonomer Figure 1. Schematic representation of a HASE associative polymer and the molecular
constitution used in this study. R refers to the C22H45 hydrophobes, p=40, and. x, y, z, p = x/y/z = 43.57/56.21/0.22 by mole.

176
10-1
100
101
102
103
η, P
a.s
03
5
710
12
1520
25
(a)
10-1
100
101
102
103
10-2 10-1 100 101 102
η, P
a.s
03
5
10
202515
γ, s-1.
(b)
Figure 2: Effects of addition of a) α-CD and b) β-CD on the steady shear viscosity of 3%
HASE associative polymer solution. Numbers correspond to the moles of cyclodextrin per moles of hydrophobes.

177
10-4
10-3
10-2
10-1
100
101
102
G',
G",
Pa
No CD
5
10
20
25
(a)
10-2
10-1
100
101
102
10-2 10-1 100 101 102
G',
G",
Pa
ω, rad/s
No CD
5
10
15
25
(b)
Symbols G'Lines G"
Symbols G'Lines G"
Figure 3: Effects of addition of a) α-CD and b) β-CD on the dynamic elastic (G’) and viscous
(G”) moduli of a 3% HASE associative polymer solution. Numbers correspond to moles of cyclodextrin per hydrophobes.

178
10-2
10-1
100
100 101 102 103
071725
η, P
a.s
β CD/H ydrophobe
γ , s-1.
(a)
10-3
10-2
10-1
100
101
10-1 100 101 102
071725
G',
G",
Pa
ω , rad/sec
G '
G "
β -CD/hydrophobes
(b)
Figure 4: Effect of addition of various amounts of β-CD amount on the a) steady shear
viscosity and b) dynamic elastic (G’) and viscous (G”) moduli of 1% unmodified polymer that is analogous to the HASE polymer in this study but with the hydrophobic groups replaced by CH3 groups.

179
0
10
20
30
40
50
60
70
0 10 20 30 40 50
Yie
ld, %
mole CD/mole Macromonomer
α-CD
β-CD
Figure 5.Yield of macromonomer-CD inclusion complexes as a function of the molar ratio of
CD/macromonomers.
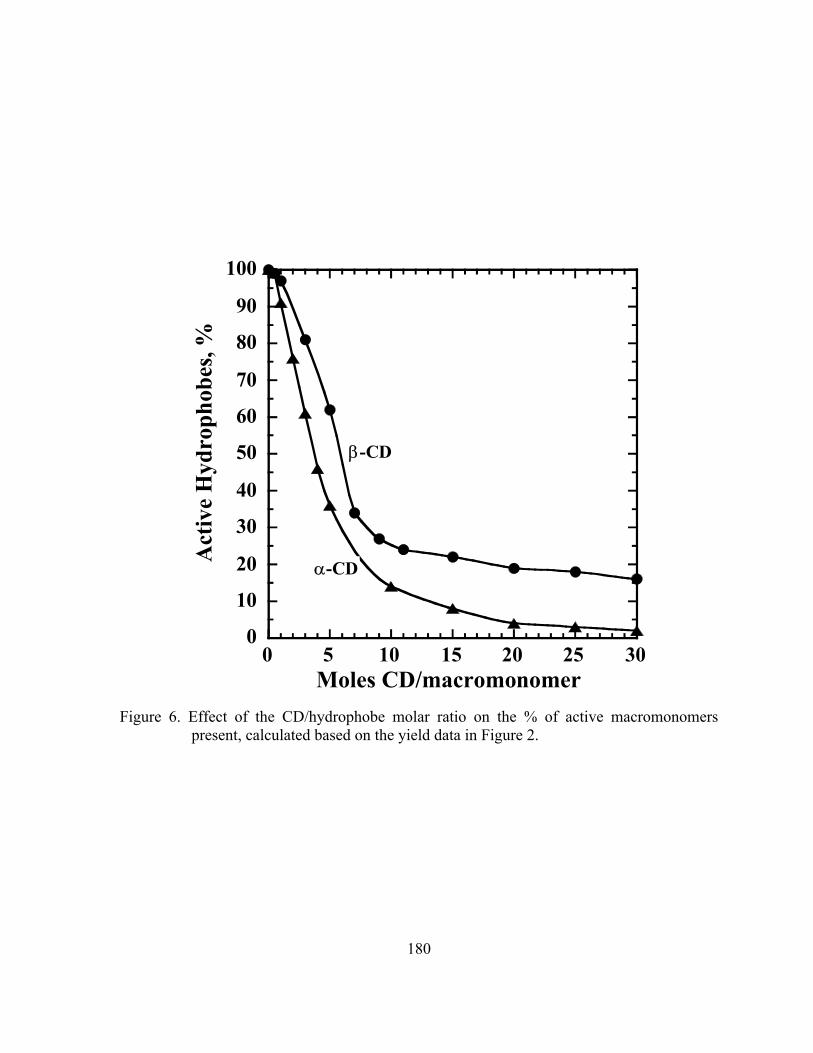
180
0
10
20
30
40
50
60
70
80
90
100
0 5 10 15 20 25 30
Act
ive
Hyd
roph
obes
, %
Moles CD/macromonomer
α-CD
β-CD
Figure 6. Effect of the CD/hydrophobe molar ratio on the % of active macromonomers
present, calculated based on the yield data in Figure 2.

181
α-Cyclodextrin
α-CD-Macromonomer IC
Macromonomer
Hea
t Flo
w (E
ndo
up)
25 50 75 100 125 150 175 200Temperature, °C
Macromonomer
β-CD-Macromonmer IC
β-Cyclodextrin
(b)
(a)
Figure 7. DSC scans of a) α-CD, macromonomer, and their inclusion compound and b). β-
CD, macromonomer, and their inclusion compound. The scans shown are the second heatings taken after heating the samples at 200° C for 3 minutes to erase any thermal history.

182
0
20
40
60
80
100
Wei
ght%
α-CD-Macromonomer IC
α-CD
Macromonomer
(a)
0
20
40
60
80
100
0 100 200 300 400 500 600
Wei
ght%
Temperature, °C
β-CD-Macromonomer IC
β-CD
Macromonomer
(b)
Figure 8. TGA scans for a) α-CD, macromonomer and their inclusion compounds and b) β-
CD, Macromonomer and their inclusion compounds. Samples were heated at 20° C/min under nitrogen.
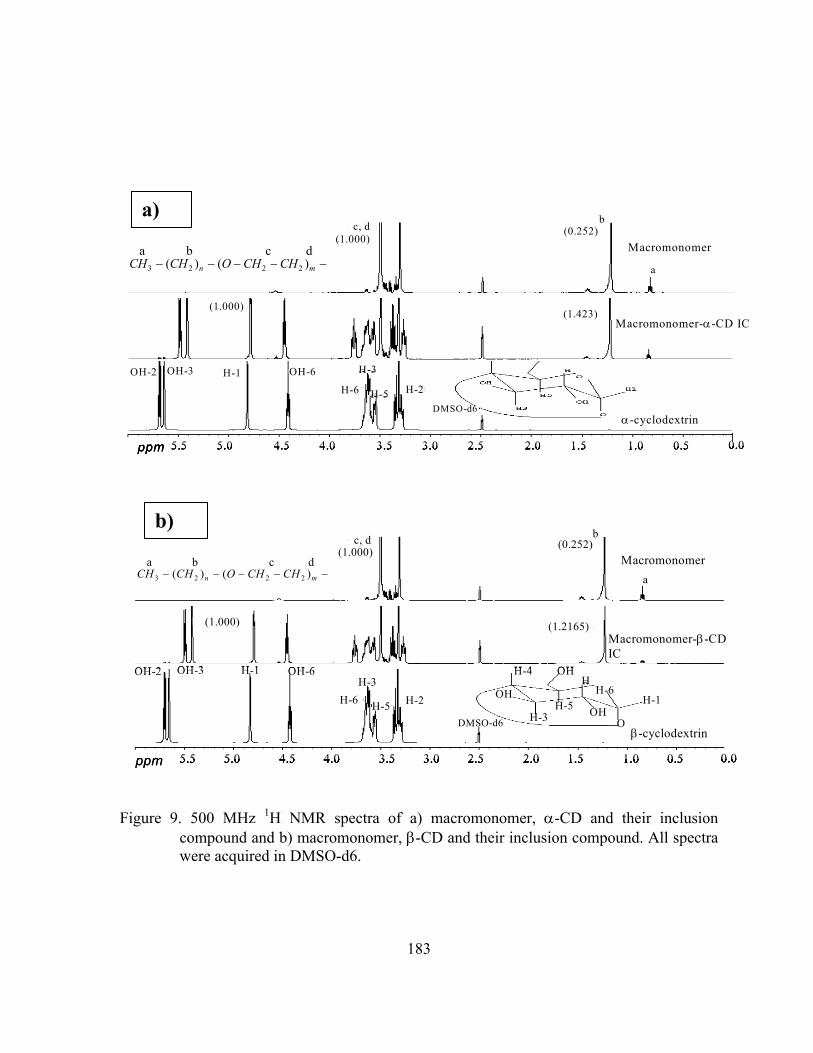
183
Figure 9. 500 MHz 1H NMR spectra of a) macromonomer, α-CD and their inclusion compound and b) macromonomer, β-CD and their inclusion compound. All spectra were acquired in DMSO-d6.
ppm 5.5 5.0 4.5 4.0 3.5 3.0 2.5 2.0 1.5 1.0 0.5 0.0
β-cyclodextrin
Macromonomer-β-CD IC
Macromonomer
OH-6H-1OH-3OH-2
H-6H-3
H-5 H-2
DMSO-d6
H-6
H-3H-5 H-1
H-4
OH
OH
OHO
H
(1.000) (1.2165)
(1.000)c, d (0.252)
b
a3 2 2 2
a b c d( ) ( )n mCH CH O CH CH− − − − −
ppm 5.5 5.0 4.5 4.0 3.5 3.0 2.5 2.0 1.5 1.0 0.5 0.0
β-cyclodextrin
Macromonomer-β-CD IC
Macromonomer
OH-6H-1OH-3OH-2
H-6H-3
H-5 H-2
DMSO-d6
H-6
H-3H-5 H-1
H-4
OH
OH
OHO
H
(1.000) (1.2165)
(1.000)c, d (0.252)
b
a3 2 2 2
a b c d( ) ( )n mCH CH O CH CH− − − − −
5.5 5.0 4.5 4.0 3.5 3.0 2.5 2.0 1.5 1.0 0.5 0.05.5 5.0 4.5 4.0 3.5 3.0 2.5 2.0 1.5 1.0 0.55.5 5.0 4.5 4.0 3.5 3.0 2.5 2.0 1.5 1.0 0.5 0.00.0
β-cyclodextrin
Macromonomer-β-CD IC
Macromonomer
OH-6H-1OH-3OH-2
H-6H-3
H-5 H-2
DMSO-d6
H-6
H-3H-5 H-1
H-4
OH
OH
OHO
H
(1.000) (1.2165)
(1.000)c, d (0.252)
b
a3 2 2 2
a b c d( ) ( )n mCH CH O CH CH− − − − −
b)
Macromonomer(1.000)
c, d (0.252)b
a3 2 2 2
a b c d( ) ( )n mCH CH O CH CH− − − − −
α-cyclodextrin
Macromonomer-α-CD IC
OH-6H-1OH-3OH-2
H-6 H-5 H-2
DMSO-d6
(1.000)(1.423)
ppm 5.5 5.0 4.5 4.0 3.5 3.0 2.5 2.0 1.5 1.0 0.5 0.0
H-3
Macromonomer(1.000)
c, d (0.252)b
a3 2 2 2
a b c d( ) ( )n mCH CH O CH CH− − − − −
Macromonomer(1.000)
c, d (0.252)b
a3 2 2 2
a b c d( ) ( )n mCH CH O CH CH− − − − −
α-cyclodextrin
Macromonomer-α-CD IC
OH-6H-1OH-3OH-2
H-6 H-5 H-2
DMSO-d6
(1.000)(1.423)
ppm 5.5 5.0 4.5 4.0 3.5 3.0 2.5 2.0 1.5 1.0 0.5 0.0ppm 5.5 5.0 4.5 4.0 3.5 3.0 2.5 2.0 1.5 1.0 0.5 0.05.5 5.0 4.5 4.0 3.5 3.0 2.5 2.0 1.5 1.0 0.55.5 5.0 4.5 4.0 3.5 3.0 2.5 2.0 1.5 1.0 0.5 0.00.0
H-3
a)

184
Figure 10. Part of the 500 MHz 1H NMR spectra showing a) the aliphatic CH2 protons of the
macromonomer and its inclusion compounds with α-CD and β-CD and b) the CH2-CH2-O protons of the macromonomer and its inclusion compounds with α-CD and β-CD. All spectra were acquired in DMSO-d6.
Macromonomer
Macromonomer-α-CD IC
Macromonomer-β-CD IC
Macromonomer
Macromonomer-α-CD IC
Macromonomer-β-CD IC
b)
Macromonomer
Macromonomer-α-CD IC
Macromonomer-β-CD IC
Macromonomer
Macromonomer-α-CD IC
Macromonomer-β-CD IC
a)

185
10-1
100
101
102
103
10-3 10-2 10-1 100 101 102
η, P
a.s
No CD
0
6.7
0.20.1
1.33.1
4.5 (a)
γ , s-1.
Symbols G 'Lines G"
10-2
10-1
100
101
102
10-2 10-1 100 101 102
G',
G",
Pa
No CD
4.5
1.3
20 moles β -CD/hydrophobes
0.2
(b)
ω , rad/s
Figure 11. Effect of adding macromonomer to a 3% HASE polymer solution that has the hydrophobic groups deactivated by 20 moles βCD on the (a) steady shear viscosity and (b) dynamic elastic (G’) and viscous (G”) moduli of the polymer solution. Numbers in figure denotes amount of macromonomer added to solution in mM

186
10-1
100
101
102
103
10-3 10-2 10-1 100 101 102
No CD
0
5.0
7.510
20
40
η, P
a.s
γ , s-1.
(a)
10-2
10-1
100
101
102
10-2 10-1 100 101 102
G',
G",
Pa
ω , rad/s
No CD
(b)
20
5
0
G' SymbolsG" Lines
Figure 12. Effect of NP4 surfactant addition to a 3% HASE polymer solution that has the
hydrophobic groups deactivated by 20 moles βCD on the (a) steady shear viscosity and (b) dynamic elastic (G’) and viscous (G”) moduli of the polymer solution. Numbers in figure denotes amount of NP4 surfactant added to solution in mM.

CHAPTER 8
CONCLUSIONS AND RECOMMENDATIONS FOR FUTURE WORK

188
8.1 Conclusions
In this chapter we briefly summarize the key aspects of this dissertation. In the
preceding chapters, we have shown that polymer composition and solvent quality have a
large impact on the polymer solution microstructure and rheology. We also investigated
the ability of diffusing wave spectroscopy to probe the dynamic of complex associative
polymers. Moreover, we provided an approach to modulate the hydrophobic interactions
through using inclusion compounds and surfactants. Some of the major findings of the
study are summarized in the following paragraphs.
• Both the polymer backbone composition and the macromonomer concentration have
profound impacts on the solution viscosity and viscoelastic properties. Increasing the
MAA concentration in the polymer backbone increased the chains’ hydrodynamic
size but reduced its flexibility. A small increase in the macromonomer concentration,
up to 1 mole%, enhances the intermolecular hydrophobic association and thus the
solution viscosity and viscoelastic properties. However, further increase in the
macromonomer concentration yield hydrophobic junctions with mostly
intramolecular associations which reduce the solution viscosity and viscoelastic
properties. The presence of competing mechanisms, i.e., increasing MAA
concentration or macromonomer concentration, therefore result in a maximum in
various material functions. Scaling various material functions with the polymer
concentration yielded three transitional regimes. These transition regimes correspond
to changes in the hydrophobic association modes. The concentrations at which these
189
transitions were observed were dependent on the polymer composition and shifted to
lower concentration with increasing MAA content.
• The solvent quality exerted a strong influence on the polymer solution microstructure
and rheology. In particular, two distinct modes of behavior were observed depending
on whether the co-solvent was “water rich” or “glycol rich”. In both regimes, the
relative viscosity and plateau modulus reveal power-law dependences with the
solvent solubility parameter; however, the dependence is much stronger in the “water
rich” regime. We attribute this dual-mode behavior to a lessening in the ability of the
hydrophobic groups for micellization as the solvent changes from being “water-rich”
to “ glycol-rich”. This lack or reduction of hydrophobic interactions in the “PG-rich”
solvents is possibly induced by less expanded polymer chains and conformational
changes in PEO spacers together with a lower tendency of the hydrophobes to form
micelles in less polar media. This hypothesis was supported by examining the
concentration dependence of viscosity and elastic modulus in each regime and
comparing them to those of associative and nonassociative.polymers.
• Using diffusing wave spectroscopy (DWS) to probe the structural changes induced by
the change of solvent quality and polymer concentration on a HASE associative
polymer has proved to be a viable approach. In particular, comparison of DWS results
with those obtained using conventional rheometry reveals excellent qualitative
agreement. Further, DWS provided information on the polymer dynamics over a very
190
wide frequency range, including high frequencies that are not accessible by
mechanical rheometry. Finally, the concentration dependence of the creep
compliance, high–frequency elastic modulus and relaxation time obtained using DWS
or rheometry reveal power-law dependences with the same exponents regardless of
the technique. However, the power-law exponents were different for the different
material functions, and were discussed in light of theoretical predictions and other
available experimental results.
• The use of inclusion compounds and surfactant provides a viable approach to control
the hydrophobic associations and concomitant solution rheology The complexation of
the normally associating hydrophobic macromonomer components with α- and β-
cyclodextrins reduces the steady shear viscosity and dynamic moduli of the HASE
solutions by several orders of magnitude. Furthermore, it is possible to reversibly
recover the high viscoelastic characteristics of HASE solutions containing
cyclodextrins by treatment with surfactants that compete with the hydrophobic
portions of HASE for complexation with the cyclodextrins. As a consequence,
cyclodextrins and surfactants in combination can be judiciously employed to lower
the viscoelasticity of HASE solutions during processing, while subsequently
recovering the high viscosity and viscoelastic properties that are sought in their
applications.

191
8.2 Recommendations for Future Work
8.2.1 Tracer microrheology measurements
In chapter 6, we reached the conclusion that diffusing wave spectroscopy (DWS)
is a viable technique to probe the dynamic of associative polymers at the microlevel.
However, the quantitative discrepancy between DWS and mechanical rheometry could be
attributed to fundamental differences between the dynamics at the micro and the
macrolevel. It could also be attributed to either the presence of inhomogeneity on some
length scale or to the perturbation of the medium by the probing particle. It would be of
great importance to further examine these last two possibilities by using another/other
microrheological techniques. In particular, there are two recent techniques that would
accomplish that task. The first technique, particle tacking or two-point microrheology
correlates the fluctuations of two beads, separated in space, and should give a more exact
measure of the bulk rheological properties. This technique does not depend on details of
the tracer’s size, shape and boundary conditions within the medium and overcomes many
of the limitations of conventional microrheology experiments1-4.
The second recommended technique is the use of a two-cell DWS technique5, a
sandwich consisting of two independent glass cells. The first cell contains the viscoelastic
medium under investigation while the second is filled with a viscous liquid and scatterer
particles. This technique eliminates any perturbation by the scatterer probes to the
viscoelatic medium. Details of this technique and the experimental setup are discussed in
reference 5.

192
8.2.2 Recovery of solution rheology after deactivation of the hydrophobic groups
In chapter 7, we presented an approach to modulate the hydrophobic association.
The first step in that approach involves the addition of inclusion compound hosts (α- or
β- cyclodextrin) to the polymer solution. The encapsulation of the hydrophobic groups
leads to significant reduction in the solution viscosity and viscoelastic properties The
second step requires the addition of surfactants to reactivate the hydrophobic groups and
thus recover the solution rheological properties. Although, we were able to recover the
solution properties, the final viscosity profile was different than that of the original
polymer solution. This change is attributed to the polymer-surfactant interactions.
However, a more direct approach to recover the solution properties is to degrade the
cyclodextrin.
A novel approach to reactivate the hydrophobic groups would be through
enzymatic degradation of the cyclodextrin. Currently, there are several enzymes that are
capable of degrading cyclodextrins, including Cyclodextrinase, Alpha Amylase from
different sources and Glucoamylase Amylase6-17. However, it is crucial that the enzyme
meets the following two criteria:
1. Thermophilic enzymes (preferably has no activity at room temperature with
maximum activity at 50-60°C)
2. Stable at pH 7.0 or higher and preferably have optimum pH >> 6.0
In the next section we discuss some preliminary results of using different enzymes
to degrade cyclodextrin and recover the solution properties. The first enzyme used is
cyclodetrinase enzyme from alkalophilc Bacillus sp. I-5 (CDase I-5) with specific activity

193
300 u/mg on β-cyclodextrin and optimum conditions 50°C and pH 7.5. This enzyme was
kindly supplied by Professor Kwan Hwa Park, Research Center for New Bio-Materials in
Agriculture, S. Korea. The second enzyme is a fungal alpha-amylase enzyme derived
from a selected strain of Aspergillus oryzae and has the commercial name Clarase®. The
specific activity of this enzyme is 40000 SKBU/g (one SKBU will degrade 1.0 gram of
limit-dextrin substrate per hour) and optimum pH and temperature 5.6 and 50°C.,
respectively. This enzyme was kindly supplied by Genencor International®.
Effect of cylodetrinase (Cdase) enzyme
Figure 1a and b shows the effect of incubation with 300 u/g Cdase at 50°C and
pH 9.0 for 24 hrs on the steady shear viscosity and elastic (G’) and viscous (G”) moduli
of a 3% polymer solution that has the hydrophobic groups initially encapsulated with 20
moles α-cyclodextrin per moles hydrophobes. The incubation with Cdase enzymes
increased the solution viscosity and viscoelastic properties. The recovery of the solution
properties could be attributed to the reactivation of the hydrophobic groups as the treated
sample has steady and dynamic profile similar to the original 3% solution. No full
recovery, however, was achieved even after long incubation time. This is due to the
incubation pH being higher than the optimum pH for the enzyme.
To increase the activity of the Cdase enzyme, a 3% polymer solution was
prepared at pH 7.5. Figure 2a and b shows the reduction of the solution pH from 9.0 to
7.5 has slight effect on the solution rheological properties. However, incubation with 300
u/g Cdase enzyme at 50° and pH 7.5 showed a near full recovery of the solution

194
rheological properties even after 1 hour as shown in Figures 3a and b. Incubation for
longer times showed a slight increase in the rheological properties.
Effect of Clarase enzyme
Because the optimum pH for the Clarase enzyme is 5.5, we have not attempted
the incubation at pH 9. Incubation at 50°C and pH 7.5 with 1200 SKBU u/g clarase
enzyme for 30 hrs showed a significant increase in the rheological properties of the 3%
polymer solution as shown in Figures 4a and b.
In summary, our preliminary data suggests that using enzymes to degrade
cyclodextrin, as a way to reactivate the hydrophobic groups, is a promising approach. A
detailed study, however, needs to fully explore the optimum use of the enzymes.

195
8.3 References:
1. Mukhopadhyay, A.; Granick, S. Micro- and Nanorheology, Current Opinion in Colloid & Interface Science 2001, 6 (5,6), 423-429.
2. Mason, T. G.; Ganesan, K.; van Zanten, J. H.; Wirtz, D.; Kuo, S. C. Particle
Tracking Microrheology of Complex Fluids, Physical Review Letters 1997, 79 (17), 3282-3285.
3. Crocker, J. C.; Valentine, M. T.; Weeks, E. R.; Gisler, T.; Kaplan, P. D.; Yodh, A.
G.; and Weitz, D. A. Two-Point Microrheology of Inhomogeneous Soft Materials, Physical Review Letters 2000, 85 (4), 888-891.
4. Levine, A. J.; Lubensky, T. C. Two-point Microrheology and the Electrostatic
Analogy, Physical Review E: Statistical, Nonlinear, and Soft Matter Physics 2002, 65 (1-1), 011501/1-011501/13.
5. Scheffold, F.; Skipetrov, S. E.; Romer, S.; Schurtenberger, P. Diffusing-Wave
Spectroscopy of Nonergodic Media, Phys. Rev. E: Stat., Nonlinear, Soft Matter Phys. 2001, 63 (6-1), 061404/1-061404/11.
6. Saha, B. C.; Zeikus, J. G., Cyclodextrin Degrading Enzymes, Starch/Staerke
1992, 44 (8), 312-15. 7. Zhong, W.; Zhang, Z. S.; and Jun, Y. S. Purification and Properties of
Cyclodextrinase from Bacillus Stearothermophilus HY-1, Applied Biochemistry and Biotechnology 1996, 59 (1), 63-75.
8. Saha, B. C.; Zeikus, J. G. Characterization of Thermostable Cyclodextrinase from
Clostridium T 39E, Appl. Environ. Microbiol. 1990, 56 (9), 2941-3. 9. Oguma, T.; Kikuchi, M.; Mizusawa, K. Cyclodextrinase of Bacillus for
Preparation of Maltooligosaccharides, JP Patent 03087193, 1991. 10. Kwon, H.-J.; Nam, S.-W.; Kim, K.-H.; Kwak, Y.-G.; Kim, B.W. Isolation of a
Bacillus Sp. Producing both Cyclodextrin G and Cyclodextrinase and Characterization of the Enzymes, Sanop Misaengmul Hakhoechi 1996, 24 (3), 274-281.
11. Kitahata, S.; Taniguchi, M.; Beltran, S. D.; Sugimoto, T.; Okada, S. Purification
and Some Properties of Cyclodextrinase from Bacillus Coagulans, Agric. Biol. Chem. 1983, 47 (7), 1441-7.

196
12. Galvin, N. M.; Kelly, C. T.; Fogarty, W. M. Purification and Properties of the Cyclodextrinase of Bacillus Sphaericus ATCC 7055, Applied Microbiology and Biotechnology 1994, (1), 46-50.
13. DePinto, J. A.; Campbell, L. L. Purification and Properties of the Cyclodextrinase
of Bacillus Macerans, Biochemistry1968, 7 (1), 121-5. 14. DePinto, J. A.; Campbell, L. L. Pattern of Action of the Amylase and the
Cyclodextrinase of Bacillus Macerans, Arch. Biochem. Biophys. 1968, 125 (1), 253-8.
15. Bryjak, J. Enzymic Hydrolysis of Starch to Maltodextrin and Starch Syrups. Part
I. Enzymes, Biotechnologia 1999, (1), 180-200. 16. Antenucci, R. N.; Palmer, J. K. Enzymic Degradation of α- and β-Cyclodextrins
by Bacteroides of the Human Ccolon, J. Agric. Food Chem. 1984, 32 (6), 1316-21.
17. Abe, J.; Nakazono, O.; Hizukuri, S. Characterization of Cyclodextrinase from
Bacillus Stearothermophilus K-12481, Oyo Toshitsu Kagaku 1996, 43 (2), 155-159.

197
10-1
100
101
102
103
104
10-4 10-3 10-2 10-1 100 101 102 103
η, P
a.s
γ, s-1.
No CD
0 hr
24 hrs
(a)
10-2
10-1
100
101
102
103
10-2 10-1 100 101 102 103
G',
G",
Pa
ω , rad/sec
0 hrs24 hrs
No CD
G'
G"
G'
G"
(b)
Figure 1. Effect of CDase enzyme on the (a) steady shear viscosity and (b) dynamic elastic (G’) and viscous (G”) moduli of 3% polymer solution encapsulated with 20 moles α-CD/hydrophobes. pH 9, incubation temperature 50°C, incubation time 24 hrs.

198
103
104
10-4 10-3 10-2 10-1 100
η, P
a.s
γ, s-1.
pH 9.0
pH 7.5
(a)
101
102
103
10-2 10-1 100 101 102 103
7.59.0
G',
G",
Pa
ω, rad/sec
G'
G"
pH
(b)
Figure 2. Effect of solution pH on the (a) steady shear viscosity and (b) dynamic elastic (G’) and viscous (G”) moduli of 3% polymer solution.

199
10-1
100
101
102
103
104
10-4 10-3 10-2 10-1 100 101 102
η, P
a.s
NO CD
γ, s-1.
0 hr
1hr
10 hrs
(a)
10-4
10-3
10-2
10-1
100
101
102
103
10-2 10-1 100 101 102 103
G',
G",
Pa
ω , rad/sec
10 hrs
NO CD
G'
G"
G'
G"
0 hrs
(b)
Figure 3. Effect of CDase enzyme on the (a) steady shear viscosity and (b) dynamic elastic (G’) and viscous (G”) moduli of a 3% polymer solution encapsulated with 20 moles α-CD/hydrophobes. pH 7.5, incubation temperature 50°C, incubation time 1 and 10 hr.

200
10-1
100
101
102
103
104
10-4 10-3 10-2 10-1 100 101 102
η, P
a.s
γ, s-1.
No CD
0 hr
30 hrs
(a)
10-4
10-3
10-2
10-1
100
101
102
103
10-2 10-1 100 101 102 103
G',
G",
Pa
ω, rad/sec
0 hr
No CD
G'
G"
G'
G"
30 hrs
(b)
Figure 4. Effect of Clarase enzyme on the (a) steady shear viscosity and (b) dynamic elastic (G’) and viscous (G”) moduli of a 3% polymer solution encapsulated with 20 moles α-CD/hydrophobes. pH 7.5, incubation temperature 50°C, incubation time 30 hrs.