Abd Rahman, Norashidah (2012) Fatigue behaviour and...
179
Abd Rahman, Norashidah (2012) Fatigue behaviour and reliability of Extended Hollobolt to concrete filled hollow section. PhD thesis, University of Nottingham. Access from the University of Nottingham repository: http://eprints.nottingham.ac.uk/12909/1/Norashidah_Abd_Rahman-PhD_thesis_-__2012.pdf Copyright and reuse: The Nottingham ePrints service makes this work by researchers of the University of Nottingham available open access under the following conditions. This article is made available under the University of Nottingham End User licence and may be reused according to the conditions of the licence. For more details see: http://eprints.nottingham.ac.uk/end_user_agreement.pdf For more information, please contact [email protected]
Transcript of Abd Rahman, Norashidah (2012) Fatigue behaviour and...

Abd Rahman, Norashidah (2012) Fatigue behaviour and reliability of Extended Hollobolt to concrete filled hollow section. PhD thesis, University of Nottingham.
Access from the University of Nottingham repository: http://eprints.nottingham.ac.uk/12909/1/Norashidah_Abd_Rahman-PhD_thesis_-__2012.pdf
Copyright and reuse:
The Nottingham ePrints service makes this work by researchers of the University of Nottingham available open access under the following conditions.
This article is made available under the University of Nottingham End User licence and may be reused according to the conditions of the licence. For more details see: http://eprints.nottingham.ac.uk/end_user_agreement.pdf
For more information, please contact [email protected]

Division of Materials, Mechanics and Structures
Fatigue Behaviour and Reliability of Extended Hollobolt to Concrete
Filled Hollow section
by
Norashidah Abd Rahman
(B.Eng, M.Eng)
Thesis submitted to the University of Nottingham for the degree of
Doctor of Philosophy
October 2012
Abstract 2012
Norashidah Abd Rahman i
Abstract
The need to provide mechanical connection from one side for the Hollow section
connection has arisen in a number of fields and has resulted in the development of
several types of so-called blind fasteners. An experimental blind bolt called the
Extended Hollobolt is giving a good behaviour performance in terms of stiffness,
strength and ductility. The strength performance of this system has been investigated
under both monotonic and cyclic loading. However, the performance of such
connections under fatigue loading is still unknown.
The aim of this study was to investigate the behaviour of blind bolt connection to
concrete filled hollow section under repeated load. Further aim was to determine the
reliability of the Extended Hollobolt to concrete filled hollow section.
The study involved conducting an experimental programme and carrying out fatigue
life and reliability analysis. The experiment programme tested 52 specimens of bolts
connected to concrete filled hollow sections where 36 tests involved Extended
Hollobolt, 10 standard Hollobolt and 6 standard bolts (M16). The test specimens
were subjected to tensile fatigue load characteristics with varying stress ranges.
Mathematical methods are used to analyse the fatigue test data using the normal,
lognormal and Weibull distributions. Normal and lognormal distributions are more
suitable. Therefore, statistical analysis procedure proposed by Eurocode for the
statistical analysis is valid for fatigue test data. Statistical analysis was conducted to
establish S-N curves and to predict the fatigue life of the proposed blind bolt. This
was then compared to the normative regulation in Eurocode 3.

Abstract 2012
Norashidah Abd Rahman ii
The failure mode of the Extended Hollobolt under repeated loading was found to be
similar with standard bolt, which is a very positive outcome. Statistical analysis of
fatigue test data showed that the fatigue life of Extended Hollobolt is higher than the
theoretical design S-N curve which is recommended by Eurocode 3 part 1-9 for the
standard bolt. However, the actual fatigue life for the standard bolt appears to be
higher than the proposed blind bolt. A design model for predicting the fatigue life
using S-N curve for the Extended Hollobolt is proposed. A reliability analysis using
FORM (First Order Reliability Method) analysis shows that Extended Hollobolt is
reliable in connections to concrete filled hollow sections where the safety index is
4.2.

Table of Contents 2012
Norashidah Abd Rahman iii
Table of Contents
Abstract ......................................................................................................................... i
Table of Contents ........................................................................................................ iii
List of Tables............................................................................................................. viii
List of Figures .............................................................................................................. x
Abbreviations ............................................................................................................. xv
Notation ..................................................................................................................... xvi
Acknowledgment ..................................................................................................... xvii
Declaration .............................................................................................................. xviii
Chapter 1 : Introduction ............................................................................................... 1
1.1. Bolted connection .......................................................................................... 1
1.2. Fatigue background ....................................................................................... 5
1.3. Research question .......................................................................................... 6
1.4. Research justification .................................................................................... 7
1.5. Aims and objectives of the research .............................................................. 8
1.6. Research methodology .................................................................................. 9
1.6.1. Literature review .................................................................................... 9
1.6.2. Experimental work ................................................................................. 9
1.6.3. Mathematical method ........................................................................... 10
1.7. Overview of the thesis ................................................................................. 11

Table of Contents 2012
Norashidah Abd Rahman iv
Chapter 2 : Literature Review and Related Background ........................................... 12
2.1 Introduction ................................................................................................. 12
2.2 Review of research on blind bolts ............................................................... 12
2.2.1 Blind bolt connection ........................................................................... 13
2.2.2 Extended blind bolt .............................................................................. 22
2.2.3 Blind bolt connection under cyclic load .............................................. 24
2.3 Review of research in fatigue ...................................................................... 27
2.3.1 Fatigue load .......................................................................................... 30
2.3.2 Effect of mean stress or stress range .................................................... 34
2.3.3 Effect of frequency ............................................................................... 35
2.4 Review of research on the fatigue behaviour of bolted connections ........... 37
2.4.1 Fatigue failure of bolts ......................................................................... 38
2.4.2 Fatigue life of the bolt .......................................................................... 42
2.4.3 S-N Model ............................................................................................ 45
2.5 Concluding remarks .................................................................................... 47
2.6 Future research directions ........................................................................... 49
Chapter 3 : Experimental Work ................................................................................. 50
3.1 Introduction ................................................................................................. 50
3.2 Overview of Fatigue Testing ....................................................................... 50
3.2.1 Hollow section material ....................................................................... 51
3.2.2 Bolts ..................................................................................................... 53
3.2.3 Concrete material ................................................................................. 56
3.3 Material geometries ..................................................................................... 56
3.3.1 Hollow section ..................................................................................... 57

Table of Contents 2012
Norashidah Abd Rahman v
3.3.2 Bolts ..................................................................................................... 57
3.3.3 Properties of concrete ........................................................................... 60
3.4 Test setup and loading procedure ................................................................ 63
3.4.1 Fatigue test loading method ................................................................. 66
3.4.2 Number of specimens ........................................................................... 67
3.4.3 Stress range .......................................................................................... 69
3.5 Concluding remark ...................................................................................... 73
Chapter 4 : Experimental Results, Discussions, and Observations ............................ 74
4.1 Introduction ................................................................................................. 74
4.2 Effect of frequency and stress range determination .................................... 74
4.2.1 Effect of frequency ............................................................................... 75
4.2.2 Effect of stress range ............................................................................ 79
4.2.3 Effect of frequency on the failure mode .............................................. 79
4.3 General observations on Extended Hollobolt under fatigue load ................ 80
4.3.1 Fatigue behaviour of the Extended Hollobolt ...................................... 81
4.3.2 Fracture failure of the Extended Hollobolt .......................................... 89
4.4 Comparison among tested bolt types ........................................................... 91
4.4.1 Fatigue life of bolt ................................................................................ 91
4.4.2 Fatigue behaviour of bolts .................................................................... 93
4.4.3 Fracture failure of bolt ......................................................................... 96
4.4.4 EC3 S–N curve classification............................................................... 98
4.5 Effect of concrete strength......................................................................... 101
4.6 Chapter summary ...................................................................................... 104
Table of Contents 2012
Norashidah Abd Rahman vi
Chapter 5 : Statistical and Reliability Analysis........................................................ 105
5.1 Introduction ............................................................................................... 105
5.2 Probability Distribution Function .............................................................. 106
5.2.1 Lognormal distribution ...................................................................... 109
5.2.2 Weibull distribution ........................................................................... 112
5.2.3 Normal distribution ............................................................................ 114
5.2.4 Distribution Discussion ...................................................................... 115
5.3 Extended Hollobolt S-N curve characteristic ............................................ 116
5.3.1 Tolerance Limits ................................................................................ 119
5.3.2 Confidence limit/level ........................................................................ 120
5.3.3 Standard deviation .............................................................................. 123
5.4 Introduction to fatigue reliability .............................................................. 124
5.5 Fatigue reliability analysis ......................................................................... 125
5.5.1 Safety index and probability of EHB ................................................. 127
5.5.2 Discussion on the reliability of the Extended Hollobolt .................... 128
5.6 Chapter summary ...................................................................................... 129
Chapter 6 : Conclusions and Recommendations for Future Work .......................... 130
6.1 Introduction ............................................................................................... 130
6.2 Conclusion ................................................................................................. 131
6.3 Recommendations for further study .......................................................... 132
References ............................................................................................................ 134
Appendix A .......................................................................................................... 142
Appendix B .......................................................................................................... 143
Appendix C .......................................................................................................... 150

Table of Contents 2012
Norashidah Abd Rahman vii
Appendix D .......................................................................................................... 152
Appendix E .......................................................................................................... 155
List of Tables 2012
Norashidah Abd Rahman viii
List of Tables
Table 2.1 : Formulation of fatigue rules (Ioannis Vayas et al., 2003) ....................... 32
Table 2.2 : Comparison table for high cycle and low cycle ....................................... 32
Table 2.3 : Bend fatigue data for four test loading frequencies (R-Fujczak, 1994) ... 36
Table 2.4 : Details of the connections tested by Birkemoe (1971) ............................ 46
Table 3.1 : Sample experimental work specimen details ........................................... 56
Table 3.2 : Material properties of the hollow section ................................................ 57
Table 3.3 : Mechanical properties of the bolts (machined) ........................................ 59
Table 3.4 : Mechanical properties of the bolts (full size) .......................................... 59
Table 3.5 : Concrete Mix ........................................................................................... 60
Table 3.6 : Concrete strength of the Extended Hollobolt (EHB C40) ....................... 60
Table 3.7 : Concrete strength of the standard M16 bolt ............................................. 62
Table 3.8 : Concrete strength of the standard HB ...................................................... 62
Table 3.9 : Concrete strength of the Extended Hollobolt (EHB C60) ....................... 63
Table 3.10 : Number of specimens required, British Standard (BS ISO 12107, 2003).
.................................................................................................................................... 67
Table 3.11 : ASTM Standard Practice recommended sample size (ASTM, 1991). .. 68
Table 3.12 : ASTM Standard Practice replication percentage (ASTM, 1991). ......... 68

List of Tables 2012
Norashidah Abd Rahman ix
Table 3.13 : Average tensile bolt area ........................................................................ 70
Table 3.14 : Number of tests per stress range ............................................................ 72
Table 4.1: Effect of frequency experimental results .................................................. 76
Table 4.2 : Experimental results of EHB Grade 8.8 C40 ........................................... 82
Table 4.3 : Experimental results of standard HB Grade 8.8 C40 ............................... 85
Table 4.4 : Experimental results of standard bolt M16 Grade 8.8 C40 ..................... 86
Table 4.5 : Experimental results of EHB Grade 8.8 C60 ........................................... 87
Table 4.6 : Fatigue life of EHB Grades 8.8 and 10.9 ................................................. 89
Table 4.7 : Fatigue life of EHB using C40 and C60 ................................................ 103
Table 5.1: Properties of the normal, lognormal, and Weibull distributions (Walpole et
al., 1998)................................................................................................................... 108
Table 5.2 : Comparison of the three distributions .................................................... 116
Table 5.3 : S-N Curve result of the EHB ................................................................. 123
Table 5.4 : Standard deviation of various types of detail category .......................... 124
Table 5.5 : Target reliability index βo for class RC2 structural members1
(BS
EN1990, 2002) ......................................................................................................... 128

List of Figures 2012
Norashidah Abd Rahman x
List of Figures
Figure 1.1: Typical extended endplate connection to a tube ........................................ 2
Figure 1.2 : Commercial blind fasteners ...................................................................... 3
Figure 2.1 : Moment rotation of connection (SCI, 1997) .......................................... 13
Figure 2.2 : Moment rotational diagram (Trahair et al., 2008) .................................. 14
Figure 2.3 : Column flange or bending and bolt strength (SCI, 1997) ...................... 15
Figure 2.4 : Moment rotation relationship for specimens S1, S2, and S3
(Korol et al., 1993) ..................................................................................................... 16
Figure 2.5 : T-stub test arrangement with RMH (Barnett et al., 2000) ...................... 17
Figure 2.6 : Load Vs plate separation for the RMH t-stub test (Barnett et al., 2000) 18
Figure 2.7 : Load displacement relationships (Sean Ellison, 2004) ........................... 19
Figure 2.8 : Wall deformation effect of unfilled SHS (Tizani and Ridley-Ellis, 2003);
blind bolt to concrete filled tube connection .............................................................. 20
Figure 2.9 : Comparison deformation for column face at the bottom flange of beam
(mm) (France et al., 1999).......................................................................................... 22
Figure 2.10 : Experimental set up and detail (Yao et al., 2008) ................................ 23
Figure 2.11: Extended Hollobolt ................................................................................ 23
Figure 2.12 : Load slip of pullout test under cyclic loading (Yao et al., 2008) ......... 25
Figure 2.13 : Details of the connection configuration (Elghazouli et al., 2009) ........ 26
List of Figures 2012
Norashidah Abd Rahman xi
Figure 2.14: Loading protocol (ECCS, 1986) ............................................................ 26
Figure 2.15 : Top view of the fracture due to low cycle fatigue
(Elghazouli et al., 2009) ............................................................................................. 27
Figure 2.16 : S-N curves (BS EN1993, 2006) ........................................................... 29
Figure 2.17 : Type of applied load (Gurney, 1979) ................................................... 31
Figure 2.18 : Magnitude and stress ratio (Trahair et al., 2008) .................................. 35
Figure 2.19 : Effect of frequency on the fatigue life of Polymer matrix composites
(IM7/PET1) (Counts and Johnson, 2002) .................................................................. 37
Figure 2.20 : Bolt fatigue failure (ESDEP, 2011) ...................................................... 38
Figure 2.21 : Fatigue fracture (marinediesels.co.uk) ................................................ 40
Figure 2.22 : Magnification of fatigue failure showing striations
(marinediesels.co.uk) ................................................................................................. 40
Figure 2.23 : Fracture failure for bolts loaded axially with a mean stress of 584 MPa
(a) and 250 MPa (b) (Hobbs et al., 2000) .................................................................. 41
Figure 2.24 : Crack shapes of eccentric loadings (Hobbs et al., 2000) ...................... 42
Figure 2.25 : Comparison between the S-N and Fracture Mechanics models .......... 43
Figure 2.26 : Predicted S-N curve using a modified Fracture Mechanics model ...... 44
Figure 2.27 : Bolted S-N curve ................................................................................. 45
Figure 2.28 : Comparison between scatter band of test and normative S-N curve
(Schaumann and Marten, 2009) ................................................................................. 47
Figure 3.1 : Illustration of EHB fatigue test. .............................................................. 51
List of Figures 2012
Norashidah Abd Rahman xii
Figure 3.2 : Test arrangement .................................................................................... 52
Figure 3.3 : Test arrangement using Rig assembly .................................................... 52
Figure 3.4 : Types of bolts for the fatigue test ........................................................... 53
Figure 3.5: Actual dimensions of the EHB (all measurements in mm) ..................... 54
Figure 3.6 : Actual dimensions of the HB (all measurements in mm) ....................... 55
Figure 3.7 : Actual dimensions of the standard M16 bolt (all dimensions in mm).... 55
Figure 3.8 : Coupon piece dimensions ....................................................................... 57
Figure 3.9 : Bolt tensile test specimens ...................................................................... 58
Figure 3.10 : Bolt Stress – Strain curve (Machined) ................................................. 58
Figure 3.11 : Leveling work ....................................................................................... 64
Figure 3.12 : Bolt connection to the load cell ............................................................ 64
Figure 3.13 : Experimental setup ............................................................................... 65
Figure 3.14 : Loading hysteresis ................................................................................ 71
Figure 3.15 : Load path .............................................................................................. 71
Figure 4.1 : Cyclic histories at stress n 455 N/mm2 ............................................... 77
Figure 4.2 : Normalization graph of frequency .......................................................... 78
Figure 4.3 : Effect of stress range graph .................................................................... 79
Figure 4.4 : Failure mode of Extended Hollobolt ...................................................... 80
Figure 4.5 : Normalization graph stress of fatigue life of EHB ................................. 81
List of Figures 2012
Norashidah Abd Rahman xiii
Figure 4.6 : Fatigue life displacement graph .............................................................. 88
Figure 4.7 : Fracture failure location.......................................................................... 90
Figure 4.8 : Fracture failure of EHB: a) Δσ = 584 N/mm2; b) Δσ = 454 N/mm
2; c) Δσ
= 389 N/mm2; d) Δσ = 325 N/mm
2; e) Δσ = 292N/mm
2 ........................................... 90
Figure 4.9 : S–N curve of bolt comparison ................................................................ 92
Figure 4.10 : Comparison fatigue life of bolt at stress range 584 N/mm2 ................. 94
Figure 4.11 : Concrete surface of the standard HB and EHB test specimens ............ 95
Figure 4.12 : Static test results of Extended Hollobolt and standard bolt concrete-
filled hollow sections ................................................................................................. 95
Figure 4.13 : Fracture failure of bolts: a) 584 N/mm2; b) 519 N/mm
2; c) 454 N/mm
2;
d) 389 N/mm2; e) 325N/mm
2 ..................................................................................... 97
Figure 4.14 : Micrographic of fracture failure at ∆σ=454 N/mm2 ............................. 98
Figure 4.15 : Sleeve observation after test ................................................................. 98
Figure 4.16 : S–N curve according to EC3 characteristics (BS EN1993, 2006) ..... 100
Figure 4.17 : Crack propagation on the concrete at stress ranges 584, 455, and 325
N/mm2 ...................................................................................................................... 101
Figure 4.18 : Fatigue life-displacement graph at 584 N/mm2 stress range for C40 and
C60 ........................................................................................................................... 102
Figure 4.19 : Fatigue life displacement at 454 N/mm2 stress range for C40 and C60
.................................................................................................................................. 103
Figure 5.1 : Probability plot using lognormal distribution ....................................... 110
Figure 5.2 : Lognormal PDF .................................................................................... 110

List of Figures 2012
Norashidah Abd Rahman xiv
Figure 5.3 : Lognormal survival graph .................................................................... 111
Figure 5.4 : Probability plot using Weibull distribution .......................................... 112
Figure 5.5 : Weibull PDF (Survival graph) .............................................................. 113
Figure 5.6 : Survival graph using the Weibull distribution of EHB C40 test data .. 114
Figure 5.7 : Probability plot using Normal distribution ........................................... 115
Figure 5.8 : Curve-fitting graph ............................................................................... 118
Figure 5.9 : Tolerance limit for fatigue test data ...................................................... 119
Figure 5.10 : Definition of characteristic resistance ................................................ 122
Figure 5.11 : S-N curve characteristic design .......................................................... 123
Figure 5.12 : Geometric representation of the safety index β based on the Hesofer–
Lind approach........................................................................................................... 127
Abbreviations 2012
Norashidah Abd Rahman xv
Abbreviations
EC = Eurocode
EC3 = Eurocode 3
ECCS = European Convention for Structural Steelwork
EHB = Extended Hollobolt
HB = Hollobolt
RMH = Reverse Mechanism Hollobolt
FORM = First Order Reliability Method
SORM = second Order Reliability Method

Notation 2012
Norashidah Abd Rahman xvi
Notation
fck,cube(40) = Concrete strength of cube (C40)
fck,cube(e) = Concrete strength of cube (Concrete at test day)
∆σe = Experimental stress range
∆σn = Nominal stress range
Pa = Actual load (experiment)
Sx = Standard deviation of x
log = Mean of stress range
m = slope
Nf = Cycles to failure
P = Probability
n = number of specimen
i = specimen at i=1,2,3…n

Acknowledgment 2012
Norashidah Abd Rahman xvii
Acknowledgment
I would like to take this opportunity to thank the following people who have
provided help, guidance and support in completing this work.
Firstly, my greatest appreciation and gratefulness to my supervisor, Dr. Walid Tizani
for his valuable guidance, advice, support and supervision. With his effort and
advice, I am able to complete this work.
I wish to thank you all the staff in Civil Engineering Laboratory: Mr. Bal Loyla, Mr.
Nigel Rook, Mr. Gordan Hardy, Mr. Mike Jones, Mr.Gary Davies, Mr. Jim Bellis
and Mr. Jim Meakin for providing assistance during the laboratory testing.
I would like to thank Ministry of Higher Education (MOHE), Malaysia and
Universiti Tun Hussein Onn Malaysia for the financial support.
I also would like to express gratitude to Mr. Neil Gill from Lindapter International
and Tata Steel Europe (formerly Corus Tubes) for providing technical support and
materials for testing.
Most importantly, I wish to thank to all my family members especially to my parents
Abd Rahman Tahir and Munah Mohamad for their encouragement and moral
support. Finally to all my friends who provided support me throughout the project.

Declaration 2012
Norashidah Abd Rahman xviii
Declaration
I declare that, except where cited in the text, all work contained within this thesis is
my own original work, under the direction of my supervisor. The work presented
herein was performed at The University of Nottingham between January 2008 and
October 2012. This thesis has not been submitted to any institution other than The
University of Nottingham for the degree of Doctor of Philosophy.
Norashidah Abd Rahman
Chapter 1: Introduction 2012
Norashidah Abd Rahman 1
Chapter 1 : Introduction
1.1. Bolted connection
The majority of buildings that incorporate steelwork frames into their structure are
usually made up of open-section profile beams and column members. The popularity
of steel-framed buildings may be partly attributed to the easy prefabrication and
erection of steel members. Structural hollow sections (SHS) are commonly used for
columns in multi-storey construction because of their good aesthetic value and high
strength-to-weight ratio. However, the close-shaped geometry of hollow sections
makes the nut component difficult to manipulate directly to the face of the column.
Early solutions for the connection problem include the use of fully welded
connections, which is not an attractive option in some countries. The use of standard
bolts, which is the main alternative in welding open sections, is impossible in SHS as
it requires access to the interior of the tube to facilitate tightening (Barnett et al.,
2000). The use of additional components, such as gusset plates and brackets,
addresses this problem. However, this use of additional components is not generally
considered an acceptable solution for aesthetic reasons.
Hollow section components can also be connected through site welding. Welded
connections do not require holes to be drilled into the member, whereas welded
joints are more rigid than bolted joints. However, field welding may remain difficult,
costly, and time consuming. Welded connections are also susceptible to failure
because of cracks caused by fatigue under repeated cycles. Fatigue may result from
working loads, such as trains passing over a bridge (high-cycle fatigue) or
earthquakes (low-cycle fatigue).

Chapter 1: Introduction 2012
Norashidah Abd Rahman 2
The need to provide mechanical connections from one side only started in a number
of engineering fields. Blind fastener or blind bolt is a one of the fastening system and
the system is applied for installations wherein only one side of the connection can be
accessed. For example, blind fasteners can be used to connect the end-plate of a
beam to a hollow section, as shown in Figure 1.1.
Figure 1.1: Typical endplate connection to a tube (Lindapter, 2012)
Blind fasteners offer many advantages, including i) high tensile and shear strength,
ii) potential use in tension applications and in moment resisting connection, iii)
uniform high clamping force, and iv) vibration resistance (Tabsh et al., 1997).
Furthermore, blind bolts can easily be installed by unskilled technicians using
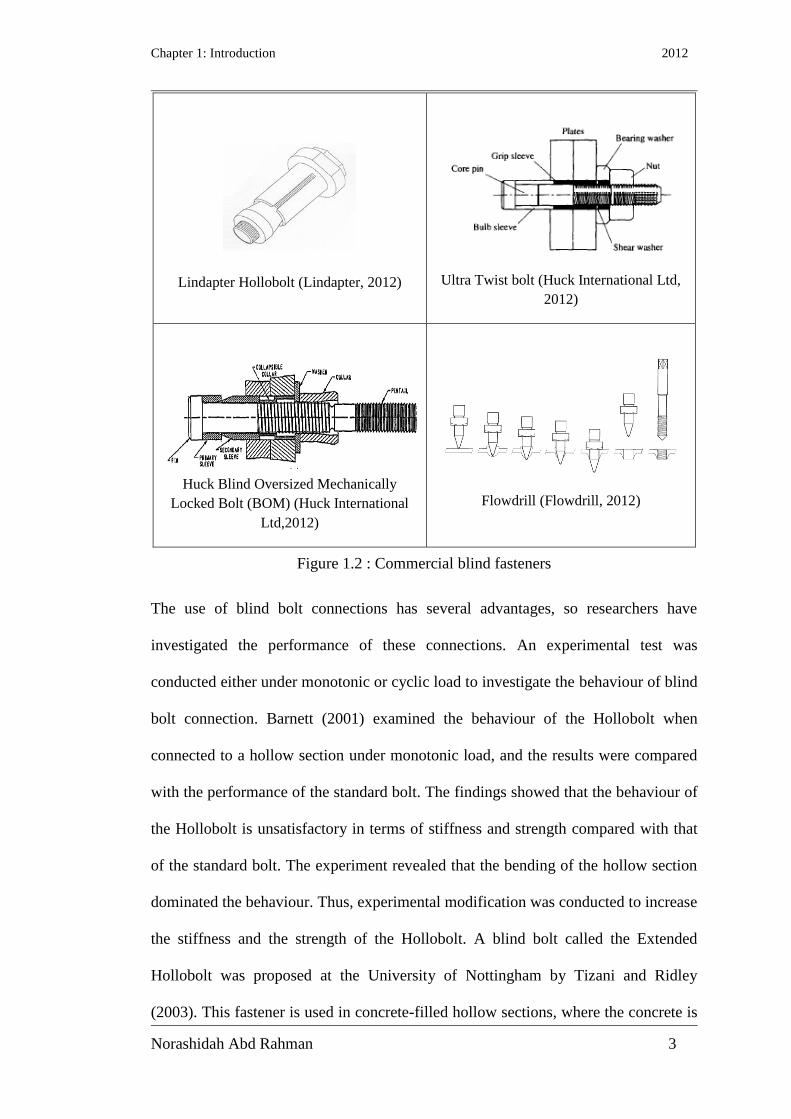
portable equipment. Many types of blind fasteners are available commercially,
including the Flowdrill (Flowdrill B.V Holland), the Huck high strength blind bolt
(HSBB), Huck blind oversized mechanically locked bolt (BOM), Ultra Twist (Huck
International, USA), and Lindapter Hollobolt (Lindapter International, UK) (Figure
1.2). Each type of fastener differs in terms of the number and design of bolt
components, resistance mechanisms, and methods of installation.
Chapter 1: Introduction 2012
Norashidah Abd Rahman 3
Lindapter Hollobolt (Lindapter, 2012)
Ultra Twist bolt (Huck International Ltd,
2012)
Huck Blind Oversized Mechanically
Locked Bolt (BOM) (Huck International
Ltd,2012)
Flowdrill (Flowdrill, 2012)
Figure 1.2 : Commercial blind fasteners
The use of blind bolt connections has several advantages, so researchers have
investigated the performance of these connections. An experimental test was
conducted either under monotonic or cyclic load to investigate the behaviour of blind
bolt connection. Barnett (2001) examined the behaviour of the Hollobolt when
connected to a hollow section under monotonic load, and the results were compared
with the performance of the standard bolt. The findings showed that the behaviour of
the Hollobolt is unsatisfactory in terms of stiffness and strength compared with that
of the standard bolt. The experiment revealed that the bending of the hollow section
dominated the behaviour. Thus, experimental modification was conducted to increase
the stiffness and the strength of the Hollobolt. A blind bolt called the Extended
Hollobolt was proposed at the University of Nottingham by Tizani and Ridley
(2003). This fastener is used in concrete-filled hollow sections, where the concrete is

Chapter 1: Introduction 2012
Norashidah Abd Rahman 4
used to prevent the bending of the tube face in order to increase the stiffness and the
strength of the connection. The Extended Hollobolt was investigated in pure tension
with the use of a T-stub connected to a concrete-filled tube. The results were
comparable to conventional connections in terms of stiffness and strength.
Cyclic load testing was conducted in previous research to explore the reliability of
the standard Hollobolt for gravity and lateral loads from wind or earthquakes in
regions of low to moderate seismicity. Wang (2008) and Elghazouli (2009)
investigated the behaviour of the standard Hollobolt when connected to concrete-
filled tubes under cyclic loading. Cyclic load testing showed the standard Hollobolt’s
reasonable energy capability and rotation capacity. The failure mode under cyclic
load was similar to that under monotonic test. Elghazouli (2009) provided evidence
of fracture caused by low-cycle fatigue, but no further investigation was performed.
As discussed above, recent studies describe the behaviour of the blind bolt when
subjected to increasing monotonic load or cyclic loading. Engineers who specify
fasteners often base their requirements on strength (tensile strength, yield strength,
proof strength, or threaded stripping strength), without taking fatigue and stress
concentration into account (O’Brien and Metcalfe, 2009). According to Barsom
(1999), most structural components are subjected to repeated fluctuating loads with a
below-fracture load magnitude under monotonic loading. Ignoring this issue may
result in unfortunate events, as these types of connection are used with a service
loading that varies with time.

Chapter 1: Introduction 2012
Norashidah Abd Rahman 5
1.2. Fatigue background
Events such as the 1994 Northridge earthquake and the I-35 bridge collapse in
Minnesota serve as reminders of the importance of fatigue and fracture (Benjamin V.
Fell and Kanvinde, 2009). Fluctuating loads must be considered in the design of
structural and machine components that are subjected to repeated fatigue (Ayyub et
al., 2002). The expected number of loading cycles can vary tremendously during the
life of a structure. For example, a beam that supports a crane may be loaded
2,000,000 times in 25 years before it fails to function, whereas an automobile
crankshaft might have to be loaded 5,000,000 times before rupture occurs (Beer and
E.R.Johnston, 1981).
Investigations on bolted connections under fatigue are not as popular as those on
welded connections because welded connections are critical. However, bolted
connections under fatigue also require examination to prevent fatigue damage.
Although bolted connections are mostly discussed in the field of aeronautics,
research related to the behaviour of bolts has also become the subject of discussion
within the field of steel structures. Design codes such as EC3 and ECCS provide
design procedures for normal bolts under fatigue. These procedures are currently
used for fatigue assessment. Studies that aim to predict the fatigue life and the
behaviour of bolts have been conducted by researchers such as Birkemoe (1971),
Ghazali (2004), and Schaumann (2009). They investigated the behaviour of various
types of bolts, such as high-strength bolts. Results in terms of fatigue life and
fracture failure showed that the behaviour is compromised compared with that of
existing standard bolt design. A fatigue design assessment for the Hollobolt blind
bolt has not yet been established, and the same is the case for the Extended

Chapter 1: Introduction 2012
Norashidah Abd Rahman 6
Hollobolt. Although the behaviour of the Extended Hollobolt is satisfactory under
monotonic or cyclic load, its response under fatigue also requires study. This
examination will compare the behaviour and the fatigue life of the Extended
Hollobolt under fatigue with the standard bolt with the use of existing design
guidance such as Eurocode 3.
1.3. Research question
A study on behaviour of blind bolts, specifically the Extended Hollobolt, was
conducted at the University of Nottingham to explore the behaviour of the Extended
Hollobolt connection under monotonic load. The Extended Hollobolt was selected
because it is easy to handle and install. In terms of stiffness, strength, and failure
mechanism, it is also quite comparable to the standard bolt. The experiment clearly
demonstrated that this type of connection is reliable as an alternative to welded
connections for connecting steel beams to concrete-filled square hollow sections
(Barnett et al., 2001). However, this type of bolt has not been examined well under
fatigue load. Blind bolt behaviour should be studied further, as low-cycle fatigue was
found when the behaviour of blind bolt connections was tested in the cyclic test of
Elghazouli (2009).
The research questions are outlined as follows:
i. What is the behaviour of the Extended Hollobolt under fatigue or
repeated load?
ii. What is the fatigue life of the Extended Hollobolt?
iii. How can the fatigue life of the Extended Hollobolt be predicted?

Chapter 1: Introduction 2012
Norashidah Abd Rahman 7
iv. How comparable is the behaviour of the Extended Hollobolt with
other types of bolts?
v. How reliable is the Extended Hollobolt with respect to fatigue
assessment?
1.4. Research justification
This section explains the need for the present study and provides an overview of the
selected parameters.
This work focuses on the investigation of the fatigue life and the reliability of the
Extended Hollobolt under tensile fatigue load through experimental work and
validation of the test data with the use of statistical analysis. It contributes to existing
knowledge by providing information on the behaviour, fatigue assessment, fatigue
life prediction, and reliability of the Extended Hollobolt. It also provides guidance
for further investigation and design.
The materials and parameters involved in this study were selected from previous
studies.
The Extended Hollobolt is comparable to the standard bolt. It has only been studied
under monotonic load. Before the present study was conducted, limited information
on fatigue load was available. In addition to the Extended Hollobolt, two other types
of bolts were investigated, the standard Hollobolt and the standard bolt, which were
selected to compare their fatigue behaviour with that of the Extended Hollobolt.
Statistical analysis is the most suitable method to validate and define the reliability of
the experimental results. Probability distributions based on previous research

Chapter 1: Introduction 2012
Norashidah Abd Rahman 8
findings were selected. These probability distributions were used to define the
reliability of the bolt during time service and to predict the fatigue life of the bolt.
The reliability function and the prediction equation can serve as foundations and
sources of information in assessing the fatigue behaviour of Extended Hollobolts.
1.5. Aims and objectives of the research
This study aims to examine the behaviour of the blind bolt connection of concrete-
filled hollow sections using Extended Hollobolts under repeated loading. A further
aim is to determine the reliability of Extended Hollobolts for concrete-filled tubes.
This research is an extension of an earlier work done at the University of
Nottingham. The objectives of the study are as follows:
i. To conduct experimental tests to investigate the behaviour of
Extended Hollobolts under repeated load
ii. To investigate the effect of the frequency and the stress range of
Extended Hollobolts
iii. To determine the fatigue life and the failure mechanism of the
Extended Hollobolt connection in concrete-filled tubes
iv. To evaluate the performance of the Extended Hollobolt connection
and compare it with other types of bolts
v. To validate the experimental results with a statistical method
vi. To analyze the reliability of the Extended Hollobolt
Chapter 1: Introduction 2012
Norashidah Abd Rahman 9
1.6. Research methodology
This section introduces the methodology used to achieve the aims and objectives of
this study. The research objectives outlined in Section 1.5 were accomplished with a
combination of experimental work and mathematical method.
1.6.1. Literature review
This stage is important to collate previous research findings and to obtain insights
from relevant work. In this section, the researcher proposed relevant areas that
should be covered in the study. Previous research on bind bolt connection to hollow
section is examined. Blind bolt connection behaviour under monotonic and cyclic
tests is discussed. Bolt connection behaviour under fatigue test is also reviewed.
Statistical analysis is used to validate fatigue test data.
1.6.2. Experimental work
Necessary tests were performed to determine the behaviour of the Extended
Hollobolt on concrete hollow section, as well as the behaviour of other types of bolts
compared with the Extended Hollobolt. This study also observed the bolt failure
mechanism after failure occurred. The experimental work aims to define the fatigue
life and the reliability of the Extended Hollobolt.
A pull out test of a single Extended Hollobolt connected to a concrete-filled hollow
section was conducted to achieve the objective of the experimental work. Preparation
was undertaken in designing the frame for fatigue testing to ensure that the frame
could handle fatigue load. Material properties were determined by coupon and bolt
tensile tests. The bolts were tightened to the hollow sections with the use of a
Chapter 1: Introduction 2012
Norashidah Abd Rahman 10
conventional torque wrench. Tightening torque was applied according to the
suggestions of the supplier. Concrete was then poured into the hollow section. After
the concrete was cured properly, the specimen was fixed into the rig frame.
Specimen level was checked to ensure it is leveled before the start of the test. All
required data such as frequency, amplitude, and mean load were created in the
system connected to the load cell. The test commenced when the entire procedure
was completed. All readings were logged into the Servocon system connected to the
load cell. This load cell was directly connected to the specimen. All the data and the
fatigue life of the specimen were recorded.
1.6.3. Mathematical method
Mathematical method was used to validate the experimental data. The reliability of
the Extended Hollobolt was also examined to establish the design proposal for the
fatigue life of the bolt. At this stage, only Extended Hollobolt connections with
concrete strengths of 40 N/mm2 were discussed. Other types of bolt were not
discussed at this stage.
Statistical analysis was used to validate the experimental data. Data from the
experimental work were validated by probability distribution. Three types of
distribution, namely, normal, lognormal, and Weibull distribution, were discussed to
find a suitable distribution. The reliability of the Extended Hollobolt was then
examined. A suitable distribution was subsequently used to predict the fatigue life of
the Extended Hollobolt connected to a concrete hollow section. Finally, the predicted
fatigue life and the safety index of the Extended Hollobolt were proposed.

Chapter 1: Introduction 2012
Norashidah Abd Rahman 11
1.7. Overview of the thesis
This thesis comprises six chapters, including the above introduction. An overview of
each chapter is provided below.
Chapter 2 discusses previous findings on blind bolt connection and provides reviews
of fatigue and the statistical methods used in analysing fatigue data. This chapter
concludes by identifying existing knowledge gaps in this area.
Chapter 3 presents the experimental work. The design experiment, experimental set-
up, and material properties are shown. Fatigue test procedures and instruments are
also presented.
Chapter 4 discusses the results and analysis of the fatigue test data, as well as the
comparison of the performances of the proposed blind bolt with the standard
Hollobolt and the standard bolt.
Chapter 5 presents the statistical analysis of the fatigue tests, which define the mean
value and the fatigue of the Extended Hollobolt categories. The results are compared
with those of the S-N curve provided by Eurocode 3. The reliability of the Extended
Hollobolt is also discussed in this chapter.
Chapter 6 concludes the thesis and makes recommendations for future work.

Chapter 2: Literature Review and Related background 2012
Norashidah Abd Rahman 12
Chapter 2 : Literature Review and Related
Background
2.1 Introduction
This chapter discusses the past and current research concerning the blind bolt and
fatigue behaviour. It also includes background research work in assessing the
reliability of the fatigue testing data.
2.2 Review of research on blind bolts
Although welding is the most suitable method for connecting structural hollow steel
sections, the high cost and labour-intensive procedures have restricted the use of this
type of connection. Welding is difficult to inspect, needs high quality control, and
must be performed in suitable weather conditions. Site welding is also costlier than
site bolting. In contrast, bolted connections are detachable, and are typically selected
for onsite assembly in order to avoid site welding, which may result in welding errors
during installation, and environmental difficulties. Several types of bolts may be used
in structural joints, including ordinary structural and high strength bolts.
The use of bolts often facilitates the assembly of a structure and only requires very
simple tools. Unless the joint is located close to the open end of a hollow section
member, it is generally difficult to connect two hollow section members or a hollow
section with an open profile or a plate directly to each other by bolting. Otherwise, it
is necessary to employ measures, such as cutting a hand access hole in the structural
hollow section member to enable the bolt to be tightened from the inside or by using
“through” or “blind” bolts. Using components such as gusset plates and brackets can

Chapter 2: Literature Review and Related background 2012
Norashidah Abd Rahman 13
help overcome this problem, but they are not generally considered aesthetically
pleasing (Barnett et al., 2000). In recent years, new fastening systems have been
developed, resulting in more convenient and efficient connections called blind bolt.
2.2.1 Blind bolt connection
The current general practice in analysing a steel structure is to assume that the
connections behave either as perfectly pinned or completely fixed elements, as
reported by Tanaka (2003) and Azizinamini (2004) and among others.
The properties of beam-column connection behaviour can be obtained from its
moment rotational relationship (M- Ø curve), and is affected by a large number of
geometric variables and material properties. The beam-column connection behaviour
relates the moment transmitted (M) to the relative rotation between the beam end of
the adjacent column (Ø) (Figure 2.1).
Figure 2.1 : Moment rotation of connection (SCI, 1997)
This connection can be classified in three ways, namely, by strength (i.e., full
strength, partial strength, or nominally pinned), by stiffness (i.e., rigid, semi-rigid, or
nominally pinned), and by ductility. M- Ø curves are used to determine the strength,
stiffness, and rotational capacity of the connection. Figure 2.2 gives an example of a
beam-column connection and its moment rotational diagram. This relationship is
Chapter 2: Literature Review and Related background 2012
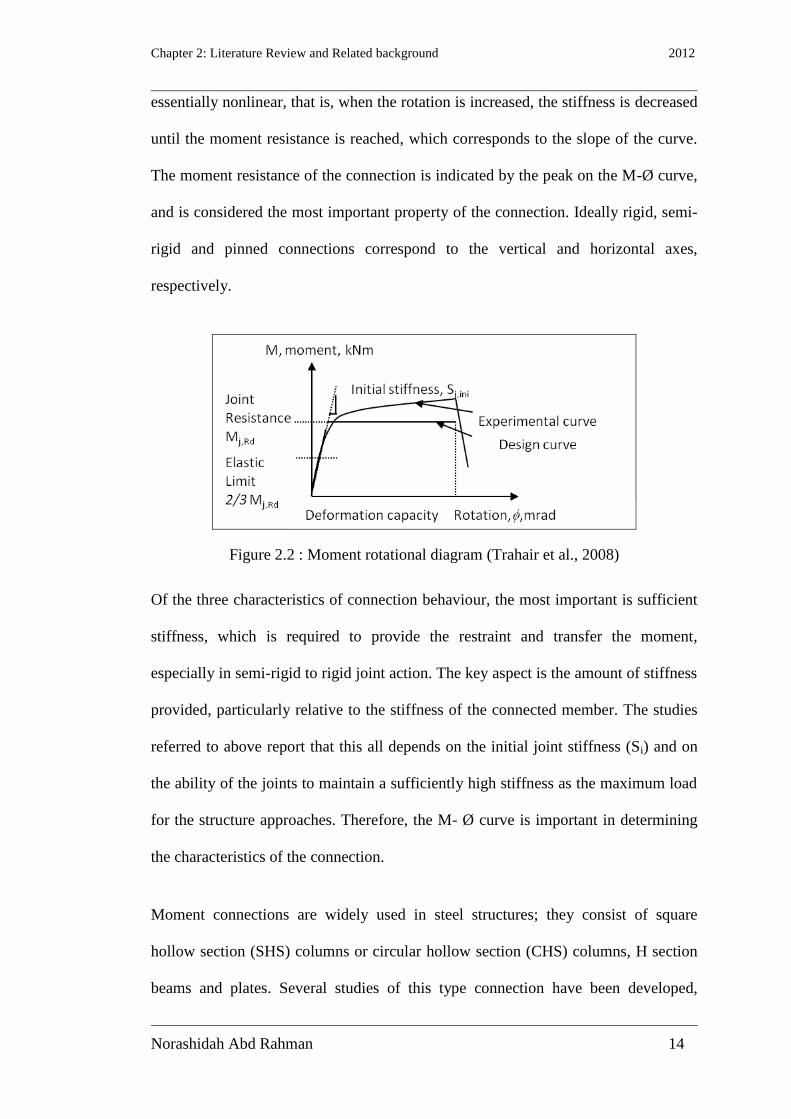
Norashidah Abd Rahman 14
essentially nonlinear, that is, when the rotation is increased, the stiffness is decreased
until the moment resistance is reached, which corresponds to the slope of the curve.
The moment resistance of the connection is indicated by the peak on the M-Ø curve,
and is considered the most important property of the connection. Ideally rigid, semi-
rigid and pinned connections correspond to the vertical and horizontal axes,
respectively.
Figure 2.2 : Moment rotational diagram (Trahair et al., 2008)
Of the three characteristics of connection behaviour, the most important is sufficient
stiffness, which is required to provide the restraint and transfer the moment,
especially in semi-rigid to rigid joint action. The key aspect is the amount of stiffness
provided, particularly relative to the stiffness of the connected member. The studies
referred to above report that this all depends on the initial joint stiffness (Si) and on
the ability of the joints to maintain a sufficiently high stiffness as the maximum load
for the structure approaches. Therefore, the M- Ø curve is important in determining
the characteristics of the connection.
Moment connections are widely used in steel structures; they consist of square
hollow section (SHS) columns or circular hollow section (CHS) columns, H section
beams and plates. Several studies of this type connection have been developed,

Chapter 2: Literature Review and Related background 2012
Norashidah Abd Rahman 15
whether in design, experimental work, or modelling. For example, Tanaka (2003)
proposed a formula for estimating the collapse moment to prevent the local
deformation of a hollow section through the application of limit analysis; the author
then verified it through comparisons with results from finite element analyses using
diagram plates. Studies have also been conducted on the moment connection using
blind bolt connection in a hollow section, both with or without concrete infill.
When a plate is used as a connection component, especially in bolted endplate
connection, this is referred to as a connection. The T-stub test is a simple test used to
understand the behaviour of a connection. Figure 2.3 shows the three possible modes
of failures using equivalent t-stub. Tests have also been conducted to determine the
failure mode using different plate thickness has been carried out elsewhere (France,
1997, Wang et al., 2009). The thicker plates show higher rigidity compared with
thinner plates.
Figure 2.3 : Column flange or bending and bolt strength (SCI, 1997)
To compare the performance of the blind bolt with the standard blind bolt, several
types of blind bolts have been tested in previous works. Korol (1993) proposed the
bolted moment connection for rectangular hollow steel columns, using high-strength
blind bolts to evaluate such a connection in terms of its performance and its failure
modes. Five-endplate, bolted beam-column assemblies of various designs were tested

Chapter 2: Literature Review and Related background 2012
Norashidah Abd Rahman 16
under monotonically increasing load, each having a W-shape beam connected to a
square HSS column. While investigating the response of the connection and its
elements, the moment rotation relationship of the test connection was also obtained.
In evaluating the performance of the connections, a bolted end-plate connection
utilizing high-strength blind bolts, as proposed for a W-shape beam and HSS
column, appeared very promising as an effective moment connection. Based on the
results of Karol (1993), the behaviour of the proposed bolted moment connection
involving a W-shape beam and a rectangular hollow section column using high
strength blind bolts (HSBB) is judged to be similar to the behaviour of connections
using ordinary A325 bolts, in terms of stiffness, moment capacity, and ductility (See
Figure 2.4). Thus, HSBB connections have a promising potential in structural
connections wherein hollow section columns are employed. A moment connection
utilizing blind oversize mechanically locked (BOM) bolts cannot achieve the
equivalent strength of A325 bolts. Hence, in applications involving principal
shearing action, it may be better to use BOM bolts.
Figure 2.4 : Moment rotation relationship for specimens S1, S2, and S3
(Korol et al., 1993)
Chapter 2: Literature Review and Related background 2012
Norashidah Abd Rahman 17
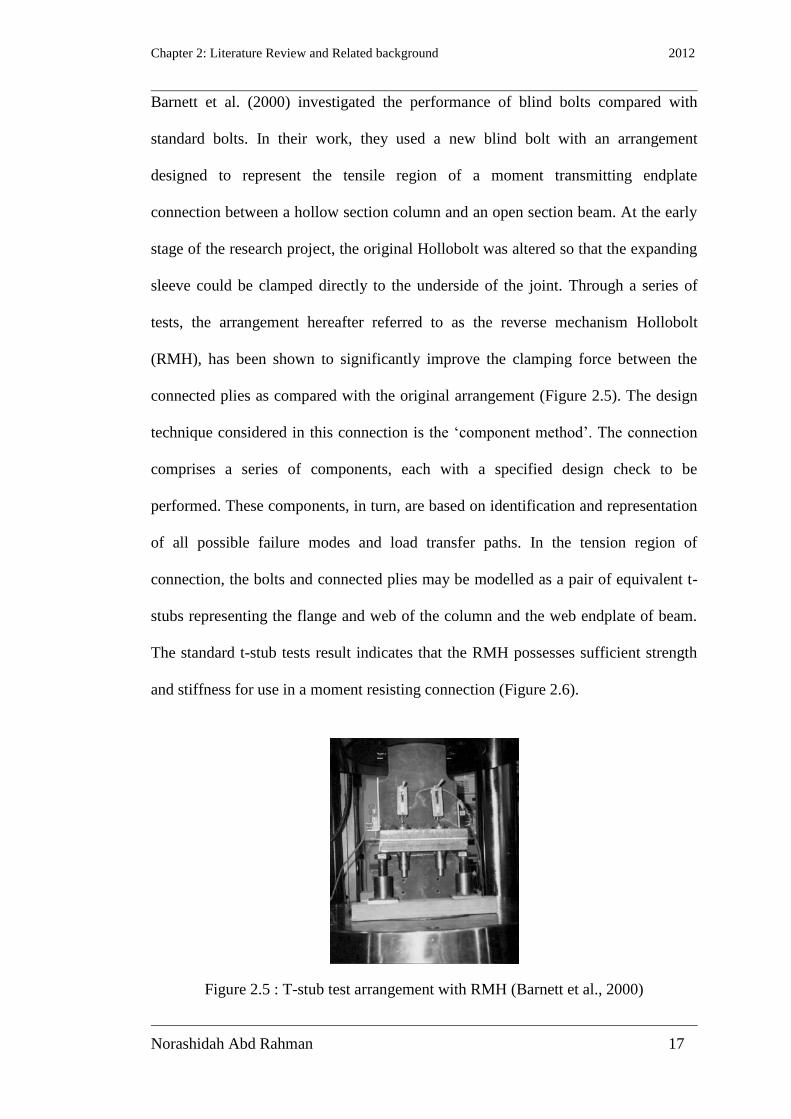
Barnett et al. (2000) investigated the performance of blind bolts compared with
standard bolts. In their work, they used a new blind bolt with an arrangement
designed to represent the tensile region of a moment transmitting endplate
connection between a hollow section column and an open section beam. At the early
stage of the research project, the original Hollobolt was altered so that the expanding
sleeve could be clamped directly to the underside of the joint. Through a series of
tests, the arrangement hereafter referred to as the reverse mechanism Hollobolt
(RMH), has been shown to significantly improve the clamping force between the
connected plies as compared with the original arrangement (Figure 2.5). The design
technique considered in this connection is the ‘component method’. The connection
comprises a series of components, each with a specified design check to be
performed. These components, in turn, are based on identification and representation
of all possible failure modes and load transfer paths. In the tension region of
connection, the bolts and connected plies may be modelled as a pair of equivalent t-
stubs representing the flange and web of the column and the web endplate of beam.
The standard t-stub tests result indicates that the RMH possesses sufficient strength
and stiffness for use in a moment resisting connection (Figure 2.6).
Figure 2.5 : T-stub test arrangement with RMH (Barnett et al., 2000)

Chapter 2: Literature Review and Related background 2012
Norashidah Abd Rahman 18
Figure 2.6 : Load Vs plate separation for the RMH t-stub test (Barnett et al., 2000)
It has been demonstrated theoretically that the flexibility of the SHS face may limit
the moment capacity of the connection when thin walls and narrow bolt gauges are
employed Thus, Barnet suggested further tests using a modified t-stub arrangement
to determine whether or not the full capacity of the RMH may be employed. These
tests are anticipated to validate a previously published theoretical model of the tube
face failure mechanism. The exploration of newly developed blind bolts continues
with the investigation on the performance of new blind bolts for moment resisting
connection (Tizani and Ridley-Ellis, 2003). Three main test series of RMH were
carried out, namely, t-stub to t-stub, t-stub to SHS, and t-stub to concrete filled SHS.
Other types of bolt such as Extended Hollobolt, Hollobolt and standard bolt were
also carried out. Throughout the entire test, a relatively rigid t-stub (50 mm thick)
was employed to eliminate the influence of endplate bending. The connection
behaviour was found to be dependent on the behaviour of the bolts and the
interaction between the bolts and the SHS. The tests, which were conducted in
displacement control, exerted predominately pure tension forces on the bolts.

Chapter 2: Literature Review and Related background 2012
Norashidah Abd Rahman 19
Figure 2.7 : Load displacement relationships (Sean Ellison, 2004)
Indeed, connections made with the RMH were seen to be almost as stiff as those
made with standard bolts (Figure 2.7). The behaviour was seen to be comparable at
the lower loads and possessed sufficient stiffness to classify the connection as
moment-resisting. The results of the initial test showed that the Extended Hollobolt
also possessed sufficient stiffness to classify the connection as moment-resisting, but
at a lower tensile strength compared with standard bolts However, a comparison
between the hollow section concrete unfilled with concrete infill to the tube shows
that the section with concrete fill has an equivalent tensile strength to that of standard
bolts; along with the axial stiffness, this indicates a rigid connection classification.
The hollow section concrete unfilled or concrete filled section affects the behaviour
of the connection, because the unfilled concrete section apparently deforms the tube
and also gives a lower strength to the connection (Figure 2.8). France (1998) studied
the effect of tube wall thickness using the flowdrill process. Thicker endplate was
also used in the test to eliminate the effect of endplate and study the tube face of
columns. Deformation of column faces was observed in every test, and more

Chapter 2: Literature Review and Related background 2012
Norashidah Abd Rahman 20
deformation was detected in the thinner column face. The behaviour performance of
stiffness, strength, and ductility also increased with thicker column face. Aside from
increasing the tube face, the other method used to increase the performance of the
connection and reduce the deformation of the column face involves adding concrete
into the column.
Figure 2.8 : Wall deformation effect of unfilled SHS (Tizani and Ridley-Ellis, 2003);
blind bolt to concrete filled tube connection
Connection technology plays an important role in the performance of hollow section
structures. A distinction, however, has to be made between CHS and RHS connected
members, because the behaviour of joints such as local behaviour of members is
different. In particular cases, such as beam-column joints in building frames with
concrete filled hollow section (CFHS) columns or concrete filled tube (CFT), both
welded and/or bolted connections can be used. Blind bolting technology is also
available for beam-column joints on hollow section frames, such as RHS columns
and beams or hollow section columns and I or H section beams.
CFHS or CFT provides excellent structural properties, especially for seismic
resistance, such as high ductility and large energy absorption capacity. In addition to

Chapter 2: Literature Review and Related background 2012
Norashidah Abd Rahman 21
the enhancement in structural properties, a considerable amount of construction time
is reduced because permanent formwork of the concrete is eliminated. Furthermore,
the CFT column system has many advantages compared with ordinary steel or the
reinforced concrete system (Tan et al., 2003, Hsu and Lin, 2003, Yu et al., 2006,
Shosuke Morino and Tsuda, 2002). The main advantages are listed below.
Interaction between steel tube and concrete: local buckling of the
steel tube is delayed, and the strength deterioration after the local
buckling is moderated due to the restraining effect of the concrete. On
the other hand, the strength of the concrete is increased due to the
confining effect provided by the steel tube.
Cross-sectional properties: the steel ratio in the CFT cross section is
much larger than those in reinforced concrete and concrete-encased
steel cross sections
Fire resistance: concrete improves fire resistance, reducing the need
for fireproofing.
Therefore, to prevent any inward deformation of blind bolt to hollow section
connection, filling the hollow section with concrete is advantageous as it prevents the
deformation of tube/column. The comparison between concrete filled and concrete
unfilled can be seen in Figure 2.9, which shows that two series of flush endplates for
serial beams have been bolted using flowdrill connection to 200 × 200 × 8 SHS
column.
Chapter 2: Literature Review and Related background 2012
Norashidah Abd Rahman 22
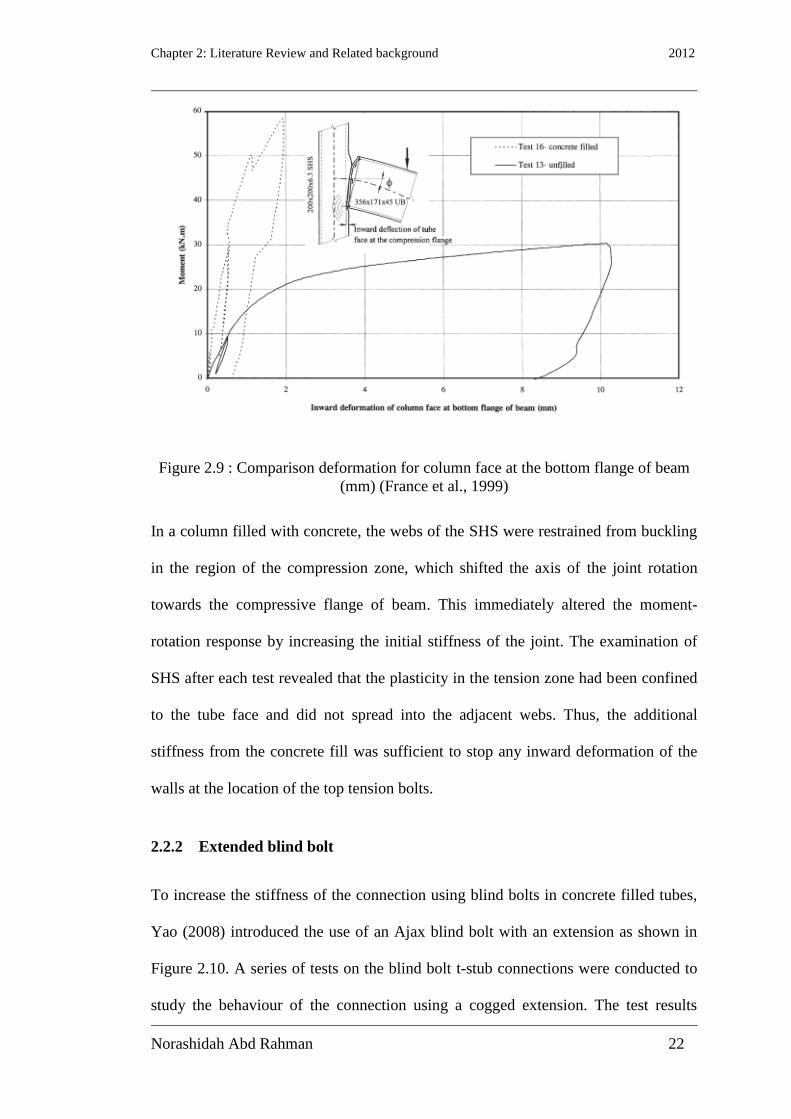
Figure 2.9 : Comparison deformation for column face at the bottom flange of beam
(mm) (France et al., 1999)
In a column filled with concrete, the webs of the SHS were restrained from buckling
in the region of the compression zone, which shifted the axis of the joint rotation
towards the compressive flange of beam. This immediately altered the moment-
rotation response by increasing the initial stiffness of the joint. The examination of
SHS after each test revealed that the plasticity in the tension zone had been confined
to the tube face and did not spread into the adjacent webs. Thus, the additional
stiffness from the concrete fill was sufficient to stop any inward deformation of the
walls at the location of the top tension bolts.
2.2.2 Extended blind bolt
To increase the stiffness of the connection using blind bolts in concrete filled tubes,
Yao (2008) introduced the use of an Ajax blind bolt with an extension as shown in
Figure 2.10. A series of tests on the blind bolt t-stub connections were conducted to
study the behaviour of the connection using a cogged extension. The test results
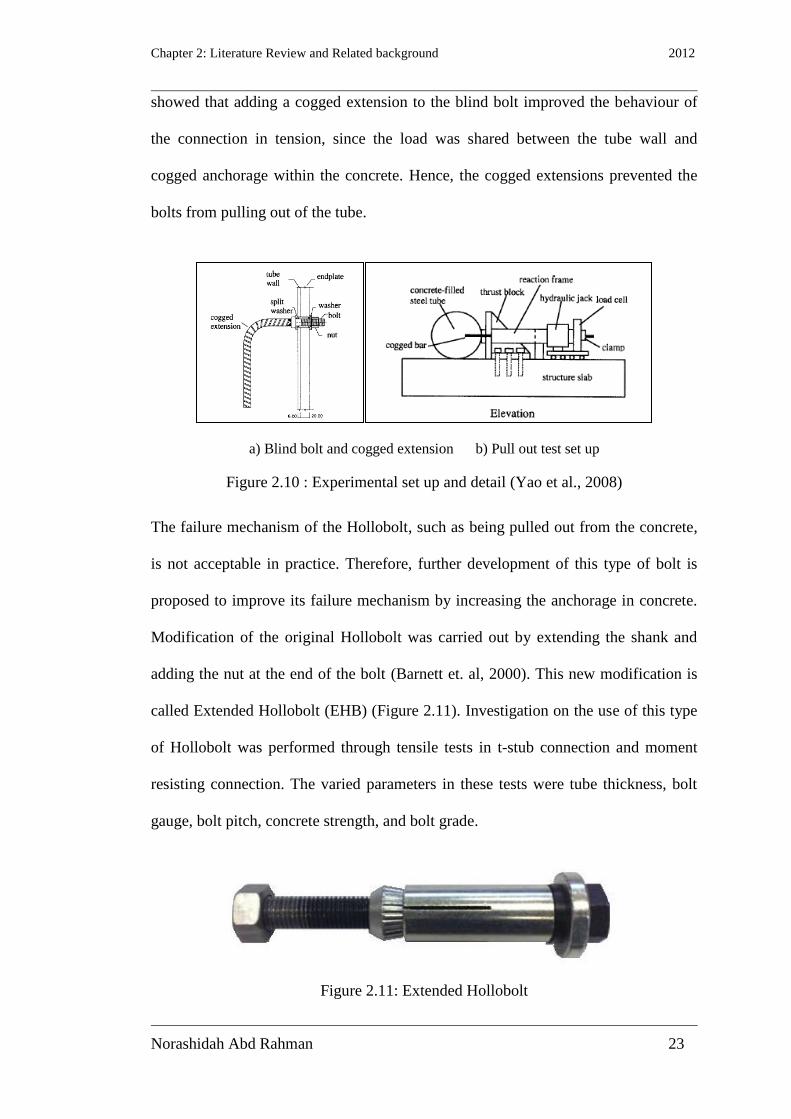
Chapter 2: Literature Review and Related background 2012
Norashidah Abd Rahman 23
showed that adding a cogged extension to the blind bolt improved the behaviour of
the connection in tension, since the load was shared between the tube wall and
cogged anchorage within the concrete. Hence, the cogged extensions prevented the
bolts from pulling out of the tube.
a) Blind bolt and cogged extension b) Pull out test set up
Figure 2.10 : Experimental set up and detail (Yao et al., 2008)
The failure mechanism of the Hollobolt, such as being pulled out from the concrete,
is not acceptable in practice. Therefore, further development of this type of bolt is
proposed to improve its failure mechanism by increasing the anchorage in concrete.
Modification of the original Hollobolt was carried out by extending the shank and
adding the nut at the end of the bolt (Barnett et. al, 2000). This new modification is
called Extended Hollobolt (EHB) (Figure 2.11). Investigation on the use of this type
of Hollobolt was performed through tensile tests in t-stub connection and moment
resisting connection. The varied parameters in these tests were tube thickness, bolt
gauge, bolt pitch, concrete strength, and bolt grade.
Figure 2.11: Extended Hollobolt
Chapter 2: Literature Review and Related background 2012
Norashidah Abd Rahman 24
The results showed that, compared with the ordinary HB, the EHB showed stiffness
improvement and increased tensile capacity (Figure 2.7). The test result shows that
the extra anchorage provided by shank length and anchorage nut helped improve the
stiffness of the bolt.
2.2.3 Blind bolt connection under cyclic load
One of the most important lessons derived from the Northridge and Hyogo Ken-
Nanbu earthquakes is the particular vulnerability of the beam-column connection in
steel moment resisting frames and building structures. Starting from this observation,
several research programmes have been developed to examine the connection
behaviour on connection performance have been underlined, and theoretical models
for reliably predicting stiffness, strength, and deformation capacity of the connection.
As bolted and rivet connections performed well in the past earthquake, particularly
when encased in concrete (Swanson and Leo, 2000), an innovative beam to concrete
filled column connection using blind bolts has been developed for seismic loading
condition. At the University of Melbourne, a series of tests on blind bolted t-stub
connections were conducted using Ajax blind bolts with or without extension into the
concrete of the column (Yao, 2008). By applying a design force of 60 kN (loaded
from 0 kN to 60 kN and back to 0 kN), the behaviour of extension was investigated.
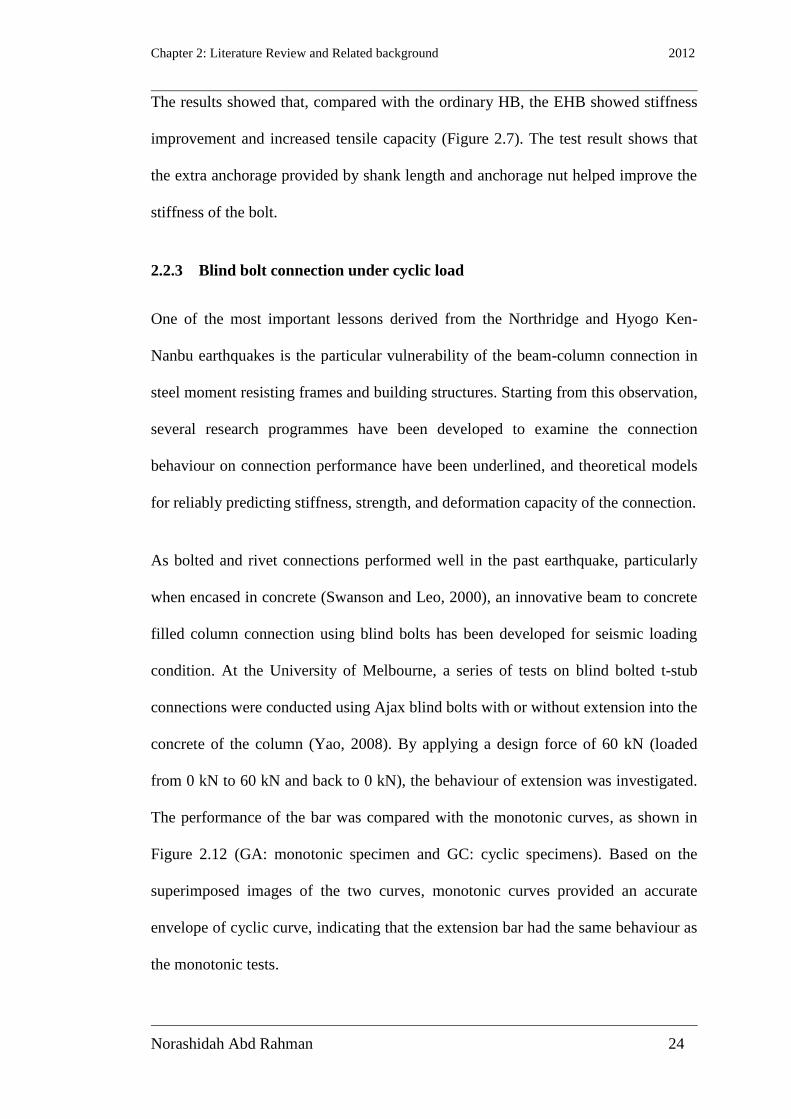
The performance of the bar was compared with the monotonic curves, as shown in
Figure 2.12 (GA: monotonic specimen and GC: cyclic specimens). Based on the
superimposed images of the two curves, monotonic curves provided an accurate
envelope of cyclic curve, indicating that the extension bar had the same behaviour as
the monotonic tests.
Chapter 2: Literature Review and Related background 2012
Norashidah Abd Rahman 25
Figure 2.12 : Load slip of pullout test under cyclic loading (Yao et al., 2008)
Wang (2009) and Elghazouli (2009) investigated the complex connections such as
the beam-column connection. Wang evaluated the hysteresis performance, failure
modes, stiffness degradation, and energy dissipation of four cruciform beams to
column connection under cyclic loading in order to investigate the seismic behaviour
of blind bolted flush endplate joint. For 28 days, self consolidating concrete (SCC)
was used with a compressive cube strength of approximately 60 N/mm2. Under
cyclic loading, all specimens displayed large rotation ductile capacities and the
majority of failure modes were similar to those under monotonic loading, which were
the bolt pullout away from the concrete wall, a longitudinal crack at the corner of the
square tube wall, and an endplate inclined and deviated from the column wall (Wang
et al., 2009).
Elghazouli (2009) carried out an investigation to find out the behaviour of the blind
bolt connection under cyclic load using 17 open beam to tubular column semi-rigid
angle connections (Figure 2.13). The cyclic system protocol based on the
recommendation provided by ECCS (ECCS, 1986) is shown in Figure 2.14.

Chapter 2: Literature Review and Related background 2012
Norashidah Abd Rahman 26
Figure 2.13 : Details of the connection configuration (Elghazouli et al., 2009)
Figure 2.14: Loading protocol (ECCS, 1986)
The test results showed that, with typical design scenarios under cyclic loading, the
connection provided a reasonable energy capability and rotational capacity above the
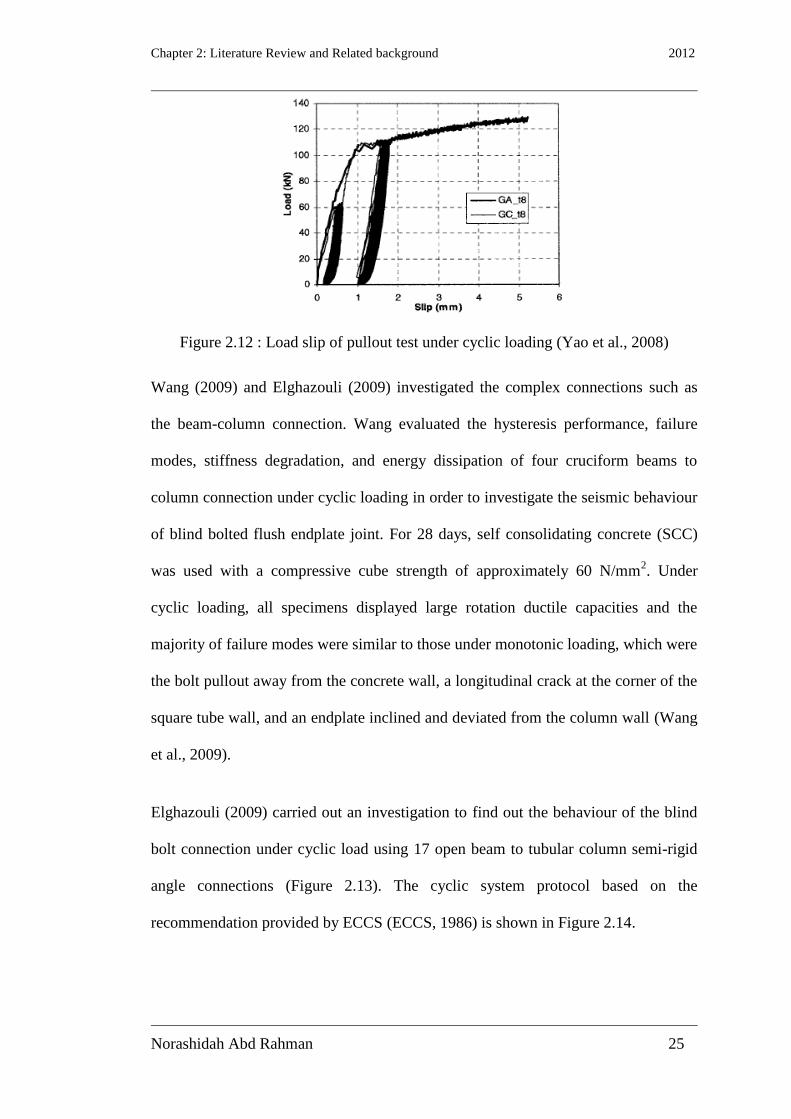
required capacity. During the experiment, one of the tests (Figure 2.15) showed that
a fracture due to low cycle fatigue occurred during the very last set of cycles at
maximum amplitude, in comparison with tests, in which there was no sign of failure
when rotation exceeded 50 mrad. However, no further test was conducted, and no
further discussion was reported under fatigue load due to the fact that their study’s
aim was to investigate the behaviour under cyclic test or, specifically, under seismic
load test.
Chapter 2: Literature Review and Related background 2012
Norashidah Abd Rahman 27
.
Figure 2.15 : Top view of the fracture due to low cycle fatigue
(Elghazouli et al., 2009)
2.3 Review of research in fatigue
Most recent studies describe the behaviour of the blind bolt when subjected to
monotonic load or cyclic load. The process of accumulating damage and finally
fracture due to cyclic loading is called fatigue. Fatigue load is primarily the type of
loading which causes cyclic variations in the applied stress or strain. Fatigue load is
categorised as one of the dynamic load groups and dynamic load is related with
effectiveness of inertia and damping force. Repeated load or reversed load is the type
of cyclic stress applied during the fatigue test. For many years, fatigue has been a
significant and difficult problem for engineers, especially for those who design
structures such as aircraft, bridges, pressure vessels, cranes, and so on (Sobczyk and
Spencer, 1992).
Fatigue is the mechanism whereby cracks grow in a structure. Growth of cracks only
occurs under fluctuating stress. Final failure generally occurs in the regions of tensile
stress, when the reduced cross-section becomes insufficient to carry the peak load
without rupture. While the loading on the structure is stationary, the crack does not
grow under normal service temperatures. Many structures, such as building frames,

Chapter 2: Literature Review and Related background 2012
Norashidah Abd Rahman 28
do not experience sufficient fluctuating stress to lead to fatigue problems. Other
structures, however, such as bridges, cranes and offshore structures, where the live
loading has a higher proportion in the total load experienced fatigue problems.
Since the 19th
century, when the use of metals in engineering applications increased,
it was widely accepted that metal components and structures subjected to repeated
load cycles may lead to failure, although the metal components and structures were
usually capable of bearing considerably larger loads if the loading were of a static
nature. This type of failure, consisting of the formation of cracks under the action of
varying loads, is known as fatigue (Ballio and Castiglioni, 1995). According to
design standards, such as EC3 (BS EN1993, 2006) and ECCS (1985), fatigue is
defined as the damage of a structural part by gradual crack propagation triggered by
repeated stress.
The first systematic investigations of fatigue were carried out by Wohler in the 1850s
and 60s. Wohler (1871) introduced the concept of fatigue with regards to welded
connection, in order to classify material degradation or failure, which was
proportional to the number of cycles of applied load. The concept is also known as
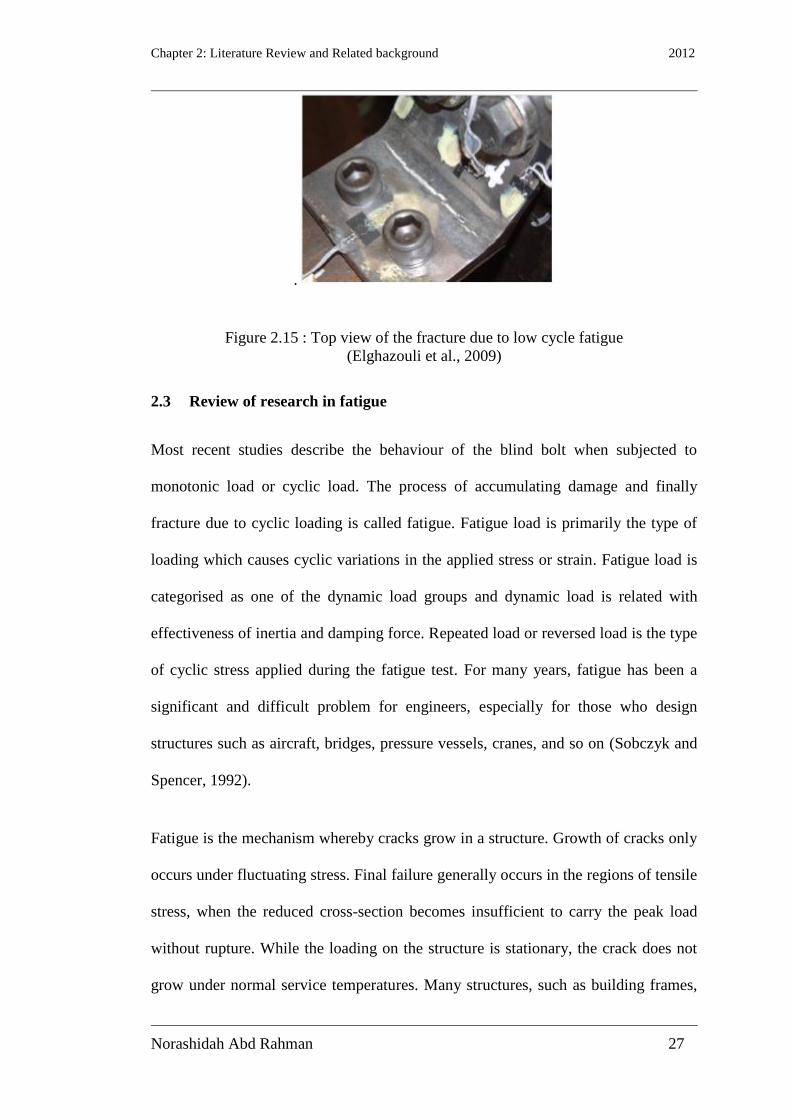
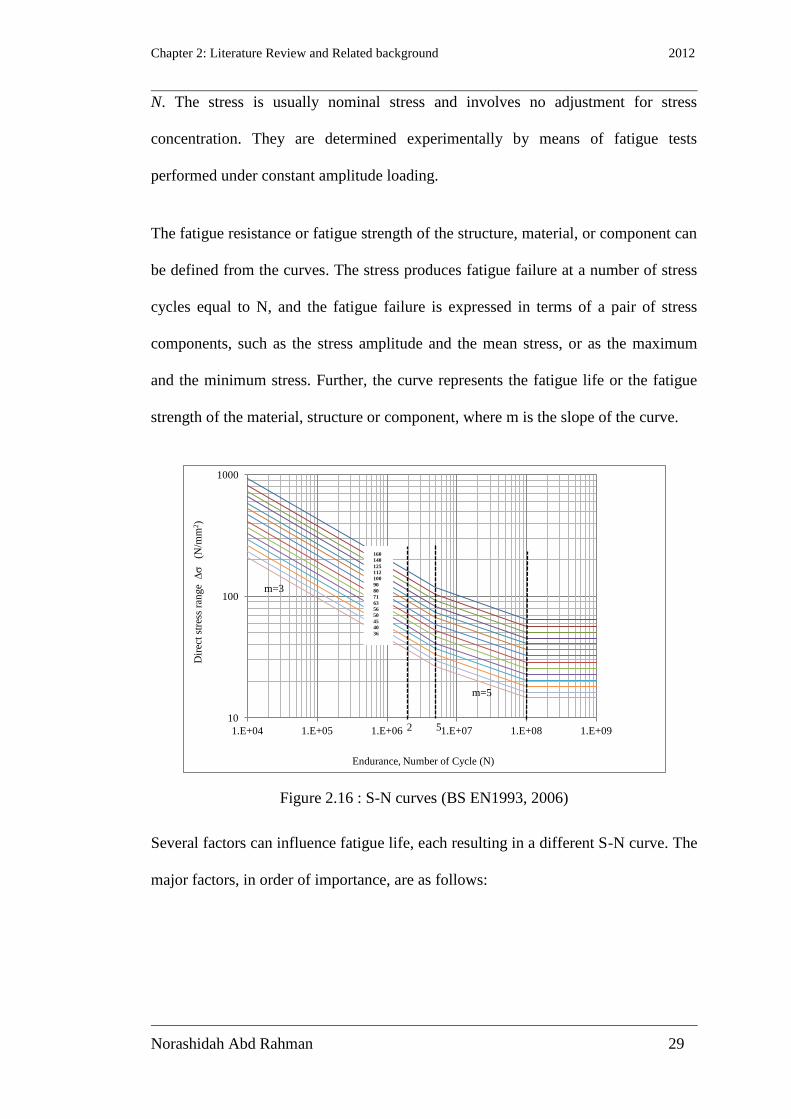
the Wohler or S-N curve. Wohler or S-N curves (Figure 2.16) are usually applied in
design procedures and serve as the design guidelines for welded connections, as
stated in Eurocode 3 for fatigue resistance. The design guideline is based on nominal
stress ranges and classified construction details. The S-N curve, otherwise known as
the stress life method is the basic method for presenting fatigue failure in high cycles
(N < 105). This method implies that the stress level is relatively low and the
deformation is in elastic range. These curves relate to the nominal stress range ,
resisting a certain number of applied loading cycles N. A log scale is always used for
Chapter 2: Literature Review and Related background 2012
Norashidah Abd Rahman 29
N. The stress is usually nominal stress and involves no adjustment for stress
concentration. They are determined experimentally by means of fatigue tests
performed under constant amplitude loading.
The fatigue resistance or fatigue strength of the structure, material, or component can
be defined from the curves. The stress produces fatigue failure at a number of stress
cycles equal to N, and the fatigue failure is expressed in terms of a pair of stress
components, such as the stress amplitude and the mean stress, or as the maximum
and the minimum stress. Further, the curve represents the fatigue life or the fatigue
strength of the material, structure or component, where m is the slope of the curve.
Figure 2.16 : S-N curves (BS EN1993, 2006)
Several factors can influence fatigue life, each resulting in a different S-N curve. The
major factors, in order of importance, are as follows:
10
100
1000
1.E+04 1.E+05 1.E+06 1.E+07 1.E+08 1.E+09 2
Endurance, Number of Cycle (N)
Dir
ect
stre
ss r
ange
(N
/mm
2)
160
140
125
112
100
90
80
71
63
56
50
45
40
36
5
m=5
m=3

Chapter 2: Literature Review and Related background 2012
Norashidah Abd Rahman 30
type of connection,
magnitude of stress executions or variations,
mean stress level, and
choice of material.
Other conditions, such as corrosive environments and extreme temperatures, also
affect fatigue performance.
2.3.1 Fatigue load
Through stress analysis, the load spectrum can be defined by the stress range, the
mean stress, and the stress sequence to which a detail is subjected. Given that this
study considers only fatigue behaviour under constant amplitude stress, the effect of
a stress sequence on the fatigue strength of a detail is not discussed. Meanwhile,
constant-amplitude cyclic-stress fluctuation is the simplest of cycle histories (Barsom
and Rolfe, 1999). This method has been proposed by various researchers in
investigating the behaviour of the connection under fatigue load. Fatigue tests are
normally carried out using constant stress amplitude for each test sample, because
they are easy to do experimentally, and they serve as a straightforward method of
presenting data. Constant amplitude can be represented by load (stress) range, mean
stress (m), alternating stress or amplitude (a), and stress ratio. During a fatigue test,
the applied stress conditions can be written as ma, where m is the static or mean
stress, and a is the alternating stress equal to half the stress range. Figure 2.17
shows the type of fatigue stress in the test. Alternating stress is considered when the
applied load is subjected to compression and tension, whereas pulsating tension and
fluctuating tension are subjected to tension.
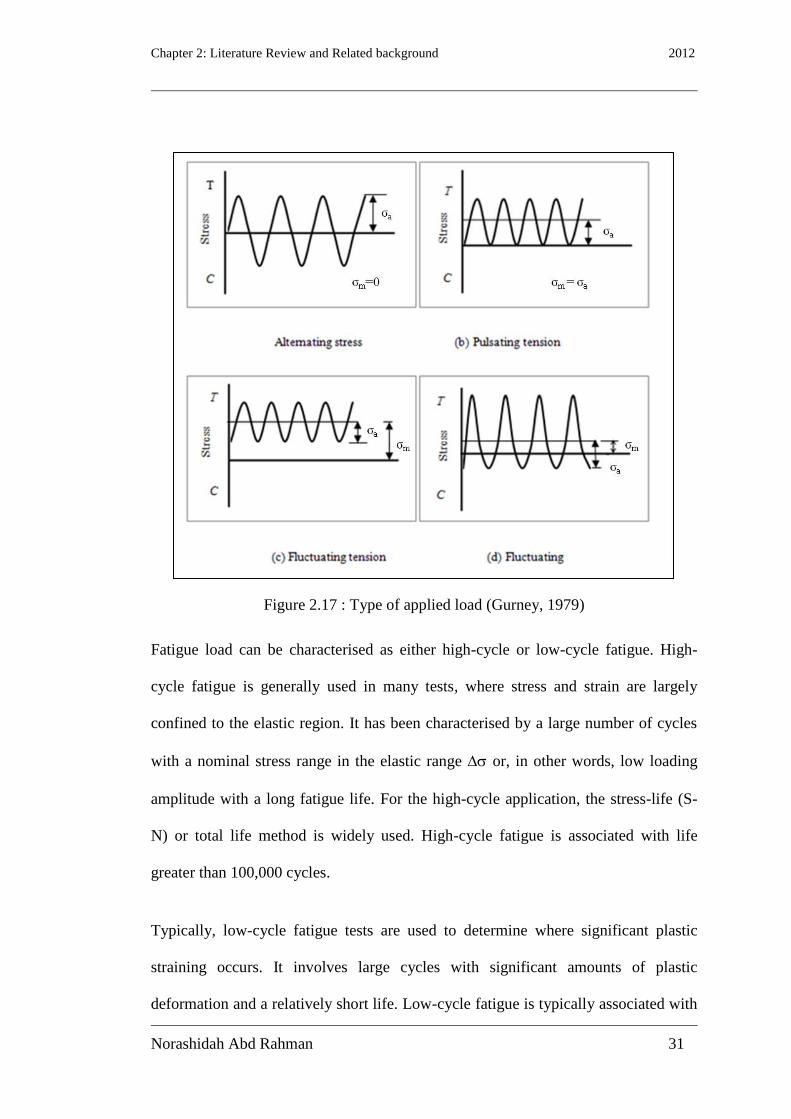
Chapter 2: Literature Review and Related background 2012
Norashidah Abd Rahman 31
Figure 2.17 : Type of applied load (Gurney, 1979)
Fatigue load can be characterised as either high-cycle or low-cycle fatigue. High-
cycle fatigue is generally used in many tests, where stress and strain are largely
confined to the elastic region. It has been characterised by a large number of cycles
with a nominal stress range in the elastic range or, in other words, low loading
amplitude with a long fatigue life. For the high-cycle application, the stress-life (S-
N) or total life method is widely used. High-cycle fatigue is associated with life
greater than 100,000 cycles.
Typically, low-cycle fatigue tests are used to determine where significant plastic
straining occurs. It involves large cycles with significant amounts of plastic
deformation and a relatively short life. Low-cycle fatigue is typically associated with

Chapter 2: Literature Review and Related background 2012
Norashidah Abd Rahman 32
fatigue life between 10 and 100,000 cycles. Table 2.1 provides a summary of the
various possible formulations of fatigue analysis. Meanwhile Table 2.2 demonstrates
the difference between high-cycle and low-cycle loading applied during the test.
Table 2.1 : Formulation of fatigue rules (Ioannis Vayas et al., 2003)
Structural response Elastic – Inelastic
Number of cycles
to failure
104 to 10
8 10
2 to 10
4 10
0 to 10
2
Fatigue curve for
ranges of
Generalised forces Generalised total
deformation
Generalised
inelastic
deformations
Usual fields of
application
Bridges, crane
girders, chimneys,
masts, and others
Slender plate
girders, and others
Buildings under
seismic loading
Table 2.2 : Comparison table for high cycle and low cycle
High-cycle fatigue Low-cycle fatigue
Amplitude Stress is low and deformation is
primary elastic
Stress is high enough for plastic
deformation to occur; stress is
less useful and the strain in the
material offers a simple
description.
Fatigue life Associated with long life Associated with short life
Amplitude
condition
Should not exceed 1.5 times the yield
stress to avoid alternating yielding
(Ioannis Vayas et al., 2003)
Stress range concept is not valid
and fatigue strength is
determined more by strain range

Chapter 2: Literature Review and Related background 2012
Norashidah Abd Rahman 33
Research on the effect and relationship of the fatigue loading type has been carried
out (Birkemoe and Srinivasan, 1971, Ballio and Castiglioni, 1995, Plumier et al.,
1998, Ghazali and Din, 2004, Birkemoe et al., 1969). The results show that high-
cycle fatigue with a small decrease in stress causes a larger number of cycles,
whereas a large stress range in low cycle fatigue gives fewer cycles. Thus, the test
under low-cycle fatigue can be classified in the same way as the high-cycle fatigue.
Even so, using low-cycle fatigue can save testing time, especially in laboratories, but
the existing information more commonly uses high-cycle fatigue. High-cycle fatigue
failure initiates local damage due to repeated loads that, in turn, leads to the
deformation of a small local crack. The extent of the fatigue crack is gradually
increased by the sequence of load repetitions until the effective cross section is
finally reduced, leading to catastrophic failure. However, this high-cycle fatigue only
becomes a design problem when a large number of loading cycles involving tensile
stress are likely to occur during the structure’s design life (compressive stress does
not cause fatigue). This is often the case for bridges, cranes, and structural support
machinery wind and wave loading.
Another kind of fatigue load usually applied during the test is variable amplitude
loading. This test is a complex function, in which there is an extremely small
probability of the same sequence and the magnitude of stress range recurring at a
particular time. Examples of this type of fatigue load histories include wind loading
on aircraft, wave loading on ships, and offshore platform and truck loading on
bridges.

Chapter 2: Literature Review and Related background 2012
Norashidah Abd Rahman 34
2.3.2 Effect of mean stress or stress range
The dependent fatigue life on stress amplitude is represented on the S-N plot. Such
data are taken for a constant mean stress, m, often for reversed cycle situation (m =
0). However, mean stress also affects fatigue life, and its influence may be
represented by a series of S-N curves, each measured at different m. Increasing the
mean stress level leads to a decrease in fatigue life. A previous study (Bouwman,
1979) investigated the effect of mean stress on the fatigue strength of untightened
bolts by applying different minimum values to the system. The experiment results
showed that the larger the amplitude, the smaller the number of cycles before
fracture occurred. To prove the effect of the stress amplitude, Ballio (1995) and
Ghazali (2004) carried out other experiments, in which they applied both low-cycle
and high-cycle fatigue. Low-cycle fatigue gives a small number of cycles compared
with high-cycle fatigue (Table 2.1), where the number of cycles produced from the
testing was less than 103.
The effect of the stress magnitude and stress ratio (R-value) on fatigue life is
demonstrated in Figure 2.18, which shows that maximum tensile stress decreases
from its ultimate static value fu in an approximately linear fashion as N, the logarithm
of the number of cycles, increases (Trahair et al., 2008).
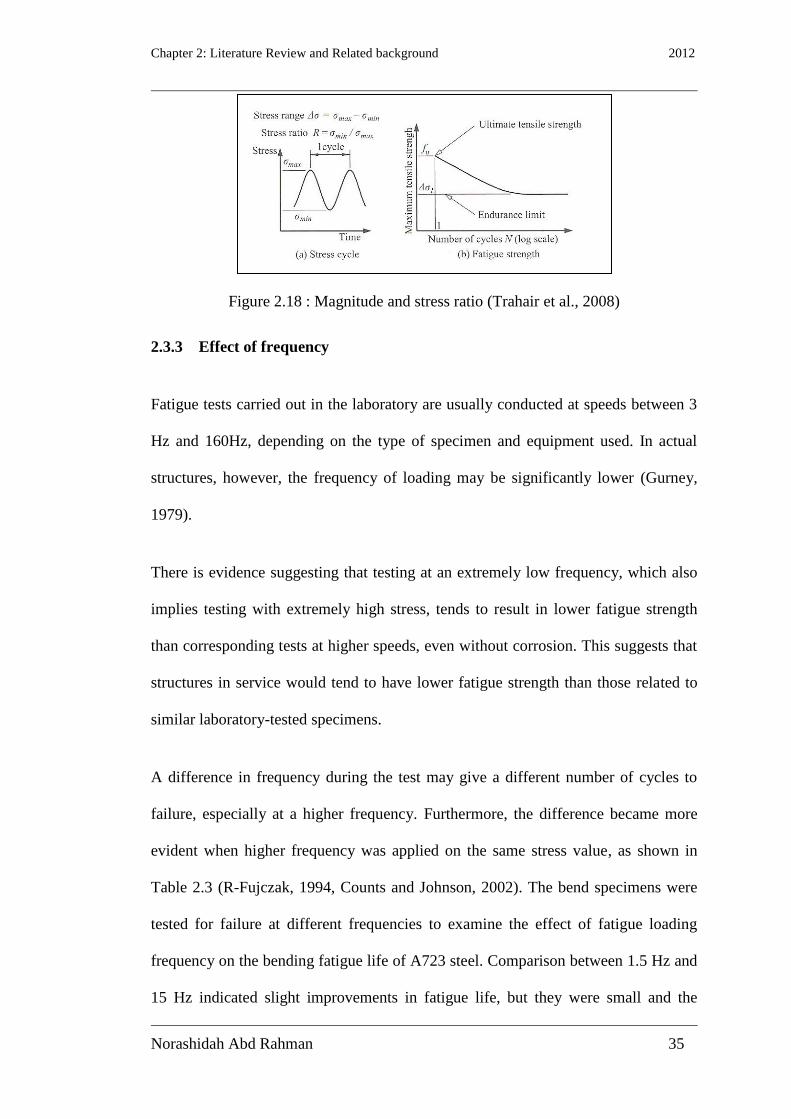
Chapter 2: Literature Review and Related background 2012
Norashidah Abd Rahman 35
Figure 2.18 : Magnitude and stress ratio (Trahair et al., 2008)
2.3.3 Effect of frequency
Fatigue tests carried out in the laboratory are usually conducted at speeds between 3
Hz and 160Hz, depending on the type of specimen and equipment used. In actual
structures, however, the frequency of loading may be significantly lower (Gurney,
1979).
There is evidence suggesting that testing at an extremely low frequency, which also
implies testing with extremely high stress, tends to result in lower fatigue strength
than corresponding tests at higher speeds, even without corrosion. This suggests that
structures in service would tend to have lower fatigue strength than those related to
similar laboratory-tested specimens.
A difference in frequency during the test may give a different number of cycles to
failure, especially at a higher frequency. Furthermore, the difference became more
evident when higher frequency was applied on the same stress value, as shown in
Table 2.3 (R-Fujczak, 1994, Counts and Johnson, 2002). The bend specimens were
tested for failure at different frequencies to examine the effect of fatigue loading
frequency on the bending fatigue life of A723 steel. Comparison between 1.5 Hz and
15 Hz indicated slight improvements in fatigue life, but they were small and the
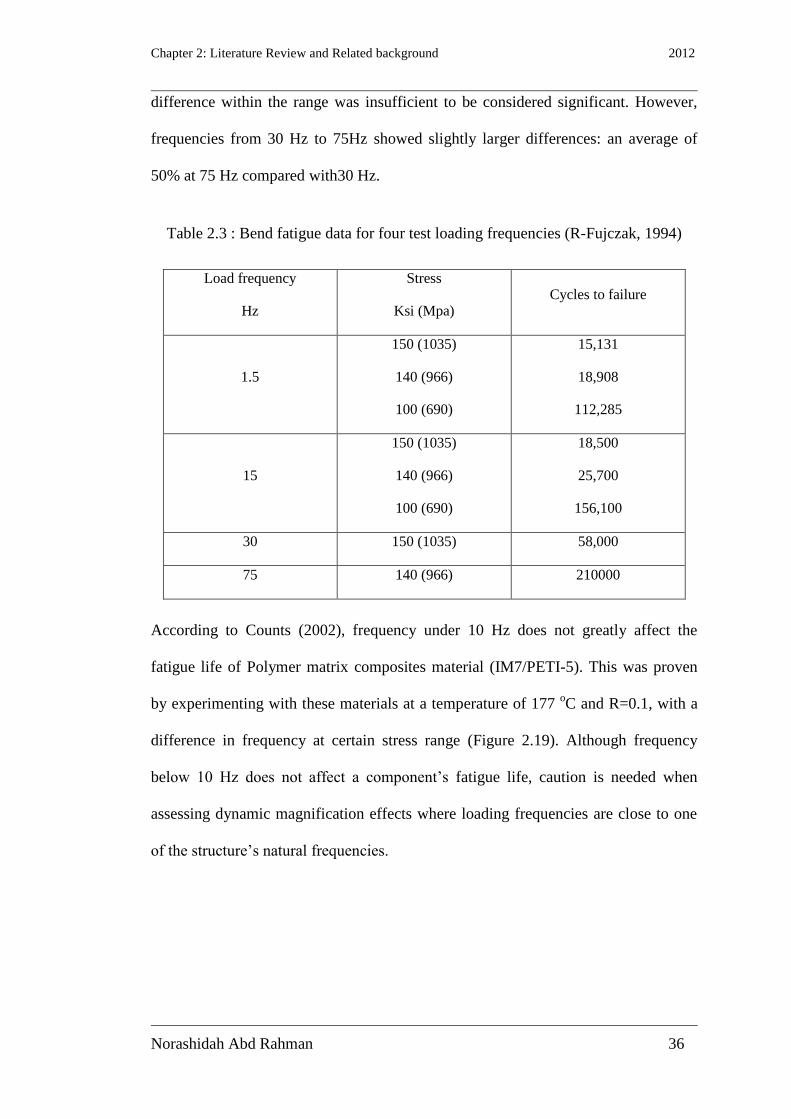
Chapter 2: Literature Review and Related background 2012
Norashidah Abd Rahman 36
difference within the range was insufficient to be considered significant. However,
frequencies from 30 Hz to 75Hz showed slightly larger differences: an average of
50% at 75 Hz compared with30 Hz.
Table 2.3 : Bend fatigue data for four test loading frequencies (R-Fujczak, 1994)
Load frequency
Hz
Stress
Ksi (Mpa) Cycles to failure
1.5
150 (1035)
140 (966)
100 (690)
15,131
18,908
112,285
15
150 (1035)
140 (966)
100 (690)
18,500
25,700
156,100
30 150 (1035) 58,000
75 140 (966) 210000
According to Counts (2002), frequency under 10 Hz does not greatly affect the
fatigue life of Polymer matrix composites material (IM7/PETI-5). This was proven
by experimenting with these materials at a temperature of 177 oC and R=0.1, with a
difference in frequency at certain stress range (Figure 2.19). Although frequency
below 10 Hz does not affect a component’s fatigue life, caution is needed when
assessing dynamic magnification effects where loading frequencies are close to one
of the structure’s natural frequencies.
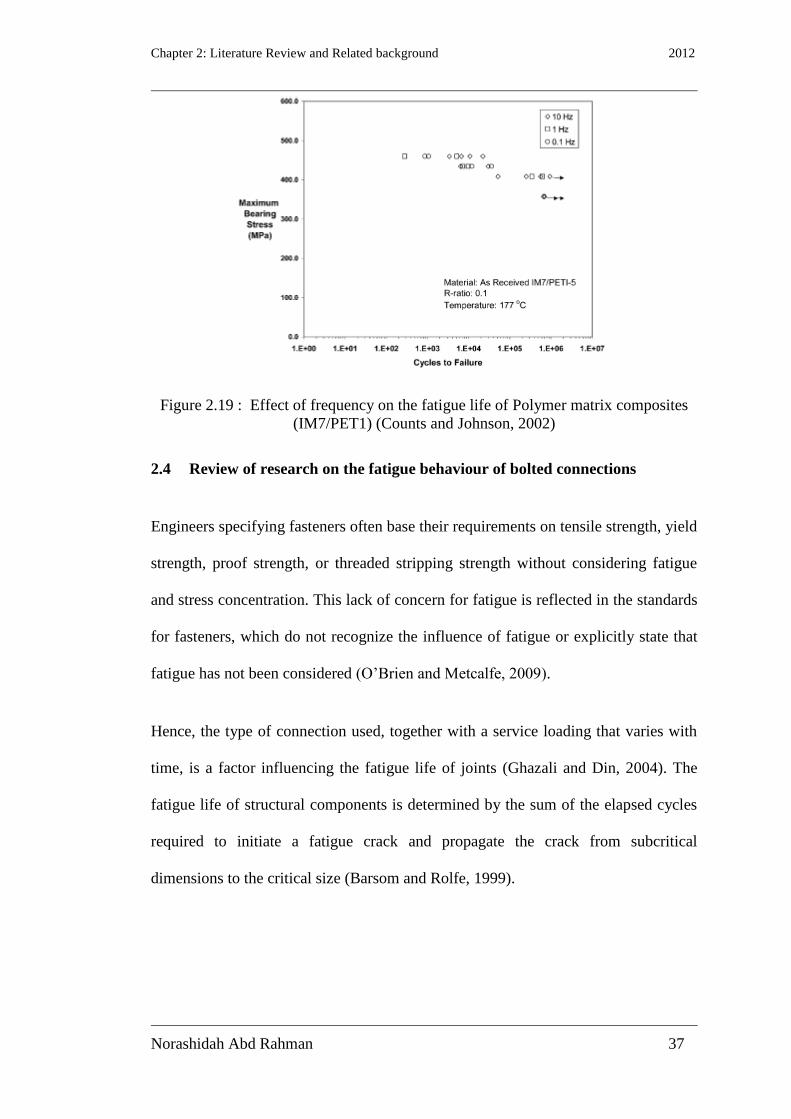
Chapter 2: Literature Review and Related background 2012
Norashidah Abd Rahman 37
Figure 2.19 : Effect of frequency on the fatigue life of Polymer matrix composites
(IM7/PET1) (Counts and Johnson, 2002)
2.4 Review of research on the fatigue behaviour of bolted connections
Engineers specifying fasteners often base their requirements on tensile strength, yield
strength, proof strength, or threaded stripping strength without considering fatigue
and stress concentration. This lack of concern for fatigue is reflected in the standards
for fasteners, which do not recognize the influence of fatigue or explicitly state that
fatigue has not been considered (O’Brien and Metcalfe, 2009).
Hence, the type of connection used, together with a service loading that varies with
time, is a factor influencing the fatigue life of joints (Ghazali and Din, 2004). The
fatigue life of structural components is determined by the sum of the elapsed cycles
required to initiate a fatigue crack and propagate the crack from subcritical
dimensions to the critical size (Barsom and Rolfe, 1999).
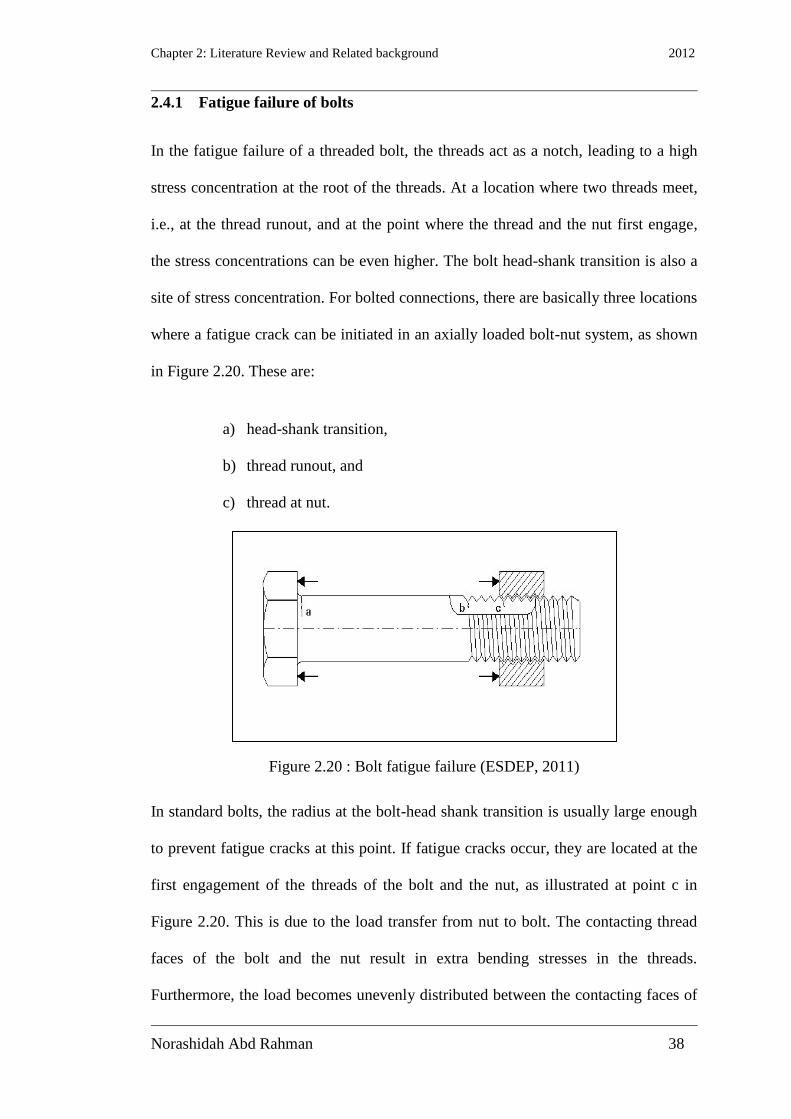
Chapter 2: Literature Review and Related background 2012
Norashidah Abd Rahman 38
2.4.1 Fatigue failure of bolts
In the fatigue failure of a threaded bolt, the threads act as a notch, leading to a high
stress concentration at the root of the threads. At a location where two threads meet,
i.e., at the thread runout, and at the point where the thread and the nut first engage,
the stress concentrations can be even higher. The bolt head-shank transition is also a
site of stress concentration. For bolted connections, there are basically three locations
where a fatigue crack can be initiated in an axially loaded bolt-nut system, as shown
in Figure 2.20. These are:
a) head-shank transition,
b) thread runout, and
c) thread at nut.
Figure 2.20 : Bolt fatigue failure (ESDEP, 2011)
In standard bolts, the radius at the bolt-head shank transition is usually large enough
to prevent fatigue cracks at this point. If fatigue cracks occur, they are located at the
first engagement of the threads of the bolt and the nut, as illustrated at point c in
Figure 2.20. This is due to the load transfer from nut to bolt. The contacting thread
faces of the bolt and the nut result in extra bending stresses in the threads.
Furthermore, the load becomes unevenly distributed between the contacting faces of
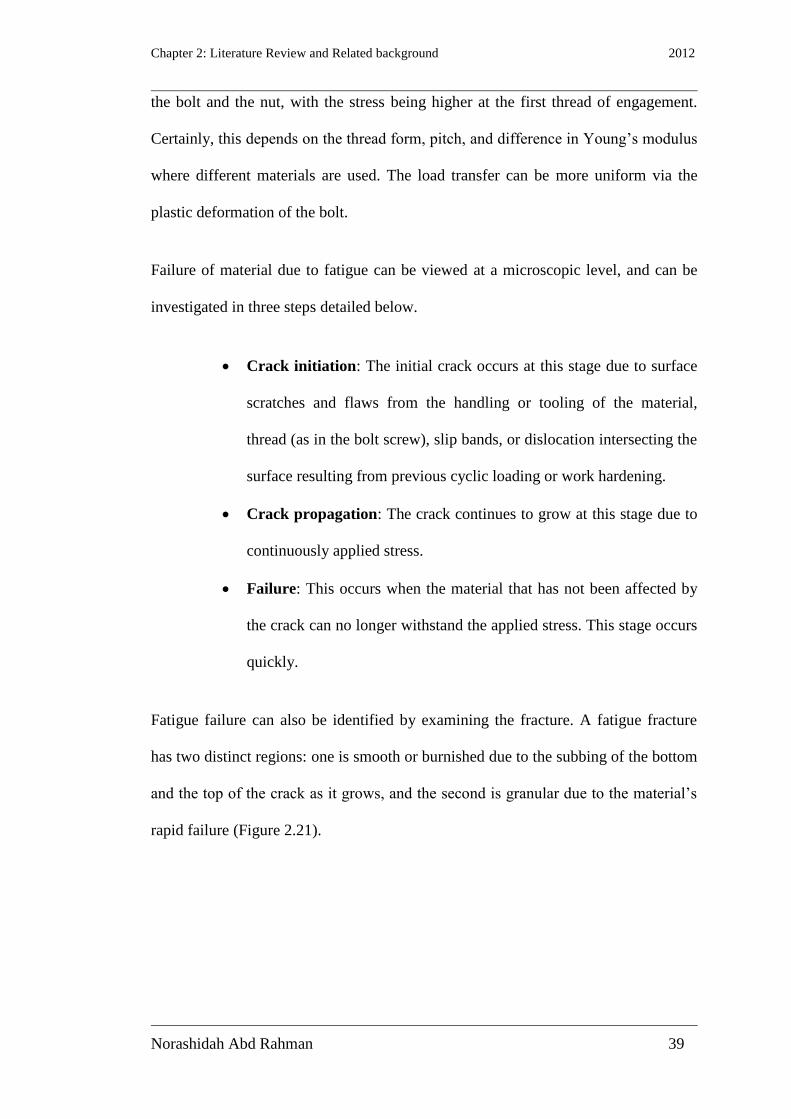
Chapter 2: Literature Review and Related background 2012
Norashidah Abd Rahman 39
the bolt and the nut, with the stress being higher at the first thread of engagement.
Certainly, this depends on the thread form, pitch, and difference in Young’s modulus
where different materials are used. The load transfer can be more uniform via the
plastic deformation of the bolt.
Failure of material due to fatigue can be viewed at a microscopic level, and can be
investigated in three steps detailed below.
Crack initiation: The initial crack occurs at this stage due to surface
scratches and flaws from the handling or tooling of the material,
thread (as in the bolt screw), slip bands, or dislocation intersecting the
surface resulting from previous cyclic loading or work hardening.
Crack propagation: The crack continues to grow at this stage due to
continuously applied stress.
Failure: This occurs when the material that has not been affected by
the crack can no longer withstand the applied stress. This stage occurs
quickly.
Fatigue failure can also be identified by examining the fracture. A fatigue fracture
has two distinct regions: one is smooth or burnished due to the subbing of the bottom
and the top of the crack as it grows, and the second is granular due to the material’s
rapid failure (Figure 2.21).
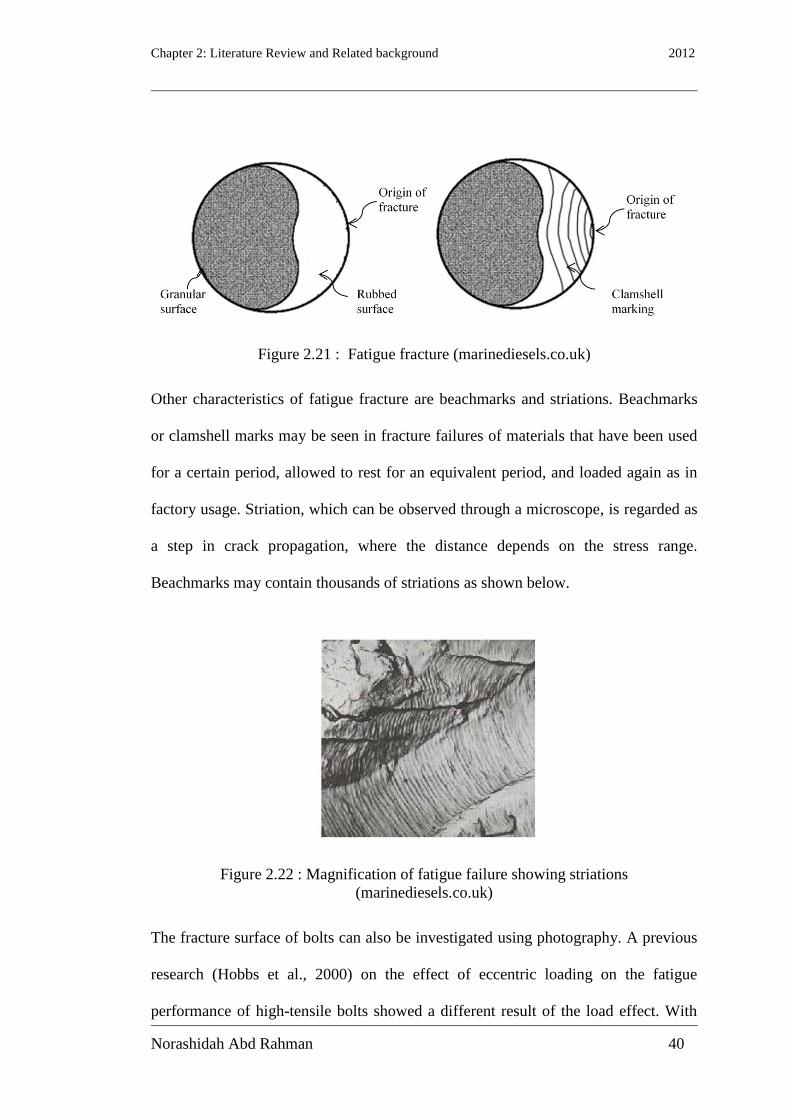
Chapter 2: Literature Review and Related background 2012
Norashidah Abd Rahman 40
Figure 2.21 : Fatigue fracture (marinediesels.co.uk)
Other characteristics of fatigue fracture are beachmarks and striations. Beachmarks
or clamshell marks may be seen in fracture failures of materials that have been used
for a certain period, allowed to rest for an equivalent period, and loaded again as in
factory usage. Striation, which can be observed through a microscope, is regarded as
a step in crack propagation, where the distance depends on the stress range.
Beachmarks may contain thousands of striations as shown below.
Figure 2.22 : Magnification of fatigue failure showing striations
(marinediesels.co.uk)
The fracture surface of bolts can also be investigated using photography. A previous
research (Hobbs et al., 2000) on the effect of eccentric loading on the fatigue
performance of high-tensile bolts showed a different result of the load effect. With

Chapter 2: Literature Review and Related background 2012
Norashidah Abd Rahman 41
axial load, it was demonstrated that the crack in the higher mean stress was more
akin to a crescent throughout its life (Figure 2.23).
Figure 2.23 : Fracture failure for bolts loaded axially with a mean stress of 584 MPa
(a) and 250 MPa (b) (Hobbs et al., 2000)
Figure 2.24 shows the crack shape resulting from the application of eccentric
loading, with (c) as the bolt loaded with the eccentricity e/D = 0.33 and (d) as the
bolt with the eccentricity of e/D = 0.008. The global stress amplitude for both bolts
loaded with eccentricity decreases from 110 Mpa (top) to 80 MPa (bottom). It can be
concluded that the eccentricity level applied on the bolt does not significantly affect
the fatigue crack’s shape. However, the mean stress level does not have an effect on
the shape of fatigue cracks, with the crack front lengthening or broadening around
the circumference of the helix as the mean stress increases.
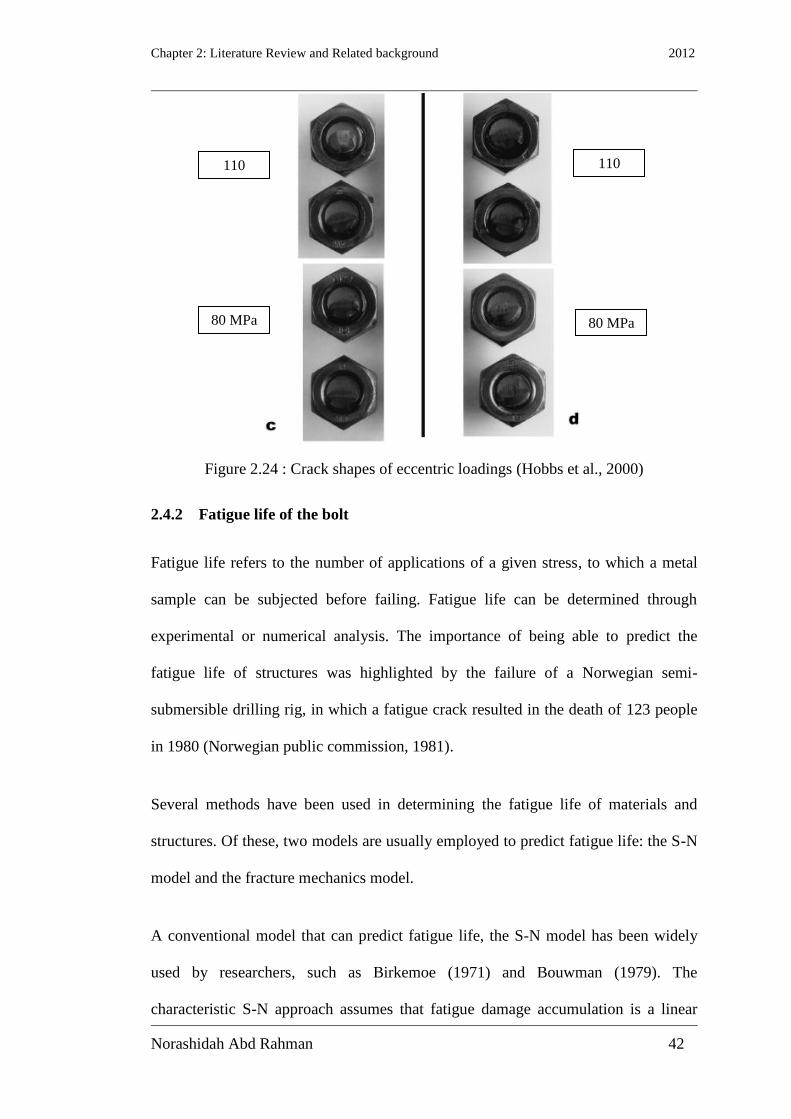
Chapter 2: Literature Review and Related background 2012
Norashidah Abd Rahman 42
Figure 2.24 : Crack shapes of eccentric loadings (Hobbs et al., 2000)
2.4.2 Fatigue life of the bolt
Fatigue life refers to the number of applications of a given stress, to which a metal
sample can be subjected before failing. Fatigue life can be determined through
experimental or numerical analysis. The importance of being able to predict the
fatigue life of structures was highlighted by the failure of a Norwegian semi-
submersible drilling rig, in which a fatigue crack resulted in the death of 123 people
in 1980 (Norwegian public commission, 1981).
Several methods have been used in determining the fatigue life of materials and
structures. Of these, two models are usually employed to predict fatigue life: the S-N
model and the fracture mechanics model.
A conventional model that can predict fatigue life, the S-N model has been widely
used by researchers, such as Birkemoe (1971) and Bouwman (1979). The
characteristic S-N approach assumes that fatigue damage accumulation is a linear
80 MPa
110
MPa
110
MPa
80 MPa
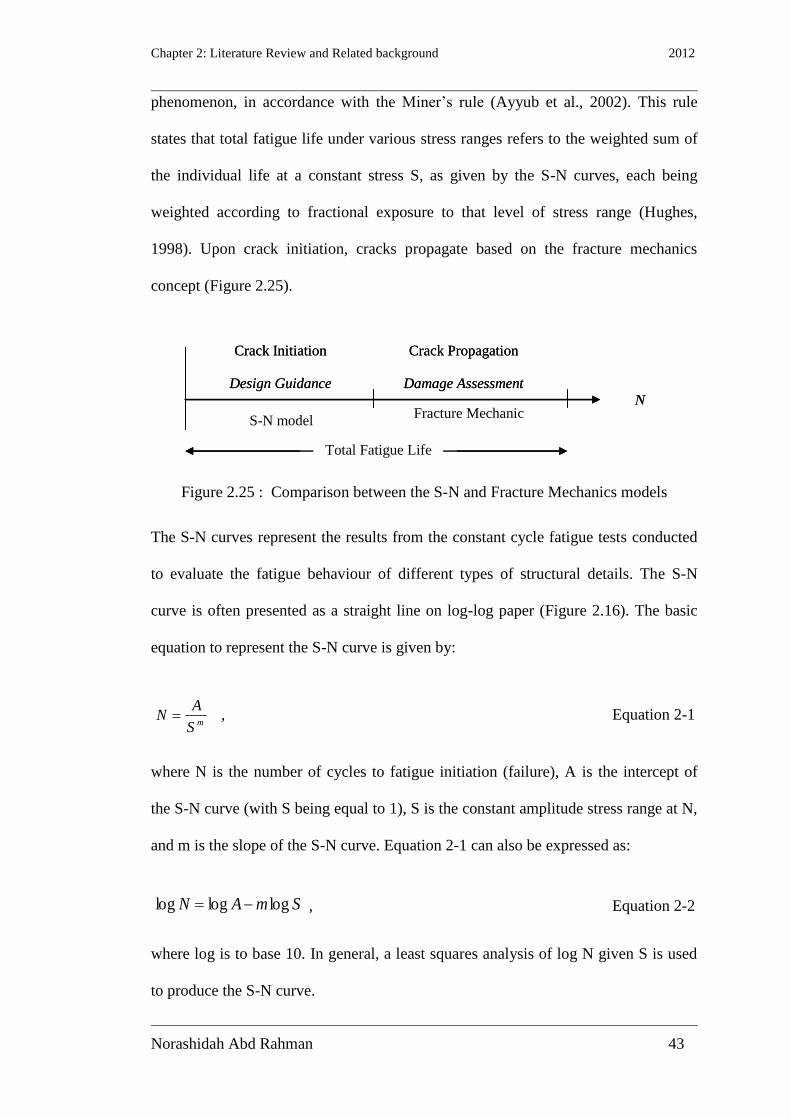
Chapter 2: Literature Review and Related background 2012
Norashidah Abd Rahman 43
phenomenon, in accordance with the Miner’s rule (Ayyub et al., 2002). This rule
states that total fatigue life under various stress ranges refers to the weighted sum of
the individual life at a constant stress S, as given by the S-N curves, each being
weighted according to fractional exposure to that level of stress range (Hughes,
1998). Upon crack initiation, cracks propagate based on the fracture mechanics
concept (Figure 2.25).
Figure 2.25 : Comparison between the S-N and Fracture Mechanics models
The S-N curves represent the results from the constant cycle fatigue tests conducted
to evaluate the fatigue behaviour of different types of structural details. The S-N
curve is often presented as a straight line on log-log paper (Figure 2.16). The basic
equation to represent the S-N curve is given by:
mS
AN , Equation 2-1
where N is the number of cycles to fatigue initiation (failure), A is the intercept of
the S-N curve (with S being equal to 1), S is the constant amplitude stress range at N,
and m is the slope of the S-N curve. Equation 2-1 can also be expressed as:
SmAN logloglog , Equation 2-2
where log is to base 10. In general, a least squares analysis of log N given S is used
to produce the S-N curve.
N
Crack Initiation
Design Guidance
domain
Crack Propagation
Damage Assessment
Domain
Total Fatigue Life
Crack Initiation
Design Guidance
domain
Crack Propagation
Damage Assessment
Domain
Total Fatigue Life
Fracture Mechanic
Model S-N model

Chapter 2: Literature Review and Related background 2012
Norashidah Abd Rahman 44
Meanwhile, the fracture mechanics model is based on crack growth data. This model
was first used by Youngwoo (2007) and Korin (2010) to predict fatigue life of bolts,
where variable fatigue load was applied. Estimating fatigue life under variable or
random fatigue load usually involved the use of the Fracture Mechanics model
(Wirsching, 1998, Tamboli, 1999). This more detailed model examines crack growth
and determines the number of load cycles needed for a small initial defect to grow
into cracks that are large enough to cause a fracture. In this model, the growth rate is
proportional to the stress range, and is expressed in terms of a stress intensity factor
K, which accounts for the magnitude of stress, current crack size, and joint details.
The basic equation governing crack growth is given by:
mKCdN
da
, Equation 2-3
where a is crack size, N is the number of fatigue cycle, ∆K is the range of stress
intensity factor, and C and m are the crack propagation parameters derived from
fracture mechanics. From the fracture mechanics model, the S-N curve can also be
plotted (Figure 2.26).
Figure 2.26 : Predicted S-N curve using a modified Fracture Mechanics model
(Youngwoo Choi et al., 2007)
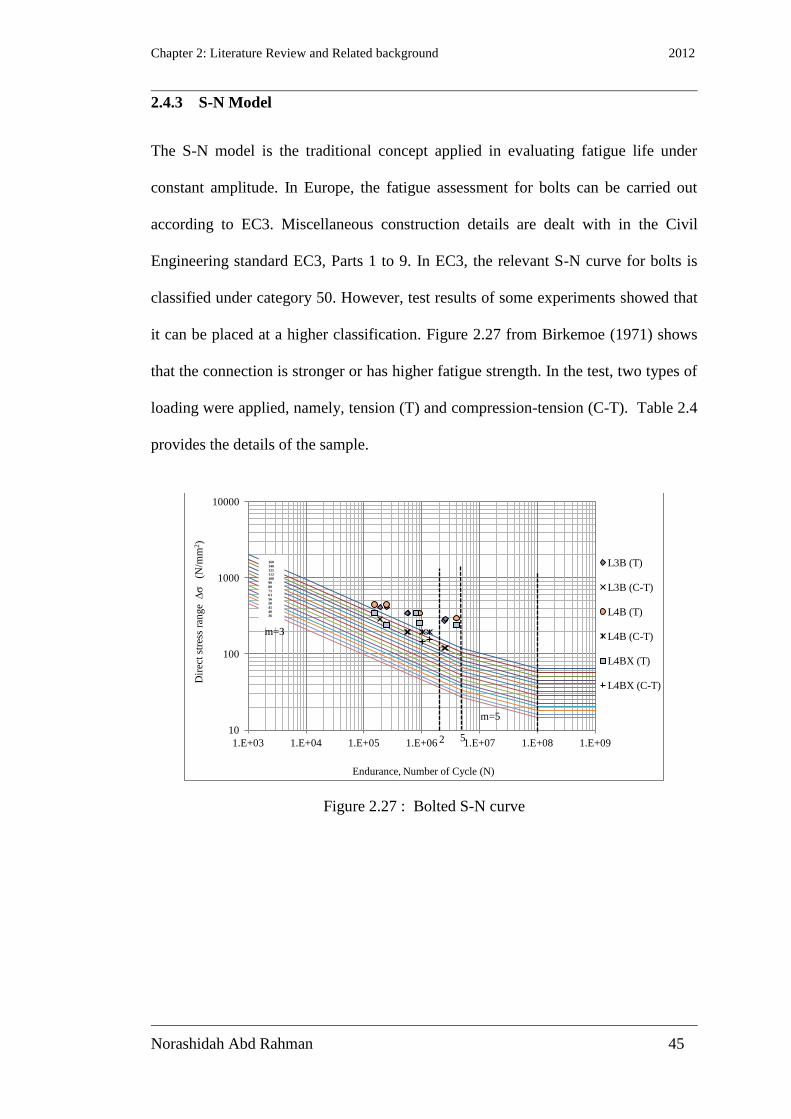
Chapter 2: Literature Review and Related background 2012
Norashidah Abd Rahman 45
2.4.3 S-N Model
The S-N model is the traditional concept applied in evaluating fatigue life under
constant amplitude. In Europe, the fatigue assessment for bolts can be carried out
according to EC3. Miscellaneous construction details are dealt with in the Civil
Engineering standard EC3, Parts 1 to 9. In EC3, the relevant S-N curve for bolts is
classified under category 50. However, test results of some experiments showed that
it can be placed at a higher classification. Figure 2.27 from Birkemoe (1971) shows
that the connection is stronger or has higher fatigue strength. In the test, two types of
loading were applied, namely, tension (T) and compression-tension (C-T). Table 2.4
provides the details of the sample.
Figure 2.27 : Bolted S-N curve
10
100
1000
10000
1.E+03 1.E+04 1.E+05 1.E+06 1.E+07 1.E+08 1.E+09
L3B (T)
L3B (C-T)
L4B (T)
L4B (C-T)
L4BX (T)
L4BX (C-T)
2
Endurance, Number of Cycle (N)
Dir
ect
stre
ss r
ange
(N
/mm
2)
160
140
125
112
100 90
80
71
63
56
50
45
40 36
5
m=5
m=3

Chapter 2: Literature Review and Related background 2012
Norashidah Abd Rahman 46
Table 2.4 : Details of the connections tested by Birkemoe (1971)
Sample Bolt grade Steel Grade Type of load Other details
L3B Four bolts of A325 A440 T -
L3B Four bolts of A325 A440 C-T -
L4B Three bolts of A490 A440 T -
L4B Three bolts of A490 A440 C-T -
L4BX Three bolts of A490 A440 T Variation of joint
efficiency L4BX Three bolts of A490 A440 C-T
From the figure above, it can be summarized that a bolt under fatigue load can be
categorised above class 50, which has greater fatigue resistance. This was also
proven by Schaumann (2009) who classified bolts with larger diameters under EC3,
indicating that the classification of 50 was for a bolt with a diameter less than 35
mm. Figure 2.28 illustrates that all test results lie above the reduced detail category
50 of EC3. Furthermore, using bolts M48 10.9 HV, with 200 kN applied preload and
60 Hz frequency, a statistical evaluation was calculated, indicating that the survival
probability of the stress levels were 97.7%. Based on EC3, this confirmed that the
reduced detail category 50 was sufficient for high-strength bolts.
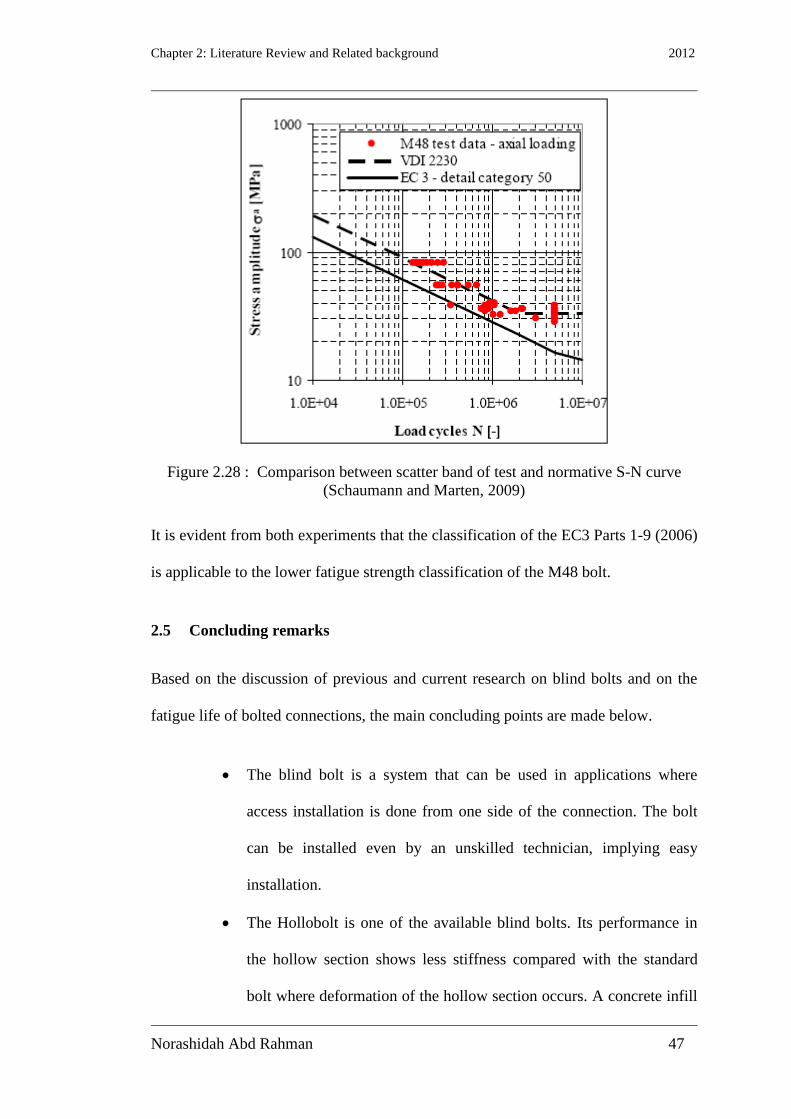
Chapter 2: Literature Review and Related background 2012
Norashidah Abd Rahman 47
Figure 2.28 : Comparison between scatter band of test and normative S-N curve
(Schaumann and Marten, 2009)
It is evident from both experiments that the classification of the EC3 Parts 1-9 (2006)
is applicable to the lower fatigue strength classification of the M48 bolt.
2.5 Concluding remarks
Based on the discussion of previous and current research on blind bolts and on the
fatigue life of bolted connections, the main concluding points are made below.
The blind bolt is a system that can be used in applications where
access installation is done from one side of the connection. The bolt
can be installed even by an unskilled technician, implying easy
installation.
The Hollobolt is one of the available blind bolts. Its performance in
the hollow section shows less stiffness compared with the standard
bolt where deformation of the hollow section occurs. A concrete infill
Chapter 2: Literature Review and Related background 2012
Norashidah Abd Rahman 48
prevents the tube face from bending. Moreover, using a thicker tube
wall increases the connection’s stiffness.
A concrete filled tube has excellent structural properties that provide
an interaction between the steel tube and the concrete and fire
resistance.
The Extended Hollobolt is a modification of the standard Hollobolt. It
is characterised by greater stiffness and strength. Previous studies
have shown that by adding anchorage, the blind bolt improves the
connection’s behaviour because the load can be shared between the
tube wall and the anchorage.
Fatigue is a critical factor, because most structural components are
subjected to repeated loads, whose magnitudes are below the fracture
load under monotonic loading.
Based on previous research, load applied at a frequency below 10 Hz
does not affect a bolted connection’s fatigue life.
Fatigue life can be predicted using the S-N model and the Fracture
Mechanics model. Selecting which model to use depends on the type
of fatigue load applied. Specifically, the S-N model can be used for
constant loads, whereas the fracture model can be used for variable or
random loads.
Greater focus has been given to the fatigue of welded connections,
which has been adopted in many design recommendations, such as
EC3, ECC3, and ASTM. In EC3, the fatigue of the bolt has been
categorised as class 50 (stress range = 50 N/mm2) with a fatigue life
of 2 million cycles.

Chapter 2: Literature Review and Related background 2012
Norashidah Abd Rahman 49
Extensive design guidance exists for the fatigue life of weld details.
However, limited information is available for bolted configurations,
because the fatigue of bolts is not considered as critical as the fatigue
of welds.
2.6 Future research directions
The following are areas that may require further research:
Cyclic tests of blind bolt connections have been conducted using
different types of blind bolts, such as the Hollobolt, the Ajax blind
bolt, and the Flowdrill. These tests have demonstrated reliable
behaviours of these bolts in concrete filled tubes, but no similar tests
have been conducted for fatigue type loading. Furthermore, limited
exploratory work with no firm endorsement exists for the low-cycle
fatigue of the standard Hollobolt.
The Extended Hollobolt to concrete filled tube demonstrated more
reliable behaviour than the standard Hollobolt. However, there is
insufficient knowledge about Extended Hollobolt fatigue that is
comparable to the EC3 fatigue assessment. Thus, the Extended
Hollobolt’s fatigue behaviour must be tested to further investigate its
behaviour under repeated loads.

Chapter 3: Experimental Work 2012
Norashidah Abd Rahman 50
Chapter 3 : Experimental Work
3.1 Introduction
This research uses experimental work to investigate the behaviour of blind bolt
connections. Fatigue testing is conducted to determine fatigue life and failure mode
when subjected to a prescribed sequence of stress amplitude (Weibull, 1961). In the
course of this research, a series of blind-bolt-to-column-joint tests is conducted to
investigate the behaviour of blind bolts when subjected to repeated loads. This
chapter describes the details of the experimental program, including materials used,
test setup, and test procedure.
3.2 Overview of Fatigue Testing
Previous study shows the HB has a higher shear capacity than standard bolts due to
its larger shear area, which is a result of the bolt area being expanded to the area of
the sleeve of the HB ( Sean Ellison, 2004). Load is applied directly to the shank of
the bolt, making the area to which the tension load is applied difficult to predict.
Therefore, loading the bolt in tension is the most appropriate method when
investigating EHB behaviour in a moment connection. In the current study’s tests,
the EHB was connected to a concrete-filled hollow section using a thick plate further
connected to the load cell. Figure 3.1 illustrates the test arrangement. The following
sections describe the materials and the test setup.
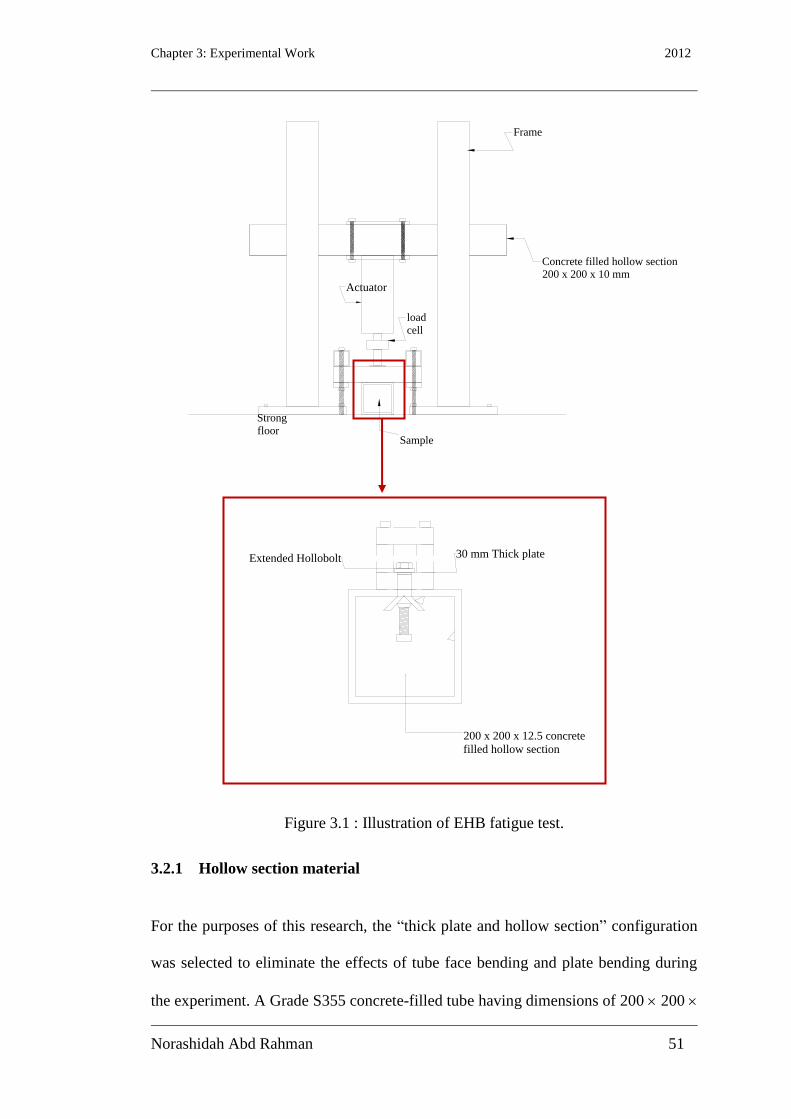
Chapter 3: Experimental Work 2012
Norashidah Abd Rahman 51
Figure 3.1 : Illustration of EHB fatigue test.
3.2.1 Hollow section material
For the purposes of this research, the “thick plate and hollow section” configuration
was selected to eliminate the effects of tube face bending and plate bending during
the experiment. A Grade S355 concrete-filled tube having dimensions of 200 200
Strong
floor
Frame
Concrete filled hollow section 200 x 200 x 10 mm
load
cell
Sample
Actuator
200 x 200 x 12.5 concrete
filled hollow section
30 mm Thick plateExtended Hollobolt

Chapter 3: Experimental Work 2012
Norashidah Abd Rahman 52
12.5 was used in the experiment (Figure 3.2). A 12.5 mm hollow section was used to
eliminate the flexibility, B/t (where B is width of tube section and t is thickness of
tube wall), in the tube wall and tube face (Al-Mughairi, 2009). The steel tube was
connected to the blind bolt using a 30 mm thick plate.
Figure 3.2 : Test arrangement
A hollow section was initially used; however, this was later replaced due to lack of
availability. Therefore, a rig was prepared to complete the fatigue test, as shown in
Figure 3.3.
Figure 3.3 : Test arrangement using Rig assembly
Concrete
Extended
Hollobolt
Actuator connector
BoltSteel Hollow
section
Collar
Thick plate
(30 mm)
Hollow
section200 x 200 x 12.5mm
500
175
175
Side View Front view
2010,5
810,5
SHS 100 x 100 x 8
180
500
180
135
6
Flange channelUKPFC180 x 75
Bottom
plate
Top
plate
18
0
8
SHS 100 x 100 x 8
6
20
175
Side view Front view

Chapter 3: Experimental Work 2012
Norashidah Abd Rahman 53
The steel rig was used repeatedly for the bolt-fatigue testing. Thus, a 20 mm thick
top plate was used to avoid deformation. Other component choices, such as plate
thickness for the connection between bolt and top plate, were similar to those in the
hollow section setup.
3.2.2 Bolts
Three types of Grade 8.8 bolts were used: a standard bolt, a standard HB, and an
EHB (Figure 3.4). The fatigue lives of the standard M16 bolt and standard HB were
determined for comparison with that of the EHB. The standard HB and standard M16
bolts were selected because under static loads, standard HB exhibit less strength and
stiffness compared to EHB, whereas standard bolts exhibit more strength and
stiffness than EHB under the same conditions.
Figure 3.4 : Types of bolts for the fatigue test
All the bolts were tightened by applying 190 Nm torque, as proposed by Lindapter
(2011). The dimensions of the bolts, such as length and shank diameter, were
measured, and the measurements were used to calculate the actual dimensions of the
material for data analysis.
Standard Bolt (M16)
Extended Hollobolt (EHB)
Standard Hollobolt (HB)

Chapter 3: Experimental Work 2012
Norashidah Abd Rahman 54
Figure 3.5 to Figure 3.7 present the actual dimensions of the EHB, the standard HB,
and the standard M16 bolt. The dimensions of each bolt, such as outer and inner
diameters, were used to determine the actual stress range value. The outer and inner
diameters of the bolt shank were measured using shadowgraph and validated using a
point micrometer. Shadowgraph is the optical system that enables to measure the part
to a higher degree of accuracy.
Figure 3.5: Actual dimensions of the EHB (all measurements in mm)
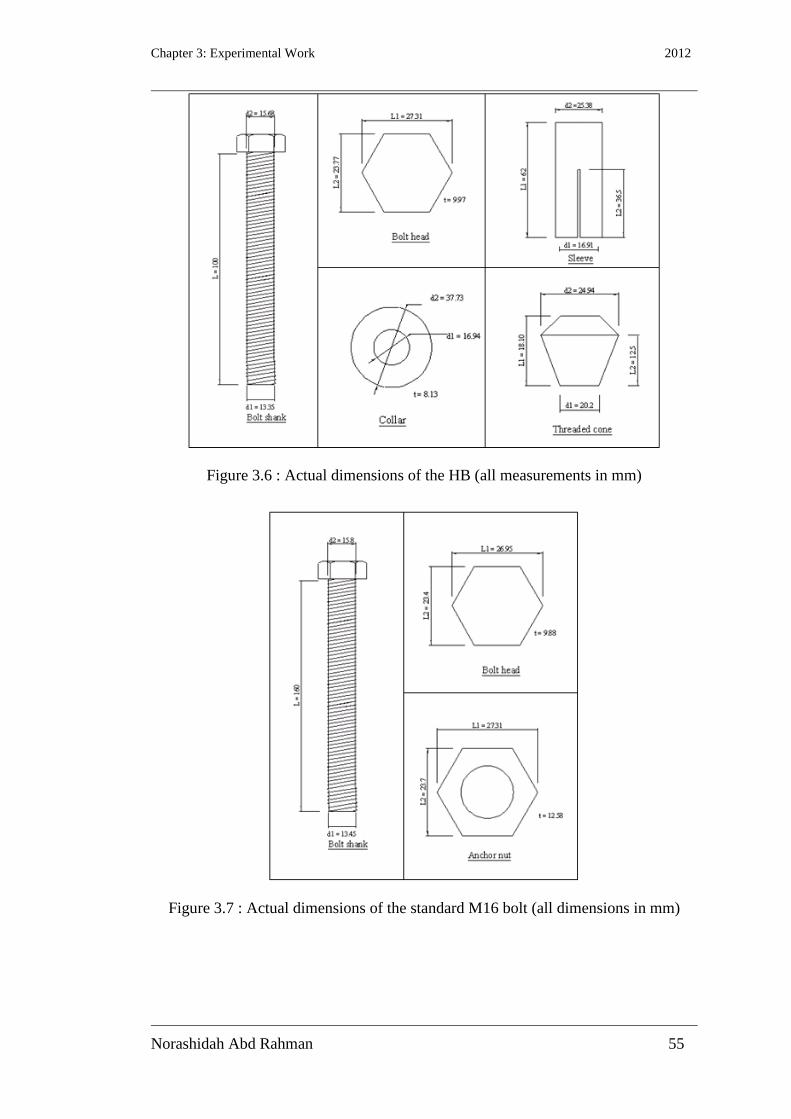
Chapter 3: Experimental Work 2012
Norashidah Abd Rahman 55
Figure 3.6 : Actual dimensions of the HB (all measurements in mm)
Figure 3.7 : Actual dimensions of the standard M16 bolt (all dimensions in mm)
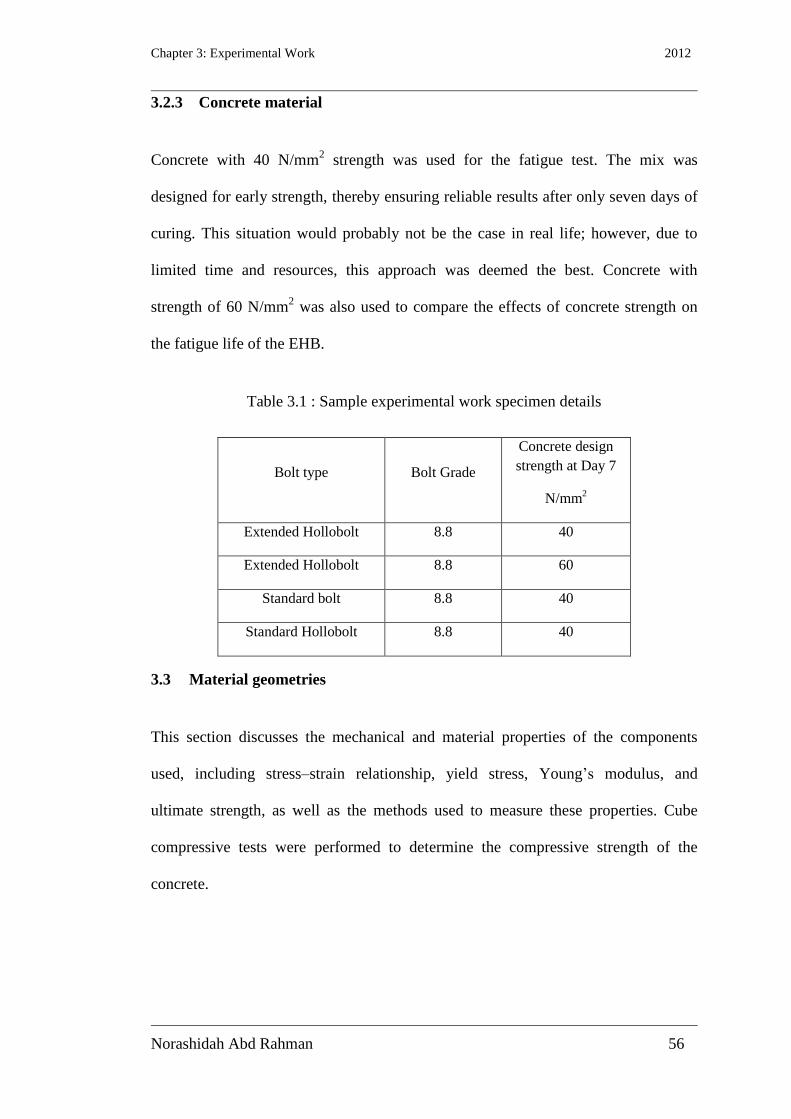
Chapter 3: Experimental Work 2012
Norashidah Abd Rahman 56
3.2.3 Concrete material
Concrete with 40 N/mm2 strength was used for the fatigue test. The mix was
designed for early strength, thereby ensuring reliable results after only seven days of
curing. This situation would probably not be the case in real life; however, due to
limited time and resources, this approach was deemed the best. Concrete with
strength of 60 N/mm2 was also used to compare the effects of concrete strength on
the fatigue life of the EHB.
Table 3.1 : Sample experimental work specimen details
Bolt type Bolt Grade
Concrete design
strength at Day 7
N/mm2
Extended Hollobolt 8.8 40
Extended Hollobolt 8.8 60
Standard bolt 8.8 40
Standard Hollobolt 8.8 40
3.3 Material geometries
This section discusses the mechanical and material properties of the components
used, including stress–strain relationship, yield stress, Young’s modulus, and
ultimate strength, as well as the methods used to measure these properties. Cube
compressive tests were performed to determine the compressive strength of the
concrete.
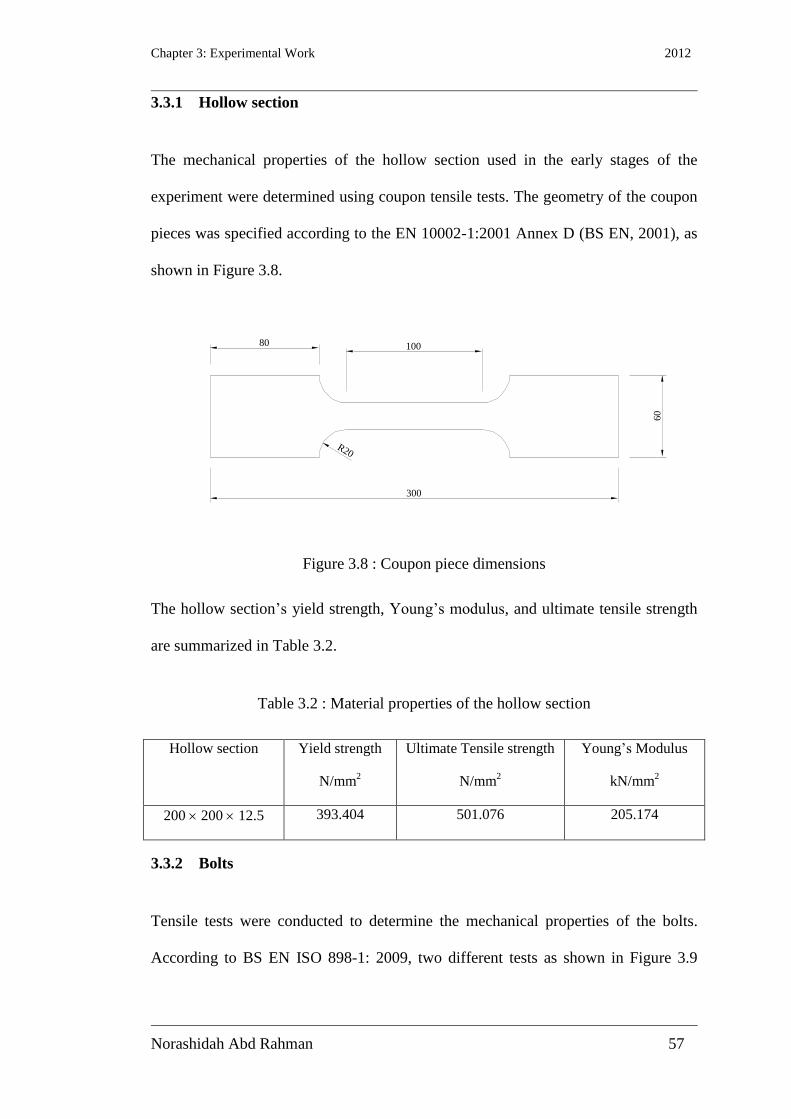
Chapter 3: Experimental Work 2012
Norashidah Abd Rahman 57
3.3.1 Hollow section
The mechanical properties of the hollow section used in the early stages of the
experiment were determined using coupon tensile tests. The geometry of the coupon
pieces was specified according to the EN 10002-1:2001 Annex D (BS EN, 2001), as
shown in Figure 3.8.
Figure 3.8 : Coupon piece dimensions
The hollow section’s yield strength, Young’s modulus, and ultimate tensile strength
are summarized in Table 3.2.
Table 3.2 : Material properties of the hollow section
Hollow section Yield strength
N/mm2
Ultimate Tensile strength
N/mm2
Young’s Modulus
kN/mm2
200 200 12.5 393.404 501.076 205.174
3.3.2 Bolts
Tensile tests were conducted to determine the mechanical properties of the bolts.
According to BS EN ISO 898-1: 2009, two different tests as shown in Figure 3.9
80
60
300
100
R20
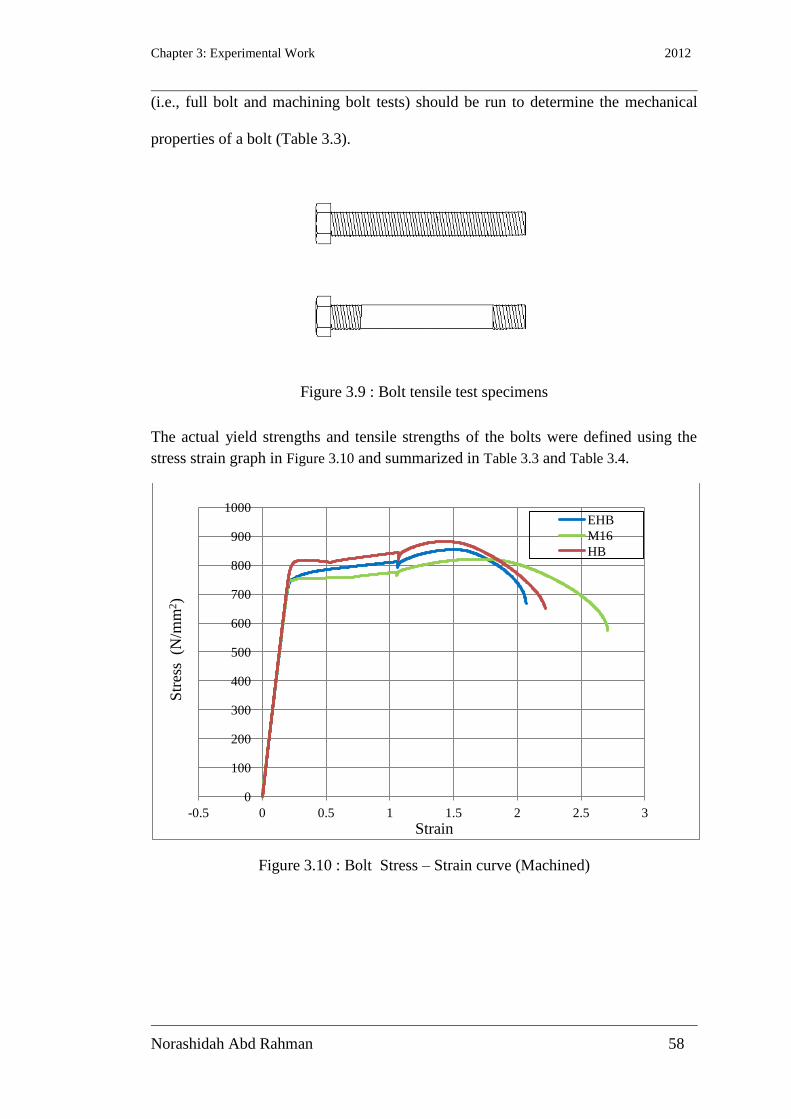
Chapter 3: Experimental Work 2012
Norashidah Abd Rahman 58
(i.e., full bolt and machining bolt tests) should be run to determine the mechanical
properties of a bolt (Table 3.3).
Figure 3.9 : Bolt tensile test specimens
The actual yield strengths and tensile strengths of the bolts were defined using the
stress strain graph in Figure 3.10 and summarized in Table 3.3 and Table 3.4.
Figure 3.10 : Bolt Stress – Strain curve (Machined)
0
100
200
300
400
500
600
700
800
900
1000
-0.5 0 0.5 1 1.5 2 2.5 3
EHB
M16
HB
Str
ess
(N
/mm
2)
Strain
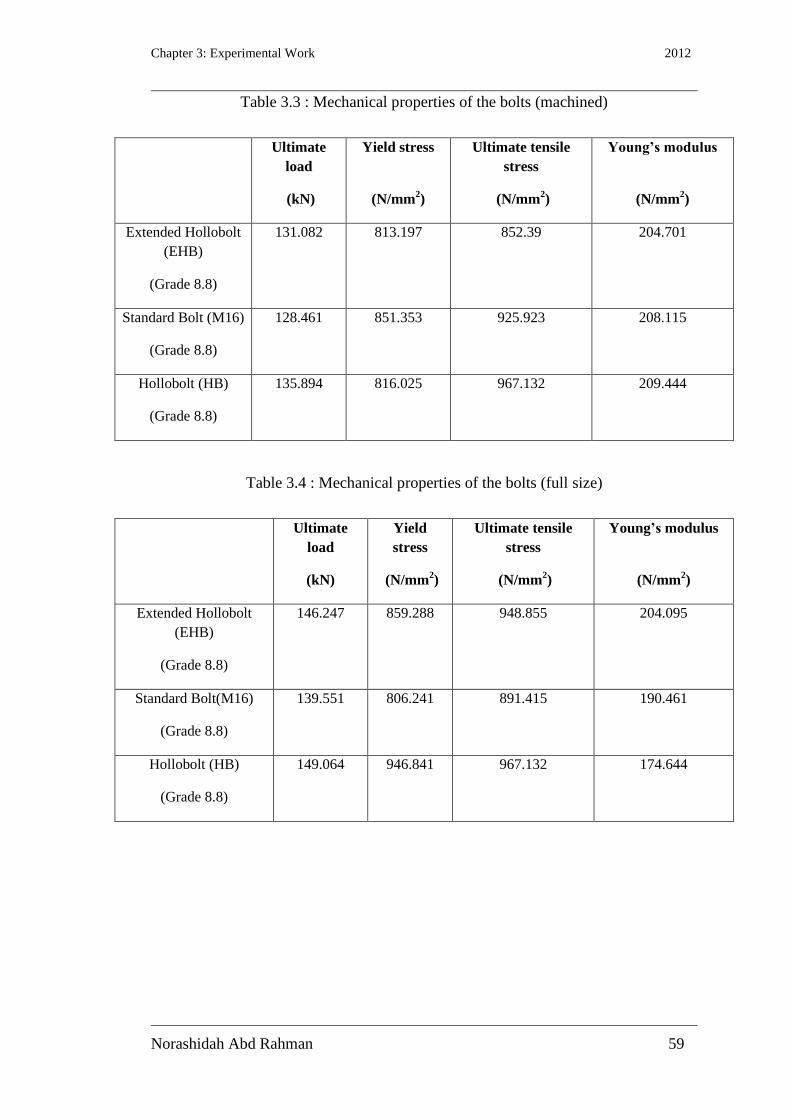
Chapter 3: Experimental Work 2012
Norashidah Abd Rahman 59
Table 3.3 : Mechanical properties of the bolts (machined)
Ultimate
load
(kN)
Yield stress
(N/mm2)
Ultimate tensile
stress
(N/mm2)
Young’s modulus
(N/mm2)
Extended Hollobolt
(EHB)
(Grade 8.8)
131.082 813.197 852.39 204.701
Standard Bolt (M16)
(Grade 8.8)
128.461 851.353 925.923 208.115
Hollobolt (HB)
(Grade 8.8)
135.894 816.025 967.132 209.444
Table 3.4 : Mechanical properties of the bolts (full size)
Ultimate
load
(kN)
Yield
stress
(N/mm2)
Ultimate tensile
stress
(N/mm2)
Young’s modulus
(N/mm2)
Extended Hollobolt
(EHB)
(Grade 8.8)
146.247 859.288 948.855 204.095
Standard Bolt(M16)
(Grade 8.8)
139.551 806.241 891.415 190.461
Hollobolt (HB)
(Grade 8.8)
149.064 946.841 967.132 174.644
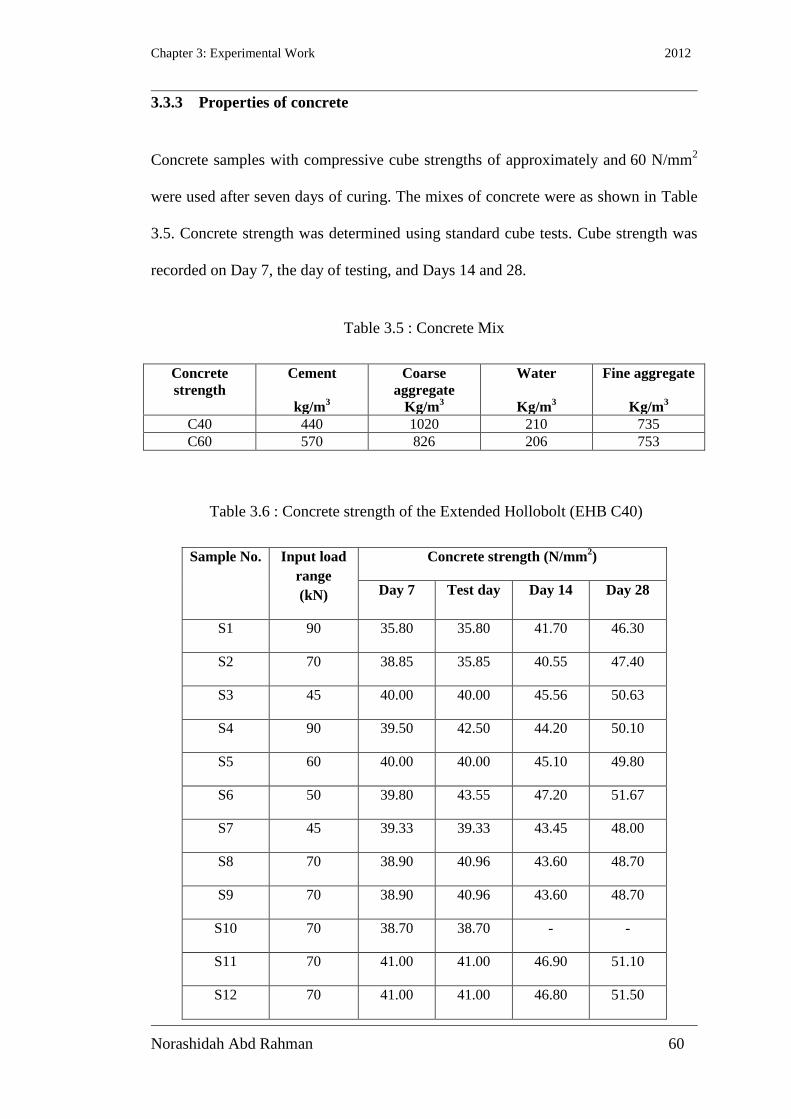
Chapter 3: Experimental Work 2012
Norashidah Abd Rahman 60
3.3.3 Properties of concrete
Concrete samples with compressive cube strengths of approximately and 60 N/mm
2
were used after seven days of curing. The mixes of concrete were as shown in Table
3.5. Concrete strength was determined using standard cube tests. Cube strength was
recorded on Day 7, the day of testing, and Days 14 and 28.
Table 3.5 : Concrete Mix
Concrete
strength
Cement
kg/m3
Coarse
aggregate
Kg/m3
Water
Kg/m3
Fine aggregate
Kg/m3
C40 440 1020 210 735
C60 570 826 206 753
Table 3.6 : Concrete strength of the Extended Hollobolt (EHB C40)
Sample No. Input load
range
(kN)
Concrete strength (N/mm2)
Day 7 Test day Day 14 Day 28
S1 90 35.80 35.80 41.70 46.30
S2 70 38.85 35.85 40.55 47.40
S3 45 40.00 40.00 45.56 50.63
S4 90 39.50 42.50 44.20 50.10
S5 60 40.00 40.00 45.10 49.80
S6 50 39.80 43.55 47.20 51.67
S7 45 39.33 39.33 43.45 48.00
S8 70 38.90 40.96 43.60 48.70
S9 70 38.90 40.96 43.60 48.70
S10 70 38.70 38.70 - -
S11 70 41.00 41.00 46.90 51.10
S12 70 41.00 41.00 46.80 51.50
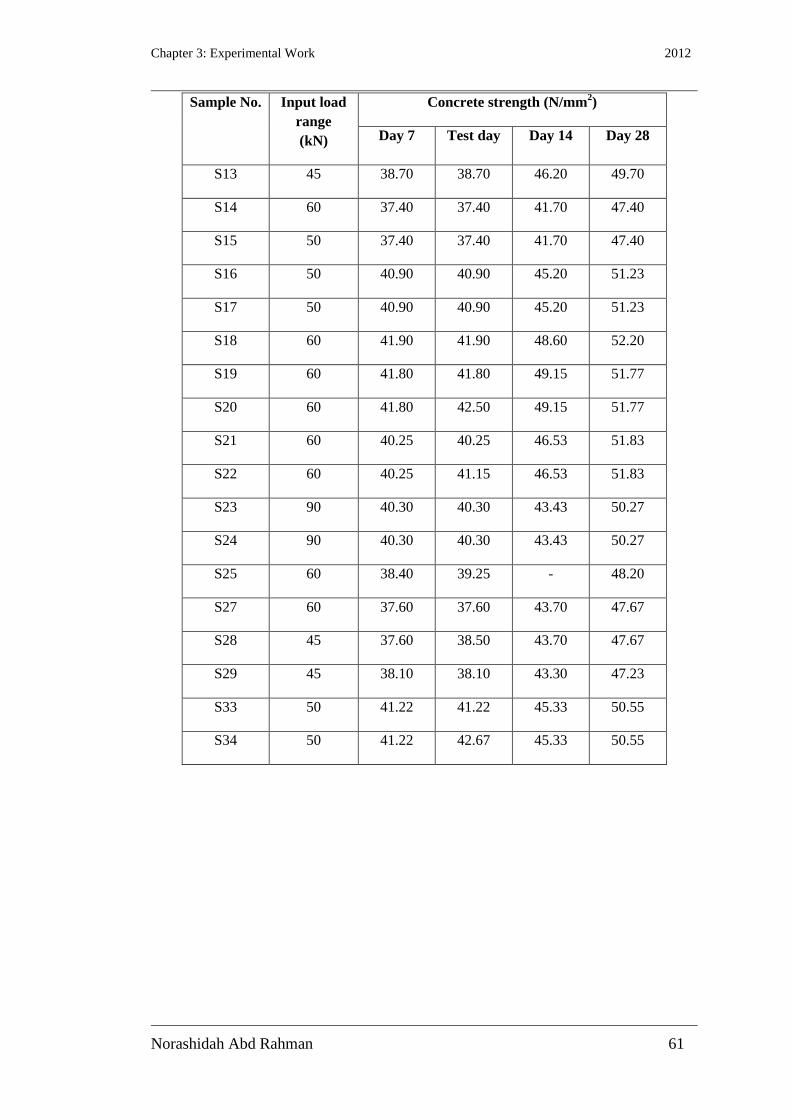
Chapter 3: Experimental Work 2012
Norashidah Abd Rahman 61
Sample No. Input load
range
(kN)
Concrete strength (N/mm2)
Day 7 Test day Day 14 Day 28
S13 45 38.70 38.70 46.20 49.70
S14 60 37.40 37.40 41.70 47.40
S15 50 37.40 37.40 41.70 47.40
S16 50 40.90 40.90 45.20 51.23
S17 50 40.90 40.90 45.20 51.23
S18 60 41.90 41.90 48.60 52.20
S19 60 41.80 41.80 49.15 51.77
S20 60 41.80 42.50 49.15 51.77
S21 60 40.25 40.25 46.53 51.83
S22 60 40.25 41.15 46.53 51.83
S23 90 40.30 40.30 43.43 50.27
S24 90 40.30 40.30 43.43 50.27
S25 60 38.40 39.25 - 48.20
S27 60 37.60 37.60 43.70 47.67
S28 45 37.60 38.50 43.70 47.67
S29 45 38.10 38.10 43.30 47.23
S33 50 41.22 41.22 45.33 50.55
S34 50 41.22 42.67 45.33 50.55
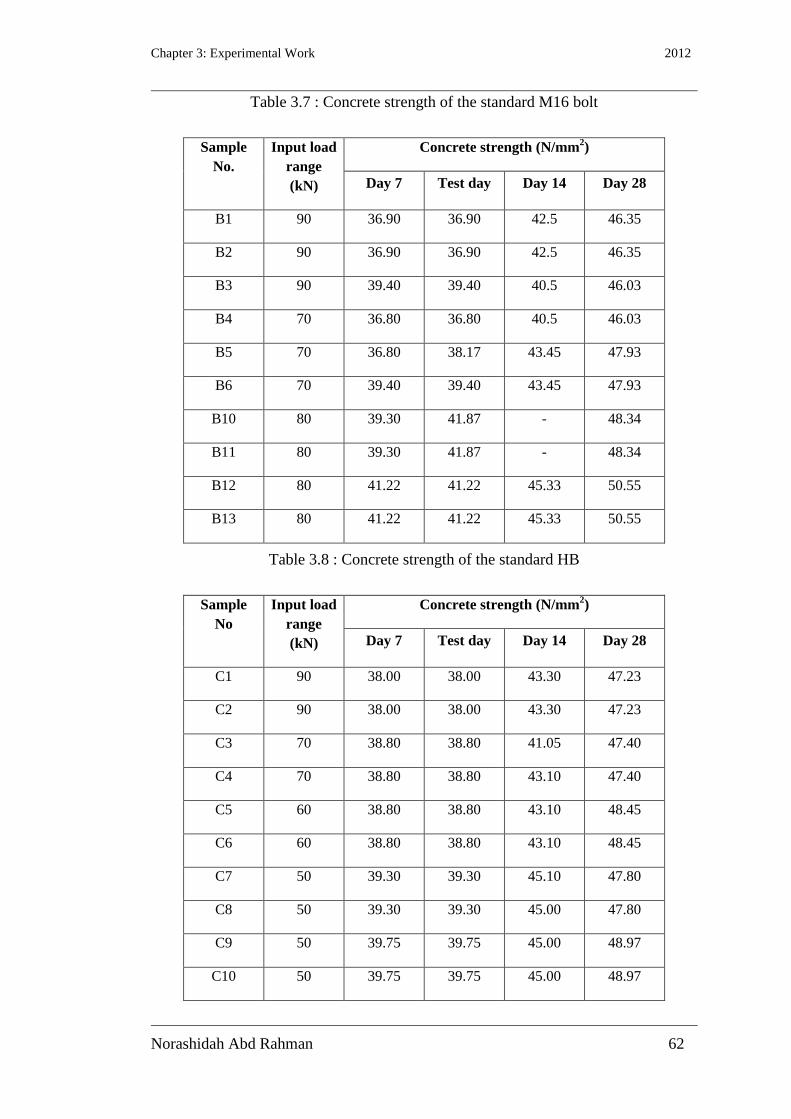
Chapter 3: Experimental Work 2012
Norashidah Abd Rahman 62
Table 3.7 : Concrete strength of the standard M16 bolt
Sample
No.
Input load
range
(kN)
Concrete strength (N/mm2)
Day 7 Test day Day 14 Day 28
B1 90 36.90 36.90 42.5 46.35
B2 90 36.90 36.90 42.5 46.35
B3 90 39.40 39.40 40.5 46.03
B4 70 36.80 36.80 40.5 46.03
B5 70 36.80 38.17 43.45 47.93
B6 70 39.40 39.40 43.45 47.93
B10 80 39.30 41.87 - 48.34
B11 80 39.30 41.87 - 48.34
B12 80 41.22 41.22 45.33 50.55
B13 80 41.22 41.22 45.33 50.55
Table 3.8 : Concrete strength of the standard HB
Sample
No
Input load
range
(kN)
Concrete strength (N/mm2)
Day 7 Test day Day 14 Day 28
C1 90 38.00 38.00 43.30 47.23
C2 90 38.00 38.00 43.30 47.23
C3 70 38.80 38.80 41.05 47.40
C4 70 38.80 38.80 43.10 47.40
C5 60 38.80 38.80 43.10 48.45
C6 60 38.80 38.80 43.10 48.45
C7 50 39.30 39.30 45.10 47.80
C8 50 39.30 39.30 45.00 47.80
C9 50 39.75 39.75 45.00 48.97
C10 50 39.75 39.75 45.00 48.97
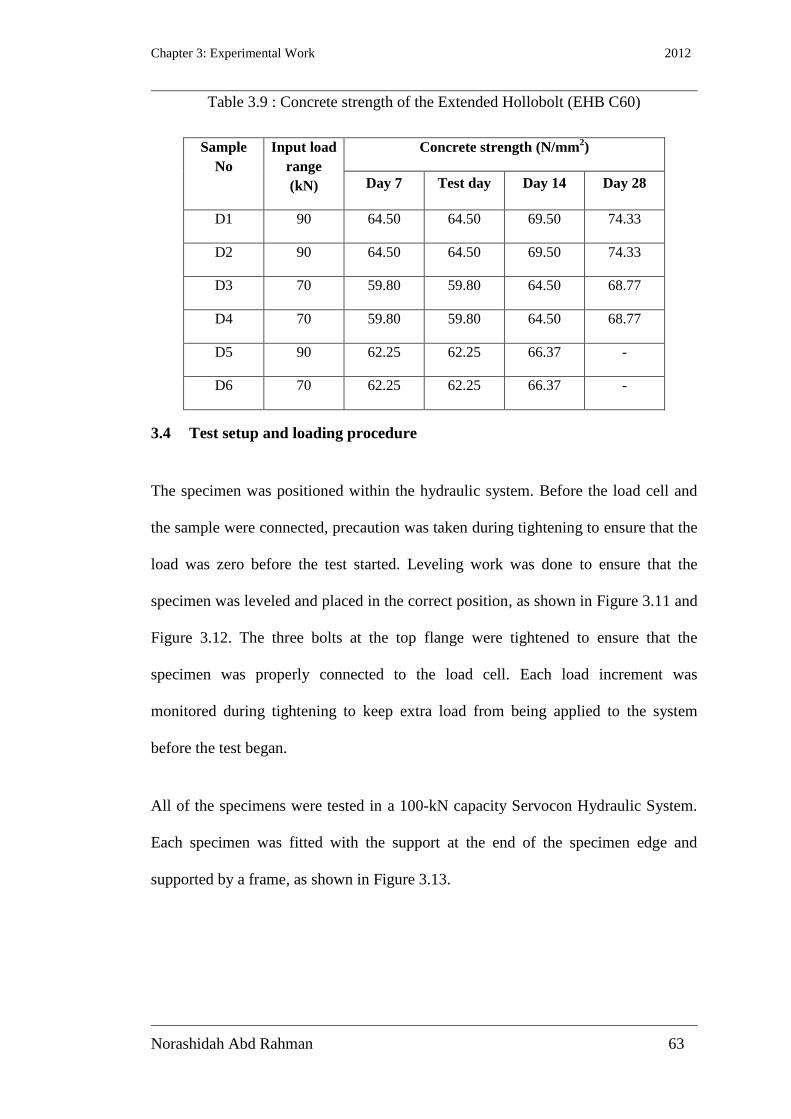
Chapter 3: Experimental Work 2012
Norashidah Abd Rahman 63
Table 3.9 : Concrete strength of the Extended Hollobolt (EHB C60)
Sample
No
Input load
range
(kN)
Concrete strength (N/mm2)
Day 7 Test day Day 14 Day 28
D1 90 64.50 64.50 69.50 74.33
D2 90 64.50 64.50 69.50 74.33
D3 70 59.80 59.80 64.50 68.77
D4 70 59.80 59.80 64.50 68.77
D5 90 62.25 62.25 66.37 -
D6 70 62.25 62.25 66.37 -
3.4 Test setup and loading procedure
The specimen was positioned within the hydraulic system. Before the load cell and
the sample were connected, precaution was taken during tightening to ensure that the
load was zero before the test started. Leveling work was done to ensure that the
specimen was leveled and placed in the correct position, as shown in Figure 3.11 and
Figure 3.12. The three bolts at the top flange were tightened to ensure that the
specimen was properly connected to the load cell. Each load increment was
monitored during tightening to keep extra load from being applied to the system
before the test began.
All of the specimens were tested in a 100-kN capacity Servocon Hydraulic System.
Each specimen was fitted with the support at the end of the specimen edge and
supported by a frame, as shown in Figure 3.13.

Chapter 3: Experimental Work 2012
Norashidah Abd Rahman 64
Figure 3.11 : Leveling work
Figure 3.12 : Bolt connection to the load cell
M16 Standard bolt
Specimen Extended Hollobolt
Collar
30mm thick plate
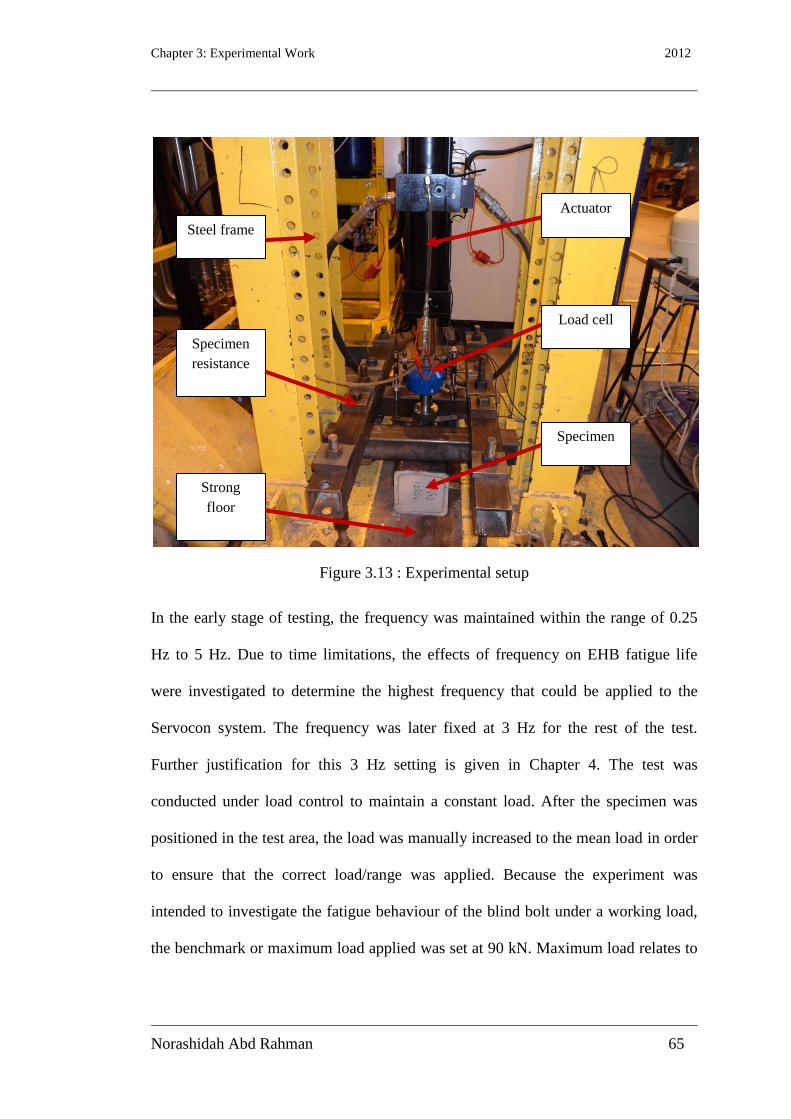
Chapter 3: Experimental Work 2012
Norashidah Abd Rahman 65
Figure 3.13 : Experimental setup
In the early stage of testing, the frequency was maintained within the range of 0.25
Hz to 5 Hz. Due to time limitations, the effects of frequency on EHB fatigue life
were investigated to determine the highest frequency that could be applied to the
Servocon system. The frequency was later fixed at 3 Hz for the rest of the test.
Further justification for this 3 Hz setting is given in Chapter 4. The test was
conducted under load control to maintain a constant load. After the specimen was
positioned in the test area, the load was manually increased to the mean load in order
to ensure that the correct load/range was applied. Because the experiment was
intended to investigate the fatigue behaviour of the blind bolt under a working load,
the benchmark or maximum load applied was set at 90 kN. Maximum load relates to
Actuator
Specimen
Steel frame
Specimen
resistance
Load cell
Strong
floor
Chapter 3: Experimental Work 2012
Norashidah Abd Rahman 66
bolts’ tension resistance, according to EC3 Part 1-8 (Appendix A). The machine was
then set for automatic operation to N number of cycles or until the specimen failed.
3.4.1 Fatigue test loading method
Standard tests are generally the most suitable methods for determining the S–N
curve. Response tests (constant amplitude) or increasing amplitude tests are most
suitable (ASTM, 1963) for determining long-life fatigue strength or fatigue limit.
The latter method, which was used in this research, is discussed in detail in this
section. Two types of standard test may be carried out using either a single test
specimen or groups of specimens at each stress level.
In the standard test, each fatigue specimen is cycled in constant stress or strain
amplitude at different stress level until fracture occurs. Stress levels usually range
from a high value, at which failure will occur quickly, to a lower value, at which
failure only occurs after an extremely large number of cycles. If the primary interest
is the long-life end of the S–N curve, often called the fatigue limit, the stress level is
usually selected somewhere above this estimated fatigue limit. If the interest depends
on the results of the first test, then subsequent specimens are tested at stress levels
either above or below first test result until a point is found at which the specimen
does not fail, in effect finding the fatigue limit.
A single test specimen at each stress level is generally used when a relatively small
number of specimens are being tested, such as when the fatigue specimens are
expensive or in short supply, or when machine parts, full size section, or assemblies
are being tested.
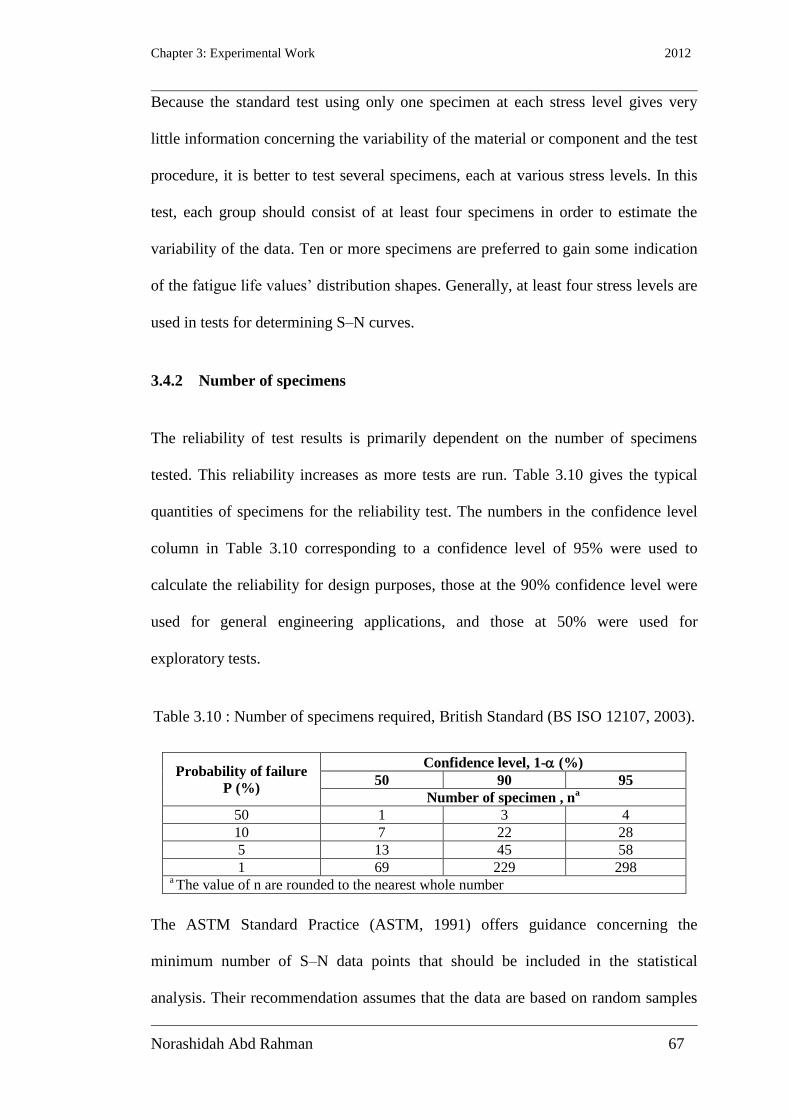
Chapter 3: Experimental Work 2012
Norashidah Abd Rahman 67
Because the standard test using only one specimen at each stress level gives very
little information concerning the variability of the material or component and the test
procedure, it is better to test several specimens, each at various stress levels. In this
test, each group should consist of at least four specimens in order to estimate the
variability of the data. Ten or more specimens are preferred to gain some indication
of the fatigue life values’ distribution shapes. Generally, at least four stress levels are
used in tests for determining S–N curves.
3.4.2 Number of specimens
The reliability of test results is primarily dependent on the number of specimens
tested. This reliability increases as more tests are run. Table 3.10 gives the typical
quantities of specimens for the reliability test. The numbers in the confidence level
column in Table 3.10 corresponding to a confidence level of 95% were used to
calculate the reliability for design purposes, those at the 90% confidence level were
used for general engineering applications, and those at 50% were used for
exploratory tests.
Table 3.10 : Number of specimens required, British Standard (BS ISO 12107, 2003).
Probability of failure
P (%)
Confidence level, 1- (%)
50 90 95
Number of specimen , na
50 1 3 4
10 7 22 28
5 13 45 58
1 69 229 298 a The value of n are rounded to the nearest whole number
The ASTM Standard Practice (ASTM, 1991) offers guidance concerning the
minimum number of S–N data points that should be included in the statistical
analysis. Their recommendation assumes that the data are based on random samples
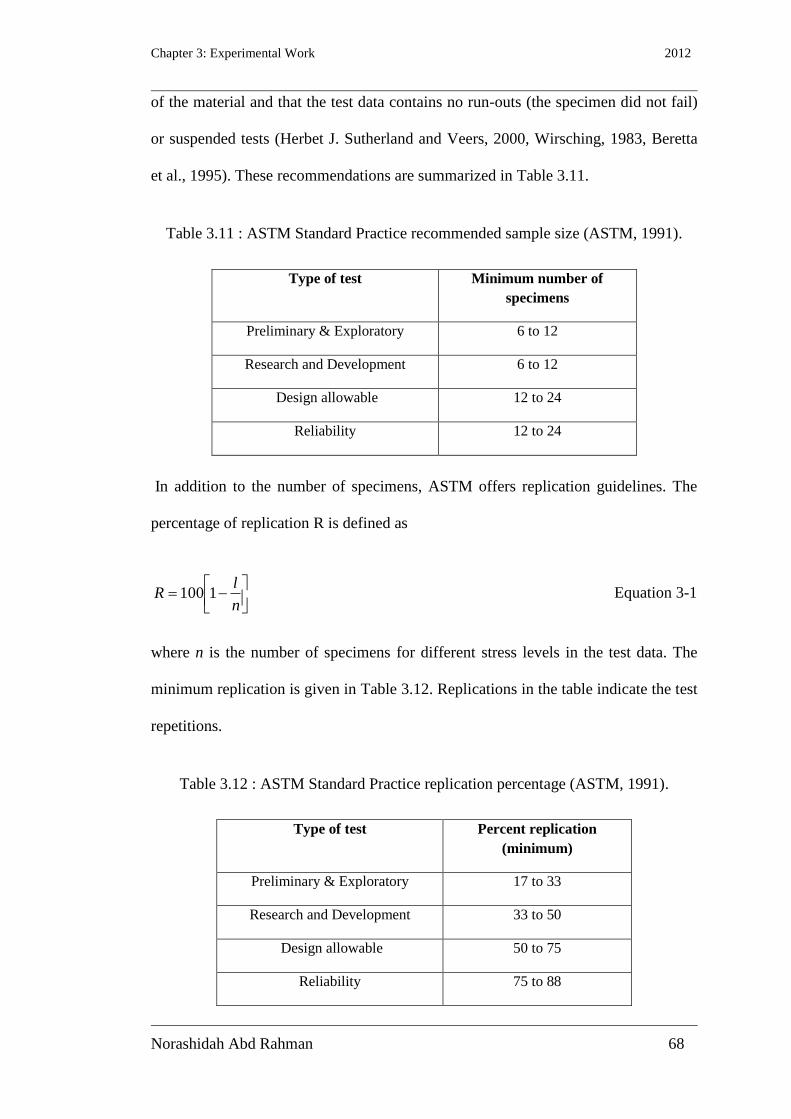
Chapter 3: Experimental Work 2012
Norashidah Abd Rahman 68
of the material and that the test data contains no run-outs (the specimen did not fail)
or suspended tests (Herbet J. Sutherland and Veers, 2000, Wirsching, 1983, Beretta
et al., 1995). These recommendations are summarized in Table 3.11.
Table 3.11 : ASTM Standard Practice recommended sample size (ASTM, 1991).
Type of test Minimum number of
specimens
Preliminary & Exploratory 6 to 12
Research and Development 6 to 12
Design allowable 12 to 24
Reliability 12 to 24
In addition to the number of specimens, ASTM offers replication guidelines. The
percentage of replication R is defined as
n
lR 1100 Equation 3-1
where n is the number of specimens for different stress levels in the test data. The
minimum replication is given in Table 3.12. Replications in the table indicate the test
repetitions.
Table 3.12 : ASTM Standard Practice replication percentage (ASTM, 1991).
Type of test Percent replication
(minimum)
Preliminary & Exploratory 17 to 33
Research and Development 33 to 50
Design allowable 50 to 75
Reliability 75 to 88

Chapter 3: Experimental Work 2012
Norashidah Abd Rahman 69
Therefore, considering the suggestions provided by ASTM and British Standard,
using five levels of stress and thirty fatigue tests of the EHB of Grade 8.8 with C40,
the replication level of the test was 83%, which falls within the reliability guideline.
The replication levels for the standard Hollobolt and normal M16 bolt tests were
60% and 70%, respectively. This number of specimens was deemed acceptable for
comparison purposes. The 67% replication level of the Grade 8.8 EHB test using
C60 also shows an acceptable number of specimens for comparison purposes. Table
3.14 shows the number of samples used in the fatigue testing.
3.4.3 Stress range
Tension tests were conducted to determine the fatigue behaviour of the proposed
connection. The stress range was calculated using the tensile stress area of the bolts,
as in Equation 3-2:
t
a
A
P Equation 3-2
where
Pa = actual load during test
At = tensile area of bolt according to BS EN ISO898:1:2009 (2009)
=
2
2
68
3
4/
HdHd o
Equation 3-3
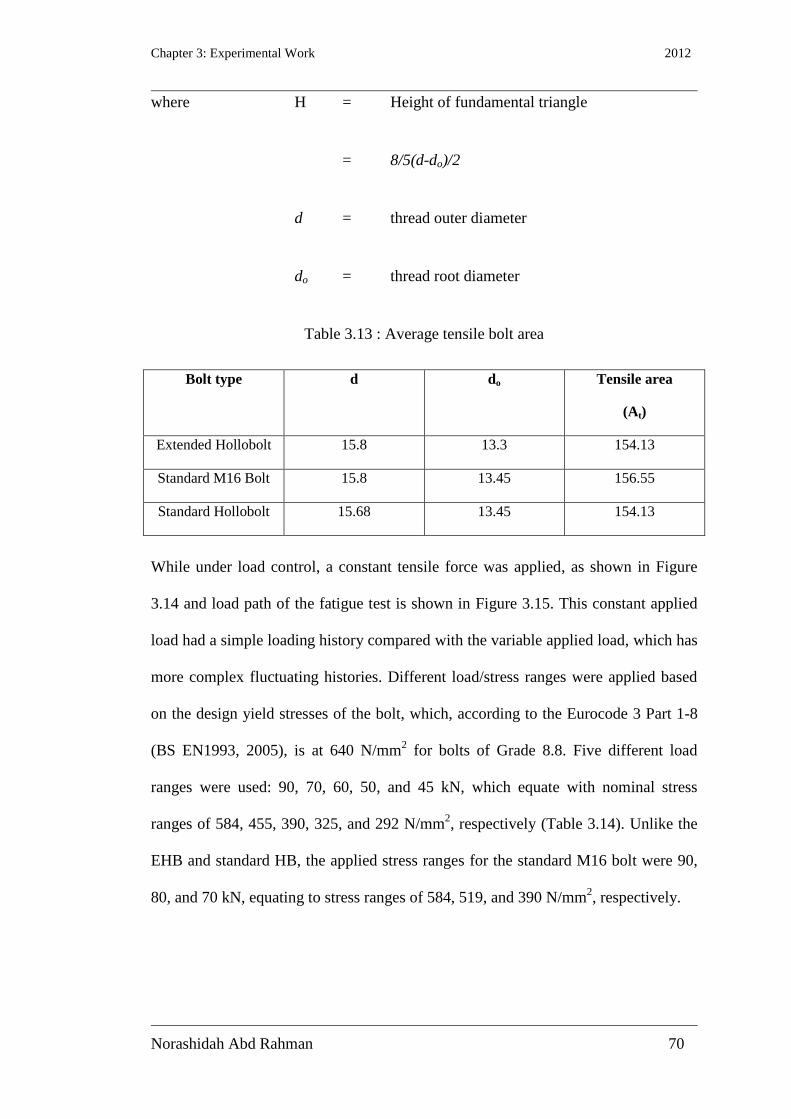
Chapter 3: Experimental Work 2012
Norashidah Abd Rahman 70
where H = Height of fundamental triangle
= 8/5(d-do)/2
d = thread outer diameter
do = thread root diameter
Table 3.13 : Average tensile bolt area
Bolt type d do Tensile area
(At)
Extended Hollobolt 15.8 13.3 154.13
Standard M16 Bolt 15.8 13.45 156.55
Standard Hollobolt 15.68 13.45 154.13
While under load control, a constant tensile force was applied, as shown in Figure
3.14 and load path of the fatigue test is shown in Figure 3.15. This constant applied
load had a simple loading history compared with the variable applied load, which has
more complex fluctuating histories. Different load/stress ranges were applied based
on the design yield stresses of the bolt, which, according to the Eurocode 3 Part 1-8
(BS EN1993, 2005), is at 640 N/mm2 for bolts of Grade 8.8. Five different load
ranges were used: 90, 70, 60, 50, and 45 kN, which equate with nominal stress
ranges of 584, 455, 390, 325, and 292 N/mm2, respectively (Table 3.14). Unlike the
EHB and standard HB, the applied stress ranges for the standard M16 bolt were 90,
80, and 70 kN, equating to stress ranges of 584, 519, and 390 N/mm2, respectively.
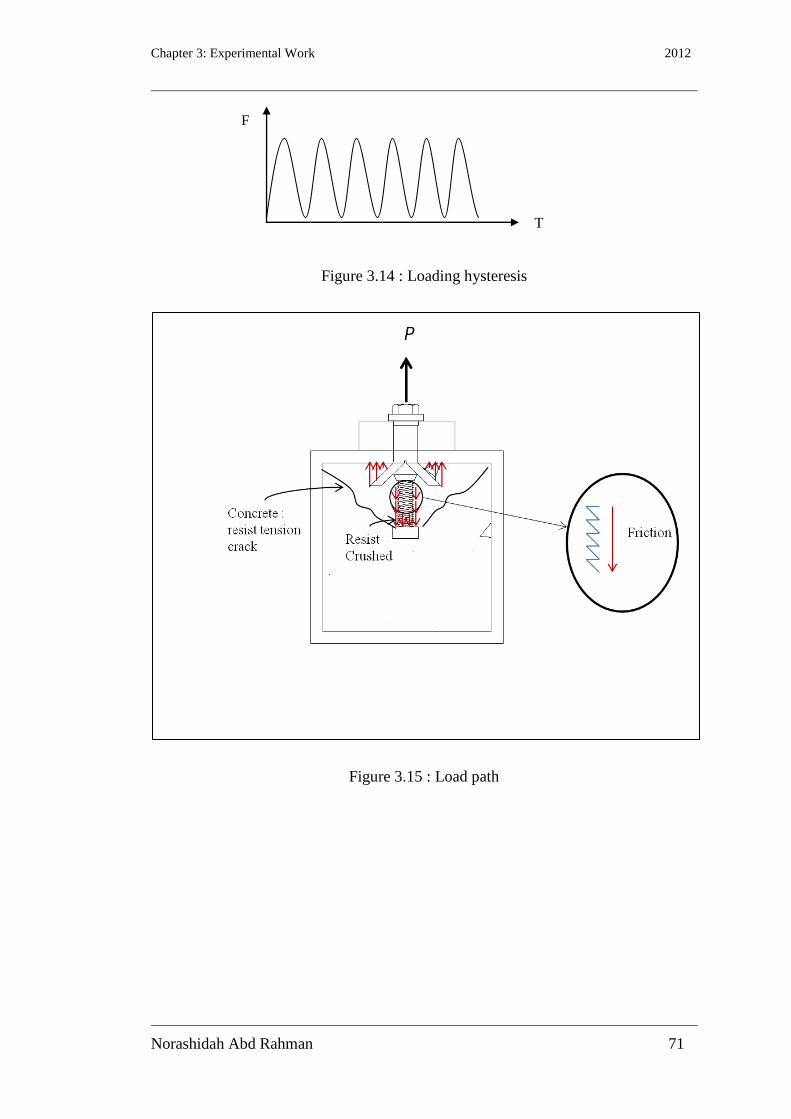
Chapter 3: Experimental Work 2012
Norashidah Abd Rahman 71
Figure 3.14 : Loading hysteresis
Figure 3.15 : Load path
F
T
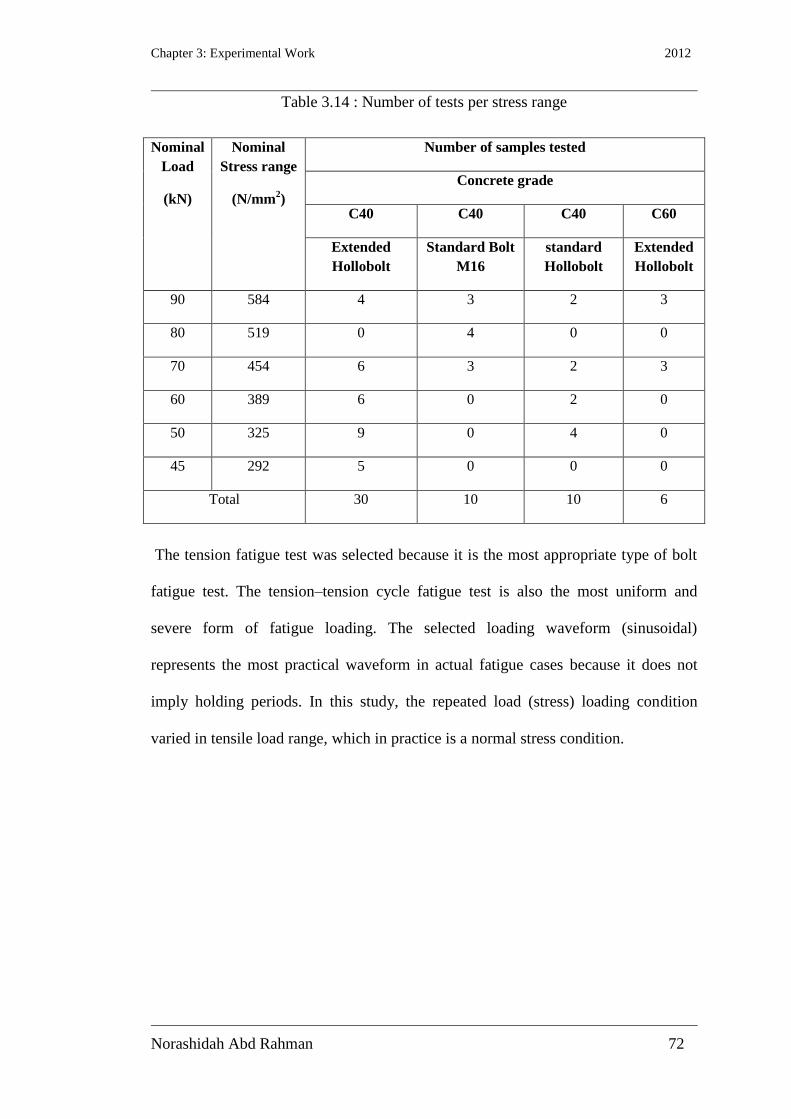
Chapter 3: Experimental Work 2012
Norashidah Abd Rahman 72
Table 3.14 : Number of tests per stress range
Nominal
Load
(kN)
Nominal
Stress range
(N/mm2)
Number of samples tested
Concrete grade
C40 C40 C40 C60
Extended
Hollobolt
Standard Bolt
M16
standard
Hollobolt
Extended
Hollobolt
90 584 4 3 2 3
80 519 0 4 0 0
70 454 6 3 2 3
60 389 6 0 2 0
50 325 9 0 4 0
45 292 5 0 0 0
Total 30 10 10 6
The tension fatigue test was selected because it is the most appropriate type of bolt
fatigue test. The tension–tension cycle fatigue test is also the most uniform and
severe form of fatigue loading. The selected loading waveform (sinusoidal)
represents the most practical waveform in actual fatigue cases because it does not
imply holding periods. In this study, the repeated load (stress) loading condition
varied in tensile load range, which in practice is a normal stress condition.
Chapter 3: Experimental Work 2012
Norashidah Abd Rahman 73
3.5 Concluding remark
Fatigue testing was conducted to determine the fatigue life of a Grade 8.8 EHB in
comparison with a Grade 8.8 standard bolt M16 and a Grade 8.8 standard HB.
12.5mm thickness of tube wall and 30mm thickness of plate are used to eliminate the
effect of tube wall and plate. The bolts were connected to concrete-filled hollow
sections, and constant fatigue tensile tests were applied under load control.
Frequencies between 0.25 and 5 Hz were used to investigate the effects of frequency
on the proposed system’s fatigue test. Due to time constraints, a frequency of 3 Hz
was later applied to the rest of the fatigue tests and will explain later in Chapter 4.
Chapter 4: Experimental Results, Discussions and Observations 2012
Norashidah Abd Rahman 74
Chapter 4 : Experimental Results, Discussions,
and Observations
4.1 Introduction
To understand the behaviour of the EHB under fatigue loading, a testing program
was undertaken. The EHB was connected to a concrete-filled hollow section, as
detailed in Chapter 3.
This chapter presents the results obtained from the experimental tests. Observation,
comparison, and discussion of the results are provided to explain the effect of the
frequency and failure mode of the EHB under different frequencies and stress ranges.
The fatigue life of different types of bolts, specifically that of the EHB, the standard
HB, and the standard bolt (M16), is the key characteristic used as the basis for
comparison and discussion. The suitable frequency for the fatigue test is discussed,
and general observations regarding the specimens after failure are provided.
4.2 Effect of frequency and stress range determination
To minimize the experimental variables, the effects of frequency and stress range for
the EHB were investigated. The effect of frequency between 0.25 Hz and 5 Hz was
investigated to define the highest frequency applied for all the tests in order to save
time considering that a longer experimental time may be required for failure mode to
be reached. The effect of the stress range was investigated to determine the fatigue
life of the bolt when a higher load or a lower load is applied.
Chapter 4: Experimental Results, Discussions and Observations 2012
Norashidah Abd Rahman 75
4.2.1 Effect of frequency
In fatigue testing, reaching the number of necessary cycles for specimen failure can
take a long time. Therefore, the effect of frequency should be analyzed to define the
suitable frequency to shorten the testing time and to confirm that the results are not
significantly affected when a different frequency is applied.
To determine the suitable frequency for the proposed test, frequencies between 0.25
Hz and 5.0 Hz were applied. The results in Table 4.1 show the various frequency
tests of EHB samples. To investigate its effect, of the frequency stress range (n) of
584, 454, 389, and 325 N/mm2 was employed.
Table 4.1 shows that fatigue life at stress n 584 N/mm2 increased by
approximately 16% for S4 (1.0 Hz) and by 30% for S23 (at 3.0 Hz) from S1 (0.25
Hz). These three samples had a similar average loads during the test, and exhibited
slightly different fatigue lives. However, a large difference occurred when a stress
range of n = 454 N/mm2
was applied. The large difference in fatigue life at this
stress range was due to the fact that the stress range increased when higher frequency
was used. Therefore, in this case, we can conclude that the stress range can be
affected by the frequency. We can see that, at a frequency of 5 Hz, the load increased
with an average of 6 kN from the applied load and reached at the negative value, as
shown in Figure 4.1, which illustrates the effect of frequency on the actual load
during the fatigue test with frequencies of 1, 3, and 5 Hz. This is probably due to the
acceleration of the system at higher frequency is higher compared to the lower
frequency .Therefore, a higher load range at higher frequency is obtained throughout
this test. Figure 4.1 shows negatives load at higher frequency, these negative values
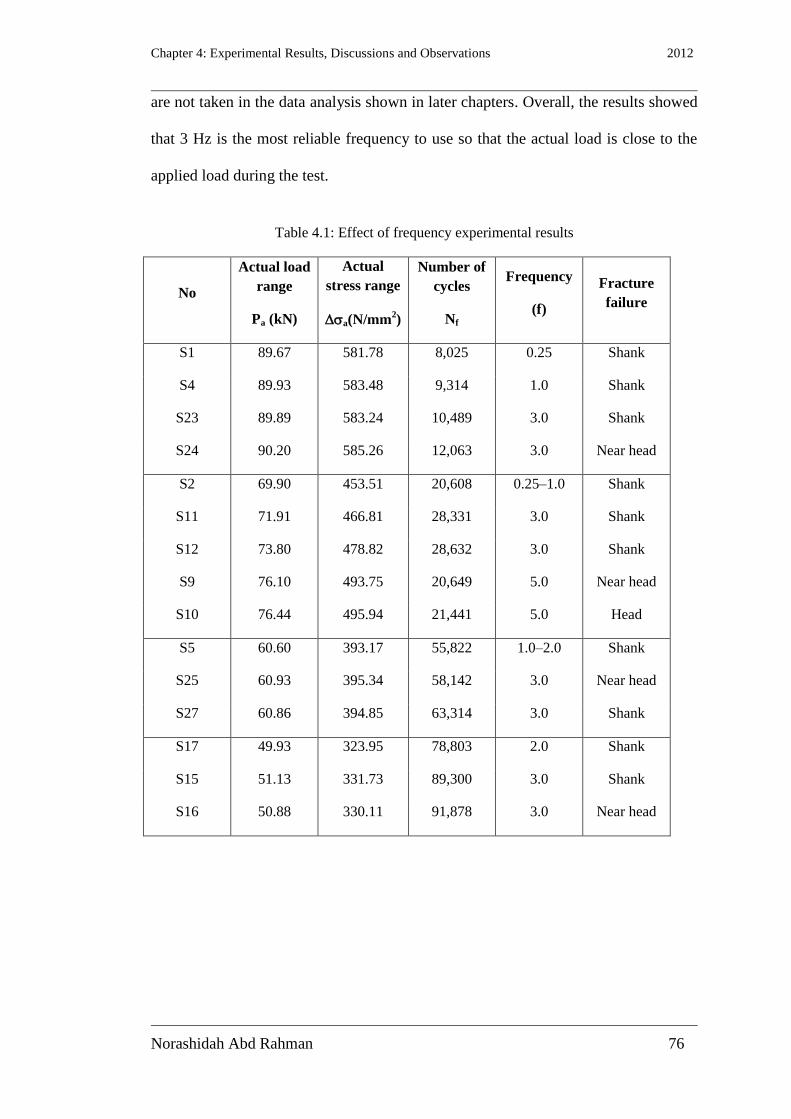
Chapter 4: Experimental Results, Discussions and Observations 2012
Norashidah Abd Rahman 76
are not taken in the data analysis shown in later chapters. Overall, the results showed
that 3 Hz is the most reliable frequency to use so that the actual load is close to the
applied load during the test.
Table 4.1: Effect of frequency experimental results
No
Actual load
range
Pa (kN)
Actual
stress range
a(N/mm2)
Number of
cycles
Nf
Frequency
(f)
Fracture
failure
S1 89.67 581.78 8,025 0.25 Shank
S4 89.93 583.48 9,314 1.0 Shank
S23 89.89 583.24 10,489 3.0 Shank
S24 90.20 585.26 12,063 3.0 Near head
S2 69.90 453.51 20,608 0.25–1.0 Shank
S11 71.91 466.81 28,331 3.0 Shank
S12 73.80 478.82 28,632 3.0 Shank
S9 76.10 493.75 20,649 5.0 Near head
S10 76.44 495.94 21,441 5.0 Head
S5 60.60 393.17 55,822 1.0–2.0 Shank
S25 60.93 395.34 58,142 3.0 Near head
S27 60.86 394.85 63,314 3.0 Shank
S17 49.93 323.95 78,803 2.0 Shank
S15 51.13 331.73 89,300 3.0 Shank
S16 50.88 330.11 91,878 3.0 Near head

Chapter 4: Experimental Results, Discussions and Observations 2012
Norashidah Abd Rahman 77
Figure 4.1 : Cyclic histories at stress n 455 N/mm2
Figure 4.2 shows the effect of frequency on the fatigue life of the EHB at different
stress ranges, where n is the actual stress range and the x-axis (fatigue life) is
normalized with the concrete strength (fck,cube,). Although similar mix proportions
were used for the concrete infill, the concrete strengths were different among
samples at Day 7 and the test day. The strength varied between 35 N/mm2 and 43
N/mm2.
-10
0
10
20
30
40
50
60
70
80
90
00:00 00:43 01:26 02:10 02:53 03:36
S10 (5Hz)
S9 (5 Hz)
S12 (3 Hz)
S2 (1 Hz)
Time (m:s)/10 cycles
Act
ual
lo
ad (
kN
)
Frequency of 70 kN (n=454 N/mm2) range

Chapter 4: Experimental Results, Discussions and Observations 2012
Norashidah Abd Rahman 78
Figure 4.2 : Normalization graph of frequency
Figure 4.2 illustrates that the fatigue life increases according to the frequency of the
system. At the stress range of 389 N/mm2, the fatigue life did not have a large
influence; from 2 Hz to 3 Hz, the difference was merely 4%. With the same
frequency, the fatigue life of the EHB increased by 9%.
For greater detail, the least squares method is used explain that the correlation
coefficient or R-square for the sets of data is 0.8867. A good logarithmic straight-line
fit is demonstrated, showing that fatigue life decreases slightly with the frequency at
lower stress.
y = 5557.3x-0.245
R² = 0.8867
100
1000
1000 10000 100000 1000000
Effect of frequency
0.25 Hz
1.0 Hz
2.0 Hz
3.0 Hz
5.0 Hz
Str
ess
range
(N
/mm
2)
Normalized (Nf x (fck,cube,(40)/fck(,cube(e))

Chapter 4: Experimental Results, Discussions and Observations 2012
Norashidah Abd Rahman 79
4.2.2 Effect of stress range
The stress range below the yield stress was applied to investigate the behaviour of
the EHB under service load. As expected, the number of cycles to failure increased
when the stress range was decreased (see Figure 4.3). This result demonstrated that
the EHB behaves in a similar manner to the standard bolt, whose fatigue life
increases relative to the stress range (Bouwman, 1979).
Figure 4.3 : Effect of stress range graph
4.2.3 Effect of frequency on the failure mode
The failure mode of the EHB was due to bolt fracture. Figure 4.4 shows the final
failure of the bolts. The difference in the location of the fracture between the bolts
was due to the position of the bolt during the test, despite the fact that, before the test
was started, caution was taken to ensure that the specimen was levelled and that the
load was working axially. However, occasionally, in the middle of the test, the
actuator did not move axially, causing the bolt to have a different location of failure.
100
200
300
400
500
600
700
0 20 40 60 80 100
Thousands
EHB test data
Str
ess
range
(N
/mm
2)
Cycles to failure (Nf)
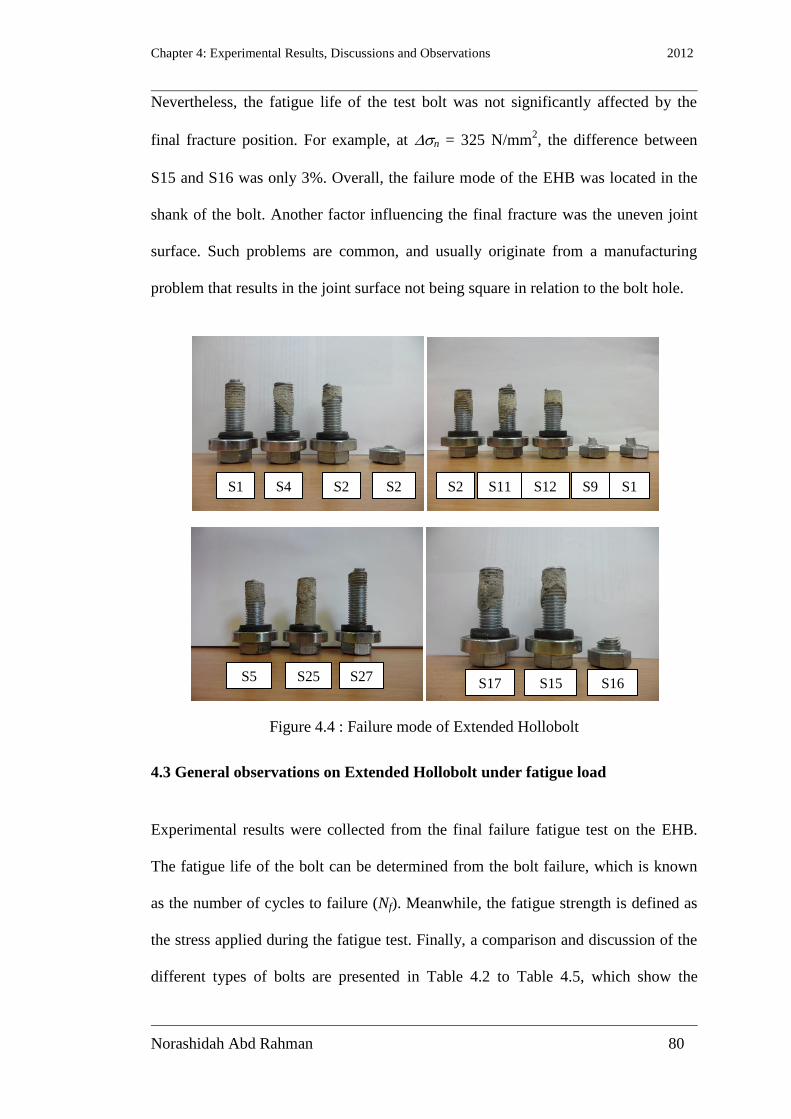
Chapter 4: Experimental Results, Discussions and Observations 2012
Norashidah Abd Rahman 80
Nevertheless, the fatigue life of the test bolt was not significantly affected by the
final fracture position. For example, at n = 325 N/mm2, the difference between
S15 and S16 was only 3%. Overall, the failure mode of the EHB was located in the
shank of the bolt. Another factor influencing the final fracture was the uneven joint
surface. Such problems are common, and usually originate from a manufacturing
problem that results in the joint surface not being square in relation to the bolt hole.
Figure 4.4 : Failure mode of Extended Hollobolt
4.3 General observations on Extended Hollobolt under fatigue load
Experimental results were collected from the final failure fatigue test on the EHB.
The fatigue life of the bolt can be determined from the bolt failure, which is known
as the number of cycles to failure (Nf). Meanwhile, the fatigue strength is defined as
the stress applied during the fatigue test. Finally, a comparison and discussion of the
different types of bolts are presented in Table 4.2 to Table 4.5, which show the
S1 S4 S2
3
S2
4
S2 S11 S12 S9 S1
0
S5 S25 S27 S17 S15 S16

Chapter 4: Experimental Results, Discussions and Observations 2012
Norashidah Abd Rahman 81
overall test results from the fatigue tests of the EHB, the HB, and the standard bolt,
respectively.
4.3.1 Fatigue behaviour of the Extended Hollobolt
The 30 fatigue tests conducted on the EHB revealed the fatigue life of the sample to
be dependent on the stress range. The fatigue life is presented in the S–N normalized
graph in Figure 4.5.
Figure 4.5 : Normalization graph stress of fatigue life of EHB
At the high stress range of 584 N/mm2, the EHB demonstrated consistent fatigue life,
with a difference of less than 20% among four tests despite the different applied
frequencies among the specimens. At the low stress range, the number of cycles to
failure varied by more than 50% at the same frequency. Fatigue life began to spread
wider when a lower range was used. For example, at stress range 389 N/mm2, the
value of the fatigue life ranged between 40000 cycles and 300000 cycles. This
pattern became more obvious at stress ranges of 325 and 292 N/mm2.
R² = 0.7861
100
1000
100 1000 10000 100000 1000000 10000000
EHB C40
EHB C40
Power (EHB C40)
Str
ess
range
(N/m
m2)
Nf x (fck,cube(40)/fck,cube(e))

Table 4.2 : Experimental results of EHB Grade 8.8 C40
No.
Sample
Number
Concrete
strength
at Day 7
(N/mm2)
Concrete
strength
at test
days
(N/mm2)
F
(kN)
Load
Amplitude
(Fmax-Fmin/2 )
(kN)
Number
of
cycles
(N)
Average
actual
load
range
(kN)
Average
actual
Stress
range
∆σa
(N/mm2)
Frequency
(Hz)
Fracture
failure
Fracture
position
from
bottom
of head
(mm)
1 S1 35.80 35.80 90 45 8025 89.67 581.77 0.25 Shank 51
2 S4 39.50 42.50 90 45 9314 89.93 583.46 1.0 Shank 52
3 S23 40.30 40.30 90 45 10489 89.90 583.22 3 Shank 49
4 S24 40.30 40.30 90 45 12063 90.21 585.24 3 Near Head 0
5 S2 35.85 35.85 70 35 20608 69.90 453.50 0.25-1.0 shank 50
6 S8 38.90 40.96 70 35 45631 70.70 458.68 3 Near Head 5
7 S9 38.90 40.96 70 35 20649 76.10 493.74 5 Near Head 0
8 S10 38.70 38.70 70 35 21441 76.44 495.93 5 Near Head 0
9 S11 41.00 41.00 70 35 28331 71.95 466.79 3 shank 52
10 S12 41.00 41.00 70 35 28632 73.80 478.80 3 Shank 50
Ch
apter 4
: Ex
perim
ental R
esults, D
iscussio
ns an
d O
bserv
ation
s 201
2
Norash
idah
Abd R
ahm
an
82

83
No.
Sample
Number
Concrete
strength
at Day 7
(N/mm2)
Concrete
strength
at test
days
(N/mm2)
F
(kN)
Load
Amplitude
(Fmax-Fmin/2 )
(kN)
Number
of
cycles
(N)
Average
actual
load
range
(kN)
Average
actual
Stress
range
∆σa
(N/mm2)
Frequency
(Hz)
Fracture
failure
Fracture
position
from
bottom
of head
(mm)
11 S5 40.00 40.00 60 30 55822 60.60 393.16 1.0–2.0 Shank 49
12 S14 37.40 37.40 60 30 40297 61.43 398.57 3 Near Head 0
13 S18 41.90 41.90 60 30 191710 60.50 392.52 3 Near head 4
14 S19 41.80 41.80 60 30 126731 60.81 394.54 3 Shank 50
15 S20 41.80 42.50 60 30 202742 61.20 397.08 3 Near head 4
16 S21 40.25 40.25 60 30 107526 61.33 397.90 3 Shank 51
17 S22 40.25 41.15 60 30 313697 60.31 391.28 3 Near Head 3
18 S25 38.40 39.25 60 30 58142 60.93 395.32 3 Shank 52
19 S27 37.60 37.60 60 30 63314 60.86 394.85 3 Shank 56
20 S6 39.80 43.55 50 25 264135 50.94 330.46 2 Near Head 4
21 S15 37.40 37.40 50 25 89300 51.13 331.72 3 Shank 53
22 S16 40.90 40.90 50 25 91878 50.88 330.10 3 Near Head 4
Ch
apter 4
: Ex
perim
ental R
esults, D
iscussio
ns an
d O
bserv
ation
s 20
12
Norash
idah
Abd R
ahm
an
83

84
No.
Sample
Number
Concrete
strength
at Day 7
(N/mm2)
Concrete
strength
at test
days
(N/mm2)
F
(kN)
Load
Amplitude
(Fmax-Fmin/2 )
(kN)
Number
of
cycles
(Nf)
Average
actual
load
range
(kN)
Average
actual
Stress
range
∆σa
(N/mm2)
Frequency
(Hz)
Fracture
failure
Fracture
position
from
bottom
of head
(mm)
23 S17 40.90 41.20 50 25 78803 49.93 323.94 2 Shank 53
24 S33 41.23 41.23 50 25 450044 50.99 330.82 3 Shank 49
25 S34 41.23 42.67 50 25 626804 51.12 331.63 3 Shank 48
26 S3 40.00 40.00 45 22.5 1328102 45.05 292.27 1.0 -2 Near head 4
27 S7 39.33 39.33 45 22.5 3358810 46.30 300.41 3 Near head 3
28 S13 38.70 38.70 45 22.5 2012778 47.89 310.72 3 Shank 49
29 S28 37.60 38.50 45 22.5 676386 46.02 298.59 3 Shank 34
30 S29 38.10 38.10 45 22.5 528703 45.86 297.53 3 Shank 56
Ch
apter 4
: Ex
perim
ental R
esults, D
iscussio
ns an
d O
bserv
ation
s 20
12
Norash
idah
Abd R
ahm
an
84
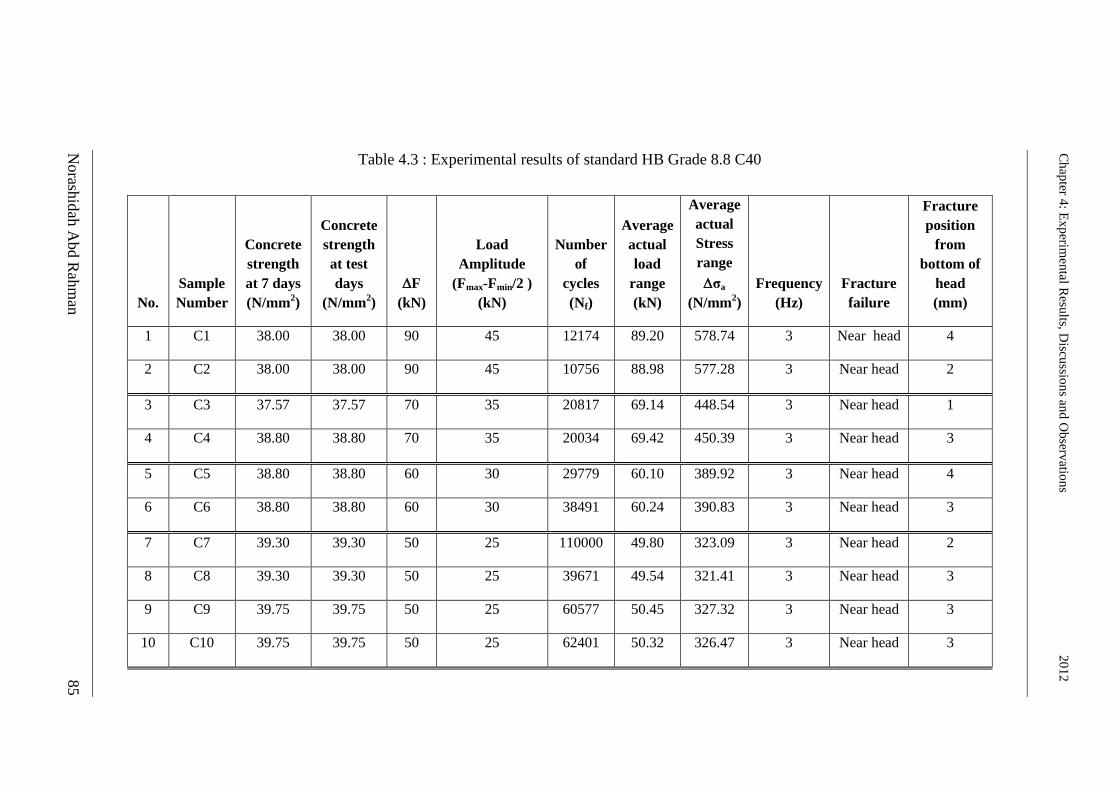
85
Table 4.3 : Experimental results of standard HB Grade 8.8 C40
No.
Sample
Number
Concrete
strength
at 7 days
(N/mm2)
Concrete
strength
at test
days
(N/mm2)
F
(kN)
Load
Amplitude
(Fmax-Fmin/2 )
(kN)
Number
of
cycles
(Nf)
Average
actual
load
range
(kN)
Average
actual
Stress
range
σa
(N/mm2)
Frequency
(Hz)
Fracture
failure
Fracture
position
from
bottom of
head
(mm)
1 C1 38.00 38.00 90 45 12174 89.20 578.74 3 Near head 4
2 C2 38.00 38.00 90 45 10756 88.98 577.28 3 Near head 2
3 C3 37.57 37.57 70 35 20817 69.14 448.54 3 Near head 1
4 C4 38.80 38.80 70 35 20034 69.42 450.39 3 Near head 3
5 C5 38.80 38.80 60 30 29779 60.10 389.92 3 Near head 4
6 C6 38.80 38.80 60 30 38491 60.24 390.83 3 Near head 3
7 C7 39.30 39.30 50 25 110000 49.80 323.09 3 Near head 2
8 C8 39.30 39.30 50 25 39671 49.54 321.41 3 Near head 3
9 C9 39.75 39.75 50 25 60577 50.45 327.32 3 Near head 3
10 C10 39.75 39.75 50 25 62401 50.32 326.47 3 Near head 3
Ch
apter 4
: Ex
perim
ental R
esults, D
iscussio
ns an
d O
bserv
ation
s 20
12
Norash
idah
Abd R
ahm
an
85

86
Table 4.4 : Experimental results of standard bolt M16 Grade 8.8 C40
No
Sample
Number
Concrete
strength
at 7 days
(N/mm2)
Concrete
strength
at test
days
(N/mm2)
F
(kN)
Load
Amplitude
(Fmax-Fmin/2 )
(kN)
Number
of
cycles
(Nf)
Average
actual
load
range
(kN)
Average
actual
Stress
range σa
(N/mm2)
Frequency
(Hz)
Fracture
failure
Fracture
position
from
bottom
of head
(mm)
1 B1 36.90 36.90 90 45 16957 89.17 577.01 3 Shank 43
2 B2 36.90 36.90 90 45 14806 89.33 578.05 3 Shank 42
3 B3 39.40 39.40 90 45 17020 89.24 577.47 3 Shank 43
4 B10 39.30 41.87 80 40 80293 79.69 515.64 3 Near head 2
5 B11 39.30 41.87 80 40 14018 79.94 517.26 3 Shank 44
6 B12 41.22 41.22 80 40 32193 80.53 521.09 3 Shank 44
7 B13 41.22 41.22 80 40 27514 80.51 520.99 3 Shank 44
8 B4 36.80 36.80 70 35 320684 70.11 453.68 3 Shank 42
9 B5 36.80 38.17 70 35 254351 70.25 454.59 3 Shank 44.5
10 B6 39.40 39.40 70 35 300387 70.59 456.79 3 Shank 44
Ch
apter 4
: Ex
perim
ental R
esults, D
iscussio
ns an
d O
bserv
ation
s 201
2
Norash
idah
Abd R
ahm
an
86

87
Table 4.5 : Experimental results of EHB Grade 8.8 C60
No
Sample
Number
Required
Concrete
strength
at 7 days
(N/mm2)
Concrete
strength
at test
days
(N/mm2)
F
(kN)
Load
Amplitude
(Fmax-Fmin/2)
(kN)
Number
of cycles
(N)
Average
actual
load
range
(kN)
Average
actual
Stress
range
σa
(N/mm2)
Frequency
(Hz)
Fracture
failure
Fracture
position
from
bottom of
head
(mm)
1 D1 64.50 64.50 90 45 13840 90.86 587.96 3 Near head 4
2 D2 64.50 64.50 90 45 21624 90.32 584.46 3 Near head 1
5 D5 62.25 62.25 90 45 17707 90.01 582.43 3 Shank 42
3 D3 59.80 59.80 70 35 27919 70.88 458.65 3 Shank 48
4 D4 58.90 59.80 70 35 42862 70.22 454.40 3 Shank 49
6 D6 62.25 62.25 70 35 88765 70.68 457.40 3 Near head 9
Ch
apter 4
: Ex
perim
ental R
esults, D
iscussio
ns an
d O
bserv
ation
s 20
12
Norash
idah
Abd R
ahm
an
87

Chapter 4 : Experimental Results, Discussions and Observations 2012
Norashidah Abd Rahman 88
88
The large scatter of the data at the low stress range is shown in Figure 4.6. The graph
illustrates that the fatigue life of the EHB was related to the concrete-filled hollow
section against the actuator movement. The actuator movement is discussed because
of the difficulty in measuring the movement of the bolt directly near it. The available
data logger also could not manage to capture the peak values during the test.
In terms of stiffness, the bolt behaved similarly at a higher stress range, but behaved
differently at a lower stress range. In the bolt test, higher stress showed that the bolt
had nearly equal stiffness as when lower stress was applied. This behaviour can be
attributed to the increasing plasticity at higher strength and the increasing elasticity at
lower strength.
Figure 4.6 : Fatigue life displacement graph
Compared with the Grade 10.9 EHB (Jiani, 2012), the fatigue life of the EHB grade
8.8 is lower at stress range 584 N/mm2
(see Table 4.6) because the yield of the
former is higher than that of the latter. However, no further conclusion can be made
0
20000
40000
60000
80000
100000
120000
140000
-0.2 0 0.2 0.4 0.6 0.8 1 1.2 1.4
S23-584N/mm2
S24-584N/mm2
S8-454N/mm2
S12-454N/mm2
S19-389N/mm2
S25-389N/mm2
Num
ber
of
Cycl
es (
Nf)
Displacement (mm)
Fatigue life of EHB C40 (8.8)
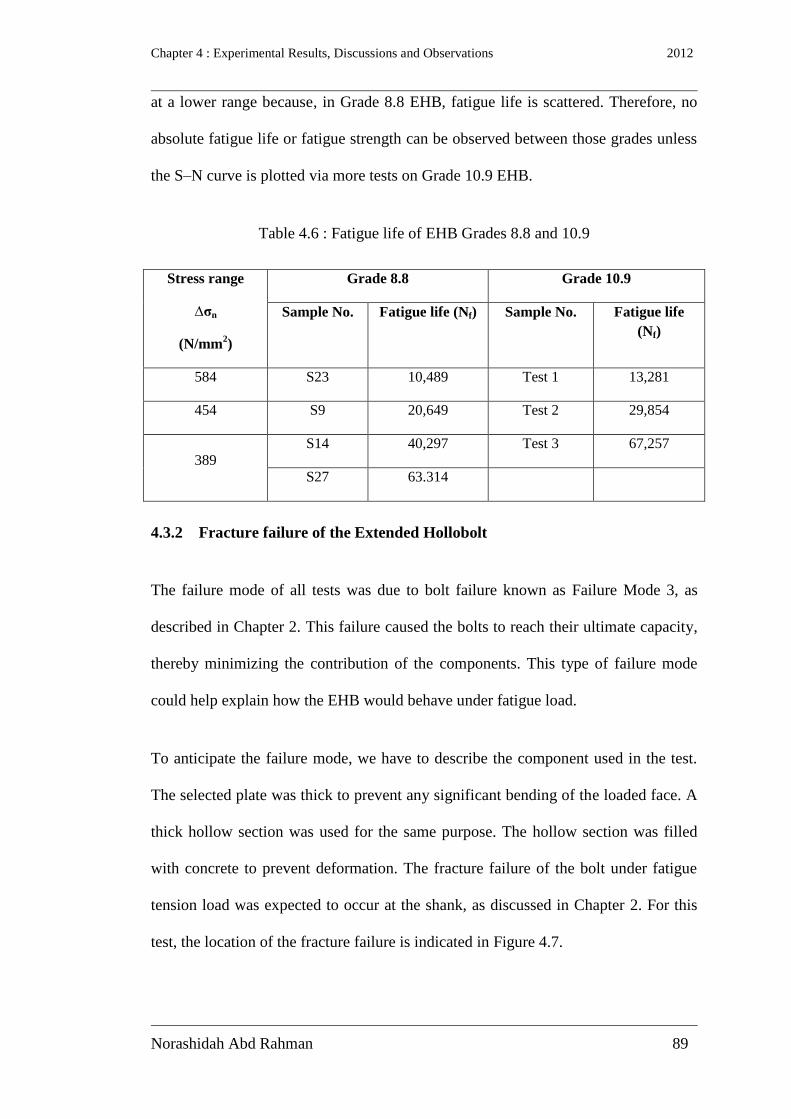
Chapter 4 : Experimental Results, Discussions and Observations 2012
Norashidah Abd Rahman 89
89
at a lower range because, in Grade 8.8 EHB, fatigue life is scattered. Therefore, no
absolute fatigue life or fatigue strength can be observed between those grades unless
the S–N curve is plotted via more tests on Grade 10.9 EHB.
Table 4.6 : Fatigue life of EHB Grades 8.8 and 10.9
Stress range
∆σn
(N/mm2)
Grade 8.8 Grade 10.9
Sample No. Fatigue life (Nf) Sample No. Fatigue life
(Nf)
584 S23 10,489 Test 1 13,281
454 S9 20,649 Test 2 29,854
389
S14 40,297 Test 3 67,257
S27 63.314
4.3.2 Fracture failure of the Extended Hollobolt
The failure mode of all tests was due to bolt failure known as Failure Mode 3, as
described in Chapter 2. This failure caused the bolts to reach their ultimate capacity,
thereby minimizing the contribution of the components. This type of failure mode
could help explain how the EHB would behave under fatigue load.
To anticipate the failure mode, we have to describe the component used in the test.
The selected plate was thick to prevent any significant bending of the loaded face. A
thick hollow section was used for the same purpose. The hollow section was filled
with concrete to prevent deformation. The fracture failure of the bolt under fatigue
tension load was expected to occur at the shank, as discussed in Chapter 2. For this
test, the location of the fracture failure is indicated in Figure 4.7.

Chapter 4 : Experimental Results, Discussions and Observations 2012
Norashidah Abd Rahman 90
90
Figure 4.7 : Fracture failure location
According to the experiments, failure occurred near the head and in the middle of the
shank, as anticipated. The fracture failure of the bolt can be examined by taking a
photograph of the fracture. Images of a typical fracture surface are shown in Figure
4.8.
Figure 4.8 : Fracture failure of EHB: a) Δσ = 584 N/mm2; b) Δσ = 454 N/mm
2; c) Δσ
= 389 N/mm2; d) Δσ = 325 N/mm
2; e) Δσ = 292N/mm
2
Shape trends are clear between S23 (stress range at 584 N/mm2) and other stress
ranges, such as S8 (389 N/mm2) and S14 (325 N/mm
2). This change may be
attributed to increased plasticity in the thread root with higher stress range causing
load shedding along the helix thread. Such load shedding can result in crack growth
around the helix.
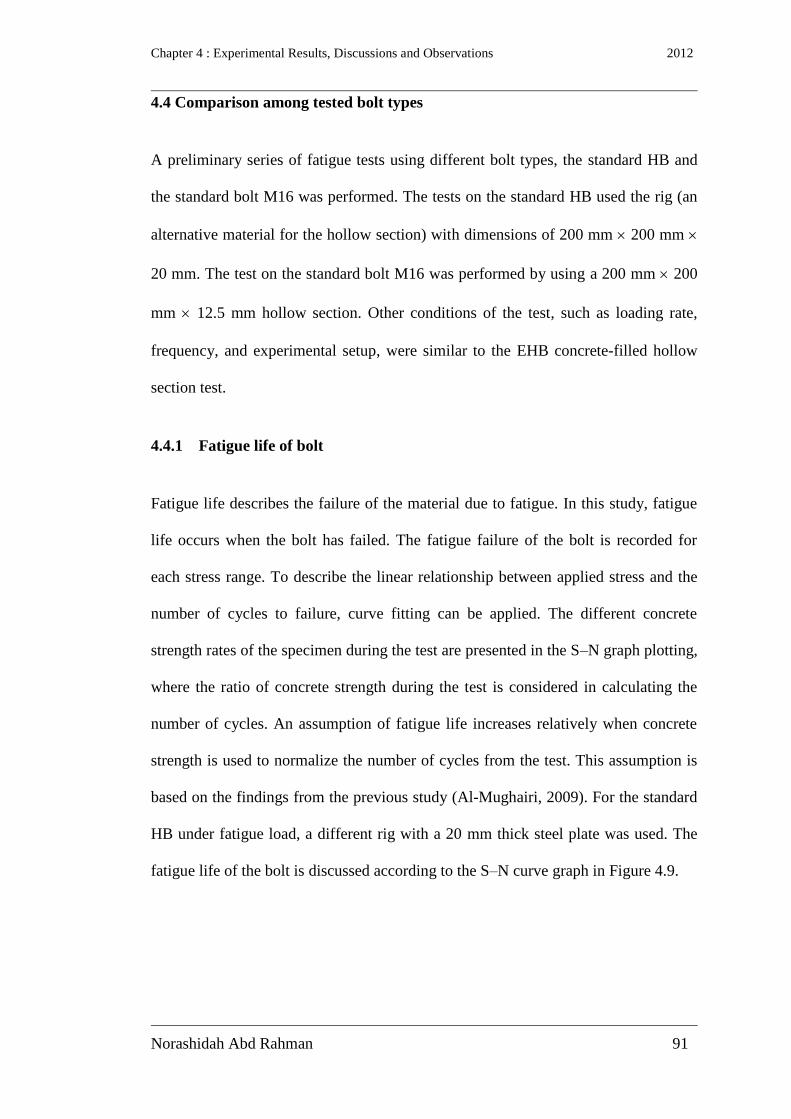
Chapter 4 : Experimental Results, Discussions and Observations 2012
Norashidah Abd Rahman 91
91
4.4 Comparison among tested bolt types
A preliminary series of fatigue tests using different bolt types, the standard HB and
the standard bolt M16 was performed. The tests on the standard HB used the rig (an
alternative material for the hollow section) with dimensions of 200 mm 200 mm
20 mm. The test on the standard bolt M16 was performed by using a 200 mm 200
mm 12.5 mm hollow section. Other conditions of the test, such as loading rate,
frequency, and experimental setup, were similar to the EHB concrete-filled hollow
section test.
4.4.1 Fatigue life of bolt
Fatigue life describes the failure of the material due to fatigue. In this study, fatigue
life occurs when the bolt has failed. The fatigue failure of the bolt is recorded for
each stress range. To describe the linear relationship between applied stress and the
number of cycles to failure, curve fitting can be applied. The different concrete
strength rates of the specimen during the test are presented in the S–N graph plotting,
where the ratio of concrete strength during the test is considered in calculating the
number of cycles. An assumption of fatigue life increases relatively when concrete
strength is used to normalize the number of cycles from the test. This assumption is
based on the findings from the previous study (Al-Mughairi, 2009). For the standard
HB under fatigue load, a different rig with a 20 mm thick steel plate was used. The
fatigue life of the bolt is discussed according to the S–N curve graph in Figure 4.9.

Chapter 4 : Experimental Results, Discussions and Observations 2012
Norashidah Abd Rahman 92
92
Figure 4.9 : S–N curve of bolt comparison
The figure reveals that EHB have a longer fatigue life than standard HB. It also
shows that the EHB has higher fatigue strength compared to a standard HB.
However, in terms of fatigue life, a standard HB exhibits a behaviour opposite to that
of the EHB. The standard HB has less scatter life throughout the different stress
ranges. Furthermore, the longer shank and the nut also provide extra fatigue life to
the EHB. The bond between the nut and the shank with concrete prevents the EHB
from pulling out, and provides the EHB additional fatigue strength.
The standard bolt M16 exhibited a longer fatigue life when it was connected to the
concrete-filled hollow section. The M16 bolt had greater fatigue strength than the
EHB. The sleeve of the HB functioning as the nut to the standard bolt did not totally
contribute to a longer fatigue life; however, it provided the EHB much better fatigue
strength and fatigue life compared with the standard HB. Even though the M16
exhibited a longer fatigue life than the EHB, both intercepted results at a higher
100
1000
1 10 100 1000 10000
Thousands
EHB (8.8) C40
EHB (8.8) C40
mean HB (8.8) C40
HB (8.8) C40
mean M16 (8.8) C40
M16 (8.8) c40
mean
Cycles to failure (Nf x (fCk,cube(40)/fck,cube(e)))
Str
ess
range
(N
/mm
2)
log N=38.1032-12.3423log
log N = 12.4119-3.0358log
S-N curve graph
2x10⁶
log N = 22.2783 - 6.6490log
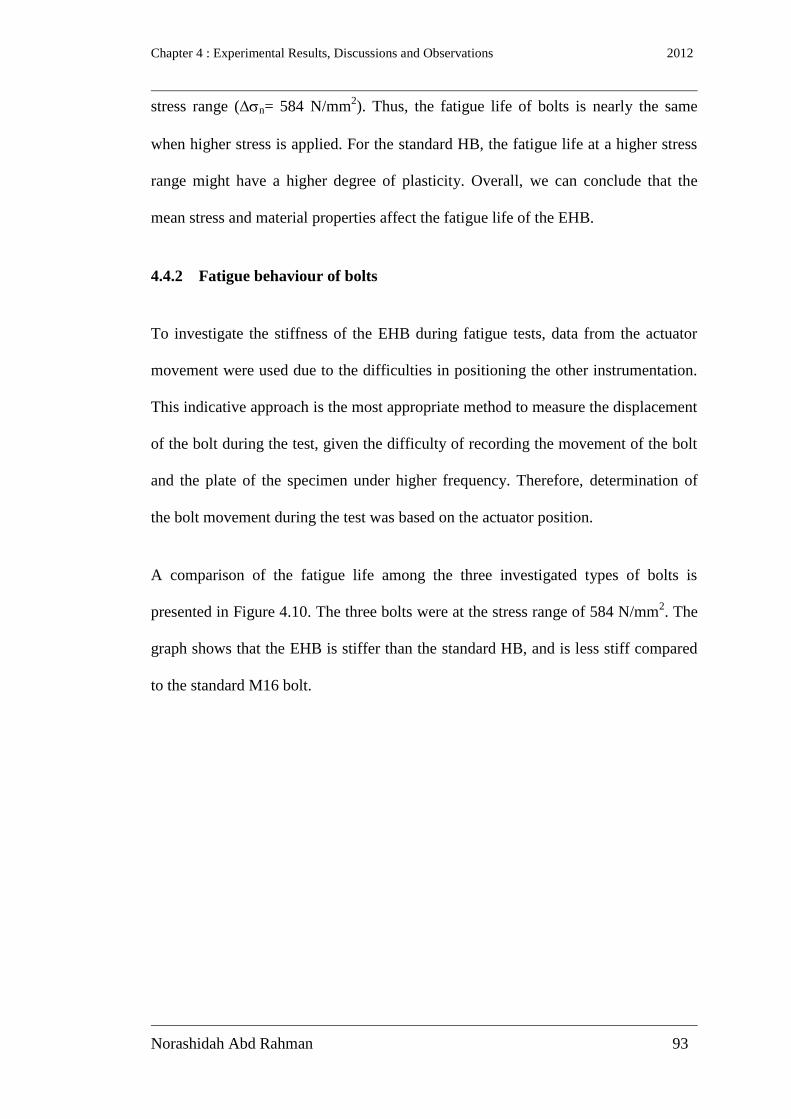
Chapter 4 : Experimental Results, Discussions and Observations 2012
Norashidah Abd Rahman 93
93
stress range (n= 584 N/mm2). Thus, the fatigue life of bolts is nearly the same
when higher stress is applied. For the standard HB, the fatigue life at a higher stress
range might have a higher degree of plasticity. Overall, we can conclude that the
mean stress and material properties affect the fatigue life of the EHB.
4.4.2 Fatigue behaviour of bolts
To investigate the stiffness of the EHB during fatigue tests, data from the actuator
movement were used due to the difficulties in positioning the other instrumentation.
This indicative approach is the most appropriate method to measure the displacement
of the bolt during the test, given the difficulty of recording the movement of the bolt
and the plate of the specimen under higher frequency. Therefore, determination of
the bolt movement during the test was based on the actuator position.
A comparison of the fatigue life among the three investigated types of bolts is
presented in Figure 4.10. The three bolts were at the stress range of 584 N/mm2. The
graph shows that the EHB is stiffer than the standard HB, and is less stiff compared
to the standard M16 bolt.

Chapter 4 : Experimental Results, Discussions and Observations 2012
Norashidah Abd Rahman 94
94
Figure 4.10 : Comparison fatigue life of bolt at stress range 584 N/mm2
Our observation showed that, after the rig section was removed, the HB was pulled
out of the concrete, which was not the case with the EHB (Figure 4.11). However,
the fatigue life of the M16 bolt was longer than that of the EHB when the bolt was
connected to the concrete-filled tube. This result was expected considering that, in
the static test, the M16 bolt was stiffer than the EHB, as shown in Figure 4.12. The
life of the M16 bolt increased when a lower stress range was applied. The same
result was also observed in the EHB and the standard HB. For both the M16 bolt and
the EHB, the bolt remained inside the concrete when the steel section was cut. The
concrete continued to hold the nut placed at the end of the EHB, thereby preventing
the bolt from pulling out during the fatigue test. This phenomenon indicates that the
EHB has longer fatigue life of the than that of the standard HB.
0
2000
4000
6000
8000
10000
12000
14000
16000
18000
-0.5 0 0.5 1 1.5 2 2.5
S23-EHB
S24-EHB
B1- M16
B2-M16
C1-HB
C2-HB
Num
ber
of
cycl
es (
Nf)
Displacement (mm)
Fatigue life of bolt at = 584 N/mm2
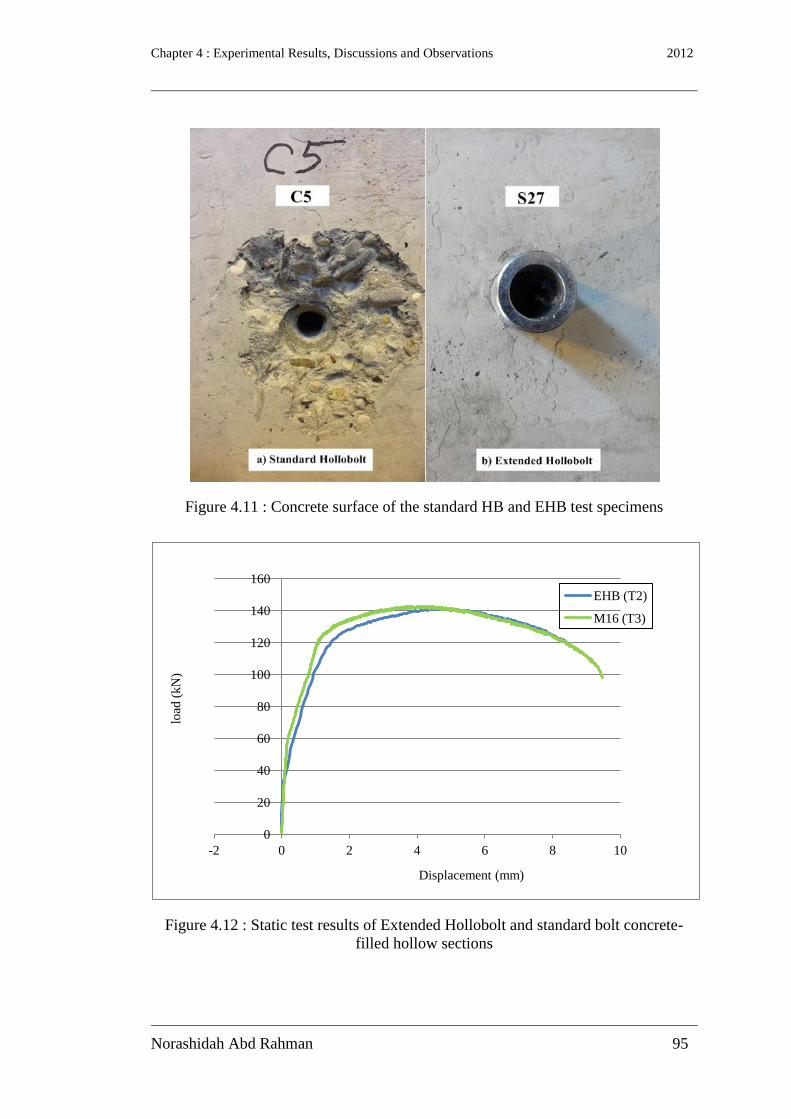
Chapter 4 : Experimental Results, Discussions and Observations 2012
Norashidah Abd Rahman 95
95
Figure 4.11 : Concrete surface of the standard HB and EHB test specimens
Figure 4.12 : Static test results of Extended Hollobolt and standard bolt concrete-
filled hollow sections
0
20
40
60
80
100
120
140
160
-2 0 2 4 6 8 10
EHB (T2)
M16 (T3)
load
(kN
)
Displacement (mm)

Chapter 4 : Experimental Results, Discussions and Observations 2012
Norashidah Abd Rahman 96
96
4.4.3 Fracture failure of bolt
A similar method to that applied to the EHB was conducted to present the fracture
failure of the other types of bolt. A photograph of the bolt fracture was taken. A
comparison of the shape trend is shown in Figure 4.13. Similarly shaped trends were
found for the EHB and the standard HB at the stress range of 584 N/mm2. However,
the M16 bolt exhibited a different shape of fracture failure. Compared with the EHB
and the standard HB, the M16 had a similar shape trend with other stress ranges. This
shape trend can also be seen in the micrograph in Figure 4.14 where a similar
fracture failure is shown. The possibility of increasing the plasticity at a higher stress
range, as discussed in Section 4.3.2, seemed to occur in the standard HB but not in
the M16. Therefore, the obvious shape trend occurred only in the Extended and the
standard HB.
Chapter 4 : Experimental Results, Discussions and Observations 2012
Norashidah Abd Rahman 97
97
Figure 4.13 : Fracture failure of bolts: a) 584 N/mm2; b) 519 N/mm
2; c) 454 N/mm
2;
d) 389 N/mm2; e) 325N/mm
2
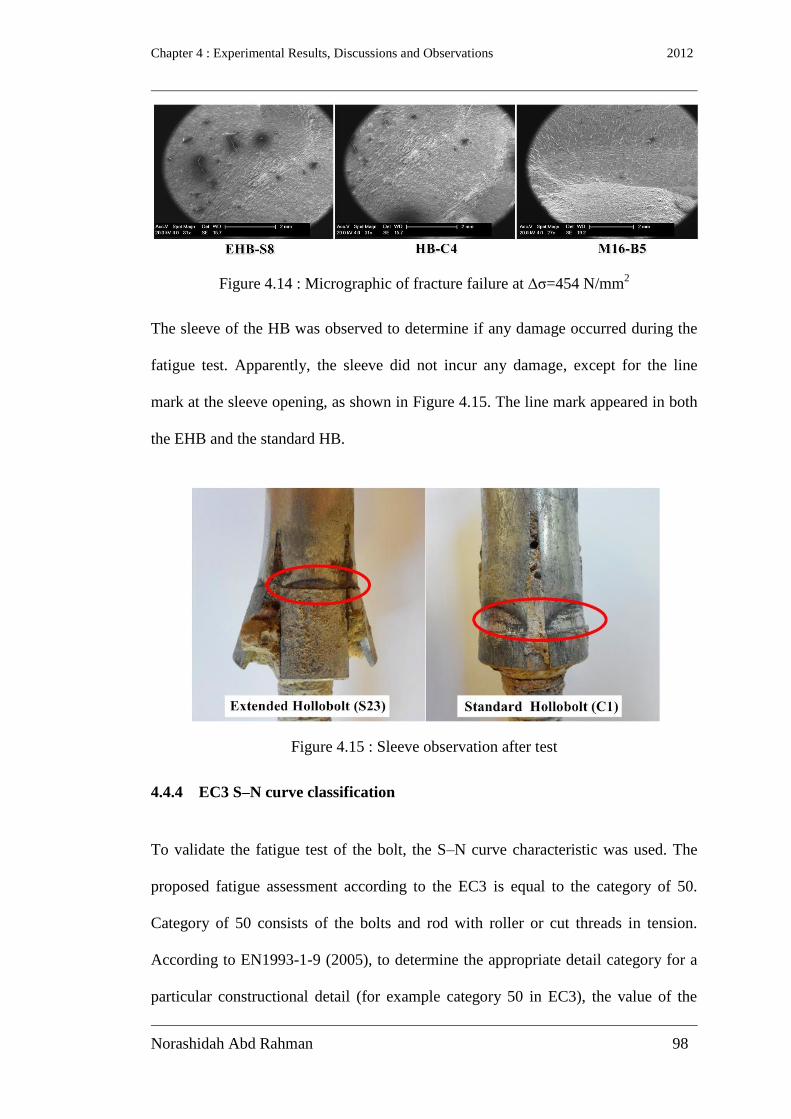
Chapter 4 : Experimental Results, Discussions and Observations 2012
Norashidah Abd Rahman 98
98
Figure 4.14 : Micrographic of fracture failure at ∆σ=454 N/mm2
The sleeve of the HB was observed to determine if any damage occurred during the
fatigue test. Apparently, the sleeve did not incur any damage, except for the line
mark at the sleeve opening, as shown in Figure 4.15. The line mark appeared in both
the EHB and the standard HB.
Figure 4.15 : Sleeve observation after test
4.4.4 EC3 S–N curve classification
To validate the fatigue test of the bolt, the S–N curve characteristic was used. The
proposed fatigue assessment according to the EC3 is equal to the category of 50.
Category of 50 consists of the bolts and rod with roller or cut threads in tension.
According to EN1993-1-9 (2005), to determine the appropriate detail category for a
particular constructional detail (for example category 50 in EC3), the value of the

Chapter 4 : Experimental Results, Discussions and Observations 2012
Norashidah Abd Rahman 99
99
stress range ∆σc corresponding to a value of Nc= 2 million cycles were calculated
with 75% confidence level of 95% probability of survival for log N. The standard
deviation, the sample size and residual stress effect were taking into account in
calculation. The member of data point (not lower than 10) is considered in statistical
analysis.
In this study the guideline proposed by the EC3 is followed to perform the S-N curve
characteristic. From the test result, fatigue life of the EHB was stronger compared
with the EC3 requirement. As shown in Figure 4.16, several test results demonstrated
that the EHB was equal to the category of 100 and above. Because of the scatter of
fatigue life, accurately categorizing it in accordance with EC3 is difficult. To
categorize the EHB, further validation using statistical analysis is required, and will
be the focus of the next chapter of this thesis.
The HB can be categorized between Classes 71 and 112. As illustrated by the
equation in Figure 4.9, the slope of the HB fatigue test is equal to the slope of the S–
N curve in EC3, which is equal to 3. Based on the overall test data, we can conclude
that the EHB and the standard HB are safe in terms of fatigue assessment. As
expected, the standard bolt M16 has a longer fatigue life because the additional
concrete gives it a greater stress range.

Norash
idah
Abd R
ahm
an
100
Figure 4.16 : S–N curve according to EC3 characteristics (BS EN1993, 2006)
10
100
1000
10000
1 10 100 1000 10000 100000
Thousands
EHB C40 (8.8)
HB C40 (8.8)
M16 C40 (8.8)
Cycles to failure (Nf)
Str
ess
range
(N
/mm
2)
160
140
125
112
100
90
80
71
63
56
50
45
40
36
Ch
apter 4
: Ex
perim
ental R
esults, D
iscussio
ns an
d O
bserv
ation
s 201
2
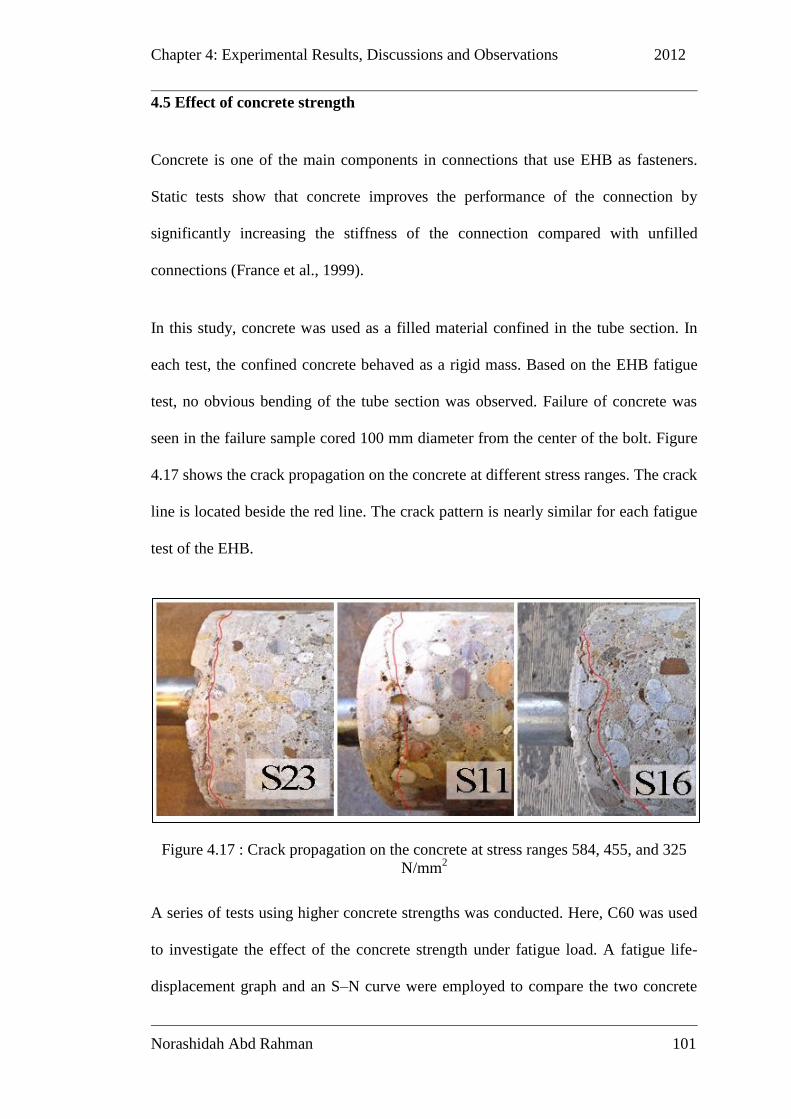
Chapter 4: Experimental Results, Discussions and Observations 2012
Norashidah Abd Rahman 101
101
4.5 Effect of concrete strength
Concrete is one of the main components in connections that use EHB as fasteners.
Static tests show that concrete improves the performance of the connection by
significantly increasing the stiffness of the connection compared with unfilled
connections (France et al., 1999).
In this study, concrete was used as a filled material confined in the tube section. In
each test, the confined concrete behaved as a rigid mass. Based on the EHB fatigue
test, no obvious bending of the tube section was observed. Failure of concrete was
seen in the failure sample cored 100 mm diameter from the center of the bolt. Figure
4.17 shows the crack propagation on the concrete at different stress ranges. The crack
line is located beside the red line. The crack pattern is nearly similar for each fatigue
test of the EHB.
Figure 4.17 : Crack propagation on the concrete at stress ranges 584, 455, and 325
N/mm2
A series of tests using higher concrete strengths was conducted. Here, C60 was used
to investigate the effect of the concrete strength under fatigue load. A fatigue life-
displacement graph and an S–N curve were employed to compare the two concrete
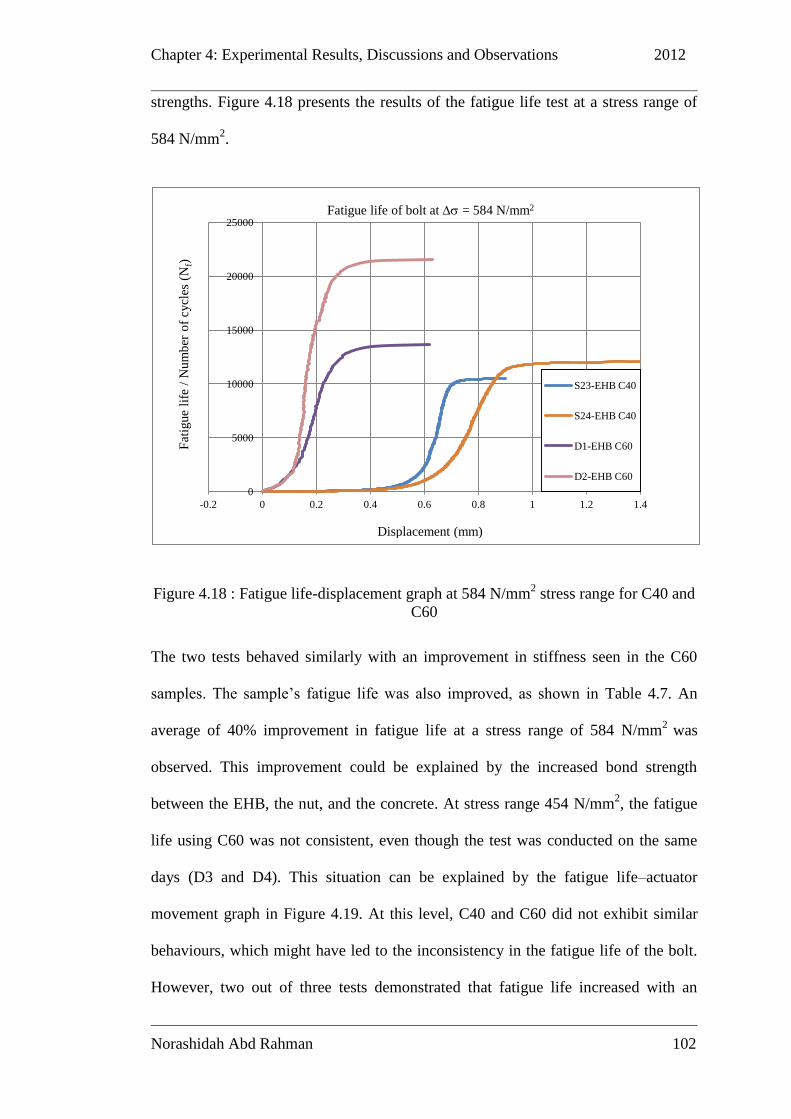
Chapter 4: Experimental Results, Discussions and Observations 2012
Norashidah Abd Rahman 102
102
strengths. Figure 4.18 presents the results of the fatigue life test at a stress range of
584 N/mm2.
Figure 4.18 : Fatigue life-displacement graph at 584 N/mm2 stress range for C40 and
C60
The two tests behaved similarly with an improvement in stiffness seen in the C60
samples. The sample’s fatigue life was also improved, as shown in Table 4.7. An
average of 40% improvement in fatigue life at a stress range of 584 N/mm2
was
observed. This improvement could be explained by the increased bond strength
between the EHB, the nut, and the concrete. At stress range 454 N/mm2, the fatigue
life using C60 was not consistent, even though the test was conducted on the same
days (D3 and D4). This situation can be explained by the fatigue life–actuator
movement graph in Figure 4.19. At this level, C40 and C60 did not exhibit similar
behaviours, which might have led to the inconsistency in the fatigue life of the bolt.
However, two out of three tests demonstrated that fatigue life increased with an
0
5000
10000
15000
20000
25000
-0.2 0 0.2 0.4 0.6 0.8 1 1.2 1.4
S23-EHB C40
S24-EHB C40
D1-EHB C60
D2-EHB C60
Fat
igue
life
/ N
um
ber
of
cycl
es (
Nf)
Displacement (mm)
Fatigue life of bolt at = 584 N/mm2
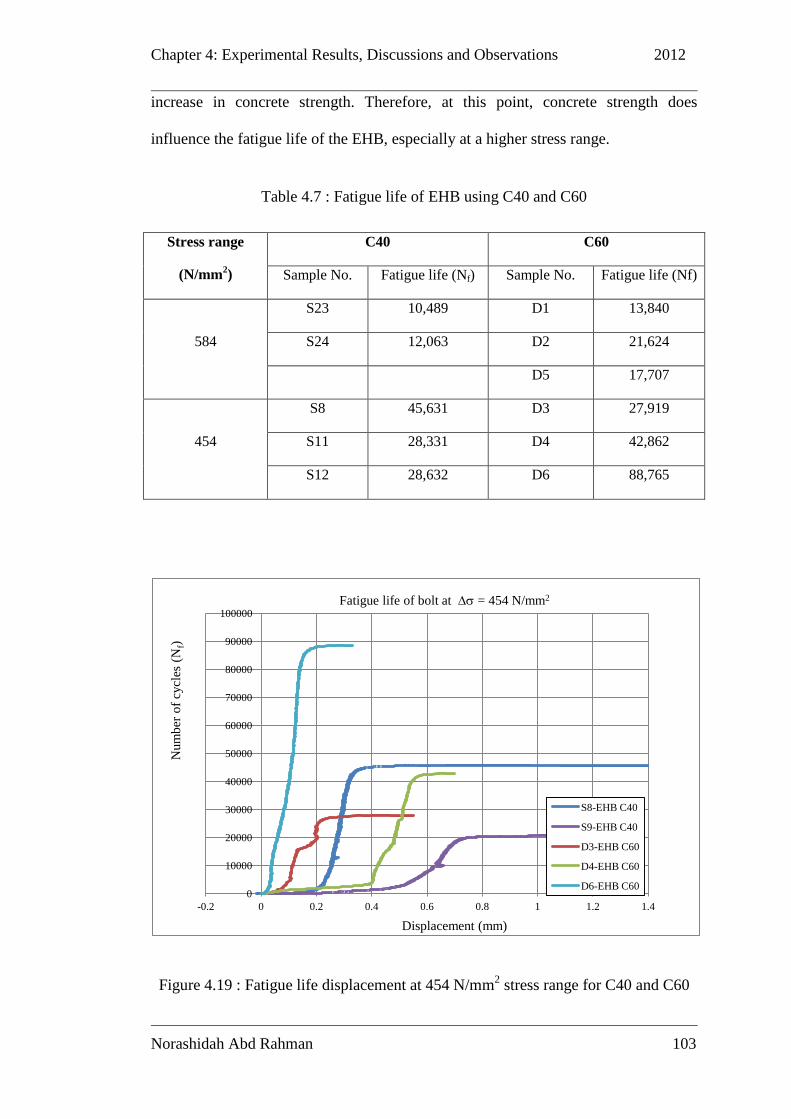
Chapter 4: Experimental Results, Discussions and Observations 2012
Norashidah Abd Rahman 103
103
increase in concrete strength. Therefore, at this point, concrete strength does
influence the fatigue life of the EHB, especially at a higher stress range.
Table 4.7 : Fatigue life of EHB using C40 and C60
Stress range
(N/mm2)
C40 C60
Sample No. Fatigue life (Nf) Sample No. Fatigue life (Nf)
584
S23 10,489 D1 13,840
S24 12,063 D2 21,624
D5 17,707
454
S8 45,631 D3 27,919
S11 28,331 D4 42,862
S12 28,632 D6 88,765
Figure 4.19 : Fatigue life displacement at 454 N/mm2 stress range for C40 and C60
0
10000
20000
30000
40000
50000
60000
70000
80000
90000
100000
-0.2 0 0.2 0.4 0.6 0.8 1 1.2 1.4
S8-EHB C40
S9-EHB C40
D3-EHB C60
D4-EHB C60
D6-EHB C60
Num
ber
of
cycl
es (
Nf)
Displacement (mm)
Fatigue life of bolt at = 454 N/mm2
Chapter 4: Experimental Results, Discussions and Observations 2012
Norashidah Abd Rahman 104
104
4.6 Chapter summary
This chapter has presented the results of the fatigue tests conducted in this study. The
results demonstrated that frequency does not influence the fatigue life of the EHB at
high stress levels, but slightly influences the fatigue life at low stress ranges. The
EHB was found to have a longer fatigue life than the standard HB, but has lower
fatigue life than standard bolts when used in concrete-filled sections. For the three
types of bolts investigated, a common failure mode was observed due to bolt
fracture. The longer fatigue life of the EHB can be attributed to the bolt anchorage
and the nut. The nut at the end of the EHB prevents the bolt from pulling out and
gives the EHB more strength. In addition, concrete strength has a significant effect
on the fatigue life of the EHB, especially at high stress levels. At lower levels,
increasing the fatigue life does not indicate clear results in two out of three tests.
Chapter 5: Statistical and Reliability Analysis 2012
Norashidah Abd Rahman 105
105
Chapter 5 : Statistical and Reliability Analysis
5.1 Introduction
This chapter discusses the validation of fatigue test data, to perform the statistical
analysis and to assess the reliability of the Extended Hollobolt. The statistical
analysis is performed to assess the behaviour of EHB using S-N curve and using the
limit state design technique. To assess the reliability index of EHB, the reliability is
calculated and compare with target reliability index according to BS EN 1990
(2002). To perform the statistical and reliability analysis, only fatigue test data of the
Extended Hollobolt (EHB, grade 8.8) with concrete strength C40 was analysed.
Currently, the most popular technique used for both research and applications in
structural design is the limit state design technique. Limit state design focuses on the
prediction of the actual load capacity at which failure will occur in the structure. The
two types of limit states are listed below.
1. Ultimate limit state refers to the load at which the structure will
collapse and at which it can no longer serve its intended function. This
type of limit state is concern about the safety of structure. It can be
threat as ultimate limit state when the structure loss of equilibrium,
failure by excessive deformation, rupture, loss of stability of the
structure including supports and foundation and failure cause by
fatigue or other time-dependent effects.
Chapter 5: Statistical and Reliability Analysis 2012
Norashidah Abd Rahman 106
106
2. Serviceability limit state refers to the load at which the structure is
damaged but can still accept additional load. Repair is usually
required to restore the structure to an acceptable state. This type of
limit state is concern about the functioning of the structure or
structural members under normal use. The verification of
serviceability limit states should be based on criteria concerning
deformation that affect the appearance or the functioning the
structure, vibrations and etc.
Eventhough fatigue is design under ultimate limit state design condition, in order to
determine the fatigue behaviour under normal working load, it is appropriate to
conduct this study under serviceability limit state design.
The limit state is usually combined with a type of probabilistic analysis to determine
whether the calculated strength is sufficient enough to guarantee safety of use. In this
study, probability analysis is conducted to validate the data from the fatigue test.
Thus, suitable probability distribution is define to choose the appropriate method for
statistical and reliability analysis.
5.2 Probability Distribution Function
Fatigue testing determines the relationship between the fatigue resistance of a given
material, component, or structural detail, and cyclic loading. The results of the
fatigue endurance test are plotted on a graph that compares the applied loading
(force, stress, strain, and etc) with the number of cycles prior to failure. Test
specimens do not always meet testing conditions. Thus, the resulting data are
invariably hampered by uncertainties that exist in the fatigue process (Schneider and

Chapter 5: Statistical and Reliability Analysis 2012
Norashidah Abd Rahman 107
107
Maddox, 2003, Wirsching, 1998) although testing conditions are maintained as
identical as possible. Consequently, critical judgement is essential in analysing the
test data. Statistical methods assist in analysing fatigue test data and in providing
recommendations on the use of such data for analysis, such as in the case of BS 2846
(BS 2846, 2002).
Given that individual fatigue failures are impossible to predict, failure from a given
set of test conditions is assumed to be distributed randomly within a fairly
predictable distribution function. The basic practice for the statistical analysis of
fatigue test data, as outlined in Eurocode 3 Parts 1- 9 (BS EN1993, 2006) and in
ECCS (1985), is available to guide the design. The fatigue life of a component is
typically determined by tests that apply constant amplitude stress. Cycles to failure
are measured, and a curve is fitted to the data. Mean and standard deviation are
determined in accordance with the distribution function.
Probability distribution function is a general term used to express the variability in
fatigue test results/data. In statistical quality studies, the underlying assumption is
that the data are obtained from normal distribution (Chandrupatla, 2009, Schneider
and Maddox, 2003). The other functions commonly used to represent fatigue data are
the lognormal and Weibull distribution. In this study, only three distributions are
discussed, namely, normal, lognormal, and Weibull distributions. The properties of
these types of distributions are summarized in Table 5.1, where β is shape parameter
of distribution, α is scale parameter, ϛ is the Weibull shape parameter, and Γ is the
gamma function.
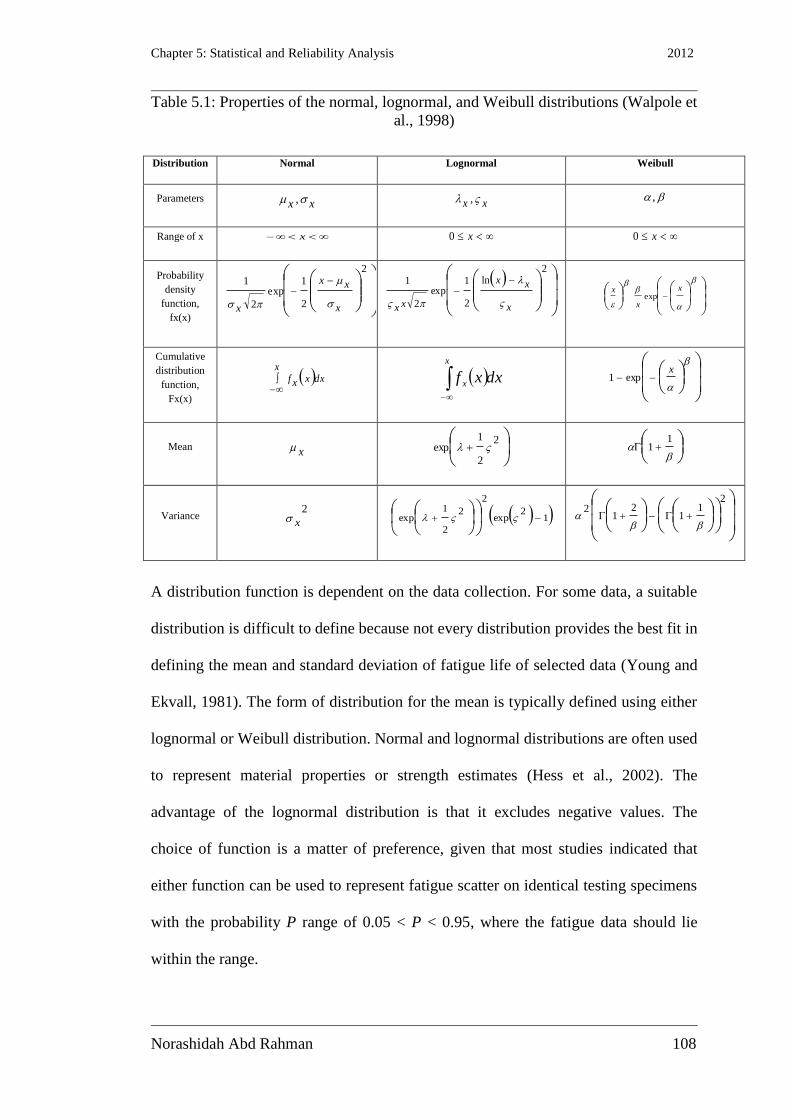
Chapter 5: Statistical and Reliability Analysis 2012
Norashidah Abd Rahman 108
108
Table 5.1: Properties of the normal, lognormal, and Weibull distributions (Walpole et
al., 1998)
Distribution Normal Lognormal Weibull
Parameters xx , xx , ,
Range of x x x0 x0
Probability
density
function,
fx(x)
2
2
1exp
2
1
x
xx
x
2ln
2
1exp
2
1
x
xx
xx
x
x
xexp
Cumulative
distribution
function,
Fx(x)
dxx
xxf
dxxf
x
x
xexp1
Mean x
2
2
1exp
1
1
Variance 2
x 12exp
2
2
2
1exp
21
12
12
A distribution function is dependent on the data collection. For some data, a suitable
distribution is difficult to define because not every distribution provides the best fit in
defining the mean and standard deviation of fatigue life of selected data (Young and
Ekvall, 1981). The form of distribution for the mean is typically defined using either
lognormal or Weibull distribution. Normal and lognormal distributions are often used
to represent material properties or strength estimates (Hess et al., 2002). The
advantage of the lognormal distribution is that it excludes negative values. The
choice of function is a matter of preference, given that most studies indicated that
either function can be used to represent fatigue scatter on identical testing specimens
with the probability P range of 0.05 < P < 0.95, where the fatigue data should lie
within the range.
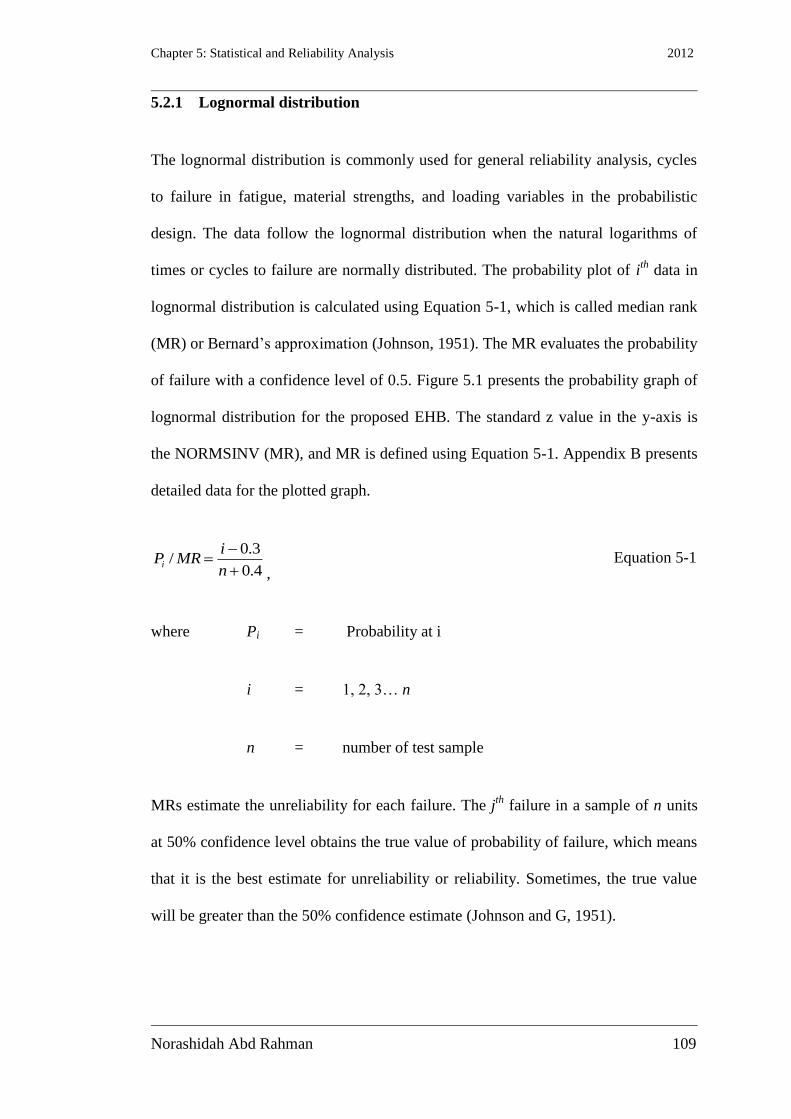
Chapter 5: Statistical and Reliability Analysis 2012
Norashidah Abd Rahman 109
109
5.2.1 Lognormal distribution
The lognormal distribution is commonly used for general reliability analysis, cycles
to failure in fatigue, material strengths, and loading variables in the probabilistic
design. The data follow the lognormal distribution when the natural logarithms of
times or cycles to failure are normally distributed. The probability plot of ith
data in
lognormal distribution is calculated using Equation 5-1, which is called median rank
(MR) or Bernard’s approximation (Johnson, 1951). The MR evaluates the probability
of failure with a confidence level of 0.5. Figure 5.1 presents the probability graph of
lognormal distribution for the proposed EHB. The standard z value in the y-axis is
the NORMSINV (MR), and MR is defined using Equation 5-1. Appendix B presents
detailed data for the plotted graph.
4.0
3.0/
n
iMRPi
, Equation 5-1
where Pi = Probability at i
i = 1, 2, 3… n
n = number of test sample
MRs estimate the unreliability for each failure. The jth
failure in a sample of n units
at 50% confidence level obtains the true value of probability of failure, which means
that it is the best estimate for unreliability or reliability. Sometimes, the true value
will be greater than the 50% confidence estimate (Johnson and G, 1951).
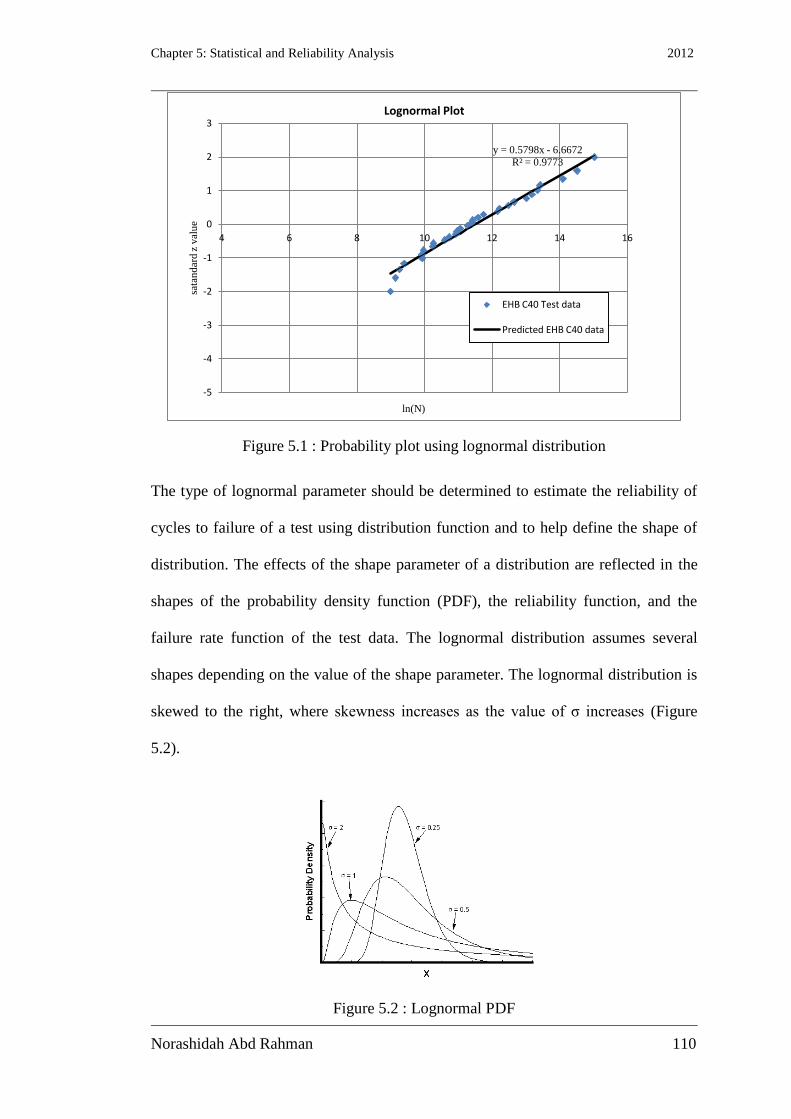
Chapter 5: Statistical and Reliability Analysis 2012
Norashidah Abd Rahman 110
110
Figure 5.1 : Probability plot using lognormal distribution
The type of lognormal parameter should be determined to estimate the reliability of
cycles to failure of a test using distribution function and to help define the shape of
distribution. The effects of the shape parameter of a distribution are reflected in the
shapes of the probability density function (PDF), the reliability function, and the
failure rate function of the test data. The lognormal distribution assumes several
shapes depending on the value of the shape parameter. The lognormal distribution is
skewed to the right, where skewness increases as the value of σ increases (Figure
5.2).
Figure 5.2 : Lognormal PDF
y = 0.5798x - 6.6672
R² = 0.9773
-5
-4
-3
-2
-1
0
1
2
3
4 6 8 10 12 14 16
sata
nd
ard z
val
ue
ln(N)
Lognormal Plot
EHB C40 Test data
Predicted EHB C40 data

Chapter 5: Statistical and Reliability Analysis 2012
Norashidah Abd Rahman 111
111
The shape parameter is used to predict the reliability of the cycles to failure in the
fatigue test. Using the approximation of MR or Bernard’s approximation, the
reliability at the jth
failure is evaluated (Chandrupatla, 2009).
jj MRtR 1)( Equation 5-2
The shape parameter is defined by the lognormal parameters μ and σ. Using the best-
fit line, values of μ and σ are calculated, where μ=16.6672/0.5798=1.500, and
σ=1/6.6672=1.7248. The graph of probability density, also known as the survival
probability graph, is presented in Figure 5.3. Analysis of data is detailed in Appendix
B.
Figure 5.3 : Lognormal survival graph
0
0.2
0.4
0.6
0.8
1
1.2
0 500000 1000000 1500000 2000000
Lognormal survival graph
EHB C40 (8.8)
Number of cycles (N)
Pro
bab
ilit
y d
ensi
ty
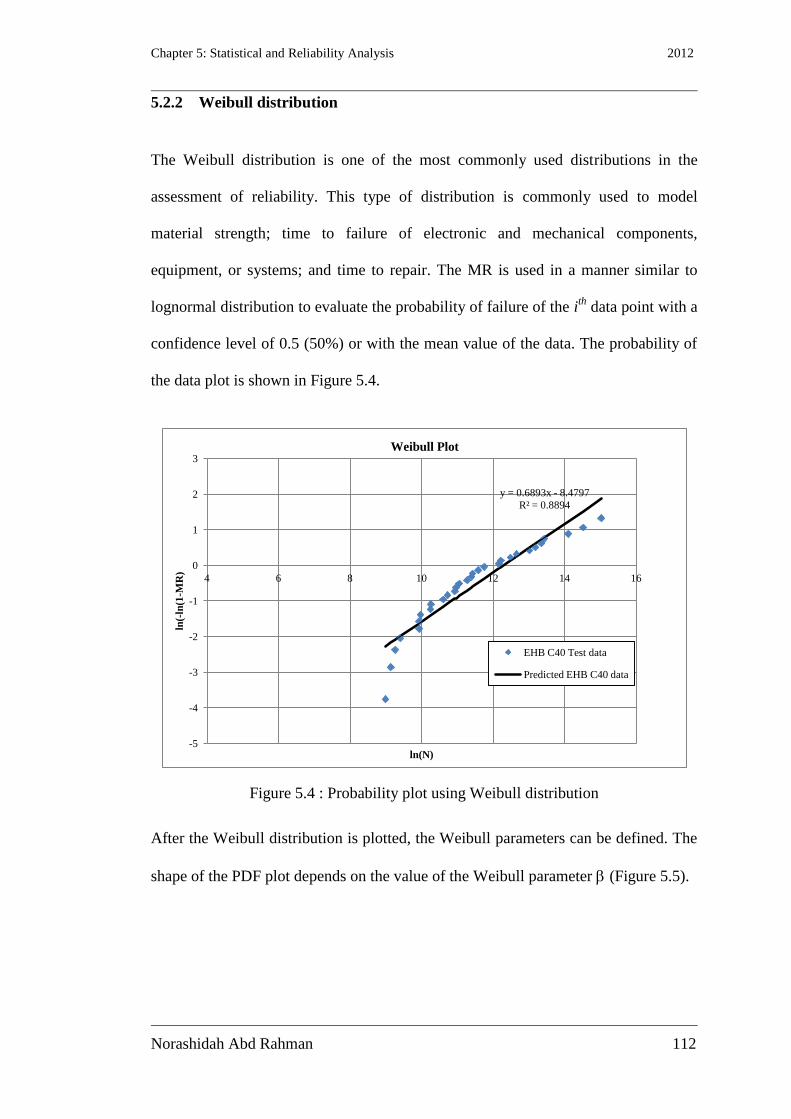
Chapter 5: Statistical and Reliability Analysis 2012
Norashidah Abd Rahman 112
112
5.2.2 Weibull distribution
The Weibull distribution is one of the most commonly used distributions in the
assessment of reliability. This type of distribution is commonly used to model
material strength; time to failure of electronic and mechanical components,
equipment, or systems; and time to repair. The MR is used in a manner similar to
lognormal distribution to evaluate the probability of failure of the ith
data point with a
confidence level of 0.5 (50%) or with the mean value of the data. The probability of
the data plot is shown in Figure 5.4.
Figure 5.4 : Probability plot using Weibull distribution
After the Weibull distribution is plotted, the Weibull parameters can be defined. The
shape of the PDF plot depends on the value of the Weibull parameter (Figure 5.5).
y = 0.6893x - 8.4797
R² = 0.8894
-5
-4
-3
-2
-1
0
1
2
3
4 6 8 10 12 14 16
ln(-
ln(1
-MR
)
ln(N)
Weibull Plot
EHB C40 Test data
Predicted EHB C40 data

Chapter 5: Statistical and Reliability Analysis 2012
Norashidah Abd Rahman 113
113
Figure 5.5 : Weibull PDF (Survival graph)
By changing the value of the shape parameter β, the Weibull distribution can model a
wide variety of data. If = 1, the Weibull distribution is identical to the exponential
distribution; if = 2, the Weibull distribution is identical to the Rayleigh
distribution; and if β is between 3 and 4, the Weibull distribution approximates the
normal distribution. The Weibull distribution approximates the lognormal
distribution for several values of .
In the EHB C40 data analysis, the shape parameter is = 0.7, which is close to the
exponential distribution function. This study does not discuss the exponential
distribution. The shape parameter or survival graph predicts the reliability of the
fatigue life at x for the EHB connection to the concrete-filled tube. For example,
based on the graph, the reliability of EHB is predicted to be 0.059 at a 1 million cycle
fatigue life.

Chapter 5: Statistical and Reliability Analysis 2012
Norashidah Abd Rahman 114
114
Figure 5.6 : Survival graph using the Weibull distribution of EHB C40 test data
5.2.3 Normal distribution
Normal distribution is the most commonly used distribution in statistical analyses of
data. The normal distribution can describe the statistical behaviour of a large number
of real events. The shape of the normal distribution is completely defined by the
mean and standard deviation (Table 5.1). Given the mean and standard deviation, the
probability of normal distribution can be computed. The first step is to plot the
probability of the data. Basically, n data points are arranged in ascending order.
Therefore, the probability value for the ith
data point is assumed to be the following:
n
iPi
5.0
. Equation 5-3
The z-value corresponding to Pi is defined using the standard normal inverse (zi) to
plot normal probability, and xi versus zi is plotted (Figure 5.7).
0
0.2
0.4
0.6
0.8
1
1.2
0 500000 1000000 1500000 2000000
Weibull survival graph
EHB C40 (8.8)
Pro
bab
ilit
y d
ensi
ty
Number of Cycles
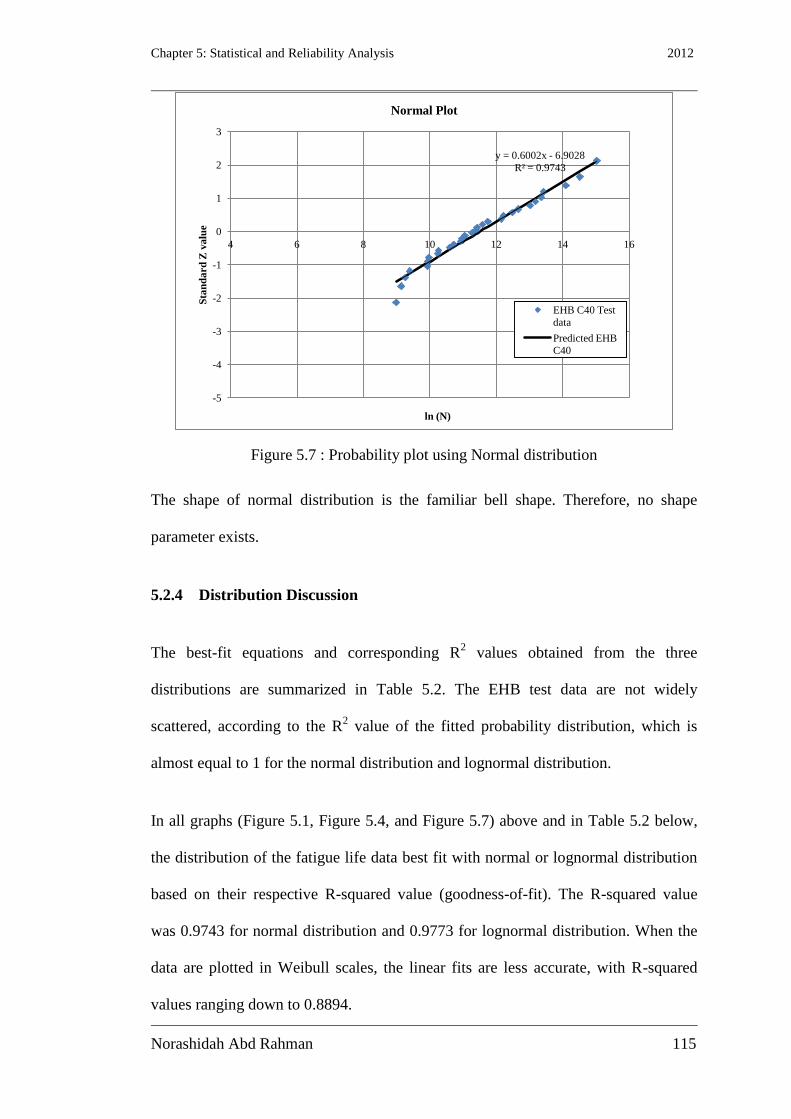
Chapter 5: Statistical and Reliability Analysis 2012
Norashidah Abd Rahman 115
115
Figure 5.7 : Probability plot using Normal distribution
The shape of normal distribution is the familiar bell shape. Therefore, no shape
parameter exists.
5.2.4 Distribution Discussion
The best-fit equations and corresponding R2 values obtained from the three
distributions are summarized in Table 5.2. The EHB test data are not widely
scattered, according to the R2 value of the fitted probability distribution, which is
almost equal to 1 for the normal distribution and lognormal distribution.
In all graphs (Figure 5.1, Figure 5.4, and Figure 5.7) above and in Table 5.2 below,
the distribution of the fatigue life data best fit with normal or lognormal distribution
based on their respective R-squared value (goodness-of-fit). The R-squared value
was 0.9743 for normal distribution and 0.9773 for lognormal distribution. When the
data are plotted in Weibull scales, the linear fits are less accurate, with R-squared
values ranging down to 0.8894.
y = 0.6002x - 6.9028
R² = 0.9743
-5
-4
-3
-2
-1
0
1
2
3
4 6 8 10 12 14 16
Sta
nd
ard
Z v
alu
e
ln (N)
Normal Plot
EHB C40 Test
data
Predicted EHB
C40

Chapter 5: Statistical and Reliability Analysis 2012
Norashidah Abd Rahman 116
116
Table 5.2 : Comparison of the three distributions
Normal distribution Lognormal
distribution
Weibull
distribution
Line fit equation y = 0.6028x-6.9028 y = 0.5798x-6.6672 y = 0.6893x-8.4797
R2 0.9743 0.9773 0.8894
Among the three graphical analyses, lognormal and normal distribution are
considered the appropriate distribution types for the fatigue test of EHB connected to
a concrete-filled hollow section. The fatigue tests are capable of investigating the
reliability of the EHB. Therefore, the characteristic S-N curve can be defined using
the statistical equation of lognormal format, as suggested in the British Standard (BS
ISO, 2003), the details of which are discussed in the next section.
5.3 Extended Hollobolt S-N curve characteristic
For typical S-N curves, a linear fit is obtained using log (N) and log (S). The fitting
technique (least squares) should identify the best-fit straight line through the data. A
standard practice in analysing fatigue data using the fitting technique is offered by
the British Standard (BS ISO 12107, 2003). The best-fit straight line through the data
is estimated by ordinary linear regression, as described by Gurney and Maddox
(1973). A general method to estimate the slope and intercept coefficients is called
“least square estimation.” Therefore, the basic equation that represents the S-N curve
is given by:
logloglog mAN , Equation 5-4
Chapter 5: Statistical and Reliability Analysis 2012
Norashidah Abd Rahman 117
117
where log corresponds to base 10, m is the slope, and A is the intercept. This equation
can be rewritten in the following form, which is commonly used to describe S-N
curves in design rules:
ANm . Equation 5-5
Using Equation 5-5, the strength model can be written as the following linear
regression (Schneider and Maddox, 2003):
bXaY , Equation 5-6
where
mbAaNYX ,log,log,log .
Fatigue strength can be computed over a fatigue life range covered by the straight
line if the slope of the line and one point on the line are known. However, only one
type of stress cycle and one detail are represented on an individual S-N curve. In this
case, the S-N curve is represented by the curve for bolt in tension (BS EN1993,
2006), where a similar assumption is applied in the classification of bolts in EC3.
Using the equation above, the mean value of the scattered fatigue data can be defined
by plotting the data using a log-log graph. The British Standard (BS ISO 12107,
2003) offers a standard practice for this class of analysis.
Figure 5.8 presents the fitting graph of mean values for three types of bolts. Thus, the
EHB has a fatigue life performance in between that of the HB and the standard bolt
(M16). Further details are provided in Chapter 4.
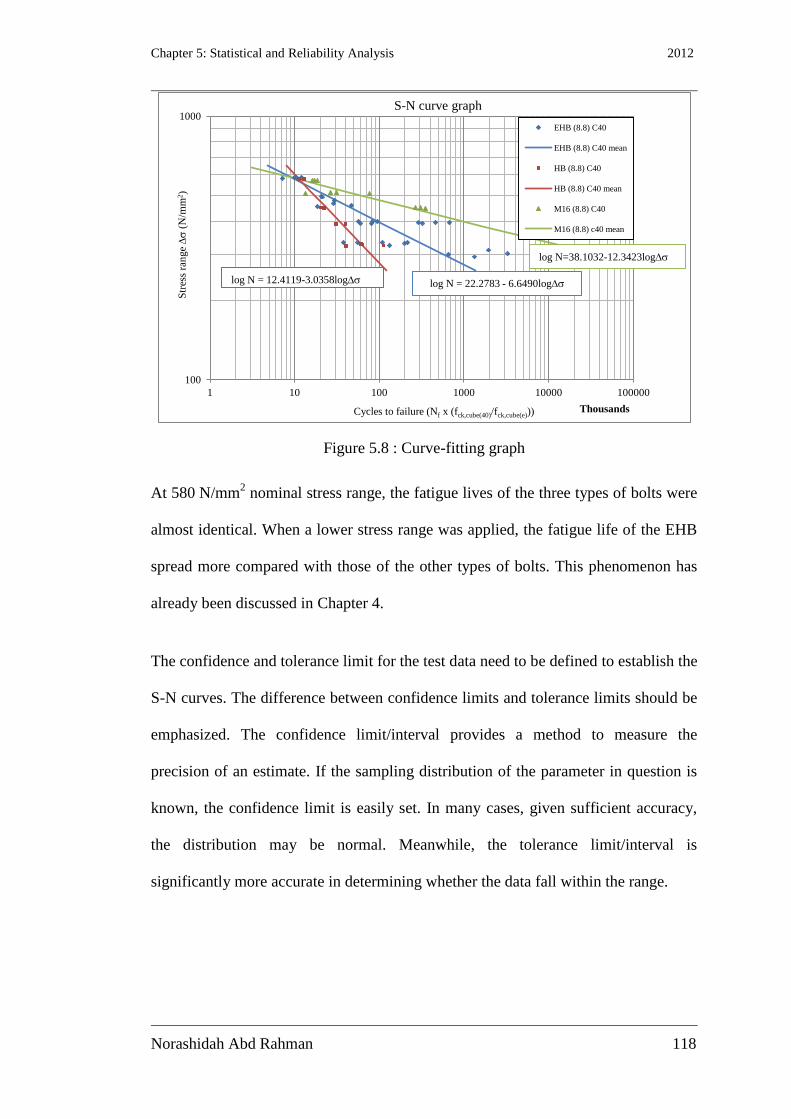
Chapter 5: Statistical and Reliability Analysis 2012
Norashidah Abd Rahman 118
118
Figure 5.8 : Curve-fitting graph
At 580 N/mm2 nominal stress range, the fatigue lives of the three types of bolts were
almost identical. When a lower stress range was applied, the fatigue life of the EHB
spread more compared with those of the other types of bolts. This phenomenon has
already been discussed in Chapter 4.
The confidence and tolerance limit for the test data need to be defined to establish the
S-N curves. The difference between confidence limits and tolerance limits should be
emphasized. The confidence limit/interval provides a method to measure the
precision of an estimate. If the sampling distribution of the parameter in question is
known, the confidence limit is easily set. In many cases, given sufficient accuracy,
the distribution may be normal. Meanwhile, the tolerance limit/interval is
significantly more accurate in determining whether the data fall within the range.
100
1000
1 10 100 1000 10000 100000
Thousands
EHB (8.8) C40
EHB (8.8) C40 mean
HB (8.8) C40
HB (8.8) C40 mean
M16 (8.8) C40
M16 (8.8) c40 mean
Cycles to failure (Nf x (fck,cube(40)/fck,cube(e)))
Str
ess
ran
ge
(N
/mm
2)
log N=38.1032-12.3423log
log N = 22.2783 - 6.6490log log N = 12.4119-3.0358log
S-N curve graph

Chapter 5: Statistical and Reliability Analysis 2012
Norashidah Abd Rahman 119
119
5.3.1 Tolerance Limits
Typical curve fitting determines the average fatigue behaviour of materials given an
appropriate range of stress levels. Scattered data indicate that some materials have
lower strength and some have higher strength than the average. A distribution of
strengths typically underlies the scatter of fatigue data.
An alternative methodology for the establishment of a characteristic curve is called
tolerance limit. Tolerance limits are based on the estimation of confidence limits.
Tolerance limits are a valuable tool for the study of the sensitivity of design curves
and can be used to justify design curves that are based on small samples, especially
for sample sizes smaller than 40 (Schneider and Maddox, 2003).
In this study, tolerance limit ensures that test data are within the range of 0.05 < P <
0.95, as discussed in Section 5.2, where P denotes the probability of the specimen.
Figure 5.9 : Tolerance limit for fatigue test data
100
1000
1 10 100 1000 10000
Thousands
EHB C40 (8.8)
EHB C40 (8.8)
mean
Lower tolerence
limit (95%)
Upper tolerence
limit (5%)
Str
ess
range
(N
/mm
2)
Cycles to failure (Nf)
Tolerence limit of fatigue test data

Chapter 5: Statistical and Reliability Analysis 2012
Norashidah Abd Rahman 120
120
Statistical analysis based on Eurocodes (BS ISO 12107, 2003) was used to analyze
experimental fatigue data. Figure 5.9 shows the tolerance limit of the test data. The
fatigue test data based on the tolerance limit prediction value are considered
acceptable because all data are between the range 5% to 95% of the tolerance limit,
which is ±45% from mean of test data. Two-sided tolerance limit has always been
discussed or practically used in numerous statistical analyses. However, Little (1981)
proposed the one-sided lower statistical tolerance limit and confirmed its suitability
for analysing fatigue data. When the one-sided lower case is considered, the
minimum limit for the study becomes 95% (-45% from mean test data), a value that
is called the confidence limit. Therefore, the confidence limit is used to define the S-
N curve of the EHB connection to the concrete hollow section. A 95% confidence
level is adopted by EC3 for the design of the S-N curve, along with a 95%
probability level, which is applicable for structures exposed to normal atmospheric
conditions (ISSC Commitee III.2, 2009)
5.3.2 Confidence limit/level
For design purposes, establishing limits between the boundaries of data proportions
(typically 95%) is necessary. These boundaries are often called “confidence limits.”
The established confidence limit properties of fatigue strength provided by the
designer are used with confidence in design (Herbet J. Sutherland and Veers, 2000).
In case of actual data, the prediction limits at stress range ∆σ can be expressed
explicitly in the following form (Schneider and Maddox, 2003, BS ISO 12107,
2003):

Chapter 5: Statistical and Reliability Analysis 2012
Norashidah Abd Rahman 121
121
n
i
i
Pn
tmAN
1
2
2^
%
loglog
loglog11)log(loglog
Equation 5-7
or
2
1
2^
%
11)(
n
i
i
P
xx
xx
ntbxay Equation 5-8
where Log A(a) and m(b) are the coefficients of the regression line through the n data
points,
log is the mean of the n values of log ∆σi,
t is the appropriate percentage points of t distribution, with n-2 degrees of freedom
(v), and
^
is the best estimate of the standard deviation of the data about the regression line.
The value of t is defined from the student’s t distribution. The t distribution of the
student (Appendix C) is applied if sample n>30 is used to estimate the confidence
limit/level of the mean when the standard deviation is unknown. All terms inside the
root sign in Equation 5-8 is a correction to the estimated standard deviation for the
population. This correction depends on the number of tests and on the range covered
by the tests. When the number and the range of the tests are sufficient, the correction
term is close to 1 and may be neglected. Equation 5-9 is used to calculate the
estimated standard deviation of the fatigue life from the mean of the S-N curve as
follows:

Chapter 5: Statistical and Reliability Analysis 2012
Norashidah Abd Rahman 122
122
2
)(2
1
n
bxayS ii
n
ix
Equation 5-9
where
a and b are the coefficients of the regression line through the n data points, and
Sx is the standard deviation of x data.
The predicted lower limit of the fatigue data is also known as the design
characteristic (Collate, 2005), where the lower limit provides low stresses. The
definition of characteristic design is illustrated in Figure 5.10. In conventional usage
(e.g., in design), the load or strength is described only by this value (Melchers,
2001). A linear extrapolation of the S-N curve at lower stresses will normally tend to
be safe because of the approach to the fatigue limit (Gurney, 1979).
Figure 5.10 : Definition of characteristic resistance
Using the equations from the available design code (BS ISO 12107, 2003), that is,
Equations 5-6 and 5-8, the S-N curve of characteristic design is plotted and is shown
in Figure 5.11, and the S-N curve result is summarized in Table 5.3. Therefore, the
characteristic design of the EHB can be written as
log5747.64863.21logN Equation 5-10
0.05
Characteristic
Design
μR
βσ
R0.05
0.05
R0.95
βσ

Chapter 5: Statistical and Reliability Analysis 2012
Norashidah Abd Rahman 123
123
Figure 5.11 : S-N curve characteristic design
Table 5.3 : S-N Curve result of the EHB
Description Slope m Stress at 2 million cycles
(N/mm2)
Mean value 6.6 253
Characteristic value 6.6 204
Using Equation 5-10, the stress range of the EHB can be classified as 204 N/mm2 at
2 million cycles, which is above the recommendation of Eurocode 3, parts 1-9.
5.3.3 Standard deviation
Standard deviations vary from test to test and from the type of details studied. A
higher stress concentration factor generally results in a lower standard deviation for
fatigue testing. Table 5.4 shows the standard deviation of fatigue strength of the EHB
100
1000
1 10 100 1000 10000
Thousands
EHB C40 (8.8)
EHB C40 (8.8)
mean
Characteristic
Design S
tres
s ra
nge
(N
/mm
2)
Cycles to failure (Nf)
log N = 22.2783-6.6490log
logN = 21.4863-6.5747log
2x10⁶
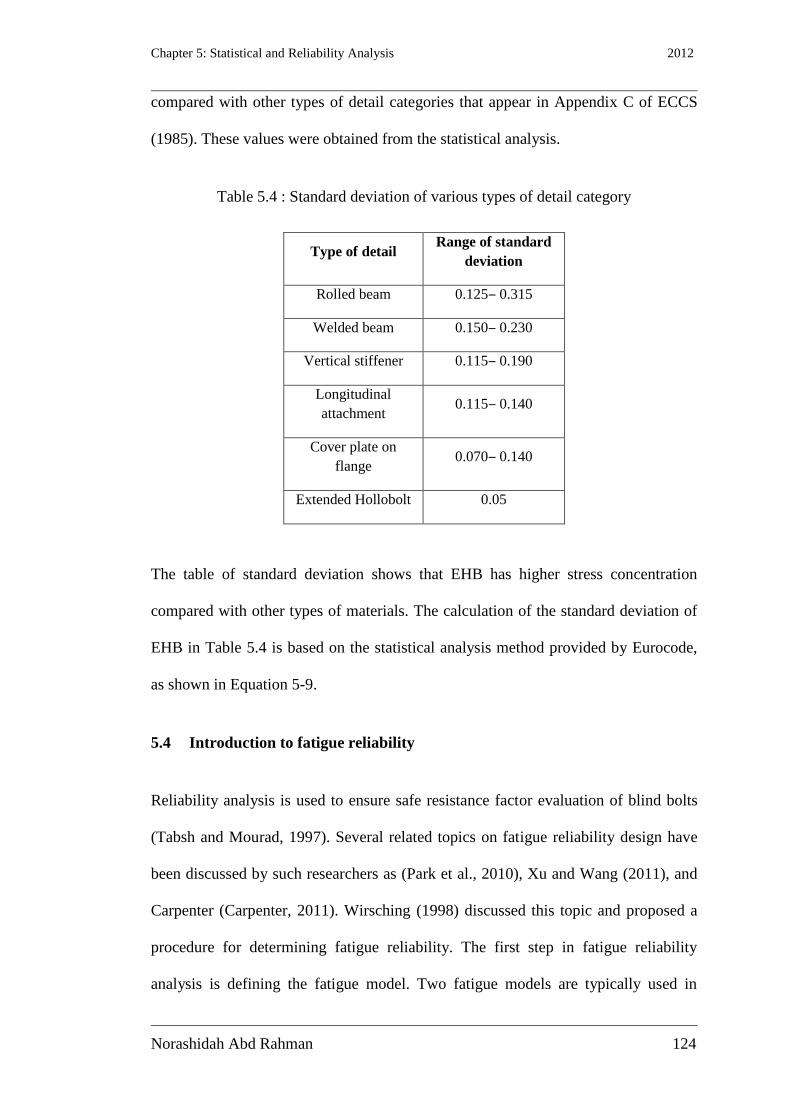
Chapter 5: Statistical and Reliability Analysis 2012
Norashidah Abd Rahman 124
124
compared with other types of detail categories that appear in Appendix C of ECCS
(1985). These values were obtained from the statistical analysis.
Table 5.4 : Standard deviation of various types of detail category
Type of detail Range of standard
deviation
Rolled beam 0.125‒ 0.315
Welded beam 0.150‒ 0.230
Vertical stiffener 0.115‒ 0.190
Longitudinal
attachment 0.115‒ 0.140
Cover plate on
flange 0.070‒ 0.140
Extended Hollobolt 0.05
The table of standard deviation shows that EHB has higher stress concentration
compared with other types of materials. The calculation of the standard deviation of
EHB in Table 5.4 is based on the statistical analysis method provided by Eurocode,
as shown in Equation 5-9.
5.4 Introduction to fatigue reliability
Reliability analysis is used to ensure safe resistance factor evaluation of blind bolts
(Tabsh and Mourad, 1997). Several related topics on fatigue reliability design have
been discussed by such researchers as (Park et al., 2010), Xu and Wang (2011), and
Carpenter (Carpenter, 2011). Wirsching (1998) discussed this topic and proposed a
procedure for determining fatigue reliability. The first step in fatigue reliability
analysis is defining the fatigue model. Two fatigue models are typically used in
Chapter 5: Statistical and Reliability Analysis 2012
Norashidah Abd Rahman 125
125
determining the fatigue reliability: the S-N approach and the fracture mechanics
approach. The S-N approach is a traditional model that describes fatigue life under
constant amplitude. This method is based on the experimental measurement of
fatigue life in terms of failure cycles at different loading levels. The fracture
mechanics approach, on the other hand, is based on the existence of an initial crack
in a stress-free structure. The fracture mechanics approach is more detailed and
involves the examination of crack growth and determines the number of load cycles
needed for small initial defects to grow into cracks that are sufficiently large to cause
fracture.
Constant amplitude is applied in this study. Therefore, the S-N approach is more
suitable for analysing the reliability of the EHB connected to concrete-filled hollow
sections under fatigue loading.
5.5 Fatigue reliability analysis
Several numerical methods can be used to evaluate the failure probability of safety
index. These methods include the first-order reliability method (FORM), the second-
order reliability method (SORM), and the Monte Carlo method. FORM is one of the
methods used for utilizing the reliability index and is the most used method in
providing the safety index with the application of lognormal distribution. SORM is
recommended if lognormal is not applied. The FORM technique emerged from the
efforts to find a simple method of estimating the failure probability of the linear state
functions of several variables by initially assuming that the variables follow a normal
distribution. The technique was proven quite powerful for handling complex cases
involving non-normal variables, non-linear limit state functions, and correlated
variables. Approximately 90% of all applications that use this first-order theory
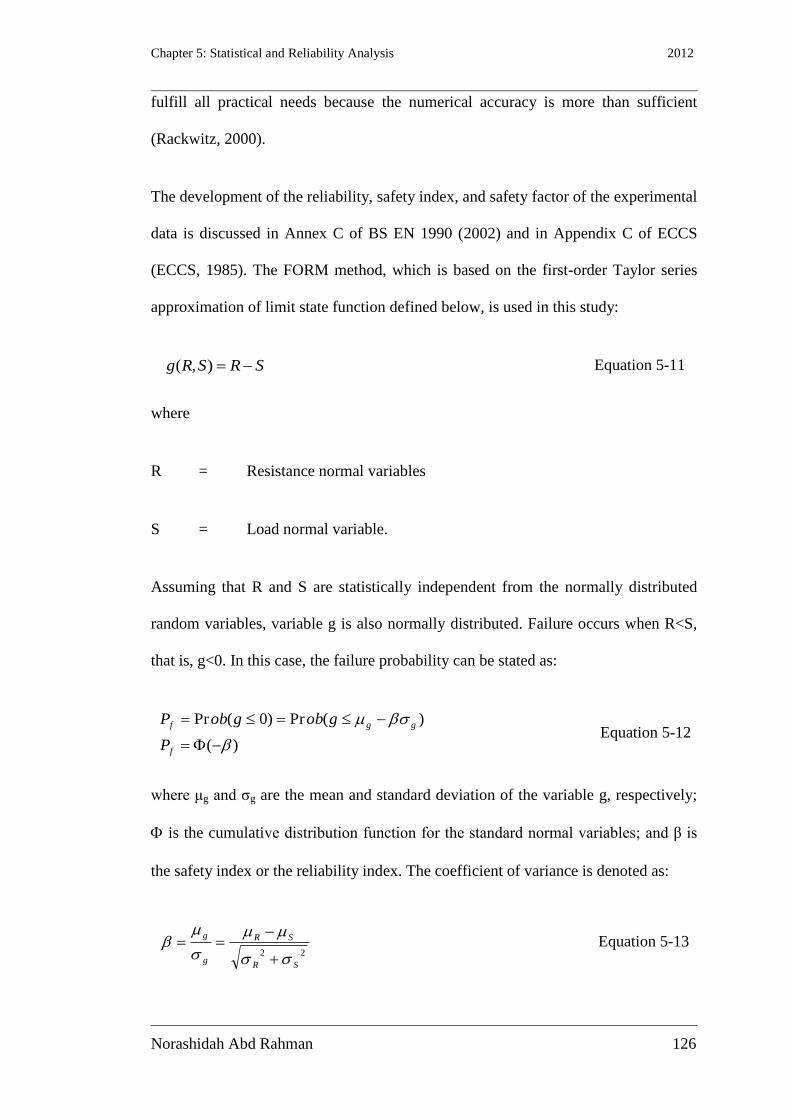
Chapter 5: Statistical and Reliability Analysis 2012
Norashidah Abd Rahman 126
126
fulfill all practical needs because the numerical accuracy is more than sufficient
(Rackwitz, 2000).
The development of the reliability, safety index, and safety factor of the experimental
data is discussed in Annex C of BS EN 1990 (2002) and in Appendix C of ECCS
(ECCS, 1985). The FORM method, which is based on the first-order Taylor series
approximation of limit state function defined below, is used in this study:
SRSRg ),( Equation 5-11
where
R = Resistance normal variables
S = Load normal variable.
Assuming that R and S are statistically independent from the normally distributed
random variables, variable g is also normally distributed. Failure occurs when R<S,
that is, g<0. In this case, the failure probability can be stated as:
)(
)(Pr)0(Pr
f
ggf
P
gobgobP Equation 5-12
where μg and σg are the mean and standard deviation of the variable g, respectively;
is the cumulative distribution function for the standard normal variables; and β is
the safety index or the reliability index. The coefficient of variance is denoted as:
22
SR
SR
g
g
Equation 5-13
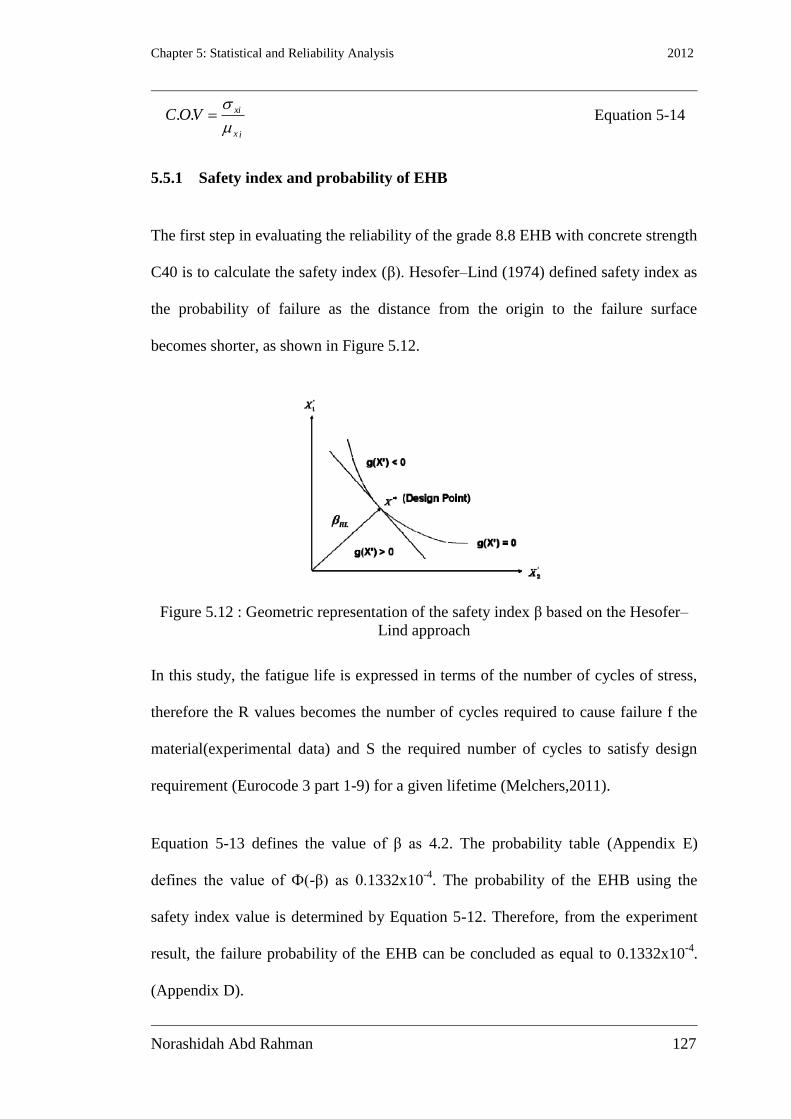
Chapter 5: Statistical and Reliability Analysis 2012
Norashidah Abd Rahman 127
127
ix
xiVOC
.. Equation 5-14
5.5.1 Safety index and probability of EHB
The first step in evaluating the reliability of the grade 8.8 EHB with concrete strength
C40 is to calculate the safety index (β). Hesofer–Lind (1974) defined safety index as
the probability of failure as the distance from the origin to the failure surface
becomes shorter, as shown in Figure 5.12.
Figure 5.12 : Geometric representation of the safety index β based on the Hesofer–
Lind approach
In this study, the fatigue life is expressed in terms of the number of cycles of stress,
therefore the R values becomes the number of cycles required to cause failure f the
material(experimental data) and S the required number of cycles to satisfy design
requirement (Eurocode 3 part 1-9) for a given lifetime (Melchers,2011).
Equation 5-13 defines the value of β as 4.2. The probability table (Appendix E)
defines the value of Ф(-β) as 0.1332x10⁻⁴
. The probability of the EHB using the
safety index value is determined by Equation 5-12. Therefore, from the experiment
result, the failure probability of the EHB can be concluded as equal to 0.1332x10⁻⁴
.
(Appendix D).
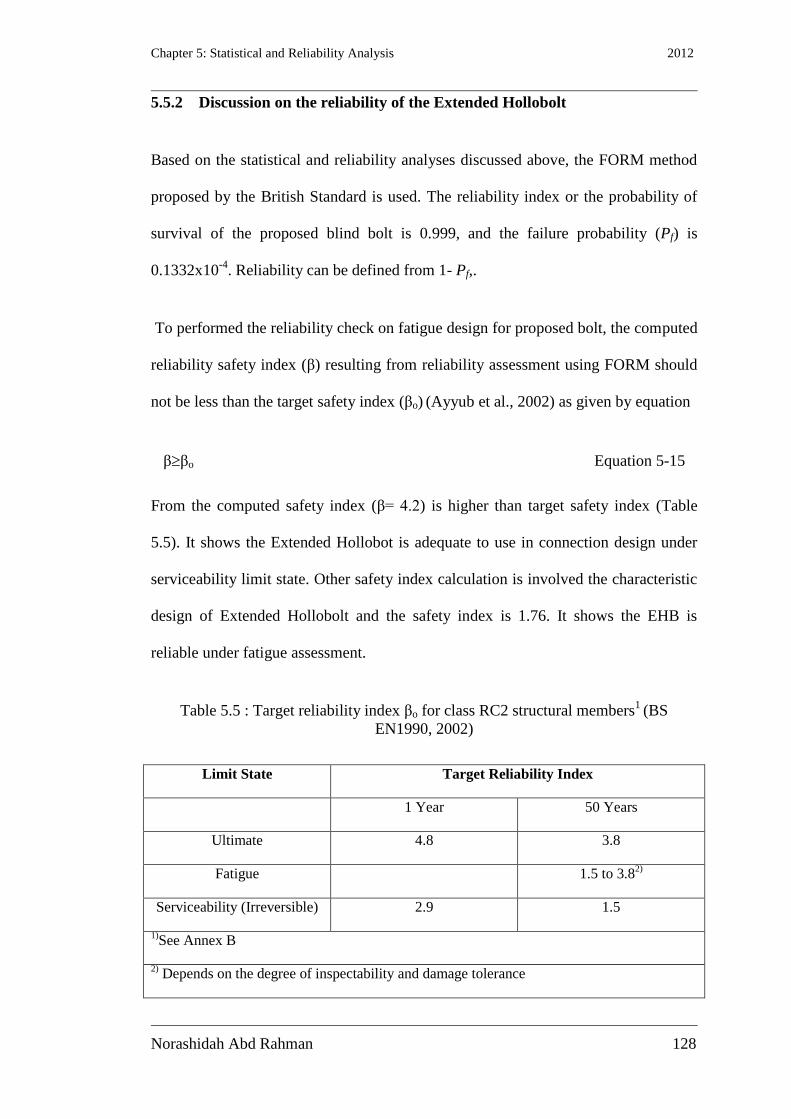
Chapter 5: Statistical and Reliability Analysis 2012
Norashidah Abd Rahman 128
128
5.5.2 Discussion on the reliability of the Extended Hollobolt
Based on the statistical and reliability analyses discussed above, the FORM method
proposed by the British Standard is used. The reliability index or the probability of
survival of the proposed blind bolt is 0.999, and the failure probability (Pf) is
0.1332x10⁻⁴
. Reliability can be defined from 1- Pf,.
To performed the reliability check on fatigue design for proposed bolt, the computed
reliability safety index (β) resulting from reliability assessment using FORM should
not be less than the target safety index (βo) (Ayyub et al., 2002) as given by equation
ββo Equation 5-15
From the computed safety index (β= 4.2) is higher than target safety index (Table
5.5). It shows the Extended Hollobot is adequate to use in connection design under
serviceability limit state. Other safety index calculation is involved the characteristic
design of Extended Hollobolt and the safety index is 1.76. It shows the EHB is
reliable under fatigue assessment.
Table 5.5 : Target reliability index βo for class RC2 structural members1
(BS
EN1990, 2002)
Limit State Target Reliability Index
1 Year 50 Years
Ultimate 4.8 3.8
Fatigue 1.5 to 3.82)
Serviceability (Irreversible) 2.9 1.5
1)See Annex B
2) Depends on the degree of inspectability and damage tolerance
Chapter 5: Statistical and Reliability Analysis 2012
Norashidah Abd Rahman 129
129
5.6 Chapter summary
Three probability distributions were investigated, namely, lognormal, normal, and
Weibull distributions. Lognormal and normal distributions have the best fit for the
probability function. These distributions are used for statistical and reliability
analyses to define such parameters as mean and standard deviation values.
Tolerance limits were defined to establish the S-N curve using BS ISO 12107(BS
ISO, 2003) as a guideline for establishing the S-N curve of the EHB. Fatigue life
prediction for the EHB was proposed with a 95% confidence interval. The equation
log N= 21.4863- 6.5747log∆σ was used to predict the fatigue life of the EHB.
Two methods are typically used to determine the reliability of a material, a
connection, and so on. These methods are the S-N Curve and the fracture mechanic
methods. The S-N curve method is adopted in this study because the samples were
tested using constant amplitude. Applying the so-called FORM method, the safety
index of the EHB was found to be 4.2, and probability of failure was 0.13x10⁻⁴
.
These results show that the reliability of EHB is 99.99, which indicates that the EHB
is reliable for connection design.

Chapter 6: Conclusions and Recommendations for Future Work 2012
Norashidah Abd Rahman 130
130
Chapter 6 : Conclusions and Recommendations
for Future Work
6.1 Introduction
This thesis has presented the results of an experimental program aimed at examining
the behaviour of an Extended Hollobolt under repeated load. A statistical analysis of
the experimental data has also been discussed. In this chapter, the research
conclusions are presented. Recommendations for future work aimed at defining the
fatigue behaviour of the investigated blind bolt connection are also proposed.
The results of previous studies have shown that the use of blind bolt fasteners to
connect to a concrete-filled tube provides stiffer behaviour compared with an unfilled
hollow section. An Extended Hollobolt is a type of blind bolt that is a modification
of the Standard Hollobolt with added anchorage. The Extended Hollobolt presents an
improvement in the behaviour of the connection because the load can be shared
between the tube wall and the anchorage.
One of the tests conducted by Elghazouli (2009) showed that fatigue behaviour
considered as low-cycle fatigue occurs during the cyclic test performed on the
Hollobolt. Therefore, a series of fatigue test was conducted to investigate the
behaviour of an Extended Hollobolt connected to a concrete-filled hollow section.
Chapter 6: Conclusions and Recommendations for Future Work 2012
Norashidah Abd Rahman 131
131
6.2 Conclusion
This work aimed to investigate the fatigue behaviour and reliability of the Extended
Hollobolt when connected to a concrete-filled hollow section. In this section, a
summary of the key findings and observations are listed as follows:
Frequencies less than 3 Hz, shows no difference in fatigue life because
the actual load during the test is equal to the applied load before the test
started. However at a frequency of 5 Hz, the actual load produced during
the test was higher than the applied load. Therefore, frequencies ranging
from 0.25 Hz to 3 Hz are more suitable for an Extended Hollobolt
connected to a concrete-filled hollow section.
The fatigue life and strength of an Extended Hollobolt were lower than
those of a Standard bolt but higher than those of a Standard Hollobolt.
This finding was proven by an S-N curve, where the fatigue strength at
two million cycles of the Extended Hollobolt was 253 N/mm2, M16 was
377 N/mm2, and Hollobolt was 103 N/mm
2.
The fatigue fracture of an Extended Hollobolt is located at the shank and
is near the head of the bolt. A close-up of the pattern of the fracture was
compared using photography. The comparison shows no obvious trend
in shape at the lower stress range but a different trend at the highest
stress range. The difference can be attributed to the increased plasticity
at the higher stress range, which is near the yield stress of the bolt in this
study.
Using different concrete strengths, the fatigue life of an Extended
Hollobolt was shown to increase using the concrete strength 60 N/mm2.

Chapter 6: Conclusions and Recommendations for Future Work 2012
Norashidah Abd Rahman 132
132
However, further studies should be conducted to obtain a more accurate
understanding of the fatigue characteristic effect of concrete strength.
A statistical analysis was conducted to analyze fatigue data, as well as
the performance of an Extended Hollobolt connected to a concrete-filled
hollow section using S-N curve characteristics. An equation of the
characteristic design with 95% confidence is proposed. This equation is
limited to an Extended Hollobolt grade of 8.8 with a concrete strength
35<fck,cube<42.
log5747.64863.21logN
The S-N curve method was used to determine the reliability of the
Extended Hollobolt connected to a concrete-filled hollow section. From
the reliability analysis using the First Order Reliability Method,
calculated safety index (β) is larger than target safety index (βo),
therefore the Extended Hollobolt was found to be adequate and reliable
for design of connection.
6.3 Recommendations for further study
The results of this study indicate that the Extended Hollobolt connected to a
concrete-filled hollow section is reliable for use. However, further studies under
fatigue load should be conducted to improve the behaviour and reliability of the
proposed bolt. Further studies will facilitate the establishment of a design procedure
for Extended Hollobolts in practical connections. The recommendations for further
study can be concluded as follows:
Chapter 6: Conclusions and Recommendations for Future Work 2012
Norashidah Abd Rahman 133
133
Further tests for grade 10.9 bolt connections should be conducted
following the same design parameters used for grade 8.8 to determine
the differences and the effects of fatigue using different bolt grades.
Bolts with different diameters and connected with different concrete
strengths should be tested to complete the assessment of Extended
Hollobolts connected to concrete-filled hollow section under fatigue
load.
The effects of axial loading resulting from torque on the fatigue life of
bolts should be tested to assess the fatigue life of actual bolts.
Variable amplitudes should be used in conducting the fatigue test to
determine the cumulative damage and fracture mechanics of the
Extended Hollobolt.
Tests on displacement control should also be conducted to study its
influence on the Extended Hollobolt.
Further investigations on reliability and probability using more
experimental data to compare with other types of bolt should also be
conducted.
Finite element modeling should be used to investigate the behaviour of
Extended Hollobolts under fatigue load for comparison with the
experimental results and for parametric studies.
References 2012
Norashidah Abd Rahman 134
134
References
1. AL-MUGHAIRI, A. S. (2009) The Behaviour of Moment Resisting
Connection to Concrete Filled Hollow Sections Using Extended Hollobolts
University of Nottingham.
2. ASTM (1991) Standard practice for statistical analysis of linear or linearized
stress-life and strain-life fatigue data. PA, ASTM.
3. ASTM, Committee E-9 on Fatigue American Society for Testing and
Materials: American Society For Testing And material. (1963) A Guide for
Fatigue testing and the statistical Analysis of Fatigue Data. American Society
For Testing And material.
4. AYYUB, B. M., ASSAKKAF, I. A., KIHL, D. P. & SIEV, M. W. (2002)
Reliability-Based Design Guidelines for Fatigue of Ship Structures. Naval
Engineers Journal, 114, 113-138.
5. AZIZINAMINI, A. & SCHNEIDER, P.S. (2004) Moment connection to
circular concrete filled steel tube columns. Journal of structural Engineering,
213-222.
6. BALLIO, G. & CASTIGLIONI, C. A. (1995) A Unified Approach for the
Design of Steel Structures under Low and/or High Cycle Fatigue. Journal
Construction Steel Research, 34, 75-101.
7. BARNETT, T., TIZANI, W. & NETHERCOT, D. A. (2000) Blind bolted
moment resisting connection to structural hollow section. Connections in
Steel Structures IV: Steel Connections in the New Millennium. Roanoke,
Virginia, USA.
8. BARNETT, T.C. (2001) The Behaviour of a Blind Bolt for Moment
Resisting Connections in Hollow Steel Section. PhD thesis. Department of
Civil engineering University of Nottingham.
9. BARNETT, T.C., TIZANI, W.& NETHERCOT, D.A. (2001) The Practice of
Blind Bolting Connection to Structural Hollow Sections: A Review. Steel and
Composite Structures, 1, 1-16.
10. BARSOM, J. M. & ROLFE, S. T. (1999) Fracture and Fatigue Control in
Structures - Applications of Fracture Mechanics: (MNL 41), ASTM
International.
11. BEER, F. P. & JOHNSTON, E.R. (1981) Mechanics of Materials McGraw
Hill.Inc.
References 2012
Norashidah Abd Rahman 135
135
12. BENJAMIN V. FELL & KANVINDE, A. M. (2009) Recent Fracture and
Fatigue Research in Steel Structures. STRUCTURE.
13. BERETTA, S., CLERICI, P.& MATTEAZZI, S. (1995) The effect of sample
size on the confidence of endurance fatigue tests. Fatigue Fracture
Engineering Material Structure, 18, 129-139.
14. BIRKEMOE, P. C. & SRINIVASAN, R. (1971) Fatigue of Bolted High
Strength Structural Steel. Journal of Structural Division Proceedings of the
American Society of Civil Engineering, 97, 935-950.
15. BIRKEMOE, P. C., MEINHEIT, D. F.& MUNSE, H.W. (1969) Fatigue of
A514 Steel In Bolted Connections. Journal of the Structural Division
Proceedings of the American Society of Civil Engineers, 95, 2011-2030.
16. BOUWMAN, I. L. P. (1979) Fatigue of bolted connections and bolts loaded
in tension. The Netherlands, Delft University of Technology.
17. BS EN, B. S. (2001) Metallic material-Tensile testing. Annex D. BSi British
Standard.
18. BS 2846, B. S. (2002) UK National Annex for Eurocode Basis of structural
design. BS 2846-1-2:2002. BSi British Standard.
19. BS EN1990, B. S. (2002) UK National Annex for Eurocode Basis of
structural design. BS EN 1990:2002, Annex C. BSi British Standard.
20. BS EN1993, B. S. (2005) Eurocode 3: Design of steel structures —Part 1-8:
Design of joints. BS EN 1993 - 1 - 8. BSi British Standard.
21. BS EN1993, B. S. (2006) Eurocode 3: Design of steel structures —Part 1-9:
Fatigue. BS EN 1993-1-9:2005. BSi British Standard.
22. BS EN ISO 898, B. S. (2009) Mechanical properties of fasteners made of
carbon steel and alloy steel : Part 1. BS EN ISO 898-1:2009. BSi British
Standard.
23. BS ISO 12107, B. S. (2003) Metallic materials- Fatigue testing-Statistical
planning and analysis data. BS ISO 12107:2003.BSi British standard.
24. CARPENTER, J. (2011) Reliability: the practical application of Eurocode.
The Stuctural engineer. London, United Kingdom, The Institute of Structural
Engineers.
25. CHANDRUPATLA, T. R. (2009) Quality and reliability in engineering, New
York, Cambridge University press.
References 2012
Norashidah Abd Rahman 136
136
26. COLLATE, M. (2005) Strength and Reliability of Aluminium Stiffened
Panels. School of Marine Science Technology. Newcatle upon Tyne,
University of Newcastle.
27. COUNTS, W. A. & JOHNSON, W. S. (2002) Bolt bearing fatigue of
polymer matrix composites at elevated temperature. International Journal of
fatigue, 24, 197-204.
28. ECCS (1985) Recommendation for the Fatigue Design of Steel Structure.
Brussels, European Convention for Constructional Steelwork.
29. ECCS (1986) Recommended testing procedure for assessing behaviour of
structural steel elements under cyclic loads. Belgium, European Convention
for Constructional Steelwork.
30. ELGHAZOULI, A.Y., MALAGA-CHUQUITAYPE, C., CASTRO, J.M. &
ORTON, A.H. (2009) Experimental Monotonic and Cyclic Behaviour of
Blind -Bolted Angle Connections Engineering Structures.
31. ESDEP (2011) ESDEP Course
http://www.fgg.uni-lj.si/kmk/esdep/master/wg12/l0600.htm#SEC_2_1. Last
acessed on June 2011
32. FLOWDRILL (2012). http://www.flowdrill.com/flowdrillprocess. Last
accessed on october 2012.
33. FRANCE, J. E. (1997) Bolted connection between open section beams and
box columns. PhD Thesis. Department of civil Engineering. England,
University of Shefield.
34. FRANCE, J. E., DAVISION, J. B. & KIRBY, P. A. (1999) Moment-capacity
and rotational stiffness of endplate connections to concrete filled tubular
columns with flowdrilled connectors. Journal of Construction Steel Research,
50, 35-48.
35. FRANCE, J. E., DAVISON, J. B. & KIRBY, P. A. (1998) Strength and
rotational stiffness of simple connections to tubular columns using flowdrill
connectors. Journal of Contruction Steel Research, 50, 15-34.
36. GHAZALI, T.H.& DIN, K. (2004) Fatigue Life of Bolt Subjected to Fatigue
Loading Condition. International Journal of Engineering and Technology, 1,
20-27.
37. GURNEY T R & MADDOX S J (1973) A re-analysis of fatigue data for
welded joints in steel. Welding Research International, 3.
38. GURNEY, T.R. (1979) Fatigue of welded structures, Cambridge, Cambridge
University Press.

References 2012
Norashidah Abd Rahman 137
137
39. HASOFER, A. M. & LIND, N. C. (1974) An Exact and Invariant First Order
Reliability Format. Journal of the Engineering Mechanics Division, ASCE,
100, 111-121.
40. HERBET J. SUTHERLAND & VEERS, P. S. (2000) The development of
confidence limits for fatigue strength data. 2000 ASME Wind Energy
Symposium. AIAA/ASME.
41. HESS, P. E., BRUCHMAN, D., ASSAKKAF, I. A. & AYYUB, B. M.
(2002) Uncertainties in Material and Geometric Strength and Load Variables.
Naval Engineers Journal, 114, 139-166.
42. HOBBS, J. W., BURGUETE, R. L., HEYES, P. F. & PATTERSON, E. A.
(2000) The effect of eccentric loading on the fatigue performance of high-
tensile bolts. International Journal of Fatigue, 22, 531-538.
43. HSU, H. L. & LIN, H. W. (2003) Performance of concrete filled tube base
under repeated load. International workshop on steel and composite
construction,NCREE.
44. HUCK INTERNATIONAL LTD. (2012)
http://www.alcoa.com/fastening_systems/commercial/en/product.asp?cat_id=
557&prod_id=884. Last accessed on October 2012.
45. HUGHES, O. F. (1998) Ship Structural design , A rationally based,
Computer-Added Optimization Approach, Jersey City, New York, The
Society of Naval Architects and Marines Engineers.
46. IOANNIS VAYAS, SOPHOCLEOUS, A. & DINU, F. (2003) Fatigue
Analysis of Moment Resisting Steel Frames. Journal of Earthquake
Engineering, 7, 635-654.
47. ISSC COMMITEE III.2 (2009) Fatigue and Fracture. 17th International Ship
and Offshore Structure Congress Seoul. Korea.
48. JIANI, H. (2012) An Investigation into the fatigue behaviour of the Extended
Hollobolt connected to the concrete filled hollow section. Master
Dissertations. Department of Civil engineering. University of Nottingham.
49. JOHNSON & G, L. (1951) The Median Ranks of Sample Values in their
Population With an Application to Certain Fatigue Studies. Industrial
Mathematics, 2.
50. JOHNSON, L. G. (1951) The Median Ranks of Sample Values in their
Population With an Application to Certain Fatigue Studies. Industrial
Mathematics, 2.

References 2012
Norashidah Abd Rahman 138
138
51. KORIN, I. & PEREZ IPIÑA, J. (2010) Experimental evaluation of fatigue
life and fatigue crack growth in a tension bolt-nut threaded connection.
International Journal of Fatigue, 33, 166-175.
52. KOROL, R. M., GHOBARAH, A. & MOURAD., S. (1993) Blind bolting W-
shape beams to HSS columns. Journal of Structural Engineering, 119, 3463-
3481.
53. LINDAPTER (2012) Lindapter Hollo-Bolt. .
http://www.lindapter.com/products/Cavity_Fixings/2/Type_HB_Hollo-Bolt.
Last accessed on october 2012.
54. LITTLE, R. E. (1981) Review of Statistical Analyses of Fatigue Life Data
Using One-Sided Lower Statistical Tolerence Limits, American Society for
Testing and Materials.
55. MARINEDIESELS.CO.UK.
http://www.marinediesels.info/2_stroke_engine_parts/Other_info/fatigue.htm
. Last accessed on 16 April 2011
56. MELCHERS, R. E. (2001) Structural Reliability analysis and prediction,
England, John wiley &Sons Ltd.
57. NORWEGIAN PUBLIC COMMISSION (1981) The Alexander L.kielland
accident, Report of Norwegian public commission appointed by Royal
Decree of March 28,1980, presented to the Ministry of Justice and Police.
ISBN B0000ED27N.
58. O’BRIEN, M. & METCALFE, R. (2009) High Strength Engineering
Fasteners: Design for Fatigue Resistance. Journal of Failure Analysis and
Prevention, 9, 171-181.
59. PARK, T.-G., CHOI, C.-H., WON, J.-H. & CHOI, J.-H. (2010) An efficient
method for fatigue reliability analysis accounting for scatter of fatigue test
data. International Journal of Precision Engineering and Manufacturing, 11,
429-437.
60. PLUMIER, A., AGANTINO, M.R., CASTELLANI, A., CASTIGLIONI
C.A. & CHESI, C. (1998) Resistance of steel connections to low cycle
fatigue. 11th European on Earthquake Engineering Balkema,Rotterdam.
61. RACKWITZ, R. (2000) Reliability Analysis-Past, Present and Future. 8th
ASCE Speciality Conference on Probabilistic Mechanics and Strucural
Reliaility. University of Notre Dome, Indiana.
62. R-FUJCZAK, R. (1994) The effects of fatigue loading frequency on fatigue
life of high strength pressure vesel steels. Watervliet, N.Y, US Army
armament research, development and engineering center.

References 2012
Norashidah Abd Rahman 139
139
63. SCHAUMANN, P. P. & MARTEN, D.-I. F. (2009) Fatigue resistance of high
strength bolts with large diameters. Proceeding of the International
Sysmposium for Steel Structures ISSS 2009. South Korea.
64. SCHNEIDER, C. R. A. & MADDOX, S. J. (2003) Best Practice Guide on
Statistical Anlaysis of Fatigue Data. Granta Park, Great Abington,
Cambridge, UK, International Institute Welding, United Kingdom delegation
65. SCI (1997) Joints in steel Construction: Moment connection, The Steel
Construction Institute, London.
66. SEAN ELLISON & TIZANI, W. (2004) Behaviour of blind bolted
connetions to concrete filled hollow sections. The structural Engineer.
London, United Kingdom, The Institution of Strcutural Engineers
67. SHOSUKE MORINO & TSUDA, K. (2002) Design and construction of
concrete-filled steel tube column system in Japan. Earthquake Engineering
and Engineering Seismology, 4.
68. SOBCZYK, K. & B.F. SPENCER, J. (1992) Random fatigue: From data to
theory, San Diego, CA 92101, Academic Press, INC.
69. SWANSON, J. A. & LEO, R. T. (2000) Bolted steel connection: test on T-
stub components. Journal of structural Engineering, ASCE, 126.
70. TABSH, S. W.& MOURAD, S. (1997) Resistance factors for blind bolts in
direct tension. Engineering Structures, 19, 995-1000.
71. TABSH, S. W., MOURAD, S. & KOROL, R. M. (1997) Structural safety of
ultra-twist blind fasteners in tension. Canadian Journal of Civil Engineering,
24, 211-217.
72. TAMBOLI, A. R. (1999) Hanbook of Structural Steel Connection Design and
Details, New York, McGraw Hill.
73. TAN, K., M.NICHOLAS, J. & PU, X. (2003) Mecahnical properties of high
strength concrete filled steel tubular column : Part 1-concentrically load. ACI
Journal, 1-26.
74. TANAKA, T.& TABUCHI, M. (2003) Flexural behaviour of H section beam
webs connection with hollow section columns. IN M.A.ALONSO, A.CHICA
& J.A.EDS (Eds.) 10th International sysposium on tubular structure: Tubular
structures X. Madrid, Spain, Rotterdan:A.A.Balkema.
References 2012
Norashidah Abd Rahman 140
140
75. TIZANI, W. & RIDLEY-ELLIS, D. J. (2003) The performance of a new
blind bolt for moment resisting connections. IN: JAURRIETA, M. A. A., A.
CHICA, J. A. EDS. (Ed.) Proceeding of the 10th
International Symposium on
Tubular Structures: Tubular Structures X. Madrid, Spain. , Rotterdan: A.A.
Balkema.
76. TRAHAIR, N.S., BRADFORD, M. A., NETHERCOT, D. A. & GARDNER,
L. (2008) The behaviour and design of steel structures to EC3, Oxon OX14
4RN, Taylor & Francis.
77. WALPOLE, E. R., MYERS, R. H. & MYERS, L.S. (1998) Probability and
Statistic for Engineers and Scientist, New Jersy, Prentice Hall.
78. WANG, J. F., HAN, L. H. & UY, B. (2009) Hysteretic behaviour of flush end
plate joints to concrete filled steel tubular columns. Journal Construction
Steel Research.
79. WANG, J.-F., HAN, L.-H. & UY, B. (2009) Behaviour of flush end plate
joints to concrete-filled steel tubular columns. Journal of Constructional Steel
Research, 65, 925-939.
80. WEIBULL, W. (1961) Fatigue testing and analysis result, Pergamon Press.
81. WIRSCHING, P. H. (1983) Statistical summaries of Fatigue Data for Design
Purpose. NASA contractor report 3697. Arizona, National Aronautics and
space administration (NASA).
82. WIRSCHING, P. H. (1998) Fatigue reliability. Structural Engineering and
Material, 1, 200-206.
83. WOHLER A (1871) Test To Determine TEhe Forces Acting on Railway
carriage Axles and The Capacity of Resistance of The Axles. Engineering,
11.
84. XU, J. & WANG, C. (2011) Reliability Design of Bolt Fatigue Strength of
Hollow Axle in Cylinder of Ball Grinder. International Conference on
Information Science and Technology. Nanjing, Jiangsu, China.
85. YAO, H., GOLDSWORTHY, H. & GAD, E. (2008) Experimental and
Numerical Investigation of the Tensile Behaviour of Blind-Bolted T-Stub
Connections to Concrete-Filled Circular Columns. Journal of Structural
Engineering, 134, 198-208.
86. YOUNG, L. & EKVALL, J. C. (1981) Reliability of fatigue testing. IN
LITTLE, R.E. & EKVALL, J. C. (Eds.) Statistical analysis of fatigue data.
American Society for Testing Material.

References 2012
Norashidah Abd Rahman 141
141
87. YOUNGWOO CHOI, BOKKYU LIM & BAE, S. (2007) Fatigue Life
Prediction of High-Strength Bolt Subjecting to Torque. Engineering
Materials, 345-346, 299-302.
88. YU, Z.-W., DING, F. X. & C.S.CAI (2006) Experimental behaviour of
circular concrete filled ateel tube stub columns. Journal Construction Steel
Research, 165-174.
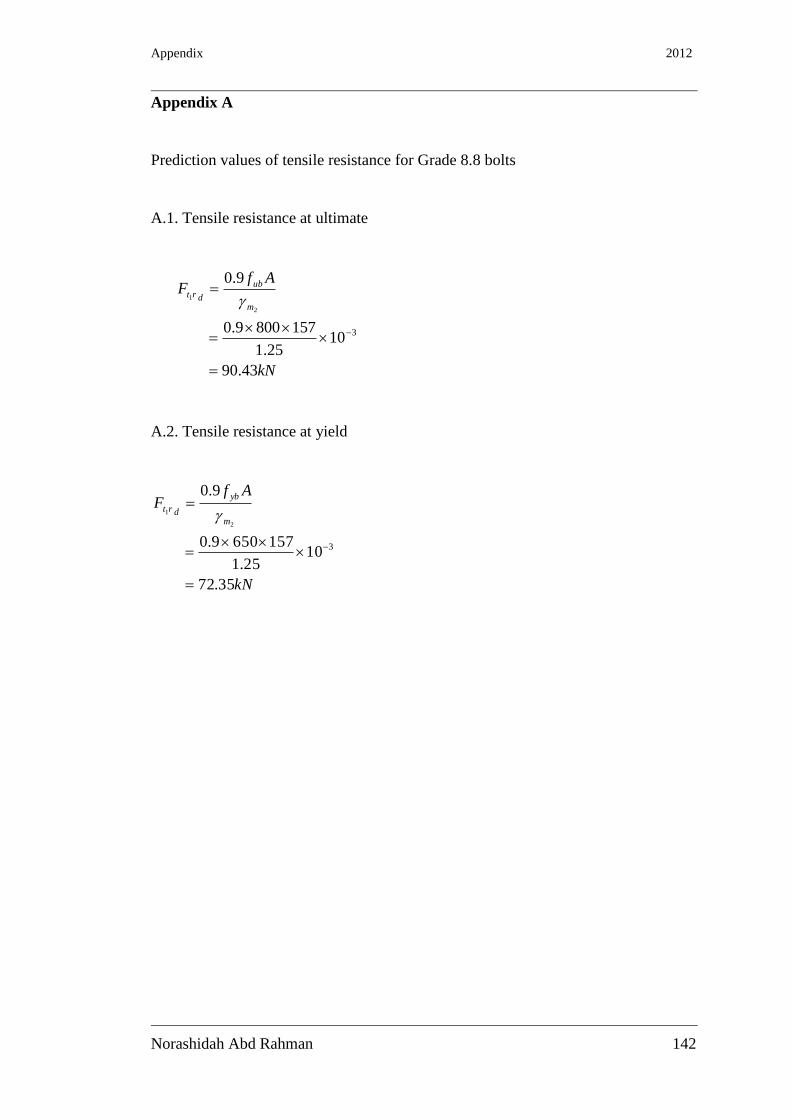
Appendix 2012
Norashidah Abd Rahman 142
142
Appendix A
Prediction values of tensile resistance for Grade 8.8 bolts
A.1. Tensile resistance at ultimate
kN
AfF
m
ub
drt
43.90
1025.1
1578009.0
9.0
3
2
1
A.2. Tensile resistance at yield
kN
AfF
m
yb
drt
35.72
1025.1
1576509.0
9.0
3
2
1

Appendix 2012
Norashidah Abd Rahman 143
143
Appendix B
Lognormal distribution fatigue test data
Rank
Sample
Number
Number of
cycles
(N) ln(N)
MR/Pi =
(j-0.3)/(n+0.4)
Standard z
value
1 S1 8025 8.99032 0.02303 -1.99491
2 S4 9314 9.13927 0.05592 -1.58997
3 S23 10489 9.25808 0.08882 -1.34808
4 S24 12063 9.39790 0.12171 -1.16648
5 S2 20608 9.93343 0.15461 -1.01688
6 S9 20649 9.93542 0.18750 -0.88715
7 S10 21441 9.97306 0.22039 -0.77086
8 S11 28331 10.25171 0.25329 -0.66417
9 S12 28632 10.26228 0.28618 -0.56457
10 S14 40297 10.60403 0.31908 -0.47028
11 S8 45631 10.72834 0.35197 -0.38000
12 S5 55822 10.92992 0.38487 -0.29272
13 S25 58142 10.97064 0.41776 -0.20762
14 S27 63314 11.05586 0.45066 -0.12400
15 S17 78803 11.27471 0.48355 -0.04124
16 S15 89300 11.39976 0.51645 0.04124
17 S16 91878 11.42822 0.54934 0.12400
18 S21 107526 11.58549 0.58224 0.20762
19 S19 126731 11.74982 0.61513 0.29272
20 S18 191710 12.16374 0.64803 0.38000
21 S20 202742 12.21969 0.68092 0.47028
22 S6 264135 12.48422 0.71382 0.56457
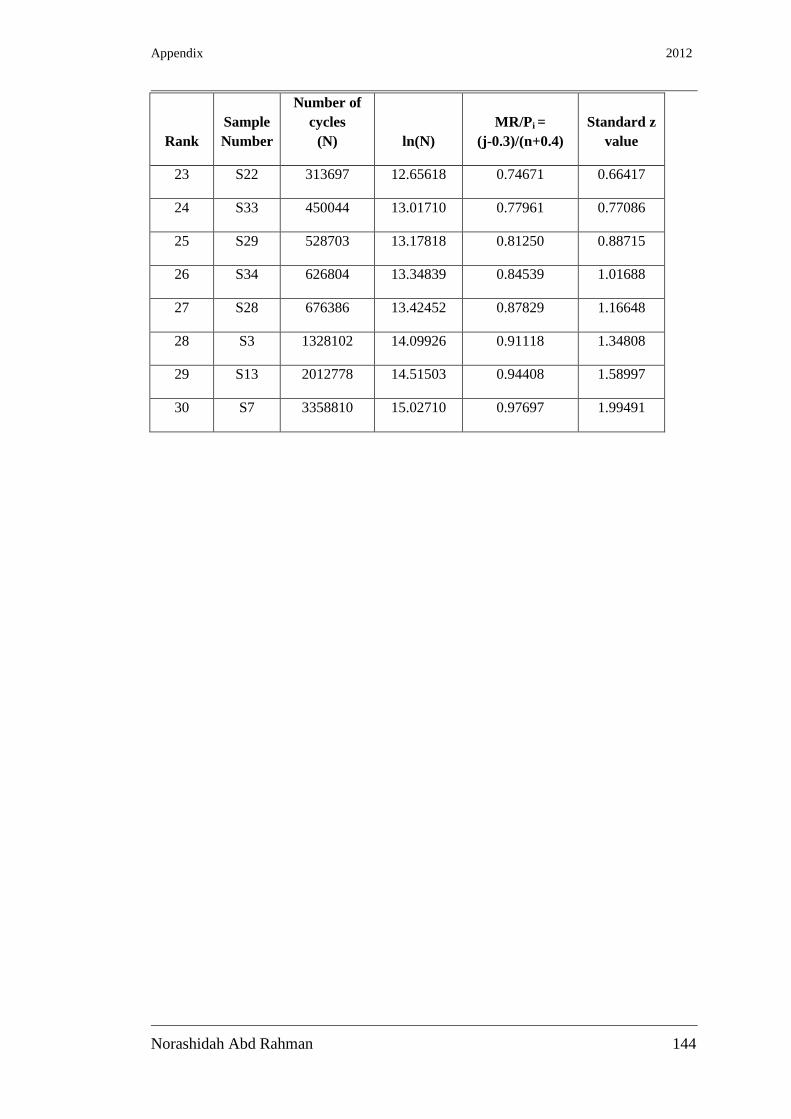
Appendix 2012
Norashidah Abd Rahman 144
144
Rank
Sample
Number
Number of
cycles
(N) ln(N)
MR/Pi =
(j-0.3)/(n+0.4)
Standard z
value
23 S22 313697 12.65618 0.74671 0.66417
24 S33 450044 13.01710 0.77961 0.77086
25 S29 528703 13.17818 0.81250 0.88715
26 S34 626804 13.34839 0.84539 1.01688
27 S28 676386 13.42452 0.87829 1.16648
28 S3 1328102 14.09926 0.91118 1.34808
29 S13 2012778 14.51503 0.94408 1.58997
30 S7 3358810 15.02710 0.97697 1.99491
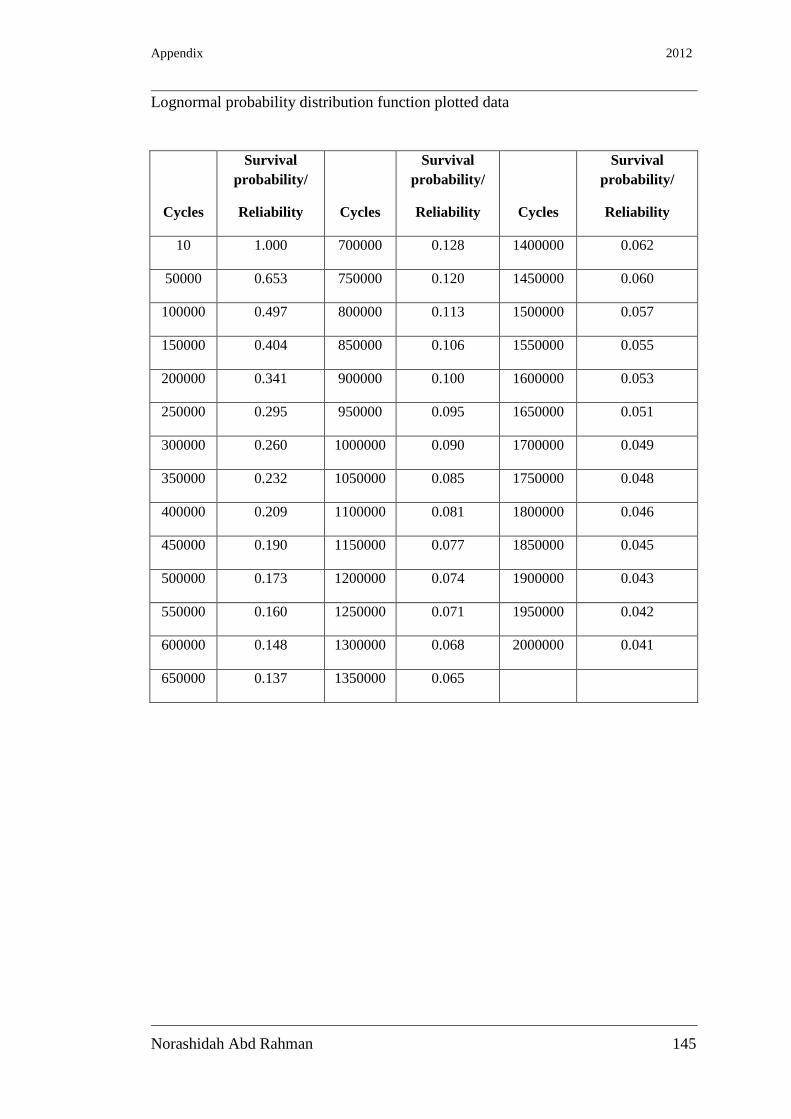
Appendix 2012
Norashidah Abd Rahman 145
145
Lognormal probability distribution function plotted data
Cycles
Survival
probability/
Reliability Cycles
Survival
probability/
Reliability Cycles
Survival
probability/
Reliability
10 1.000 700000 0.128 1400000 0.062
50000 0.653 750000 0.120 1450000 0.060
100000 0.497 800000 0.113 1500000 0.057
150000 0.404 850000 0.106 1550000 0.055
200000 0.341 900000 0.100 1600000 0.053
250000 0.295 950000 0.095 1650000 0.051
300000 0.260 1000000 0.090 1700000 0.049
350000 0.232 1050000 0.085 1750000 0.048
400000 0.209 1100000 0.081 1800000 0.046
450000 0.190 1150000 0.077 1850000 0.045
500000 0.173 1200000 0.074 1900000 0.043
550000 0.160 1250000 0.071 1950000 0.042
600000 0.148 1300000 0.068 2000000 0.041
650000 0.137 1350000 0.065

Appendix 2012
Norashidah Abd Rahman 146
146
Weibull distribution data
Rank
Sample
Number
Number
of cycles
(N) ln(N)
MR =
(j-0.3)/(n+0.4) 1-MR
ln(-ln(1-
MR)
1 S1 8025 8.9903 0.0230 0.9770 -3.7595
2 S4 9314 9.1393 0.0559 0.9441 -2.8552
3 S23 10489 9.2581 0.0888 0.9112 -2.3750
4 S24 12063 9.3979 0.1217 0.8783 -2.0419
5 S2 20608 9.9334 0.1546 0.8454 -1.7841
6 S9 20649 9.9354 0.1875 0.8125 -1.5720
7 S10 21441 9.9731 0.2204 0.7796 -1.3904
8 S11 28331 10.2517 0.2533 0.7467 -1.2307
9 S12 28632 10.2623 0.2862 0.7138 -1.0873
10 S14 40297 10.6040 0.3191 0.6809 -0.9563
11 S8 45631 10.7283 0.3520 0.6480 -0.8351
12 S5 55822 10.9299 0.3849 0.6151 -0.7217
13 S25 58142 10.9706 0.4178 0.5822 -0.6146
14 S27 63314 11.0559 0.4507 0.5493 -0.5124
15 S17 78803 11.2747 0.4836 0.5164 -0.4143
16 S15 89300 11.3998 0.5164 0.4836 -0.3194
17 S16 91878 11.4282 0.5493 0.4507 -0.2268
18 S21 107526 11.5855 0.5822 0.4178 -0.1360
19 S19 126731 11.7498 0.6151 0.3849 -0.0462
20 S18 191710 12.1637 0.6480 0.3520 0.0432
21 S20 202742 12.2197 0.6809 0.3191 0.1331
22 S6 264135 12.4842 0.7138 0.2862 0.2240
23 S22 313697 12.6562 0.7467 0.2533 0.3172

Appendix 2012
Norashidah Abd Rahman 147
147
Rank
Sample
Number
Number
of cycles
(N) ln(N)
MR =
(j-0.3)/(n+0.4) 1-MR
ln(-ln(1-
MR)
24 S33 450044 13.0171 0.7796 0.2204 0.4137
25 S29 528703 13.1782 0.8125 0.1875 0.5152
26 S34 626804 13.3484 0.8454 0.1546 0.6243
27 S28 676386 13.4245 0.8783 0.1217 0.7448
28 S3 1328102 14.0993 0.9112 0.0888 0.8843
29 S13 2012778 14.5150 0.9441 0.0559 1.0591
30 S7 3358810 15.0271 0.9770 0.0230 1.3274

Appendix 2012
Norashidah Abd Rahman 148
148
Normal distribution data
Rank
Sample
Number
Number of cycles
(N) ln(N) Pi=j-0.5/n
Standard z
value
1 S1 8025 8.9903 0.0167 -2.1280
2 S4 9314 9.1393 0.0500 -1.6449
3 S23 10489 9.2581 0.0833 -1.3830
4 S24 12063 9.3979 0.1167 -1.1918
5 S2 20608 9.9334 0.1500 -1.0364
6 S9 20649 9.9354 0.1833 -0.9027
7 S10 21441 9.9731 0.2167 -0.7835
8 S11 28331 10.2517 0.2500 -0.6745
9 S12 28632 10.2623 0.2833 -0.5730
10 S14 40297 10.6040 0.3167 -0.4770
11 S8 45631 10.7283 0.3500 -0.3853
12 S5 55822 10.9299 0.3833 -0.2967
13 S25 58142 10.9706 0.4167 -0.2104
14 S27 63314 11.0559 0.4500 -0.1257
15 S17 78803 11.2747 0.4833 -0.0418
16 S15 89300 11.3998 0.5167 0.0418
17 S16 91878 11.4282 0.5500 0.1257
18 S21 107526 11.5855 0.5833 0.2104
19 S19 126731 11.7498 0.6167 0.2967
20 S18 191710 12.1637 0.6500 0.3853
21 S20 202742 12.2197 0.6833 0.4770
22 S6 264135 12.4842 0.7167 0.5730
23 S22 313697 12.6562 0.7500 0.6745
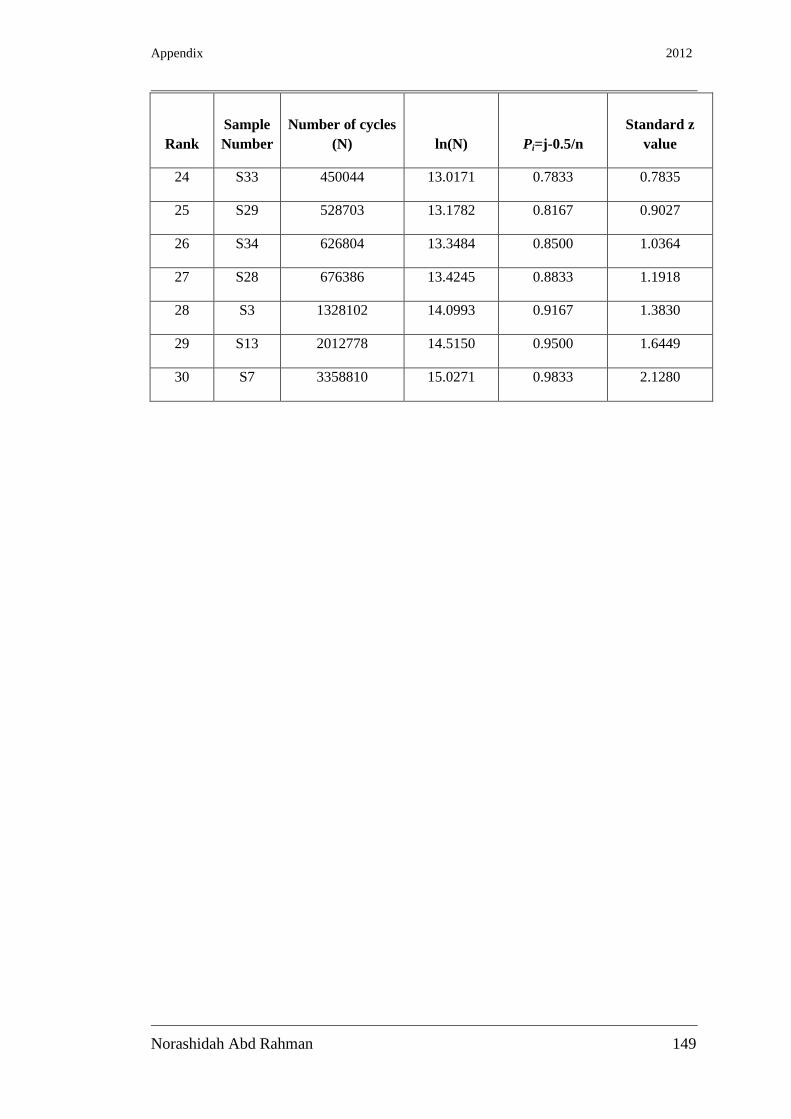
Appendix 2012
Norashidah Abd Rahman 149
149
Rank
Sample
Number
Number of cycles
(N) ln(N) Pi=j-0.5/n
Standard z
value
24 S33 450044 13.0171 0.7833 0.7835
25 S29 528703 13.1782 0.8167 0.9027
26 S34 626804 13.3484 0.8500 1.0364
27 S28 676386 13.4245 0.8833 1.1918
28 S3 1328102 14.0993 0.9167 1.3830
29 S13 2012778 14.5150 0.9500 1.6449
30 S7 3358810 15.0271 0.9833 2.1280

Appendix 2012
Norashidah Abd Rahman 150
150
Appendix C
Student’s t distribution ((E.Walpole et al., 1998)

Appendix 2012
Norashidah Abd Rahman 151
151

Appendix 2012
Norashidah Abd Rahman 152
152
Appendix D
Experimental data (R )
n = 30
xm (log∆σR) = 2.5994 Mean value of stress
ym (logNR) = 4.9944 Mean value of fatigue life
â = 22.2783
b = 6.6490
sy = 0.3301 Standard deviation of fatigue life
sx = 0.0496 Standard deviation of fatigue strength
log∆σ (2x10⁶) = 2.4029 Stress at 2 million cycles
∆σ (2x10⁶) = 253N/mm
2
Equation = log N = 22.2783-6.6490log∆σ
Design requirement EC3 (S)
category
n = 5
xm (log∆σS) = 2.5984 Mean value of stress
ym (logNS) = 3.6027 Mean value of fatigue life
â = 11.3979
b = 3
sy = 0 Standard deviation of fatigue life
sx = 0 Standard deviation of fatigue strength
log∆σ (2x10⁶) = 1.7 Stress at 2 million cycles
∆σ (2x10⁶) = 50N/mm
2
Equation = log N = 11.3979-3log∆σ

Appendix 2012
Norashidah Abd Rahman 153
153
Characteristic design (S)
category
n = 5
xm (log∆σ) = 2.5968 Mean value of stress
ym (logN) = 4.4132 Mean value of fatigue life
â = 21.4863
b = 6.5747
sy = 0 Standard deviation of Fatigue life
sx = 0 Standard deviation of Fatigue strength
log∆σ (2x10⁶) = 2.3 Stress at 2 million cycles
∆σ (2x10⁶) = 204N/mm
2
Equation = log N = 21.6181-6.6907log∆σ
Safety index calculations ( EC3 Design requirement)
probability of failure P = Ф(-)β
Safety index (β)
β =
= 4.22
From Standard Normal Table D.1 (Appendix E) (Melchers, 2001)
β = 4.22, Therefore Ф(-β) = 0.1332x10⁻⁴
Probability of failure P = 0.1332 x 10⁻⁴
Reliability = 1-P
= 0.999
sR NN
sR
SS
NogNl
log2
log2
}log{

Appendix 2012
Norashidah Abd Rahman 154
154
Safety index calculations( Characteristic design)
probability of failure P = Ф(-)β
safety index β =
= 1.76
From Table standard Normal Table
therefore Ф(-β) = 3.92x 10-02
β = 1.76
Probability of failure P = 0.03921
Reliability = 1-P
= 0.96079
sR NN
sR
SS
NogNl
log2
log2
}log{

Appendix 2012
Norashidah Abd Rahman 155
155
Appendix E
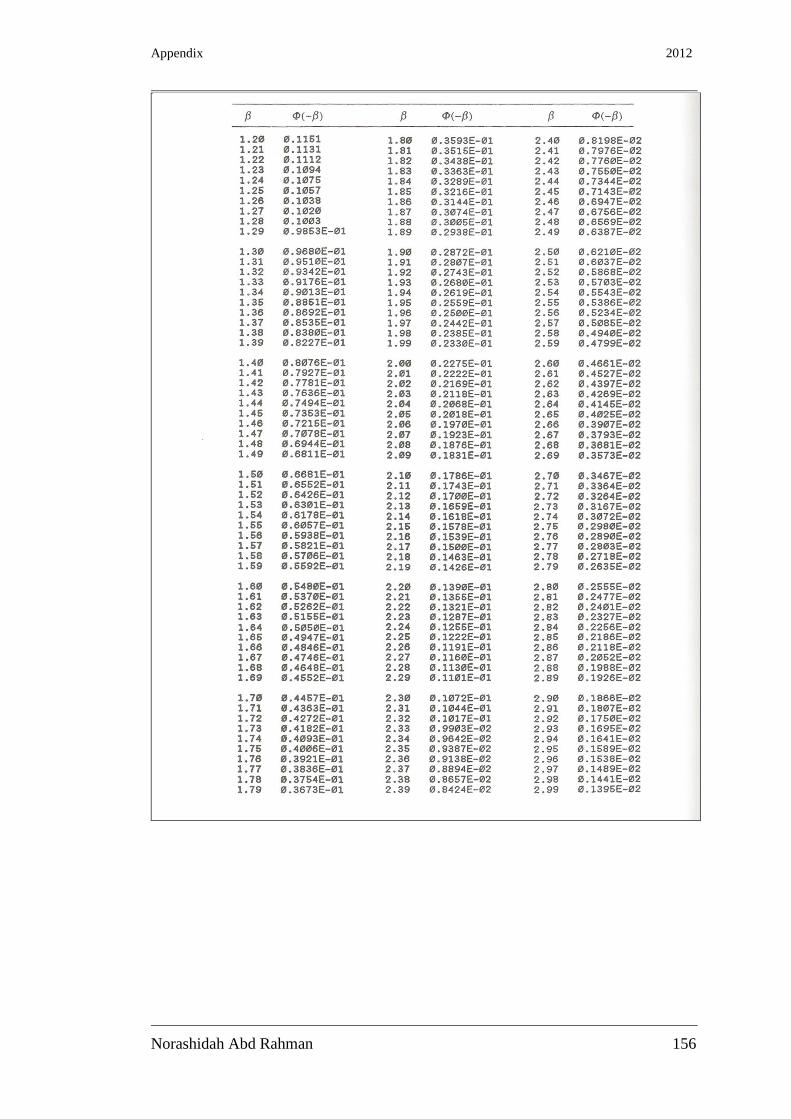
Appendix 2012
Norashidah Abd Rahman 156
156

Appendix 2012
Norashidah Abd Rahman 157
157

Appendix 2012
Norashidah Abd Rahman 158
158

Appendix 2012
Norashidah Abd Rahman 159
159