ABC of clinical ECG - Masaryk University
59
ABC of clinical ECG Magnus Lauritzen
Transcript of ABC of clinical ECG - Masaryk University

ABC of clinical ECG
Magnus Lauritzen

Goal with this seminar
• Learn a systematic approach for analysing
ECGs:” 5+1”
• Recognize and understand normal ECGs
• Interpret abnormalitets in ryhtm,
conduction or morphology
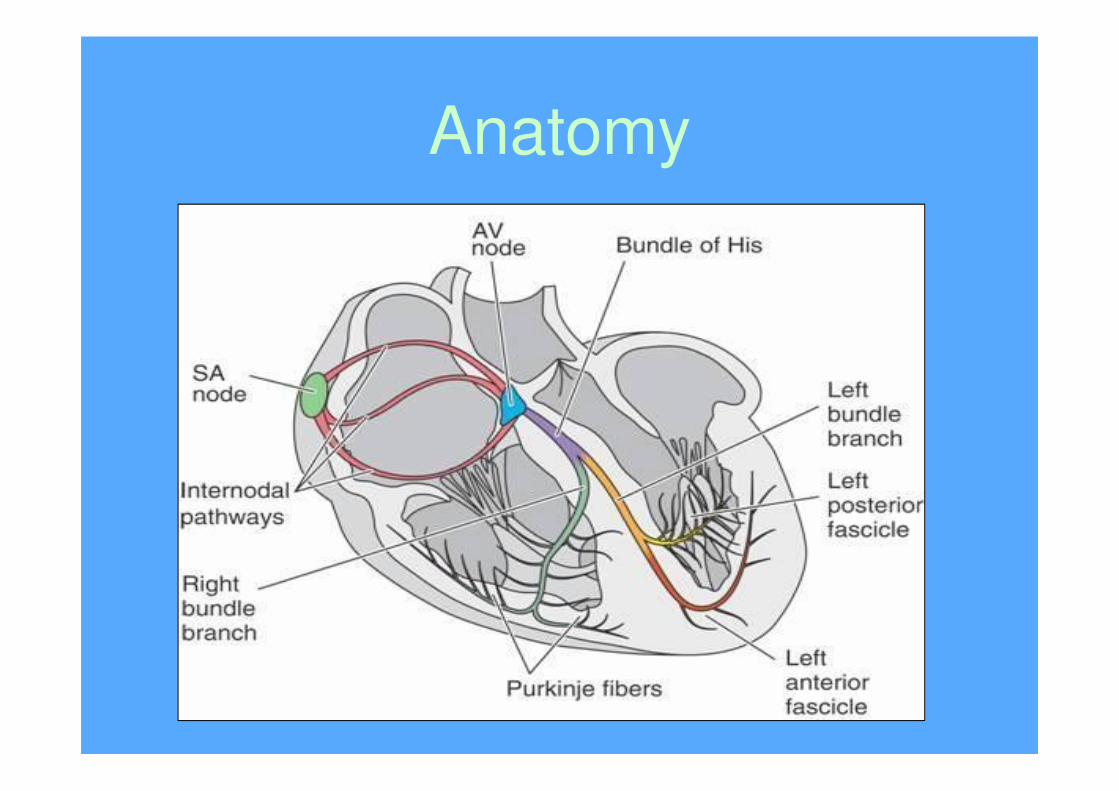
Anatomy

Physiology
• The sinoatrial node (SA node)
contains the fastest
physiological pacemaker cells of
the heart; therefore, they
determine the heart ratedetermine the heart rate
• SA-node initiates depolarization,
first atria, than ventricles by help
of specialized conduction
system
• Repolarization follows
depolarization
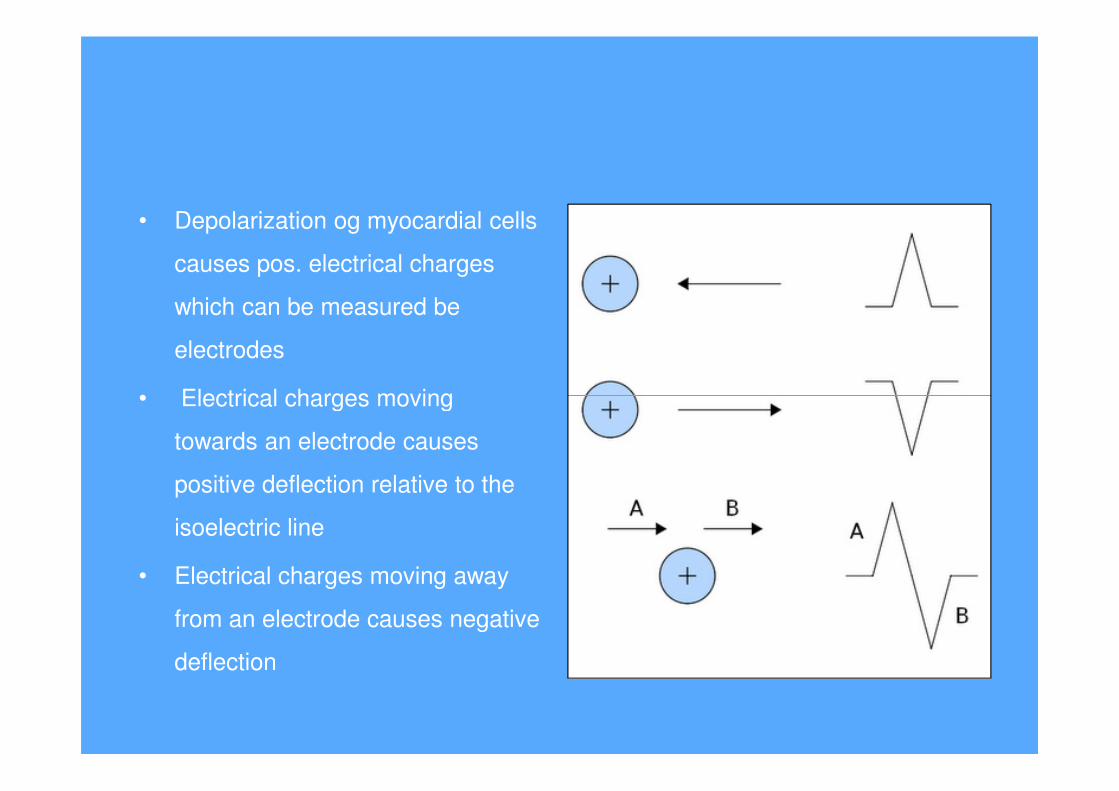
• Depolarization og myocardial cells
causes pos. electrical charges
which can be measured be
electrodes
• Electrical charges moving • Electrical charges moving
towards an electrode causes
positive deflection relative to the
isoelectric line
• Electrical charges moving away
from an electrode causes negative
deflection
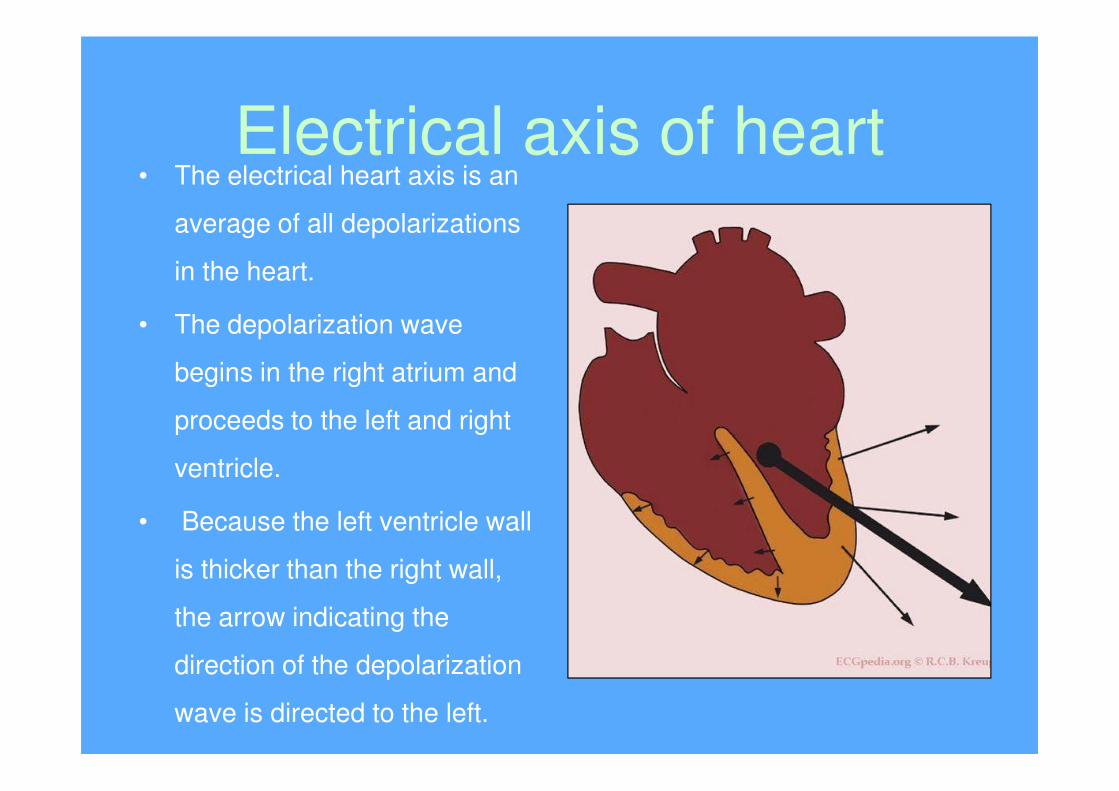
Electrical axis of heart• The electrical heart axis is an
average of all depolarizations
in the heart.
• The depolarization wave
begins in the right atrium and
proceeds to the left and right
ventricle.
• Because the left ventricle wall
is thicker than the right wall,
the arrow indicating the
direction of the depolarization
wave is directed to the left.

Placements of electrodes
(leads)

Limb leads (Vertical plane)• Info from limb electrodes
are combined to produce
six limb leads
• Try to look at the leads as
eyes ”looking” at the
heart from different
angles
• Group the leads together
into right, left and inferior-
posterior

Chest leads (horizontal
plane)

Normal ECG intervalls• The PQ interval starts at the beginning
of the atrial contraction and ends at the
beginning of the ventricular contraction
(0,12 – 0,20 seconds)
• The QRS duration indicates how fast
the ventricles depolarize (normal < 0,10
seconds)seconds)
• The normal QTc (corrected) interval
indicates how fast the ventricles are
repolarized, becoming ready for a new
cycle. (below 0.45 seconds in men and
below 0,46 in women)

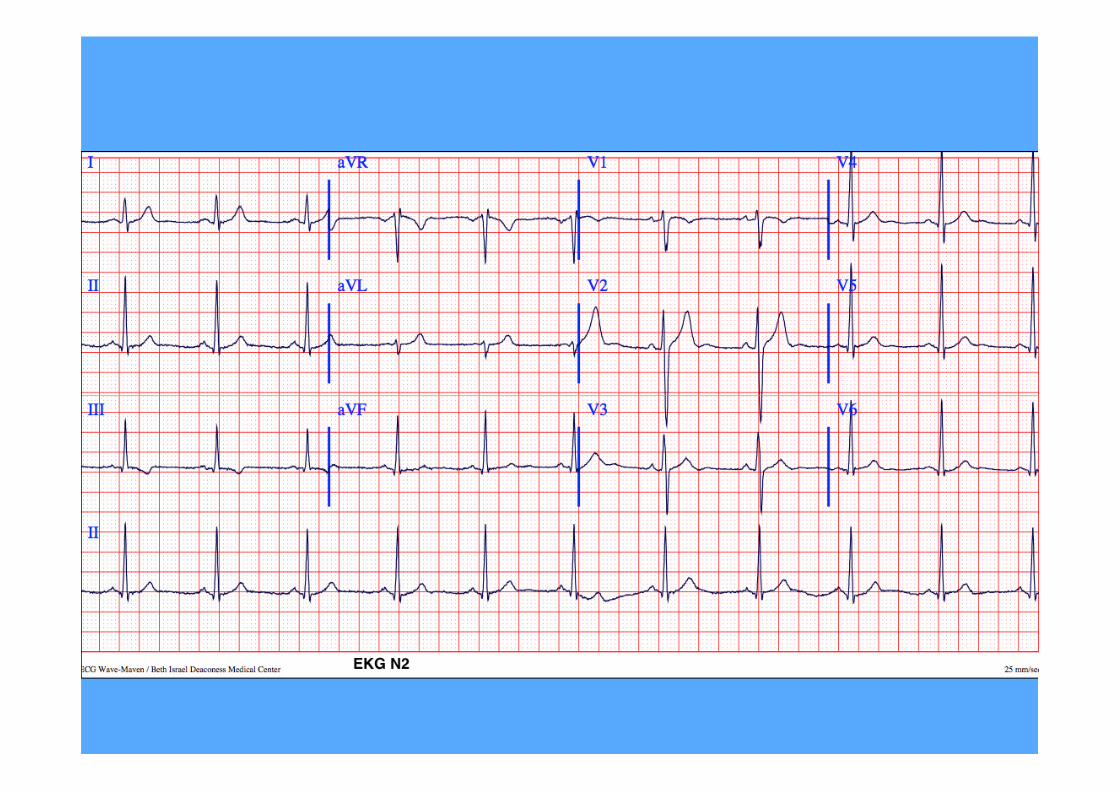
Normal ECG – ”Sinus
ryhtm”
• A P-wave (atrial contraction) precedes every QRS
complex
• The rhythm is regular, but varies slightly during
respirations
• The rate ranges between 60 and 100 beats per • The rate ranges between 60 and 100 beats per
minute
• The P waves maximum height at 2.5 mm in II
and/or III
• The P wave is positive in I and II, and biphasic in
V1

Normal ECG

ArrhytmiasClassifications based on heart rate:
1. Tachycardia (HR > 100 bpm)
2. Bradycardia (HR < 60 bpm)
Classification based on origin of impulse:Classification based on origin of impulse:
1. Supraventricular – ”Narrow QRS complex” (<
0.12 ms)
2. Ventricular - ”Wide QRS complex” (> 0.12 ms)

Tachyarrhytmias

An overview of pathological supraventricular arrhythmias and their
origin
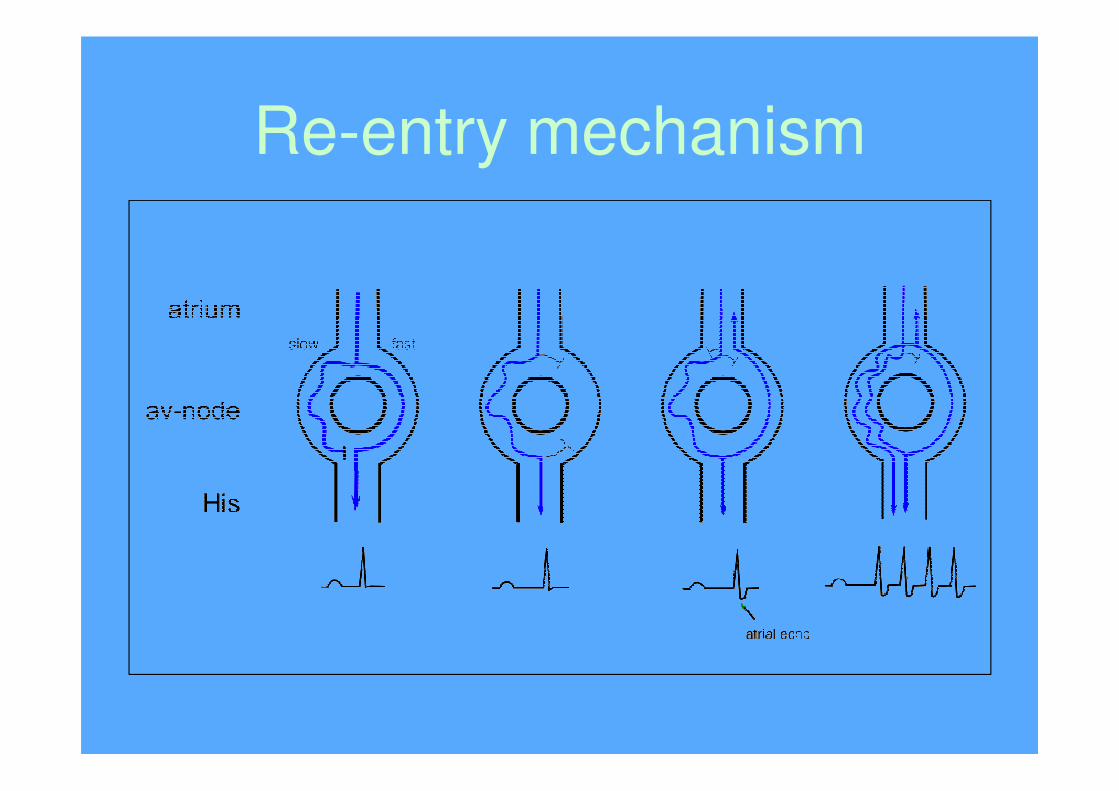
Re-entry mechanism

Sinustachycardia
Atrial frequency 100 – 180 bpm
Ventricular frequency 100 – 180 bpm
Regularity Regular
Origin Sinus node
P-wave Positive in II, aVF
Effect of Adenosine No (can lead to temporary AV block

Sinustachycardia
Causes:
• Exercise, anxiety, alcohol, caffeine, drugs
• Fever
•• Hypoxia
• Bleeding
• Anemia
• Hyperthyroidism
• +++++

Atrial tachycardia
Atrial frequency > 100
Ventricular frequency >100
Regularity Regular
Origin Ectopic foci in atrium (re-entry)
P-wave Negative in I, aVF (different morphology)
Effect of Adenosine / Vagal stimulation Slow down rythm (AV-conduction)

Atrial fibrillaton (AF)
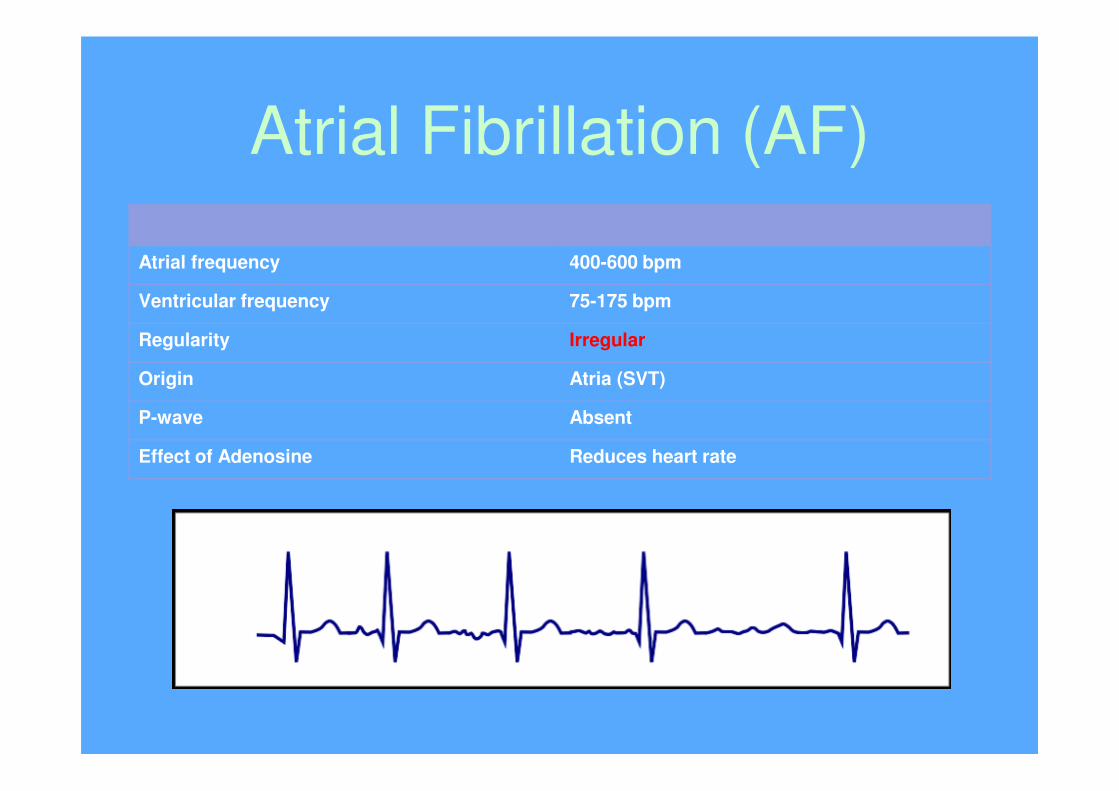
Atrial Fibrillation (AF)
Atrial frequency 400-600 bpm
Ventricular frequency 75-175 bpm
Regularity Irregular
Origin Atria (SVT)
P-wave Absent
Effect of Adenosine Reduces heart rate

Atrial Fibrillation (AF)

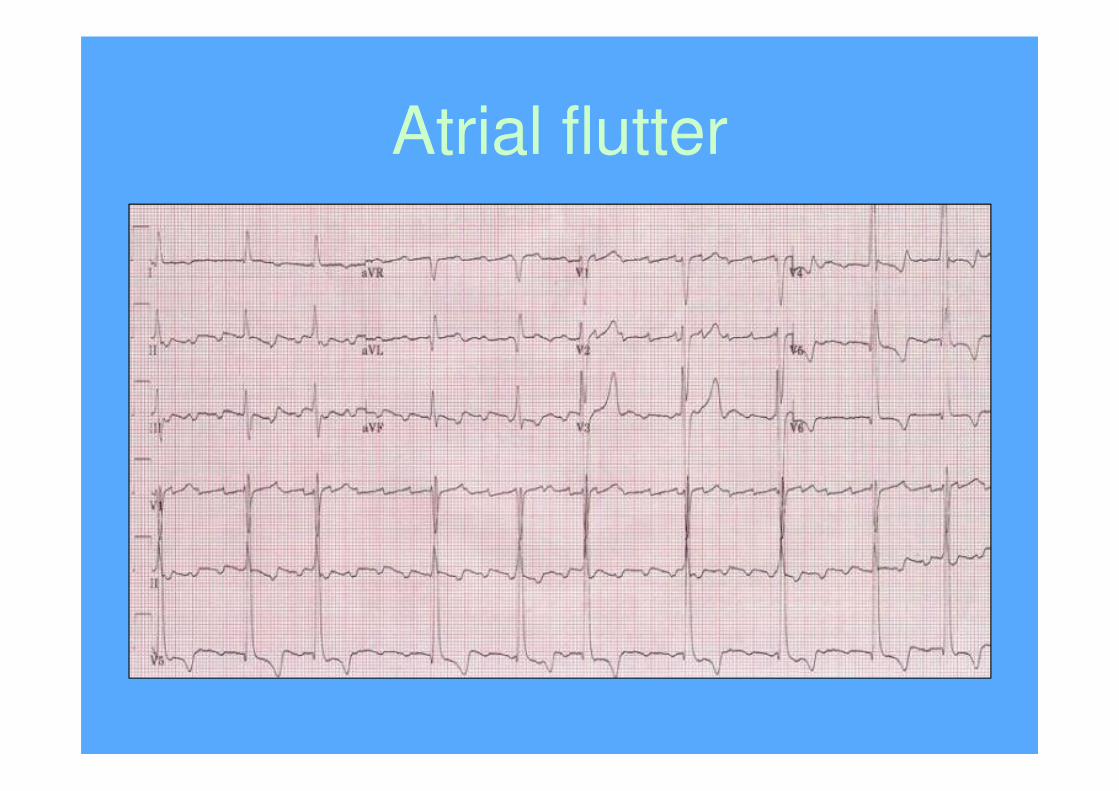
Atrial flutter

Atrial flutter
Atrial frequency 250-350 bpm
Ventricular frequency 75-150 bpm (3:1 or 2:1 block)
Regularity Regular
Origin Atria (SVT)
P-wave Negative sawtooth in lead II
Effect of Adenosine Temporary reduced AV conduction
Atrial flutter

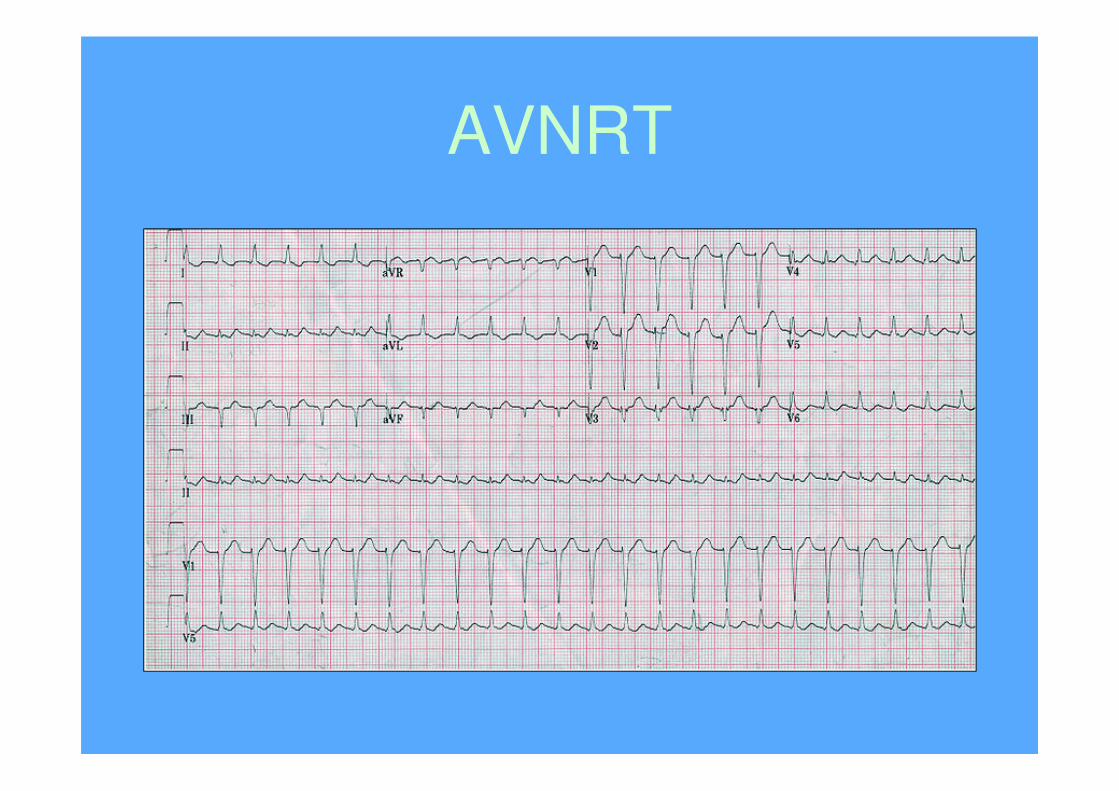
AV-nodal re-entry tachycardia (AVNRT)

AVNRT
Atrial frequency 180-250 bpm
Ventricular frequency 180-250 bpm
Regularity Regular
Origin AV-node
P-wave Inside or right after QRS-complex
Effect of Adenosine Terminates arrhytmia
AVNRT

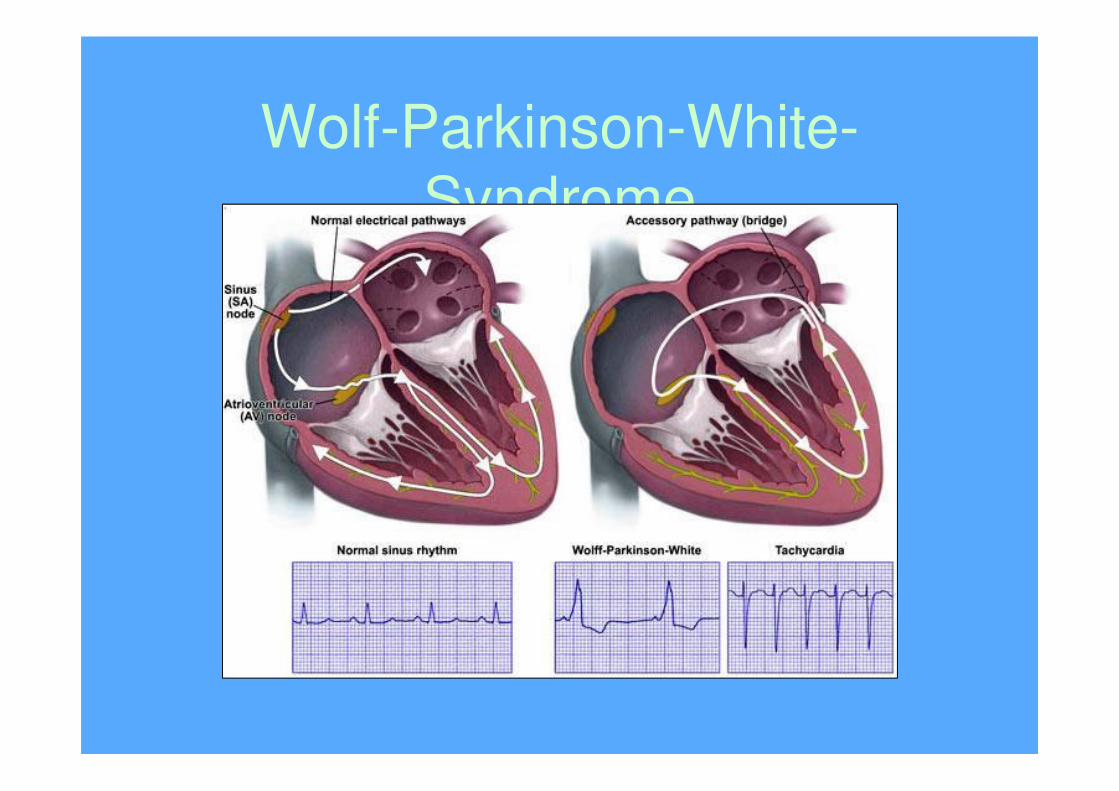
Atrioventricular Re-entrant
Tachycardia (AVRT)• Also called ”Wolf-Parkinson-White-syndrome” (WPS)
and is a part of ”Preexitation syndromes”
• Caused by an abnormal accessory conduction
pathway between atria and ventriclespathway between atria and ventricles
• Ventricles might be stimulated prematurely, resulting
in an atriventricular re-entry tachycardia
• Can also cause diffuse ECG-changes resembling
ischaemia
Wolf-Parkinson-White-
Syndrome

Wolf-Parkinson-White
syndrome

Ventricular tachycardias
Premature ventricular contractions (PVC)
• Most common of ventriuclar arrhytmias

Ventricular tachycardia (VT)
• Regular, HR 110-250
Ventricular fibrillation (VF)
• Irregular, HR 400-600 bpm
Torsade de pointes
• Regular, HR 150-300
Bradyarrhytmias• AV-block 1st degree
• AV-block 2nd degree (Wenckebach and
Mobitz type II)
• AV-block 3rd degree (complete AV-block)
• AV-blocks
• Sick sinus syndrome
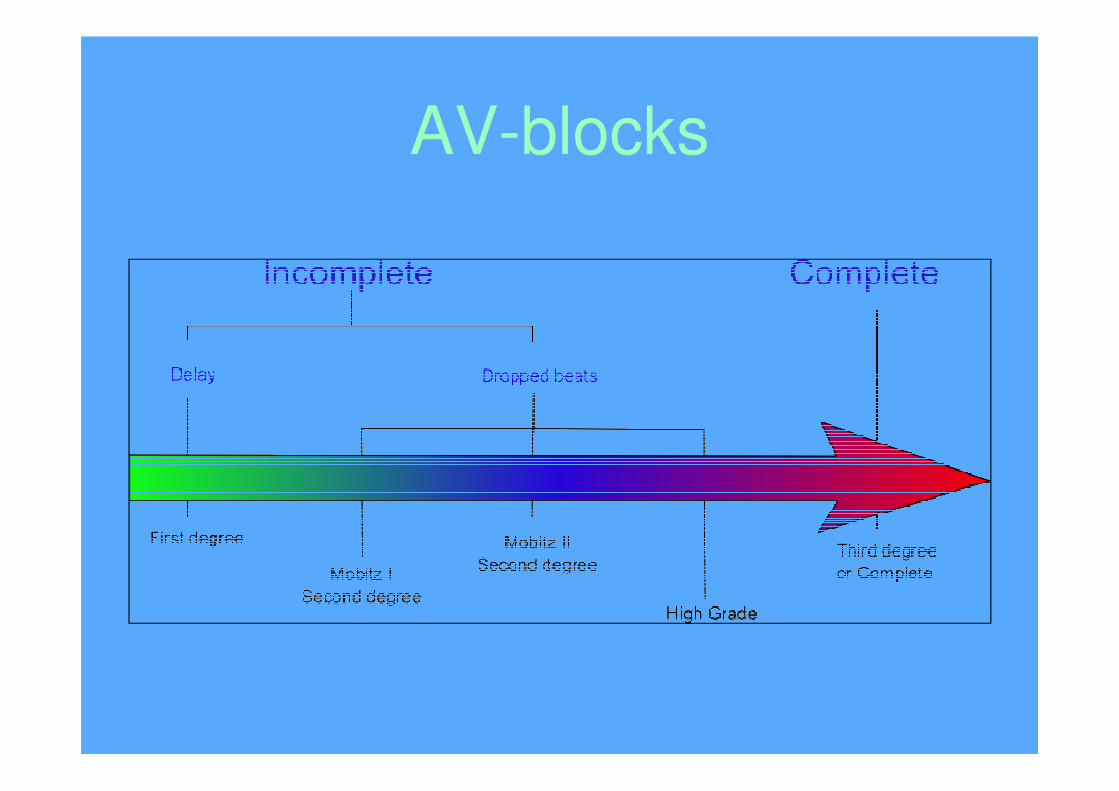
AV-blocks

• AV-block type 1
• AV-block type 2 – Mobitz I (Wencheback)
• AV-block type 2 – Mobitz II
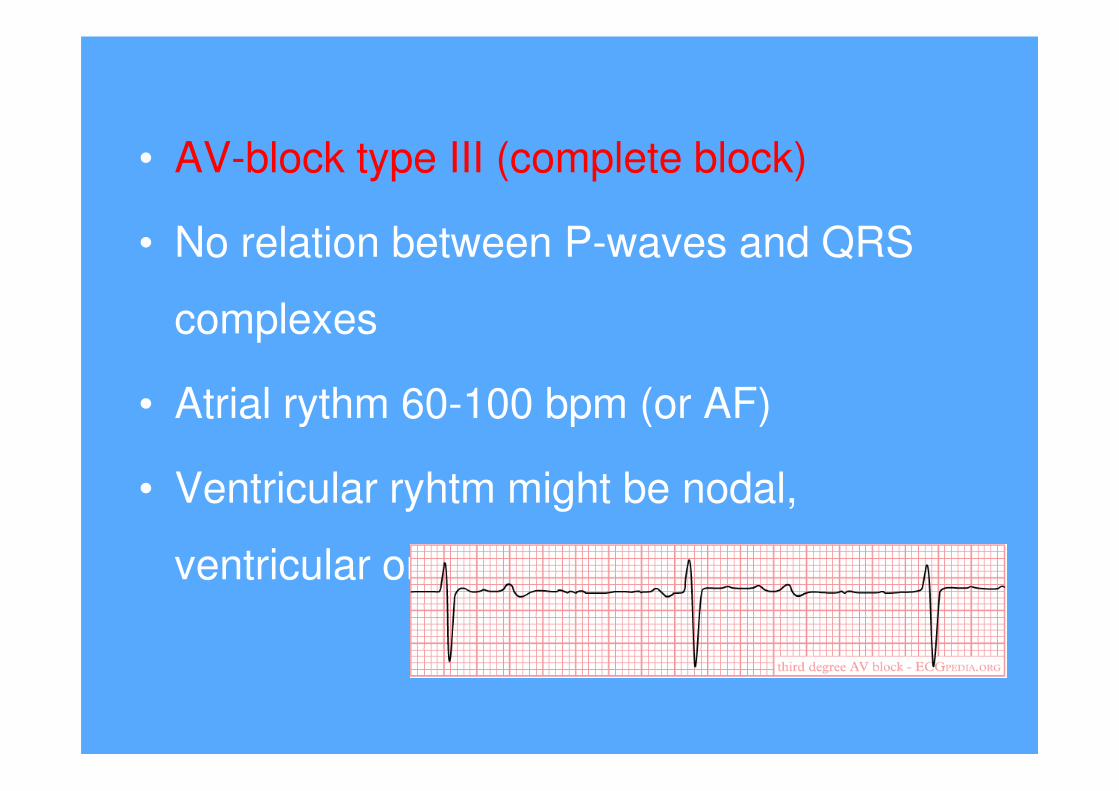
• AV-block type III (complete block)
• No relation between P-waves and QRS
complexes
• Atrial rythm 60-100 bpm (or AF)• Atrial rythm 60-100 bpm (or AF)
• Ventricular ryhtm might be nodal,
ventricular or absent

Conduction system

Left bundle branch block
(LBBB)• Slowed conduction in left
bundle, causing delayed
depolarization of left ventricle
• QRS > 0,12 sec
• Deep S-waves in V1-V3
• Late R-waves in V5-V6
• ST-segment depression in
lateral leads (I, aVL, V5-V6)
• Always a pathological finding in
patients!

Right bundle branch block
(RBBB)• Conduction in right bundle
branch is slow, causing late
depolarization of right ventricle
• QRS > 0,12 sec• QRS > 0,12 sec
• rSR (”rabbit ears”) in V1-V2
• Late deep S-waves in lateral
leads (I, aVL, V5-V6)
• Commonly a physiological
finding in patients!
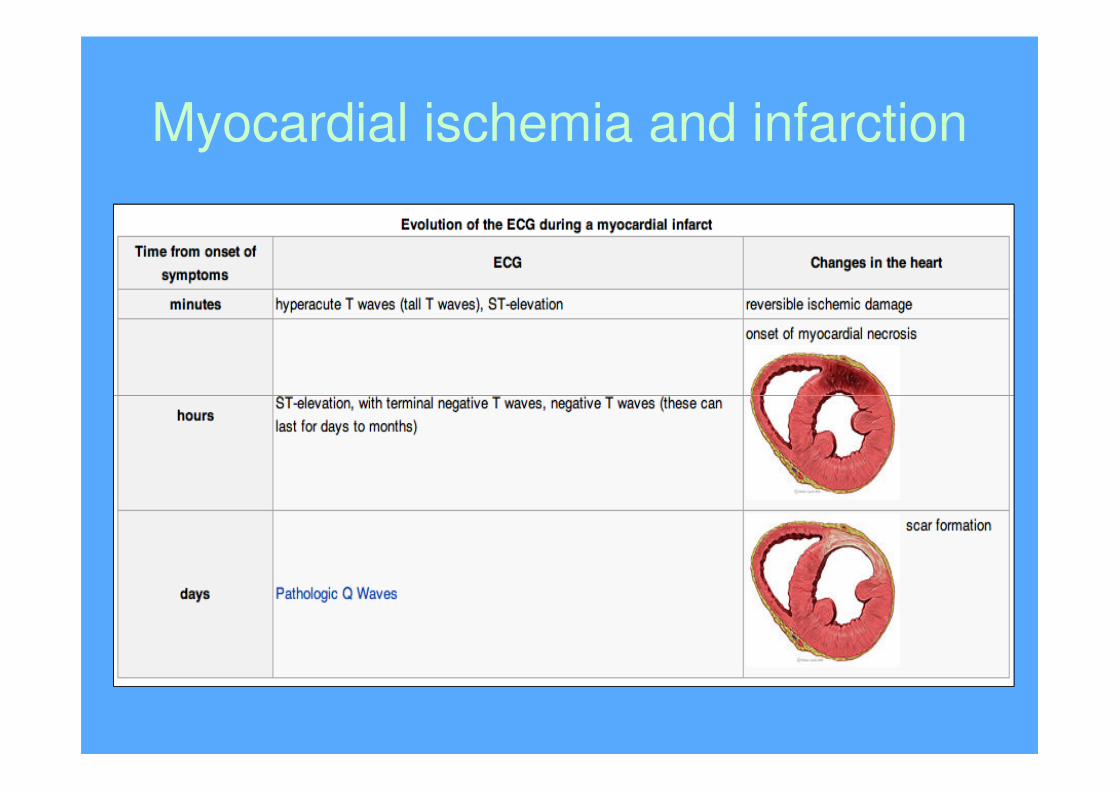
Myocardial ischemia and infarction

Evolution of ECG changes in
Myocardial infarction

Diagnosis of myocardial
infarction• Elevated cardiac enzymes in
blood (Troponin T, C and
CKMB)
AND on of the following:
• Typical symptoms (chest • Typical symptoms (chest
pain > 20 min)
• ECG changes (ST elevation,
ST depression or
pathological Q-waves)
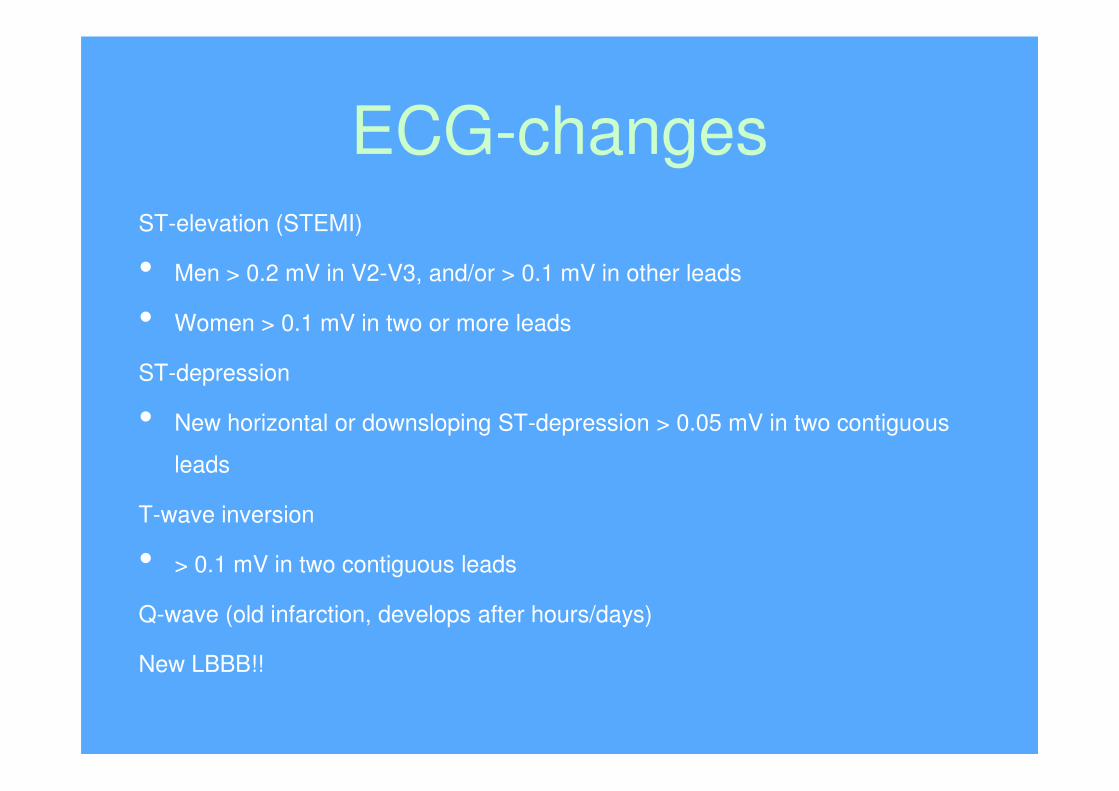
ECG-changesST-elevation (STEMI)
• Men > 0.2 mV in V2-V3, and/or > 0.1 mV in other leads
• Women > 0.1 mV in two or more leads
ST-depression
•• New horizontal or downsloping ST-depression > 0.05 mV in two contiguous
leads
T-wave inversion
• > 0.1 mV in two contiguous leads
Q-wave (old infarction, develops after hours/days)
New LBBB!!

Location of ECG-changes

Location of ECG-changes

Where is MI located?
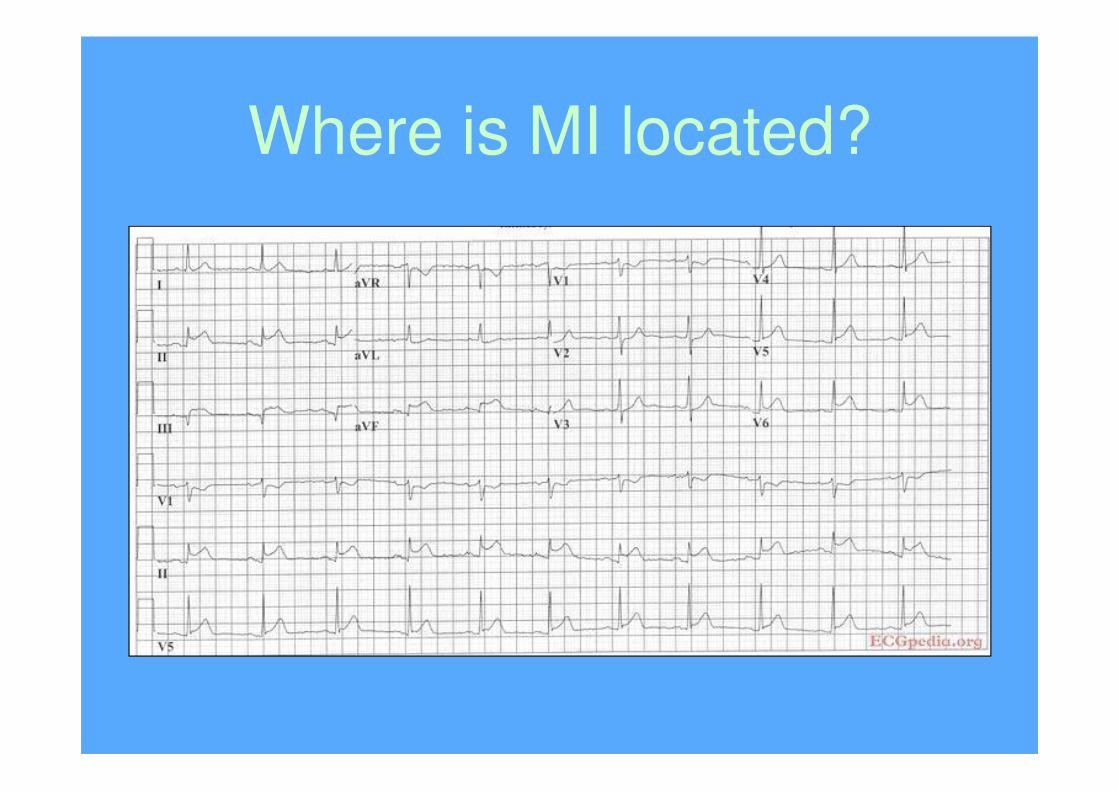
Where is MI located?

PAUSE!

How to read ECG”5+1”:
1. Rhytm
2. Rate
3. Conduction (PQ, QRS, QT)3. Conduction (PQ, QRS, QT)
4. Heart axis
5. Morphology (P wave, QRS, ST-segment)
6. Compare current ECG with a previous one

1. Ryhtm
• Is it sinus ryhtm?
• Regular or irregular?• Regular or irregular?
• Prolonged recording from one lead is used
to provide a rhytm strip (usually lead II)
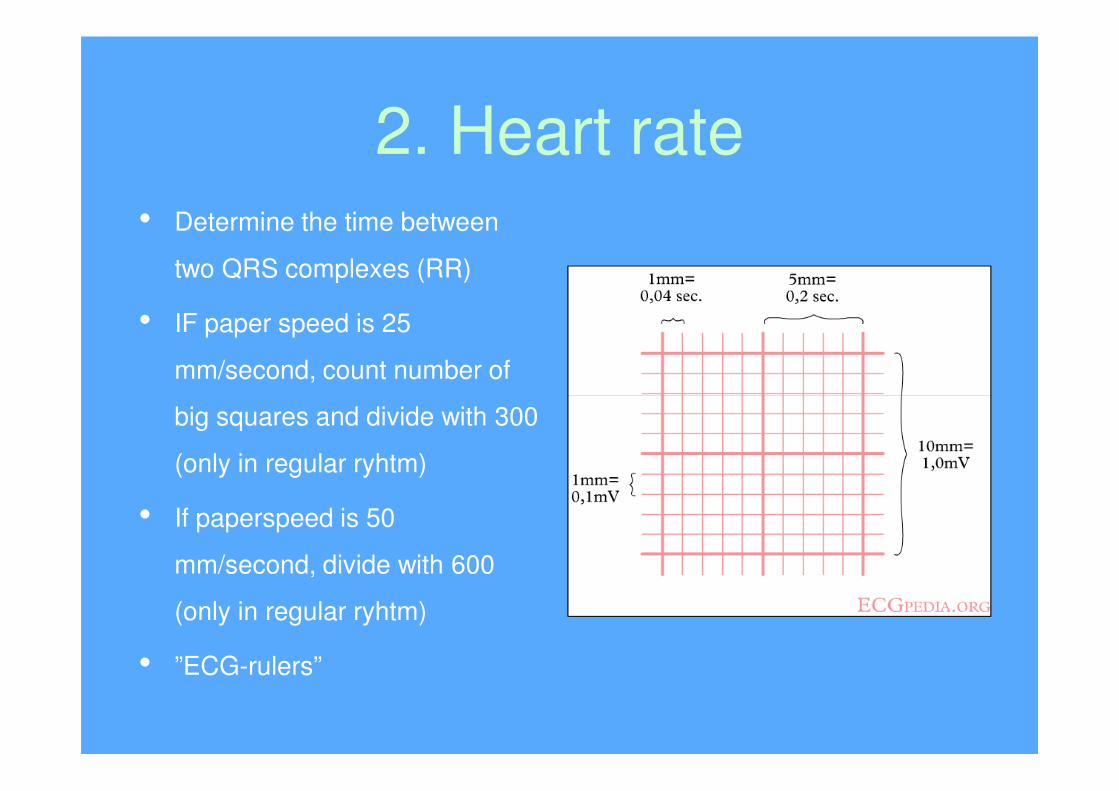
2. Heart rate• Determine the time between
two QRS complexes (RR)
• IF paper speed is 25
mm/second, count number of
big squares and divide with 300
(only in regular ryhtm)
• If paperspeed is 50
mm/second, divide with 600
(only in regular ryhtm)
• ”ECG-rulers”

3. Conduction• The PQ interval starts at the beginning
of the atrial contraction and ends at the
beginning of the ventricular contraction
(0,12 – 0,20 seconds)
• The QRS duration indicates how fast
the ventricles depolarize (normal < 0,10
seconds)seconds)
• The normal QTc (corrected) interval
indicates how fast the ventricles are
repolarized, becoming ready for a new
cycle. (below 0.45 seconds in men and
below 0,46 in women)

4. Heart axis• Look at lead aVF and I,
should normally be
positive
• Lead II is also postive, • Lead II is also postive,
lead III can be pos. or
neg.
• In normal axis both has
predominant positive
deflections

5. Morphology
• Normal p wave?
• No pathological Q-waves?
• Prolonged QRS?• Prolonged QRS?
• Normal R-wave progression in V1-V6?
• ST elevation or depression?
• Abnormal T-wave?

6. Compare to old ECG
• Are the presenting ECG-changes new?
• Remember that new LBBB is treatet as
STEMI..

For more ECG traces click:
http://ecg.bidmc.harvard.edu/maven/maven
main.asp