
ABC (Activity Based Costing) and Course Optimization ... · ABC (Activity Based Costing) and Course...
30
ABC (Activity Based Costing) and Course Optimization Project Kick-off July 2015
-
Upload
vuongquynh -
Category
Documents
-
view
226 -
download
0
Transcript of ABC (Activity Based Costing) and Course Optimization ... · ABC (Activity Based Costing) and Course...
ABC (Activity Based Costing) and Course Optimization
Project Kick-off
July 2015
2 |
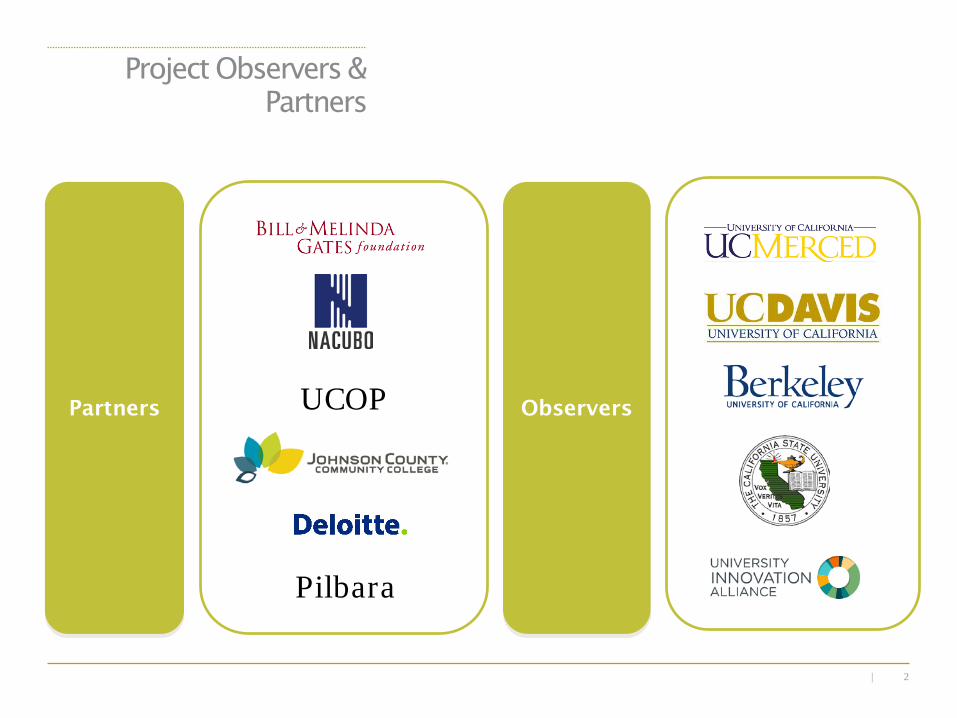
Project Observers & Partners
Partners Observers Partners UCOP Partners
Pilbara
3 |
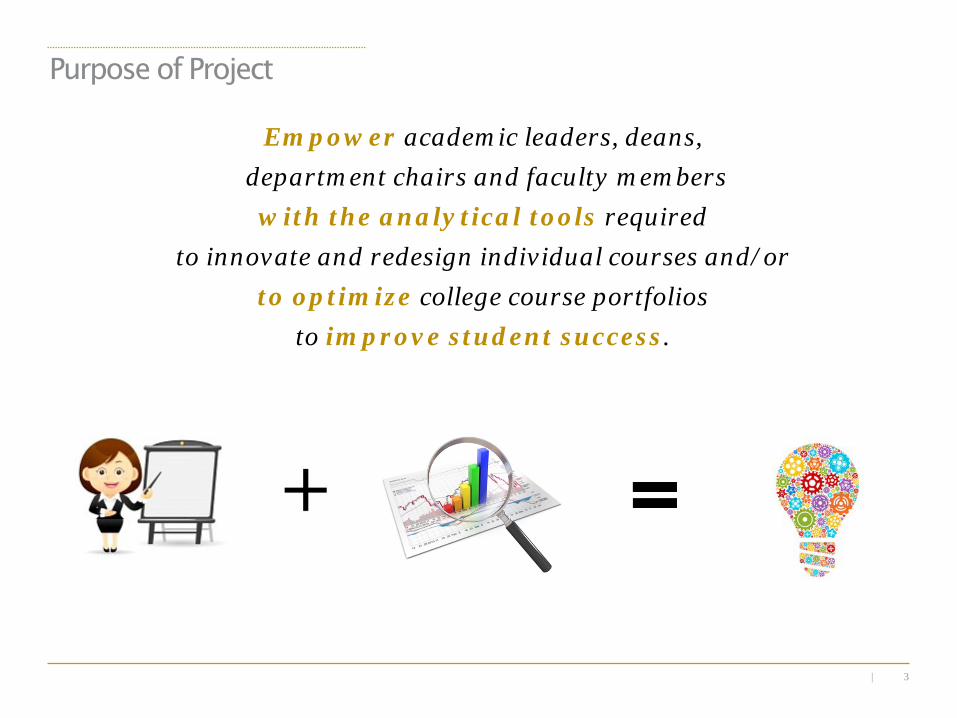
Empower academic leaders, deans, department chairs and faculty members
with the analytical tools required to innovate and redesign individual courses and/or
to optimize college course portfolios to improve student success.
Purpose of Project
4 |
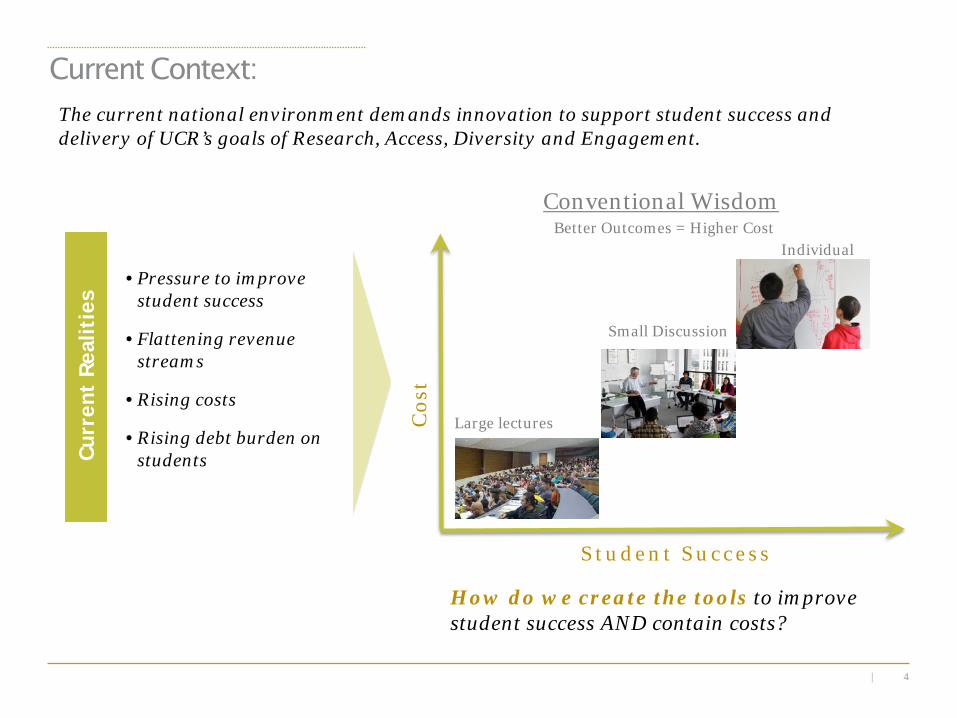
Current Context: Cu
rren
t Re
alit
ies
• Pressure to improve student success
• Flattening revenue streams
• Rising costs
• Rising debt burden on students
The current national environment demands innovation to support student success and delivery of UCR’s goals of Research, Access, Diversity and Engagement.
How do we create the tools to improve student success AND contain costs?
S t u d e n t S u c c e s s
Cos
t
Better Outcomes = Higher Cost
Small Discussion
Large lectures
Conventional Wisdom
Individual
5 |
Scenario A
x90
Scenario B Scenario C
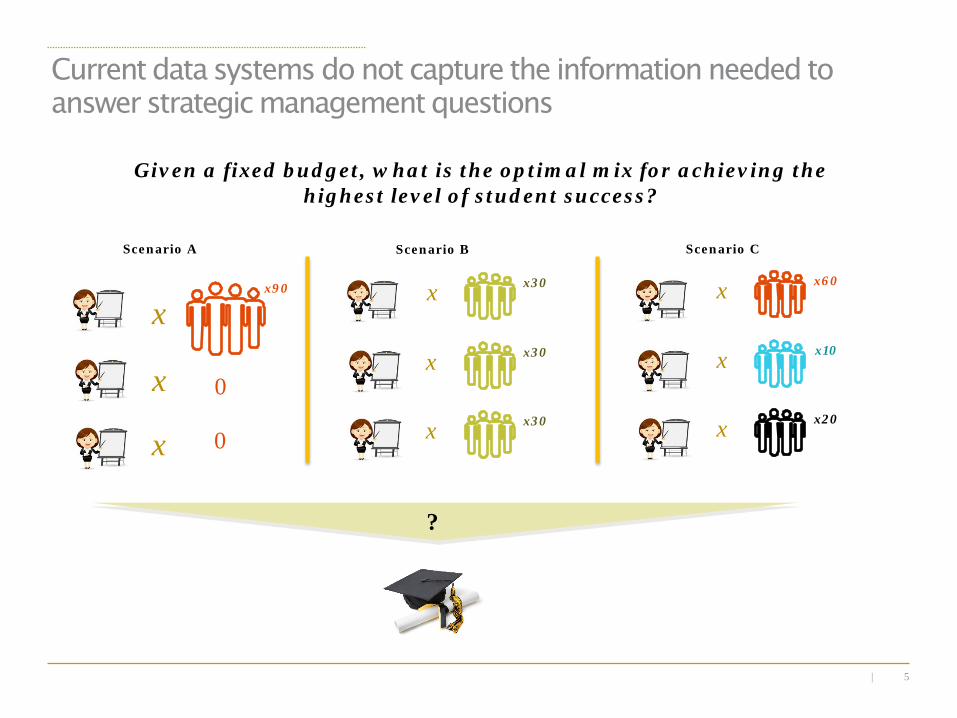
Given a fixed budget, what is the optimal mix for achieving the highest level of student success?
x x60 x
x10 x
x20 x
x30 x
x30 x
x30 x
Current data systems do not capture the information needed to answer strategic management questions
x
x
0
0
?
6 |
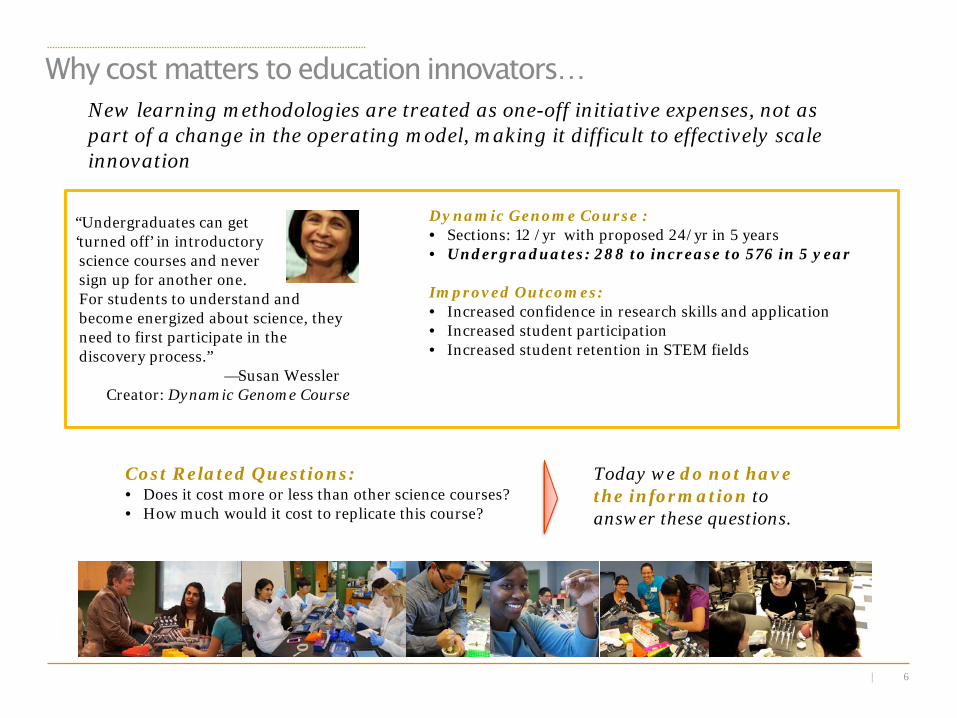
Why cost matters to education innovators…
“Undergraduates can get ‘turned off’ in introductory science courses and never sign up for another one. For students to understand and become energized about science, they need to first participate in the discovery process.” —Susan Wessler
Creator: Dynamic Genome Course
Dynamic Genome Course : • Sections: 12 /yr with proposed 24/yr in 5 years • Undergraduates: 288 to increase to 576 in 5 year
Improved Outcomes: • Increased confidence in research skills and application • Increased student participation • Increased student retention in STEM fields
Cost Related Questions: • Does it cost more or less than other science courses? • How much would it cost to replicate this course?
Today we do not have the information to answer these questions.
New learning methodologies are treated as one-off initiative expenses, not as part of a change in the operating model, making it difficult to effectively scale innovation
7 |
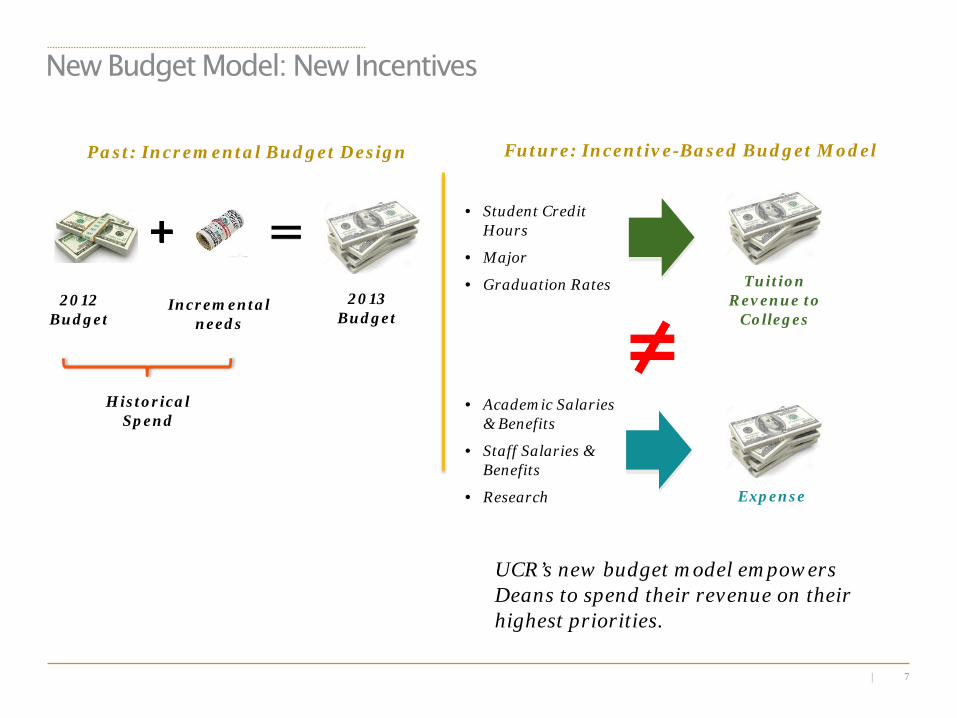
New Budget Model: New Incentives
Past: Incremental Budget Design
2013 Budget
2012 Budget
Incremental needs
Future: Incentive-Based Budget Model
Tuition Revenue to
Colleges
• Student Credit Hours
• Major
• Graduation Rates
Expense
• Academic Salaries & Benefits
• Staff Salaries & Benefits
• Research
UCR’s new budget model empowers Deans to spend their revenue on their highest priorities.
Historical Spend
8 |
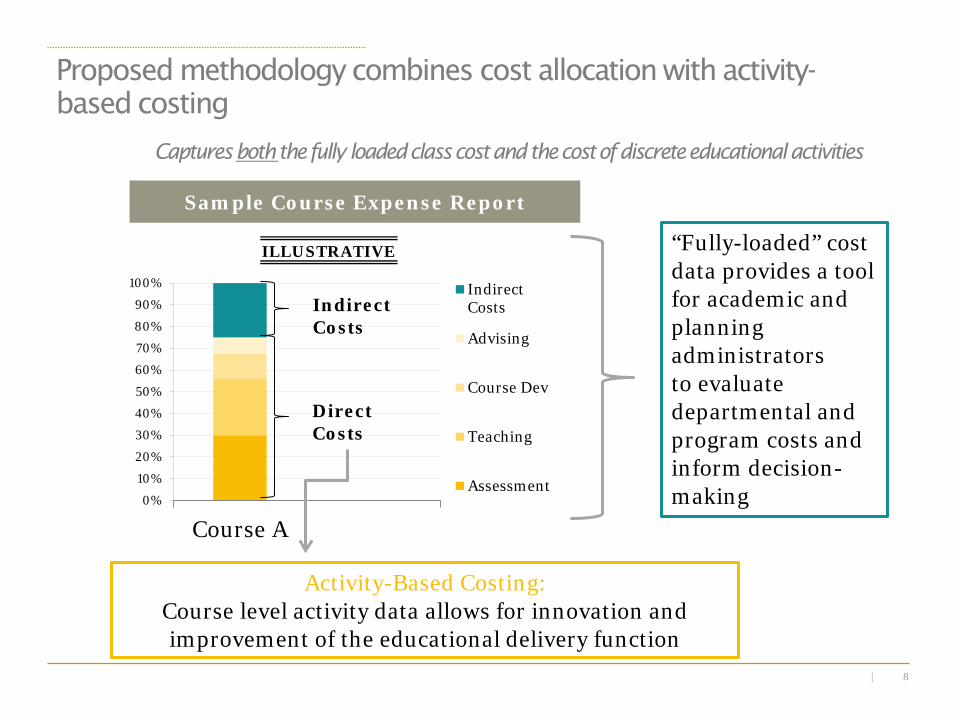
Captures both the fully loaded class cost and the cost of discrete educational activities
0%
10%
20%
30%
40%
50%
60%
70%
80%
90%
100%
Course A
IndirectCosts
Advising
Course Dev
Teaching
Assessment
Sample Course Expense Report
Indirect Costs
Direct Costs
“Fully-loaded” cost data provides a tool for academic and planning administrators to evaluate departmental and program costs and inform decision-making
Activity-Based Costing: Course level activity data allows for innovation and improvement of the educational delivery function
ILLUSTRATIVE
Proposed methodology combines cost allocation with activity-based costing
9 |
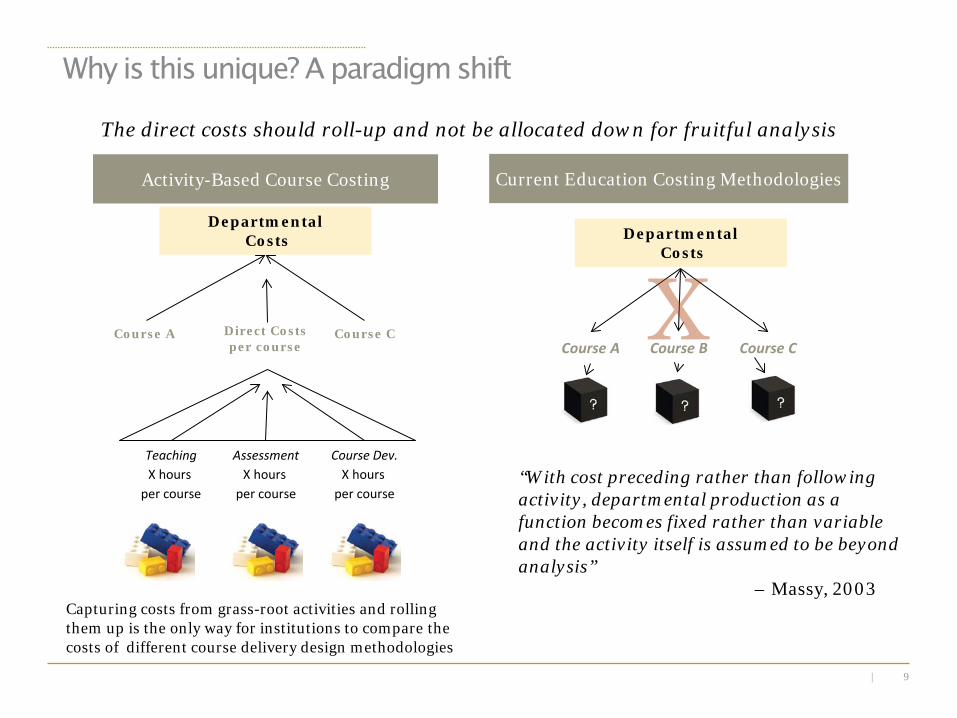
Capturing costs from grass-root activities and rolling them up is the only way for institutions to compare the costs of different course delivery design methodologies
Teaching X hours
per course
Assessment X hours
per course
Course Dev. X hours
per course
Direct Costs per course Course A Course B Course C
Current Education Costing Methodologies Activity-Based Course Costing
Departmental Costs
Course C Course A
“With cost preceding rather than following activity, departmental production as a function becomes fixed rather than variable and the activity itself is assumed to be beyond analysis” – Massy, 2003
Departmental Costs
The direct costs should roll-up and not be allocated down for fruitful analysis
Why is this unique? A paradigm shift
10 |
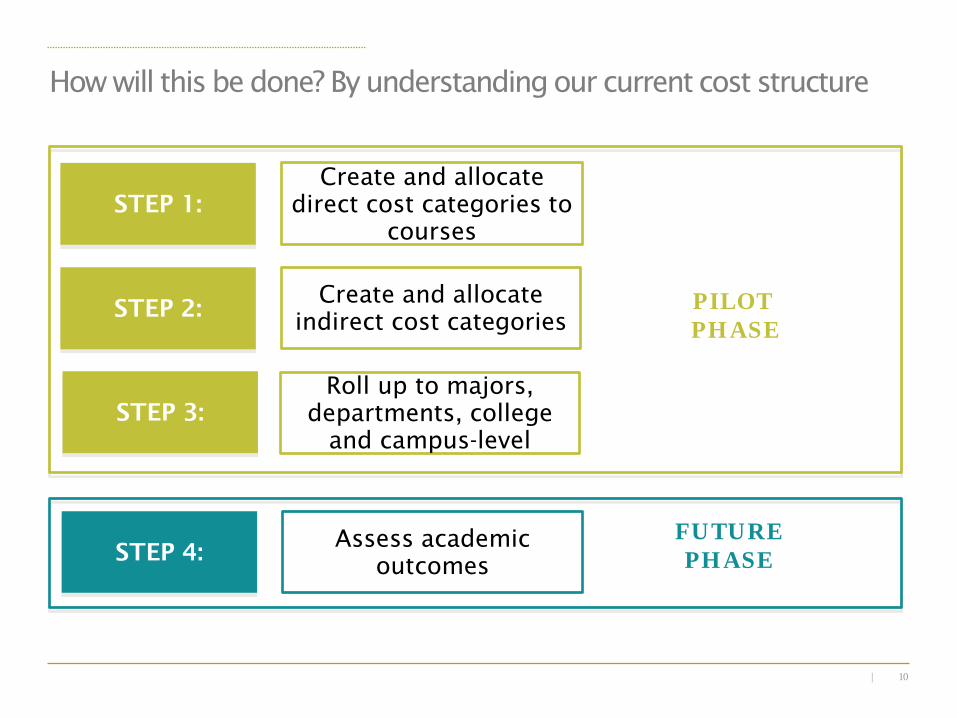
How will this be done? By understanding our current cost structure
STEP 1: Create and allocate
direct cost categories to courses
Create and allocate indirect cost categories
STEP 4: Assess academic
outcomes
PILOT PHASE
FUTURE PHASE
STEP 2:
STEP 3: Roll up to majors,
departments, college and campus-level

11 |
First Step in Direct Cost Allocation: Course Profiles
Course Development Hours
Course Management Hours
Teaching Hours
Tutoring Hours
Advising Hours
Assessment & Grading Hours
Class Type Lecture/Lab/etc
Credit Hours
Delivery Mode On-campus Online/ Hybrid
Semester Fall/Summer
# of Students
Edu
cati
onal
Act
ivit
ies
C
ours
e A
ttri
bute
s
Sample Course Profile
• In order to allocate costs to the educational activities, course profiles will be created to allocate activity hours and attributes to its courses
• Attributes can be added to course profiles to give more information •Note that in Excel these would create unmanageable data sets, but DS software can handle this complexity
• Effort on course activities can be captured in “course profiles” – minimizes interviews & effort
• Can be set to differ by school/department, by level/type of course or individual
• Can refine as appropriate over time
12 |
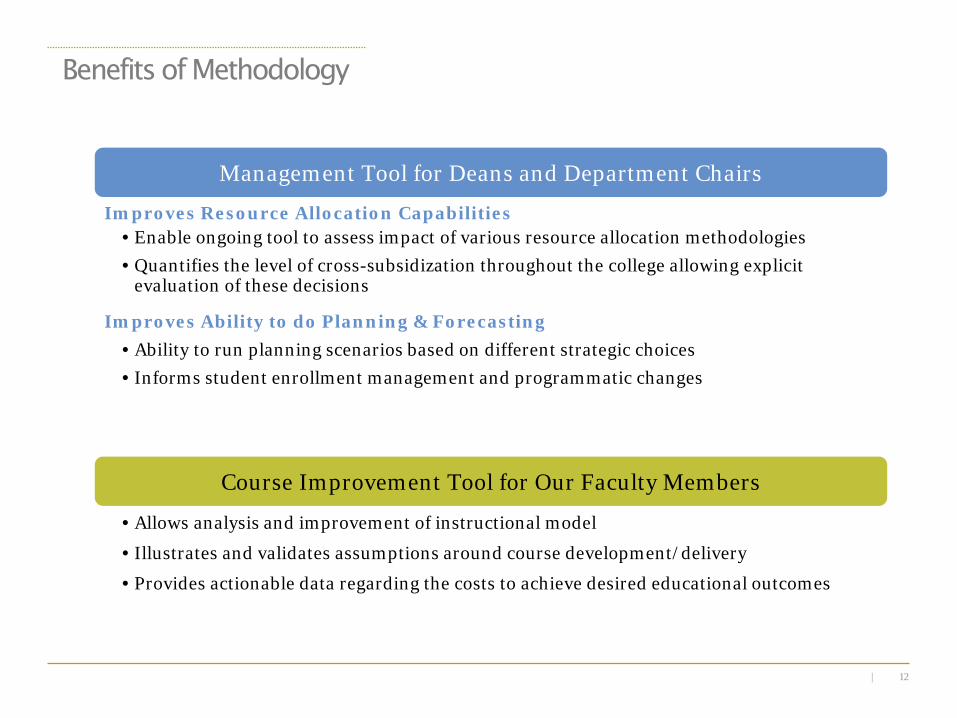
Benefits of Methodology
Improves Resource Allocation Capabilities • Enable ongoing tool to assess impact of various resource allocation methodologies • Quantifies the level of cross-subsidization throughout the college allowing explicit
evaluation of these decisions
Improves Ability to do Planning & Forecasting • Ability to run planning scenarios based on different strategic choices • Informs student enrollment management and programmatic changes
Management Tool for Deans and Department Chairs
Course Improvement Tool for Our Faculty Members
• Allows analysis and improvement of instructional model
• Illustrates and validates assumptions around course development/delivery
• Provides actionable data regarding the costs to achieve desired educational outcomes
13 |
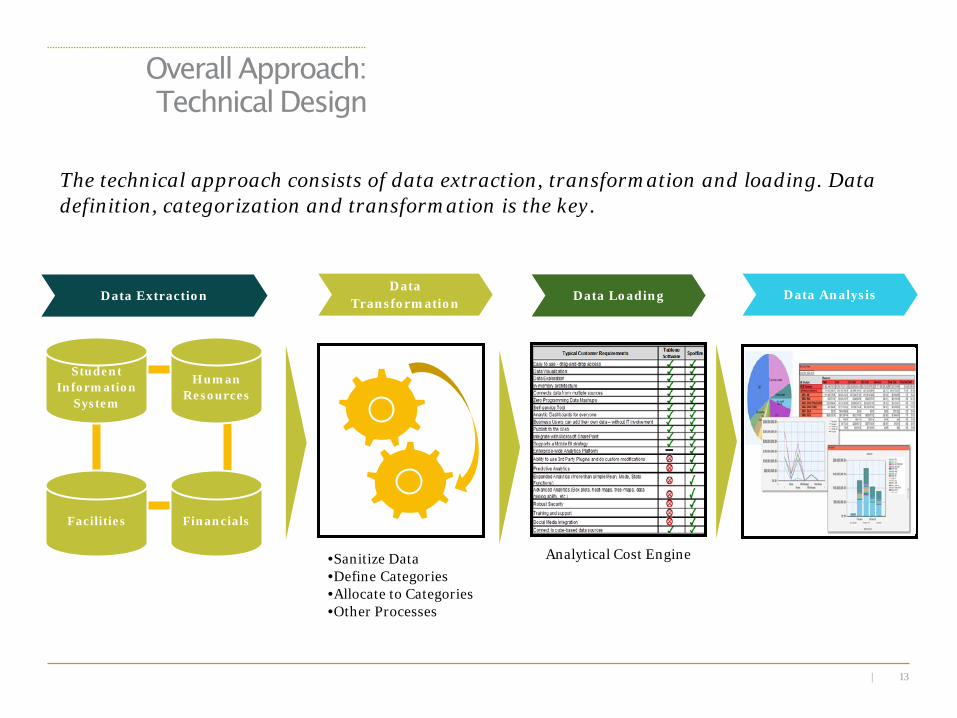
Overall Approach: Technical Design
The technical approach consists of data extraction, transformation and loading. Data definition, categorization and transformation is the key.
Student Information
System
Facilities
Human Resources
Financials
Data Extraction Data
Transformation Data Loading Data Analysis
•Sanitize Data •Define Categories •Allocate to Categories •Other Processes
Analytical Cost Engine
14 |
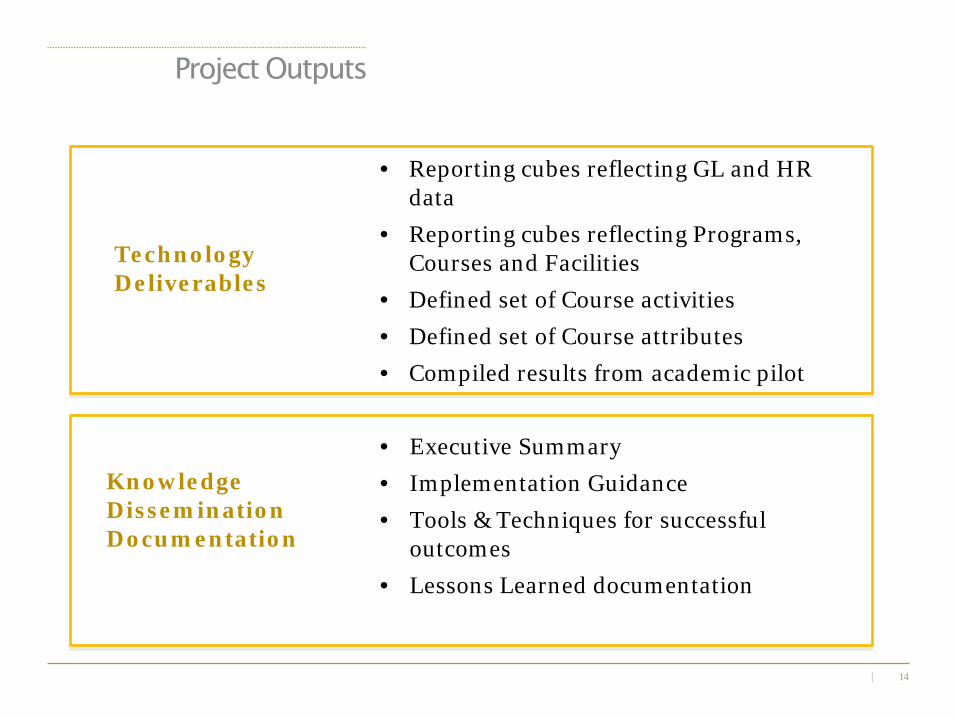
Project Outputs
• Reporting cubes reflecting GL and HR data
• Reporting cubes reflecting Programs, Courses and Facilities
• Defined set of Course activities • Defined set of Course attributes • Compiled results from academic pilot
• Executive Summary • Implementation Guidance • Tools & Techniques for successful
outcomes • Lessons Learned documentation
Technology Deliverables
Knowledge Dissemination Documentation
15 |
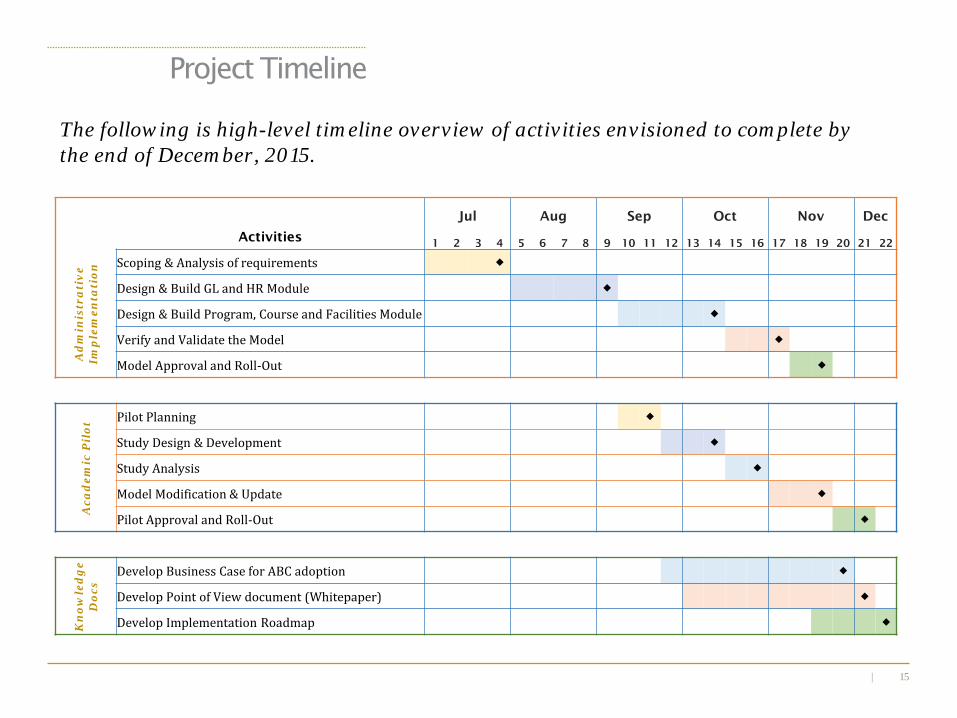
Project Timeline
Jul Aug Sep Oct Nov Dec
Activities 1 2 3 4 5 6 7 8 9 10 11 12 13 14 15 16 17 18 19 20 21 22
Ad
min
istr
ati
ve
Imp
lem
enta
tion
Scoping & Analysis of requirements
Design & Build GL and HR Module
Design & Build Program, Course and Facilities Module
Verify and Validate the Model
Model Approval and Roll-Out
Aca
dem
ic P
ilot
Pilot Planning
Study Design & Development
Study Analysis
Model Modification & Update
Pilot Approval and Roll-Out
Kn
owle
dg
e D
ocs
Develop Business Case for ABC adoption
Develop Point of View document (Whitepaper)
Develop Implementation Roadmap
The following is high-level timeline overview of activities envisioned to complete by the end of December, 2015.
16 |
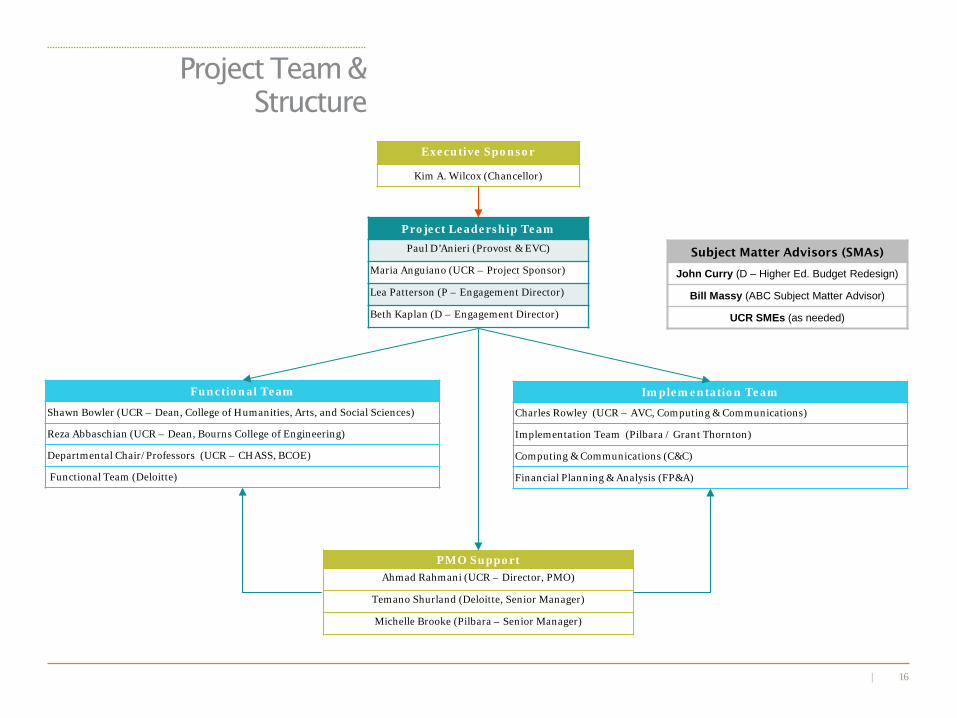
Project Team & Structure
Project Leadership Team
Paul D’Anieri (Provost & EVC)
Maria Anguiano (UCR – Project Sponsor)
Lea Patterson (P – Engagement Director)
Beth Kaplan (D – Engagement Director)
Executive Sponsor
Kim A. Wilcox (Chancellor)
Functional Team
Shawn Bowler (UCR – Dean, College of Humanities, Arts, and Social Sciences)
Reza Abbaschian (UCR – Dean, Bourns College of Engineering)
Departmental Chair/Professors (UCR – CHASS, BCOE)
Functional Team (Deloitte)
Subject Matter Advisors (SMAs)
John Curry (D – Higher Ed. Budget Redesign)
Bill Massy (ABC Subject Matter Advisor)
UCR SMEs (as needed)
PMO Support Ahmad Rahmani (UCR – Director, PMO)
Temano Shurland (Deloitte, Senior Manager)
Michelle Brooke (Pilbara – Senior Manager)
Implementation Team
Charles Rowley (UCR – AVC, Computing & Communications)
Implementation Team (Pilbara / Grant Thornton)
Computing & Communications (C&C)
Financial Planning & Analysis (FP&A)

17 |
Appendix
18 |
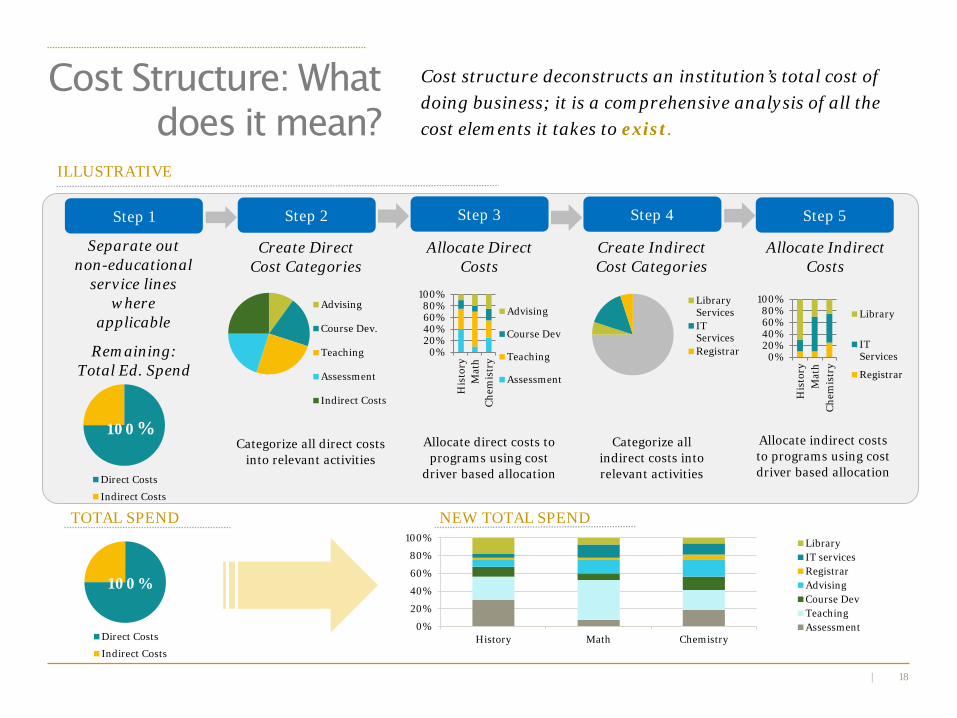
Cost structure deconstructs an institution’s total cost of doing business; it is a comprehensive analysis of all the cost elements it takes to exist.
Step 2 Step 3 Step 4 Step 5
Advising
Course Dev.
Teaching
Assessment
Indirect Costs
Create Direct Cost Categories
Start
Direct Costs
Indirect Costs
100%
Remaining: Total Ed. Spend
Categorize all direct costs into relevant activities
Allocate direct costs to programs using cost
driver based allocation
Categorize all indirect costs into relevant activities
Allocate indirect costs to programs using cost driver based allocation
0%20%40%60%80%
100%
His
tory
Mat
hC
hem
istr
y
Advising
Course Dev
Teaching
Assessment
LibraryServicesITServicesRegistrar
Allocate Direct Costs
Create Indirect Cost Categories
Allocate Indirect Costs
0%20%40%60%80%
100%
His
tory
Mat
hC
hem
istr
y
Library
ITServices
Registrar
Step 1
Separate out non-educational
service lines where
applicable
Direct Costs
Indirect Costs
100%
TOTAL SPEND
0%
20%
40%
60%
80%
100%
History Math Chemistry
LibraryIT servicesRegistrarAdvisingCourse DevTeachingAssessment
NEW TOTAL SPEND
Cost Structure: What does it mean?
ILLUSTRATIVE
19 |
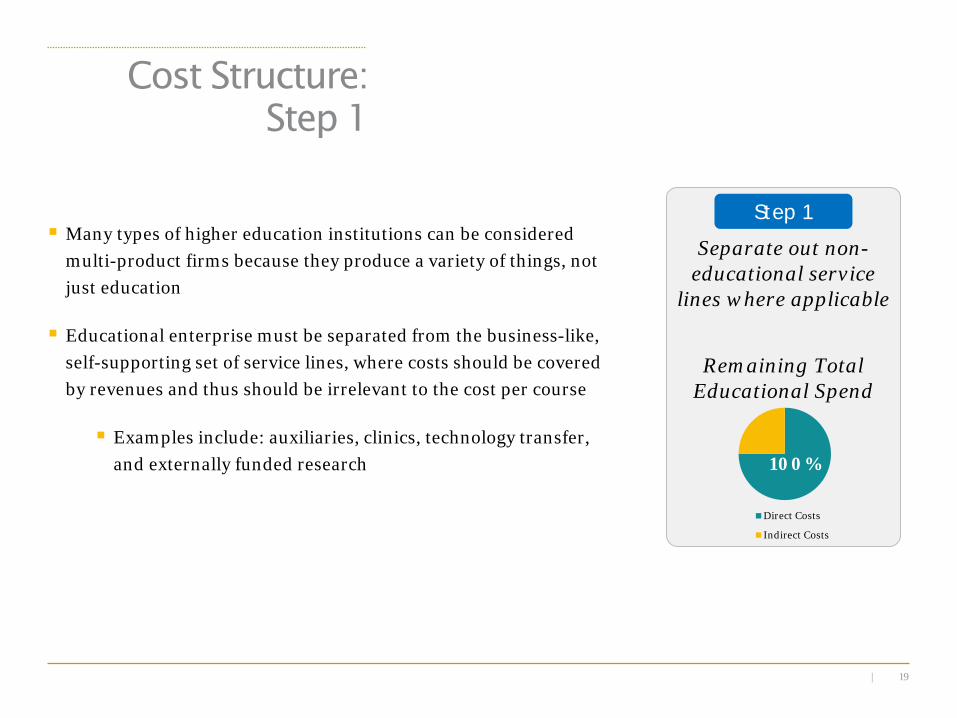
Many types of higher education institutions can be considered multi-product firms because they produce a variety of things, not just education
Educational enterprise must be separated from the business-like, self-supporting set of service lines, where costs should be covered by revenues and thus should be irrelevant to the cost per course
Examples include: auxiliaries, clinics, technology transfer, and externally funded research
Cost Structure: Step 1
Step 1
Separate out non-educational service
lines where applicable
Remaining Total Educational Spend
Direct Costs
Indirect Costs
100%
20 |
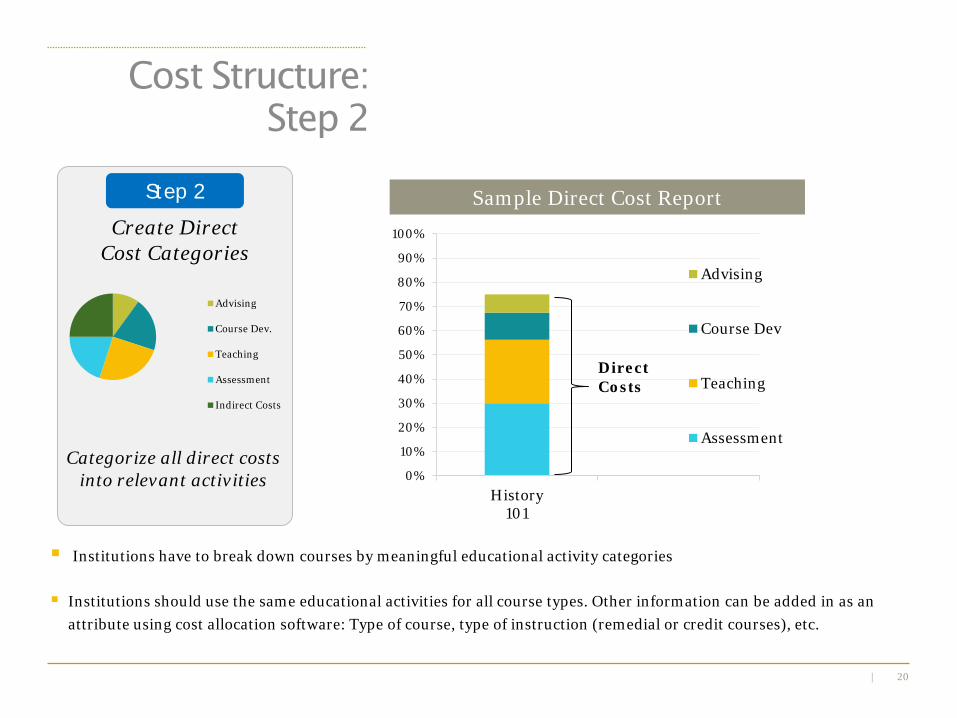
Institutions have to break down courses by meaningful educational activity categories
Institutions should use the same educational activities for all course types. Other information can be added in as an attribute using cost allocation software: Type of course, type of instruction (remedial or credit courses), etc.
0%
10%
20%
30%
40%
50%
60%
70%
80%
90%
100%
History101
Advising
Course Dev
Teaching
Assessment
Direct Costs
Step 2
Categorize all direct costs into relevant activities
Create Direct Cost Categories
Cost Structure: Step 2
Advising
Course Dev.
Teaching
Assessment
Indirect Costs
Sample Direct Cost Report
21 |
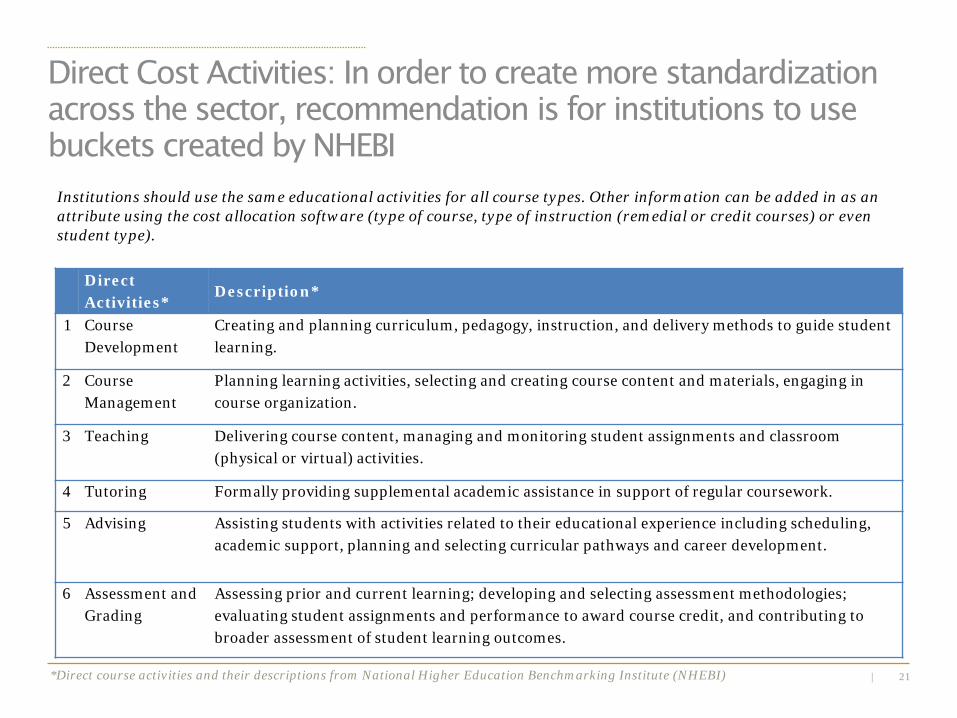
Direct Activities*
Description*
1 Course Development
Creating and planning curriculum, pedagogy, instruction, and delivery methods to guide student learning.
2 Course Management
Planning learning activities, selecting and creating course content and materials, engaging in course organization.
3 Teaching Delivering course content, managing and monitoring student assignments and classroom (physical or virtual) activities.
4 Tutoring Formally providing supplemental academic assistance in support of regular coursework.
5 Advising Assisting students with activities related to their educational experience including scheduling, academic support, planning and selecting curricular pathways and career development.
6 Assessment and Grading
Assessing prior and current learning; developing and selecting assessment methodologies; evaluating student assignments and performance to award course credit, and contributing to broader assessment of student learning outcomes.
*Direct course activities and their descriptions from National Higher Education Benchmarking Institute (NHEBI)
Institutions should use the same educational activities for all course types. Other information can be added in as an attribute using the cost allocation software (type of course, type of instruction (remedial or credit courses) or even student type).
Direct Cost Activities: In order to create more standardization across the sector, recommendation is for institutions to use buckets created by NHEBI
22 |
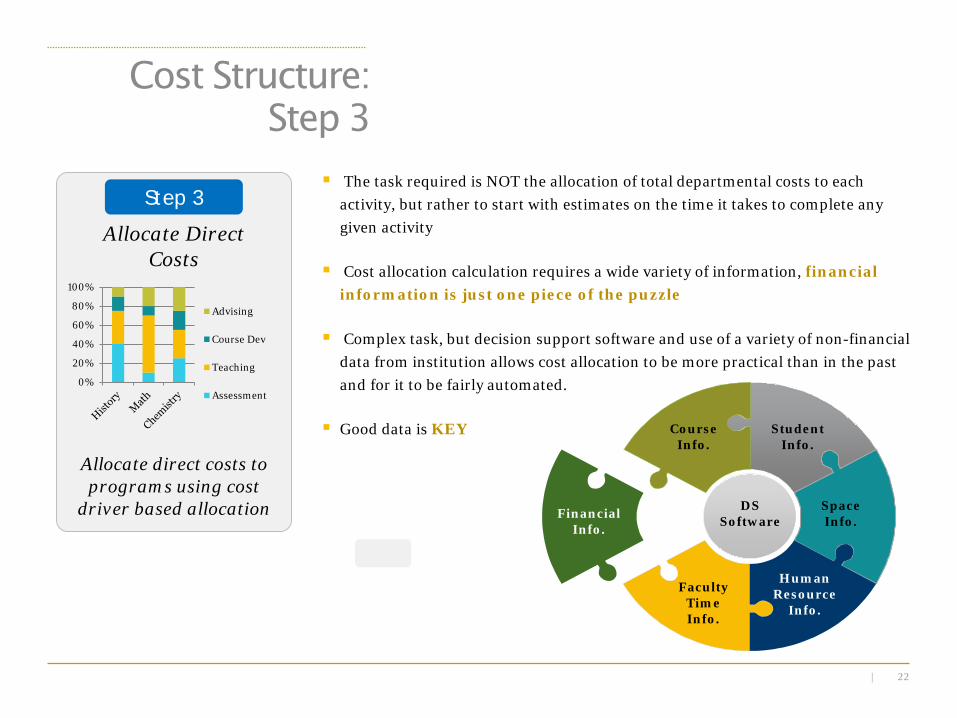
The task required is NOT the allocation of total departmental costs to each activity, but rather to start with estimates on the time it takes to complete any given activity
Cost allocation calculation requires a wide variety of information, financial information is just one piece of the puzzle
Complex task, but decision support software and use of a variety of non-financial data from institution allows cost allocation to be more practical than in the past and for it to be fairly automated.
Good data is KEY
Step 3
Allocate direct costs to programs using cost
driver based allocation
Allocate Direct Costs
0%
20%
40%
60%
80%
100%
Advising
Course Dev
Teaching
Assessment
Cost Structure: Step 3
DS Software
Course Info.
Student Info.
Space Info.
Human Resource
Info.
Faculty Time Info.
Financial Info.
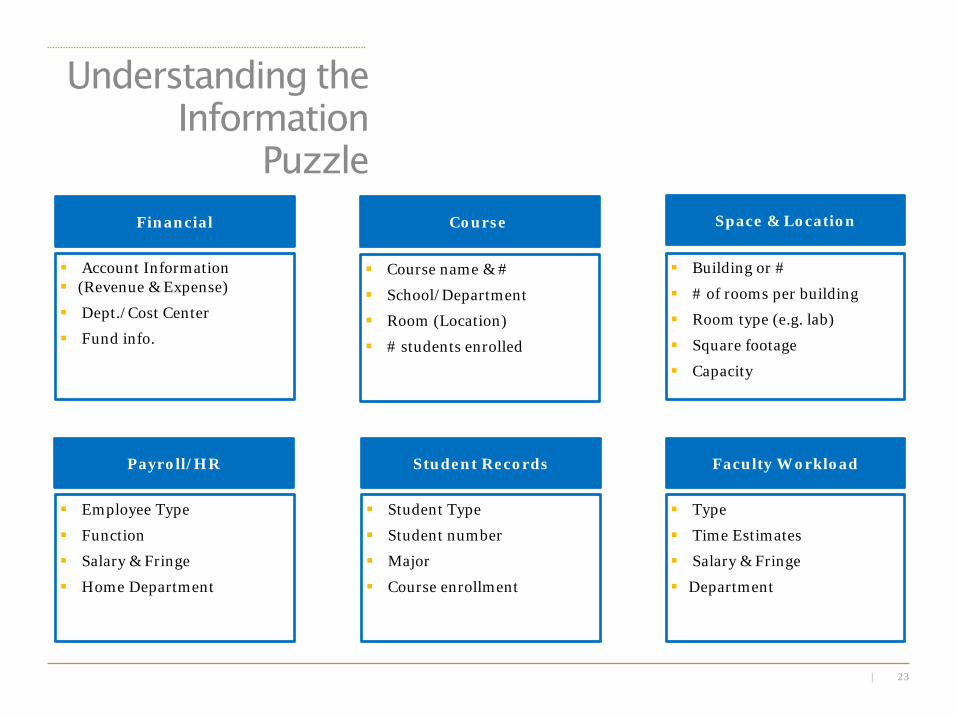
23 |
Course
Course name & #
School/Department
Room (Location)
# students enrolled
Space & Location
Building or #
# of rooms per building
Room type (e.g. lab)
Square footage
Capacity
Payroll/HR
Employee Type
Function
Salary & Fringe
Home Department
Student Records
Student Type
Student number
Major
Course enrollment
Faculty Workload
Type
Time Estimates
Salary & Fringe
Department
Financial
Account Information (Revenue & Expense)
Dept./Cost Center
Fund info.
Understanding the Information
Puzzle
24 |
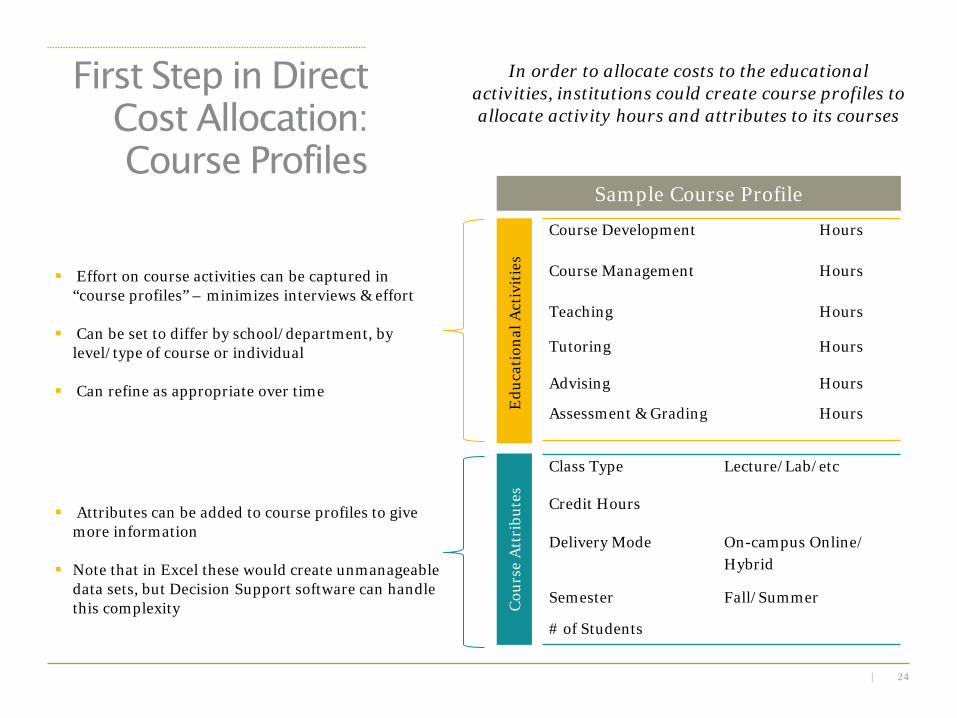
Course Development Hours
Course Management Hours
Teaching Hours
Tutoring Hours
Advising Hours
Assessment & Grading Hours
Class Type Lecture/Lab/etc
Credit Hours
Delivery Mode On-campus Online/ Hybrid
Semester Fall/Summer
# of Students
Edu
cati
onal
Act
ivit
ies
C
ours
e A
ttri
bute
s
In order to allocate costs to the educational activities, institutions could create course profiles to allocate activity hours and attributes to its courses
Attributes can be added to course profiles to give more information
Note that in Excel these would create unmanageable data sets, but Decision Support software can handle this complexity
Effort on course activities can be captured in “course profiles” – minimizes interviews & effort
Can be set to differ by school/department, by level/type of course or individual
Can refine as appropriate over time
First Step in Direct Cost Allocation: Course Profiles
Sample Course Profile
25 |
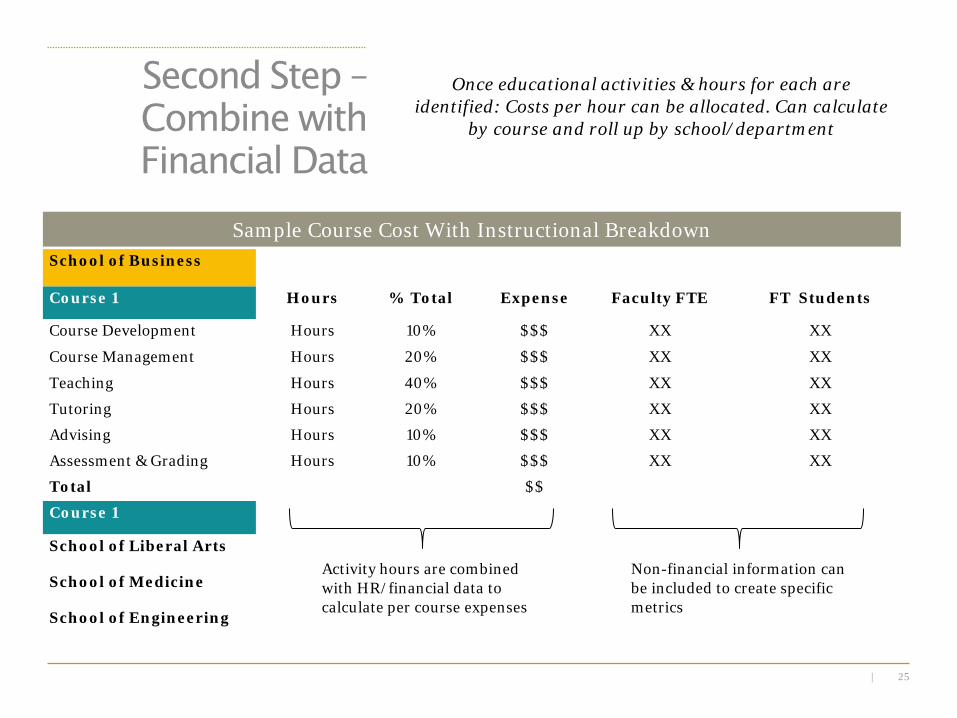
School of Business
Course 1 Hours % Total Expense Faculty FTE FT Students
Course Development Hours 10% $$$ XX XX
Course Management Hours 20% $$$ XX XX
Teaching Hours 40% $$$ XX XX
Tutoring Hours 20% $$$ XX XX
Advising Hours 10% $$$ XX XX
Assessment & Grading Hours 10% $$$ XX XX
Total $$
Course 1
School of Liberal Arts
School of Medicine
School of Engineering
Second Step – Combine with Financial Data
Activity hours are combined with HR/financial data to calculate per course expenses
Non-financial information can be included to create specific metrics
Sample Course Cost With Instructional Breakdown
Once educational activities & hours for each are identified: Costs per hour can be allocated. Can calculate
by course and roll up by school/department
26 |
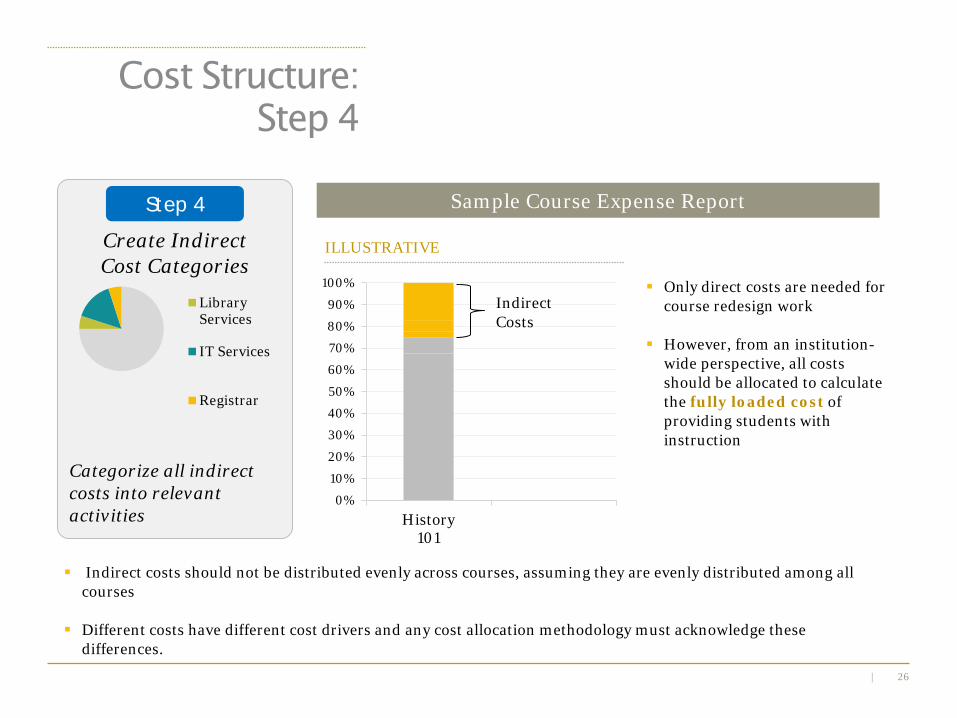
Indirect costs should not be distributed evenly across courses, assuming they are evenly distributed among all courses
Different costs have different cost drivers and any cost allocation methodology must acknowledge these differences.
Step 4
Categorize all indirect costs into relevant activities
Create Indirect Cost Categories
LibraryServices
IT Services
Registrar
Cost Structure: Step 4
0%
10%
20%
30%
40%
50%
60%
70%
80%
90%
100%
History101
Indirect Costs
Only direct costs are needed for course redesign work
However, from an institution-wide perspective, all costs should be allocated to calculate the fully loaded cost of providing students with instruction
Sample Course Expense Report
ILLUSTRATIVE
27 |
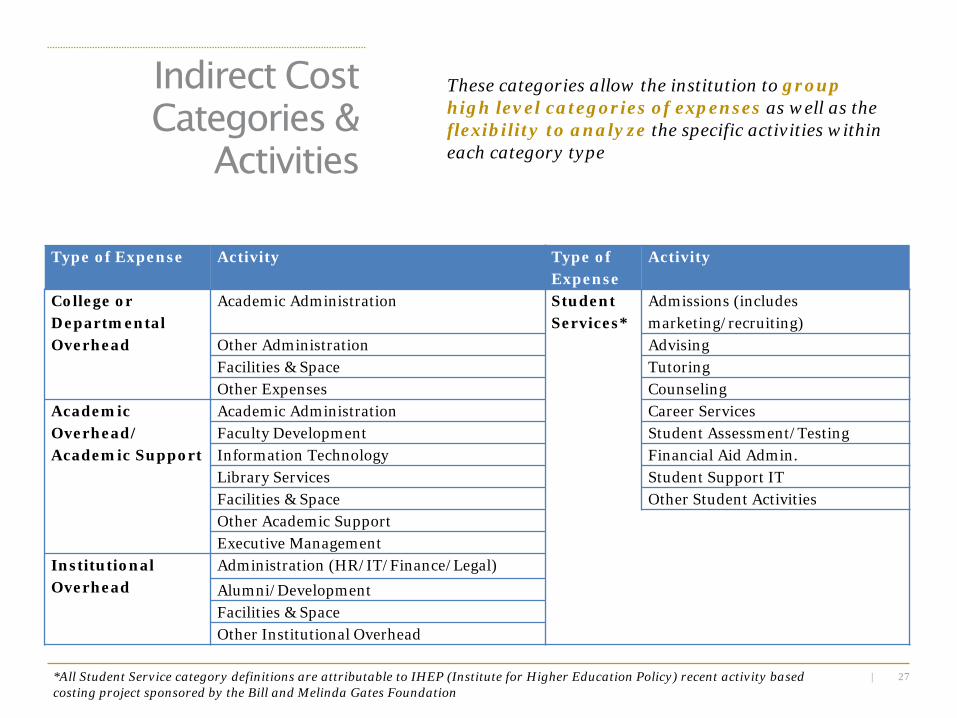
Type of Expense Activity Type of Expense
Activity
College or Departmental Overhead
Academic Administration Student Services*
Admissions (includes marketing/recruiting)
Other Administration Advising Facilities & Space Tutoring Other Expenses Counseling
Academic Overhead/ Academic Support
Academic Administration Career Services Faculty Development Student Assessment/Testing Information Technology Financial Aid Admin. Library Services Student Support IT Facilities & Space Other Student Activities Other Academic Support Executive Management
Institutional Overhead
Administration (HR/IT/Finance/Legal)
Alumni/Development Facilities & Space Other Institutional Overhead
*All Student Service category definitions are attributable to IHEP (Institute for Higher Education Policy) recent activity based costing project sponsored by the Bill and Melinda Gates Foundation
These categories allow the institution to group high level categories of expenses as well as the flexibility to analyze the specific activities within each category type
Indirect Cost Categories &
Activities
28 |
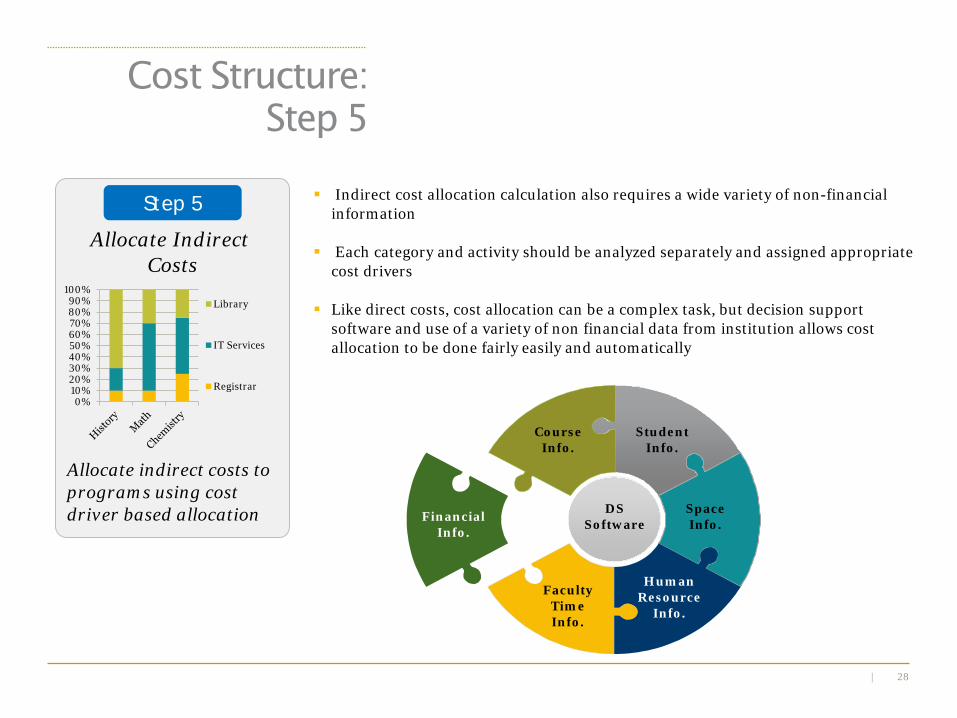
Step 5
Allocate indirect costs to programs using cost driver based allocation
Allocate Indirect Costs
0%10%20%30%40%50%60%70%80%90%
100%Library
IT Services
Registrar
Indirect cost allocation calculation also requires a wide variety of non-financial information
Each category and activity should be analyzed separately and assigned appropriate cost drivers
Like direct costs, cost allocation can be a complex task, but decision support software and use of a variety of non financial data from institution allows cost allocation to be done fairly easily and automatically
DS Software
Course Info.
Student Info.
Space Info.
Human Resource
Info.
Faculty Time Info.
Financial Info.
Cost Structure: Step 5
29 |
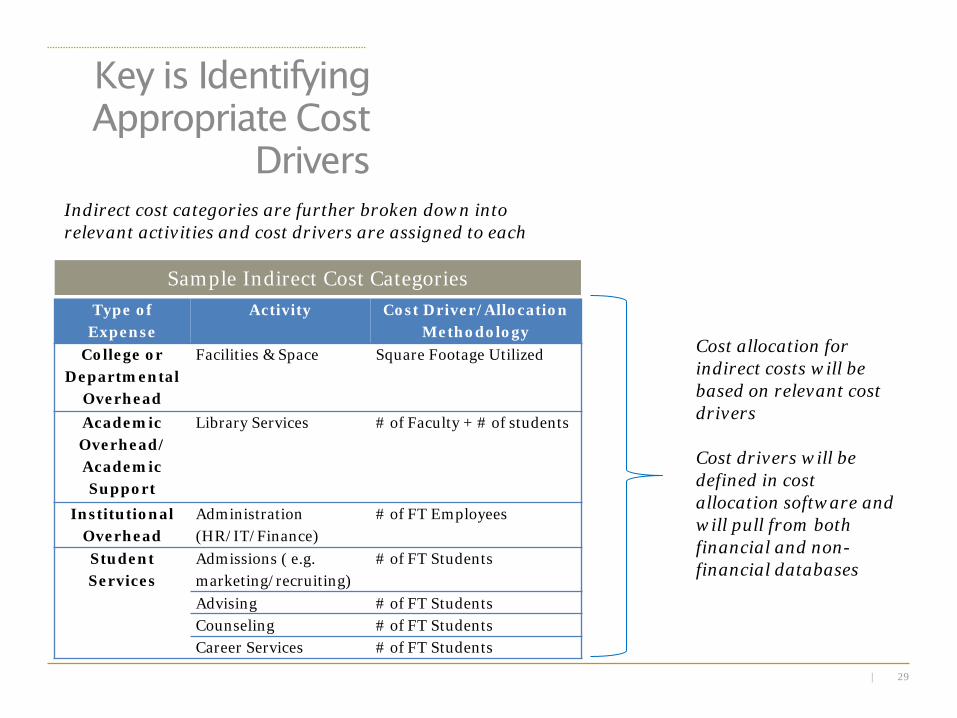
Key is Identifying Appropriate Cost
Drivers
Type of Expense
Activity Cost Driver/Allocation Methodology
College or Departmental
Overhead
Facilities & Space Square Footage Utilized
Academic Overhead/ Academic Support
Library Services # of Faculty + # of students
Institutional Overhead
Administration (HR/IT/Finance)
# of FT Employees
Student Services
Admissions ( e.g. marketing/recruiting)
# of FT Students
Advising # of FT Students Counseling # of FT Students Career Services # of FT Students
Sample Indirect Cost Categories
Cost allocation for indirect costs will be based on relevant cost drivers
Cost drivers will be defined in cost allocation software and will pull from both financial and non-financial databases
Indirect cost categories are further broken down into relevant activities and cost drivers are assigned to each
30 |
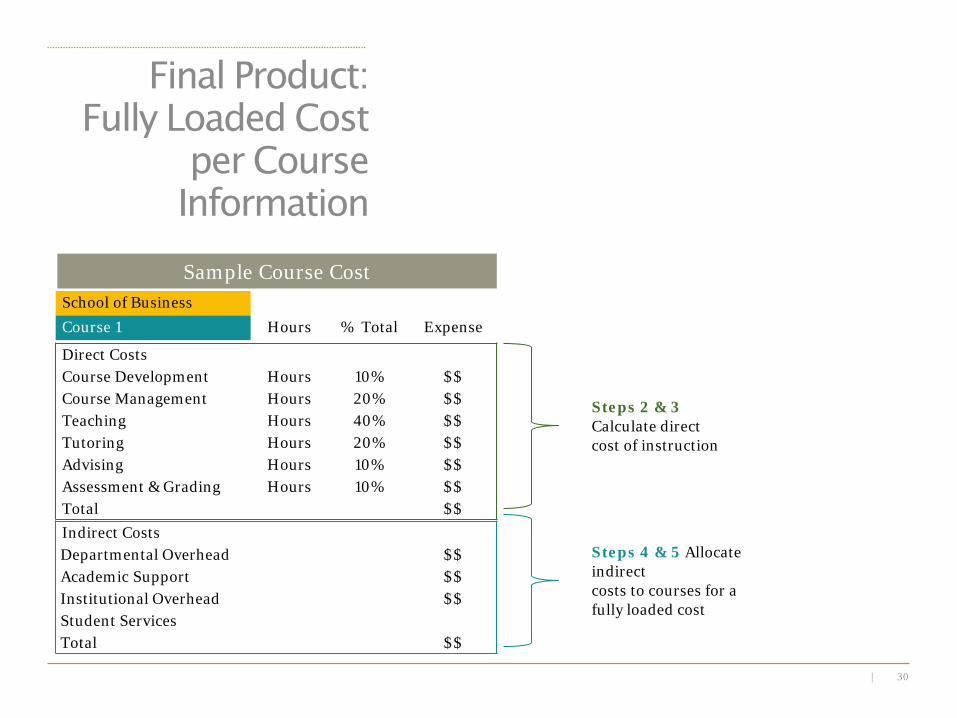
Direct Costs Course Development Hours 10% $$ Course Management Hours 20% $$ Teaching Hours 40% $$ Tutoring Hours 20% $$ Advising Hours 10% $$ Assessment & Grading Hours 10% $$ Total $$
Steps 4 & 5 Allocate indirect costs to courses for a fully loaded cost
Steps 2 & 3 Calculate direct cost of instruction
Final Product: Fully Loaded Cost
per Course Information
Indirect Costs Departmental Overhead $$ Academic Support $$ Institutional Overhead $$ Student Services Total $$
School of Business Course 1 Hours % Total Expense
Sample Course Cost


