
ABBREVIATIONS 9 MAP OF SAMPLED STATES 10 ...planningcommission.nic.in/reports/sereport/ser/stdy...MP...
167
STUDY OF PRESENT STATUS AND UTILIZATION OF LAND ALLOTTED TO THE SC FAMILIES AND ITS IMPACT IN ANDHRA PRADESH, GUJARAT, MADHYA PRADESH, UTTAR PRADESH AND WEST BENGAL PLANNING COMMISSION Government of India H HA AR RY YA AL LI I C CE EN NT TR RE E F FO OR R R RU UR RA AL L D DE EV VE EL LO OP PM ME EN NT T 32/11, Zakir Nagar (West), New Delhi-25 Phone: 011-26988387 and 9810109467 July 2009
Transcript of ABBREVIATIONS 9 MAP OF SAMPLED STATES 10 ...planningcommission.nic.in/reports/sereport/ser/stdy...MP...
SSTTUUDDYY OOFF PPRREESSEENNTT SSTTAATTUUSS AANNDD UUTTIILLIIZZAATTIIOONN OOFF LLAANNDD AALLLLOOTTTTEEDD TTOO TTHHEE SSCC FFAAMMIILLIIEESS AANNDD IITTSS IIMMPPAACCTT IINN AANNDDHHRRAA PPRRAADDEESSHH,, GGUUJJAARRAATT,,
MMAADDHHYYAA PPRRAADDEESSHH,, UUTTTTAARR PPRRAADDEESSHH AANNDD WWEESSTT BBEENNGGAALL
PPLLAANNNNIINNGG CCOOMMMMIISSSSIIOONN
Government of India
HHAARRYYAALLII CCEENNTTRREE FFOORR RRUURRAALL DDEEVVEELLOOPPMMEENNTT
32/11, Zakir Nagar (West), New Delhi-25 Phone: 011-26988387 and 9810109467
July 2009
HARYALI
2
PREFACE 7
ABBREVIATIONS 9
MAP OF SAMPLED STATES 10
1 EXECUTIVE SUMMARY 16
2 INTRODUCTION 31
3 OBJECTIVES & METHODOLOGY 41
4 FINDINGS 48
5 OPINION SURVEY OF SC NON-BENEFICIARIES 107
6 OPINION SURVEY OF THE OFFICIALS AND COMMUNITY
LEADERS 121
7 CONCLUSION AND RECOMMENDATIONS 125
HARYALI
3
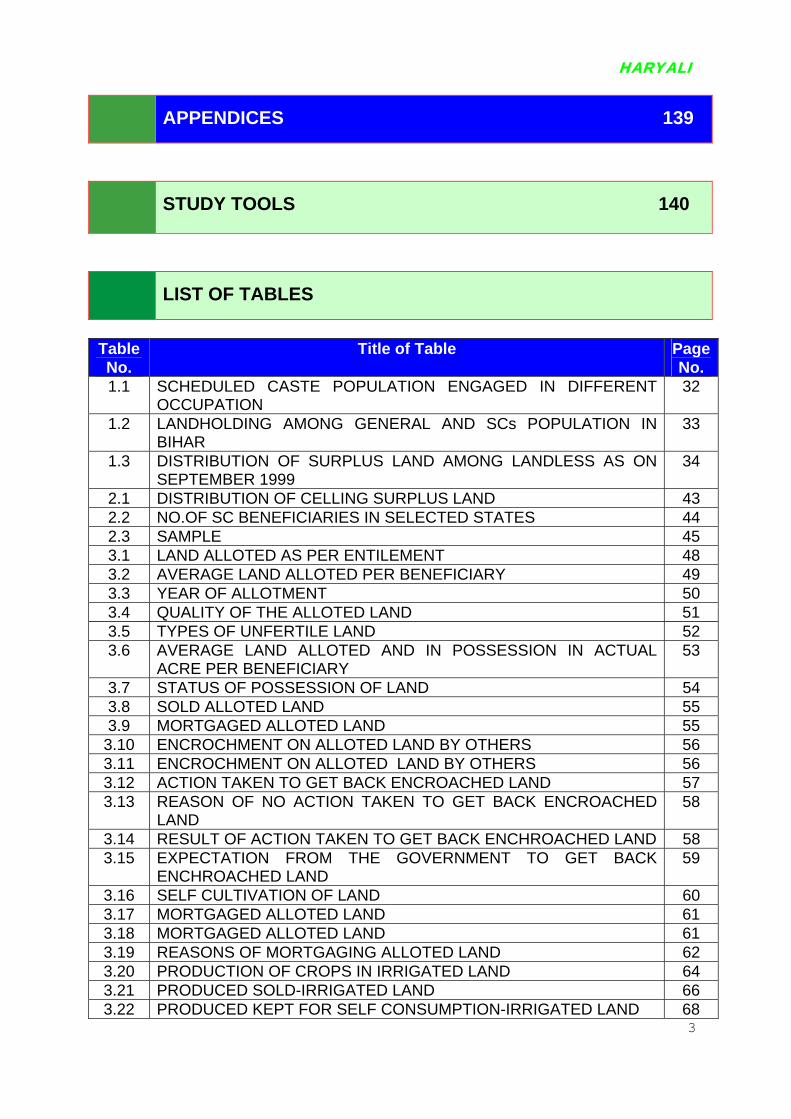
APPENDICES 139
STUDY TOOLS 140
LIST OF TABLES
Table No.
Title of Table Page No.
1.1 SCHEDULED CASTE POPULATION ENGAGED IN DIFFERENT OCCUPATION
32
1.2 LANDHOLDING AMONG GENERAL AND SCs POPULATION IN BIHAR
33
1.3 DISTRIBUTION OF SURPLUS LAND AMONG LANDLESS AS ON SEPTEMBER 1999
34
2.1 DISTRIBUTION OF CELLING SURPLUS LAND 43 2.2 NO.OF SC BENEFICIARIES IN SELECTED STATES 44 2.3 SAMPLE 45 3.1 LAND ALLOTED AS PER ENTILEMENT 48 3.2 AVERAGE LAND ALLOTED PER BENEFICIARY 49 3.3 YEAR OF ALLOTMENT 50 3.4 QUALITY OF THE ALLOTED LAND 51 3.5 TYPES OF UNFERTILE LAND 52 3.6 AVERAGE LAND ALLOTED AND IN POSSESSION IN ACTUAL
ACRE PER BENEFICIARY 53
3.7 STATUS OF POSSESSION OF LAND 54 3.8 SOLD ALLOTED LAND 55 3.9 MORTGAGED ALLOTED LAND 55 3.10 ENCROCHMENT ON ALLOTED LAND BY OTHERS 56 3.11 ENCROCHMENT ON ALLOTED LAND BY OTHERS 56 3.12 ACTION TAKEN TO GET BACK ENCROACHED LAND 57 3.13 REASON OF NO ACTION TAKEN TO GET BACK ENCROACHED
LAND 58
3.14 RESULT OF ACTION TAKEN TO GET BACK ENCHROACHED LAND 58 3.15 EXPECTATION FROM THE GOVERNMENT TO GET BACK
ENCHROACHED LAND 59
3.16 SELF CULTIVATION OF LAND 60 3.17 MORTGAGED ALLOTED LAND 61 3.18 MORTGAGED ALLOTED LAND 61 3.19 REASONS OF MORTGAGING ALLOTED LAND 62 3.20 PRODUCTION OF CROPS IN IRRIGATED LAND 64 3.21 PRODUCED SOLD-IRRIGATED LAND 66 3.22 PRODUCED KEPT FOR SELF CONSUMPTION-IRRIGATED LAND 68

HARYALI
4
3.23 PRODUCTION OF CROPS IN UN-IRRIGATED LAND 70 3.24 PRODUCED SOLD UN-IRRIGATED LAND 72 3.25 PRODUCED KEPT FOR SELF CONSUMPTION UN-IRRIGATED
LAND 74
3.26 LAND IS FERTILED 78 3.27 LAND IS NOT LEVELLED 80 3.28 WASTELAND & FULL OF STONE LAND 80 3.29 LACK OF IRRIGATION FACILITY 80 3.30 ELECTRICITY PROBLEMS 81 3.31 LACK OF ANIMALS TO FARM THE LAND 81 3.32 NON AVAILIBILITY OF TRACTOR/ANIMALS FOR PLOUGHING ON
TIME 82
3.33 FINANCIAL PROBLEM 82 3.34 LACK OF RESOURCES FOR BUYING TRACTORS 83 3.35 LACK OF RESOURCES FOR BUYING BETTER SEED 84 3.36 LACK OF RESOURCES FOR BUYING FERTILIZER 84 3.37 LACK OF RESOURCES FOR BUYING INSECTISIDE 84 3.38 LACK OF RESOURCES FOR TO ENGAGED LABOUR ON WAGES 85 3.39 USE OF AGRICULTURAL EQUIPMENTS 85 3.40 HIRING AGRICULTURAL EQUIPMENTS TRACTOR /HARROW
/CULTIVATOR 86
3.41 HIRING ANIMALS FOR PLOUGHING 86 3.42 MAIN SOURCE OF IRRIGATION 87 3.43 HIRED OR OWN PUMPSET 88 3.44 AVERAGE EXPENSES INCURRED TO IMPROVE THE QUALITY OF
THE UNFERTILE LAND 88
3.45 EEFORTS TO IMPROVED THE QUALITY OF THE UNFERTILED LAND
89
3.46 TRY TO GET LOAN TO IMPROVED THE CULTIVATION 90 3.47 SOURCE OF LOAN TAKEN 90 3.48 INTEREST RATE OF LOAN TAKEN 91 3.49 AWARNESS ABOUT NSFDC 91 3.50 TAKEN LOAN FROM NSFDC 92 3.51 TAKEN LOAN UNDER THE SCHEMES 93 3.52 RESPONDENTS BY SEX 94 3.53 MAIN OCCUPATION OF THE RESPONDENTS 94 3.54 RESPONDENTS BY EDUCATION 95 3.55 MONTHLY TOTAL FAMILY INCOME OF THE RESPONDENTS 96 3.56 MONYHLY AVERAGE FAMILY INCOME OF THE RESPONDENTS 97 3.57 CHILDREN ADMITTED TO GOOD SCHOOL 98 3.58 BETTER/MORE CONSUMPTION OF FOOD 99 3.59 BETTER CLOTHING 99 3.60 MORE EXPENSE ON SOCIAL FUNCTIONS 100 3.61 MORE PROMINENT ROLE IN VILLAGE POLITICAL LIFE 100 3.62 BETTER SPOUSE IN MARRIAGE 101 3.63 AVAIL HEALTH FACILITIES 101 3.64 GAIN RESPECT IN THE VILLAGE 102 3.65 BETTER HOUSING 103

HARYALI
5
3.66 BETTER ACCESS TO ELECTRICITY 103 3.67 HIGHER INCOME THAN BEFORE 104 3.68 OWN OR BETTER SOURCE OF DRINKING 104 3.69 BETTER HOUSEHOLD EXPENTITURE 105 3.70 NO NEED TO BORROW FROM MONEY LENDER ALL LOANS 105 3.71 EXPANDED OCCUPATION ACTIVITIES 106 4.1 RESPONDENTS BY SEX 108 4.2 RESPONDENTS BY EDUCATION 108 4.3 MAIN OCCUPATION OF THE RESPONDENTS 109 4.4 RESPONDENTS TOTAL FAMILY MONTHLY INCOME 109 4.5 HAVING OWN LAND 110 4.6 AVERAGE OWN LAND PER NON BENEFICIARY 111 4.7 NON BENEFICIARIES WERE ELIGIBLE TO GET ALLOTED LAND 112 4.8 REASONS FOR LAND NOT GETTING THE LAND ALLOTMENT 113 4.9 MADE EFFORTS TO GET ALLOTMENT OF LAND 114 4.10 TYPES OF EFFORTS MADE 114 4.11 REASONS FOR NOT MAKING EFFORTS TO GET ALLOTMENT OF
LAND 115
4.12 BETTER STANDARD OF LIVING 116 4.13 AWARENESS ABOUT NSFDC AMONG RESPONDENTS 117 4.14 AVAILED OF ANY SCHEME OR LOAN FROM THE NSFDC 117 4.15 PURPOSE OF LOAN TAKEN 118 4.16 AMOUNT OF LOAN TAKEN 119 4.17 AVERAGE AMOUNT OF LOAN TAKEN 119 4.18 PAYING INSTALLMENT ON TIME 120 5.1 UTILIZATION OF ALLOTED LAND TO THE SC FAMILIES 122 5.2 TYPE OF ALLOTED LAND 122 5.3 TYPE OF UNFERTILE LAND ALLOTED 123 5.4 SUGGESTIONS TO IMPROVED THE QUALITY LAND 123 5.5 SUGGESTIONS TO INCREASE THE PRODUCTION AND INCOME 124

HARYALI
6
LIST OF FIGURES
Table No.
Title of Figure Page No.
1 ENTILEMENT AND ACTUAL ALLOTMENT OF LAND 48 2 IRRIGATED AND UN-IRRIGATED LAND ALLOTED 50 3 BENEFICIARIES RECEIVED FERTILE AND UN-FERTILE LAND 51 4 LAND ALLOTED AND IN POSSESSION 53 5 STATUS OF POSSESSION OF LAND 54 6 ENCROCHMENT LAND BY OTHERS 56 7 CUTIVATION OF LAND 60 8 PROBLEM FACED IN UTILIZING THE LAND 79 9 LACK OF RESOURCES 83
10 AWARENESS ABOUT NSFDC 92 11 RESPONDENTS BY EDUCATION 95 12 AVERAGE MONTHLY FAMILY INCOME 97 13 IMPACT ON SOCIAL STATUS 102 14 IMPACT ON ECONOMIC STATUS 106 15 HAVING OWN LAND 110 16 NON- BENEFICIARIES WEE ELIGIBLE TO GET LAND 112

HARYALI
7
The scheduled caste population constitutes almost 16.5% of the country’s population. Most of them live below the poverty line. Their economic and educational status is very poor and most often, they work as unskilled labourers. In view of the gravity of the problem, in the post-Independence period, land-ceiling laws were promulgated and the land, thus rendered surplus, was sought to be distributed among the landless, mostly belonging to scheduled castes. However, many states were somewhat sluggish in implementing these laws. Further, subterfuge on the part of large landowners and landlords also played its part. This is what impelled the sarvodaya leader, Acharya Vinoba Bave, to initiate Bhudan movement. Some of landowners, particularly large landowners, voluntarily donated land for distribution among the landless. The movement was quite a success. Besides, beginning with the Second Five-Year Plan, Government has launched a programme for the reclamation of waste and saline land for distribution among the landless. It was found that most of the SC beneficiaries did not receive fertile land and also they are not in position to make it fertile due to lack of resources. The productivity of crops grown is also very low. It was also observed that allotted land was given on contract or for share cropping by the SC beneficiaries. The main purpose of the study is to understand the present status of the land allotted to the SC families, its utilization and its impact on their living conditions and problems faced by them in cultivation. What types of measures can be taken to increase productivity of land and income of these beneficiaries by proper utilizing the allotted land? The findings of this study will give practical suggestions to prepare an action plan to improve the quality of land, productivity of crops grown on the allotted land and increase income of the beneficiaries. The study was undertaken in Andhra Pradesh, Gujarat, Madhya Pradesh, Uttar Pradesh and West Bengal during October 2008 to June 2009. The draft report was submitted in the month of June 2009 and final report was submitted in the month of July 2009 to the Planning Commission. We are grateful to Mrs. Sudha P. Rao, Adviser (SER Division) for providing us the opportunity to conduct this study and inputs to improve the quality of the report, Mr. S. Mukherjee, Deputy Secretary, (SER Division) and particularly Shri B.S. Rathor, Senior Research Officer (SER Division) for his valuable guidance.

HARYALI
8
We are also grateful to Shri Mushtaq Ahmed, Former Advisor UNESCO to the Government of Nigeria and Zambia and Chairman of Core Group for Evaluation of Adult Education Programmes, Government of India, for his contribution to the study. He guided the study at each and every step. Without his participation the study would not have been completed satisfactorily. We are thankful to Prof. MZ Khan, Former Dean, Faculty of Social Sciences and former Head, Dept. of Social Work, Jamia Millia Islamia, New Delhi, for his contribution to the study. He has provided guidance and encouragement throughout its implementation. We are equally indebted to Mr. Gopi Nath who has given us time and support in spite of his extremely busy schedule. His inputs have greatly helped and enriched the study in more than one way. We are thankful to Dr. Omveer Tyagi who has given us technical support. He has provided guidance and encouragement throughout its implementation. We would also like to thank Ms. Hem Borker for her editorial inputs and support in putting together the report. We would personally like to thank our Research Team members particularly Shri. S.A. Malik, Shri. Mahesh Kumar, Shri Brijesh Kumar, Shri Ashok Kumar, Shri Sanjay Panday, Shri Mohan Lal, Shri Taufeeq Ahmed, Shri Mohd. Owais, Ms. Nida Akhlaque, Ms. Laishram Bina, Ms. Ziya Shakeel and other team members who have helped in completing the study. Without their hard work, this study would not have seen the light of the day. The study would have been difficult to complete without the help and cooperation of the District Officials, Stakeholders, PRI Members and the respondents, who have facilitated data collection. We thank all of them earnestly. Mohammad Yusuf Executive Director HARYALI Centre for Rural Development July 2009 32/11, Zakir Nagar (West), New Delhi-25 Phone: 26988387 & 9810109467 Email: [email protected] and [email protected] Website: www.haryali.org.in

HARYALI
9
ABBREVIATIONS
AP ANDHRA PRADESH BDO BLOCK DEVELOPMENT OFFICER AEO AGRICULTURE EXTENSION OFFICERS DRDA DISTRICT RURAL DEVELOPMENT AGENCY DSWO DISTRICT SOCIAL WELFARE OFFICERS GP GRAM PANCHAYAT GOI GOVERNMENT OF INDIA JRY JAWAHAR ROZGAR YOJANA MLC MASS LITERACY CAMPAIGN MP MADHYA PRADESH MSJE MINISRTY OF SOCIAL JUSTICE AND EMPOWERMENT MRD MINISTRY OF RURAL DEVELOPMENT NSFDC NATIONAL SCHEDULED CASTE FINANCE DEVELOPMENT COPORATION NREP NATIONAL RURAL EMPLOYMENT PROGRAMME NSSO NATIONAL SAMPLE SURVEY ORGANISATION NSI NATIONAL SOCIAL INSTITUTE NGO NON GOVERNMENT ORGANISATION PCL PLANNING COMMISSION LIBRARY PC PLANNING COMMISSION SCDC SCHEDULED CASTE DEVELOPMENT COPORATION SC SCHEDULED CASTE UNESCO UNITED NATIONS EDUCATIONAL, SCIENTIFICAL AND CULTURAL ORGANISATION UP UTTAR PRADESH WB WEST BENGAL

HARYALI
10
MAP OF SELECTED STATES

HARYALI
11
MAP OF ANDHRA PRADESH

HARYALI
12
MAP OF GUJARAT

HARYALI
13
MAP OF MADHYA PRADESH

HARYALI
14
MAP OF UTTAR PRADESH
HARYALI
15
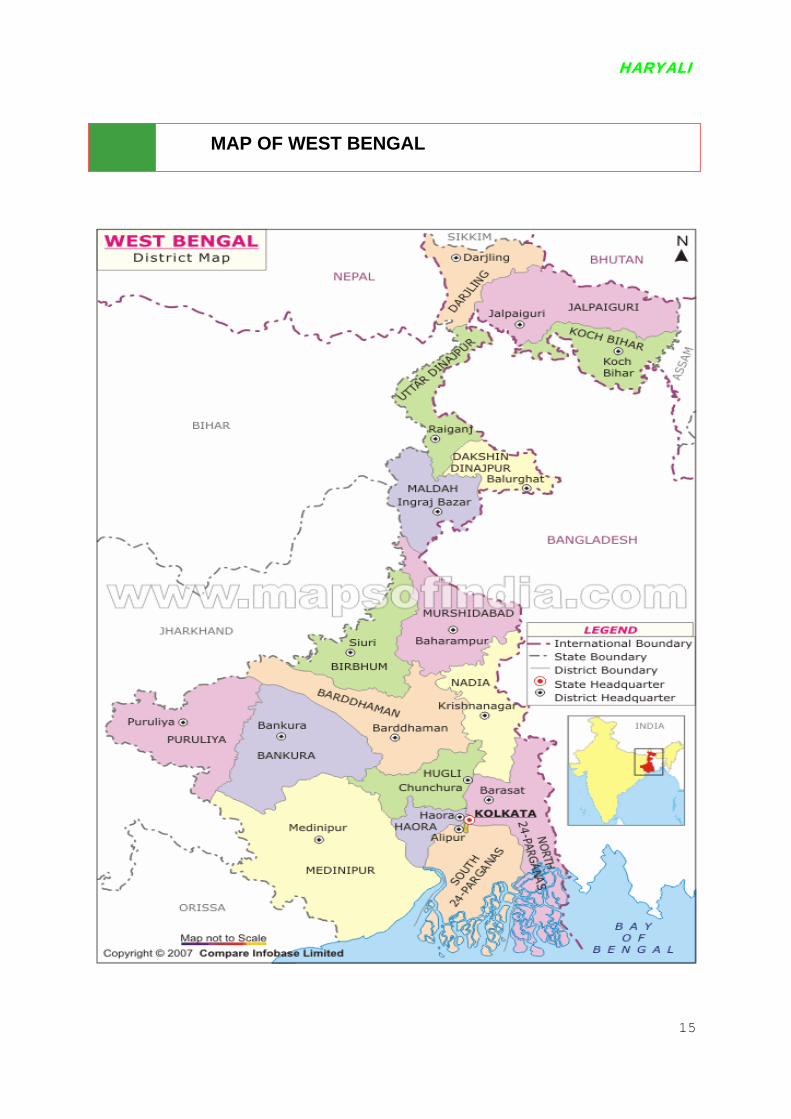
MAP OF WEST BENGAL

HARYALI
16
CHAPTER 1 EXECUTIVE SUMMARY
11.. IINNTTRROODDUUCCTTIIOONN
.1 The scheduled caste population constitutes almost 16.5% of the country’s
Agriculture or cultivation in India is one of the primary modes of production and,
was found that most of the SC beneficiaries did not receive fertile land and also they
are not in position to make it fertile due to lack of resources. The productivity of crops
1
population. Most of them live below the poverty line. Their economic and edu
cational status is very poor and most often, they work as unskilled labourers. In view
of the gravity of the problem, in the post-Independence period, land-ceiling laws
were promulgated and the land, thus rendered surplus, was sought to be distributed
among the landless, mostly belonging to scheduled castes. However, many states
were somewhat sluggish in implementing these laws. Further, subterfuge on the
part of large landowners and landlords also played its part. This is what impelled the
sarvodaya leader, Acharya Vinoba Bave, to initiate Bhudan movement. Some of
landowners, particularly large landowners, voluntarily donated land for distribution
among the landless. The movement was quite a success. Besides, beginning with
the Second Five-Year Plan, Government has launched a programme for the
reclamation of waste and saline land for distribution among the landless.
1.2
hence, primary occupation. Earlier, nearly all the population lived in villages and
directly or indirectly took to agriculture or agro-related work. Around 10 percent of
SC persons in rural area are, directly or indirectly, dependent on agriculture and
nearly 22 percent work as agricultural labourers. Even those who till their own land
have but small, uneconomical, landholdings. While the proportion of SC household’s
wholly dependent on land is smaller than those of non-SC households, their average
land holding is only 0.89 acres, as against 1.90 acres for non-SC households.
Apparently, Non-SC’s are much better off than SCs as far as land holding is
concerned. In addition, agricultural labourers rarely have regular work. They have
to contend with seasonal work. This is what underlines the problem of landless and
marginal farmers among the scheduled castes.
It

HARYALI
17
grown is also very low. It was also observed that allotted land was given on contract or
for share cropping by the SC beneficiaries.
1.3 The main purpose of the study is to understand the present status of the land
llotted to the SC families, its utilization and its impact on their living conditions and
was undertaken in Andhra Pradesh, Gujarat, Madhya Pradesh, Uttar
radesh and West Bengal during October 2008 to June 2009.
o prepare an action
lan to improve the quality of land, productivity of crops grown on the allotted land
a
problems faced by them in cultivation. What types of measures can be taken to
increase productivity of land and income of these beneficiaries by proper utilizing the
allotted land?
1.4 The study
P
1.5 The findings of this study will give practical suggestions t
p
and increase income of the beneficiaries.
22.. OOBBJJEECCTTIIVVEESS
e quantity and quality of land allotted to the SC families
.2 To find out the status of possession of land allotted to the beneficiaries and
ilies
2.1 To assess th
2
encroachment by other people, if any
2.3 To find out whether cultivation of land is done by themselves or given on
contract or share basis
2.4 To find out the utilization of land, including crop grown, productivity of crops
and income
2.5 To assess the problems faced by the beneficiaries in proper utilization of land
allotted to them
2.6 To study the impact of land allotment on the socio-economic status of the
beneficiaries’ fam
2.7 To suggest ways and mean of proper utilization of land to increase their
income
33.. MMEETTHHOODDOOLLOOGGYY

HARYALI
18
3.1 The Universe of th s e tudy comprises of the SC beneficiary families to whom
e land was allotted in the selected villages.
three states namely Andhra Pradesh,
ttar Pradesh and West Bengal having high proportion of SC beneficiaries were
proposed to divide all the districts of selected states into two strata.
tratum 1 - those districts that as per the 2001 census, had 20 percent or more
cheduled Caste Development Corporation
as also obtained from the concerned department and available beneficiaries of
th
3.2 When the study was originally conceived
U
selected. On the basis of the suggestion by the Planning Commission, two more
states of Western and Central part of India i.e. Gujarat and Madhya Pradesh were
also included in the study to get an all India picture of the status of land allotted to
SC families.
3.3 It was
S
scheduled caste population, and stratum 2 - those districts that had less than 20
percent SC population. Within each stratum, one district was randomly selected. In
each district two blocks having high SC population and within each block, five
villages with high SC population were selected. For selecting the households, a list
of SC beneficiaries who were allotted land in selected villages was obtained from the
Tehsil, BDO and Gram Panchayat Pradhan. From the household list of villages, a fix
number of 25 SC beneficiaries’ households from each village were selected by using
systematic random sampling procedure.
3.4 In addition, a list of beneficiaries of S
w
SCDC were interviewed in each selected village. In addition, 5 SC non-beneficiaries
from each selected villages were interviewed to find out the reasons for not allotting
land to them. Total 2,501 SC beneficiaries and 498 SC non-beneficiaries were
interviewed. Incorporating all the data and their analysis, a detailed report was
prepared and submitted to the sponsor.
44.. FFIINNDDIINNGGSS

HARYALI
19
4.1 Land allott ed per entitlement - Access to land plays a significant role in
proving the living standard of the SC’s in Rural India. It was due to this very
lotted under redistributive land reforms and other programmes to the SC’s
as quite satisfactory. 91% of the families got the land they were entitled to. In this
of Possession of Land - Interviews with the respondents pointed to a
iscrepancy between the land allotted to the respondents and the land in their actual
• % possessed less than allotted
ficiary - According to a rough estimate 3-4
cres of average type of land is required for a family of 5, just to pull along. On an
terestingly on an average Gujarat
allotted the highest amount of un-irrigated land also (1.8 acres), followed by Andhra
im
reason that redistribution of surplus land to the poor especially the SC’s was viewed
as central to land reforms and later programmes such as Bhoodan were conceived.
The ownership of land is the very basis of the ones position in the agrarian social
hierarchy.
The land al
w
respect Andhra Pradesh and Gujarat were the leading states, 100% families in both
the states got the land they were entitled to. West Bengal was behind all districts in
this respect.
4.2 Status
d
possession. On an average 2.3 acres was allotted but only 1 acre was in actual
possession of the respondents with the difference of 1.3 acres between allotment
and actual possession. It is very interesting to note that in terms of getting actual
possession of allotted land, it was only in Madhya Pradesh that the beneficiaries
could not get possession of land allotted to them. A very small number of the
beneficiaries had sold their land (only 0.5%) and only 1% had mortgaged them.
• 85% possessed the land allotted
7
• 8% could not get the possession
4.3 Average land allotted per bene
a
average, area of land allotted per SC beneficiary was 0.9 acres if it was irrigated and
1.4 acres incase un-irrigated land was allotted.
On an average Gujarat allotted the highest amount of irrigated land i.e. 2 acres
followed by Madhya Pradesh (1.1 acres). In

HARYALI
20
Pradesh (1.5 acres). Whether the land allotted was irrigated or not is highly critical
to understanding whether it is productive to make a difference to poor SC
households. It is quite informative to note how old is the story of land allotment to
SC families. The time range is 10 to 30 years. Around 33% of the land allotted was
between 10 to 30 years ago.
4.4 Quality of land allotted - Distribution of land to the SC’s is the first step
towards their emancipation. However if the quality of land is sub standard the very
urpose of allotting land gets defeated. The overall picture that emerged was that
Dalits is when the community attempts to assert their right to
sources especially land. A form of this atrocity is encroachment of the land of
court (64%).
, and
• 2% filed a complaint in SC/ST Tribunal
4.7 e main reason for no action was the
lack o ), 21% were afraid of the
p
74% of the land allotted was irrigated and fertile. However there were wide interstate
disparities. 97% and 92% of the land allotted in West Bengal and Uttar Pradesh
respectively was fertile and the least percent of fertile land given was by Gujarat and
Andhra Pradesh.
4.5 Encroachment of allotted land - One of the most common causes for
atrocities against
re
SC’s. In 11% of the cases the land of the beneficiaries was encroached by others.
Encroachment was concentrated in Madhya Pradesh and Uttar Pradesh. In Madhya
Pradesh 40% land was encroached upon and in Uttar Pradesh 14% land was
encroached. Average total land allotted per beneficiary was 2.29 acres, out of which
0.9 acre was encroached.
4.6 Action taken to get back the land - Largest number of Madhya Pradesh
allottees had filed cases in
• 11% did not take any action
• 50% filed cases in court
Reasons for not taking any action - Th
f money to meet the expenses of litigation (31%

HARYALI
21
consequences largely because those who encroached the land represented the
village elite and 8% had no knowledge of the processes.
4.8 Expectation from government to get back encroached land - In light of the
creasing awareness and assertion of the SC’s for their rights and the
assess whether the SC
milies to whom land was allotted were able to retain it and if they were able to
had mortgaged the land for the purpose of land
development that is to buy inputs for getting better crop. 41% had mortgaged it to be
.11 Utilization of land - This section aims to bring to light the productivity of
nd and the monetary benefits accruing to the SC recipients of the allotted land.
in
unresponsiveness of the institutional mechanisms available for SC’s it’s important to
understand the expectations of the respondents from the government. There were
two main expectations from the government - 82% were of the opinion that the
government should take steps to get back the encroached land, and 18% expected
the government to provided legal aid. The largest number of those who wanted
government to provide legal aid was in Uttar Pradesh (64%).
4.9 Who was cultivating the land - It is very important to
fa
make that significant shift towards self employed cultivators. It was found that 95%
of the families were cultivating the land themselves. 100% of the families in Andhra
Pradesh and Gujarat were self-cultivators. Sharecropping or leasing out the allotted
land was almost a non-existent practice. Similarly a very small percentage of the
families had mortgaged the land; only 1% had done so. The farmers had mortgaged
the land on are arrange for 5 years.
4.10 Reasons of Mortgaging - 6%
able to return loans taken. But unfortunately to main reason for mortgaging the land
was to fulfill social customs i.e. to meet the cost of marriage, rather than, improve
their economic condition. 100% farmers of Andhra Pradesh had fallen prey to this
custom, followed by Uttar Pradesh farmers. This clearly highlights the vicious hold
that certain social customs continue to have in rural society wherein the poor
continue to spend beyond their pocket falling into the debt trap.
4
la

HARYALI
22
This is a significant indicator of land utilization by the beneficiaries. A concerted
effort was made to understand the variation between irrigated and un-irrigated land.
COMPARISON OF CROP GROWN IN IRRIGATED AND UN-IRRIGATED LAND
D SI. VARIABLES
COMPARED IRRIGATED LAND UN IRRIGATED LAN
Crops grown Groundnut Grown in M.P., Gujarat,
A.P. M.P., Gujarat, A.P.
Paddy
All states except Gujarat Mustard- in A.P., .B.
M.P., W
1.
Pulses
All states except A.P., W.B.
Bajara- A.P., Gujarat, W.B.
2 ea sown (acre) Highest in Gujarat (945
on per state (434 cres)
ion per state (158 es)
Total ar Least in A.P. (204 acres)
acres) Average area under cultivatia cr
Least in W.B. (89.2 acres) Highest in Gujarat (1,550 acres) Average area under Cultivata
3 Total production
verage production per verage production per
Highest in Gujarat 8,285 quintals Least in A.P. 135 quintals Astate 3,964 quintals
Highest in Gujarat 1,550 quintals Least in U.P. 34 quintals Astate 889 quintals
4 Average production per acre
9 quintals per acre
4.6 quintals per acre
5 Average production per beneficiary
ranged from 5.1 to 11.3 uintals.
It ranged from 3 to 5 quintals per beneficiary. It was 5 quintals each in
Itq

HARYALI
23
The highest amount by Gujarat beneficiaries’ 11.3 uintals followed by W.B.,
quintals.
q104 quintals. Least amount was produced by M.P. beneficiaries 6.1 quintals, followed by A.P. beneficiaries 5.2 quintals. Overall average quintal per beneficiary 7.6 quintals
Gujarat, M.P. and W.B. and 3 quintals each in M.P. and U.P. Overall all average per beneficiary 4.2
6 Total quantity of grain sold arat
eneficiaries were able to
was 2,157 uintals.
was 10.25 uintals.
It ranged from 0 to 1,329 quintals. Gujarat farmers sold the highest amount
per state was 385 ntals.
y was 3.7 uintals.
It ranged from 523 quintals to 7,774 quintals; Gujbsell the largest amount of grain (7,774 quintals), whereas U.P. beneficiaries were able to sell only 523 quintals. Quantity sold per beneficiary ranged for 3 to 16 quintals, Gujarat beneficiaries sold an average of 16 quintals per beneficiary, whereas M.P. farmers were able to sell only 3 quintals. Overall average quantity sold per state
ui
q Average quantity sold per beneficiaryq
1,329 quintals followed by A.P. beneficiaries. Least amount sold was in U.P. where not a single quintal was sold by the beneficiaries followed by A.P. Overall average quantity sold q Average quantity sold per beneficiarq
7 Average annual income per beneficiaries
rage income per eneficiary was Rs.
11,963/- U.P. farmers were behind all, only Rs. 2,069/- per beneficiary. The average annual income per beneficiary was Rs. 7,796/-.
this case it was the M.P. beneficiaries, who were in lead, with an acre income of Rs. 5,965/-. There was no average income of U.P. beneficiaries as they did not sell any gain. The average annual income per beneficiary was Rs. 5,070/-
Again Gujarat was in the lead. Ave
In
b

HARYALI
24
Overall average
A.P. 5.4 quintals
Gujarat 1.0 quintals
M.P. 3.7quintals
U.P. 4.3 quintals
8 Average quantity kept for consumption per beneficiary
W.B. 6.4 quintals Overall 4.0 quintals
Overall average
A.P. 2.7 quintals
Gujarat 0.0 quintals
M.P. 7.3 quintals
U.P. 4.8 quintals
W.B. 5.3 quintals
Overall 3.0 quintals
4.12 ct
crops grown by the SC beneficia v
UP the Paddy productivity is re
productivity in SC families was n Similarly the In UP the
Wheat productivity is generally 1 h
SC families was noted to be mer
.13 Problems faced in the proper utilization of land - If the allotted land is to
ake a difference in the lives of the poor SC’s it is very significant that they should
nts mentioned this as the key
roblem. Some of the other problems cited were pertaining to the lack of facilities to
A Noteworthy trend that emerged was that the produ ivity of majority of the
ries was below the national a erage. For example In
generally 20-25 quintals/ac whereas the paddy
oted to be 11 quintals/acre.
8-20 quintals/acre whereas t e wheat productivity in
ely 8.5 quintals/acre.
4
m
be able to utilize it to the hilt. The fact that largely the land allotted to the SC’
constitutes marginal holdings severely limits the benefits that accrue to the SC’s.
Further they face several problems in utilizing the land. In 12 % of the cases the
land was not leveled. In 12% of the cases the land allotted was wasteland and full of
stone hence not productive without intensive land development.
Significantly in Madhya Pradesh 25% of the responde
p
plough the land. 77% of the respondents did not have animals to plough the land
and for other agricultural operations while 74% did not have tractors. The most
significant problem that emerged was that the while the SC’s had land they did not
have the finances improve land productive and make their small landholdings viable.
78% did not have enough money to procure facilities required to improve
productivity.

HARYALI
25
4.14 Types of efforts made for better utilization of land – Since most of the
respondents attributed the difficulty in utilization of land owing to lack of financial
resources, an attempt was made to find out the possibilities of supportive investment
assistance to make land productive. Out of 2,306 persons who had been allotted
land, only 36% made efforts to raise loan to improve the productivity. 43% of these
respondents tried taking a loan through Banks. Only 9% of the allotees owned their
own animals for ploughing the land. As high as 91% had to hire the animals for
ploughing their fields and almost all of the respondents had to hire agricultural
quipments, like tractor and harrow for cultivation. Average expenses incurred to
DC. As compared to other states only in Andhra
Pradesh the respondents displayed awareness about the corporation, as 50% of the
ge number of respondents perceived
e
improve the quality of unfertile land was Rs. 7,981/-. To make the land holdings
economically viable the beneficiaries had to incur significant expenditure. The
highest amount was incurred by the farmer of Uttar Pradesh (Rs. 9,267/-) followed
by Gujarat farmer (Rs. 8,921/-).
4.15 Effectiveness of the National Schedules Caste Finance Development
Corporation (NSCFDC) - National Scheduled Caste Finance Development
Corporation (NSCFDC) provides credit facilities to SC who are living below the
double poverty line. The main purpose of the corporation is to provide assistance to
SC to help them develop economically. But surprisingly, only 16% of the
respondents were even aware of its existence. Only 4% respondents in Madhya
Pradesh, 6% in Gujarat and 9% of the respondents in Uttar Pradesh and West
Bengal were aware of the NSCF
Andhra Pradesh respondents knew about it. Only 2% of the respondents had taken loan from NSCFDC. 98% did not avail any
facilities offered by the corporation. During the interaction the respondents pointed
out that the main reason was that they did not apply for it, as they were not aware of
the existence of NSCFDC.
4.16 Impact of land allotment on the Socio economic status of beneficiaries -
Ownership and control over land determine ones standing in the agrarian hierarchy.
Despite the fact that the land that the SC beneficiaries gained was largely sub-
marginal and the utilization below optimal lar

HARYALI
26
that the allotment of land had helped them in improving their living status , that is
they enjoyed better housing, the schooling of children was much better, have more
electricity and drinking water, they were eating better food and wearing better
clothes, were able to avail health facilities and play a more prominent role in village
olitical life, and so on. One interesting response was that it had helped them to get p
better spouse.
4.17 SC Non-beneficiaries though eligible to get land --
question. The main reasons given for non-allotment were:
• Land allotment was stopped by the government - 8% pointed to the fact
.18 66% made the effort to gain control over the land legitimately due to them but
cant to note that the process of
Poverty and unawareness were the
Out of the 498 non
beneficiaries’ interviewed, 80% of them were eligible, and only 20% were not eligible
to get the government allotted land. Almost all Andhra Pradesh respondents were
not eligible (97%). On the other hand only 1% of respondents of Gujarat, 2% of Uttar
Pradesh and 6% of West Bengal were not eligible.
Out of the 489 non-beneficiaries interviewed as high as 29% did not give any
response to the
• Officers did not pay attention - 28% of the respondents pointed to the
official apathy to the plight of the SC’s
• Did not know whom to approach – 18% of the respondents clearly stated
that though they knew that they were eligible to get the land they were not
aware of which authority to approach.
that the government policy of allotting land to SC’s had changed.
4
34% did not make any effort to get land allotted to them. 67% of the respondents
approached the village Panchayat. Its signifi
assertion of their rights over land often leads the SC’s to voice their concerns in
Panchayat; this indicates the Panchayati Raj institutions as a dispute redressal
mechanism enjoy the faith of the rural SC’s.
main reasons of lack of effort.

HARYALI
27
4.19 45% did not make any effort as they not have the money to meet the
expenses and 38% simply did not know whom to approach. 12% did not make any
effort, as they were not sure of the results. 261 concerned officials and community
leaders including village Pradhan were interviewed to find out their views on the
utilization of land by SC families, type of land allotted to them and their suggestions
to improve the quality of land.
Different suggestions were given by officials to improve the quality of land. Some of
the suggestions were as follows:
• Leveling the field - 29%
• Arrangement of irrigation - 23%
• Providing tractor and equipments - 17%
• Making boundaries -13%
44..2200 TTHHEE SSUUGGGGEESSTTIIOONNSS TTOO IIMMRROOVVEE PPRROODDUUCCTTIIOONN AANNDD IINNCCOOMMEE --
• 53% suggested that good seeds and fertilizer should be provided to them on
lities to be provided particularly were well.
ents should be provided to them.
be fenced.
subsidized basis.
• 21% suggested that irrigation faci
• 9% suggested tractors and other equipm
• 6% said that the field should
RECOMMENDATIONS
55.. RREECCOOMMMMEENNDDAATTIIOONNSS

HARYALI
28
5.1 91% of the families got the land they were entitled to however the amount of
nd allotted was 2. cres was in actual possession of the SC
beneficiaries. These sub-marginal holdings are not economically viable. It is critical
at the Government increases the allotment of land; the allotment should not be
imply in terms of acres but take into account the productivity of soil. There is also a
rency in allotment to prevent discrepancy between
llotment and actual possession. One measure for this is the updating of the land
nt can now be carried out by the Krishi Vigyan Kendra and accordingly
technical assistance given to the SC’s.
be allotted to, a member of a Scheduled Caste or a
cheduled Tribe or gets the land allotted to him transferred; wrongly dispossesses a
ember of a Scheduled Caste or a Scheduled Tribe from his land or premises or
terferes with the enjoyment of his rights over any land, premises or water, shall be
unishable with imprisonment for a term which shall not be less than six months but
la 3 acres of which only 1 a
th
s
need for increased transpa
a
records.
5.2 Before allotment an assessment of the quality of land should be made - how
much of it is wasteland or non utilizable in present form. On the basis of this
assessment it’s important that the process of allotment is integrated with land and
irrigation development assistance to the SC’s such as the Million Wells Scheme and
Land Development Scheme. For the land that has already been allotted, an
assessme
5.3 The government should take stern action against encroachment of land.
Encroaching upon one’s land and causing damage to one’s property is an offence
even under common law. The Scheduled Castes and Scheduled Tribes (Prevention
of Atrocities) Act states:
“Whoever, not being a member of a Scheduled Caste or a Scheduled Tribe,
wrongfully occupies or cultivates any land owned by, or allotted to, or notified by any
competent authority to
S
m
in
p
which may extend to five years and with fine.” (Section 3 (1) (iv), (v) and (xv) of the
HARYALI
29
Atrocities Act). Timely intervention by the state could have done justice to the
victims and spared them of prolonged litigation.
5.4 Further apart from corrective measures there is a need for preventive
measures and constant monitoring. For this a committee can be created which
includes the District Magistrate, Sub Divisional Magistrate, Tehsildar, retired Judge
Superintendent of Police and Social Welfare Officer. Also there should be a
Separate Legal Cell to provide legal assistance to the SC beneficiaries.
t to ensure
the connectedness of the land allotment policy with supplementary non-farm
.7 The rural SC’s need to be provided skills on how to change cropping pattern,
astructural support in terms of supply of power and irrigation needs to be
learly mandated in policy.
that formal credit is
rovided to SC’s at subsidized rates.
(NSCFDC) should play more effective role in helping
e beneficiaries to improve the land allotted to them. Awareness about its role in
ity of the land allotted and need to supplement
5.5 In light of the low yield generated in the farms of the SC’s its critical that they
are educated about and provided better quality seeds and fertilizers at subsidized
rates.
5.6 In the context of the marginalization of landholdings it’s importan
activities and dairy/ livestock to make small farms viable and supplement household
income.
5
practice vegetable farming and horticulture for maximum gains, Krishi Vigyan Kendra
and agricultural universities can be involved in such initiatives.
5.8 Infr
c
5.9 One of the significant problems that emerged was the lack of financial
resources that continue to plague SC’s, for this, it’s imperative
p
5.10 Finance Corporations
th
helping the SC/ST to develop economically should be increased. At present only
16% were aware of its existence. Majority of the respondents who did not have
enough resources to improve the fertil

HARYALI
30
agricultural with other income generating activities could be its potential creditors.
ed strategy cannot operate
isolation of political will bureaucratic commitment, plugging the loopholes in the
The corporation needs to expend its out reach activities.
5.11 Finally as the NHRC Report on Prevention of Atrocities against Scheduled
Castes"(2006) authored by K.B. Saxena and Justice A.S. Anand, clearly stated
that there is a need for the government to adopt a rights-based approach and not a
welfare-based one in addressing the condition of people belonging to the Scheduled
Castes. The implementation of the redistributive land bas
in
laws, curbing the manipulative power of the landed classes.

HARYALI
31
CHAPTER 2 INTRODUCTION
The Schedule Caste members constitute about 16.2 per cent of the Indian
population. The main criterion for inclusion of a particular caste in the SC list was
based on its social, educational and economic backwardness arising out of
traditional customs related to the practice of untouchability. In light of this the
constitution of India made several provisions for the welfare of the weaker sections
of the society who were historically discriminated against. These constitutional
safeguards were meant to integrate the scheduled caste with the main stream of the
country. For the past 60 years the development process in India has consistently
sought to improve the standards of living of the SC’s and empower them.
However notwithstanding some gains made since independence, the disparities
between SCs and other sections of Indian society continue to persist. The present
situation of scheduled caste is very dismal in both urban as well rural areas of the
country. They are lagging behind on all fronts - education, health, and employment.
The cumulative impact of these disparities is reflected in the high levels of poverty in
the SC community. In 1999-2000, about 36 per cent of SC’s were poor as compared
with 21 per cent among non-SCs/STs. The prevalence of poverty was particularly
high among S.C. households that were engaged in wage labour in rural areas (50
per cent) and urban areas (60 per cent). There have been several plans and policies
to ameliorate their status which has gone into vain due to improper implementation
of the safeguards at all levels and also due to the antagonism of higher castes. Infact
various studies show evidence of discrimination in market and non-market
transactions, including access to social services such as education, health and
housing, and in political participation. Till date SC’s continue to be victims of
untouchability and other atrocities. S. Thorat notes that on an average about 23,000
cases of human rights violations and atrocities are registered with the police annually
by SCs.

HARYALI
32
Agriculture or cultivation in India is one of the primary modes of production and,
hence, primary occupation. Earlier, nearly all the population lived in villages and
directly or indirectly took to agriculture or agro-related work.
Today agriculture and allied sectors contribute nearly 22% of the GDP and 60-70%
of the population is dependent on agriculture for their livelihood. Therefore despite
the emergence of industry and service as additional sources of production, the
importance of agriculture remains undiminished. Since, more than 81 percent of
persons belonging to scheduled castes live in villages it assumes greater
significance as a means of livelihood for the community.
Around 10 percent of SC persons in rural area are, directly or indirectly, dependent
on agriculture and nearly 22 percent work as agricultural labourers. Even those who
till their own land have but small, uneconomical, landholdings. While the proportion
of SC household’s wholly dependent on land is smaller than those of non-SC
households, their average land holding is only 0.89 acres, as against 1.90 acres for
non-SC households. Apparently, Non-SC’s are much better off than SCs as far as
land holding is concerned. In addition, agricultural labourers rarely have regular
work. They have to contend with seasonal work. This is what underlines the
problem of landless and marginal farmers among the scheduled castes.
Type of Workers
M F Total M F Total M F
Total Workers 52% 33% 42% 47% 16% 32% 51% 29%Main Workers - % of Total Workers 81% 53% 71% 89% 75% 85% 83% 55%- Cultivators 29% 22% 27% 2% 2% 2% 23% 19%- Agricultural Labourers 42% 57% 46% 7% 16% 9% 35% 51%- Household Industry Workers 3% 5% 4% 3% 9% 4% 3% 6%- Other Workers 26% 16% 24% 88% 73% 85% 39% 24%Marginal Workers - % of Total Workers 19% 47% 29% 11% 25% 15% 17% 45%- Cultivators 12% 18% 16% 1% 3% 2% 11% 17%- Agricultural Labourers 66% 67% 67% 18% 32% 23% 60% 65%- Household Industry Workers 3% 5% 4% 4% 14% 8% 3% 6%- Other Workers 19% 10% 14% 77% 52% 67% 26% 12%Non-workers - Total Population 48% 67% 58% 53% 84% 68% 49% 71%Source: Census of India 2001
Rural Urban Tota
Table 1.1Scheduled Caste Population Engaged in Different Occupation
Total
40%73%22%39%4%
35%27%14%63%4%
18%60%
l

HARYALI
33
In 1993-94, 48.11% were living below the poverty line. But it seems that in
subsequent years, this percentage instead of going below has sharply increased. In
1997-98, 64.64% of persons belonging to scheduled castes were reported to be
living below the poverty line.
It was recommended in the 8th Plan that the states with high population of SCs,
should receive priority in economic development plans. Bihar was one of the states
with high SC population (1,25,71,700). Brahamchary has examined the position of
land holding in Bihar, which is shown in the Table 1.2.
Table 1.2 Landholding among General and SCs Population in Bihar
Particulars General Population
% to total Cultivating HH
Scheduled Castes % to total cultivating
HH Owner cultivators 67.27 58.08
Size of landholding
Land holding less than 1acre 21.51 47.51 Between 1 to 2.4 acre 26.65 29.07
Between 2.5 to 4.9 acre 23.24 17.73 Source: Employment Planning for Rural Poor SC&ST, O. P. Brahamchari, Deep & Deep Publication. A family, which owns more than 2.5 acres of land, may be expected to pull on
somehow. But only 17.73% of SC families were in this category, whereas 23.24% of
the families in the general category enjoyed this position.
It is therefore highly relevant to look into the situation of the scheduled castes vis-à-
vis agriculture and other allied activities.
Furthermore, the wage-structure of agricultural workers leaves much to be desired.
Seldom are they paid minimum wages as laid down by the government and, women
workers do not receive parity wages.

HARYALI
34
Table 1.3
Distribution of Surplus Land among landless as on September 1999.
INDICATORS AREA (in
acres)
BALANCE
Under land ceiling laws:
Land declared surplus 73,51,030 —
Land taken possession 64,90,103 8,60,927
Total number of beneficiaries 54,65,174 —
Distribution of government waste-land:
Land distributed (in lakhs of acres) 1,47,47,000 —
Distribution of Bhoodan land:
Donated (in lakhs of acres) 39,96,000 —
Distributed (in lakhs of acres) 21,75,000 —
Balance (in lakhs of acres) 17,41,000 —
Source: Ministry of Rural Development, Annual Report, 1999-2000.
Table 1.3 shows the distribution of surplus land among the landless. Up to the end
of the year 1999, nearly 74 lakh acres of land was declared surplus in rural areas
under land ceiling laws. Out of this, 64,90,103 acres was distributed among the
landless and about 55 lakh person / households benefited from this programme.
Under the wasteland reclamation programme, more than 147 lakh acres of land was
also distributed. Similarly, another 22 lakh acres of land, donated to Bhoodan
movement, was distributed. Scheduled castes were to be the major beneficiaries of
these programmes.
Dependable information on the distribution of reclaimed land and donated land,
under Bhoodan, among the landless is not available. However, Ministry of Rural

HARYALI
35
Development, GOI, compiles information on the distribution of land rendered surplus
under land ceiling laws. It is found that up to March 31, 1992, nearly 24 lakh SC
persons or households had benefited from this programme.
PPRROOBBLLEEMMSS
The problem of landlessness is probably amongst the gravest problems that the
community is facing today with nearly 70% of the SC rural households being landless
and near landless (owning less than 1 acre). Despite significant efforts the
Government record on land redistribution has been quite dismal. Only 2% of the
total cultivable land has been distributed under the ceiling to landless and the share
goes up marginally to 10% if we include government land. Only 18 lakh acres of
land have been distributed so far to 18.5 lakh SC beneficiaries with 0.977 acre per
beneficiary. Therefore, it is a cause for concern that a large section of SC
households remain without viable land even today.
Further while the popular notion is that SC’s are the main beneficiaries of the
redistribution of land findings reveal that most of the SC beneficiaries did not receive
fertile land and neither are they in position to make it fertile due to lack of resources.
This is clearly illustrated by the fact that the poverty level among the SC cultivators is
30% which is much higher compared with non-scheduled cultivators (18%).
Further the productivity of crops grown is also very low. It was also observed that
allotted land was given on contract or for share cropping by the SC beneficiaries to
others.
BRIEF REVIEW OF LITERATURE

HARYALI
36
1. EEMMPPLLOOYYMMEENNTT OOFF SSCC LLAANNDDLLEESSSS LLAABBOOUURREESS IINN CCOOIIMMBBAATTOORREE DDIISSTTRRIICCTT
The study was conducted by Department of Social Welfare, Karpagam Arts and
Science College, Coimbatore, in November 2004, sponsored by Ministry of Social
Justice & Empowerment.
It presents in detail the pitiable social and economic condition of the SC’s. It details
how despite the existence of special employment programmes meant for the
landless like the RIEGD, NREP, JRY etc, they remain out of work for long periods in
a year. SC’s have to work as temporary or casual laboures and work under adverse
working conditions. The Income they earn is also very meagre.
The study was conducted with the following objectives:
I. To analyses the trend of land reformation
II. To study the socio-economic factors of landless agricultural labourers.
III. To analyse the employment potential of agricultural labour in future.
IV. To know their employment potential other than agriculture.
V. To identify the training needs of the unemployed.
Coimbatore was selected among other reasons because its rich soil contributes to
the flourishing agriculture industry.
The main finding of the study was that there was a declining trend in agricultural
employment. The SC community was not ready to give up agriculture. The key
reasons cited were lack of awareness about the employment potential in non-
agricultural sector, lethargy and lack of motivation.
The suggestions that emanated from the study included improving SC’s employment
status by creating awareness amongst them about employment opportunities in non-
agricultural sectors and organizing self-employment training programmes.

HARYALI
37
Some of the other relevant studies that have been conducted are those that study
the income of SC’s, the issue of landlessness amongst SC’s and their social status
vis-à-vis the other communities. They are as follows:
2 TTHHEE MMAADDRRAASS IINNSSTTIITTUUTTEE OOFF DDEEVVEELLOOPPMMEENNTT SSTTUUDDIIEESS SSUURRVVEEYYEEDD TTHHEE TTRREENNDDSS IINN
IINNCCOOMMEE EEAARRNNEEDD BBYY HHAARRIIJJAANNSS IINN TTAAMMIILL NNAADDUU
Alladi Vagewari conducted the survey in four districts of Tamil Nadu where the
percentage of SCs population is relatively large. The survey aimed at studying the
gap between the income of Harijans and other communities. The ratio of Harijan to
Non-Harijan household’s income, which was 3:4 in 1960 and increased to 3:5 in
1970.
3. S Thorat (2009) in his book titled ‘Dalits in India: Search for a Common
Destiny’ talks about how notwithstanding some gains made in the past 60 years the
disparities between SCs and other sections of Indian society continue, with the S.Cs
lagging behind with respect to a number of development-related indices especially
possession of land. For e.g. In 2000, about two-thirds of S.C. rural households were
landless or near-landless, compared with one-third amongst the non-Scheduled
Caste/Scheduled Tribe communities; fewer than one-third of S.C. households had
acquired access to capital assets, compared with 60 per cent among non-S.C/S.T
households; and about 60 per cent of S.C. households still had to depend on wage
labour, compared with one-fourth among non-S.C. /S.T. households. The book
draws upon datasets from the Census of India and the National Sample Surveys on
land ownership, employment and unemployment, and consumption expenditure. It
also utilizes the Rural Labour Inquiry reports, which are unique in the sense that they
provide data on several aspects of rural labour from 1974-75 to the present day.
Disparities of a similar magnitude exist in their education, health and housing, and in
political participation. Thorat reveals, with the support of data, that the cumulative
impact of these disparities is reflected in the high levels of poverty in the S.C.
community.

HARYALI
38
The above studies were mostly concerned with exploring the earning of SC’s
engaged in the agricultural sector as labourers and their social standing vis-à-vis
other communities whereas the study proposed by us aims to find out the status and
utilization of land allotted to SC families and its impact on their living conditions.
We have explored the following sources to obtain further studies done on the
subject:
- Ministry of Social Justice & Empowerment
- Planning Commission Library
- Ministry of Rural Development, Library
- National Social Institute, Lodi Road
- Web Search
We did not find any research and evaluation studies on the proposed subject except
above-mentioned studies.
HYPOTHESIS OF THE PRESENT STUDY
1. Quality of most of the land allotted to SC is unfertile and waste
2. It requires lot of money to improve its quality
3. The productivity of the agricultural crops grown is low
4. The production cost is high and profit margin is very nominal
5. Most of the beneficiaries don’t cultivate it and give it to share croppers or to
contractors
HARYALI
39
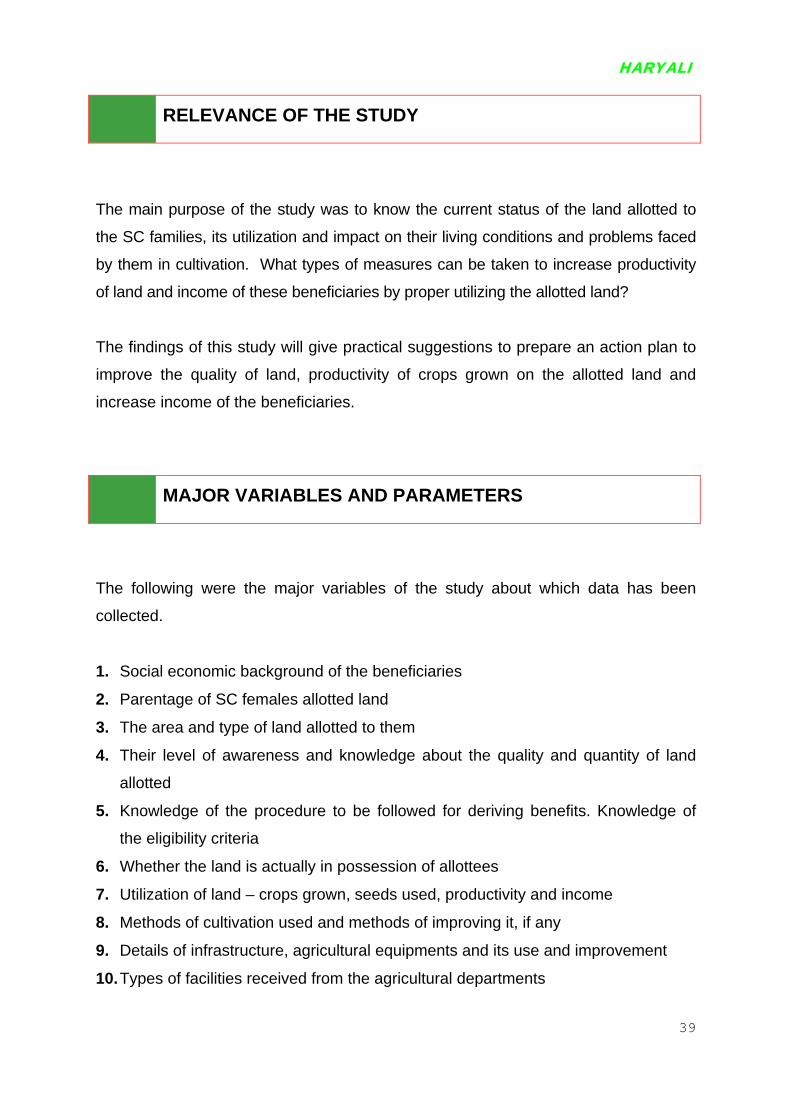
RELEVANCE OF THE STUDY
The main purpose of the study was to know the current status of the land allotted to
the SC families, its utilization and impact on their living conditions and problems faced
by them in cultivation. What types of measures can be taken to increase productivity
of land and income of these beneficiaries by proper utilizing the allotted land?
The findings of this study will give practical suggestions to prepare an action plan to
improve the quality of land, productivity of crops grown on the allotted land and
increase income of the beneficiaries.
MAJOR VARIABLES AND PARAMETERS
The following were the major variables of the study about which data has been
collected.
1. Social economic background of the beneficiaries
2. Parentage of SC females allotted land
3. The area and type of land allotted to them
4. Their level of awareness and knowledge about the quality and quantity of land
allotted
5. Knowledge of the procedure to be followed for deriving benefits. Knowledge of
the eligibility criteria
6. Whether the land is actually in possession of allottees
7. Utilization of land – crops grown, seeds used, productivity and income
8. Methods of cultivation used and methods of improving it, if any
9. Details of infrastructure, agricultural equipments and its use and improvement
10. Types of facilities received from the agricultural departments

HARYALI
40
11. Financial implications in getting funds/loans for land
purchase/cultivation/marketing and source of funding
12. Role of Scheduled Caste Development Corporation
13. Reasons for not cultivating the land
14. Amount of land cultivated by themselves and amount given to others
15. Details of share croppers and contractors
16. To what extent the land received has helped them in improving their social and
economic conditions of life
17. Reasons and hurdles of not sanctioning land to the eligible persons
18. Suggestions to improve the quality of land, productivity of the crops and income
and better system of land allotment
19. Perceptions of beneficiaries about the role of panchayat and officials
20. Problems faced by them in receiving the land
- action taken by them, and result
- reason if no action was taken

HARYALI
41
CHAPTER 3 OBJECTIVES & METHODOLOGY
2.1 OBJECTIVES
1. To assess the quantity and quality of land allotted to the SC families
2. To find out the status of possession of land allotted to the beneficiaries and
encroachment by other people, if any
3. To find out whether cultivation of land is done by themselves or given on
contract or share basis
4. To find out the utilization of land, including crop grown, productivity of crops
and income
5. To assess the problems faced by the beneficiaries in proper utilization of land
allotted to them
6. To study the impact of land allotment on the socio-economic status of the
beneficiaries’ families
7. To suggest ways and mean of proper utilization of land to increase their
income

HARYALI
42
FFOOLLLLOOWWIINNGG AASSPPEECCTTSS TTOO BBEE CCOOVVEERREEDD WWEERREE AALLSSOO AASS SSUUGGGGEESSTTEEDD BBYY TTHHEE PPLLAANNNNIINNGG
CCOOMMMMIISSSSIIOONN ((LLEETTTTEERR FF.. NNOO.. OO--1155001122//5588//0077 –– SSEERR DDAATTEEDD 88 FFEEBBRRUUAARRYY 22000088)) SSTTUUDDYY
1. The type and area of land allotted to the SC beneficiaries
2. Whether the land is actually in possession of allotted
3. Financial implications in getting funds/loan for land
purchase/cultivation/marketing
4. Size of land holding
5. Percentage of SC female allotted land
6. The study to cover by the beneficiaries of Scheduled Caste Development
Corporation of the selected states
7. The study will also cover two more states of western and central part of India
i.e. Gujarat and Madhya Pradesh to get as All India picture of the land allotted
to the SC families.
22..22 MMEETTHHOODDOOLLOOGGYY
SAMPLING DESGIN
UUNNIIVVEERRSSEE:: The Universe of the study comprises of the SC beneficiary families to
whom the land was allotted in the selected villages.

HARYALI
43
SSEELLEECCTTIIOONN SSTTAATTEESS
Sl. States/UTsNo. Area No. Area No. Area No.
1 Andhra Pradesh 525,663 582,188 224205 226683 84653 119469 2168052 Assam 445,862 545,875 43723 86069 42365 58986 3597743 Bihar 379,528 306,964 234861 182045 43050 39978 1016174 Gujarat 33,312 146,578 15079 85176 14047 31579 41865 Haryana 29,346 102,388 12684 44201 - - 166626 Himachal Pradesh 6,259 6,167 3912 2727 329 245 20187 Jammu & Kashmir 450,000 450,000 - - - - 4500008 Karnataka 33,727 123,412 20356 74149 1250 4338 121219 Kerala 166,814 68,745 70853 26619 8990 7248 8697110 Madhya Pradesh 74,705 186,942 21904 49542 28138 73379 2466311 Maharashtra 135,301 613,965 40707 157862 29268 97378 6532612 Manipur 1,258 1,682 96 128 72 97 109013 Orissa 141,155 158,030 48382 50150 52264 66228 4050914 Punjab 28,582 104,257 11352 44248 - - 1723015 Rajasthan 82,441 463,547 29932 144827 11769 50239 4074016 Tamil Nadu 145,608 183,670 64732 69246 205 275 8067117 Tripura 1,424 1,598 256 217 359 448 80918 Uttar Pradesh 300,163 260,509 205104 183495 450 951 9460919 West Bengal 2,759,791 1,088,445 1019658 373881 523908 224778 121622520 D&N Haveli 3,353 6,851 30 53 3321 6795 221 Delhi 654 394 495 277 - - 15922 Pondicherry 1,464 1,070 858 640 - - 606
Total 5,746,410 5,403,277 2,069,179 1,802,235 844,438 782,411 2,832,793Note: No.= No. of Beneficiaries - Area in AcresSource: Ministry of Rural Development, GOI, Annual Report 2005-06
Table 2.1Distribution of Ceiling Surplus Land (as on 31.03.2005)
Total Scheduled Castes Scheduled Tribes OthersArea2360364008208494125994581623195
450000449253487864021
3590101457
4165260009
269481114149
93376063
4056483
117430
2,731,924
When the study was originally conceived three states namely Andhra Pradesh, Uttar
Pradesh and West Bengal having high proportion of SC beneficiaries were selected.
On the basis of the suggestion by the Planning Commission, two more states of
Western and Central part of India i.e. Gujarat and Madhya Pradesh were also
included in the study to get an all India picture of the status of land allotted to SC
families.

HARYALI
44
State No. of SC % of TotalBeneficiaries Beneficiaries
Andhra Pradesh 224,205Gujarat 15,079Madhya Pardesh 21,904Uttar Pradesh 205,104West Bengal 1,019,658
Total India 1,485,950
Table 2.2No. of SC Beneficiaries in Selected States
15%45%29%14%69%
26% SSEELLEECCTTIIOONN OOFF DDIISSTTRRIICCTTSS It was proposed to divide all the districts of selected states into two strata. Stratum 1
- those districts that as per the 2001 census, had 20 percent or more scheduled
caste population, and stratum 2 - those districts that had less than 20 percent SC
population. Within each stratum, one district was randomly selected.
SSEELLEECCTTIIOONN OOFF BBLLOOCCKKSS AANNDD VVIILLLLAAGGEESS
In each district two blocks having high SC population and within each block, five
villages with high SC population were selected.
For selecting the households, a list of SC beneficiaries who were allotted land in
selected villages was obtained from the Tehsil, BDO and Gram Panchayat Pradhan.
From the household list of villages, a fix number of 25 SC beneficiaries’ households
from each village were selected by using systematic random sampling procedure.
In addition, a list of beneficiaries of Scheduled Caste Development Corporation was
also obtained from the concerned department and available beneficiaries of SCDC
were interviewed in each selected village.
In addition, 5 SC non-beneficiaries from each selected villages were interviewed to
find out the reasons for not allotting land to them.

HARYALI
45
The details of sample of the respondents are given in Table 2.3.
State
Andh
Gujr
Mad
Utta
Wes
Tota
DistrictBeneficiaries Non- Officials Total
Beneficiariesra Pradesh Nalgonda 250 50 25 325
Prakasam 250 45 25 320at Porbandar 250 57 23 330
Surendernagar 250 50 25 325hya Pradesh Rewa 250 45 20 315
Datia 251 50 27 328r Pradesh Pilibhit 250 47 34 331
Rae Bareily 250 49 34 333t Bengal Maldah 250 50 23 323
Jalpaiguri 250 55 25 330
l 2501 498 261 3260
No. of Respondents
Table 2.3Sample
1
Total 2,501 SC beneficiaries and 498 SC non-beneficiaries were interviewed.
Additional discussions were also held with the followings to find out the status of land
allotted in their area and type of problems faced by the beneficiaries and
implementing agencies.
1. Village Pradhan and Other Panchayat Members
2. Village Secretary
3. Block Development Officer
4. Agriculture Extension Officers
5. DRDA Officials
1 Source: Census of India 2001

HARYALI
46
2 DATA COLLECTION
The study is mainly empirical, based on primary data, which has been correlated with
secondary data. It brings to light not only the quantitative dimension of the problem
but the qualitative aspects as well.
SSTTUUDDYY TTOOOOLLSS
The study was conducted using the following tools:
- Interview schedule for Beneficiaries
- Interview schedule for Non-Beneficiaries
- Interview Schedule for concerned officials and community leaders
- Format for Village profile
- Format for collecting secondary information
PRIMARY DATA
Primary data was collected from the SC beneficiaries and non-beneficiaries
households through interview
Detailed interview were also held with the following to collect primary data:
• Existing Gram Pradhan, Ex-Gram Pradhan and Panchayat members,
etc.
• District Social Welfare Officer
• District Rural Development Agency
• Agriculture Extension Officers
• Block Development Office

47
HARYALI
SECONDARY DATA
Census and NSSO
ment Agencies
evelopment Office
and evaluation reports and other related documents
•
• District Rural Develop
• Tehsil
• Block D
• Available research studies
on the subject
DATA PROCESSING, ANALYSIS AND REPORT WRITING
he data thus collected was checked and edited for consistency and accuracy. On
corporating all the data and their analysis, a detailed report was prepared and
T
the basis of codebooks, information in completed interview schedules, observation-
sheets, etc. were coded. Subsequently, data was entered into computer and
processed using such software as SPSS and Microsoft Excel. One-way or
frequency tables were prepared. Inter-linkages have been examined through cross-
tables. Throughout, suitable statistical techniques and tests have been applied. The
analysis based on primary data/information has been validated with secondary
information. Apart from statistical tables, presentation graphs and diagrams have
been prepared.
In
submitted to the sponsor.
CHAPTER 4 FINDINGS
48
33..11 OBJECTIVE-WISE FINDINGS
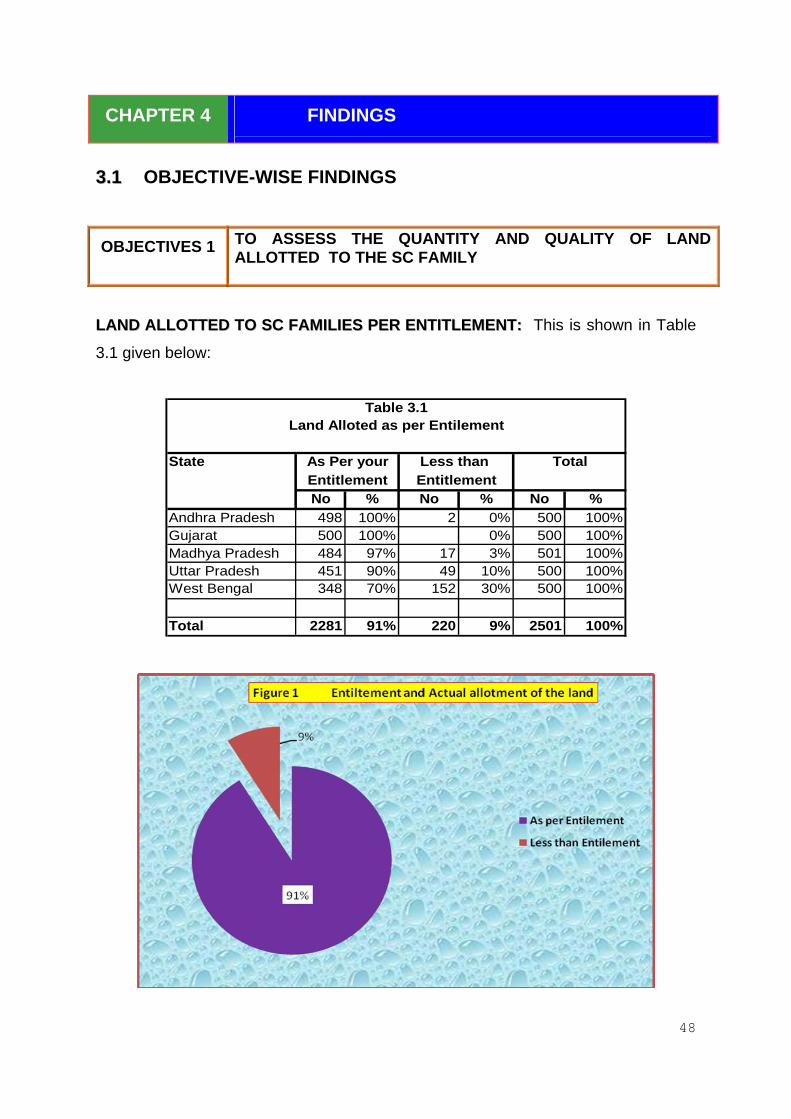
OBJECTIVES 1 TO ASSESS THE QUANTITY AND QUALITY OF LAND ALLOTTED TO THE SC FAMILY
LLAANNDD AALLLLOOTTTTEEDD TTOO SSCC FFAAMMIILLIIEESS PPEERR EENNTTIITTLLEEMMEENNTT:: This is shown in Table
3.1 given below:
State
No % No %Andhra Pradesh 498 100% 2 0%Gujarat 500 100% 0%Madhya Pradesh 484 97% 17 3%Uttar Pradesh 451 90% 49 10%West Bengal 348 70% 152 30%
Total 2281 91% 220 9%
As Per your Less than
Table 3.1
Entitlement Entitlement
Land Alloted as per Entilement
No %500 100%500 100%501 100%500 100%500 100%
2501 100%
Total

HARYALI
49
The allotment of land as per entitlement was quite satisfactory. 91% of the families
got the land they were entitled to. In this respect Andhra Pradesh and Gujarat were
the best states. 100% families in both the states got the land they were entitled to;
West Bengal was behind all states in this respect. Only 70% of the families received
the land they were entitled to.
Access to land plays a significant role in improving the living standard of the SC’s in
Rural India. It was due to this very reason that redistribution of surplus land to the
poor especially the SC’s was viewed as central to land reforms and later
programmes such as Bhoodan were conceived. The ownership of land is the very
basis of the ones position in the agrarian social hierarchy. For the SC’s in rural
areas land is not just a source of livelihood and wealth it denotes an enhanced social
status.
LLAANNDD AALLLLOOTTTTEEDD PPEERR BBEENNEEFFIICCIIAARRYY
State
No. %
TotalNo. of
Acres No. % AcresAndhra Pradesh 261 52% 0.8 239 48% 1.5Gujarat 253 51% 2.0 247 49% 1.8Madhya Pradesh 382 76% 1.1 119 24% 1.2Uttar Pradesh 470 94% 0.6 30 6% 0.7West Bengal 328 66% 0.5 172 34% 0.5
Total 1694 68% 0.9 807 32% 1.4
Table 3.2 Average Land Alloted per Beneficiary
Un-IrrigatedIrrigatedBeneficiaries & Area Beneficiaries & Area
Benf.500500501500500
2501

HARYALI
50
Table 3.2 shows that on an average, area of land allotted per SC beneficiary was 0.9
acres if it was irrigated and 1.4 acres incase un-irrigated land was allotted. On an
average Gujarat allotted the highest amount of irrigated land i.e. 2 acres followed by
Madhya Pradesh (1.1 acres). Interestingly on an average Gujarat allotted the
highest amount of un-irrigated land also (1.8 acres), followed by Andhra Pradesh
(1.5 acres). Whether the land allotted was irrigated or not is highly critical to
understanding whether it is productive to make a difference to poor SC households.
YYEEAARR OOFF AALLLLOOTTMMEENNTT
StateNo. % No. % No. % No. % No.
Andhra Pradesh 242 48% 258 52% 0% 0% 500Gujarat 0% 180 36% 320 64% 0% 500Madhya Pradesh 500 100% 1 0% 0% 0% 501Uttar Pradesh 26 5% 101 20% 300 60% 73 15% 500West Bengal 0% 53 11% 439 88% 8 2% 500
Total 768 31% 593 24% 1059 42% 81 3% 2501
Table 3.3Year of Allotment
0-10 years 10-20years 20-30 years 30+years To%100%100%100%100%100%
100%
tal

HARYALI
51
Considering that the redistributive land reform strategy has been an intrinsic part of
the development envisaged since independence looking at the when the land was
allotted to the SC’s is significant. The time range is 10 to 30 years. Around 33% of
the land allotted was between 10 to 30 years ago.
QQUUAALLIITTYY OOFF LLAANNDD AALLLLOOTTTTEEDD
StateNo. % No. %
Andhra Pradesh 275 55% 225 45%Gujarat 252 50% 248 50%Madhya Pradesh 235 76% 73 24%Uttar Pradesh 460 92% 38 8%West Bengal 485 97% 15 3%
Total 1707 74% 599 26%
Table 3.4Quality of the Alloted Land
Fertile Un-fertile
Note: Exuding Encrochment Cases
No. %500 100%500 100%308 100%498 100%500 100%
2306 100%
Total

HARYALI
52
Distribution of land to the SC’s is the first step towards their emancipation. However
if the quality of land is sub standard the very purpose of allotting land gets defeated.
To understand this aspect, questions were asked to ascertain the quality of land.
The overall picture that emerged was that 74% of the land allotted was irrigated and
fertile. However there were wide interstate disparities. 97% and 92% of the land
allotted in West Bengal and Uttar Pradesh respectively was fertile and the least
percent of fertile land given was by Gujarat and Andhra Pradesh.
RREEAASSOONNSS OOFF UUNNFFEERRTTIILLIITTYY OOFF TTHHEE LLAANNDD AALLLLOOTTTTEEDD
State
No. % No. % No. % No. % No. % No. % No. % No.Andhra Pradesh 1 0% 0% 0% 3 1% 1 0% 207 92% 13 6% 225Gujarat 47 19% 3 1% 29 12% 2 1% 152 61% 13 5% 2 1% 248Madhya Pradesh 15 21% 34 47% 2 3% 3 4% 8 11% 0% 11 15% 7Uttar Pradesh 8 21% 3 8% 7 18% 0% 9 24% 2 5% 9 24% 3West Bengal 1 7% 0% 0% 0% 0% 2 13% 12 80% 1
Total 72 12% 40 7% 38 6% 8 1% 170 28% 224 37% 47 8% 599
Pot hole/Undulated
Waste land +full of stone
Table 3.5Types of Unfertile Land
Waste Full of Sandy SwampyStoneLand
Noresponse
%100%100%
3 100%8 100%5 100%
100%
Total
To determine how the land was unfertile the respondents were asked to explain the
reasons for it. The main reason that emerged was that 37% of the land allotted was
wasteland and full of stone. Andhra Pradesh allotted the worst type of land with 92%
of the land given falling in this category, followed by West Bengal, where 13% of the
land had these defects.

HARYALI
53
OBJECTIVES 2 TTOO FFIINNDD OOUUTT TTHHEE SSTTAATTUUSS OOFF PPOOSSSSEESSSSIIOONN OOFF LLAANNDD AALLLLOOTTTTEEDD TTOO TTHHEE BBEENNEEFFIICCIIAARRIIEESS AANNDD EENNCCHHRROOCCHHMMEENNTT BBYY OOTTHHEERR PPEEOOPPLLEE
AAVVEERRAAGGEE LLAANNDD AALLLLOOTTTTEEDD AANNDD PPOOSSSSEESSSSIIOONN OOFF LLAANNDD PPEERR BBEENNEEFFIICCIIAARRYY TTAABBLLEE 33..66 AANNDD
33..77..
StateAcres % Acres % Acres
Andhra Pradesh 2.3 100% 1.1 50% 1.2Gujarat 3.8 100% 1.9 50% 1.9Madhya Pradesh 2.3 100% 1.1 47% 1.2Uttar Pradesh 1.3 100% 0.5 43% 0.7West Bengal 1.0 100% 0.5 49% 0.5
Total 2.3 100% 1.0 45% 1.3
Table 3.6 Average Land Alloted and in Possession in Actual acre per Benef
Alloted Possession Diffe%
50%50%53%57%51%
55%
iciary
rence
Interviews with the respondents pointed to a discrepancy between the land allotted
to the respondents and the land in their actual possession.

HARYALI
54
On an average 2.3 acres was allotted but only 1 acre was in actual possession of the
respondents with the difference of 1.3 acres between allotment and actual
possession.
State
No. % No. % No. No.Andhra Pradesh 498 100% 2 0% 0% 500Gujarat 500 100% 0% 0% 500Madhya Pradesh 308 61% 0% 193 39% 501Uttar Pradesh 456 91% 42 8% 2 0% 500West Bengal 359 72% 141 28% 0% 500
Total 2121 85% 185 7% 195 8% 2501
Could not get possession
Table 3.7Status of Possession of Land
Same as Less than Allotted Allotted
%100%100%100%100%100%
100%
Total
While all the land that was to be allotted to the beneficiaries was given, in 85% of the
cases the beneficiaries got the same amount of land as they were allotted, 7%
beneficiaries were allotted less land than they were entitled and 8% beneficiaries
could not gain possession of the land allotted to them.
HARYALI
55
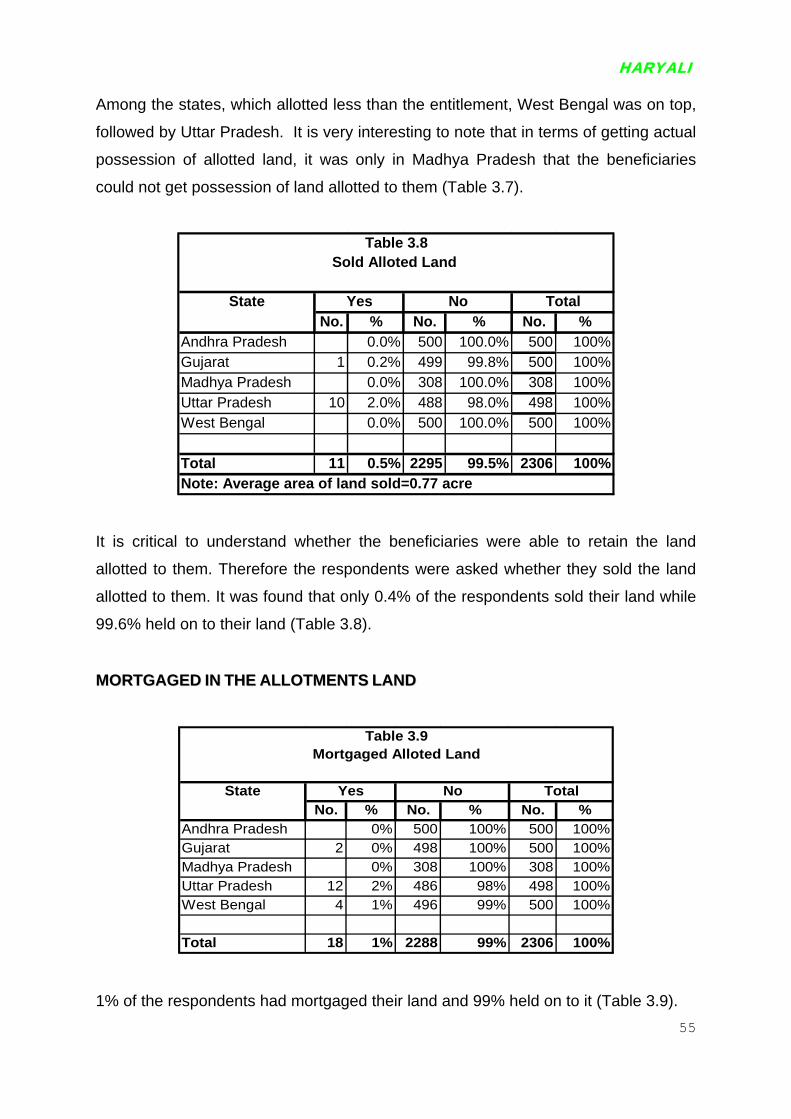
Among the states, which allotted less than the entitlement, West Bengal was on top,
followed by Uttar Pradesh. It is very interesting to note that in terms of getting actual
possession of allotted land, it was only in Madhya Pradesh that the beneficiaries
could not get possession of land allotted to them (Table 3.7).
StateNo. % No. %
Andhra Pradesh 0.0% 500 100.Gujarat 1 0.2% 499 99.Madhya Pradesh 0.0% 308 100.Uttar Pradesh 10 2.0% 488 98.West Bengal 0.0% 500 100.
Total 11 0.5% 2295 99.
Table 3.8Sold Alloted Land
Yes No
Note: Average area of land sold=0.77 acre
No. %0% 500 100%8% 500 100%0% 308 100%0% 498 100%0% 500 100%
5% 2306 100%
Total
It is critical to understand whether the beneficiaries were able to retain the land
allotted to them. Therefore the respondents were asked whether they sold the land
allotted to them. It was found that only 0.4% of the respondents sold their land while
99.6% held on to their land (Table 3.8).
MMOORRTTGGAAGGEEDD IINN TTHHEE AALLLLOOTTMMEENNTTSS LLAANNDD
StateNo. % No. %
Andhra Pradesh 0% 500Gujarat 2 0% 498Madhya Pradesh 0% 308Uttar Pradesh 12 2% 486West Bengal 4 1% 496
Total 18 1% 2288
Table 3.9Mortgaged Alloted Land
Yes NoNo. %
100% 500 100%100% 500 100%100% 308 100%
98% 498 100%99% 500 100%
99% 2306 100%
Total
1% of the respondents had mortgaged their land and 99% held on to it (Table 3.9).

HARYALI
56
EENNCCRROOAACCHHMMEENNTT OOFF LLAANNDD AALLLLOOTTTTEEDD BBYY OOTTHHEERRSS TTAABBLLEE 33..1100 AANNDD TTAABBLLEE
33..1111
StateNo. % No. %
Andhra Pradesh 0% 500 100%Gujarat 0% 500 100%Madhya Pradesh 198 40% 303 60%Uttar Pradesh 69 14% 431 86%West Bengal 1 0% 499 100%
Total 268 11% 2233 89%
Yes No
Table 3.10Enrcrochment on Alloted Land by O
No. %500 100%500 100%501 100%500 100%500 100%
2501 100%
Total
thers
State Total LandAlloted Area % of(Acres) (Acres) Alloted Land
1.0 45%0.4 27%0.4 36%
0.9 38%
and Enroched
Others
Madhya Pradesh 2.30 Uttar Pradesh 1.50 West Bengal 1.18
Total 2.29
Average L
Table 3.11Encrochment on Alloted Land by

HARYALI
57
The SC’s in rural India continue to live in a socially oppressive context. In the social
hierarchy the SC’s are positioned right at the bottom. In this context
misappropriation of the resources of SC’s is a common offense. In fact one of the
most common causes for atrocities against Dalits is when the community attempted
to assert their right to resources especially land. A form of this atrocity is
encroachment of the land of SC’s. In 11% of the cases the land of the beneficiaries
was encroached by others. Encroachment was concentrated in Madhya Pradesh
and Uttar Pradesh. In Madhya Pradesh the incidence was as high as 40% and Uttar
Pradesh 14%. This points to how the system of land redistribution cannot be
practiced in isolation of the power structure that operates in villages.
AACCTTIIOONN TTAAKKEENN TTOO GGEETT BBAACCKK EENNCCRROOAACCHHEEDD LLAANNDD
What was heartening to see was the trend amongst the SC’s to assert their Rights
though the situation was far from perfect. In Madhya Pradesh 64% of the wronged
respondents filed a suit in court and only 5% did not take any action.
State
No % No % No % No % NoMadhya Pradesh 10 5% 127 64% 1 1% 60 30% 198Uttar Pradesh 20 29% 6 9% 4 6% 39 57% 69West Bengal 0% 0% 1 100% 0% 1
Total 30 11% 133 50% 6 2% 99 37% 268
To
Table 3.12Action Taken to Get Back Encroched Land
No action Filed a case Filed a complained TahsilTaken in the court in the SC/ST Tribunal
%100%100%100%
100%
tal
In Uttar Pradesh as high as 29% did not take any action. Largest number of those
who took action approached the Tehsil for redressal. Only 1 allotee took action and
filed a complaint in SC/ST tribunal.

HARYALI
58
RREEAASSOONNSS OOFF NNOO AACCTTIIOONN TTAAKKEENN TTOO GGEETT BBAACCKK EENNCCRROOAACCHHEEDD LLAANNDD
State
No % No % No % No % NoMadhya Pradesh 11 31% 4 11% 13 36% 8 22% 36Uttar Pradesh 10 16% 4 6% 17 27% 32 51% 63West Bengal 0% 0% 1 100% 0% 1
Total 21 21% 8 8% 31 31% 40 40% 100
Toconsequences whom to complain to file case other
Afraid of Do not know No money Any
Note: No response/DK=168
Table 3.13Reason of No Action Taken to Get Back Encroched Land
%100%100%100%
100%
tal
The main reason for no action was the lack of money to meet the expenses of
litigation (31%), 21% were afraid of the consequences largely because those who
encroached the land represented the village elite and 8% had no knowledge of the
processes.
RREESSUULLTT OOFF AACCTTIIOONN TTAAKKEENN TTOO GGEETT BBAACCKK EENNCCRROOAACCHHEEDD LLAANNDD
State
No % No % No % NoMadhya Pradesh 1 1% 127 64% 70 35% 198Uttar Pradesh 3 4% 5 7% 61 88% 69West Bengal 0% 0% 1 100% 1
Total 4 1% 132 49% 132 49% 268
Back Under Consideration
Table 3.14Result of Action Taken to Get Back Encroched Land
Got Land Case in Still No Result T
%100%100%100%
100%
otal
Only 1% of those who complained got back their land. 49% cases were still under
consideration and in the case of another 49% there was no action. Highest number
of those who got back their land was in Uttar Pradesh (4%), and the lowest in West
Bengal. This is significant as it points to the increasing awareness and assertion of
the SC’s for their rights and the unresponsiveness of the institutional mechanisms
available for SC’s.

HARYALI
59
EEXXPPEECCTTAATTIIOONN FFRROOMM GGOOVVEERRNNMMEENNTT TTOO GGEETT BBAACCKK EENNCCRROOAACCHHEEDD LLAANNDD
State
No. % No. % No.Madhya Pradesh 194 98% 4 2% 198Uttar Pradesh 25 36% 44 64% 69West Bengal 1 100% 0% 1
Total 220 82% 48 18% 268
Table 3.15Expectation from the Government to Get Back Encroched Land
provide possession provide legal AidGovt. should Govt. should T
%100%100%100%
100%
otal
There were two main expectations from the government 82% were of the opinion
that the government should take steps to get back the encroached land, and 18%
expected the government to provided legal aid. The largest number of those who
wanted government to provide legal aid was in Uttar Pradesh (64%).

HARYALI
60
OBJECTIVES 3 TO FIND OUT WHETHER CULTIVATION OF LAND WAS DONE BY THE ALLOTEE THEMSELVES, OR GIVEN ON CONTRACT OR SHARE CROPPING BASIS
Table 3.16 below shows the position:
State
No. % No. %Andhra Pradesh 498 100% 2Gujarat 500 100%Madhya Pradesh 251 81% 57 19Uttar Pradesh 453 91% 45West Bengal 495 99% 5
Total 2197 95% 109
Table 3.16Self Cultivation of Land
Self Share CroppingCultivation Lease out
No. %0% 500 100%0% 500 100%% 308 100%
9% 498 100%1% 500 100%
5% 2306 100%
/ Total
It is very important to assess whether the SC families to whom land was allotted
were able to retain it and if they were able to make that significant shift towards self
employed cultivators.

HARYALI
61
It was found that 95% of the families were cultivating the land themselves. 100% of
the families in Andhra Pradesh and Gujarat were self-cultivators. Sharecropping or
leasing out the allotted land was almost a non-existent practice.
StateNo. % No. %
Andhra Pradesh 0% 500 100%Gujarat 2 0% 498 100%Madhya Pradesh 0% 308 100%Uttar Pradesh 12 2% 486West Bengal 4 1% 496
Total 18 1% 2288
Table 3.17Mortgaged Alloted Land
Yes NoNo. %500 100%500 100%308 100%
98% 498 100%99% 500 100%
99% 2306 100%
Total
Corroborating the above finding was the discovery that a very small percentage of
the families had mortgaged the land; only 1% had done so that too mostly limited to
the states of Uttar Pradesh and West Bengal.
State Average Acres Average AmountMortgaged of Mortgage (Rs.) for M
Andhra Pradesh 0.0 0Gujarat 1.0 30000Madhya Pradesh 0.0 0Uttar Pradesh 0.6 9225West Bengal 1.3 7250
Total 0.8 9982
Table 3.18Mortgaged Alloted Land
Yearsortgage
05063
5
The average land mortgaged was 0.8 acre only. Average mortgaged amount was
Rs. 9,982/-. Highest amount for 1 acre mortgaged was in Andhra Pradesh Rs.
30,000/-. The farmers had mortgaged the land on an average for 5 years.

HARYALI
62
Why the land was mortgaged is illustrated in Table 3.19 given below.
State
No. % No. % No. % No.Andhra PradeshGujarat 0% 0% 1 100%Madhya PradeshUttar Pradesh 1 8% 4 33% 7 58%West Bengal 0% 3 75% 1 25%
Total 1 6% 7 41% 9 53%
Table 3.19Reasons of mortgaging allotted land
Marriagefor cultivation loanTo buy input To repay
%01 100%0
12 100%4 100%0
17 100%
Total
6% had mortgaged the land for the purpose of land development that is to buy inputs
for getting better crop. 41% had mortgaged it to be able to return loans taken. But
unfortunately to main reason for mortgaging the land was to fulfill social customs i.e.
to meet the cost of marriage, rather than, improve their economic condition. 100%
farmers of Andhra Pradesh had fallen prey to this custom, followed by Uttar Pradesh
farmers. This clearly highlights the vicious hold that certain social customs continue
to have in rural society wherein the poor continue to spend beyond their pocket
falling into the debt trap.
OBJECTIVES 4 UTILIZATION OF LAND, INCLUDING, CROPS GROWN, PRODUCTIVITY AVERAGE INCOME PER BENEFICIARY
An attempt was made to study the productivity of land and the monetary benefits
accruing to the SC recipients of the allotted land. This is a significant indicator of land
utilization by the beneficiaries. A concerted effort was made to understand the
variation between irrigated and un-irrigated land as this not only indicates the
significant qualitative difference in the productivity of the two kinds of land but also
shows the need for inputs to make the land productive.

HARYALI
63
1,694 beneficiaries having irrigated land from all the 5 states were interviewed to find
out the crops grown by them, average yield per acre and average income per
beneficiary. The land given to them was of both types irrigated and un-irrigated, and
naturally the type of crops grown and income per acre differed in the irrigated and
un-irrigated land. Therefore data given below shows the utilization of both the types
of land.
IIRRRRIIGGAATTEEDD LLAANNDD
1. The crops differed from state to state. However the following crops were
common in majority of states.
Groundnut: Grown in Madhya Pradesh, Gujarat and Andhra Pradesh.
Paddy: Grown in all the states except Gujarat
Pulses: Grown in all the states except Andhra Pradesh and West
Bengal The other crops were:
Cotton
Sugarcane
Tobacco
Bajara, etc.
In Table 3.20 we have shown only the types of crops grown in different states, total
acre sown, total quintal produced, average quintal produced per acre and average
quintal produced per beneficiary.

HARYALI
64
State Name of No. of Total Area Total Average AverageCrops Beneficiaries Sown Production Productivity Production
(Acre) (Quintal) Q./Acre Q./BeneficiaryAndhra Pradesh Groundnut 2 2 7 3.0 3.5
Tobacco 99 79 492 6.2 5.0Paddy 152 114 820 7.2 5.4Cotton 6 7 36 5.3 5.9Red Goan 2 2 5 1.9 2.3
Total 261 204 1359 6.6 5.2Gujarat Wheat 9 11 100 9.1 11
Gram 227 229 2258 9.9 9.9Groundnut 241 390 3132 8.0 13.0Bajra 4 6 26 4.3 6.5Pulses (Moong) 6 6 63 10.5 10.5Pulses (Urad) 4 5 46 9.2 11.5Cotton 239 299 2660 8.9 11.1
Total 730 945 8285 8.8 11.3Madhya Pradesh Wheat 218 226 1311 5.8 6.0
Til 33 37 75 2.0 2.3Gram 59 56 192 3.4 3.3Maize 6 7 41 5.9 6.8Pulses (Urad) 5 5 20 4.0 4.0Pulses (Moong) 4 5 20 4.4 5.0Pulses (Arhar) 6 4 26 6.5 4.3Bajra 2 2 16 8.0 8.0Paddy 1 1 7 7.0 7.0Groundnut 1 1 11 11.0 11Pea 2 2 9 6.0 4.5Mustard 1 2 6 3.0 6
Total 338 346 1733 5.0 5.1Uttar Pradesh Wheat 439 228 1929 8.5 4.4
Gram 1 0 0 0.4 0.1Pulses (Arhar) 3 1 4 6.5 1.3Paddy 261 181 2051 11.3 7.9Sugarcane 4 3 282 110.2 70.5
Total 708 412 4266 10.3 6.0West Bengal Wheat 193 89 1136 12.7 5.9
Gram 1 0 2 12.5 2.0Paddy 206 169 2742 16.2 13.3Sugarcane 2 3 300 100.0 150.0
Total 402 262 4180 16.0 10.4
Production of Crops in Irrigated Land (July 2007 to June 2008)Table 3.20

HARYALI
65
2. TOTAL AREA SOWN (IN ACRES) BY THE SAMPLE BENEFICIARIES
Least sown acreage was in Andhra Pradesh (204 acres) and highest in Gujarat (945
acres). Average acreage per state under cultivation was 434 and per beneficiary
was 0.88 acre.
3. TOTAL PRODUCTION
In terms of total production the highest production was in Gujarat (8,285 quintals)
followed by Uttar Pradesh (4,266). At the other end of the spectrum lay Andhra
Pradesh (204 quintals) which had the least produce. The average total production
per beneficiary was 8 quintals.
4. AVERAGE PRODUCTION PER ACRE
A Noteworthy trend that emerged was that the productivity of majority of the crops
grown by the SC beneficiaries was below the national average. For example In UP
the Paddy productivity is generally 20-25 quintals/acre whereas the paddy
productivity in SC families was noted to be 11 quintals/acre. Similarly the In UP the
Wheat productivity is generally 18-20 quintals/acre whereas the wheat productivity in
SC families was noted to be merely 8.5 quintals/acre.
5. AVERAGE PRODUCTION PER BENEFICIARY
It ranged from 5.1 to 11.3 quintals of all crops sown in a year. The highest average
production per beneficiary was seen in Gujarat (11.3 quintals) followed by West
Bengal (10.4 quintals). Least amount was produced by Madhya Pradesh
beneficiaries (5.1 quintals) followed by Andhra Pradesh beneficiaries (5.2 quintals).
Table 3.21 systematically details (state wise and crop wise) the percentage of the
total crop produce that the beneficiaries sold in the market and the resulting income
per beneficiary.

HARYALI
66
State Name of No. of % of Total Average % of Total AverageCrops Beneficiaries Beneficiaries Quantity Quantity Total Value Income
Sold Grains Sold Grains of Grains Sold Produced (Rs.) Rs./Sold Q./Benef. Sold Benef.
Groundnut 2 100% 7 4 100% 2000 1000Tobacco 99 100% 492 5 100% 984000 9939Paddy 2 1% 4 2 0% 2800 1400Cotton 6 100% 36 6 100% 67000 11167Red Goan 2 100% 4.5 2 100% 9000 4500
Total 111 43% 543 5 40% 1051000 9468Wheat 9 100% 84 9 84% 104100 11567Gram 227 100% 2032 9 90% 4054000 17859Groundnut 241 100% 2900 12 93% 5656400 23471Bajra 4 100% 23 6 88% 14800 3700Pulses (Moong) 6 100% 58 10 92% 116000 19333Pulses (Urad) 4 100% 42 11 91% 84000 21000Cotton 239 100% 2635 11 99% 5242000 21933
Total 494 68% 7774 16 94% 5909600 11963Wheat 119 55% 412 3 31% 451900 3797Til 26 79% 40 2 53% 50100 1927Gram 36 61% 89 2 46% 156200 4339Maize 2 33% 11 6 27% 6200 3100Pulses(Urad) 5 100% 17 3 85% 2000 400Pulses(Moong) 4 100% 17 4 84% 33400 8350Pulses(Arhar) 4 67% 18 5 69% 36000 9000Bajra 2 100% 10 5 63% 6000 3000Paddy 1 100% 5 5 71% 3500 3500Groundnut 1 100% 11 11 100% 2000 2000Pea 2 100% 9 5 100% 5400 2700Mustard 1 100% 5 5 83% 5500 5500
Total 203 60% 644 3 37% 501700 2471Wheat 23 5% 107 5 6% 119900 5213Gram 0% 0%Pulses (Arhar) 2 67% 0.6 0 15% 1200 600Paddy 24 9% 253 11 12% 7385 308Sugarcane 2 50% 162 81 57% 75 38
Total 51 7% 523 10 12% 105540 2069Wheat 62 32% 298 5 26% 323700 5221Gram 1 100% 2 2 100% 4000 4000Paddy 128 62% 701 5 26% 424200 3314Sugarcane 2 100% 300 150 100% 36010 18005
Total 193 48% 1301 7 31% 634200 3286
Produced Sold - Irrigated Land (July 2007 to June 2008)Table 3.21

HARYALI
67
6. TOTAL QUANTITY OF GRAIN SOLD BY THE SAMPLE BENEFICIARIES
The total quantity of grain sold ranged from 523 quintals to 7,774 quintals of all crops
sown in a year. Gujarat beneficiaries were able to sell the largest amount of gain
(7,774 quintals) whereas Uttar Pradesh beneficiaries were able to sell only 523
quintals. Average quantity sold per beneficiary ranged from 3 to 16 quintals, Gujarat
beneficiaries sold on as average 16 quintals per beneficiary whereas Madhya
Pradesh formers were able to sell only 3 quintals.
Percent of total produced sold
Gujarat beneficiaries were in the lead. 94% of them were in a position to sell their
surplus produce as against only 12% of Uttar Pradesh farmers.
7. AVERAGE ANNUAL INCOME PER BENEFICIARY
Again Gujarat was in the lead. In this state average income per beneficiary was Rs.
11,963/-. Uttar Pradesh farmers were behind all, with only Rs. 2,069/- per
beneficiary followed by Madhya Pradesh farmers, Rs. 2,471/-. The average income
per beneficiary was Rs. 7,796/-.
8. AVERAGE QUANTITY KEPT FOR CONSUMPTION PER BENEFICIARY
State Quantity (Quintals)
Andhra Pradesh 5.4 Quintals
Gujarat 1.0 Quintals
Madhya Pradesh 3.7 Quintals
Uttar Pradesh 4.3 Quintals
West Bengal 6.4 Quintals
Overall - Average 4.0 Quintals

HARYALI
68
State Name of No. of % of Total AverageCrops Beneficiaries Beneficiaries Quantity Qty. Kept
Kept for Kept for Kept for for Consump.Consumption Consumption Consumption Q./Benef.
Andhra Pradesh Groundnut 0 0% 0 0Tobacco 0 0% 0 0.0Paddy 151 99% 808 5.4Cotton 0 0% 0 0Red Goan 0 0% 0 0
Total 151 58% 808 5.4
Gujarat Wheat 9 100% 16 1.8Gram 222 98% 225 1.0Groundnut 232 96% 232 1.0Bajra 3 75% 3 1.0Pulses (Moong) 5 83% 5 1.0Pulses(Urad ) 3 75% 3 1.0Cotton 9 4% 13 1.4
Total 483 66% 497 1.0Madhya Pradesh Wheat 210 96% 900 4.3
Til 24 73% 34 1.4Gram 48 81% 110 2.3Maize 3 50% 27 8.8Pulses(Urad) 1 20% 3 3.0Pulses(Moong) 3 75% 3 1.0Pulses(Arhar) 6 100% 9 1.5Bajra 2 100% 6 3.0Paddy 1 100% 2 2.0Groundnut 0 0% 0 0Pea 0 0% 0 0Mustard 1 100% 5 5.0
Total 299 88% 1098 3.7Uttar Pradesh Wheat 439 100% 1824 4.2
Gram 1 100% 1 1Pulses (Arhar) 3 100% 3 1.1Paddy 255 98% 1164 4.6Sugarcane 0 0% 0 0.0
Total 698 99% 2992 4.3West Bengal Wheat 190 98% 844 4.4
Gram 0 0% 0 0.0Paddy 206 100% 1672 8.1Sugarcane 0 0% 0 0.0
Total 396 99% 2516 6.4
Produced Kept for Self Consumption - Irrigated Land (July 2007 to June 2008)Table 3.22

HARYALI
69
The quantity kept for consumption depended upon the size of the family and/or
eating habit. We see that only 1 quintal was kept by the beneficiaries of Gujarat for
consumption purposes whereas 6.4 quintals were kept in West Bengal for
consumption. The average quantity kept per beneficiary was around 4 quintals.
UUNN--IIRRRRIIGGAATTEEDD LLAANNDD
807 beneficiaries from the selected 5 states were interviewed to find out the
difference in crops produced, quantity produced and area sown between irrigated
and un-irrigated land allotted to them.
As in the case of irrigated land different crops were produced in un-irrigated land as
well. However the following 3 crops were common in most of the states.
Gram - Andhra Pradesh, Gujarat, Madhya Pradesh
Mustard - Andhra Pradesh, Madhya Pradesh, West Bengal
Bajara - Andhra Pradesh, Gujarat, West Bengal
Other crops were cotton, wheat, paddy, coriander etc.

HARYALI
70
State Name of No. of Total Area Total Average AverageCrops Beneficiaries Sown Production Productivity Production
(Acre) (Quintal) Q./Acre Q./BeneficiaryAndhra Pradesh Gram 3 6.0 1.5 0.25 1
Mustard 2 4.0 3.0 0.75 2Cotton 110 176.4 344.5 1.95 3Red Goan 9 9.0 13.7 1.53 2Corrinder 3 1.4 5.5 4.01 2Paddy 2 1.5 5.5 3.67 3Custard Seed 4 6.2 6.5 1.05 2Bajra 1 1.2 4.0 3.39 4Total 134 205.7 384.2 1.87 3
Gujarat Gram 85 109.0 425.0 3.90 5Groundnut 9 13.0 24.0 1.85 3Cotton 66 81.0 250.0 3.09 4Annas 5 7.0 18.0 2.57 4Bajra 179 257.2 833.0 3.24 5Total 344 467.2 1550.0 3.32 5
Madhya Pradesh Til 3 3.2 3.5 1.09 1Gram 9 12.2 62.0 5.08 7Mustard 4 4.3 12.0 2.78 3Total 16 19.7 77.5 3.93 5
Uttar Pradesh Wheat 7 4.6 19.0 4.17 3Paddy 6 3.0 15.0 5.00 3Total 13 7.6 34.0 4.50 3
West Bengal Wheat 31 19.0 153.5 8.10 5Paddy 153 69.4 690.0 9.94 5Bajra 1 0.7 7.0 10.61 7Mustard 1 0.1 0.2 2.00 0
Total 186.0 89.2 850.7 9.54 5
Production of Crops - Un-Irrigated Land (July 2007 to June 2008)Table 3.23

HARYALI
71
1. TOTAL AREA SOWN
Average sown area ranged from 19.7 acres to 467 acres. In terms of average sown
area the least acreage sown was in West Bengal (89.2 acres) and highest amount
was in Gujarat 1,550 acres. The average area sown per beneficiary was 1.21 acres.
2. TOTAL PRODUCTION IN QUINTALS
Highest production was seen in Gujarat (1,550 quintals) and least in Uttar Pradesh,
only 34 quintals. The average production per beneficiary was very low i.e. only 4.28
quintals.
3. AVERAGE PRODUCTION PER ACRE
Production per acre ranged from 1.8 quintals to 9.54 quintals. Highest production
per acre was in West Bengal (9.64 quintals) and lowest in Andhra Pradesh 1.87
quintals. The average production per acre was 3.53 quintals.

HARYALI
72

HARYALI
73
4. TOTAL QUANTITY OF GAIN SOLD
Total quantity of gain sold ranged from 0 quintal to 1,329 quintals in sample states.
In Uttar Pradesh not even 1 quintal was sold whereas in Gujarat 1,329 quintals were
sold. The average quantity sold per beneficiary was 3.72 quintals.
The percentage ranged from 16 to 71 of total production. In West Bengal only 16%
of total produced was sold and in Gujarat as high as 86%.
5. AVERAGE ANNUAL INCOME PER BENEFICIARY
It ranged from Rs. 3,277/- to Rs. 5,965/- (no grain was sold and Uttar Pradesh)
highest income was that of Madhya Pradesh beneficiaries (Rs. 5,965/-) and lowest
that of West Bengal (Rs. 3,277/-). The average income per beneficiary was Rs.
5,070/-.
6. AVERAGE QUANTITY KEPT FOR CONSUMPTION
Average quantity per beneficiary kept for consumption ranged from 0 quintal to 7.3
quintals.
State Quantity (Quintals)
Andhra Pradesh 2.7 Quintals
Gujarat 00 Quintals
Madhya Pradesh 7.3 Quintals
Uttar Pradesh 4.8 Quintals
West Bengal 5.3 Quintals
Overall - Average 3.0 Quintals

HARYALI
74
COMPARISON OF CROP GROWN IN IRRIGATED AND UN-IRRIGATED LAND
State Name of No. of % of Total AverageCrops Beneficiaries Beneficiaries Quantity Qty. Kept
Kept for Kept for Kept for for Consump.Consumption Consumption Consumption Q./Benef.
Andhra Pradesh Gram 0 0% 0 0.0Mustard 2 100% 3 1.5Cotton 32 29% 91 2.8Red Goan 3 33% 5.7 1.9Corrinder 0 0% 0 0.0Paddy 2 100% 5.5 2.8Custard Seed 1 25% 1.5 1.5Bajra 0 0% 0 0.0Total 40 30% 106.7 2.7
Gujarat Gram 71 84% 73 1.0Groundnut 0 0% 0 0.0Cotton 0 0% 2 0.0Annas 0 0% 0 0.0Bajra 140 78% 142 1.0Total 211 61% 217 0.0
Madhya Pradesh Til 0 0% 0 0.0Gram 4 44% 29 7.3Mustard 0 0% 0 0.0Total 4 25% 29 7.3
Uttar Pradesh Wheat 7 100% 19 2.7Paddy 6 100% 44 7.3Total 13 100% 63 4.8
West Bengal Wheat 31 100% 131 4.2Paddy 151 99% 832 5.5Bajra 1 100% 7 7.0Mustard 1 100% 5 5.0
0.0Total 184 99% 975 5.3
17136 29 107
2312 500 4.6240.6 130
1387.2 601.12600
1201.12
Table 3.25 Produced Kept for Self Consumption - Un-Irrigated Land (July 2007 to June 2008)

HARYALI
75
SI. VARIABLES
COMPARED IRRIGATED LAND UN IRRIGATED LAND
Crops grown Groundnut Grown in M.P., Gujarat,
A.P. M.P., Gujarat, A.P.
Paddy
All states except Gujarat Mustard- in A.P., M.P., W.B.
1.
Pulses
All states except A.P., W.B. Bajara- A.P., Gujarat, W.B.
2 Total area sown (acre) Least in A.P. (204 acres) Highest in Gujarat (945 acres) Average area under cultivation per state (434 acres)
Least in W.B. (89.2 acres) Highest in Gujarat (1,550 acres) Average area under Cultivation per state (158 acres)
3 Total production Highest in Gujarat 8,285 quintals Least in A.P. 135 quintals Average production per state 3,964 quintals
Highest in Gujarat 1,550 quintals Least in U.P. 34 quintals Average production per state 889 quintals
4 Average production per acre
9 quintals per acre
4.6 quintals per acre
5 Average production per beneficiary
It ranged from 5.1 to 11.3 quintals. The highest amount by Gujarat beneficiaries’ 11.3 quintals followed by W.B., 104 quintals. Least amount was produced by M.P. beneficiaries 6.1 quintals, followed by A.P. beneficiaries 5.2 quintals. Overall average quintal per beneficiary 7.6 quintals
It ranged from 3 to 5 quintals per beneficiary. It was 5 quintals each in Gujarat, M.P. and W.B. and 3 quintals each in M.P. and U.P. Overall all average per beneficiary 4.2 quintals.
SI. VARIABLES IRRIGATED LAND UN IRRIGATED LAND
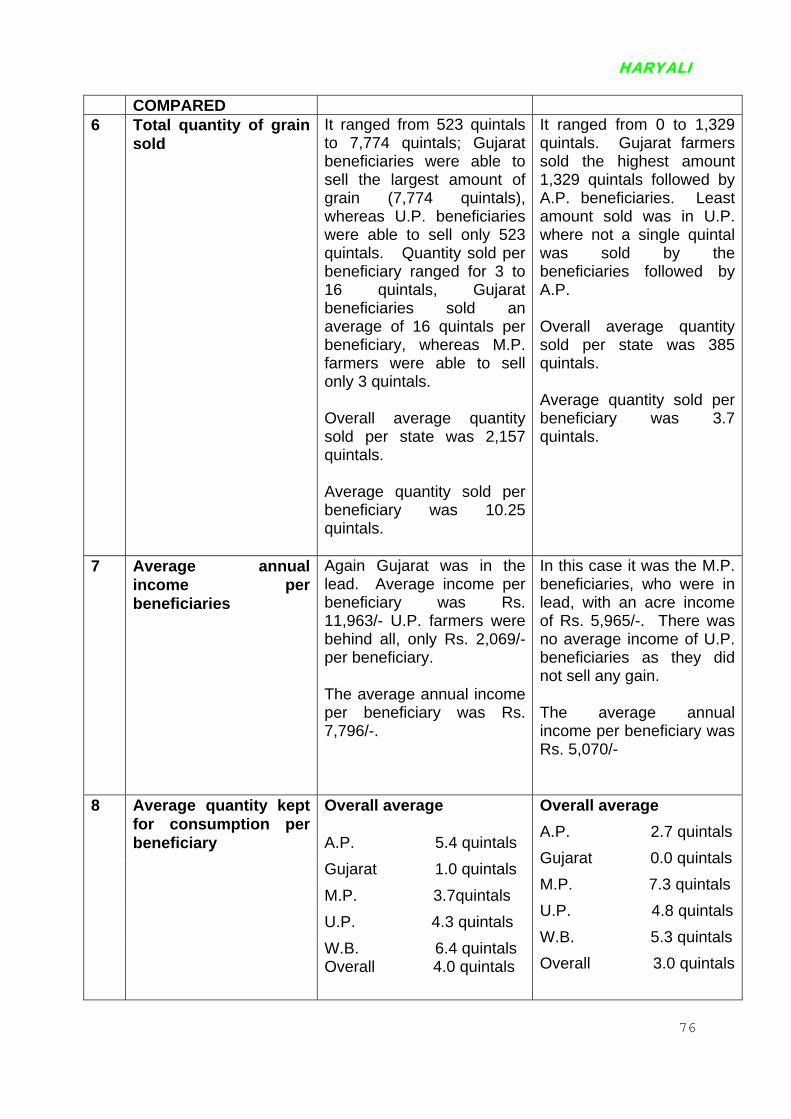
HARYALI
76
COMPARED 6 Total quantity of grain
sold It ranged from 523 quintals to 7,774 quintals; Gujarat beneficiaries were able to sell the largest amount of grain (7,774 quintals), whereas U.P. beneficiaries were able to sell only 523 quintals. Quantity sold per beneficiary ranged for 3 to 16 quintals, Gujarat beneficiaries sold an average of 16 quintals per beneficiary, whereas M.P. farmers were able to sell only 3 quintals. Overall average quantity sold per state was 2,157 quintals. Average quantity sold per beneficiary was 10.25 quintals.
It ranged from 0 to 1,329 quintals. Gujarat farmers sold the highest amount 1,329 quintals followed by A.P. beneficiaries. Least amount sold was in U.P. where not a single quintal was sold by the beneficiaries followed by A.P. Overall average quantity sold per state was 385 quintals. Average quantity sold per beneficiary was 3.7 quintals.
7 Average annual income per beneficiaries
Again Gujarat was in the lead. Average income per beneficiary was Rs. 11,963/- U.P. farmers were behind all, only Rs. 2,069/- per beneficiary. The average annual income per beneficiary was Rs. 7,796/-.
In this case it was the M.P. beneficiaries, who were in lead, with an acre income of Rs. 5,965/-. There was no average income of U.P. beneficiaries as they did not sell any gain. The average annual income per beneficiary was Rs. 5,070/-
Overall average A.P. 5.4 quintals Gujarat 1.0 quintals M.P. 3.7quintals U.P. 4.3 quintals
8 Average quantity kept for consumption per beneficiary
W.B. 6.4 quintals Overall 4.0 quintals
Overall average A.P. 2.7 quintals Gujarat 0.0 quintals M.P. 7.3 quintals U.P. 4.8 quintals W.B. 5.3 quintals Overall 3.0 quintals

HARYALI
77
The quantity kept for consumption depended upon the size of the family and/or
eating habit. We see that only 1 quintal was kept by Gujarat beneficiaries for
consumption, whereas 6.4 quintals were kept in West Bengal for consumption.
CONCLUDING REMARK
This section aims to bring to light the productivity of land and the monetary benefits
accruing to the SC recipients of the allotted land. This is a significant indicator of land
utilization by the beneficiaries. A concerted effort was made to understand the
variation between irrigated and un-irrigated land
• Different crops were grown in irrigated and Un-irrigated land. Groundnut was
the common crop grown in several states. Average area under cultivation per
state was 439 acres of irrigated land and 156 acres of Un-irrigated land.
Highest average area under cultivation was in Gujarat and least in Andhra
Pradesh and Uttar Pradesh.
• Average productivity for all crops in irrigated land was 9.3 quintals per acre
and only 4.6 quintals in un-irrigated land.
• Average production per beneficiary was 7.6 quintals in irrigated land and 4.2
quintals in un-irrigated.
• A Noteworthy trend that emerged was that the productivity of majority of the
crops grown by the SC beneficiaries was below the national average. For
example In UP the Paddy productivity is generally 20-25 quintals/acre
whereas the paddy productivity in SC families was noted to be 11
quintals/acre. Similarly the In UP the Wheat productivity is generally 18-20
quintals/acre whereas the wheat productivity in SC families was noted to be
merely 8.5 quintals/acre.
• Overall total quantity sold was 2,157 quintals (irrigated land) and 358 quintals
(un-irrigated). Gujarat farmer were able to sell 16 quintals per beneficiary

HARYALI
78
whereas Madhya Pradesh beneficiaries were able to sell only 3 quintals per
beneficiary.
• The average income per beneficiary in Gujarat was Rs. 11,963/- as against
only Rs. 2,069/- per Uttar Pradesh beneficiary.
• West Bengal kept the largest amount of grain for consumption purpose, per
beneficiary 64 quintals, whereas in Gujarat, it was only 1 quintal, the rest they
were able to sell away.
OBJECTIVES 5 TO ASSESS THE PROBLEMS FACED BY THE BENEFICIARIES IN PROPER UTILIZATION OF THE LAND ALLOTED TO THEM
TTables 3.26 to 3.38 shows the problems faced by the beneficiaries in the proper
utilization of the land allotted to them and Tables 3.39 to 3.47 show the efforts made
by them to improve the land.
StateNo. % No.
Andhra Pradesh 225 45% 275Gujarat 248 50% 252Madhya Pradesh 73 24% 235Uttar Pradesh 38 8% 460West Bengal 15 3% 485
Total 599 26% 1707
Table 3.26Land is unfertile
Yes No% No. %
55% 500 100%50% 500 100%76% 308 100%92% 498 100%97% 500 100%
74% 2306 100%
Total
As mentioned earlier a significant issue is the quality of land. 26% of the land
allotted to SC families was unfertile and 74% fertile. The largest type of unfertile

HARYALI
79
land given to them was in Gujarat and Andhra Pradesh. Uttar Pradesh and West
Bengal gave mostly fertile land.
TTHHEE MMAAIINN PPRROOBBLLEEMMSS FFAACCEEDD IINN TTHHEE UUTTIILLIIZZAATTIIOONN OOFF LLAANNDD
If the allotted land is to make a difference in the lives of the poor SC’s it is very
significant that they should be able to utilize it to the hilt. The fact that largely the land
allotted to the SC’ constitutes marginal holdings severely limits the benefits that
accrue to the SC’s. Further they face several problems in utilizing the land. In 12 %
of the cases the land was not leveled (Table 3.27). In 12% of the cases the land
allotted was wasteland and full of stone hence not productive without intensive land
development (Table 3.28). Significantly in Madhya Pradesh 25% of the respondents
mentioned this as the key problem.

HARYALI
80
StateNo. % No.
Andhra Pradesh 19 4% 4Gujarat 133 27% 36Madhya Pradesh 67 22% 24Uttar Pradesh 50 10% 44West Bengal 14 3% 48
Total 283 12% 202
Table 3.27Land is not levell
Yes% No. %
81 96% 500 100%7 73% 500 100%1 78% 308 100%8 90% 498 100%6 97% 500 100%
3 88% 2306 100%
ed
No Total
StateNo. % No.
Andhra Pradesh 3 1% 49Gujarat 89 18% 41Madhya Pradesh 77 25% 23Uttar Pradesh 35 7% 4West Bengal 76 15% 42
Total 280 12% 202
Table 3.28Wasteland & Full of Ston
Yes% No. %
7 99% 500 100%1 82% 500 100%1 75% 308 100%
63 93% 498 100%4 85% 500 100%
6 88% 2306 100%
e Land
No Total
StateNo. % No.
Andhra Pradesh 253 51%Gujarat 343 69%Madhya Pradesh 100 32%Uttar Pradesh 75 15%West Bengal 412 82%
Total 1183 51% 1123
Table 3.29Lack of irrigation faci
Yes% No. %
247 49% 500 100%157 31% 500 100%208 68% 308 100%423 85% 498 100%88 18% 500 100%
49% 2306 100%
lity
No Total
51% did not have adequate irrigation facilities. As high as 69% of the respondents in
Gujarat cited this issue.

HARYALI
81
StateNo. % No.
Andhra Pradesh 400 80%Gujarat 457 91%Madhya Pradesh 268 87%Uttar Pradesh 313 63%West Bengal 235 47%
Total 1673 73%
Table 3.30Electricity probl
Yes% No. %
100 20% 500 100%43 9% 500 100%40 13% 308 100%
185 37% 498 100%265 53% 500 100%
633 27% 2306 100%
ems
No Total
73% of the respondents did not have adequate supply of electricity. This emerged
as an all-pervasive problem barring West Bengal where 53% did not face shortage of
electricity.
Some of the other problems cited were pertaining to the lack of facilities to plough
the land. 77% of the respondents did not have animals to plough the land and for
other agricultural operations (Table 3.31) while 74% did not have tractors (Table
3.32).
StateNo. % No.
Andhra Pradesh 492 98%Gujarat 470 94%Madhya Pradesh 180 58%Uttar Pradesh 287 58%West Bengal 337 67%
Total 1766 77%
Table 3.31Lack of animals to fa
Yes% No. %
8 2% 500 100%30 6% 500 100%
128 42% 308 100%211 42% 498 100%163 33% 500 100%
540 23% 2306 100%
rm the land
No Total

HARYALI
82
StateNo. % No.
Andhra Pradesh 421 84%Gujarat 467 93%Madhya Pradesh 177 57%Uttar Pradesh 300 60%West Bengal 349 70%
Total 1714 74%
Table 3.32Non availability of tractor/a
Yes% No. %
79 16% 500 100%33 7% 500 100%
131 43% 308 100%198 40% 498 100%151 30% 500 100%
592 26% 2306 100%
nimals for ploughing on time
No Total
StateNo. % No. %
Andhra Pradesh 487 97% 13 3Gujarat 484 97% 16 3Madhya Pradesh 248 81% 60 19Uttar Pradesh 338 68% 160 32West Bengal 233 47% 267 53
Total 1790 78% 516 22
Table 3.33Financial Problem
Yes NoNo. %
% 500 100%% 500 100%% 308 100%% 498 100%% 500 100%
% 2306 100%
Total
The most significant problem that emerged was that the while the SC’s had land they
did not have the finances improve land productive and make their small landholdings
viable. 78% did not have enough money to procure facilities required to improve
productivity. Relatively West Bengal respondents were not so hard pressed as
farmers of other states, particularly Andhra Pradesh and Gujarat farmers.
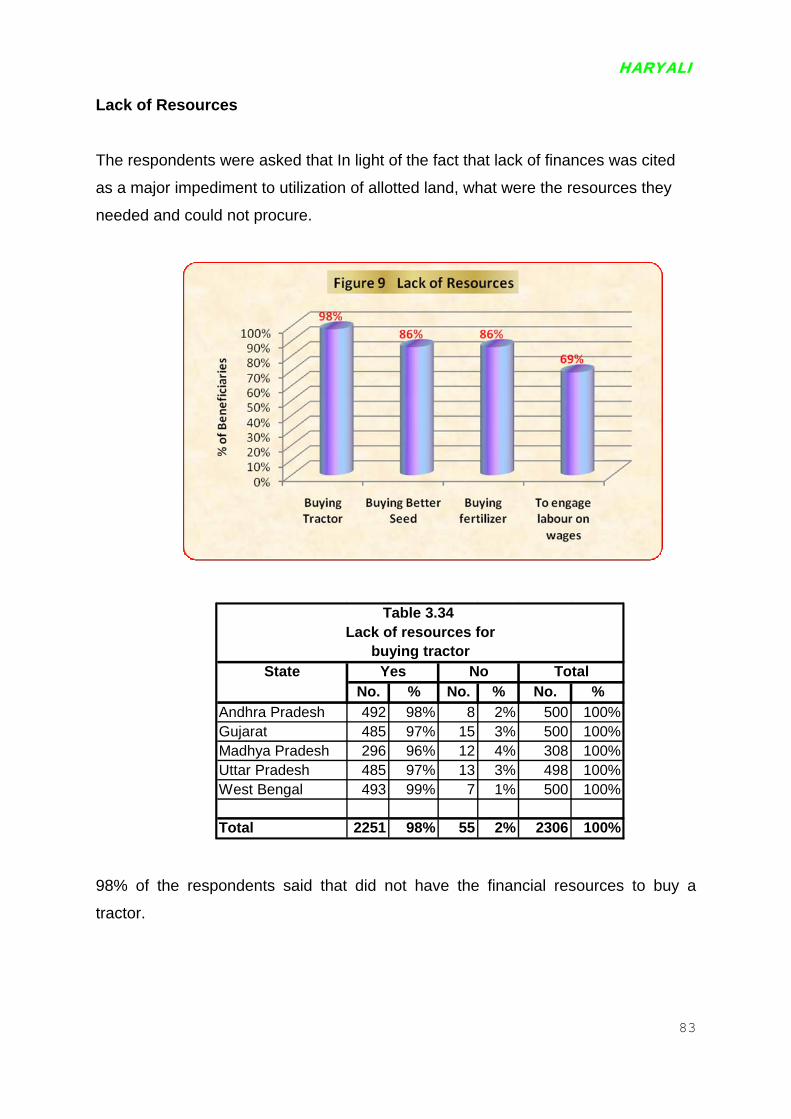
HARYALI
83
Lack of Resources
The respondents were asked that In light of the fact that lack of finances was cited
as a major impediment to utilization of allotted land, what were the resources they
needed and could not procure.
StateNo. % No.
Andhra Pradesh 492 98%Gujarat 485 97%Madhya Pradesh 296 96%Uttar Pradesh 485 97%West Bengal 493 99%
Total 2251 98%
Lack of resources fTable 3.34
buying tractYes
% No. %8 2% 500 100%
15 3% 500 100%12 4% 308 100%13 3% 498 100%
7 1% 500 100%
55 2% 2306 100%
oror
No Total
98% of the respondents said that did not have the financial resources to buy a
tractor.
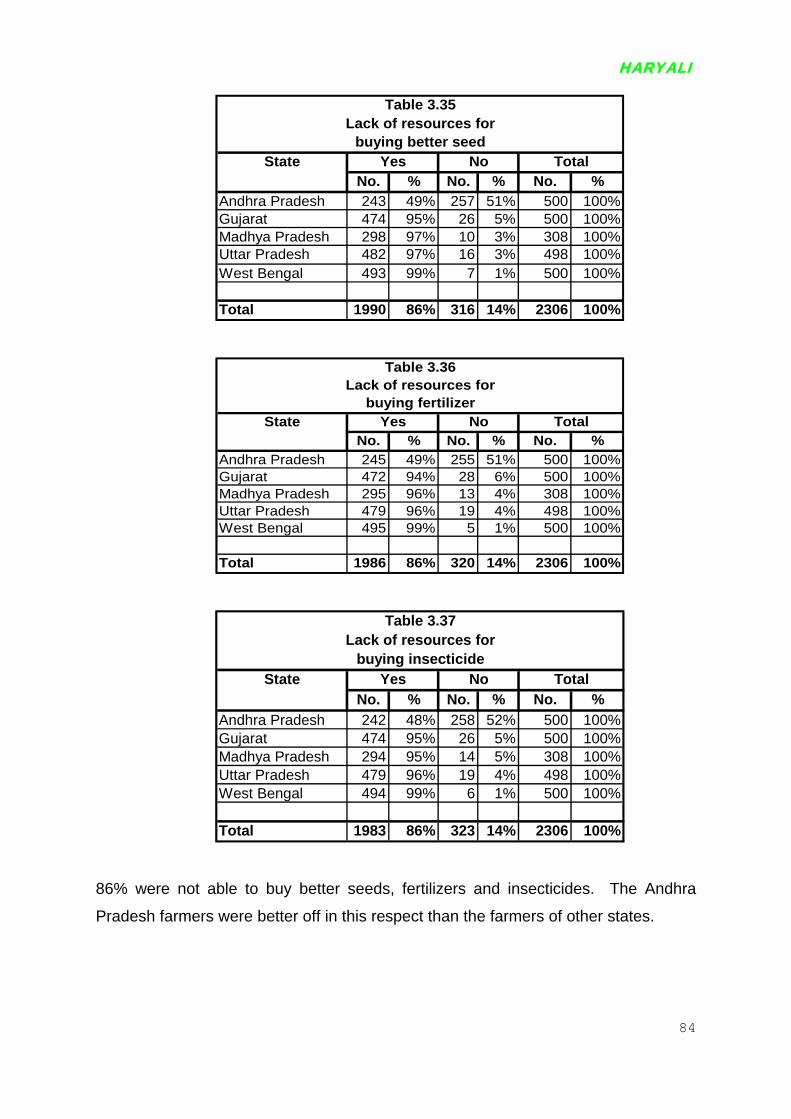
HARYALI
84
StateNo. % No.
Andhra Pradesh 243 49%Gujarat 474 95%Madhya Pradesh 298 97%Uttar Pradesh 482 97%West Bengal 493 99%
Total 1990 86%
Table 3.35Lack of resources f
buying betteYes
% No. %257 51% 500 100%26 5% 500 100%10 3% 308 100%16 3% 498 100%
7 1% 500 100%
316 14% 2306 100%
orr seed
No Total
StateNo. % No.
Andhra Pradesh 245 49%Gujarat 472 94%Madhya Pradesh 295 96%Uttar Pradesh 479 96%West Bengal 495 99%
Total 1986 86%
Table 3.36Lack of resources f
buying fertilizeYes
% No. %255 51% 500 100%28 6% 500 100%13 4% 308 100%19 4% 498 100%
5 1% 500 100%
320 14% 2306 100%
orrNo Total
StateNo. % No.
Andhra Pradesh 242 48%Gujarat 474 95%Madhya Pradesh 294 95%Uttar Pradesh 479 96%West Bengal 494 99%
Total 1983 86%
Table 3.37Lack of resources f
buying insecticYes
% No. %258 52% 500 100%
26 5% 500 100%14 5% 308 100%19 4% 498 100%
6 1% 500 100%
323 14% 2306 100%
orideNo Total
86% were not able to buy better seeds, fertilizers and insecticides. The Andhra
Pradesh farmers were better off in this respect than the farmers of other states.

HARYALI
85
StateNo. % No.
Andhra Pradesh 164 33%Gujarat 464 93%Madhya Pradesh 189 61%Uttar Pradesh 280 56%West Bengal 491 98%
Total 1588 69%
Table 3.38Lack of resources f
engaging labour on wYes
% No. %336 67% 500 100%
36 7% 500 100%119 39% 308 100%218 44% 498 100%
9 2% 500 100%
718 31% 2306 100%
orages
No Total
69% did not have enough money to engage labour and pay their wages. Andhra
Pradesh farmers were better off in this respect than farmers of other states
particularly that of West Bengal, where 98%, faced this problem.
To sum up the main hurdle in yielding the requisite benefits was the poor economic
condition of the SC beneficiaries. Though they were allotted the land, which
significantly added to their land base yet they lacked the means to utilize this land,
this was because the instances in which inputs were requires for land improvement
the majority of the beneficiaries could not procure them.
Use of Agricultural Equipments
State
No. % No. % No. % No. % No. % No.Andhra Pradesh 468 94% 363 73% 317 63% 319 64% 367 73% 366Gujarat 500 100% 500 100% 499 100% 500 100% 500 100% 498Madhya Pradesh 265 86% 233 76% 35 11% 29 9% 65 21% 34Uttar Pradesh 460 92% 449 90% 449 90% 443 89% 473 95% 452West Bengal 500 100% 500 100% 500 100% 495 99% 500 100% 498
Total 2193 95% 2045 89% 1800 78% 1786 77% 1905 83% 1848
Harrow Trolley
Table 3.39Use of Agricultural equipments
EquipmentsAnimal for ploughPloughTractor Cultivator
%73%
100%11%91%
100%
80%
ing
Majority of beneficiaries were using tractor, cultivator and harrow for ploughing the
field.

HARYALI
86
Hiring of Agricultural Equipments
StateNo. % No. %
Andhra Pradesh 16 452 97%Gujarat 0% 500 100%Madhya Pradesh 3 1% 262 99%Uttar Pradesh 0% 431 100%West Bengal 0% 499 100%
Total 19 1% 2144 99%
Owned Hired
Hiring Agricultural EquipmentsTractor / Harrow /Cultivator
Table 3.40
TotalNo. %468 100%500 100%265 100%431 100%499 100%
2163 100%
Almost all of the respondents had to hire agricultural equipments, like tractor and
harrow for cultivation.
StateNo. % No. %
Andhra Pradesh 46 13% 320 87%Gujarat 22 4% 476 96%Madhya Pradesh 11 32% 23 68%Uttar Pradesh 24 5% 428 95%West Bengal 62 12% 436 88%
Total 16
No. %366 100%498 100%34 100%
452 100%498 100%
5 9% 1683 91%
Owned Hired
Table 41Hiring Animal for Ploughing
1848 100%
Total
Only 9% of the allotees owned their own animals for ploughing the land. Madhya
Pradesh allotees owned the largest number of animals, while Gujarat allotees the
least number.
As high as 91% had to hire the animals for ploughing their fields which necessitates
financial resources. This lends support as to why the respondents had pointed to the
lack of resources for ploughing land as an impediment to land utilization.

HARYALI
87
Irrigating the land
As outlined in the earlier section, irrigation of land was a major concern for the SC
beneficiaries.
State
No. % No. %Andhra Pradesh 246 91% 24Gujarat 468 100% 0Madhya Pradesh 144 61% 93Uttar Pradesh 447 96% 17West Bengal 169 56% 131
Total 1444 83% 265Note: Other Sources: Canal, Well, Drip Irrigation, Ponds,
Table 3.42Main Source of irrigation
Source of irrigationPumset Other
No. %9% 270 100%0% 468 100%
39% 237 100%4% 464 100%
44% 300 100%
15% 1739 100% etc.
Total
They used various sources for irrigating the land, like
• Uses of pumpset
• Uses of canal
• Uses of wells
• Adopting drip irrigation method
• Using ponds
Use of Pump set was the most common method of irrigating the land (83%), followed
by canals and wells. Using pump set was the most popular method in Gujarat and
Uttar Pradesh. But only 11% owned the pump sets, 89% hired them (Table 3.42).

HARYALI
88
StateNo. % No. %
Andhra Pradesh 27 11% 21No. %
9 89%Gujarat 4 1% 464 99%Madhya Pradesh 73 51% 71 49%Uttar Pradesh 31 7% 386 93%West Bengal 22 13% 147 87%
Total 157 11% 1287 89%
Table 3.43Hired or Own Pumpset
PumpsetOwn Hired
246 100%468 100%144 100%417 100%169 100%
1444 100%
Total
Average expenses incurred to improve the quality of unfertile land was Rs. 7,981/-.
State Average Amountexpensed
6,062 8,921 2,500 9,267
NA
7,981
ncurrede Unfertile Land
Andhra PradeshGujaratMadhya PradeshUttar PradeshWest Bengal
Total
Average Expenses ITable 3.44
to Improve the Quality of th
To make the land holdings economically viable the beneficiaries had to incur
significant expenditure. The highest amount was incurred by the farmer of Uttar
Pradesh (Rs. 9,267/-) followed by Gujarat farmer (Rs. 8,921/-).

HARYALI
89
Types of efforts made
State
No % No % No % No % No %Andhra Pradesh 98 44% 1 0% 1 0% 112 50% 13 6%Gujarat 26 10% 49 20% 5 2% 144 58% 24 10%Madhya Pradesh 68 93% 0% 4 5% 1 1% 0%Uttar Pradesh 4 11% 7 18% 4 11% 20 53% 3 8%West Bengal 15 100% 0% 0% 0% 0%
Total 211 35% 57 10% 14 2% 277 46% 40 7%
Levelled land toAdded Soil Created AnyAmendments Drainage otherenable cultivation
Table 3.45Efforts to Improve the Quality of the Unfertile Land
Nothing
No %225 100%248 100%73 100%38 100%15 100%
599 100%
Total
35% did not make any effort to improve the quality of the land. Among them the
allotees of West Bengal and Madhya Pradesh were in the lead. 100% of the allotees
in West Bengal and 93% in Madhya Pradesh did not make effort to improve the
quality of the land. Most common methods used were:
• Adding fresh soil-10%
• Creating drainage-2%
• Leveling the land-46%
• Others-7%
EEFFFFOORRTTSS MMAADDEE TTOO GGEETT LLOOAANN FFOORR TTHHEE BBEETTTTEERR UUTTIILLIIZZAATTIIOONN OOFF TTHHEE
AALLLLOOTTTTEEDD LLAANNDD

HARYALI
90
StateNo. % No. % No. %
Andhra Pradesh 264 53% 236 47% 500 100%Gujarat 433 87% 67 13% 500 100%Madhya Pradesh 15 5% 293 95% 308 100%Uttar Pradesh 99 20% 399 80% 498 100%West Bengal 22 4% 478 96% 500 100%
Total 833 36% 1473 64% 2306 100%
Table 3.46Try to get loan to improved the cultivation
Tried to get LoanYes No Total
No. %244 49%425 85%
1 0%94 19%13 3%
777 34%
LoanReceived
Since most of the respondents attributed the difficulty in utilization of land owing to
lack of financial resources, an attempt was made to find out the possibilities of
supportive investment assistance to make land productive. Out of 2,306 persons
who had been allotted land, only 36% made efforts to raise loan to improve the
productivity.
State
No. % No. % No. % No. % No. % No.Andhra Pradesh 0 0% 243 100% 1 0% 0 0% 0 0% 244Gujarat 2 0% 2 0% 244 57% 57 13% 120 28% 425Madhya Pradesh 1 100% 0 0% 0 0% 0 0% 0 0%Uttar Pradesh 7 7% 87 93% 0 0% 0 0% 0 0% 9West Bengal 4 31% 5 38% 4 31% 0 0% 0 0% 1
Total 14 2% 337 43% 249 32% 57 7% 120 15% 777
BDOMahajan
Bank Friends Zamindar /Brother/Relative
Table 3.47Source of Loan Taken
Office%
100%100%
1 100%4 100%3 100%
100%
Total
43% of the respondents who said that they tried taking a loan availed formal credit
through Banks especially in Andhra Pradesh and Uttar Pradesh there is greater
access to the formalized banking system. 28% of the respondents in Gujarat
approached traditional moneylenders which illustrates the continued prevalence of
preference for informal credit despite the presence of banks giving loans at
subsidized interest. Only 2% got loan from the BDO’s.

HARYALI
91
State
No. % No. % No. % No. % No.Andhra Pradesh 0% 242 99% 0% 2 1% 244Gujarat 8 2% 36 8% 346 81% 35 8% 425Madhya Pradesh 0% 1 100% 0% 0% 1Uttar Pradesh 10 11% 42 45% 0% 42 45% 94West Bengal 0% 4 31% 0% 9 69% 13Total 18 2% 325 42% 346 45% 88 11% 777
Table 3.48Interest Rate of Loan Taken
Interest Rate T0-10 10-20 20-30 30+
%100%100%100%100%100%100%
otal
The poor SC‘s had to take a loan at interest rates ranging form 2% to 45%. This
illustrates a worrisome feature: one is that even though there are banks and several
government initiatives have been taken to give loans to rural poor at subsidized
rates, SC’s often rely of the traditional exploitative informal credit system and get
caught in the debt trap.
TTOO SSTTUUDDYY TTHHEE BBEENNEEFFIICCIIAARRIIEESS OOFF NNAATTIIOONNAALL SSCCHHEEDDUULLEEDD CCAASSTTEE FFIINNAANNCCEE DDEEVVEELLOOPPMMEENNTT CCOORRPPOORRAATTIIOONN ((NNSSFFDDCC))
Awareness about National Scheduled Caste Finance Development Corporation
(NSFDC)
StateNo. % No. %
Andhra Pradesh 248 50% 252 50%Gujarat 31 6% 469 94%Madhya Pradesh 18 4% 483 96%Uttar Pradesh 47 9% 453 91%West Bengal 47 9% 453 91%
Total 391 16% 2110 84%
Table 3.49Awareness about NSFDC
Yes NoNo. %
500 100%500 100%501 100%500 100%500 100%
2501 100%
Total

HARYALI
92
National Scheduled Caste Finance Development Corporation (NSFDC) provides
credit facilities to SC who are living below the double poverty line. The main purpose
of the corporation is to provide assistance to SC to help them develop economically.
But surprisingly, only 16% of the respondents were even aware of its existence.
Only 4% respondents in Madhya Pradesh, 6% in Gujarat and 9% of the respondents
in Uttar Pradesh and West Bengal were aware of the NSFDC. As compared to other
states only in Andhra Pradesh the respondents displayed awareness about the
corporation as 50% of the A.P. respondents knew about it (Table 3.49).
Beneficiaries taken loan from the corporation
StateNo. % No. %
Andhra Pradesh 1 0% 499 100%Gujarat 27 5% 473 95%Madhya Pradesh 0% 501 100%Uttar Pradesh 3 1% 497 99%West Bengal 7 1% 493 99%
Total 38 2% 2463 98%
Table 3.50Taken Loan from NSFDC
NSFDCYes No
No. %500 100%500 100%501 100%500 100%500 100%
2501 100%
Total

HARYALI
93
Only 2% of the respondents had taken loan from NSFDC. 98% did not avail any
facilities offered by the corporation. During the interaction the respondents pointed
out that the main reason was that they did not apply for it, as they were not aware of
the existence of NSFDC. In the case of Andhra Pradesh 50% of the respondents
knew about it, but not even a single respondent availed of the loan. This was
because they did not apply to the NSFDC for A loan (Table 3.50).
Loan taken from different schemes
State
No. % No. % No. % No.Andhra Pradesh 1 100% 0%Gujarat 27 100% 0%Madhya PradeshUttar Pradesh 3 100% 0%West Bengal 4 57% 2 1 14%
Total 35 92% 2 5% 1 3%
Gen. Scheme Scheme Development
Table 3.51Taken Loan Under the Schemes
Income Micro Credit New / Skill
%1 100%
27 100%03 100%7 100%
38 100%
Total
Most of the respondents took the loan under the income Generating Scheme (92%).
Other scheme it seems were not very popular as only 5% of the respondents took
loan from the Micro Credit Scheme, and 3% from the Skill development scheme
(Table 3.51).

HARYALI
94
OBJECTIVES 6 TO STUDY THE IMPACT OF LAND ALLOTMENT ON THE SOCIO-ECONOMIC STATUS OF BENEFICIARIES’ FAMILY
PROFILE OF THE BENEFICAIRIES (RESPONDENTS) SSEEXX
StateNo. % No. %
Andhra Pradesh 170 34% 330 66%Gujarat 498 100% 2 0%Madhya Pradesh 484 97% 17 3%Uttar Pradesh 478 96% 22 4%West Bengal 475 95% 25 5%
Total 2105 84% 396 16%
Table 3.52Respondents by Sex
Male FemaleNo. %
500 100%500 100%501 100%500 100%500 100%
2501 100%
Total
84% of the respondents were male and 16% females. It is interesting to note that as
high as 66% respondents of Andhra Pradesh were female. Conversely there was
not even one female respondent among 500 respondents of Gujarat.
PPRROOFFEESSSSIIOONN
State
No. % No. % No. % No. % No. % No. % No.Andhra Pradesh 38 8% 1 0% 0% 1 0% 7 1% 453 91% 500Gujarat 2 0% 33 7% 1 0% 0% 0% 464 93% 500Madhya Pradesh 1 0% 0% 1 0% 2 0% 0% 497 99% 501Uttar Pradesh 17 3% 121 24% 5 1% 2 0% 8 2% 347 69% 500West Bengal 3 1% 0% 0% 1 0% 2 0% 494 99% 500
Total 61 2% 155 6% 7 0% 6 0% 17 1% 2255 90% 2501
Service Service
Table 3.53Main Occupation of the Respondents
Housewife Agriculture Government Private Business TLabour
%100%100%100%100%100%
100%
otal

HARYALI
95
90% of the respondents were labourers. Only 6% were agriculturists and 2%
housewives. What emerges clearly is that most of the SC population is dependent on
agriculture but to a very minimal extent as agricultural cultivators and mostly as
agricultural labourers.
EEDDUUCCAATTIIOONN
State
No. % No. % No. % No. % No. % No. % No. % No.Andhra Pradesh 473 95% 0% 9 2% 5 1% 8 2% 3 1% 2 0% 500Gujarat 435 87% 0% 26 5% 36 7% 2 0% 0% 1 0% 500Madhya Pradesh 369 74% 7 1% 81 16% 30 6% 10 2% 3 1% 1 0% 501Uttar Pradesh 363 73% 0% 52 10% 50 10% 26 5% 3 1% 6 1% 500West Bengal 129 26% 5 1% 157 31% 186 37% 23 5% 0 0% 0 0% 500
Total 1769 71% 12 0% 325 13% 307 12% 69 3% 9 0% 10 0% 2501
Table 3.54Respondents by Education
Illeterate Neo- Primary Middle High Interme- Graduate TSchool diate & Aboveliterate School
%100%100%100%100%100%
100%
otal

HARYALI
96
It is very interesting to note that even though the literacy campaign to make at least
55% persons literate, was going on in these states, for over 20 years, yet 71% of the
respondents were illiterate and 0% neo literate i.e. made literate through the Mass
Literacy Campaign. 28% of them had received education through the formal system.
This means that the contribution of formal education was much more than the Mass
Literacy Campaign. Education is one of the key components that can play a decisive
role in improving the status of the SC. Lack of education not only disempowers the
SC‘s but further reinforces their dependence on agriculture.
FFAAMMIILLYY MMOONNTTHHLLYY AAVVEERRAAGGEE IINNCCOOMMEE
State
No. % No. % No. % No. %
Andhra Pradesh 331 72% 130 28% 0% 1 0%Gujarat 129 26% 356 72% 7 1% 0%Madhya Pradesh 450 91% 46 9% 0% 1 0%Uttar Pradesh 371 78% 101 21% 3 1% 2 0%West Bengal 496 100% 0% 0% 1 0%
Total 1777 73% 633 26% 10 0% 5 0%
4000 6000
Table 3.55Monthly Total Family Income of the Respondents
Upto Rs. 2000 Rs. 2000- Rs. 4000- Rs. 6000+
No. %
462 100%492 100%497 100%477 100%497 100%
2425 100%
Total
The monthly family income of 73% of the respondents was below Rs. 2,000/-. This
attests to the sheer poverty that characterizes most SC households.

HARYALI
97
State AverageIncome (Rs.)
4,309 4,855 3,371 2,635 1,846
3,401
the Respondents
Andhra PradeshGujaratMadhya PradeshUttar PradeshWest Bengal
Average
Table 3.56Monthly Average Family Income of
Average family income of the respondents was Rs. 3,401/-. Highest income was
that of Gujarat respondents (Rs. 4,855/-) followed by Andhra Pradesh (Rs. 4,309/-).
West Bengal respondents were the poorest, having a monthly income of only Rs.
1,846/-.
These tables show that quite a large number of respondents felt that allotment of
land to them has helped them in informing the standard of their social life &
particularly in the following aspects.

HARYALI
98
IMPACT ON SOCIAL STATUS
Land is a prime asset, which has a significant impact on a person’s socio-economic
status especially in rural India. Land plays a critical role in improving the living status
of SC’s in Rural India. Ownership and control over land determine ones standing in
the agrarian hierarchy. These tables show that despite the fact that the land that the
SC beneficiaries gained was largely sub-marginal and the utilization below optimal
large number of respondents perceived that the allotment of land had helped them in
improving their living status particularly in the following aspects:
IIMMPPAACCTT OONN TTHHEE SSOOCCIIAALL LLIIFFEE OOFF BBEENNEEFFIICCIIAARRIIEESS IISS SSHHOOWWNN IINN TTAABBLLEE 33..5577 TTOO TTAABBLLEE 33..6644..
a) Schooling of Children
StateNo. % No.
Andhra Pradesh 438 88% 62Gujarat 408 82% 92Madhya Pradesh 206 67% 102Uttar Pradesh 430 86% 69West Bengal 257 52% 242
Total 1739 75% 567
Table 3.57Children admitted to good s
Yes N% No. %12% 500 100%18% 500 100%33% 308 100%14% 499 100%48% 499 100%
25% 2306 100%
chool
o Total
75% said that they were able to admit their children in schools. 88% respondents of
Andhra Pradesh had expressed this opinion (Table 3.57).

HARYALI
99
b) Eating Better Food
StateNo. % No. % No. %
Andhra Pradesh 498 100% 2 0% 500 100%Gujarat 449 90% 51 10% 500 100%Madhya Pradesh 244 79% 64 21% 308 100%Uttar Pradesh 468 94% 30 6% 498 100%West Bengal 459 92% 41 8% 500 100%
Total 2118 92% 188 8% 2306 100%
Table 3.58Better/more consumption of food
Yes No Total
92% of the respondents felt that they were now eating better/more food 100%
respondents of Andhra Pradesh expressed their feeling (Table 3.58).
c) Better clothing
StateNo. % No. %
Andhra Pradesh 493 99% 7Gujarat 404 81% 96Madhya Pradesh 235 76% 73Uttar Pradesh 330 66% 16
No. %1% 500 100%
19% 500 100%24% 308 100%
8 34% 498 100%46% 500 100%
25% 2306 100%
Total
West Bengal 269 54% 231
Total 1731 75% 575
Table 3.59Better Clothing
Yes No
75% said that they were wearing better clothes. In Andhra Pradesh the largest
number of respondents expressed this opinion (Table 3.59).
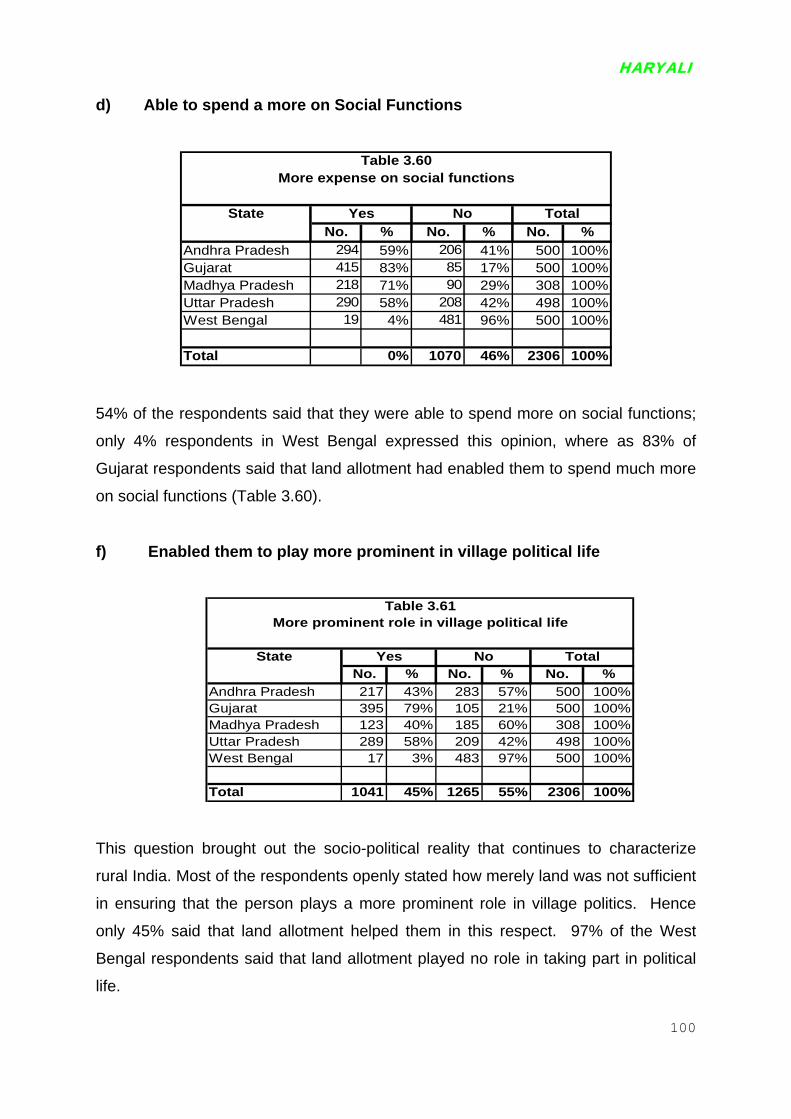
HARYALI
100
d) Able to spend a more on Social Functions
StateNo. % No
Andhra Pradesh 294 59% 206Gujarat 415 83% 85Madhya Pradesh 218 71% 90Uttar Pradesh 290 58% 208West Bengal 19 4% 481
Total 0% 1070
Table 3.60More expense on social funct
Yes No. % No. %
41% 500 100%17% 500 100%29% 308 100%42% 498 100%96% 500 100%
46% 2306 100%
ions
Total
54% of the respondents said that they were able to spend more on social functions;
only 4% respondents in West Bengal expressed this opinion, where as 83% of
Gujarat respondents said that land allotment had enabled them to spend much more
on social functions (Table 3.60).
f) Enabled them to play more prominent in village political life
StateNo. % No
Andhra Pradesh 217 43% 283Gujarat 395 79% 105Madhya Pradesh 123 40% 185Uttar Pradesh 289 58% 209West Bengal 17 3% 483
Total 1041 45% 1265
Table 3.61More prominent role in village
Yes N. % No. %
57% 500 100%21% 500 100%60% 308 100%42% 498 100%97% 500 100%
55% 2306 100%
political life
o Total
This question brought out the socio-political reality that continues to characterize
rural India. Most of the respondents openly stated how merely land was not sufficient
in ensuring that the person plays a more prominent role in village politics. Hence
only 45% said that land allotment helped them in this respect. 97% of the West
Bengal respondents said that land allotment played no role in taking part in political
life.

HARYALI
101
g) Helped them to get better spouse in marriage
StateNo. % No.
Andhra Pradesh 297 59% 203Gujarat 438 88% 62Madhya Pradesh 179 58% 129Uttar Pradesh 365 73% 133West Bengal 200 40% 300
Total 1479 64% 827
Table 3.62Better spouse in marri
Yes No% No. %41% 500 100%12% 500 100%42% 308 100%27% 498 100%60% 500 100%
36% 2306 100%
age
Total
64% felt that the allotted land had helped than get better spouse. Highest number of
Gujarat respondents were of they opinion. On the other hand 60% of the
respondents of West Bengal that land allotment had no effect in getting better
spouse (Table 3.62).
h) Availed Health Facilities
StateNo. % No.
Andhra Pradesh 488 98% 12Gujarat 413 83% 87Madhya Pradesh 216 70% 92Uttar Pradesh 398 80% 100West Bengal 260 52% 240
Total 1775 77% 531
No
Table 3.63Avail health facilitie
Yes% No. %2% 500 100%
17% 500 100%30% 308 100%20% 498 100%48% 500 100%
23% 2306 100%
Total
s
77% of the respondents felt that they now had better access to health facilities
(Table 3.63).

HARYALI
102
i) Increased prestige in the village
StateNo. % No.
Andhra Pradesh 385 77% 115Gujarat 447 89% 53Madhya Pradesh 245 80% 63Uttar Pradesh 474 95% 24West Bengal 468 94% 32
Total 2019 88% 287
Yes No
Table 3.64Gain respect in the villag
% No. %23% 500 100%11% 500 100%20% 308 100%
5% 498 100%6% 500 100%
12% 2306 100%
Total
e
It’s significant to note that 88% of the respondents felt that getting the land, had
increased their respect in the village. Uttar Pradesh respondents were in the lead in
this respect (95%) followed by West Bengal respondents 94% (Table 3.64). This
reaffirms the importance that ownership and control over land play, for Scheduled
Castes the ownership of land denotes enhanced social status, self respect.
Overall impact on social status of the beneficiaries is shown in Figure 13.

HARYALI
103
IMPACT ON ECONOMIC STATUS
IIMMPPAACCTT OONN TTHHEE EECCOONNOOMMIICC LLIIFFEE OOFF BBEENNEEFFIICCIIAARRIIEESS IISS SSHHOOWW IINN TTAABBLLEE 33..6655 TTOO TTAABBLLEE 33..7711..
a) Better Housing
StateNo. % No. %
Andhra Pradesh 340 68% 160 32%Gujarat 412 82% 88 18%Madhya Pradesh 201 65% 107 35%Uttar Pradesh 414 83% 84 17%West Bengal 474 95% 26 5%
Total 1841 80% 465 20%
Table 3.65Better Housing
Yes NoNo. %
500 100%500 100%308 100%498 100%500 100%
2306 100%
Total
80% respondents felt that they have been able to live in better houses than before.
95% of the respondents of West Bengal were of this opinion (Table 6.64).
b) Had better access to electricity
StateNo. % No. %
Andhra Pradesh 411 82% 89Gujarat 456 91% 44Madhya Pradesh 109 35% 19
No. %18% 500 100%9% 500 100%
9 65% 308 100%68% 498 100%Uttar Pradesh 157 32% 341
West Bengal 22 4% 478 96% 500 100%
50% 2306 100%
Total
Total 1155 50% 1151
Table 3.66Better Access to Electricity
Yes No
Only half of the respondents were of the opinion that land allotment had helped than
in this respect.

HARYALI
104
Largest number of Gujarat & Andhra Pradesh respondents felt that they were able to
get more electricity because of the land allotment (91% and 82% respectively). West
Bengal respondents had that land allotment had little effect in increasing access to
electricity (Table 6.65).
c) Income has increased
StateNo. % No. %
Andhra Pradesh 330 66% 170Gujarat 462 92% 38 8Madhya Pradesh 259 84% 49Uttar Pradesh 448 90% 50West Bengal 486 97% 14 3
Total 1985 86% 321
Table 3.67Higher income than befo
Yes NoNo. %
34% 500 100%% 500 100%
16% 308 100%10% 498 100%
% 500 100%
14% 2306 100%
re
Total
86% of the respondents felt that their income has increased, 97% West Bengal
respondents were of this opinion. Though the land allotted was merge (only 1.1 are
per beneficiary). However even this marginal landholding added to the overall
income to some extent (Table 6.67).
d) Better drinking water
StateNo. % No. %
Andhra Pradesh 498 100% 2Gujarat 455 91% 45Madhya Pradesh 257 83% 51Uttar Pradesh 479 96% 19West Bengal 28 6% 472
Total 1717 74% 589
Table 3.68Own or Better Source of Dri
Yes NoNo. %
0% 500 100%9% 500 100%
17% 308 100%4% 498 100%
94% 500 100%
26% 2306 100%
nking
Total

HARYALI
105
74% of the respondents said that they were able to gain access to better drinking
water and to sources of water supply in general. 100% of Andhra Pradesh
respondents expressed this opinion; where as only 6% of West Bengal respondents
felt that they were able to own better sources of water supply (Table 3.68).
e) Better household expenditure
StateNo. % No. %
Andhra Pradesh 253 51% 247 49%Gujarat 453 91% 47Madhya Pradesh 238 77% 70 23%Uttar Pradesh 301 60% 197 40%West Bengal 375 75% 12
No. %500 100%
9% 500 100%308 100%498 100%
5 25%
Total 1620 70% 686 30%
Table 3.69Better Household Expenditure
Yes No
500 100%
2306 100%
Total
As high as 70% respondents felt that because of increased income, they were able
to spend more on household requirements. Gujarat respondents were ahead of all
in this respect - 91% felt that they were able to spend more on procuring household
necessities (Table 3.69).
f) No Need to borrow from money lenders
StateNo. % No. %
Andhra Pradesh 394 79% 106 21%Gujarat 411 82% 89 18%Madhya Pradesh 234 76% 74 24%Uttar Pradesh 243 49% 255 51%West Bengal 237 47% 263 53%
Total 1519 66% 787 34%
Table 3.70No Need to Borrow from Money Lender/
Yes NoNo. %500 100%500 100%308 100%498 100%500 100%
2306 100%
Repaid all Loans
Total

106
HARYALI
66% of the respondents felt that their dependency on money lenders had decreased.
But more significant is the fact that 51 % of the respondents in Uttar Pradesh and
53% of the respondents in West Bengal talked about the continued dependency on
moneylenders for credit generally at exploitative rates of interest.
g) Expanded occupational activities
StateNo. % No. %
Andhra Pradesh 136 27% 364 73%Gujarat 251 50% 249 50%Madhya Pradesh 138 45% 170 55%Uttar Pradesh 437 88% 61 12%West Bengal 68 14% 432 86%
Total 1030 45% 1276 55%
Table 3.71Expanded Occupation Activit
Yes NoNo. %
500 100%500 100%308 100%498 100%500 100%
2306 100%
ies
Total
Only 5% felt that the income from the allotted land had enabled them to expand their
occupation. In this regard it’s significant to note that 88% of the respondents in Uttar
Pradesh gave a positive response. 55% of the respondents felt that the allotted land
had not helped in expanding occupational activities as they rightly pointed out that
only 1.1 acre of land was insufficient to even think of any such expansion.
Overall impact on economic status of the beneficiaries is shown in Figure 14.

HARYALI
107
CHAPTER 5 OPINION SURVEY OF SC NON-BENEFICIARIES

HARYALI
108
44..11 PROFILE OF SCHEDULED CASTE NON- BENEFICIARIES It is critical to understand the profile of the SC’s who have been excluded from the
redistributive land reform strategy and other land based measures to understand the
reasons for this exclusion and the efforts made by the SC’s to assert their Right to land. 498
SC were interviewed from all the 5 states to find out what were the reasons due to which
they were unable to get the land due to them even though they were eligible, and what
efforts, if any, did they make to get the land.
SSEEXX
StateNo. % No.
Andhra Pradesh 64 67% 31Gujarat 105 98% 2Madhya Pradesh 91 96% 4Uttar Pradesh 89 93% 7West Bengal 96 91% 9
Total 445 89% 53
Table 4.1Respondents by Sex
Male Fem% No. %33% 95 100%2% 107 100%4% 95 100%7% 96 100%9% 105 100%
11% 498 100%
ale Total
89% of them were male and 11% female, majority of the female belonged to Andhra
Pradesh (33%).
EEDDUUCCAATTIIOONN
State
No. % No. % No. % No. % No. % No. % No.Andhra Pradesh 72 76% 1 1% 3 3% 4 4% 11 12% 4 4% 95Gujarat 77 72% 16 15% 12 11% 1 1% 0% 1 1% 107Madhya Pradesh 60 63% 24 25% 5 5% 4 4% 0% 2 2% 95Uttar Pradesh 61 64% 13 14% 16 17% 3 3% 2 2% 1 1% 96West Bengal 61 58% 16 15% 20 19% 7 7% 0% 1 1% 105
Total 331 66% 70 14% 56 11% 19 4% 13 3% 9 2% 498
Respondents by Education
Illeterate Primary Middle High interme-School diate
Graduate To
Table 4.2
& AboveSchool%
100%100%100%100%100%
100%
tal

HARYALI
109
66% of the respondents were illiterate. Most of the illiterates belonged to Andhra Pradesh
(76%) followed by Gujarat (72%). 25% had education up to Primary –Middle level.
OOCCCCUUPPAATTIIOONN
State
No. % No. % No. % No. % No. % No.Andhra Pradesh 1 1% 1 1% 8 8% 5 5% 80 84% 95Gujarat 0% 0% 0% 4 4% 103 96% 107Madhya Pradesh 0% 0% 0% 0% 95 100% 95Uttar Pradesh 2 2% 0% 0% 0% 94 98% 96West Bengal 0% 0% 0% 0% 105 100% 105
Total 3 1% 1 0% 8 2% 9 2% 477 96% 498
Table 4.3Main Occupation of the Respondents
Business ToLabourHousewife AgricultureServicePrivate
%100%100%100%100%100%
100%
tal
• 96% were laborers
• 2% were in Private service and had their own business and
• 2% had businesses
None of the respondents were self-employed in agriculture.
TTOOTTAALL MMOONNTTHHLLYY FFAAMMIILLYY IINNCCOOMMEE OOFF NNOONN--BBEENNEEFFIICCIIAARRIIEESS
State
No. % No. % No. % No. % No.Andhra Prades
%h 27 28% 25 26% 18 19% 25 26% 9
Gujarat 0% 19 18% 60 56% 28 26% 107Madhya Prade
5 100%100%
s 15 16% 67 71% 10 11% 3 3% 9Uttar Pradesh 70 73% 20 21% 6 6% 0% 9West Bengal 48 46% 41 39% 13 12% 3 3% 105
Total 160 32% 172 35% 107 21% 59 12% 498
Table 4.4Respondents Total Family Monthly Income
Rs. 2000 Rs. 2000-4000 6000
Rs. 4000- Rs. 6000+
5 100%6 100%
100%
100%
Total

HARYALI
110
Most of them belonged to the lower and middle-income group
• Up to Rs. 2000 – 32%
• Rs. 2000 - 4000 – 35%
• Rs. 4000 – Rs. 6000 – 2%
• Above Rs. 6000 – 12%
Those in highest income bracket (Rs. 6,000 and +) belonged to Andhra Pradesh and
Gujarat (26%) Uttar Pradesh respondents were the poorest; income of 73% was only
up to Rs. 2,000/- (Table 4.4).
NNOONN--BBEENNEEFFIICCIIAARRIIEESS HHAAVVIINNGG OOWWNN LLAANNDD
StateNo. % No. %
Andhra Pradesh 18 19% 77 81%Gujarat 19 18% 88 82%Madhya Pradesh 0% 95 100%Uttar Pradesh 38 40% 58 60%West Bengal 23 22% 82 78%
Total 98 20% 400 80%
Table 4.5Having Own land
Having Not HavingNo. %
95 100%107 100%95 100%96 100%
105 100%
498 100%
Total

HARYALI
111
Only 20% of all respondents had ownership over land. The largest number of land
owners belonged to Uttar Pradesh. (40%) followed by West Bengal 22%. None of
the respondents of Madhya Pradesh owned their own land. Its critical to note that the
landlessness of the SC’s which the above table points to, this is a archetypal
characteristic of the social and economic deprivation of SC‘s in rural society.
HHAAVVIINNGG AAVVEERRAAGGEE OOWWNN LLAANNDD
StateAcres Acres
No. % No. % No. %Andhra Pradesh 8 44% 2.6 10 56% 1.0 18 100%Gujarat 19 100% 1.0 0 0% 19 100%Madhya Pradesh - - - - - - - -Uttar Pradesh 38 100% 1.3 0 0% 38 100%West Bengal 22 96% 0.9 1 4% 1.0 23 100%
Total 87 89% 1.3 11 11% 1.0 98 100%
Respondents Respondents
Table 4.6 Average Own Land per Non Beneficiary
Total RespondentsHaving Land
Irrigated Un-Irrigated
Of the one-fifth non-beneficiary respondents that owned land 89% of the land owned
was irrigated. Gujarat & Uttar Pradesh non-beneficiaries owned 100% irrigated land.
Only 11% of the land owned by them was un-irrigated. Total average land owned by
per non-beneficiary was around 1 acre land.

HARYALI
112
NNOONN--BBEENNEEFFIICCIIAARRIIEESS TTHHOOUUGGHH EELLIIGGIIBBLLEE TTOO GGEETT LLAANNDD
StateNo % No % No
Andhra Pradesh 3 3% 92 97%Gujarat 106 99% 1 1%Madhya Pradesh 95 100% 0%Uttar Pradesh 94 98% 2 2%West Bengal 99 94% 6 6%
Total 397 80% 101 20% 4
Allotment was done but not got possession of land
Non-Beneficiaries were eligible to get allotted
Note: 1 beneficiary in UP and 8 beneficiaries in West
Yes No
Table 4.7
%95 100%
107 100%95 100%96 100%
105 100%
98 100%
land
Bengal
Total
Out of the 498 non beneficiaries’ interviewed, 80% of them were eligible, and only
20% were not eligible to get the government allotted land. Almost all Andhra
Pradesh respondents were not eligible (97%). On the other hand only 1% of
respondents of Gujarat, 2% of Uttar Pradesh and 6% of West Bengal were not
eligible.

HARYALI
113
RREEAASSOONN’’SS FFOORR NNOOTT GGEETTTTIINNGG LLAANNDD AALLLLOOTTMMEENNTT
ReasonsNo.
Officers did not give attention 139Government stopped the land allotment 42Corruptions 27Name has been removed from BPL list 3Reasons of live outside the village 11Reasons of quarrel for neighbour 16Giving small piece of land 2Did not know whom to approached 91No information / Do not Know 19Not applied 5No response 143
Total 498
Table 4.8Reasons for land not getting the land allottment
Respond%28%
8%5%1%2%3%0%
18%4%1%
29%
100%
ents
Out of the 489 non-beneficiaries interviewed as high as 29% did not give any
response to the question. The main reasons given for non-allotment were:
• Officers did not pay attention - 28% of the respondents pointed to the
official apathy to the plight of the SC’s.
• Did not know whom to approach – 18% of the respondents clearly stated
that though they knew that they were eligible to get the land they were not
aware of which authority to approach.
• Land allotment was stopped by the government - 8% pointed to the fact
that the government policy of allotting land to SC’s had changed.

HARYALI
114
MMAADDEE EEFFFFOORRTT TTOO GGEETT AALLLLOOTTMMEENNTT OOFF LLAANNDD
StateNo. % No. %
Andhra Pradesh 5 5% 90 95%Gujarat 74 69% 33 31%Madhya Pradesh 89 94% 6 6%Uttar Pradesh 75 78% 21 22%West Bengal 85 81% 20 19%
Total 328 66% 170 34%
Table 4.9Made efforts to get allotment of lan
Yes NoNo. %
95 100%107 100%95 100%96 100%
105 100%
498 100%
d
Total
66% made the effort to gain control over the land legitimately due to them but 34%
did not make any effort to get land allotted to them. 95% of the respondents of
Andhra Pradesh did not make any effort in this regard, followed by Gujarat
respondents 31% and Uttar Pradesh 22%. Largest number of persons who made
the effort to get land allotted to them belonged to Madhya Pradesh (94%) followed by
West Bengal (81%) and Uttar Pradesh (78%). This is not only an indicator of the
importance that even small acreage of land holds but also is reflective of the
responsiveness of the institutions and the people’s faith in these institutions. This is
indicated in the responses to the next question.
TTYYPPEESS OOFF EEFFFFOORRTTSS MMAADDEE
State
No. % No. % No. % No.Andhra Pradesh 2 40% 3 60% 0% 5 1Gujarat 62 84% 12 16% 0% 74 1Madhya Pradesh 21 24% 65 73% 3 3% 89 1Uttar Pradesh 73 97% 2 3% 0% 75 1West Bengal 61 72% 22 26% 2 2% 85 1
Total 219 67% 104 32% 5 2% 328 1
Table 4.10Types of Efforts Made
Approached Approached TotalVillage corcern Govt.
DepartmentPanchayat
Any Other
%00%00%00%00%00%
00%

HARYALI
115
67% of the respondents approached the village Panchayat. Its significant to note
that the process of assertion of their rights over land often leads the SC’s to voice
their concerns in Panchayat; this indicates the Panchayati Raj institutions as a
dispute redressal mechanism enjoy the faith of the rural SC’s. Largest number of
Uttar Pradesh respondents approached only the village Panchayat (97%) followed by
Gujarat (84%). 32% of the respondents stated that they approached the concerned
government department.
RREEAASSOONN’’SS FFOORR NNOOTT MMAAKKIINNGG EEFFFFOORRTT TTOO GGEETT AALLLLOOTTMMEENNTT OOFF LLAANNDD
State
No. % No. % No. % No. % No. %Andhra Pradesh 43 48% 40 44% 7 8% 0% 90 100%Gujarat 10 30% 9 27% 5 15% 9 27% 33 100%Madhya Pradesh 3 50% 2 33% 1 17% 0% 6 100%Uttar Pradesh 13 62% 7 33% 1 5% 0% 21 100%West Bengal 8 40% 6 30% 6 30% 0% 20 100%
Total 77 45% 64 38% 20 12% 9 5% 170 100%
Table 4.11Reasons for not making efforts to get allotment of land
Do not Did not know Not sure TotalAnyhave whom to for
money approached allotmentother
Poverty and unawareness were the main reasons of lack of effort. 45% did not
make any effort as they not have the money to meet the expenses and 38% simply
did not know whom to approach. 12% did not make any effort, as they were not sure
of the results.
Uttar Pradesh respondents seem to be the poorest as 62% of them said that they did
have the money as against 30% of Gujarat respondents. But as for as ignorance as
to whom approach was concerned, Andhra Pradesh respondents seemed to be the
least informed (44%). 30% of the West Bengal respondents did make any effort as
they were not sure of the result, also because quite a large number of them did not
have the money 40%.

HARYALI
116
DDIIDD TTHHEEYY VVIISSUUAALLIIZZEE TTHHEE IIMMPPAACCTT OONN TTHHEEIIRR LLIIFFEE,, IIFF TTHHEEYY DDIIDD GGEETT TTHHEE
AALLLLOOTTMMEENNTT OOFF LLAANNDD
DDIIDD TTHHEEYY VVIISSUUAALLIIZZEE IITTSS IIMMPPAACCTT OONN TTHHEEIIRR LLIIFFEE
StateNo. % No. %
Andhra Pradesh 90 95% 5 5%Gujarat 107 100% 0%Madhya Pradesh 90 95% 5 5%Uttar Pradesh 94 98% 2 2%West Bengal 104 99% 1 1%
Total 485 97% 13 3%
Table 4.12Better standard of living
Yes NoNo. %
95 100%107 100%
95 100%96 100%
105 100%
498 100%
Total
Only 3% did not visualize the impact on their life if they got the allotment of land and
97% did. This is quite reasonable, as almost every body would think that their life
would become somewhat better if they possess better resources.
WWHHAATT WWEERREE TTHHEEIIRR EEXXPPEECCTTAATTIIOONNSS IIFF TTHHEEYY GGOOTT LLAANNDD
Majority of them had similar expectations, that they will be able to provide better
education to their children (97%), will be able to get more facilities (96%) and will
enjoy some whole higher social position (95%).
AAWWAARREENNEESSSS AABBOOUUTT NNAATTIIOONNAALL SSCCHHEEDDUULLEEDD CCAASSTTEE FFIINNAANNCCEE
DDEEVVEELLOOPPMMEENNTT CCOORRPPOORRAATTIIOONN ((NNSSFFDDCC))
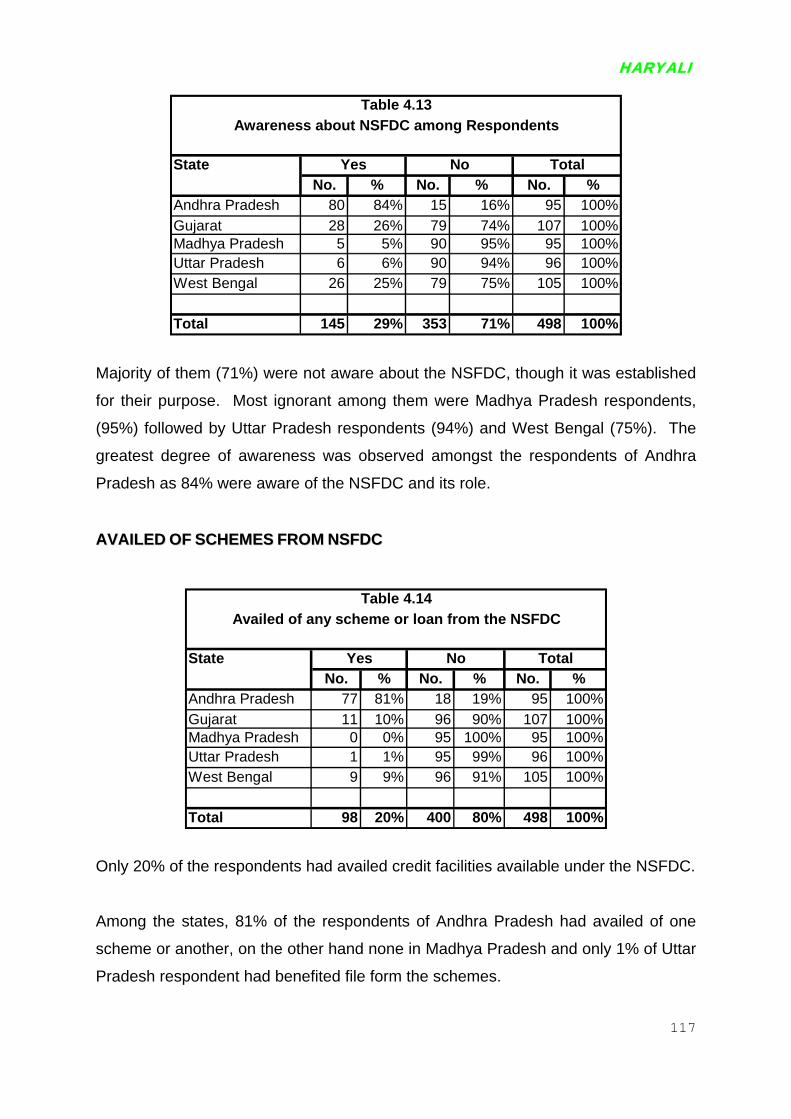
HARYALI
117
StateNo. % No. % No. %
Andhra Pradesh 80 84% 15 16% 95 1Gujarat 28 26% 79 74% 107 1Madhya Pradesh 5 5% 90 95% 95 1Uttar Pradesh 6 6% 90 94% 96 1West Bengal 26 25% 79 75% 105 1
Total 145 29% 353 71% 498 1
Table 4.13Awareness about NSFDC among Respondents
Yes No Total
00%00%00%00%00%
00%
Majority of them (71%) were not aware about the NSFDC, though it was established
for their purpose. Most ignorant among them were Madhya Pradesh respondents,
(95%) followed by Uttar Pradesh respondents (94%) and West Bengal (75%). The
greatest degree of awareness was observed amongst the respondents of Andhra
Pradesh as 84% were aware of the NSFDC and its role.
AAVVAAIILLEEDD OOFF SSCCHHEEMMEESS FFRROOMM NNSSFFDDCC
StateNo. % No. % No.
Andhra Pradesh 77 81% 18 19% 95Gujarat 11 10% 96 90% 107Madhya Pradesh 0 0% 95 100% 95Uttar Pradesh 1 1% 95 99% 96West Bengal 9 9% 96 91% 105
Total 98 20% 400 80% 498
Table 4.14Availed of any scheme or loan from the NSFDC
Yes No Total%
100%100%100%100%100%
100%
Only 20% of the respondents had availed credit facilities available under the NSFDC.
Among the states, 81% of the respondents of Andhra Pradesh had availed of one
scheme or another, on the other hand none in Madhya Pradesh and only 1% of Uttar
Pradesh respondent had benefited file form the schemes.

HARYALI
118
Almost all of the respondents had availed of income generating schemes (87%)
while only 9% had opted for skill development schemes.
PPUURRPPOOSSEE FFOORR WWHHIICCHH LLOOAANN TTAAKKEENN
ReasonsNo. %
Plantation 54Housing 6Business 14Farming equipments 3Animal husbandry 10Tailoring 2Agricultural materials 6Beauty parlour 1Transport material 2
Total 98 1
Table 4.15Purpose of loan taken
Respondent
55%6%
14%3%
10%2%6%1%2%
00%
s
The respondents had taken the loan for various purposes, like repairing or building
houses, acquiring business, skill training, transportation of materials and agricultural
development. Out of the 98 persons who took the loan:
• 74% took for agricultural purposes
• 6% for housing
• 14% for business purposes, and
• 2% for skill development.
AAMMOOUUNNTT OOFF LLOOAANN TTAAKKEENN
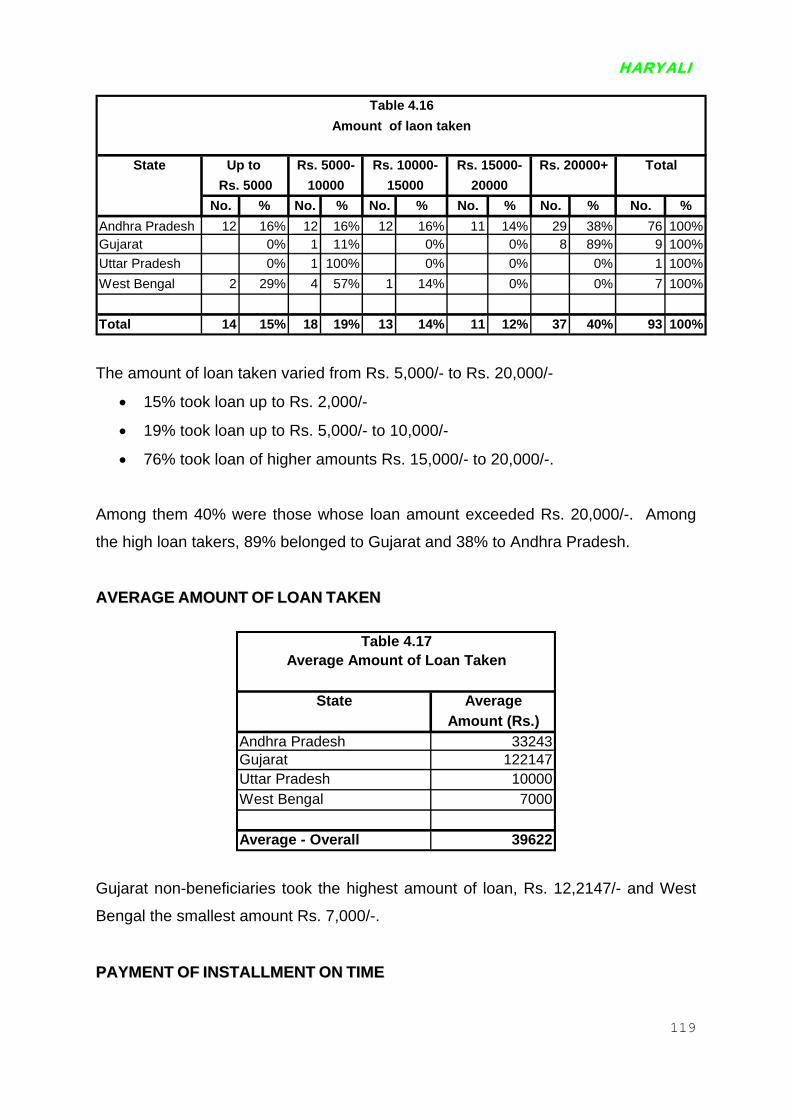
HARYALI
119
State
No. % No. % No. % No. % No. % No. %a Pradesh 12 16% 12 16% 12 16% 11 14% 29 38% 76 100%t 0% 1 11% 0% 0% 8 89% 9 100%adesh 0% 1 100% 0% 0% 0% 1 100%
Bengal 2 29% 4 57% 1 14% 0% 0% 7 100%
14 15% 18 19% 13 14% 11 12% 37 40% 93 100%
Rs. 15000-
Table 4.16Amount of laon taken
Up to Rs. 5000- Rs. 10000- Rs. 20000+Rs. 5000 10000 15000 20000
Total
AndhrGujaraUttar PrWest
Total
The amount of loan taken varied from Rs. 5,000/- to Rs. 20,000/-
• 15% took loan up to Rs. 2,000/-
• 19% took loan up to Rs. 5,000/- to 10,000/-
• 76% took loan of higher amounts Rs. 15,000/- to 20,000/-.
Among them 40% were those whose loan amount exceeded Rs. 20,000/-. Among
the high loan takers, 89% belonged to Gujarat and 38% to Andhra Pradesh.
AAVVEERRAAGGEE AAMMOOUUNNTT OOFF LLOOAANN TTAAKKEENN
State AverageAmount (Rs.)
33243122147100007000
Andhra PradeshGujaratUttar PradeshWest Bengal
Average - Overall
Table 4.17Average Amount of Loan T
39622
aken
Gujarat non-beneficiaries took the highest amount of loan, Rs. 12,2147/- and West
Bengal the smallest amount Rs. 7,000/-.
PPAAYYMMEENNTT OOFF IINNSSTTAALLLLMMEENNTT OONN TTIIMMEE

HARYALI
120
StateNo. % No. % No.
Andhra Pradesh 60 79% 16 21% 76Gujarat 5 56% 4 44% 9Uttar Pradesh 1 100% 0% 1West Bengal 5 71% 2 29% 7
Total 71 76% 22 24% 93
Table 4.18Paying installment on time
No ToYes%
100%100%100%100%
100%
tal
This is quite a revealing table. Though Uttar Pradesh and West Bengal Non-
Beneficiaries took the least amount loan Rs. 10, 000/- and Rs. 7000/- respectively, a
great majority of them returned the loan on time. 100% Uttar Pradesh respondents
returned the loan on time and 7% respondents of West Bengal did the same. On the
other land Gujarat and Andhra Pradesh respondents were among those who took
the higher amount of loan Rs. 122,147/- and Rs. 33,243/- respectively, but they were
among the highest defaulters. 21% of Andhra Pradesh and 44% of Gujarat
respondents failed to return the loan on time.
The main reasons of not returning the loan taken was incurring loss in the business
started (85%) and low crop yield.
HARYALI
121
CHAPTER 6 OPINION SURVEY OF THE OFFICIALS AND COMMUNITY LEADERS
CHAPTER CHAP

HARYALI
122
55..11 VVIIEEWWSS OOFF OOFFFFIICCIIAALLSS AANNDD CCOOMMMMUUNNIITTYY LLEEAADDEERRSS 261 concerned officials and community leaders including village Pradhan were
interviewed to find out their views on the utilization of land by SC families, type of
land allotted to them and their suggestions to improve the quality of land. Views of
these persons who constituted village leadership was taken as their voices would be
more representative and in touch with ground reality.
St
Sold GiGiCult
ateNo. % No. % No. %
the land allotted 14 5% 247 95% 261 100%ven the land on contract 8 3% 253 97% 261 100%ven the land on share cropping 10 4% 251 96% 261 100%
ivating the land allotted themselves 255 98% 6 2% 261 100%
Table 5.1Utilization of alloted land to the SC families
Yes No Total
The nature of utilization according to officials and Community leaders are given
belong.
• 5% sold the land allotted.
• 3% gave it on contract basis
• 4% gave it on shear cropping basis, but
• 98% cultivated the land themselves
Significantly very few of the beneficiaries had mentioned the selling of land.
TTYYPPEE OOFF LLAANNDD AALLLLOOTTTTEEDD
StateFertile
Andhra Pradesh 57Gujarat 48Madhya Pradesh 75Uttar Pradesh 82West Bengal 97
Overall 72
Table 5.2Type of alloted land
Type of Land AUnfertile
43522518
3
28
lloted (%)

HARYALI
123
According to them 72% of the land allotted was fertile and only 28% unfertile.
Gujarat and Andhra Pradesh gave the largest amount of unfertile land, 52% and
43% respectively. This corresponds with what the beneficiaries had pointed out.
TTYYPPEE OOFF UUNNFFEERRTTIILLEE LLAANNDD AALLLLOOTTTTEEDD
StateNo. % No. % No. % No. % No. % No. %
AndhGujaraMadhyUttar PrWest
Total
ra Pradesh 1 33% 0% 0% 0% 2 67% 3 100%t 21 78% 0% 0% 0% 6 22% 27 100%a Pradesh 15 32% 9 19% 2 4% 0% 21 45% 47 100%adesh 4 21% 1 5% 3 16% 0% 11 58% 19 100%
Bengal 1 8% 0% 1 8% 4 31% 7 54% 13 100%
42 39% 10 9% 6 6% 4 4% 39 36% 109 100%
Sandy Waste Land Total
Type of Unfertile Land AllottedTable 5.3
Full of Stone Swampy Pot Holes
The land was unfertile because
• 39% was waste land
• 36% was full of pot holes
• 9% was full of stone, and
• 10% sandy and swampy
Largest amount of wasteland was given by Gujarat followed by Andhra Pradesh.
SSUUGGGGEESSTTIIOONNSS TTOO IIMMPPRROOVVEE TTHHEE QQUUAALLIITTYY OOFF LLAANNDD
Suggetions No.Making boundariesLevelling of fieldArragement of IrrigationUse of Organic FertilizerUse of Chemical FertilizerProviding Tractor and EquipmentsFilling Pits
Total 2
Table 5.4Suggetions to Imrove the Quality L
%34 13%75 29%60 23%15 6%20 8%45 17%12 5%
61 100%
and

124
HARYALI
Different suggestions were given by them to improve the quality of land. Some of
the suggestions were as follows.
• Leveling the field - 29%
• Arrangement of irrigation - 23%
• Providing tractor and equipments - 17%
• Making boundaries -13%
SSUUGGGGEESSTTIIOONNSS TTOO IINNCCRREEAASSEE PPRROODDUUCCTTIIOONN AANNDD IINNCCOOMMEE
Suggetions No. % Irrigation facilities specially bore well 56 21% Good Seed and fertilizer on subsidized rate 138 53% tractor and equipments on subsidized rate 24 9%
eness generation about new techonologies 5 2%or cultivation 11 4%
ing on regular basis 12 5% facility 15 6%
261 100%
Suggetions to increase the production and incomeTable 5.5
ProvidingProvidingProvidingAwarEasy loan fSoil testFencing
Total
TTHHEE SSUUGGGGEESSTTIIOONNSS WWEERREE AASS FFOOLLLLOOWWSS::
• 53% suggested that good seeds and fertilizer should be provided to them on
subsidized basis.
• 21% suggested that irrigation facilities to be provided particularly were well.
• 9% suggested tractors and other equipments should be provided to them.
• 6% said that the field should be fenced.
CHAPTER 7 CONCLUSION AND RECOMMENDATION
CCOONNCCLLUUSSIIOONN Land allotted per entitlement
Access to land plays a significant role in improving the living standard of the SC’s in
Rural India. It was due to this very reason that redistribution of surplus land to the poor
especially the SC’s was viewed as central to land reforms and later programmes such
as Bhoodan were conceived. The ownership of land is the very basis of the ones
position in the agrarian social hierarchy.
The land allotted under redistributive land reforms and other programmes to the SC’s
was quite satisfactory. 91% of the families got the land they were entitled to. In this
respect Andhra Pradesh and Gujarat were the leading states, 100% families in both the
states got the land they were entitled to. West Bengal was behind all districts in this
respect.
1. Status of Possession of Land
• 85% possessed the land allotted
• 7% possessed less than allotted
• 8% could not get the possession
Interviews with the respondents pointed to a discrepancy between the land allotted to
the respondents and the land in their actual possession. On an average 2.3 acres was
allotted but only 1 acre was in actual possession of the respondents with the difference
of 1.3 acres between allotment and actual possession.
125

It is very interesting to note that in terms of getting actual possession of allotted land, it
was only in Madhya Pradesh that the beneficiaries could not get possession of land
allotted to them. A very small number of the beneficiaries had sold their land (only
0.5%) and only 1% had mortgaged them.
2. Average land allotted per beneficiary
According to a rough estimate 3-4 acres of average type of land is required for a family
of 5, just to pull along. On an average, area of land allotted per SC beneficiary was 0.9
acres if it was irrigated and 1.4 acres incase un-irrigated land was allotted. On an
average Gujarat allotted the highest amount of irrigated land i.e. 2 acres followed by
Madhya Pradesh (1.1 acres). Interestingly on an average Gujarat allotted the highest
amount of un-irrigated land also (1.8 acres), followed by Andhra Pradesh (1.5 acres).
Whether the land allotted was irrigated or not is highly critical to understanding whether
it is productive to make a difference to poor SC households.
It is quite informative to note how old is the story of land allotment to SC families. The
time range is 10 to 30 years. Around 33% of the land allotted was between 10 to 30
years ago.
3. Quality of land allotted
Distribution of land to the SC’s is the first step towards their emancipation. However if
the quality of land is sub standard the very purpose of allotting land gets defeated. The
overall picture that emerged was that 74% of the land allotted was irrigated and fertile.
However there were wide interstate disparities. 97% and 92% of the land allotted in
West Bengal and Uttar Pradesh respectively was fertile and the least percent of fertile
land given was by Gujarat and Andhra Pradesh.
126

4. Encroachment of allotted land
One of the most common causes for atrocities against Dalits is when the community
attempts to assert their right to resources especially land. A form of this atrocity is
encroachment of the land of SC’s. In 11% of the cases the land of the beneficiaries was
encroached by others. Encroachment was concentrated in Madhya Pradesh and Uttar
Pradesh. In Madhya Pradesh 40% land was encroached upon and in Uttar Pradesh
14% land was encroached. Average total land allotted per beneficiary was 2.29 acres,
out of which 0.9 acre was encroached.
5. Action taken to get back the land
• 11% did not take any action
• 50% filed cases in court, and
• 2% filed a complaint in SC/ST Tribunal
Largest number of Madhya Pradesh allottees had filed cases in court (64%).
6. Reasons for not taking any action
The main reason for no action was the lack of money to meet the expenses of litigation
(31%), 21% were afraid of the consequences largely because those who encroached
the land represented the village elite and 8% had no knowledge of the processes.
7. Expectation from government to get back encroached land
In light of the increasing awareness and assertion of the SC’s for their rights and the
unresponsiveness of the institutional mechanisms available for SC’s it’s important to
understand the expectations of the respondents from the government.
127

There were two main expectations from the government - 82% were of the opinion that
the government should take steps to get back the encroached land, and 18% expected
the government to provided legal aid. The largest number of those who wanted
government to provide legal aid was in Uttar Pradesh (64%).
8. Who was cultivating the land
It is very important to assess whether the SC families to whom land was allotted were
able to retain it and if they were able to make that significant shift towards self employed
cultivators. It was found that 95% of the families were cultivating the land themselves.
100% of the families in Andhra Pradesh and Gujarat were self-cultivators.
Sharecropping or leasing out the allotted land was almost a non-existent practice.
Similarly a very small percentage of the families had mortgaged the land; only 1% had
done so.
The farmers had mortgaged the land on are arrange for 5 years.
Reasons of Mortgaging: 6% had mortgaged the land for the purpose of land development that is to buy inputs for
getting better crop. 41% had mortgaged it to be able to return loans taken. But
unfortunately to main reason for mortgaging the land was to fulfill social customs i.e. to
meet the cost of marriage, rather than, improve their economic condition. 100% farmers
of Andhra Pradesh had fallen prey to this custom, followed by Uttar Pradesh farmers.
This clearly highlights the vicious hold that certain social customs continue to have in
rural society wherein the poor continue to spend beyond their pocket falling into the debt
trap.
128

9. Utilization of land
This section aims to bring to light the productivity of land and the monetary benefits
accruing to the SC recipients of the allotted land. This is a significant indicator of land
utilization by the beneficiaries. A concerted effort was made to understand the variation
between irrigated and un-irrigated land.
COMPARISON OF CROP GROWN IN IRRIGATED AND UN-IRRIGATED LAND
SI. VARIABLES COMPARED
IRRIGATED LAND UN IRRIGATED LAND
Crops grown Groundnut Grown in M.P., Gujarat,
A.P. M.P., Gujarat, A.P.
Paddy
All states except Gujarat Mustard- in A.P., M.P., W.B.
1.
Pulses
All states except A.P., W.B. Bajara- A.P., Gujarat, W.B.
2 Total area sown (acre) Least in A.P. (204 acres) Highest in Gujarat (945 acres) Average area under cultivation per state (434 acres)
Least in W.B. (89.2 acres) Highest in Gujarat (1,550 acres) Average area under Cultivation per state (158 acres)
3 Total production Highest in Gujarat 8,285 quintals Least in A.P. 135 quintals Average production per state 3,964 quintals
Highest in Gujarat 1,550 quintals Least in U.P. 34 quintals Average production per state 889 quintals
4 Average production per acre
9 quintals per acre
4.6 quintals per acre
129

5 Average production per beneficiary
It ranged from 5.1 to 11.3 quintals. The highest amount by Gujarat beneficiaries’ 11.3 quintals followed by W.B., 104 quintals. Least amount was produced by M.P. beneficiaries 6.1 quintals, followed by A.P. beneficiaries 5.2 quintals. Overall average quintal per beneficiary 7.6 quintals
It ranged from 3 to 5 quintals per beneficiary. It was 5 quintals each in Gujarat, M.P. and W.B. and 3 quintals each in M.P. and U.P. Overall all average per beneficiary 4.2 quintals.
6 Total quantity of grain sold
It ranged from 523 quintals to 7,774 quintals; Gujarat beneficiaries were able to sell the largest amount of grain (7,774 quintals), whereas U.P. beneficiaries were able to sell only 523 quintals. Quantity sold per beneficiary ranged for 3 to 16 quintals, Gujarat beneficiaries sold an average of 16 quintals per beneficiary, whereas M.P. farmers were able to sell only 3 quintals. Overall average quantity sold per state was 2,157 quintals. Average quantity sold per beneficiary was 10.25 quintals.
It ranged from 0 to 1,329 quintals. Gujarat farmers sold the highest amount 1,329 quintals followed by A.P. beneficiaries. Least amount sold was in U.P. where not a single quintal was sold by the beneficiaries followed by A.P. Overall average quantity sold per state was 385 quintals. Average quantity sold per beneficiary was 3.7 quintals.
130
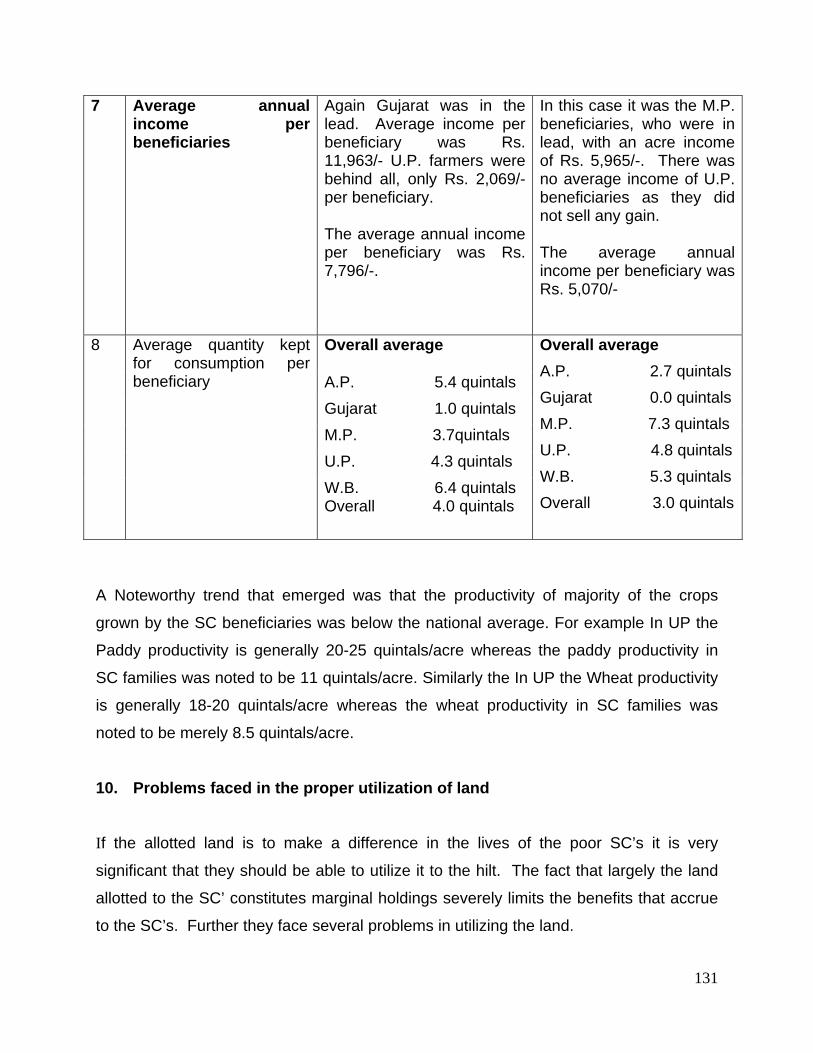
7 Average annual income per beneficiaries
Again Gujarat was in the lead. Average income per beneficiary was Rs. 11,963/- U.P. farmers were behind all, only Rs. 2,069/- per beneficiary. The average annual income per beneficiary was Rs. 7,796/-.
In this case it was the M.P. beneficiaries, who were in lead, with an acre income of Rs. 5,965/-. There was no average income of U.P. beneficiaries as they did not sell any gain. The average annual income per beneficiary was Rs. 5,070/-
O
verall average
A.P. 5.4 quintals Gujarat 1.0 quintals M.P. 3.7quintals U.P. 4.3 quintals
8 Average quantity kept for consumption per beneficiary
W.B. 6.4 quintals Overall 4.0 quintals
Overall average A.P. 2.7 quintals Gujarat 0.0 quintals M.P. 7.3 quintals U.P. 4.8 quintals W.B. 5.3 quintals Overall 3.0 quintals
A Noteworthy trend that emerged was that the productivity of majority of the crops
grown by the SC beneficiaries was below the national average. For example In UP the
Paddy productivity is generally 20-25 quintals/acre whereas the paddy productivity in
SC families was noted to be 11 quintals/acre. Similarly the In UP the Wheat productivity
is generally 18-20 quintals/acre whereas the wheat productivity in SC families was
noted to be merely 8.5 quintals/acre.
10. Problems faced in the proper utilization of land
If the allotted land is to make a difference in the lives of the poor SC’s it is very
significant that they should be able to utilize it to the hilt. The fact that largely the land
allotted to the SC’ constitutes marginal holdings severely limits the benefits that accrue
to the SC’s. Further they face several problems in utilizing the land.
131

In 12 % of the cases the land was not leveled. In 12% of the cases the land allotted
was wasteland and full of stone hence not productive without intensive land
development. Significantly in Madhya Pradesh 25% of the respondents mentioned
this as the key problem.
Some of the other problems cited were pertaining to the lack of facilities to plough
the land. 77% of the respondents did not have animals to plough the land and for
other agricultural operations while 74% did not have tractors.
The most significant problem that emerged was that the while the SC’s had land
they did not have the finances improve land productive and make their small
landholdings viable. 78% did not have enough money to procure facilities required
to improve productivity.
11. Types of efforts made for better utilization of land
• Took loan: Since most of the respondents attributed the difficulty in utilization of
land owing to lack of financial resources, an attempt was made to find out the
possibilities of supportive investment assistance to make land productive. Out of
2,306 persons who had been allotted land, only 36% made efforts to raise loan to
improve the productivity. 43% of these respondents tried taking a loan through
Banks.
• Hired animals and other agricultural equipments for ploughing: Only 9% of
the allotees owned their own animals for ploughing the land. As high as 91%
had to hire the animals for ploughing their fields and almost all of the
respondents had to hire agricultural equipments, like tractor and harrow for
cultivation.
• Average expenses incurred to improve the quality of unfertile land was Rs.
7,981/-. To make the land holdings economically viable the beneficiaries had to
incur significant expenditure. The highest amount was incurred by the farmer of
Uttar Pradesh (Rs. 9,267/-) followed by Gujarat farmer (Rs. 8,921/-).
132

12. Effectiveness of the National Schedules Caste Finance Development Corporation (NSCFDC)
National Scheduled Caste Finance Development Corporation (NSCFDC) provides credit
facilities to SC who are living below the double poverty line. The main purpose of the
corporation is to provide assistance to SC to help them develop economically. But
surprisingly, only 16% of the respondents were even aware of its existence. Only 4%
respondents in Madhya Pradesh, 6% in Gujarat and 9% of the respondents in Uttar
Pradesh and West Bengal were aware of the NSCFDC. As compared to other states
only in Andhra Pradesh the respondents displayed awareness about the corporation, as
50% of the Andhra Pradesh respondents knew about it.
Only 2% of the respondents had taken loan from NSCFDC. 98% did not avail any
facilities offered by the corporation. During the interaction the respondents pointed out
that the main reason was that they did not apply for it, as they were not aware of the
existence of NSCFDC. 13. Impact of land allotment on the Socio economic status of beneficiaries
Ownership and control over land determine ones standing in the agrarian hierarchy.
Despite the fact that the land that the SC beneficiaries gained was largely sub-marginal
and the utilization below optimal large number of respondents perceived that the
allotment of land had helped them in improving their living status , that is they enjoyed
better housing, the schooling of children was much better, have more electricity and
drinking water, they were eating better food and wearing better clothes, were able to
avail health facilities and play a more prominent role in village political life, and so on.
One interesting response was that it had helped them to get better spouse.
133

14. SC Non-beneficiaries though eligible to get land
Out of the 498 non beneficiaries’ interviewed, 80% of them were eligible, and only 20%
were not eligible to get the government allotted land. Almost all Andhra Pradesh
respondents were not eligible (97%). On the other hand only 1% of respondents of
Gujarat, 2% of Uttar Pradesh and 6% of West Bengal were not eligible.
Out of the 489 non-beneficiaries interviewed as high as 29% did not give any response
to the question. The main reasons given for non-allotment were:
• Officers did not pay attention - 28% of the respondents pointed to the official
apathy to the plight of the SC’s
• Did not know whom to approach – 18% of the respondents clearly stated that
though they knew that they were eligible to get the land they were not aware of
which authority to approach.
• Land allotment was stopped by the government - 8% pointed to the fact that
the government policy of allotting land to SC’s had changed.
66% made the effort to gain control over the land legitimately due to them but 34% did
not make any effort to get land allotted to them.
67% of the respondents approached the village Panchayat. Its significant to note that
the process of assertion of their rights over land often leads the SC’s to voice their
concerns in Panchayat; this indicates the Panchayati Raj institutions as a dispute
redressal mechanism enjoy the faith of the rural SC’s.
134

Poverty and unawareness were the main reasons of lack of effort. 45% did not make
any effort as they not have the money to meet the expenses and 38% simply did not
know whom to approach. 12% did not make any effort, as they were not sure of the
results.
261 concerned officials and community leaders including village Pradhan were
interviewed to find out their views on the utilization of land by SC families, type of land
allotted to them and their suggestions to improve the quality of land.
Different suggestions were given by officials to improve the quality of land. Some of the
suggestions were as follows.
• Leveling the field - 29%
• Arrangement of irrigation - 23%
• Providing tractor and equipments - 17%
• Making boundaries -13%
TTHHEE SSUUGGGGEESSTTIIOONNSS TTOO IIMMRROOVVEE PPRROODDUUCCTTIIOONN AANNDD IINNCCOOMMEE
• 53% suggested that good seeds and fertilizer should be provided to them on
subsidized basis.
• 21% suggested that irrigation facilities to be provided particularly were well.
• 9% suggested tractors and other equipments should be provided to them.
• 6% said that the field should be fenced.
135

RECOMMENDATIONS
RREECCOOMMMMEENNDDAATTIIOONNSS
1. 91% of the families got the land they were entitled to however the amount of land
allotted was 2.3 acres of which only 1 acres was in actual possession of the SC
beneficiaries. These sub-marginal holdings are not economically viable. It is
critical that the Government increases the allotment of land; the allotment should
not be simply in terms of acres but take into account the productivity of soil.
There is also a need for increased transparency in allotment to prevent
discrepancy between allotment and actual possession. One measure for this is
the updating of the land records.
2. Before allotment an assessment of the quality of land should be made - how
much of it is wasteland or non utilizable in present form. On the basis of this
assessment it’s important that the process of allotment is integrated with land
and irrigation development assistance to the SC’s such as the Million Wells
Scheme and Land Development Scheme. For the land that has already been
allotted, an assessment can now be carried out by the Krishi Vigyan Kendra and
accordingly technical assistance given to the SC’s.
3. The government should take stern action against Encroachment of land.
Encroaching upon one’s land and causing damage to one’s property is an
offence even under common law. The Scheduled Castes and Scheduled Tribes
(Prevention of Atrocities) Act states:
136

“Whoever, not being a member of a Scheduled Caste or a Scheduled Tribe,
wrongfully occupies or cultivates any land owned by, or allotted to, or notified by
any competent authority to be allotted to, a member of a Scheduled Caste or a
Scheduled Tribe or gets the land allotted to him transferred; wrongly
dispossesses a member of a Scheduled Caste or a Scheduled Tribe from his
land or premises or interferes with the enjoyment of his rights over any land,
premises or water, shall be punishable with imprisonment for a term which shall
not be less than six months but which may extend to five years and with fine.”
(Section 3 (1) (iv), (v) and (xv) of the Atrocities Act). Timely intervention by the
state could have done justice to the victims and spared them of prolonged
litigation.
4. Further apart from corrective measures there is a need for preventive measures
and constant monitoring. For this a committee can be created which includes the
District Magistrate, Sub Divisional Magistrate, Tehsildar, retired Judge
Superintendent of Police and Social Welfare Officer. Also there should be a
Separate Legal Cell to provide legal assistance to the SC beneficiaries.
5. In light of the low yield generated in the farms of the SC’s its critical that they are
educated about and provided better quality seeds and fertilizers at subsidized
rates.
6. In the context of the marginalization of landholdings it’s important to ensure the
connectedness of the land allotment policy with supplementary non-farm
activities and dairy/ livestock to make small farms viable and supplement
household income.
7. The rural SC’s need to be provided skills on how to change cropping pattern,
practice vegetable farming and horticulture for maximum gains, Krishi Vigyan
Kendra and agricultural universities can be involved in such initiatives.
137

8. Infrastructural support in terms of supply of power and irrigation needs to be
clearly mandated in policy.
9. One of the significant problems that emerged was the lack of financial resources
that continue to plague SC’s, for this, it’s imperative that formal credit is provided
to SC’s at subsidized rates.
10. Finance Corporations (NSCFDC) should play more effective role in helping the
beneficiaries to improve the land allotted to them. Awareness about its role in
helping the SC/ST to develop economically should be increased. At present
only 16% were aware of its existence. Majority of the respondents who did not
have enough resources to improve the fertility of the land allotted and need to
supplement agricultural with other income generating activities could be its
potential creditors. The corporation needs to expend its out reach activities.
11. Finally as the NHRC Report on Prevention of Atrocities against Scheduled
Castes"(2006) authored by K.B. Saxena and Justice A.S. Anand, clearly stated
that there is a need for the government to adopt a rights-based approach and not
a welfare-based one in addressing the condition of people belonging to the
Scheduled Castes. The implementation of the redistributive land based strategy
cannot operate in isolation of political will bureaucratic commitment, plugging the
loopholes in the laws, curbing the manipulative power of the landed classes.
138

APPENDICES
139

140
STUDY TOOLS

PAGE 1 OF 4 CONFIDENTIAL
GOI - HARYALI Research Project
UTILIZATION OF LAND ALLOTED TO SC FAMILIES
We are from HARYALI Centre for Rural Development, New Delhi. With the support of the Planning Commission, Government of India we are studying the present status and utilisation of land allotted to the SC families and its impact, in several states. It is important that information pertaining to utilisation of land allotted to SCs is systematically gathered and analysed. This will greatly help in refining existing policies and programmes that will facilitate the functioning of this process more effectively and transparently. In this connection, we are meeting and talking to people and officials who are knowledgeable and have rich and varied experience. Towards this, we have a few questions on which we wish to take your views. It will take about 20 minutes. The information we gather will be treated as confidential and will be used only for study purposes. We thank you for all the help and cooperation in advance.
I BACKGROUND INFORMATION
1 Respondent number mRrjnkrk dh la[;k
……………………………………………… 1
2 Name of the State
jkT; dk uke
……………………………………………… 2
3 Name of the District
ftys dk uke
……………………………………………… 3
4 Name of the Block
CykWd dk uke
……………………………………………… 4
5 Name of the Village xkWo dk uke
……………………………………………… 5
S C H E D U L E Non-Beneficiary
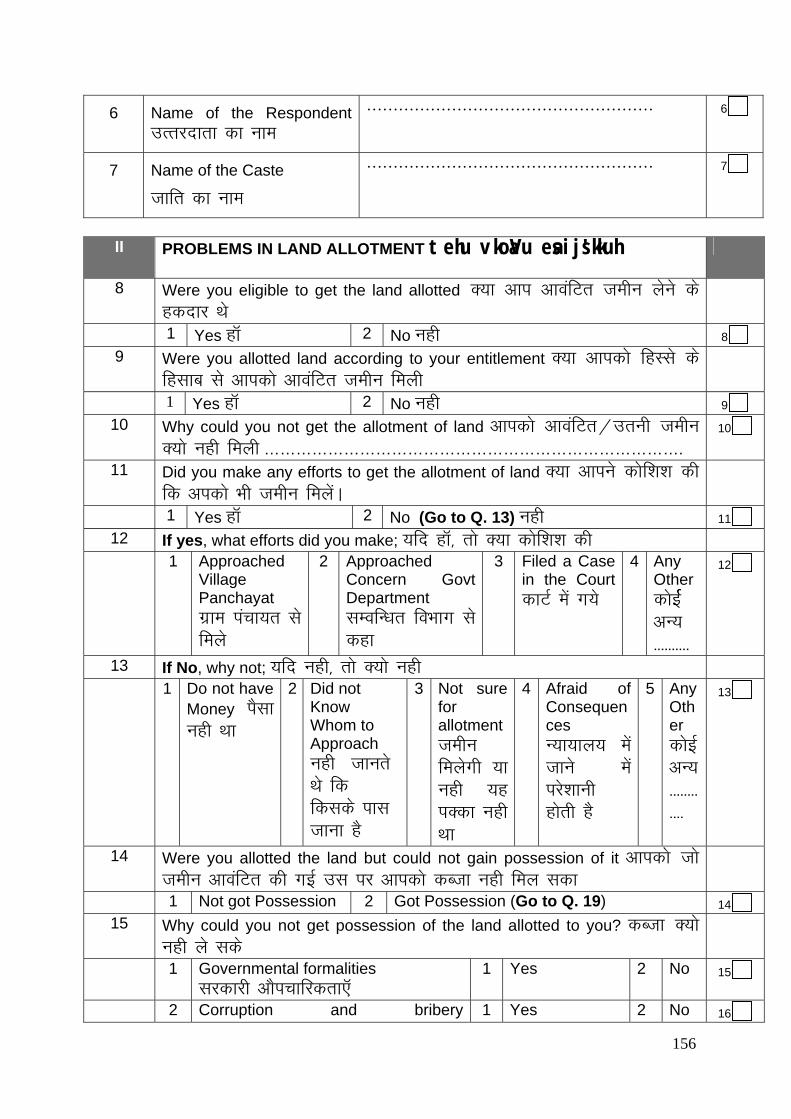
6 Name of the Respondent mRrjnkrk dk uke
……………………………………………… 6
7 Name of the Caste
tkfr dk uke
……………………………………………… 7
II PROBLEMS IN LAND ALLOTMENT tehu vkoaVu esa ijs'kkuh
8 Were you eligible to get the land allotted D;k vki vkoafVr tehu ysus ds gdnkj Fks
1 Yes gkW 2 No ugh 8 9 Were you allotted land according to your entitlement D;k vkidks fgLls ds
fglkc ls vkidks vkoafVr tehu feyh
1 Yes gkW 2 No ugh 9 10 Why could you not get the allotment of land vkidks vkoafVr@mruh tehu
D;ks ugh feyh ……………………………………………………………………. 10
11 Did you make any efforts to get the allotment of land D;k vkius dksf'k'k dh fd vidks Hkh tehu feysaA
1 Yes gkW 2 No (Go to Q. 13) ugh 11 12 If yes, what efforts did you make; ;fn gkW] rks D;k dksf'k'k dh 1 Approached
Village Panchayat xzke iapk;r ls feys
2 Approached Concern Govt Department lEofU/kr foHkkx ls dgk
3 Filed a Case in the Court dkVZ esa x;s
4 Any Other dksbZZZ vU; ----------
12
13 If No, why not; ;fn ugh] rks D;ks ugh
1 Do not have Money iSlk ugh Fkk
2 Did not Know Whom to Approach ugh tkurs Fks fd fdlds ikl tkuk gS
3 Not sure for allotment tehu feysxh ;k ugh ;g iDdk ugh Fkk
4 Afraid of Consequences U;k;ky; esa tkus esa ijs'kkuh gksrh gS
5 Any Other dksbZ vU; ------------
13
14 Were you allotted the land but could not gain possession of it vkidks tks tehu vkoafVr dh xbZ ml ij vkidks dCtk ugh fey ldk
1 Not got Possession 2 Got Possession (Go to Q. 19) 14 15 Why could you not get possession of the land allotted to you? dCtk D;ks
ugh ys lds
1 Governmental formalities ljdkjh vkSipkfjdrk,W
1 Yes 2 No 15
2 Corruption and bribery 1 Yes 2 No 16
156
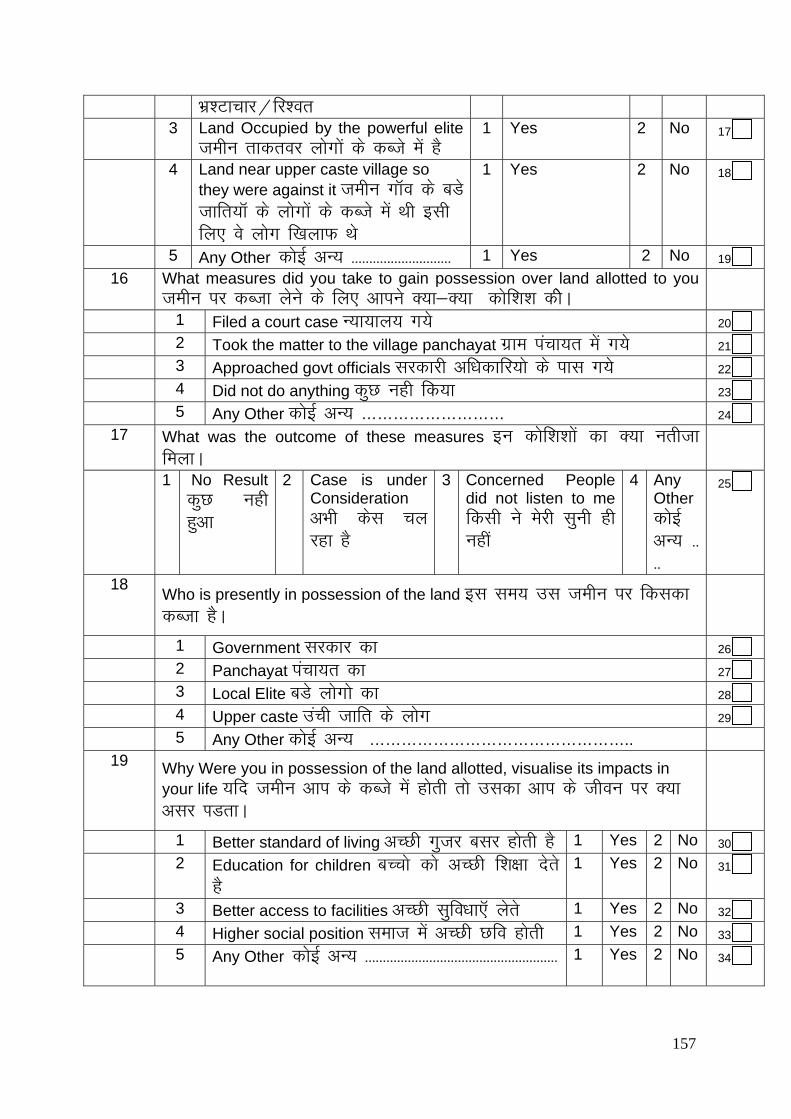
Hkz’Vkpkj@fj'or 3 Land Occupied by the powerful elite
tehu rkdroj yksxksa ds dCts esa gS 1 Yes 2 No 17
4 Land near upper caste village so they were against it tehu xkWo ds cMs tkfr;kW ds yksxksa ds dCts esa Fkh blh fy, os yksx f[kykQ Fks
1 Yes 2 No 18
5 Any Other dksbZ vU; ---------------------------- 1 Yes 2 No 19 16 What measures did you take to gain possession over land allotted to you
tehu ij dCtk ysus ds fy, vkius D;k&D;k dksf'k'k dhsA
1 Filed a court case U;k;ky; x;s 20 2 Took the matter to the village panchayat xzke iapk;r esa x;s 21 3 Approached govt officials ljdkjh vf/kdkfj;ks ds ikl x;s 22 4 Did not do anything dqN ugh fd;k 23 5 Any Other dksbZ vU; ……………………… 24
17 What was the outcome of these measures bu dksf'k'kksa dk D;k urhtk feykA
1 No Result dqN ugh gqvk
2 Case is under Consideration vHkh dsl py jgk gS
3 Concerned People did not listen to me fdlh us esjh lquh gh ugha
4 Any Other dksbZ vU; ----
25
18 Who is presently in possession of the land bl le; ml tehu ij fdldk dCtk gSA
1 Government ljdkj dk 26 2 Panchayat iapk;r dk 27 3 Local Elite cMs yksxks dk 28 4 Upper caste maph tkfr ds yksx 29 5 Any Other dksbZ vU; …………………………………………..
19 Why Were you in possession of the land allotted, visualise its impacts in your life ;fn tehu vki ds dCts esa gksrh rks mldk vki ds thou ij D;k vlj IkMrkA
1 Better standard of living vPNh xqtj clj gksrh gS 1 Yes 2 No 30 2 Education for children cPpks dks vPNh f'k{kk nsrs
gS 1 Yes 2 No 31
3 Better access to facilities vPNh lqfo/kk,W ysrs 1 Yes 2 No 32 4 Higher social position lekt esa vPNh Nfo gksrh 1 Yes 2 No 33 5 Any Other dksbZ vU; ------------------------------------------------------
1 Yes 2 No 34
157

IX SCHEDULED CASTES FINIANCE DEVELOPMENT CORPORATION vuqlwfpr tkfr fofr; fodkl LkaLFkku
20 Are you aware of the existence of NSFDC and its purpose of assisting D;k vki vuqlwfpr tkfr fofr; fodkl laLFkku ls fdl rjg dh enn feyrh gS ;s tkurs gS
1 Yes gkW 2 No (Go to Q. 27) ugh 35 21 Have you ever availed of any scheme or loan from the NSFDC D;k vkius
NSFDC dhs fdlh ;kstuk ls Qk;nk mBk;k gS ;k mlls dtkZ fy;k gSA
1 Yes gkW 2 No ugh 36 22 Which of the following schemes did you avail dkSu dkSu lh ;kstukvksa ls
vkius Qk;nk mBk;k gS
1 Income Generating Scheme vkenuh c<kus dh ;kstuk
1 Yes 2 No
2 Micro Credit Finance vYi cpr foRr ;kstuk ¼S.H.G)
1 Yes 2 No
3 New Skills/Skill Development programme ubZ dq'kyrk@ dq'kyrk fodkl dk;Zdze
1 Yes 2 No
37
38
39
23 If you took loan ;fn vkius dtkZ fy;kA 1 Purpose rks fdl fy, ------------------------------------------------------------------------------------- 40 2 Amount :i;s ------------------------------------------------------------------------------------------------------ 41 3 Year Ok’kZ ………………………………………………………………. 42 4 Interest rate C;kt nj ---……………………………………………… 43 5 Subsidy amount NwV dh jde Rs…………………………………… 44 6 Amount Repaid vc rd dtZ ds fdrus :i;s okil fd,…………. 45
7 Instalment amount fdLr dh jde Rs…………………….………… 46
8 Paying instalment on time D;k fdLr le; ij ns jgs gS s
1 Yes gkW 2 No ugh 47
10 If No, Reasons ;fn ugh rks dkj.k …………………………………. 48
11 Problems faced in repaying loan vkidks dtZ pqdkus esa D;k leL;k vkbZ……………………………………………………………………….
49
158

24 Did you face any problem in getting the loan dtZ ysus esa dksbZ leL;k vkbZ
1 Yes gkW 2 No ugh 50 25 If Yes, what was the problem ;fn gkW] rks D;k leL;k gqbZ ------------
…………………………………………………………………………………… 51
26 Did you apply for a loan from NSFDC and not get it D;k vkius dHkh
¼ NSFDC esa½ dtZ ysus ds fy, nj[kkLRk nh exj dtZ ughsa feykA
1 Yes gkW 2 No ugh 52 27 If Yes, Why ;fn dtZ ugha feyk rks D;ksa ugh feyk--------------------------------------------
……………………………………………………………………………………
53
X 28. FAMILY DETAILS ifjokj ds ckjs esa tkudkjh
SI. Relation to Respondent mRrjnkrk ls fj”rk
Sex fyax
Age vk;q
Marital Status oSokfgd fLFkfr
Education f'k{kk
1.Student Nk= 2. Dropout 3. NA ykxw ugh
Profe- Ssion /kU/kk
Income (Rs/Month) vkenuh :0@ekg
1 Respondent mRrjnkrk
2
3
4
5
6
7
8
9
10
11
54 55 56 57 58 59 60 61 62 63 64 65 66 67 68 69 70 71 72 73 74 75 76
159

160
XI OWENED LAND viuh tehu
29 Do you have any your own land vkidh [kqn dh tehu gS@FkhA
1 Yes gkW 2 No ugh (go to 98)
77
30 If Yes, total Land ;fn gkW] dqy tehu
Irrigated (Acre) flafpr ¼,dM½ -------------------------------------------------------------------
Un-irrigated (Acre) vflafpr ¼,dM½ ----------------------------------------------------
78 79
31 At present how much of that land do you still possess mlesa ls bl le; vkids dCts esa fdruh tehu gS
Irrigated (Acre) flafpr ¼,dM½ -------------------------------------------------------------------
Un-irrigated (Acre) vflafpr ¼,dM½ ----------------------------------------------------
80 81
32 Have you sold any part of the land you personally owned D;k vkius futh tehu dk dqN fgLlk cspk gS
1 Yes gkW 2 No ugh 82
33 If Yes how much land did you sell? ;fn gkW] rks fdruh tehu csph gS
Irrigated (Acre) flafpr ¼,dM½ ----------------------------------Rate/Acre………
Un-irrigated (Acre) vflafpr ¼,dM½ ------------------- Rate/Acre………
83 84
85 86
3344.. AANNYY OOTTHHEERR IINNFFOORRMMAATTIIOONN // SSUUGGGGEETTIIOONNSS dksbZ vU; tkudkjh ;k lq>ko …………………………………………………………………………………………………………………………………………………………………………………………………………………………
…………………………………………………………………………………………………………………………………………………………………………………………………………………………
…………………………………………………………………………………………………………………………………………………………………………………………………………………………
NNAAMMEE && SSIIGGNNAATTUURREE OOFF IINNVVEESSTTIIGGAATTOORR……………………………………………………………………………………………………………… NNAAMMEE OOFF TTHHEE SSUUPPEERRVVIISSOORR ………………………………………………………………………………………………………………………………………… DDAATTEE………………………………………………………………………………………………………………………………………………………………………………………… CCHHEECCKKEEDD BBYY NNAAMMEE…………………………………………………………………………………………………………………………………………………………………………………….... SSIIGGNNAATTUURREE ………………………………………………………………………………………………………………………………………………………………………….... DDAATTEE…………………………………………………………………………………………………………………………………………………………………………………………

Page 141 of 15
CONFIDENTIAL
GOI - HARYALI Research Project UTILIZATION OF LAND ALLOTED TO SC FAMILIES
We are from HARYALI Centre for Rural Development, New Delhi. With the support of the Planning Commission, Government of India we are studying the present status and utilisation of land allotted to the SC families and its impact, in several states. It is important that information pertaining to utilisation of land allotted to SCs is systematically gathered and analysed. This will greatly help in refining existing policies and programmes that will facilitate the functioning of this process more effectively and transparently. In this connection, we are meeting and talking to people and officials who are knowledgeable and have rich and varied experience. Towards this, we have a few questions on which we wish to take your views. It will take about 20 minutes. The information we gather will be treated as confidential and will be used only for study purposes. We thank you for all the help and cooperation in advance.
I BACKGROUND INFORMATION
1 Respondent number
mRrjnkrk dh la[;k
…………………………………………
1
2 Name of the State
jkT; dk uke
…………………………………………
2
3 Name of the District
ftys dk uke
…………………………………………
3
4 Name of the Block
CykWd dk uke
…………………………………………
4
5 Name of the Village xkWo dk uke
…………………………………………
5
S C H E D U L E Beneficiary

Page 142 of 15
6 Name of the Respondent
mRrjnkrk dk uke
…………………………………………
6
7 Name of the Caste
Tkkfr dk uke
…………………………………………
7
8 Were you allotted the land for which you were entitled? D;k vidks mruh tehu feyh ftlds vki gdnkj Fks\
1 Yes
gkW
2 No
ugha feyh gSa
8
9 What was the size of the allotted land? vkidks fdruh tehu vkoafVr gqbZ\
Acres ,sdM esas Irrigated (Acres) flafpr ¼,dM½ …………………………
Un-irrigated (Acres) vflafpr ¼,dM½ …………………
I
II In local measure ogkW ds uki esas
Irrigated (Acres) flafpr ¼,dM½ …………………………
Un-irrigated (Acres) vflafpr ¼,dM½ ………………………
9
10
III Name of local measure uki dk uke ………………………………………….. 11
IV How many bigha / Gattha / Kanal / is equal to 1 acre vki ds bykds esa ,d ,sdM esas fdrus ch?ks@xV~Vs@duky gksrs gSA
12
V How many years ago the land was allotted to you vkidks fdrus o’kZ igys tehu feyh FkhA …………………………………………………………………..
13
10 Was the land which was allotted to you vkidks tks tehu vkoafVr gqbZ mlesa ls fdruh tehu vkidks feyhA
1 As Per your Entitlement ftrus ds vki gdnkj Fks ¼,dM½ Size of land (Acre) fdruh tehu ¼,dM½ --------------------------------
2 Less than Entitlement (Acre) gd ls de ¼,dM½ Size of land (Acre) fdruh tehu ¼,dM½ --------------------------------
3 More than Entitlement (Acre) gd ls T;knk ¼,dM½ Size of land (Acre) fdruh tehu ¼,dM½ --------------------------------
14
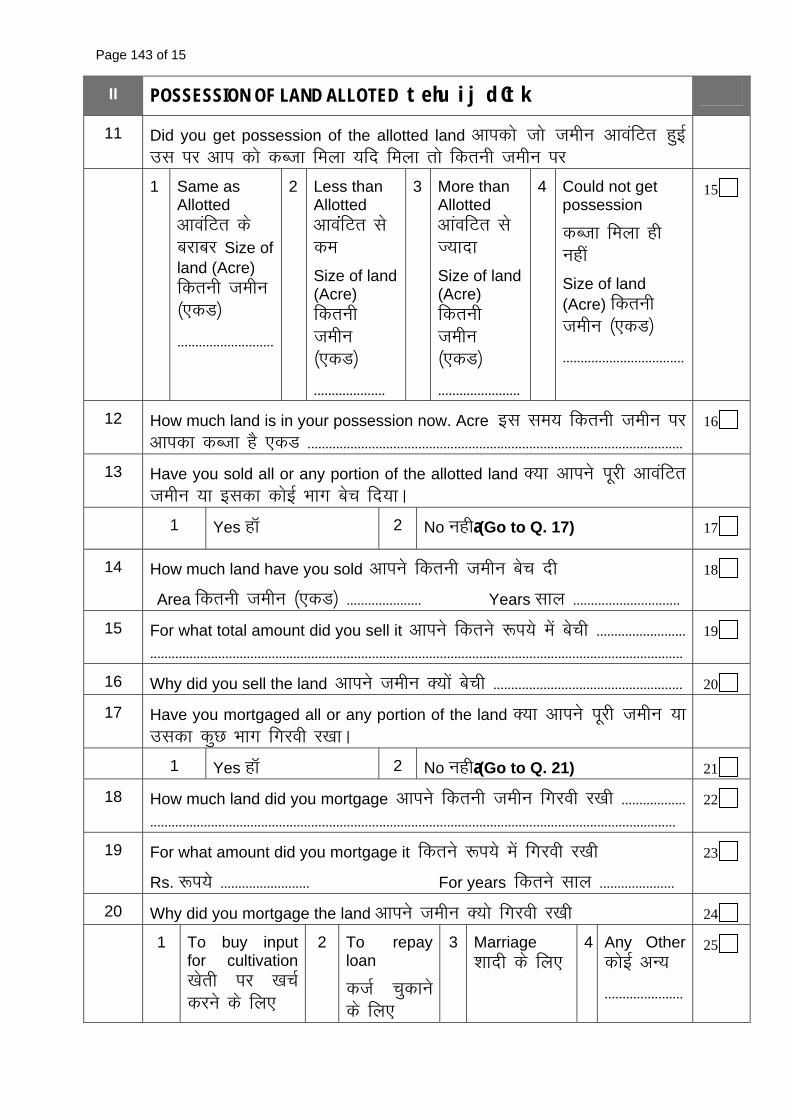
Page 143 of 15
II POSSESSION OF LAND ALLOTED tehu ij dCtk
11 Did you get possession of the allotted land vkidks tks tehu vkoafVr gqbZ ml ij vki dks dCtk feyk ;fn feyk rks fdruh tehu ij
1 Same as Allotted vkoafVr ds cjkcj Size of land (Acre) fdruh tehu ¼,dM½
---------------------------
2 Less than Allotted vkoaaaafVr ls de
Size of land (Acre) fdruh tehu ¼,dM½
--------------------
3 More than Allotted vkaofVr ls T;knk
Size of land (Acre) fdruh tehu ¼,dM½
-----------------------
4 Could not get possession
dCtk feyk gh ugha
Size of land (Acre) fdruh tehu ¼,dM½
----------------------------------
15
12 How much land is in your possession now. Acre bl le; fdruh tehu ij vkidk dCtk gS ,dM ---------------------------------------------------------------------------------------------------------
16
13 Have you sold all or any portion of the allotted land D;k vkius iwjh vkoafVr tehu ;k bldk dksbZ Hkkx csp fn;kA
1 Yes gkW 2 No ugha (Go to Q. 17) 17
14 How much land have you sold vkius fdruh tehu csp nh
Area fdruh tehu ¼,dM½ --------------------- Years lky ------------------------------
18
15 For what total amount did you sell it vkius fdrus :i;s esa csph ------------------------------------------------------------------------------------------------------------------------------------------------------------------------------
19
16 Why did you sell the land vkius tehu D;ksa csph ----------------------------------------------------- 20 17 Have you mortgaged all or any portion of the land D;k vkius iwjh tehu ;k
mldk dqN Hkkx fxjoh j[kkA
1 Yes gkW 2 No ugha (Go to Q. 21) 21 18 How much land did you mortgage vkius fdruh tehu fxjoh j[kh ------------------
--------------------------------------------------------------------------------------------------------------------------------------------------- 22
19 For what amount did you mortgage it fdrus :i;s esa fxjoh j[kh
Rs. :i;s ------------------------- For years fdrus lky ---------------------
23
20 Why did you mortgage the land vkius tehu D;ks fxjoh j[kh 24 1 To buy input
for cultivation [ksrh ij [kpZ djus ds fy,
2 To repay loan
dtZ pqdkus ds fy,
3 Marriage 'kknh ds fy,
4 Any Other dksbZ vU;
----------------------
25

Page 144 of 15
21 Has certain portion of your land been encroached by others D;k vki dh dqN tehu ij nwljksaa dk dCtk gS
1 Yes gkW 2 No ugha (Go to Q. 29) 26 22 If Yes, how much area (Acre) ;fn gkW] rks fdrus fgLls ij ¼,dM½ -------------------
----------------------------------------------------------------------------------------------------------------------------------------------------- 27
23 Since when dCtk dc ls gS -------------------------------------------------------------------------------------------- 28 24 By whom dCtk fdlus fd;k gS 1 Village
Panchayat xzke iapk;r dk
2 Neighboured tehu ds vklikl tku igpku okyksa dk
3 Elite Villagers ncax yksxksa dk
4 Upper Caste
Åaph tkfr ds yksxksa dk
5 Any other dksbZ vU;
-------------
29
25 Did you take any action to get back your land, which has been encroached upon? ftl tehu ij nwljksa dk dCtk gS mldks okil ysus ds fy, vkius D;k fd;k\
1 No Action Taken dksbZ iz;kl ugha
2 Filed a case in the court U;k;ky; x;s
3 Filed a complained in the SC/ST Tribunal, ,l-lh-@,l-Vh- f'dk;r izdksCV esa x;sa
4 Any Other dksbZ vU;
--------------------
30
26 What was the result; D;k ifj.kke fudyk 1 Got Land Back
tehu okil fey xbZ
2 Case in under
consideration dsl py jgk
gS
3 No Result dksbZ
ifj.kke ugha
4 Any Other dksbZ vU;
----------------------
31
27 If No, Action taken vxj dksbZ dk;ZokbZ ugh dh xbZ rks dkj.k D;k gS 1 Afraid of
consequences urhts ls Mj yxrk gS
2 Do not know whom to complain irk ugh gS f'kdk;r dgk djuh
gS
3 No Money to file case U;k;ky; tkus ds fy, iSlk ughs gS
4 Any Other dksbZ vU; -----------------------
32

Page 145 of 15
28 What is your expectation from the government in this regard bl ekeys esa vki ljdkj ls D;k lgk;rk pkgrs gS -----------------------------------------------------------------------
………………………………………………………………………….…………..
33
III QUANTITY AND QUALITY OF LAND ALLOTED tehu fdruh gS vkSj fdl rjg dh gS
29 What was the quality of land, which was allotted to you? vkidh feyh gqbZ tehu fdl rjg dh gS]
1 Fertile mitkÅ (Go to Q. 34) 2 Un-fertile vumitkÅ 34
30 If Unfertile, type of land ;fn vumitkÅ gS] rks og fdl rjg dh gS]
1 Waste Land catj tehu 35
2 Full of Stone iFkjhyh 36
3 Sandy jsrhyh 37
4 Swampy nyny 38
5 Pot holes / Undulated xM~Mksa okyh tehu 39
6 Others vU; rjg dh --------------------------------------------------------------------------------------- 40
31 Did you make any effort to improve the quality of unfertile land? D;k vki us mls mitkÅ cukus ds fy, dksbZ dksf'k'k dhA
1 Yes gkW 2 No ugha (Go to Q. 34) 41
32 If yes, what efforts did you make to improve the quality of unfertile land? ;fn gkW] rks mls mitkÅ cukus ds fy, vkius D;k dksf'k'k dh\
1 Added Soil Amendments tehu dh moZjdrk esa lq/kkj fd;k
2 Created Drainage system ukyh flLVe cuk;k
3 Levelled Land to Enable Cultivation tehu dks cjkcj fd;k
4 Any others dksbZ vU;----------------------
42
33 How much expense incurred?Rs bl ij fdrus :i;s [kpZ gq,\
:i;s ………………………………………………………………………………
43

Page 146 of 15
34 Whether land is irrigated? D;k vkidh tehu ij flpkbZ gks tkrh gS
1 Yes gkW
2 No (Go to 38) ugha
35 If yes, source of irrigation? ;fn gkW] rks flpkbZ dk lk/ku\
1 Pump set iEi LkSV Own viuk gS Hire fdjk;s dk gS 44
2 Canal ugj Own viuk gS Hire fdjk;s dk gS 45
3 Well dqvkW Own viuk gS Hire fdjk;s dk gS 46
4 Drip Irrigation QOokjs ls flapkbZ
Own viuk gS Hire fdjk;s dk gS 47
5 Ponds rkykc Own viuk gS Hire fdjk;s dk gS 48
6 Any Other dksbZ vU; --------------- Own viuk gS Hire fdjk;s dk gS 49
36 Does the location of your plot of land pose any disadvantages in terms of access to irrigation etc. tgkW vkidh tehu gS D;k ogkW flpkbZ eq'kfdy gS
50
1 Yes gkW 2 No ugha
37 What are the problems you face due to this bl ds dkj.k vkidks fdl izdkj dh leL;k dk lkeuk djuk iMrk gSA -- ………………………………………..
51
IV SELF CULTIVATED LAND [kqn [ksrh djus okyh tehu
38 Do you cultivate all the land yourself? D;k vki lkjh tehu ij [kqn [ksrh djrs gS\
1 Yes gkW
Size of land (Acre) fdruh tehu ¼,dM½--------------------------
2 No ughsa (Go to 40)
Size of land (Acre) fdruh tehu ¼,dM½-------------------------
3 Part of it
dqN fgLlk
Size of land (Acre) fdruh tehu ¼,dM½-------------------------
52 53
39 How is the rest of the land cultivated ftl tehu ij vki [ksrh ugh djrs gS rks ml ij [skrh dSls gksrh gS
1 Land Sold tehu csp nh
2 Share cropping
cVkbZ ij
3 Leased Out,
Bsds ij
4 NA
ykxw ughsa
54

Page 147 of 15
40 Which of the following agricultural implements / Machinery do you own or hire? uhps fy[ks [ksrh ds vkStkj vkids vius gS ;k fdjk;s ds gSA
Equipments vkStkj@lkeku
Own vius gS Hire fdjk;s ds gS
Tractor VªSDVj Own vius gS Hire fdjk;s ds gS 55 Cultivator dYVhosVj Own vius gS Hire fdjk;s ds gS 56 Harrow gSjks Own vius gS Hire fdjk;s ds gS 57 Trolley VªkWyh Own vius gS Hire fdjk;s ds gS 58
Plough gy Own vius gS Hire fdjk;s ds gS 59 Animals for ploughing
tksrus ds fy, tkuoj Own vius gS Hire fdjk;s ds gS 60
Any other dksbZ vU; ……………….
Own vius gS Hire fdjk;s ds gS 61
V 41 UTILIZATION OF LAND tehu dk mi;ksx Crop Qly
Area Sown (Acre) fdruh tehu ij [ksrh dh\
Production(Quintals) iSnkokj ¼dq0 es½
Grain Sold (Q) fdruk xYyk cspk ¼dq0½
Income vkenuh (Rs)
Self Consumption/ Storage vius [kkus ds fy, fdruk j[kk ¼dq0 es½
Current Year (July 2007-June 08)– Irrigated Land bl o’kZ ¼tqykbZ 07&twu&08½ flafpr Hkwfe dk C;kSjk
62 63 64 65
66 67 68 69
70 71 72 73
Current Year (July 2007-June 08)– Un-Irrigated Land ¼tqykbZ 07&twu&08½ vflafpr Hkwfe dk C;kSjk\
74 75 76 77
78 79 80 81
82 83 84 85
Past Year (July 2006-June 07) – Irrigated Land fiNys o’kZ ¼tqykbZ 06&twu&07½ flafpr Hkwfe dk C;ksjk

Page 148 of 15
86 87 88 90
91 92 93 94
Past Year (July 2006-June 07) – Un-Irrigated Land ¼tqykbZ 06&twu&07½ vflafpr Hkwfe dk C;kssjk 95 96
97 98 99 100
101 102 103 104
105 106
42 What are the problems faced by you in proper utilization of the Land. vPNh rjg ls tehu dk mi;ksx djus esa vkidks D;k leL;k,Wss vkrh gS-
1 Land is unfertile tehu mitkÅ ughs gS 1 Yes 2 No 107 2 Land is not levelled tehu cjkcj ughs gS 1 Yes 2 No 108 3 Wasteland tehu catj gS 1 Yes 2 No 109 4 Land is removed from any irrigation facility
tehu ij flpkbZ dk dksbZ cUnkscLr ugha gS 1 Yes 2 No 110
5 Unable to water the Crop regularly flapkbZ yxkrkj ugha gks ldrhA
1 Yes 2 No 111
6 No animals for drawing water from well dqa,@cksfjax ls ikuh f[kpus ds fy, dksbZ tkuoj ughsa gS
1 Yes 2 No 112
7 Electricity problem fctyh dh leL;k gS 1 Yes 2 No 113 8 No animals to Farm’s the land [ksrh ds
fy, tkuoj ugh gS 1 Yes 2 No 114
9 Non availability of tractor / animals for ploughing on time le; ij VS~DVj @tkuoj tksrus dks ugh feyrsA
1 Yes 2 No 115
10 Financial Problem :Ik;s iSls dh deh 1 Yes 2 No 116 11 Any other dksbZ vU;………………………… 1 Yes 2 No 117 43 Do you face a lack of resources in purchasing any of the following? D;k
vkidks uhpas fy[ks lkeku dks [kjhnus esa dksbZ ijs'kkuh vkrh gS A
1 Buying Tractor VS~DVj [kjhnus esa 1 Yes 2 No 118 2 Buying Better seed vPNk cht [kjhnus esa 1 Yes 2 No 119 3 Buying Fertilizer QjVhykbZtj [kjhnus esa 1 Yes 2 No 120 4 Buying Insecticide dhV uk'kd nok [kjhnus
esa 1 Yes 2 No 121

Page 149 of 15
5 To engage labour on wages etnwj yxkusa
esa
1 Yes 2 No 122
6 Any other dksbZ vU; --------------------------------------------- 1 Yes 2 No 123 44 Did you try to get loan to improve you cultivation D;k vkius viuh [ksrh
lq/kkjus ds fy, dtZ ysus dh dksf”k”k dhA
1 Yes gkW 2 No ughs 124 45 If No. why ;fn ugh rks D;ksa ………………………………………(Go to 49) 125 46 If Yes – details ;fn gkW] rks fooj.k ns 1 Source dgk ls dtZ fy;k ……………………………………………… 126 2 Purpose fdl dke ds fy, …………………………………………… 127 3 Amount fdrus :i;as …………………………………………………… 128 4 Interest Rate C;kt dk nj ……………………………………………… 129
5 Subsidy dksbZ NwV feyh ………………………………………………… 130 6 Year Ok’kZ ……………………………………………………………… 131 7 Instalment amount Rs jde dh fdLr :i;s ----------------------------------------------- 132 8 Total Amount Repaid Rs vc rd fdruh jde okil dhas xb :i;
……………………………………………………………………………. 133
9 Paying instalment on time D;k fdLrs le; ij okil dh tk jghs gS 1 Yes gkW 2 No ugh 134
47 10 If No, Reasons ;fn ugh rks dkj.k …………………………………… 135 48 11 Problems faced in repaying loan dtkZ okil djus esa leL;k D;k gS
……………………………………………………………………………… 136
49 Did you receive any funds / assistance for cultivation? D;k vkidks viuh [ksrh dh enn ds fy, ljdkj ls dksbZ lgk;rk feyh\
1 Yes gkW 2 No (Go to 54) ugh 137 50 1 If Yes, Source ;fn gkW ] rks dgk ls …………………….………………… 138 51 2 Purpose lgk;rk fdl fy, yh …………………………………………. 139 52 3 Amount/Type of Assistance fdruh jde@fdl rjg dh lgk;rk yh
……………… 140
53 4 Year fdl o’kZ esa ………………………………………………………. 141 VI SHARE CROPPING cVkbZ dh tehu
54 Have you given the land on share cropping D;k vkius tehu CkVkbZ ij ns j[kh gS

Page 150 of 15
1 Yes gkW 2 No (Go to 59) ugh 142 55 What led you to give the land on share cropping tehu dks cVkbZ ij nsus
dk D;k dkj.k FkkA
1 Financial Problems vkfFkZd leL;k,W ¼iSlksa dh deh½ 143 2 Lack of Equipments midj.kks@lk/kuksaa dh deh 144 3 Small Size of Land FkksMh lh tehu gS 145 4 Any other dksbZ vU; …………………………………………………. 146
56 How many acres given on sharecropping fdrus ,sdM Hkwfe cVkbZ ij nhA
Irrigated flafpr ¼,dM½ …….. ………………………………………. .. .
Un-irrigated vflafpr ¼,dM½ ……………..……………………………….
147 148
57 The share cropping is based on which system [ksrh dks cVkbZ ij nsus dk D;k rjhdk gSA
1 50:50 vk/ks ij 2 Fixed Rate fuf'pr nj ij
149
58 If Fixed, what is your share ;fn fuf'pr nj ij] rks vki dk fdruk Hkkx gS -----------------------------------------------------------------------------------------------------------------------------------------
150
VII CONTRACT BASIS Bsds ij
59 Have you given the land on contract basis D;k vkius tehu Bsds ij ns j[kh gS
1 Yes gkW 2 No ugha (Go to Q. 66) 151 60 What led you to give the land on contract basis tehu dks Bsds ij nsus dk
D;k dkj.k Fkk
1 Financial Problems :i;s&iSlksa dh deh 152 2 Lack of Equipments midj.kks @lk/kuks dh deh 153 3 Small Size of Land [ksr NksVk Fkk 154 4 Any other vU; dksbZ ………………………………………… 155
61 How many acres given on contract basis? Bsds ij fdrus ,sdM tehu nh
Irrigated (Acre) flafpr ¼,dM½ -------------------------------------------------------------------------
Un-irrigated (Acre) vflafpr ¼,dM½ --------------------------------------------------------
156 157
62 The land has been given on contract for how many years Bsds ij tehu fdrus o’kZ ds fy, nh gSA lky ---------------------------------------------------------------------------------
158
63 The contract is based on which system tehu nsus dk D;k rjhdk gS 1 Grain Qly 2 Cash udn :i;ks ij 159

Page 151 of 15
64 If Fixed on grain basis, what is the distribution vxj Qly ij rks vkidks fdruk dq0 vukt feysxk -----------------------------------------------------------------------------
160
65 If Fixed on cash basis, what is the payment ;fn udn :i;ks ij gS ] rks fdrus :i;s feysxs Rs…………………………………………………………
161
66 Which of the following systems is more profitable uhps fy[kh dkSu lk rjhdk T;knk ykHknk;d gSA
1 Self Cultivation
[kqn [ksrh djuk
2 Contract
Bsds ij [skrh nsuk
3 Share Crop Basis
cVkbZ ij nsuk
162
VIII SOCIO-ECONOMIC IMPACT lkekftd vkfFkZd izHkko
Ever since the land has been allotted to you, what is the impact on your socio-Economic status vkidks tks tehu feyh mldk vkids lkekftd vkSj vkfFkZd Lrj ij D;k izHkko iMk Social Status lkekftd Lrj
67 Children admitted to Good school cPpks dk vPNsa Ldwy esa nf[kyk fd;kA
1 Yes 2 No 163
68 Better / more consumption of food vPNk@HkjisV [kkuk [kkus yxs
1 Yes 2 No 164
69 Better clothing vPNs diMs iguus yxs
1 Yes 2 No 165
70 More expense on social functions rht R;kSgkj ij T;knk [kpZ djrs gS
1 Yes 2 No 166
71 More prominent role in village political life xkWo dh jktfufr esa vf/kd Hkkx fy;kA
1 Yes 2 No 167
72 Better spouse in marriage cPpksa ds fookg ds fy, csgrj fj'rk feykA
1 Yes 2 No 168
73 Avail health facilities vPNk bykt djk;k
1 Yes 2 No 169
74 Gain respect in the village community lekt esa bTtr c<hA
1 Yes 2 No 170
75 Any Other dksbZ vU; ---------------------- 1 Yes 2 No 171
Ever since the land has been allotted to you, what is the impact on your tks tehu vkidks feyh ml ls vkids jgu&lgu esa D;k QdZ iMkA Economic Status vkfFkZd Lrj
76 Better Housing vPNk ?kj cuk 1 Yes 2 No 172

Page 152 of 15
fy;k 77 Better access to electricity fctyh
ysus esa vklkuh gqbZ 1 Yes 2 No 173
78 Higher income than before igys ls vkenuh c< xbZ
1 Yes 2 No 174
79 Own or better source of drinking water lkQ lqFkjk ikuh ihus yxs
1 Yes 2 No 175
80 Better household expenditure ?kj dk [kpkZ vPNs <ax ls djus yxs
1 Yes 2 No 176
81 No need to borrow from money lender / repaid all loans fdlh ls m/kkj ysus dh t:jr ugh@dtkZpqdk fn;k
1 Yes 2 No 177
82 Expanded occupational activities viuk dkjksckj dj fy;k
1 Yes 2 No 178
83 Any Other dksbZ vU; ------------------------ 1 Yes 2 No 179
IX SCHEDULED CASTES FINIANCE DEVELOPMENT CORPORATION vuqlwfpr tkfr fofr; fodkl LkaLFkku
84 Are you aware of the existence of NSFDC and its purpose of assisting D;k vki vuqlwfpr tkfr fofr; fodkl laLFkku ls fdl rjg dh enn feyrh gS ;s tkurs gS
1 Yes gkW 2 No (Go to 90) ugh 180 85 Have you ever availed of any scheme or loan from the NSFDC D;k
vkius NSFDC dhs fdlh ;kstuk ls Qk;nk mBk;k gS ;k mlls dtkZ fy;k gSA
1 Yes gkW 2 No ugh 181 86 Which of the following schemes did you avail dkSu dkSu lh ;kstukvksa ls
vkius Qk;nk mBk;k gS
1 Income Generating Scheme vkenuh c<kus dh ;kstuk
1 Yes 2 No
2 Micro Credit Finance vYi cpr foRr ;kstuk ¼S.H.G)
1 Yes 2 No
3 New Skills/Skill Development programme ubZ dq'kyrk@ dq'kyrk fodkl dk;Zdze
1 Yes 2 No
182 183 184 185
87 If you took loan ;fn vkius dtkZ fy;kA 1 Purpose rks fdl fy, ------------------------------------------------------------------------------------- 186
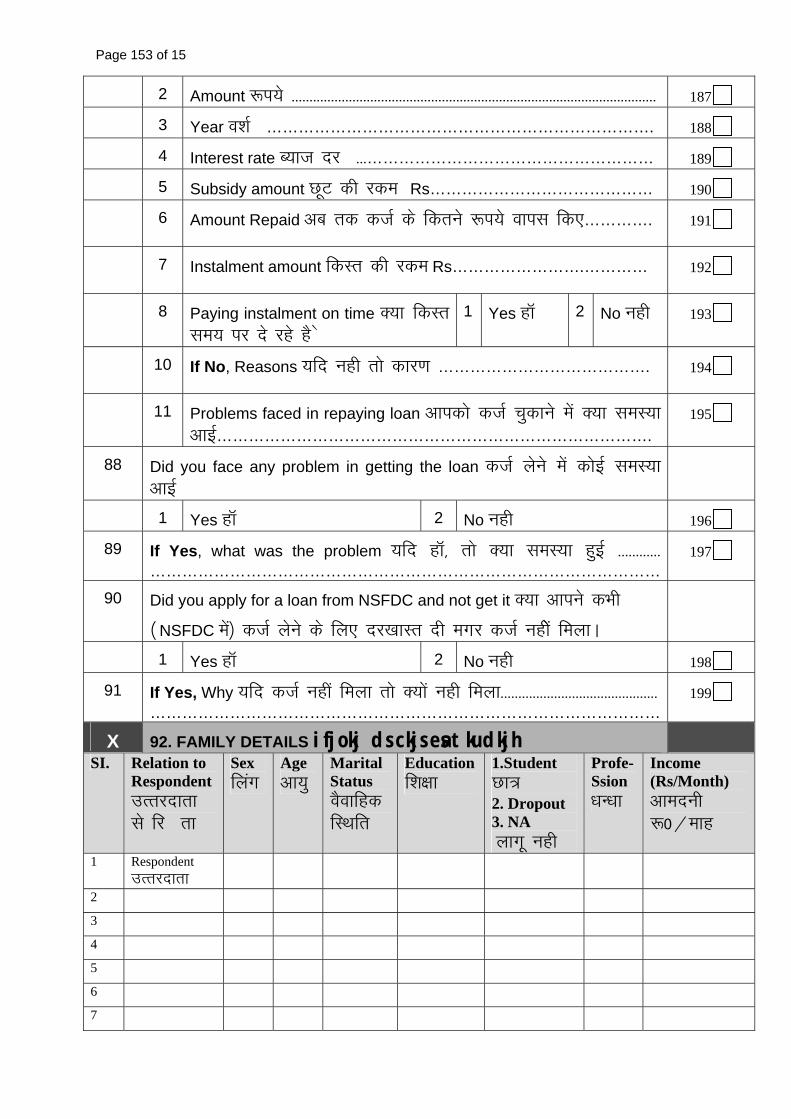
Page 153 of 15
2 Amount :i;s ------------------------------------------------------------------------------------------------------ 187 3 Year Ok’kZ ………………………………………………………………. 188 4 Interest rate C;kt nj ---……………………………………………… 189 5 Subsidy amount NwV dh jde Rs…………………………………… 190 6 Amount Repaid vc rd dtZ ds fdrus :i;s okil fd,…………. 191
7 Instalment amount fdLr dh jde Rs…………………….………… 192
8 Paying instalment on time D;k fdLr le; ij ns jgs gS s
1 Yes gkW 2 No ugh 193
10 If No, Reasons ;fn ugh rks dkj.k …………………………………. 194
11 Problems faced in repaying loan vkidks dtZ pqdkus esa D;k leL;k vkbZ……………………………………………………………………….
195
88 Did you face any problem in getting the loan dtZ ysus esa dksbZ leL;k vkbZ
1 Yes gkW 2 No ugh 196 89 If Yes, what was the problem ;fn gkW] rks D;k leL;k gqbZ ------------
……………………………………………………………………………………197
90 Did you apply for a loan from NSFDC and not get it D;k vkius dHkh
¼ NSFDC esa½ dtZ ysus ds fy, nj[kkLRk nh exj dtZ ughsa feykA
1 Yes gkW 2 No ugh 198 91 If Yes, Why ;fn dtZ ugha feyk rks D;ksa ugh feyk--------------------------------------------
……………………………………………………………………………………199
X 92. FAMILY DETAILS ifjokj ds ckjs esa tkudkjh SI. Relation to
Respondent mRrjnkrk ls fj”rk
Sex fyax
Age vk;q
Marital Status oSokfgd fLFkfr
Education f'k{kk
1.Student Nk= 2. Dropout 3. NA ykxw ugh
Profe- Ssion /kU/kk
Income (Rs/Month) vkenuh :0@ekg
1 Respondent mRrjnkrk
2
3
4
5
6
7

Page 154 of 15
8
9
200 201 202 203 204 205 206 207 208 209 210 211 212 213 214 215 216 217 218 219 220 221 222
XI OWENED LAND viuh tehu
93 Apart from the land allotted to you did you own any land personally vkoafVr tehu tks vkidks feyh D;k mlds vykok vkidh [kqn dh tehu gS@ FkhA
1 Yes gkW 2 No ugh (go to 98)
222
94 If Yes, total Land ;fn gkW] dqy tehu
Irrigated (Acre) flafpr ¼,dM½ -------------------------------------------------------------------
Un-irrigated (Acre) vflafpr ¼,dM½ ----------------------------------------------------
223
224
95 At present how much of that land do you still possess mlesa ls bl le; vkids dCts esa fdruh tehu gS
Irrigated (Acre) flafpr ¼,dM½ -------------------------------------------------------------------
Un-irrigated (Acre) vflafpr ¼,dM½ ----------------------------------------------------
225
226
96 Have you sold any part of the land you personally owned D;k vkius futh tehu dk dqN fgLlk cspk gS
1 Yes gkW 2 No ugh 227
97 If Yes how much land did you sell? ;fn gkW] rks fdruh tehu csph gS
Irrigated (Acre) flafpr ¼,dM½ ---------------------------------Rate/Acre………
Un-irrigated (Acre) vflafpr ¼,dM½ ------------------ Rate/Acre………
228
229
230
231 9988.. AANNYY OOTTHHEERR IINNFFOORRMMAATTIIOONN // SSUUGGGGEETTIIOONNSS dksbZ vU; tkudkjh ;k lq>ko ………………………………………………………………………………………………………………………………………………………………………………………………………………………… ………………………………………………………………………………………………………………………………………………………………………………………………………………………… ………………………………………………………………………………………………………………………………………………………………………………………………………………………… ………………………………………………………………………………………………………………………………………………………………………………………………………………………… NNAAMMEE && SSIIGGNNAATTUURREE OOFF IINNVVEESSTTIIGGAATTOORR……………………………………………………………………………………………………………… NNAAMMEE OOFF TTHHEE SSUUPPEERRVVIISSOORR ………………………………………………………………………………………………………………………………………… DDAATTEE………………………………………………………………………………………………………………………………………………………………………………………… CCHHEECCKKEEDD BBYY

Page 155 of 15
NNAAMMEE…………………………………………………………………………………………………………………………………………………………………………………….... SSIIGGNNAATTUURREE ………………………………………………………………………………………………………………………………………………………………………….... DDAATTEE…………………………………………………………………………………………………………………………………………………………………………………………..
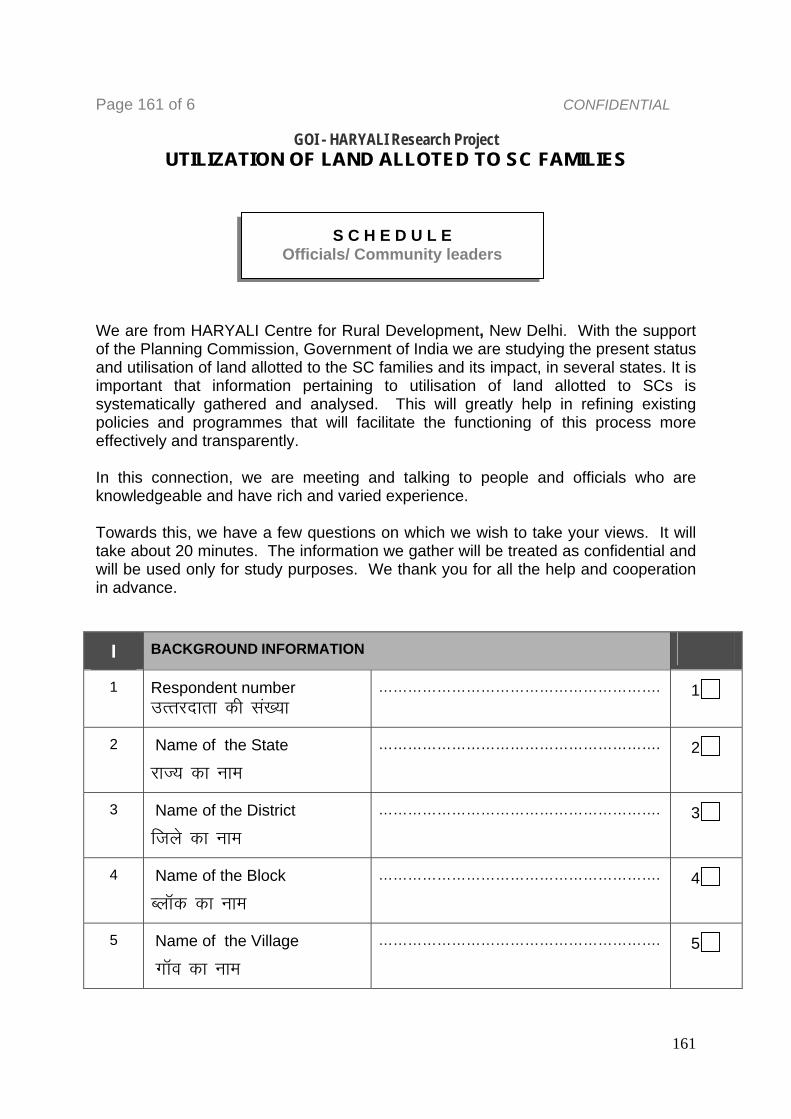
Page 161 of 6 CONFIDENTIAL
GOI - HARYALI Research Project UTILIZATION OF LAND ALLOTED TO SC FAMILIES
We are from HARYALI Centre for Rural Development, New Delhi. With the support of the Planning Commission, Government of India we are studying the present status and utilisation of land allotted to the SC families and its impact, in several states. It is important that information pertaining to utilisation of land allotted to SCs is systematically gathered and analysed. This will greatly help in refining existing policies and programmes that will facilitate the functioning of this process more effectively and transparently. In this connection, we are meeting and talking to people and officials who are knowledgeable and have rich and varied experience. Towards this, we have a few questions on which we wish to take your views. It will take about 20 minutes. The information we gather will be treated as confidential and will be used only for study purposes. We thank you for all the help and cooperation in advance.
I BACKGROUND INFORMATION
1 Respondent number mRrjnkrk dh la[;k
…………………………………………………. 1
2 Name of the State
jkT; dk uke
…………………………………………………. 2
3 Name of the District
ftys dk uke
…………………………………………………. 3
4 Name of the Block
CykWd dk uke
…………………………………………………. 4
5 Name of the Village
xkWo dk uke
…………………………………………………. 5
S C H E D U L E Officials/ Community leaders
161

6 Name of The Respondents mRrjnkrk dk uke
…………………………………………………. 6
7 Position in the Village community
in dk uke
…………………………………………………. 7
II VIEWPOINT BASED QUESTIONS fuEu ds ckjsa es vkids D;k fopkj gS
8 What is the pattern of land utilization by the SCs vuqlwfpr tkfr ¼,l-lh-½ leqnk; ds yksxksa dks tks tehu nh xbZ oks bLrseky dSls djrs gSA
1 Majority of them sold the land allotted to them vkaofVr tks tehu mudks feyh Fkh T;knkrj yksaxks us mls csp fn;k gSA
1 Yes 2 No 8
2 Majority of them have given it on contract T;knkrj Bsds ij ns nsrs gS
1 Yes 2 No 9
3 Majority of them have given it on share cropping basis T;knkrj cVkbZ ij ns nsrs gSA
1 Yes 2 No 10
4 Majority are cultivating the land allotted themselves T;knkrj Loa; gh [ksrh djrs gS
1 Yes 2 No 11
9 What was the quality of the land allotted to majority of the SC’s vuqlwfpr tkfr ds yksxksa dks tks tehu feyh Fkh T;knkrj fdl rjg dh tehu Fkh
1 Fertile mitkÅ Estimated YkxHkx %……………….… 12
2 Unfertile vumitkÅ Estimated YkxHkx %……………….… 13
10 If Unfertile, type of land ;fn vumitkÅ feyh rks T;knkrj fdl rjg dh tehu nh xbZ
1 Waste Land catj@csdkj tehu 14
2 Full of Stone iFkjhyh 15
3 Sandy jsrhyh 16
4 Swampy nynyh 17
5 Pot holes xìs okyh 18
162

6 Any Others dksbZ vU; ------------------------------
19
11 What measures would you suggest to improve the quality of the land tehu dks mitkÅ cukus ds fy, vki D;k lq>ko nsuk pkgsaxs ----------------------------------------------------------------------------------------------------------------------------------------------------------------------------------------------------------------------------------------------------------------------------------------------------------------------
20
12 What possible support can be given to the SCs to increase their produce and income from agricultural production vuqlwfpr tkfr ds yksxksa dh [ksrh dh iSnkokj ,oa mlls vkenuh c<kus ds fy, mudh D;k lgk;rk dh tk ldrh gS -------------------------------------------------------------------------------------------------------------------------------------------------------------------------------------------------------------------------------------------------------------------------------------------------------------------------------------------------------------------------------------------------------------------
21
III IMPACT ON SOCIAL STATUS lkekftd Lrj ij izHkko 13 Ever since the land has been allotted to the SCs, according to you what
has been the impact on their social status ftu vuqlwfprtkfr ds yksxska dks tehu feyh Fkh muds lkekftd LRkj esa D;k cnykvksa vk;k gS tSls
I Children admitted to school cPps Ldwy tkus yxs
1 Yes 2 No 22
II Better \more consumption of food vPNk [kkuk [kkus yxs
1 Yes 2 No 23
III Better clothing vPNs diMs iguus yxs
1 Yes 2 No 24
IV More expense on social functions rht R;ksgkj esa T;knk [kpZ djus yxas]
1 Yes 2 No 25
V More prominent role in village political life xkWo dh jktuhfr esa T;knk Hkkx ysus yxs
1 Yes 2 No 26
VI Better spouse in marriage vPNh txg 'kknh gks tkrh gS
1 Yes 2 No 27
VII Avail health facilities vius LokLFk dh vPNh ns[kHkky djus yxs
1 Yes 2 No 28
VIII Gain respect in the village community xkWo esa mudh vPNh Nfo gks x;h gS
1 Yes 2 No 29
IX Any Other dksbZ vU; ------------------------- 1 Yes 2 No 30
IV IMPACT ON ECONOMIC STATUS vkfFkZd Lrj ij izHkko 14 Ever since the land has been allotted to the SCs, according to you what
163
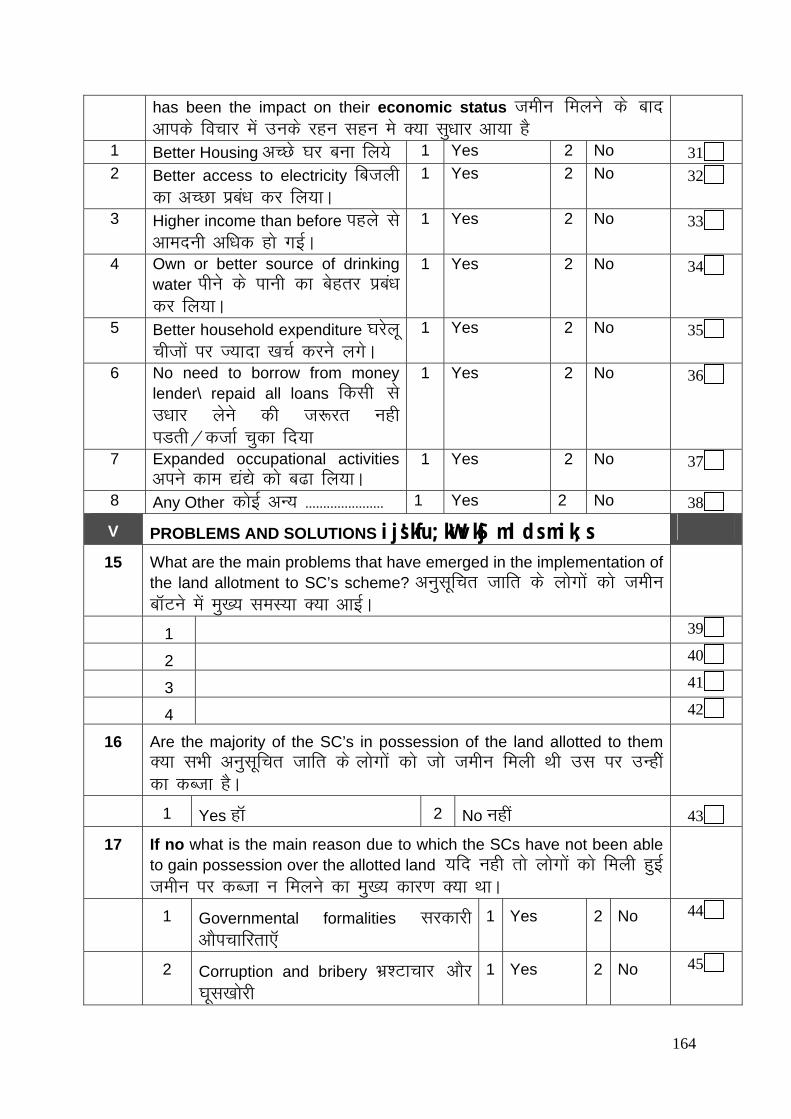
has been the impact on their economic status tehu feyus ds ckn vkids fopkj esa muds jgu lgu es D;k lq/kkj vk;k gS
1 Better Housing vPNs ?kj cuk fy;s 1 Yes 2 No 31 2 Better access to electricity fctyh
dk vPNk izca/k dj fy;kA 1 Yes 2 No 32
3 Higher income than before igys ls vkenuh vf/kd gks xbZA
1 Yes 2 No 33
4 Own or better source of drinking water ihus ds ikuh dk csgrj izca/k dj fy;kA
1 Yes 2 No 34
5 Better household expenditure ?kjsyw phtksa ij T;knk [kpZ djus yxsA
1 Yes 2 No 35
6 No need to borrow from money lender\ repaid all loans fdlh ls m/kkj ysus dh t:jr ugh iMrh@dtkZ pqdk fn;k
1 Yes 2 No 36
7 Expanded occupational activities vius dke |a|s dks c<k fy;kA
1 Yes 2 No 37
8 Any Other dksbZ vU; ---------------------- 1 Yes 2 No 38
V PROBLEMS AND SOLUTIONS ijs'kfu;kW vkSj mlds mik;s
15 What are the main problems that have emerged in the implementation of the land allotment to SC’s scheme? vuqlwfpr tkfr ds yksxksa dks tehu ckWVus esa eq[; leL;k D;k vkbZA
1 39
2 40
3 41
4 42
16 Are the majority of the SC’s in possession of the land allotted to them D;k lHkh vuqlwfpr tkfr ds yksxksa dks tks tehu feyh Fkh ml ij mUghsa dk dCtk gSA
1 Yes gkW 2 No ugha 43
17 If no what is the main reason due to which the SCs have not been able to gain possession over the allotted land ;fn ugh rks yksxksa dks feyh gqbZ tehu ij dCtk u feyus dk eq[; dkj.k D;k FkkA
1 Governmental formalities ljdkjh vkSipkfjrk,W
1 Yes 2 No 44
2 Corruption and bribery Hkz’Vkpkj vkSj ?kwl[kksjh
1 Yes 2 No 45
164

165
3 Land usurped by the powerful elite rkdroj yksxksa dk xSj dkuwuh dCtk
1 Yes 2 No 46
4 Land near upper caste village so they were against it tehu xkWo ds mPp tkfr ds yksxksa ds ikl Fkh blfy, cgqr f[kykQ FksA
1 Yes 2 No 47
5 Any other dksbZ vU; ----------------------------------- 1 Yes 2 No 48
18 What steps have been taken by village leadership to ensure that those allotted land gain possession over it xkWo ds usrk yksxks us dCtk fnykus es D;k enn dhA ----------------------------------------------------------------------------------------------------------------------------------------------------------------------------------------------------------------------------------------------------------------
49
19 Have any disputes over land allotment come to the Panchayat for resolution feyh gqbZ tehu ds fookn iapk;r ds ikl vkrs gS
1 Yes gkW 2 No ugh 50
20 If Yes, could you furnish the details of the dispute/s ;fn gkW] rks D;k vki crk ldrs gSa fd fookn dh tM+ D;k FkhA …………………………………..
51
21 What was the action taken by the Panchayat iapk;r us D;k QSlyk fd;kA ---------------------------------------------------------------------------------------------------------------------------------
52
2222.. AANNYY OOTTHHEERR IINNFFOORRMMAATTIIOONN//SSUUGGGGEESSTTIIOONNSS dksbZ vU; tkudkjh ;k lq>ko …………………………………………………………………………………………………………………………………………………………………………………………………………………………………………………………………………………………………………………………………………………………………………………………………………………………………………………… …………………………………………………………………………………………………………………………………………………………………………………………………………………………………………………………………………………………………………………………………………………………………………………………………………………………………………………… …………………………………………………………………………………………………………………………………………………………………………………………………………………………………………………………………………………………………………………………………………………………………………………………………………………………………………………… …………………………………………………………………………………………………………………………………………………………………………………………………………………………………………………………………………………………………………………………………………………………………………………………………………………………………………………… NNAAMMEE && SSIIGGNNAATTUURREE OOFF IINNVVEESSTTIIGGAATTOORR……………………………………………………………………………………………………………….. NNAAMMEE OOFF TTHHEE SSUUPPEERRVVIISSOORR ……………………………………………………………………………………………………………………………………...... DDAATTEE………………………………………………………………………………………………………………………………………………………………………………………… CCHHEECCKKEEDD BBYY ……………………………………………………………… NNAAMMEE…………………………………………………………………………………………

166
SSIIGGNNAATTUURREE ………………………………………………………………………………………………………………………………………………………………………… DDAATTEE……………………………………………………………………………………………………………………………………………………………………………………....


