Abacus Storage Operations Limited and its controlled ... › asxpdf › 20180817 › pdf ›...
106
Appendix 4E Abacus Property Group (comprising Abacus Group Holdings Limited and its controlled entities, Abacus Trust and its controlled entities, Abacus Income Trust and its controlled entities, Abacus Group Projects Limited and its controlled entities, Abacus Storage Property Trust and its controlled entities and Abacus Storage Operations Limited and its controlled entities) ABN: 31 080 604 619 Annual Financial Report For the year ended 30 June 2018 Results for announcement to the market (corresponding period: year ended 30 June 2017) Total revenues and other income up 2% to $473.7m Net profit after income tax expense attributable to stapled security holders down 15% to $243.7m Funds from operations ("FFO") (1) up 9% to $169.8m (1) FFO has been determined with reference to the updated Property Council of Australia’s voluntary disclosure guidelines to help investors and analysts compare many different AREITs. FFO is calculated by adding back tenant incentive amortisation, depreciation on owner occupied property, plant & equipment (PP&E), change in fair value of investment properties derecognised, impairment of inventory and non-FFO tax benefit/expense to underlying profit.. 30 June 2018 30 June 2017 $'000 $'000 Consolidated statutory net profit after tax attributable to members of the Group 243,709 285,097 add back: consolidated profits relating to managed funds (these profits are excluded as 1,169 (27,165) the profits of the managed funds cannot and do not form part of the assessable and distributable income of Abacus) Net profit attributable to ABP securityholders 244,878 257,932 Certain significant items: Net change in fair value of investment properties held at balance date (60,724) (74,773) Net change in fair value of investments and financial instruments held at balance date 6,363 10,677 Net change in fair value of derivatives (730) (4,317) Net change in fair value of property, plant and equipment, inventory and investment properties included in equity accounted investments (4,635) (718) Net tax benefit on significant items (1,831) (1,999) Underlying profit attributable to ABP securityholders 183,321 186,802 Funds from operations ("FFO") 169,790 156,440 Basic earnings per security (cents) 42.18 49.91 Basic underlying earnings per security^ (cents) 31.73 32.71 Basic funds from operations per security^ (cents) 29.39 27.39 Distribution per security (cents - including proposed distribution) 18.00 17.50 Weighted average securities on issue (million) 577.8 571.2 ^Abacus For personal use only
Transcript of Abacus Storage Operations Limited and its controlled ... › asxpdf › 20180817 › pdf ›...

Appendix 4E
Abacus Property Group (comprising Abacus Group Holdings Limited and its controlled entities, Abacus Trust and its controlled entities, Abacus Income Trust and its controlled entities, Abacus Group Projects Limited and its controlled entities, Abacus Storage Property Trust and its controlled entities and Abacus Storage Operations Limited and its controlled entities)
ABN: 31 080 604 619
Annual Financial Report For the year ended 30 June 2018
Results for announcement to the market (corresponding period: year ended 30 June 2017)
Total revenues and other income up 2% to $473.7m
Net profit after income tax expense attributable to
stapled security holdersdown 15% to $243.7m
Funds from operations ("FFO") (1) up 9% to $169.8m
(1) FFO has been determined with reference to the updated Property Council of Australia’s voluntary disclosure guidelines to help investors
and analysts compare many different AREITs. FFO is calculated by adding back tenant incentive amortisation, depreciation on owner occupied property, plant & equipment (PP&E), change in fair value of investment properties derecognised, impairment of inventory and non-FFO tax benefit/expense to underlying profit..
30 June 2018 30 June 2017
$'000 $'000
Consolidated statutory net profit after tax attributable to members of the Group 243,709 285,097
add back: consolidated profits relating to managed funds (these profits are excluded as 1,169 (27,165)
the profits of the managed funds cannot and do not form part of the assessable
and distributable income of Abacus)
Net profit attributable to ABP securityholders 244,878 257,932
Certain significant items:
Net change in fair value of investment properties held at balance date (60,724) (74,773)
Net change in fair value of investments and financial instruments held at balance date 6,363 10,677
Net change in fair value of derivatives (730) (4,317)
Net change in fair value of property, plant and equipment, inventory and investment properties
included in equity accounted investments (4,635) (718)
Net tax benefit on significant items (1,831) (1,999)
Underlying profit attributable to ABP securityholders 183,321 186,802
Funds from operations ("FFO") 169,790 156,440
Basic earnings per security (cents) 42.18 49.91
Basic underlying earnings per security^ (cents) 31.73 32.71
Basic funds from operations per security^ (cents) 29.39 27.39
Distribution per security (cents - including proposed distribution) 18.00 17.50
Weighted average securities on issue (million) 577.8 571.2
^Abacus
For
per
sona
l use
onl
y

Abacus Property Group Appendix 4E
2
Distributions
This distribution was declared on 21 June 2018 and will be paid on 31 August 2018.
per stapled security
9.00 cents
29 June 2018
June 2018 half year
Record date for determining entitlement to the distributions
Refer to the attached announcement for a detailed discussion of the Abacus Property Group's results and the above figures for the
year ended 30 June 2018.
Total
Half December 2017 distribution $52.0m
per stapled security
paid 28 February 2018
Details of individual and total distribution payments
9.00
The distribution was paid in full by Abacus Trust which does not pay tax, hence there were no franking credits attached.
Net tangible assets per security (2)
30 June 2018
$2.93$3.18
30 June 2017
(2) Net tangible assets per security excludes the external non-controlling interest and is adjusted for the recognition of the June 2018 and 2017 distributions.
Details of associates and joint venture entities
30 June 2018 30 June 2017 30 June 2018 30 June 2017
% % $'000 $'000
Australian Aggregation Head Trust 25 25 12,821 8,565
Fordtrans Pty Ltd (Virginia Park) 50 50 8,659 (2,253)
Merivale JV Unit Trust 49 49 18,228 (883)
St Leonards JV Unit Trust 50 50 19,883 5,257
Other 25-50 25-50 14,158 43,587
73,749 54,273
Ownership Interest Share of net profit/(loss)
The equity accounted profits/losses includes a fair value gain of $4.6 million
Distribution Reinvestment Plan (DRP)
The Abacus Property Group DRP allows securityholders to reinvest their distributions into ABP securities. Information on the terms of the DRP is available from our website www.abacusproperty.com.au.
Securityholders wishing to participate in the DRP may lodge their election notice at any time. The record date for determining entitlements to each distribution is also the record date for participation in the DRP for that distribution.
For
per
sona
l use
onl
y

Abacus Property Group ABN 31 080 604 619
Financial Report
For the year ended 30 June 2018
For
per
sona
l use
onl
y

ABACUS PROPERTY GROUP
1
ANNUAL FINANCIAL REPORT 30 June 2018
Directory
Abacus Group Holdings Limited Directors of Responsible Entities and ABN: 31 080 604 619 Abacus Group Holdings Limited: John Thame, Chairman Abacus Group Projects Limited Steven Sewell, Managing Director ABN: 11 104 066 104 William Bartlett Jingmin Qian Abacus Storage Operations Limited Myra Salkinder ABN: 37 112 457 075 Peter Spira Abacus Funds Management Limited Company Secretary: ABN: 66 007 415 590 Robert Baulderstone Abacus Storage Funds Management Limited Auditor (Financial and Compliance Plan): ABN: 41 109 324 834 Ernst & Young 200 George Street Registered Office SYDNEY NSW 2000 Level 34, Australia Square 264-278 George Street Share Registry: SYDNEY NSW 2000 Boardroom Pty Ltd Tel: (02) 9253 8600 Level 12, 225 George St Fax: (02) 9253 8616 SYDNEY NSW 2000 Website: www.abacusproperty.com.au Tel: 1300 737 760 Fax: 1300 653 459 Custodian: Perpetual Trustee Company Limited Level 12 Angel Place 123 Pitt Street SYDNEY NSW 2000
CONTENTS
DIRECTORS’ REPORT 2
AUDITORS INDEPENDENCE DECLARATION 34
CONSOLIDATED INCOME STATEMENT 35
CONSOLIDATED STATEMENT OF OTHER COMPREHENSIVE INCOME 36
CONSOLIDATED STATEMENT OF FINANCIAL POSITION 37
CONSOLIDATED STATEMENT OF CASH FLOW 39
CONSOLIDATED STATEMENT OF CHANGES IN EQUITY 40
NOTES TO THE FINANCIAL STATEMENTS 42
DIRECTORS’ DECLARATION 95
INDEPENDENT AUDIT REPORT 96
It is recommended that this Annual Financial Report should be read in conjunction with the Annual Financial Report of Abacus Trust, Abacus Group Projects Limited, Abacus Income Trust, Abacus Storage Property Trust and Abacus Storage Operations Limited as at 30 June 2018. It is also recommended that the report be considered together with any public announcements made by the Abacus Property Group in accordance with its continuous disclosure obligations arising under the Corporations Act 2001.
For
per
sona
l use
onl
y

ABACUS PROPERTY GROUP
2
DIRECTORS’ REPORT 30 June 2018
The Directors of Abacus Group Holdings Limited (“AGHL”), Abacus Funds Management Limited (“AFML”) – the Responsible entity of Abacus Trust (“AT”) and Abacus Income Trust (“AIT”), Abacus Group Projects Limited (“AGPL”), Abacus Storage Funds Management Limited (“ASFML”) – the Responsible Entity of Abacus Storage Property Trust (“ASPT”) and Abacus Storage Operations Limited (“ASOL”) present their report for the year ended 30 June 2018.
IN MEMORIAM
In April 2018, Dr Frank Wolf, Abacus Property Group’s co-founder and Managing Director for the last 12 years died following a short battle with cancer. Abacus Property Group, led by Frank, became well known as a strong Value Add/Core Plus investor in real estate. Frank’s expertise over 30 years of experience was able to see the value in assets that most could not or were unable to extract. The Group was known for delivering strategies to unlock and crystallise capital growth over the short, medium and long periods of time and was often an early mover into sectors or geographies of the real estate market, uncovering value in asset classes as they became more institutionalised including retirement, aged care and particularly self-storage.
Early in his career, Frank graduated from The University of British Columbia, with a doctorate in accounting whilst considering a life in academia. Frank ultimately entered the corporate world becoming a partner of Touche Ross & Co and later senior management roles throughout the insurance and financial advisory industries. During this time Frank had been instrumental in over $5 billion of property related and corporate acquisitions and divestments within the retail, commercial, industrial and hospitality sectors in Australia, New Zealand and the United States.
Outside of his professional life, Frank was meaningfully involved in multiple philanthropic activities, particularly as a major donor and strong advocate of the Jewish community. Frank was heavily involved in multiple charities, most notably with the Jewish Community Appeal where, since 2005, he chaired a number of important committees and was an integral member of the charities executive team.
Frank brought to Abacus his incredible work-ethic, energy and a willingness to give anyone with an idea an opportunity to succeed. He had a wicked sense of humour. Frank was extremely humble yet very generous. He was 64 years of age when he died.
MANAGING DIRECTOR SUCCESSION
As announced by the Group in January 2018, Mr Steven Sewell was appointed Managing Director elect. Mr Sewell was appointed to the role of Managing Director and to the Board upon Dr Wolf’s passing in April 2018.
PRINCIPAL ACTIVITIES
The principal activities of Abacus Property Group are investment in self-storage, office, retail and industrial properties, participation in property and residential developments and property funds management. The retail funds management activities continued to be substantially reduced during the year as the Abacus Hospitality Fund and the Abacus Wodonga Land Fund are managed through to wind up in the short to medium term.
OPERATING AND FINANCIAL REVIEW
The operating and financial review is intended to convey the Directors’ perspective of Abacus Property Group and its operational and financial performance. It sets out information to assist securityholders to understand and interpret the financial statements prepared in accordance with Australian International Financial Reporting Standards (“AIFRS”) included in this report. It should be read in conjunction with the financial statements and accompanying notes.
Listed Structure / Entities
The listed Abacus Property Group is a diversified property group that operates predominantly in Australia. It comprises AGHL, AT, AGPL, AIT, ASPT and ASOL (collectively “Abacus”) and its securities trade on the Australian Securities Exchange (“ASX”) as ABP. Abacus was listed on the ASX in November 2002 and its market capitalisation was over $2.18 billion at 30 June 2018.
Shares in AGHL, AGPL and ASOL and units in AT, AIT and ASPT have been stapled together so that none can be dealt without the others and are traded together on the ASX as Abacus securities. An Abacus security consists of one share in AGHL, one unit in AT, one share in AGPL, one unit in AIT, one share in ASOL and one
For
per
sona
l use
onl
y

ABACUS PROPERTY GROUP
3
DIRECTORS’ REPORT 30 June 2018
OPERATING AND FINANCIAL REVIEW (continued)
unit in ASPT. A transfer, issue or reorganisation of a share or unit in any of the component parts requires, while they continue to be stapled, a corresponding transfer, issue or reorganisation of a share or unit in each of the other component parts.
AGHL, AGPL and ASOL are companies that are incorporated and domiciled in Australia. AT, AIT and ASPT are Australian registered managed investment schemes. AFML is the Responsible Entity of AT and AIT and ASFML is the Responsible Entity of ASPT. Both AFML and ASFML are incorporated and domiciled in Australia and are wholly-owned subsidiaries of AGHL.
Abacus Property Group Consolidation
The application of AASB10 by Abacus results in the consolidation of Abacus Hospitality Fund and Abacus Wodonga Land Fund (the “Group”). This is due to the combination of Abacus’ role as responsible entity, variable returns arising from its collective equity and loan investments in these funds.
AGHL has been identified as the parent entity of the Group. The financial reports of the Group for the year ended 30 June 2018 comprise the consolidated financial reports of AGHL and its controlled entities, AT and its controlled entities, AGPL and its controlled entities, AIT and its controlled entities, ASOL and its controlled entities, ASPT and its controlled entities, Abacus Hospitality Fund and its controlled entities and Abacus Wodonga Land Fund.
The principal activities of Abacus that contributed to its earnings during the year ended 30 June 2018 included:
• investment in self-storage, office, retail and industrial properties to derive rental and management and other fee income; and
• participation in property and residential developments to derive interest income and development profits.
These activities are reported in the segment information note.
Abacus is included in the S&P/ASX 200 A-REIT index (ASX:XPJ), a sub-index of the S&P/ASX 200 index that contains the listed vehicles classified as A-REITs.
OUR STRATEGY
Abacus’ overarching strategy has been to invest our capital in assets with value add opportunities that are forecast to drive long term total returns and maximise securityholder value. Our investment objective is to provide our investors with reliable and increasing returns. We look for property assets that can provide strong and stable cash-backed distributions from a diversified portfolio that provides genuine potential for enhanced capital and income growth as a result of our diligent active management. Abacus does this through the acquisition, development and active management of property assets. In particular:
• We take advantage of our specialised knowledge, track record and market positioning.
• We invest in core and core plus property investments that are expected to yield an appropriate risk adjusted return over time.
• We drive value through active management of the asset portfolio.
We have a successful track record of acquiring property based assets and actively managing those assets to enhance income and capital growth. Our track record has facilitated joint ventures with a number of sophisticated local and global third party capital providers. Our assets are mostly in major city centres or suburban areas, typically on the eastern seaboard of Australia.
Our experience has shown that strict adherence to our fundamental investment criteria enables us to buy assets well and provide opportunities for outperformance while minimising downside risk to equity. F
or p
erso
nal u
se o
nly

ABACUS PROPERTY GROUP
4
DIRECTORS’ REPORT 30 June 2018
OPERATING AND FINANCIAL REVIEW (continued)
GROUP RESULTS SUMMARY
The Board monitors a range of financial information and operating performance indicators to measure performance over time. We use several measures to monitor the financial success of our overall strategy. The key measure is underlying profit.
2018 2017
Revenue ($ million) 307.9 251.6
Total income ($ million) 473.7 463.4
Statutory net profit excluding non-controlling interests ($ million) 243.7 285.1
Underlying profit^ ($ million) 183.3 186.8
Underlying profit per security^ (c) 31.73 32.71
Cashflow from operating activities ($ million) 194.3 116.2
Cashflow from operating activities per security (c) 33.53 20.35
Distributions per security^ (c) 18.00 17.50
Interest cover ratio 8.7x 7.4x
Weighted securities on issue^ (million) 577.8 571.2
^ Abacus
The Group earned a statutory net profit excluding non-controlling interests of $243.7 million for the year ended 30 June 2018 (2017: $285.1 million). This profit has been calculated in accordance with Australian Accounting Standards. It includes certain significant items that need adjustment to enable securityholders to obtain an understanding of Abacus’ underlying profit of $183.3 million, a 2% decrease on the 2017 underlying profit of $186.8 million.
For
per
sona
l use
onl
y

ABACUS PROPERTY GROUP
5
DIRECTORS’ REPORT 30 June 2018
OPERATING AND FINANCIAL REVIEW (continued)
GROUP RESULTS SUMMARY (continued)
The underlying profit reflects the statutory profit as adjusted to present a figure which reflects the Directors’ assessment of the result for the ongoing business activities of Abacus, in accordance with the AICD / Finsia principles for reporting underlying profit. The consolidated profits / (losses) which belong to the securityholders of Abacus Hospitality Fund and Abacus Wodonga Land Fund are excluded as these profits cannot and do not form part of the distributable income of Abacus. The calculation of underlying profit excludes items such as unrealised fair value gains / losses on investment properties, unrealised provision gains / losses, adjustments arising from the effect of revaluing assets / liabilities carried at fair value (such as derivatives, financial instruments and investments), the consolidated profits / (losses) of managed funds which do not form part of the assessable or distributable profits of Abacus and other adjustments in the determination of underlying profit including transactions that occur infrequently and those that are outside the scope of Abacus’ core ongoing business activities. Underlying profit is the basis on which distributions are determined.
The reconciliation between the Group’s statutory profit excluding non-controlling interests and Abacus’ underlying profit is below. This reconciliation and the underlying profit have not been reviewed or audited by the Group’s auditor.
2018 2017
$'000 $'000
Consolidated statutory net profit after tax attributable to members of the Group 243,709 285,097
add back: Consolidated profits relating to the managed funds (these profits are excluded as the
profits of the managed funds cannot and do not form part of the assessable and distributable income
of Abacus) 1,169 (27,165)
Net profit attributable to Abacus securityholders 244,878 257,932
Certain significant items:
Net change in fair value of investment properties held at balance date (60,724) (74,773)
Net change in fair value of investments and financial instruments held at balance date 6,363 10,677
Net change in fair value of derivatives (730) (4,317)
Net change in fair value of property, plant and equipment and investment properties included in equity
accounted investments
(4,635) (718)
Net tax benefit on significant items (1,831) (1,999)
Underlying profit attributable to Abacus securityholders 183,321 186,802
2018 2017
Basic earnings per security (cents) 42.18 49.91
Basic underlying earnings per security^ (cents) 31.73 32.71
Distribution per security^ (cents - including proposed distribution) 18.00 17.50
Weighted average securities on issue (million) 577.8 571.2
^Abacus
During the 12 months to 30 June 2018 the real estate markets across Australia continued to see historically low interest rates as the RBA maintained the cash rate at 1.5% while the forward guidance is for an ultimate increase in the cash rate. This outlook continues to support Australia as an appealing real estate market to global capital seeking high quality assets with attractive yields in a global low yield environment. These conditions saw further cap rate compression across the majority of sectors of the market from traditional asset classes lead by the highest quality of office, retail and industrial through to alternative asset classes of self-storage, healthcare facilities, manufactured homes and hotels/pubs. A strong leasing market, particularly in Sydney and Melbourne office markets and general industrial markets during the year also contributed to the attractiveness of real estate assets to domestic and global investors. Increased merger and acquisition activity in the listed real estate markets has also intensified valuations and interest in direct real estate markets. The strength of the market continues despite a backdrop of economic uncertainty and disparate economic activity throughout Australian States.
For
per
sona
l use
onl
y

ABACUS PROPERTY GROUP
6
DIRECTORS’ REPORT 30 June 2018
OPERATING AND FINANCIAL REVIEW (continued)
GROUP RESULTS SUMMARY (continued)
The office markets across the eastern seaboard, in particular Sydney and Melbourne have remained very strong delivering exceptional growth in net effective rents and strong valuation growth. The strong markets in Sydney are anticipated to continue as supply continues to remain limited for the next few years. The Melbourne office market is expected to see an elevated level of supply over this same time period however absorption is also expected to remain strong keeping vacancy rates low and provide upward pressure of rents. The Abacus office portfolio is approximately 64% located within these markets.
The self-storage markets across Australia and New Zealand continue to experience the impacts from several attempts to consolidate the sector. Following the recent institutionalisation of the market as investors increased their awareness of self-storage as a viable asset class resulted in several participants investing heavily into the sector looking to increase their market share of the self-storage sector. This increased transactional activity and heightened interest has continued to deliver strong capitalisation rate compression across the sector. It is anticipated this strong market will continue as this alternative asset class benefits from higher passing yields than high quality assets in more traditional sectors.
Australian retail sales grew modestly during the year with the eastern states leading the way as employment growth continues to be stimulated by government and infrastructure investment across these states. A bifurcation in the retail environment is occurring with high quality assets continuing to be well bid for by the investment market keeping valuations strong in these classes. Super regional assets providing a full experiential shopping offer that dominate their region remain sought after by domestic and international listed and unlisted institutions. Neighbourhood and select sub-regional assets that offer a strong food and service-based tenant offering with limited exposure to tenants exposed to discretionary spending remain in favour with high net worth and listed investors.
The investment market for institutional grade industrial product has been strong over the past few years, with landmark assets and portfolios transacting at yields firmer than at previous market peaks. Despite a modest growth outlook and increasing supply side issues, assets with strong covenants and long weighted lease expiries have been well sought after. The medium-term outlook is for a stabilisation of yields as this investment activity tapers off, while rents are likely to remain stable.
During FY18 Abacus continued to focus our investment capital on acquisitions across the self-storage and office sectors in line with our capital allocation strategy as we believed they represented the best risk adjusted returns over the investment period. This activity was and will continue to be funded via reduction in retail investment and the realisation of our residential developments over the coming years. This strategy is focussed on growing the contribution to recurring earnings to fund the Group’s targeted distribution growth of 2-3% pa.
Abacus had an active year in FY18 adding assets to the office portfolio, largely on the back of our city fringe investment thematic that focuses on assets in the fringes of the CBD. As a result, we acquired a number of assets including 187 Todd Road in Port Melbourne for $43.5m, 452 Johnston Street in Abbotsford for $93.5m, a 50% interest in 464 St Kilda Road in St Kilda for $47.7m all within the Melbourne city fringe. We also acquired two CBD fringe assets in Sydney - 11 Bowden Street in Alexandria for $48.9m and 63 Ann Street in Surry Hills for $27.5m. All these assets illustrate strong long-term growth prospects, providing access to stable and growing cash flows from high quality tenants and improving rental rate outlook as inner suburban areas continue to undergo gentrification and elevated levels of infrastructure spend.
Abacus continued to utilise our third party capital platform with the introduction of a new investment partner, Wing Tai on the 464 St Kilda Road acquisition (50/50 respective ownership percentages as tenants in common). Abacus also acquired two self-storage and industrial assets for $10 million which we intend to convert into self-storage facilities.
The residential markets in Australia also encountered strong bifurcation of markets with Melbourne and Sydney markets weathering some of the impacts that have slowed other residential markets around Australia. Pockets of oversupply in Brisbane combined with a reduction in the availability of financing for investors, particularly offshore investors, has slowed settlement and sales rates, increased settlement timeframes and in some cases increased the number of defaults. During the 12 months to 30 June 2018, even in spite of Abacus’ experiences matching those of the general market, the Group has managed to deliver several good results across its residential developments business. The decrease in the Group’s statutory net profit excluding non-controlling interests was principally due to lower net change in fair value of investment properties and lower fair value derecognised from divestments in the commercial property investment portfolio.
For
per
sona
l use
onl
y

ABACUS PROPERTY GROUP
7
DIRECTORS’ REPORT 30 June 2018
OPERATING AND FINANCIAL REVIEW (continued)
GROUP RESULTS SUMMARY (continued)
The reconciliation between the Group’s statutory profit excluding non-controlling interests, Abacus’ underlying profit and funds from operation (“FFO”) is below. This reconciliation and the FFO has not been reviewed or audited by the Group’s auditor.
2018 2017
$'000 $'000
Abacus funds from operations ("FFO") 169,790 156,440
Adjust for:
Net change in fair value of investment properties derecognised 15,265 36,775
Reversal of impairment of inventory 2,660 (3,000)
Depreciation on owner occupied property, plant and equipment (1,090) (667)
Amortisation of rent abatement incentives (1,981) (1,335)
Amortisation of other tenant incentives (1,646) (1,611)
Tax benefit on Non-FFO Items 323 200
Underlying profit attributable to Abacus securityholders 183,321 186,802
Net change in fair value of investment properties held at balance date 60,724 74,773
Net change in fair value of investments and financial instruments held at balance date (6,363) (10,677)
Net change in fair value of derivatives 730 4,317
Net change in fair value of property, plant and equipment and investment properties included in equity
accounted investments
4,635 718
Net tax expense on significant items 1,831 1,999
Consolidated profits relating to the managed funds (these profits are excluded as the profits of the
managed funds cannot and do not form part of the assessable and distributable income of Abacus) (1,169) 27,165
Consolidated statutory net profit after tax attributable to members of the Group 243,709 285,097
FFO has been determined with reference to the updated Property Council of Australia’s voluntary disclosure guidelines to help investors and analysts compare many different AREITs. FFO is calculated by adding back tenant incentive amortisation, depreciation on owner occupied property, plant & equipment (PP&E), change in fair value of investment properties derecognised, impairment of inventory and non-FFO tax benefit/expense to underlying profit.
The impact of both year-end fair value adjustments and the Group’s performance on its financial position were as follows:
2018 2017
Total assets ($ million) 2,795.6 2,436.7
Gearing^ (%) 23.3 20.5
Net assets* ($ million) 1,870.1 1,766.1
Net tangible assets* ($ million) 1,841.7 1,737.1
NTA per security^# ($) 3.18 2.93
^ Abacus - gearing calculated as debt minus cash divided by total assets minus cash
* Excluding external non-controlling interests of $46.6 million (2017: $48.5 million)
# Following recognition of June 2018 and 2017 distributions
The increase in net assets of the Group by 6% reflects the increase in fair value of investments and undistributed share of equity accounted income during the year.
For
per
sona
l use
onl
y

ABACUS PROPERTY GROUP
8
DIRECTORS’ REPORT 30 June 2018
OPERATING AND FINANCIAL REVIEW (continued)
GROUP RESULTS SUMMARY (continued)
Capital management
The Abacus balance sheet remains strong with gearing levels conservative at 23.3%, well within our target gearing limit of 35%. At 30 June 2018, Abacus had $135 million of available liquidity that provides capacity for use for up to $211 million of accretive acquisitions. Post year end several asset settlements occurred further adding to the Group’s liquidity balances providing significant opportunity to prudently invest and up weight our exposure to office and self-storage markets throughout select Australian markets. We view low gearing and high liquidity levels positively as we extend through, what we consider to be the top of the property markets, with the ability to take advantage should opportunities arise. We anticipate Abacus’ weighted average interest rate will remain relatively stable as current capacity is utilised and anticipate it should be no greater than 5.0% over the next year.
CORE SEGMENT RESULTS SUMMARY
Business activities that specifically contributed to the Abacus’ operating performance and financial condition for the financial year were:
Property Investment
Commercial Portfolio
Abacus’ commercial portfolio delivered a segment result of $119.8 million for the year ended 30 June 2018 which was 35.2% lower than the previous period (2017: $184.9 million) largely due to a reduction in the value of fair value increases from the investment property portfolio. The commercial portfolio consists of 35 assets (2017: 34 assets) and had a total value of $1.5 billion at year end (2017: $1.2 billion).
Pursuant to the 2018 portfolio valuation process, 13 out of 31 of the commercial properties (excluding equity accounted properties) or 53% by value were independently valued during the year to 30 June 2018. The remaining properties were subject to internal review and, where appropriate, their values were adjusted. The valuation process resulted in a net full year revaluation gain of $18.4 million (2017: $47.4 million gain) or 1.2% of commercial portfolio.
Commercial portfolio (office, retail, industrial and other)
1. WACR: Weighted Average Capitalisation Rate 2. Like for like rental growth.
For
per
sona
l use
onl
y

ABACUS PROPERTY GROUP
9
DIRECTORS’ REPORT 30 June 2018
OPERATING AND FINANCIAL REVIEW (continued)
CORE SEGMENT RESULTS SUMMARY (continued)
During the year Abacus was able to secure several high profile quality commercial properties that met our investment criteria, including:
• 187 Todd Road, Port Melbourne VIC for $43.5 million (Abacus interest 100%), settled November 2017 • 452 Johnston Street, Abbotsford VIC for $93.5 million (Abacus interest 100%), settled March 2018 • 464 St Kilda Road, Melbourne VIC for $47.7 million (Abacus interest 50%), settled May 2018 • 11 Bowden Street, Alexandria NSW for $48.9 million (Abacus interest 100%), settled March 2018; and • 63 Ann Street, Surry Hills NSW for $27.5 million (Abacus interest 100%), settled April 2018
Abacus and its partners divested several properties at various stages during the year which delivered some strong returns to the group and included:
• 50% interest in 201 Pacific Highway, St Leonards NSW for $85.8 million, settled May 2018; and • 169 Australis Drive, Derrimut VIC for $34.0 million, settled June 2018
As a result of changes in the portfolio from acquisitions and divestments and a mixed leasing environment across regions the portfolio occupancy increased from 90.5% at 30 June 2017 to 91.3% at 30 June 2018. Pleasingly, like for like rental growth remained strong across our existing and stabilised portfolio to deliver growth of 3.6%. This was largely due to the performance of the Group’s property management team, leasing of developed assets and in-built annual rental increases.
We believe Abacus’ portfolio is suited to the current conditions. The majority of the office portfolio has limited exposure to full floor or multi-floor tenants and is configured more for multi-tenanted floors. We have found the potential cost (financial and time) of relocating to another property in the same location often outweighs the benefit of a cheaper rent. Our tenants are also strongly connected to the property’s location, which is traditionally the reason they initially leased the property and results in a positive predisposition to remain. Due to the multi-tenanted floor structure, we also have the ability to work proactively with our tenants to contract or expand and adjust their space requirements. Alongside the market, Abacus has also been a beneficiary of the stronger leasing environment with the strong re-leasing spreads across new and renewing leases, particularly in the Sydney CBD. As a result of current market conditions and a shift in future expectations in the office sector, Abacus has targeted assets that offer more stabilised income streams with longer dated value enhancing strategies. This capital allocation strategy supports our drive to improve recurring earnings to support our distribution policy to securityholders.
Abacus’ retail portfolio is currently development focused as all assets are at some stage of redevelopment to support our retail thematic of “super convenience retail”. The thematic supports assets that incorporate up to three national brand supermarkets with a heavy focus on food, services and minimal exposure to discretionary retail tenancies that enable centres to control their catchment and limit the impact from shifting trends in shoppers activities highlighted by an increase in online shopping for discretionary retail. Assets that are considered non-core to this strategic thesis have and will be sold. Abacus has formed joint venture / capital partnership relationships with likeminded institutions that share our vision of super convenience retail assets with existing portfolio assets or new opportunities within the sector.
Abacus remains focused on maintaining revenue and cashflows to support securityholder distributions but nevertheless being conscious of the market’s leasing requirements and competitive offerings.
Contribution from Third Party Capital
Abacus’ third party capital joint ventures remain an integral strategic investment platform for the Group. As previously mentioned, we have expanded the platform with a new joint venture with Wing Tai, out of Hong Kong to acquire 464 St Kilda Road in Melbourne for $95.4 million (100% asset value). Abacus and its joint venture partner Heitman completed its investment fund during the year. Abacus currently has $1.8 billion of assets under management including Abacus’ $693 million ownership share. Abacus typically invests 25% to 50% of the required equity with our capital partners investing the balance. Management of the property typically remains with Abacus and as a result we are able to leverage our capital to gain greater exposure to a higher number of high quality assets. This leads to greater earnings from fees and rental income. We will focus on driving our third party strategy to expand our capital base.
For
per
sona
l use
onl
y

ABACUS PROPERTY GROUP
10
DIRECTORS’ REPORT 30 June 2018
OPERATING AND FINANCIAL REVIEW (continued)
CORE SEGMENT RESULTS SUMMARY (continued)
Self-storage
Abacus’ self-storage portfolio delivered a segment result of $97.7 million for the year ended 30 June 2018. This represents a 38% increase on the FY17’s result of $70.7 million and can be attributed to strong increases in self-storage EBITDA, gains on the sale of a non-core portfolio of regional assets and higher fair value increases in the self-storage portfolio. Portfolio assets totalled $666 million across a total portfolio of 62 assets, an overall net reduction of three facilities during the period.
Pursuant to the 2018 valuation process 39 self-storage facilities out of 62 or 66% by value were independently valued during the year to 30 June 2018. The remaining facilities were subject to internal review and, where appropriate, their values were adjusted. The valuation process resulted in a net full year revaluation gain of $42.4 million (2017: $27.3 million gain) or 6.8% of investment properties.
The self-storage portfolio is well diversified in Australia and New Zealand.
1. Stabilised portfolio
2. WACR: Weighted Average Capitalisation Rate
3. Revenue per available square metre
4. Average over last 12 months (by area)
The Group has continued with its stated strategy of allocating investment capital to growing exposure to the self-storage sector. Abacus remains committed to growing the asset base while ensuring the portfolio is operating as efficiently and profitably as possible. With this in mind, an evaluation of the portfolio occurred during the year and as a result it highlighted a portfolio of five assets as non-core due to regional concerns and limitations to future occupancy and rental growth. This portfolio was divested in May 2018 for $26.5 million. The Group also acquired two development sites during the year in Robina and Stafford in QLD for development into self-storage facilities that should begin to deliver returns to the portfolio in the next few years. We remain committed to growing our presence in metropolitan areas on Australia’s eastern seaboard that will deliver higher average rental rates than the current portfolio average to drive portfolio returns.
The storage portfolio’s stabilised assets are the key contributor to underlying growth across the portfolio. They continue to deliver improved operating performances across Australian and New Zealand markets. Despite the portfolios reduction to 62 assets, the stabilised portfolio grew occupancy to 89.4% from 89.2% and average rental rate increased to $276/m
2 from $262/m
2. The increased rental and occupancy improved portfolio revenue per
available metre (RevPAM) to $247/m2 from $234/m
2 in 2017, a 5.6% increase assuming a stabilised New Zealand
exchange rate. RevPAM measures the profitability and efficiency of the portfolio.
The portfolio’s development pipeline of non-self-storage or non-stabilised assets currently numbers 9 assets valued at $51 million. These assets are at various stages of development or occupancy/rate stabilisation and are anticipated to be delivered to the stabilised portfolio over the next few years as they reach established occupancy levels. We anticipate these assets to enhance the average rental rate and RevPAM across the stabilised portfolio at this time.
For
per
sona
l use
onl
y

ABACUS PROPERTY GROUP
11
DIRECTORS’ REPORT 30 June 2018
OPERATING AND FINANCIAL REVIEW (continued)
CORE SEGMENT RESULTS SUMMARY (continued)
Developments - residential
The residential developments business delivered an increased segment result of $85.6 million (2017: $55.0 million). The business invests in projects and provides finance solutions that focus on select residential and commercial development opportunities in core locations directly on balance sheet and with experienced local joint venture partners. Abacus has total assets of $449 million invested across a number of residential developments in capital city markets across the eastern seaboard of Australia. Abacus controls approximately 7,700 apartment units or land lots which equates to approximately $58,000 cost base per unit/land lot. This low average price provides evidence that the developments business has prospects for strong returns.
Abacus completed four residential joint venture development projects during the last 12 months. As at 30 June 2018:
• The Eminence, Melbourne VIC delivered 193 apartments in the inner city suburb of Carlton. The project is a 50/25/25 joint venture with the Crema and Lechte Groups. All apartments but one have settled.
• Ashfield Central, Sydney NSW delivered 101 apartments in the inner-city suburb of Ashfield. The project is 100% owned by Abacus. Settlements began in June 2018 with 81 apartments settled, and we remain confident of settling the remainder in early FY19.
• Ivy and Eve, Brisbane QLD delivered 476 apartments across two buildings in the inner-city suburb of South Brisbane. The project is a joint venture with City Developments Limited, a Singaporean developer and Kilcor Properties. Settlements began in early 2018 with 365 apartments settled and while we are experiencing a number of defaults and an elongation to settlement time frames we are confident of settling the majority of apartments in FY19 with the delivery of anticipated project returns.
• One A, Erskineville Sydney NSW delivered 175 apartments in the inner-city suburb of Sydney. The project is a joint venture with the Linear Group. Settlements began in June 2018 with 146 apartments settled, and we remain confident of settling the remainder in early FY19.
Further, Abacus also has a number of ventures that own land sites, across the Metropolitan Sydney area, undergoing residential rezoning. The timeframe to work through the rezoning of non-residential zoned land is uncertain and complex. This is the reason it is possible to derive higher risk adjusted returns through projects of this type. Timeframes can be disrupted through unpredictable changes in local council and state governments and can affect Abacus’ ability to correctly forecast when projects will be realised.
In the period, Abacus has sought to sell several parcels of this land, with good demand from developers of residential and especially for industrial zoned properties.
NON CORE SEGMENT RESULTS SUMMARY
As a result of AASB10, the managed funds are consolidated into the Group financial statements and the Group’s statutory profit includes the financial performance of these funds. These funds are treated as non-core segments as the assets of the funds are not directly owned by Abacus securityholders and do not contribute directly to Abacus’ underlying profit and distributable income.
An overview of the financial performance of each of the funds for the year ended 30 June 2018 is as follows:
Abacus Hospitality Fund (AHF)
The remaining hotel in the fund, Twin Waters on the Sunshine Coast QLD, reported total income of $30.2m in the year to 30 June 2018 with an average occupancy of 69%, compared to total income of $27.3m and occupancy of 64% in the prior year. The hotel has traded strongly for both room revenue and food and beverage revenue, driven by solid conference and leisure traveller demand.
Abacus Wodonga Land Fund (AWLF)
AWLF owns the residential estate known as White Box Rise located in Wodonga, Victoria. During the year 87 residential lots were settled for combined proceeds of $12.8 million. This takes the total number of lots settled to 920 since the start of the project. There are approximately 153 lots left to sell in the estate, and these are expected to be sold over the next 1-2 years.
For
per
sona
l use
onl
y
ABACUS PROPERTY GROUP
12
DIRECTORS’ REPORT 30 June 2018
OPERATING AND FINANCIAL REVIEW (continued)
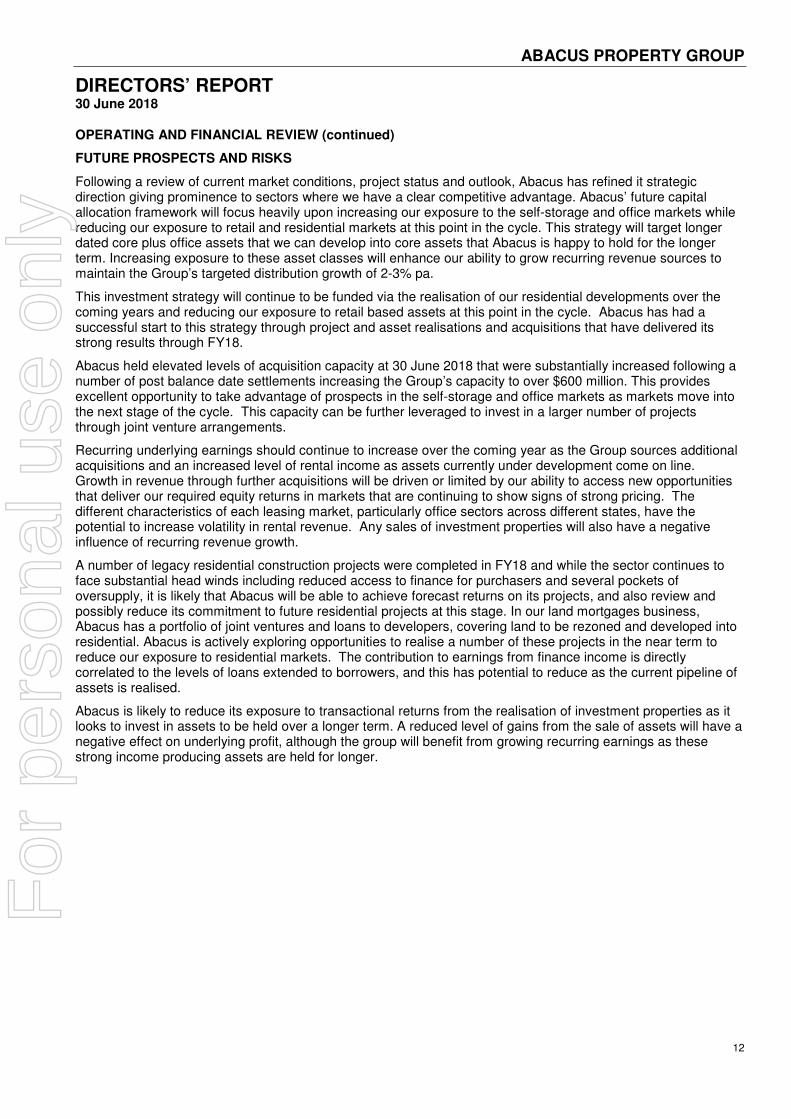
FUTURE PROSPECTS AND RISKS
Following a review of current market conditions, project status and outlook, Abacus has refined it strategic direction giving prominence to sectors where we have a clear competitive advantage. Abacus’ future capital allocation framework will focus heavily upon increasing our exposure to the self-storage and office markets while reducing our exposure to retail and residential markets at this point in the cycle. This strategy will target longer dated core plus office assets that we can develop into core assets that Abacus is happy to hold for the longer term. Increasing exposure to these asset classes will enhance our ability to grow recurring revenue sources to maintain the Group’s targeted distribution growth of 2-3% pa.
This investment strategy will continue to be funded via the realisation of our residential developments over the coming years and reducing our exposure to retail based assets at this point in the cycle. Abacus has had a successful start to this strategy through project and asset realisations and acquisitions that have delivered its strong results through FY18.
Abacus held elevated levels of acquisition capacity at 30 June 2018 that were substantially increased following a number of post balance date settlements increasing the Group’s capacity to over $600 million. This provides excellent opportunity to take advantage of prospects in the self-storage and office markets as markets move into the next stage of the cycle. This capacity can be further leveraged to invest in a larger number of projects through joint venture arrangements.
Recurring underlying earnings should continue to increase over the coming year as the Group sources additional acquisitions and an increased level of rental income as assets currently under development come on line. Growth in revenue through further acquisitions will be driven or limited by our ability to access new opportunities that deliver our required equity returns in markets that are continuing to show signs of strong pricing. The different characteristics of each leasing market, particularly office sectors across different states, have the potential to increase volatility in rental revenue. Any sales of investment properties will also have a negative influence of recurring revenue growth.
A number of legacy residential construction projects were completed in FY18 and while the sector continues to face substantial head winds including reduced access to finance for purchasers and several pockets of oversupply, it is likely that Abacus will be able to achieve forecast returns on its projects, and also review and possibly reduce its commitment to future residential projects at this stage. In our land mortgages business, Abacus has a portfolio of joint ventures and loans to developers, covering land to be rezoned and developed into residential. Abacus is actively exploring opportunities to realise a number of these projects in the near term to reduce our exposure to residential markets. The contribution to earnings from finance income is directly correlated to the levels of loans extended to borrowers, and this has potential to reduce as the current pipeline of assets is realised.
Abacus is likely to reduce its exposure to transactional returns from the realisation of investment properties as it looks to invest in assets to be held over a longer term. A reduced level of gains from the sale of assets will have a negative effect on underlying profit, although the group will benefit from growing recurring earnings as these strong income producing assets are held for longer.
For
per
sona
l use
onl
y

ABACUS PROPERTY GROUP
13
DIRECTORS’ REPORT 30 June 2018
OPERATING AND FINANCIAL REVIEW (continued)
FUTURE PROSPECTS AND RISKS (continued)
There are a number of risk factors associated with property-related businesses that may have an impact on the financial prospects of Abacus. Some of the key risks are outlined below. This outline is not exhaustive, and performance may be affected adversely by any of these risk and other factors.
• Returns from investment – Returns from investment in real property and other related property exposures depend largely on the amount of rental income that can be generated from the property, the expenses incurred in operations, including the management and maintenance of the property, as well as changes in the market value of the property. Factors which may adversely impact these returns include:
• the overall conditions in the national and local economy, such as changes in gross domestic product, employment trends, inflation and interest rates;
• local real estate conditions, such as the level of demand for and supply of retail, commercial and industrial space;
• the perception of prospective tenants of the attractiveness, practicality and convenience of the rental space;
• changes in tenancy laws and planning approval requirements;
• external factors including major world events such as war, terrorist attacks or force majeure events;
• unforeseen capital expenditures;
• supply of new property and other investment assets;
• cost of property outgoings and recoverability from tenants; and
• investor demand/liquidity in investment markets.
• Development – Abacus is involved in the development of real estate. Generally, property development projects have a number of risks including:
• The risk that planning consents and regulatory approvals are not obtained or, if obtained, are received later than expected, or are adverse to Abacus’ interests, or are not properly adhered to;
• The escalation of development costs beyond those originally expected;
• Project delays;
• Anticipated sales prices or timing on sales not being achieved;
• Defaults on pre-sales contracts;
• Non-performance/breach of contract by a contractor, sub-contractor or joint venture partner; and
• Competing development projects adversely affecting the overall return achieved by Abacus developments.
A sustained downturn in property markets caused by any deterioration in the economic climate could result in reduced development profits through reduced selling prices or delays in achieving sales.
Increases in supply or falls in demand in any of the sectors of the property market in which Abacus operates or invests could influence the acquisition of sites, the timing and value of sales and carrying value of projects. The residential property market in particular may be adversely affected by declining consumer sentiment and increasing interest rates. In the short term this may affect, for example, project enquiry levels or rates of sale.
In the medium-term factors such as the oversupply or undersupply of various markets may materially impact Abacus’ development operations.
A number of factors affect the earnings, cashflows and valuations of Abacus’ commercial property development, including construction costs, scheduled completion dates, estimated rental income and occupancy levels and the ability of tenants to meet rental and other contractual obligations.
For
per
sona
l use
onl
y

ABACUS PROPERTY GROUP
14
DIRECTORS’ REPORT 30 June 2018
OPERATING AND FINANCIAL REVIEW (continued)
FUTURE PROSPECTS AND RISKS (continued)
• Leasing terms and tenant defaults – The future financial performance of Abacus will depend, in part, on its ability to continue to lease existing retail, office, industrial and self-storage space that is vacant or becomes vacant on economically favourable terms. In addition, its ability to lease new asset space in line with expected terms will impact on the financial performance of Abacus. The ability of major tenants to meet their rental and other contractual commitments to Abacus (such as in situations of insolvency or closure of their businesses) may have an adverse impact on the income from properties, which may result in an adverse impact on the financial performance of Abacus.
This risk is managed through active asset management including ongoing liaison with tenants, regular maintenance and refurbishment of properties to attract tenants, timely marketing programs for vacant space and due diligence on the financial strength of prospective tenants prior to entering into leases.
• Funding – The property investment and development sector is highly capital intensive. The ability of Abacus to raise funds (equity and debt) on acceptable terms will depend on a number of factors including capital market conditions, general economic and political conditions, Abacus’ performance, and credit availability. Changes in the cost of current and future borrowings and equity raisings may impact the earnings of Abacus, and impact the availability of funding for new acquisitions and projects, or increase refinancing risk as debt facilities mature. Abacus uses debt funding provided by major banks. Any downgrade of Abacus’ bank credit assessment may increase overall debt funding costs and adversely affect Abacus’ access to debt funding and the terms on which that funding is offered. Abacus staggers the debt maturity profile to reduce the concentration of refinancing risks at any point in time and obtains funding through different banks to reduce credit and counterparty risks.
• Insurance – While Abacus carries property insurance, there are types of losses (such as against floods and earthquakes) that are generally not insured at full replacement cost or that are insured subject to larger deductibles or insurance may not be able to be obtained. Additionally, Abacus will face risks associated with the financial strength of its insurers to meet their indemnity obligations when called upon which could lead to an adverse effect on earnings. Abacus mitigates this risk through the use of insurance brokers to seek to place cover with well rated insurers and ensure that this insurance risk is diversified across various insurers. The diversification of the property portfolio across geographical regions reduces the impact of any potential losses to Abacus.
• Environmental – Abacus may from time to time be exposed to a range of environmental risks including those resulting from soil and water contamination, construction, cultural heritage and flora and fauna (for example, native vegetation). In addition, there is a risk that property owned by or projects undertaken by Abacus from time to time may be contaminated by materials harmful to human health (such as asbestos or other hazardous materials). Also, returns may be adversely impacted by changes to sustainability and environmental requirements and potentially costs associated with the carbon pricing or the introduction of new regulations referable to the property industry. In these circumstances, Abacus may be required to undertake remedial works on contaminated sites. Additional expenses may result from changes in environmental regulations across the industry. Abacus as part of the property acquisition due diligence engages experts to advise on any potential environmental risks and factors these into the acquisition price of the property. Abacus also constantly monitors for any potential exposure in changes in environmental regulations to manage any costs and impacts associated with these risks.
• Treasury risk – Abacus manages its exposure to financial market risks by way of a formal treasury policy encompassing among other things interest rate, funding, liquidity and credit risk management. Risk management is undertaken over multiple timeframes with risk management activity reviewed on a regular basis by our Treasury Management Committee, a formally documented senior management committee. The overarching treasury policy parameters for interest rate and funding risk management reflect the objective of balancing a desired level of certainty for interest expense against retaining an appropriate level of
For
per
sona
l use
onl
y

ABACUS PROPERTY GROUP
15
DIRECTORS’ REPORT 30 June 2018
OPERATING AND FINANCIAL REVIEW (continued)
FUTURE PROSPECTS AND RISKS (continued)
flexibility to respond to external developments within not only domestic and global financial markets but also the wider domestic and global economies. The Treasury Policy is reviewed on a regular basis by senior management and the Board. This is enhanced by utilising the in-depth market knowledge of Abacus’ external independent treasury adviser.
With high levels of uncertainty not only in domestic financial markets but also in the Australasian residential and commercial property sectors and the wider global economy, Abacus has focused its interest rate risk management activity over the last financial year on the near-term, albeit within the overall interest rate risk management hedging requirements of our Treasury Policy. Funding risk management has focused on the timely renegotiation of maturing facilities and where possible seeks to increase the overall maturity profile.
• Workplace Health and Safety (WH&S) – Abacus manages its exposure to WH&S by way of a documented WH&S program including policies and procedures for managing safety. The management system ensures compliance by stakeholders including site contractors and employees through training and education. The management system protects from the risk of incidents, causing financial or physical impact arising from an accident or event at an asset owned or managed by Abacus.
• Talent retention – The inability to attract, retain and develop talented people can frustrate the execution of the strategy, limiting the ability to deliver the business’ objectives. Abacus is committed to ensuring our workplace, market standing and strategic objectives remain relevant and attract the most appropriately skilled and diverse workforce for the organisation to deliver on its goals
For
per
sona
l use
onl
y

ABACUS PROPERTY GROUP
16
DIRECTORS’ REPORT 30 June 2018
OPERATING AND FINANCIAL REVIEW (continued)
DIRECTORS AND SECRETARY
The qualifications, experience and special responsibilities of the Directors and Company Secretary are as follows:
John Thame AIBF, FCPA Chairman (non-executive)
Mr Thame has over 30 years’ experience in the retail financial services industry in senior management positions. His 26-year career with Advance Bank included 10 years as Managing Director until the Bank’s merger with St George Bank Limited in 1997. Mr Thame was Chairman (2004 to 2008) and a director (1997 to 2008) of St George Bank Limited and St George Life Limited.
Mr Thame is a member of the Audit & Risk, Nomination & Remuneration and Compliance Committees.
Tenure: 15 years (All as Chairman)
Steven Sewell BSc Managing Director
Mr Sewell joined Abacus in October 2017 bringing over 17 years’ experience in real estate funds management, asset management, equity and debt capital markets and M&A transactions. Steven joined Abacus from the Macquarie Group where he was an Executive Director of Macquarie Infrastructure and Real Assets. Previously Steven was CEO and Managing Director of Federation Centres Ltd (now renamed Vicinity Centres), Charter Hall Retail REIT (previously known as Macquarie Countrywide Trust). Steven’s prior career experience is across various real estate sectors, and importantly provides a valuable insight and connection to institutional investors, the whole Group’s business and investment strategies, capital allocation and developing third party capital relationships. Steven was appointed Managing Director elect in January 2018, and appointed to the role permanently in April 2018.
William J Bartlett FCA, FCPA, FCMA, CA(SA), FAICD
Mr Bartlett is a Non-Executive Director. As a partner at Ernst & Young for 23 years, he held the roles of Chairman of Worldwide Insurance Practice, National Director of Australian Financial Services Practice and Chairman of the Client Service Board. Mr Bartlett is a director of Reinsurance Group of America Inc. and RGA Reinsurance Company of Australia Limited. He is Chairman of the Cerebral Palsy Foundation of Australia.
Mr Bartlett is Chairman of the Audit & Risk Committee and a member of the Nomination & Remuneration Committee.
Tenure: 11 years
Jingmin Qian CFA, MBA, FAICD
Ms Qian is a Non-Executive Director and has significant expertise in the property, infrastructure and resource sectors as well as rich experience in Asia. Ms Qian is a director of Jing Meridian and specialises in advising boards and senior management on investment, strategic management and cross-cultural management. Ms Qian has served as a member of the business liaison program of the Reserve Bank of Australia. Ms Qian is a trustee of Club Plus Super, a member of Macquarie University Council, a director of the Chartered Financial Analyst Society of Sydney and a director of the Australia China Business Council.
Ms Qian is Chairperson of the Compliance Committee and a member of the Audit & Risk Committee.
Tenure: 1 year
Myra Salkinder MBA, BA
Mrs Salkinder is a Non-Executive Director and is a senior executive of the Kirsh Group. She has been integrally involved over many years with the continued expansion of the Kirsh Group’s property and other investments, both in South Africa, Australia and internationally. Mrs Salkinder is a director of various companies associated with the Kirsh Group worldwide.
Mrs Salkinder is a member of the Nomination & Remuneration and Compliance Committees.
Tenure: 7 years
For
per
sona
l use
onl
y

ABACUS PROPERTY GROUP
17
DIRECTORS’ REPORT 30 June 2018
OPERATING AND FINANCIAL REVIEW (continued)
DIRECTORS AND SECRETARY (continued)
Peter Spira AM, B Arch
Mr Spira is a Non-Executive Director. He has over 36 years’ experience in the Australian real estate sector with Meriton Group, Australia’s largest residential apartment developer. He was responsible for Meriton Group’s development projects while also leading the Meriton team in researching and developing new construction and remediation systems. Mr Spira was a director of Meriton Group from 1995 until 2015. In 2006 he received the Order of Australia (AM) for services to the development industry. He is a director of Retire Australia.
Mr Spira is Chairman of the Nomination & Remuneration Committee.
Tenure: 3 years
Robert Baulderstone BA, CA, FCIS Company Secretary and Chief Financial Officer
Mr Baulderstone has been the Company Secretary since February 2017. He has been a chartered accountant for over 25 years.
As at the date of this report, the relevant interests of the directors in the stapled securities of ABP Group were as follows:
Directors ABP securities held
J Thame 84,590
W Bartlett 33,125
Directors’ Meetings
The number of meetings of directors (including meetings of committees of directors) of AGHL, AFML (the Responsible Entity of AT and AIT), AGPL, ASFML (the Responsible Entity of ASPT) and ASOL, held during the year and the number of meetings attended by each director were as follows:
Audit & Remuneration &
Risk Nomination Compliance
Board Committee Committee Committee
Eligible Attended Eligible Attended Eligible Attended Eligible Attended
J Thame 12 12 5 5 4 4 2 2
F Wolf (deceased) 8 8
S Sewell 4 4
W Bartlett 12 12 5 5 4 3
M Irving 5 5 1 1 2 2
J Qian 10 10 4 4 2 2
M Salkinder 12 12 4 4 4 4
P Spira 12 12 1 1
Indemnification and Insurance of Directors and Officers
The Group has paid an insurance premium in respect of a contract insuring all directors, full time executive officers and the secretary. The terms of this policy prohibit disclosure of the nature of the risks insured or the premium paid.
Indemnification of Auditors
To the extent permitted by law, the Company has agreed to indemnify its auditors, Ernst & Young, as part of the terms of its audit engagement agreement against claims by third parties arising from the audit (for an unspecified amount) – except for any loss in respect of any matters which are finally determined to have resulted from Ernst & Young’s negligent, wrongful or wilful acts or omissions. No payment has been made to indemnify Ernst & Young during or since the financial year.
For
per
sona
l use
onl
y

ABACUS PROPERTY GROUP
18
DIRECTORS’ REPORT 30 June 2018
ENVIRONMENTAL REGULATION AND PERFORMANCE
The Group is subject to significant environmental regulation in respect of its property activities. Adequate systems are in place for the management of the Group’s environmental responsibilities and compliance with the various licence requirements and regulations. No material breaches of requirements or any environmental issues have been identified during the year. The Group is a core plus investor, not a builder of new buildings. The Group endeavours to choose sustainable options whenever that is a cost-effective outcome.
AUDITORS INDEPENDENCE DECLARATION
We have obtained an independence declaration from our auditor, Ernst & Young, and such declaration is shown on page 34.
NOTIFICATION OF AUDITOR ROTATION REQUIREMENTS
On 24 April 2018 the board of directors approved the extension of the Lead Audit Partner rotation period for one year in accordance with section 324DAB of the Corporations Act 2001 and of the Corporations Legislative Amendment (Audit Enhancement) Act 2012. The decision was based on the directors determining that the extension provided consistency in the audit process during the change in the Group’s Managing Director. The directors believe that this enhanced the overall quality of the Group’s audit and the extension does not give rise to a conflict of interest.
ROUNDING
The amounts contained in this report and in the half-year financial report have been rounded to the nearest $1,000 (where rounding is applicable) under the option available to the group under ASIC Corporations Instrument 2016/191. The group is an entity to which the instrument applies.
For
per
sona
l use
onl
y
ABACUS PROPERTY GROUP
19
DIRECTORS’ REPORT
30 June 2018
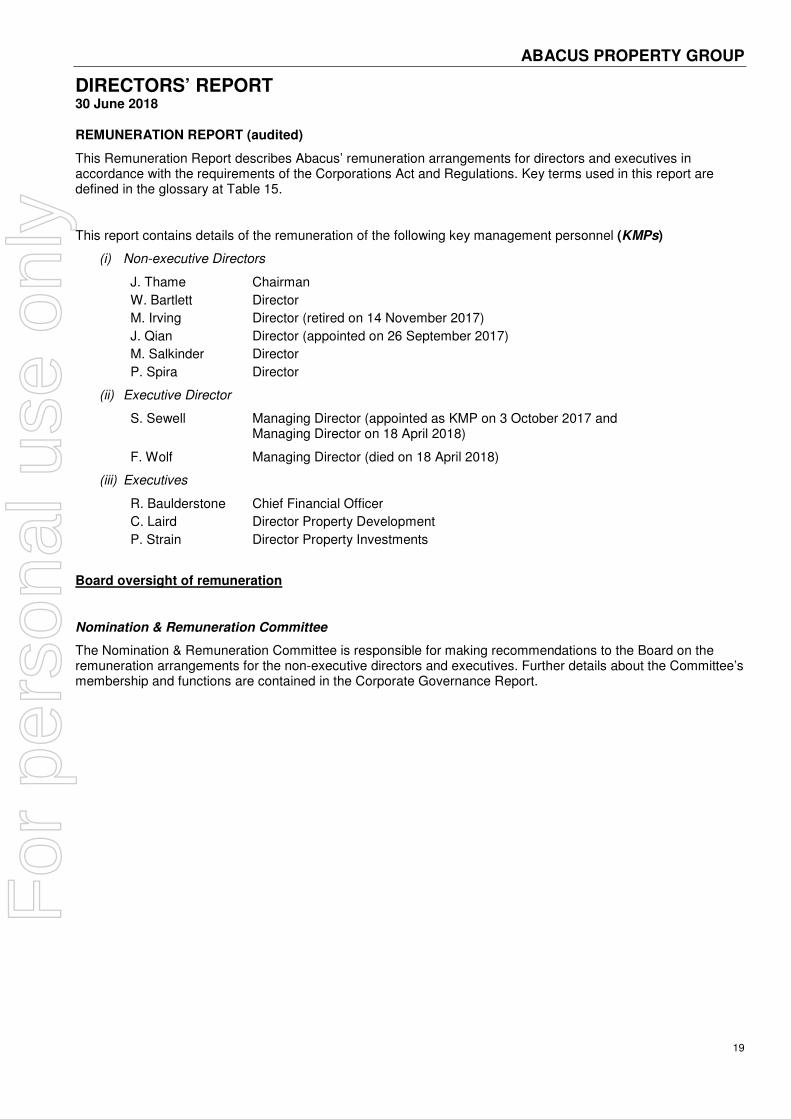
REMUNERATION REPORT (audited)
This Remuneration Report describes Abacus’ remuneration arrangements for directors and executives in accordance with the requirements of the Corporations Act and Regulations. Key terms used in this report are defined in the glossary at Table 15.
This report contains details of the remuneration of the following key management personnel (KMPs)
(i) Non-executive Directors
J. Thame Chairman
W. Bartlett Director
M. Irving Director (retired on 14 November 2017)
J. Qian Director (appointed on 26 September 2017)
M. Salkinder Director
P. Spira Director
(ii) Executive Director
S. Sewell Managing Director (appointed as KMP on 3 October 2017 and Managing Director on 18 April 2018)
F. Wolf Managing Director (died on 18 April 2018)
(iii) Executives
R. Baulderstone Chief Financial Officer
C. Laird Director Property Development
P. Strain Director Property Investments
Board oversight of remuneration
Nomination & Remuneration Committee
The Nomination & Remuneration Committee is responsible for making recommendations to the Board on the remuneration arrangements for the non-executive directors and executives. Further details about the Committee’s membership and functions are contained in the Corporate Governance Report.
For
per
sona
l use
onl
y

ABACUS PROPERTY GROUP
20
DIRECTORS’ REPORT
30 June 2018
REMUNERATION REPORT (audited) (continued)
Executive remuneration
Snapshot
Abacus is a high conviction investor and manager of real estate assets in the Australian and New Zealand
markets.
Abacus’ primary focus is to acquire long dated assets in the core sectors of self-storage and office sectors that
contribute to and drive recurring earnings growth to fulfil our distribution policy. In addition, core investment
opportunities in the retail and industrial sectors will also be considered at appropriate times in the property cycle.
Abacus will continue on a limited scale, to invest in core plus/opportunistic investments across higher risk return
projects in residential development, office, retail and industrial depending upon the nature of the opportunity, the
property cycle and capital availability. The preferred funding sources for this type of investment will be within
Abacus’ third party capital platform in order to achieve a higher level of investment returns.
Remuneration incentives have been set up to ensure executives are not encouraged to take undue risks.
Short and long dated variable remunerations are structured in such a way that different contributions by each
executive can be appropriated rewarded.
Long dated variable remuneration, which is subject to clawback, is linked to Abacus’ security price that reflects
the market assessment of the business’s longer term ability to deliver sustainable distributions and growth.
Objective
The remuneration policy for executives supports the Group’s overall objective of producing sustainable earnings and continuing growth in security value.
Total remuneration levels are positioned at market median, with higher rewards possible if justified by performance. The policy framework is designed to align the interests of executives and securityholders through the use of variable remuneration linked to an underlying profit gateway range and to the Abacus security price over the vesting period for deferred remuneration. The variable remuneration strategy is designed to drive sustainable and growing underlying profit that covers the distribution level implicit in the Abacus security price.
Abacus’ performance over the last 5 years is illustrated below.
Table 1: 5 year performance
2014 2015 2016 2017 2018
Underlying earnings per security (cents)* 20.83 24.53 22.36 32.71 31.73
Distributions paid and proposed (cents) 16.75 17.00 17.00 17.50 18.00
Closing security price (30 June) $2.50 $2.92 $3.15 $3.24 $3.77
Net tangible assets per security** $2.38 $2.49 $2.66 $2.93 $3.18
Weighted average securities on issue 486.1m 524.4m 554.7m 571.2m 577.8m
* Underlying earnings are unaudited.
** Net tangible assets per security include the impact of the fair value movements and are adjusted for the recognition of the June distribution in the respective financial years.
For
per
sona
l use
onl
y

ABACUS PROPERTY GROUP
21
DIRECTORS’ REPORT
30 June 2018
REMUNERATION REPORT (audited) (continued)
Structure
The table below sets out the structure of Abacus’ executive remuneration arrangements. Each element is discussed in further detail in the sections that follow.
Table 2: Summary of ABP’s remuneration structure
Remuneration component Method Purpose Link to performance
Fixed remuneration Paid mainly as cash salary - comprises base salary, superannuation contributions and other non-monetary benefits (car parking and associated fringe benefits tax).
Set with reference to role, market, experience and skill-set.
Indirect link to performance. Periodic increases are linked to market movements, changes in roles and responsibilities, and incumbent experience.
Current variable component (capped at 75% of fixed remuneration for the Managing Director and at 60% for other executives)
Paid in cash in September. To drive achievement of the underlying profit target range as set by the Board.
Underlying profit is a key financial gateway for a current variable award. Individual performance is then tested against KPIs, key effectiveness indicators and other internal financial and performance measures.
Deferred variable component (capped at 75% of fixed remuneration for the Managing Director and at 60% for other executives)
Awards are made in the form of security acquisition rights.
To reward executives for achieving sustainable underlying profit growth over the short to medium term and to reduce excessive risk taking associated with short term performance assessment models.
Directly linked to the increase in the Abacus security price over the vesting period, and the maintenance of distributions. Claw back of prior grants is considered if performance is not sustained.
Abacus aims to ensure that the split of fixed and variable remuneration for executives is appropriate for the type of business it operates, namely, a cyclical, established business that seeks to provide stable distributions to securityholders. Volatile outcomes are not valued by long-term investors, and therefore remuneration is not highly incentive leveraged. The result is a higher proportion of fixed remuneration for executives compared to other A-REITs and a lower proportion of variable remuneration, with the variable remuneration designed to reward consistency of sustainable distributions and steady improvement to the underlying financial strength of the business. This strategy aligns with the Board’s desired positioning of the group within the A-REIT industry.
Accordingly, the Board considers it appropriate that for the key management personnel the proportion of fixed to the potential maximum variable pay (the remuneration ratio) is 40:60 for the Managing Director and 45:55 for the other executives, with half of the variable component generally allocated to current variable remuneration and the other half to deferred variable remuneration. There may be variations from the ratio based on personal performance, but each executive’s total current and deferred variable remuneration is generally capped at 150% for the Managing Director and 120% for the other executives of their fixed remuneration.
To assist the Committee in determining remuneration, Abacus subscribes to an independent property salary and remuneration survey recommended to it by EY. Abacus also reviews the published remuneration of the members of the S&P ASX 200 Index and the S&P/ASX 300 A-REIT Index. This information is used by the Committee for benchmarking purposes
Fixed Remuneration
Abacus aims to set a fair base salary. Base salary is set by reference to each executive’s position, performance and experience, and the Committee has regard to independent benchmarking information. The Committee has authority to engage independent advisers to assist it in its role. No external adviser provided any remuneration recommendations in relation to any member of the KMP during the year.
Fixed remuneration is benchmarked against data for the property industry as well as data from the stock market to determine an appropriate market-competitive level of pay. Stock market data covers listed industry companies of comparable size and, within that, A-REITs of comparable size.
Base salaries paid to executives increased by an average of 2.0% in the year ended 30 June 2018.
For
per
sona
l use
onl
y
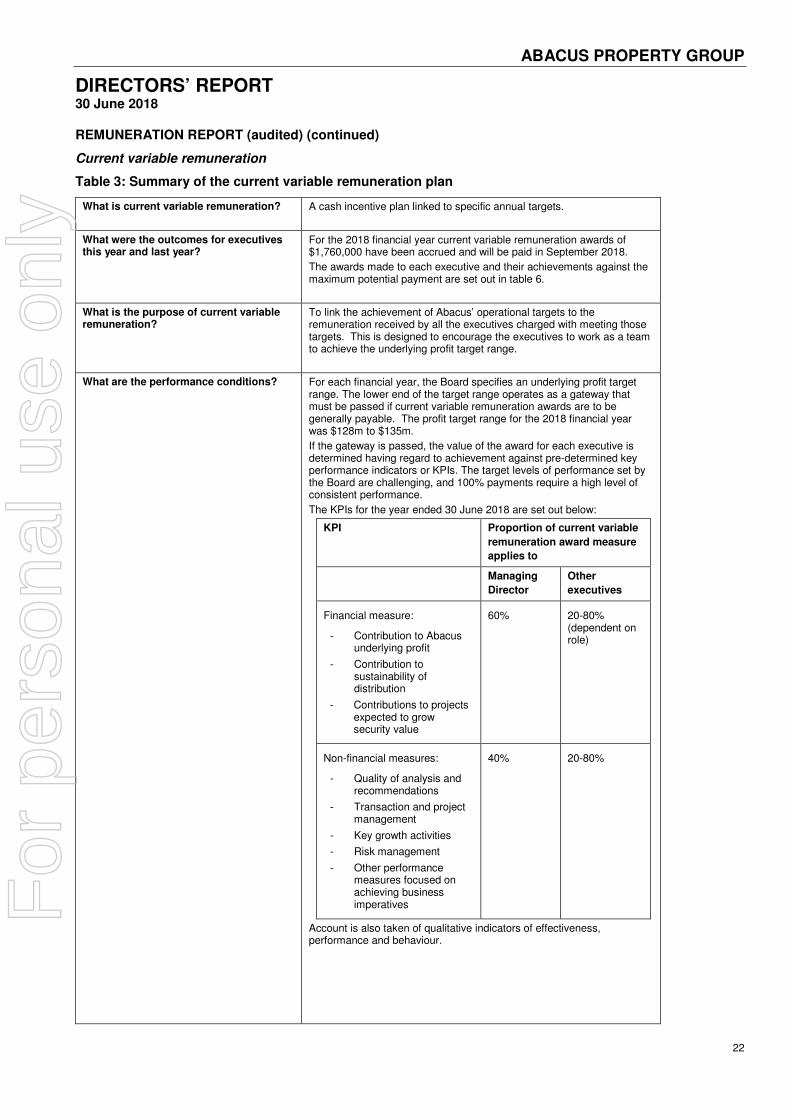
ABACUS PROPERTY GROUP
22
DIRECTORS’ REPORT
30 June 2018
REMUNERATION REPORT (audited) (continued)
Current variable remuneration
Table 3: Summary of the current variable remuneration plan
What is current variable remuneration? A cash incentive plan linked to specific annual targets.
What were the outcomes for executives this year and last year?
For the 2018 financial year current variable remuneration awards of $1,760,000 have been accrued and will be paid in September 2018.
The awards made to each executive and their achievements against the maximum potential payment are set out in table 6.
What is the purpose of current variable remuneration?
To link the achievement of Abacus’ operational targets to the remuneration received by all the executives charged with meeting those targets. This is designed to encourage the executives to work as a team to achieve the underlying profit target range.
What are the performance conditions?
For each financial year, the Board specifies an underlying profit target range. The lower end of the target range operates as a gateway that must be passed if current variable remuneration awards are to be generally payable. The profit target range for the 2018 financial year was $128m to $135m.
If the gateway is passed, the value of the award for each executive is determined having regard to achievement against pre-determined key performance indicators or KPIs. The target levels of performance set by the Board are challenging, and 100% payments require a high level of consistent performance.
The KPIs for the year ended 30 June 2018 are set out below:
KPI Proportion of current variable
remuneration award measure
applies to
Managing
Director
Other
executives
Financial measure:
- Contribution to Abacus underlying profit
- Contribution to sustainability of distribution
- Contributions to projects expected to grow security value
60% 20-80% (dependent on role)
Non-financial measures:
- Quality of analysis and recommendations
- Transaction and project management
- Key growth activities
- Risk management
- Other performance measures focused on achieving business imperatives
40% 20-80%
Account is also taken of qualitative indicators of effectiveness, performance and behaviour.
For
per
sona
l use
onl
y

ABACUS PROPERTY GROUP
23
DIRECTORS’ REPORT
30 June 2018
REMUNERATION REPORT (audited) (continued)
Current variable remuneration (continued)
Table 3: Summary of the current variable remuneration plan (continued)
Why were these measures chosen? An underlying profit target range was chosen because, of several financial performance measures considered by the Board, underlying profit demonstrated the closest correlation to security-holder value creation (measured by total security-holder return). Underlying profit reflects the statutory profit as adjusted in order to present a figure that reflects the Directors’ assessment of the result for the ongoing business activities of Abacus, in accordance with the AICD/Finsia principles for reporting underlying profit.
The other financial and non-financial KPIs were chosen as they represent the key drivers for the short-term success of the business and provide a framework for long term securityholder value.
How is the total current variable remuneration pool determined?
The current variable remuneration pool is linked directly to, and contingent on, the achievement of the underlying profit gateway for the assessment year.
How is performance assessed? The Nomination & Remuneration Committee considers the performance of the executives against their KPIs and other applicable measures and has regard to independent benchmarking information. The Committee then recommends current variable remuneration payments, if any, to the Board for its approval.
What discretions does the Board have? If the underlying profit gateway is missed, the Board retains the discretion to make the current variable remuneration pool, or a reduced pool, generally available if it determines the circumstances warrant such action. If performance has been exceptionally strong the Board may increase the total pool size to provide additional current variable remuneration awards reflective of the above target performance.
If the underlying profit gateway is missed, the Board also retains the discretion to pay current variable remuneration awards to selected individuals to reward them for their personal above target performance.
When approving awards for individual executives, the Board has the discretion to consider each executive’s total contribution to the group in addition to the specific KPIs selected for the relevant year.
The board will disclose the exercise of any of these discretions.
No discretions have been exercised in respect of the reporting year.
What happens on cessation of employment?
An executive will generally not be entitled to be paid a current variable remuneration award if they resign or if their employment is terminated with cause.
For
per
sona
l use
onl
y

ABACUS PROPERTY GROUP
24
DIRECTORS’ REPORT
30 June 2018
REMUNERATION REPORT (audited) (continued)
Table 4: Summary of the pooling and assessment process
The process for determining an individual’s current variable remuneration award is as follows:
Current variable remuneration outcome for the Managing Director
The following table sets out the performance of the Managing Director against his KPI targets for the year ended 30 June 2018 (scorecard) which are reviewed by the Nomination & Remuneration Committee and the Board. These KPIs are intended to provide a link between remuneration outcomes and the key drivers of long term securityholder value:
Table 5: Managing Director’s performance against KPIs
Category Weighting Result Performance Detail
Financial performance – measured by underlying profit
40% Above target Abacus delivered an underlying profit of $183.3m which is 43% higher than the variable remuneration gateway.
Sustainable distribution – measured by payment of the target amount
20% Above target Abacus has paid a distribution of 18.0 c per security which is 3% higher than the target distribution of 17.5c per security.
Growth – measured by revenue growth, funds under management, acquisitions, capital partners and expanded activities
15% Above target Abacus achieved a 24% increase in revenue and continued to grow the property portfolio. Abacus also entered into joint ventures with new capital partners which led to an increase in funds and properties under management
Business management – measured by debt management, rent and leasing management, operating costs and delivery of business plans
15% Above target Abacus has a strong capital position and sound controls that have supported its performance in maintaining occupancy levels above 90%, comparable WALE and the delivery of operational improvements and efficiencies
People – measured by leadership performance, employee engagement, retention and development
10% At target An independent survey on leadership was undertaken with senior staff during the year and the overall results were very positive. The average tenure of all employees in Abacus is greater than 6 years.
The scorecards for other executives are similar to that of the Managing Director, but with different weightings and
with KPIs applicable to their individual roles.
Year-end
Measure Abacus’ financial performance
- Is underlying profit gateway met or exceeded?
- If no, a payment will generally not be made
- If yes, gateway is passed
Beginning of the year
Set the plan parameters
- Underlying profit target range for coming year
- KPIs for each participant
- Maximum current variable remuneration payable for each participant based on remuneration ratio
After year-end
Distribute current variable remuneration
- Assess individual performance against KPIs and other measures
- Pay current variable remuneration entitlements
For
per
sona
l use
onl
y
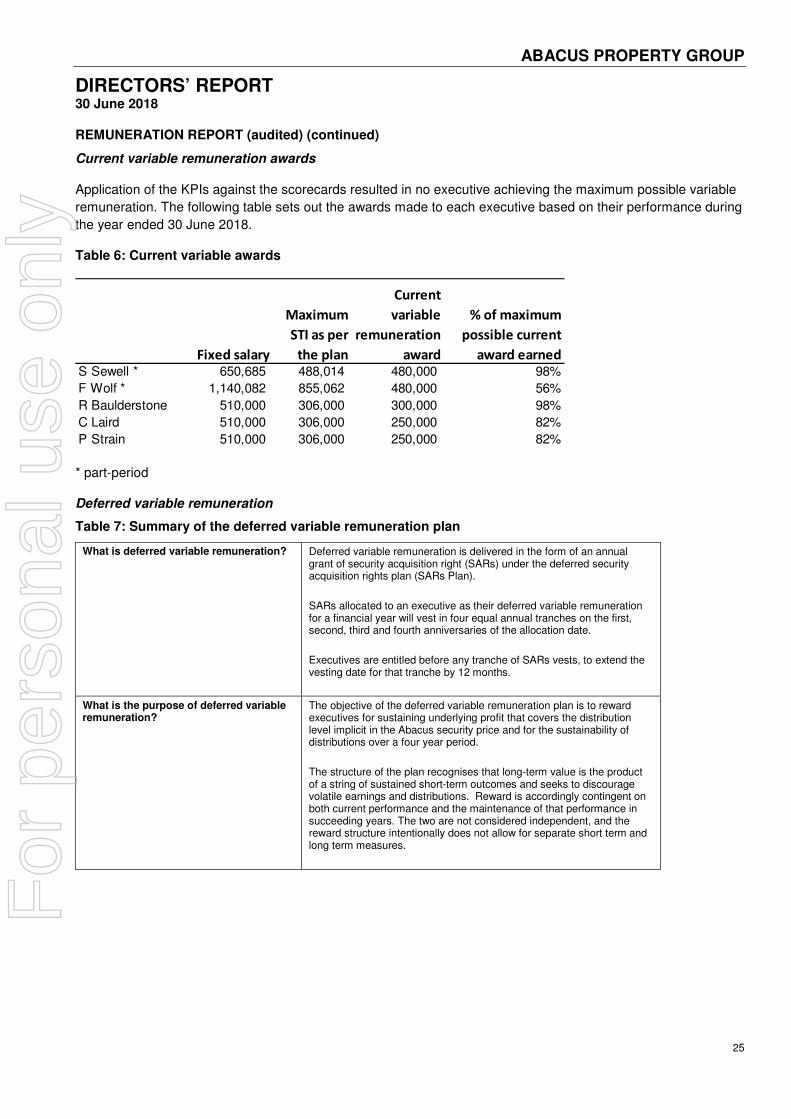
ABACUS PROPERTY GROUP
25
DIRECTORS’ REPORT
30 June 2018
REMUNERATION REPORT (audited) (continued)
Current variable remuneration awards
Application of the KPIs against the scorecards resulted in no executive achieving the maximum possible variable
remuneration. The following table sets out the awards made to each executive based on their performance during
the year ended 30 June 2018.
Table 6: Current variable awards
Fixed salary
Maximum
STI as per
the plan
Current
variable
remuneration
award
% of maximum
possible current
award earnedS Sewell * 650,685 488,014 480,000 98%
F Wolf * 1,140,082 855,062 480,000 56%
R Baulderstone 510,000 306,000 300,000 98%
C Laird 510,000 306,000 250,000 82%
P Strain 510,000 306,000 250,000 82%
* part-period
Deferred variable remuneration
Table 7: Summary of the deferred variable remuneration plan
What is deferred variable remuneration? Deferred variable remuneration is delivered in the form of an annual grant of security acquisition right (SARs) under the deferred security acquisition rights plan (SARs Plan).
SARs allocated to an executive as their deferred variable remuneration for a financial year will vest in four equal annual tranches on the first, second, third and fourth anniversaries of the allocation date.
Executives are entitled before any tranche of SARs vests, to extend the vesting date for that tranche by 12 months.
What is the purpose of deferred variable remuneration?
The objective of the deferred variable remuneration plan is to reward executives for sustaining underlying profit that covers the distribution level implicit in the Abacus security price and for the sustainability of distributions over a four year period.
The structure of the plan recognises that long-term value is the product of a string of sustained short-term outcomes and seeks to discourage volatile earnings and distributions. Reward is accordingly contingent on both current performance and the maintenance of that performance in succeeding years. The two are not considered independent, and the reward structure intentionally does not allow for separate short term and long term measures.
For
per
sona
l use
onl
y

ABACUS PROPERTY GROUP
26
DIRECTORS’ REPORT
30 June 2018
REMUNERATION REPORT (audited) (continued)
Deferred variable remuneration (continued)
Table 7: Summary of the deferred variable remuneration plan (continued)
How is the value of the deferred variable remuneration determined?
A deferred variable remuneration award is available to an executive who satisfies the KPIs outlined in the current variable remuneration section.
As a starting point, the deferred variable remuneration award for a financial year will match the value of the current variable remuneration award paid for that year.
The matching allocations may then be adjusted to take into account other factors that the Board considers specifically relevant to the purpose of providing deferred variable remuneration awards. Adjustments may be needed, for example, to take into account exceptional individual performance, the potential of an executive, or their future employment plans and aspirations.
Once the grant value is determined by the Board, the number of SARs to be awarded is calculated based on the face value of Abacus’ securities. The face value is calculated using a 10 day volume weighted average price (VWAP) for the period commencing on the second trading day after the full year results announcement.
Can deferred variable remuneration be forfeited?
Deferred variable remuneration will usually be forfeited if an executive resigns or is summarily dismissed prior to the vesting date (see the ‘Cessation of employment section’ below for more detail).
The Board has the discretion to forfeit unvested SARs tranches of an allocation of SARs if ABP distributions fall by more than the annualised distribution rate per ABP security set at the time of the relevant allocation. The rate set for the reporting year was $0.17. No forfeitures of SARs for unsustainable performance occurred in the reporting period.
Further, if the Board determines that an executive is responsible for misconduct resulting in material non-compliance with financial reporting requirements or for excessive risk taking, the executive will forfeit all unvested SARs entitlements.
Do executives receive distributions on their unvested deferred variable remuneration?
No. However, to achieve a closer alignment of the interests of securityholders and senior executives, when a tranche of SARs vests, the holder will receive an additional number of ABP securities equivalent in value to the distributions the executive would have received over the vesting period if their SARs had been ABP securities.
What discretions does the Board have? The Board has the discretion to award SARs in excess of the deferred remuneration cap in the case of exceptional performance.
The board will disclose the exercise of any of these discretions.
No discretions have been exercised in respect of the reporting year.
What happens on cessation of employment?
To receive the deferred remuneration award the executive must remain employed by Abacus, unless they are considered a good leaver (that is, through disability, termination without cause, genuine retirement, death or some other circumstance considered acceptable by the board in its discretion).
Further details about deferred variable remuneration grants are set out in tables 10 to 13 and the terms of prior year grants are set out in earlier remuneration reports.
For
per
sona
l use
onl
y

ABACUS PROPERTY GROUP
27
DIRECTORS’ REPORT
30 June 2018
REMUNERATION REPORT (audited) (continued)
Deferred variable remuneration (continued)
Employment contracts and termination entitlements
The Managing Director, Mr Sewell, is employed under a contract dated 15 February 2018 and may be terminated by either party giving 9 months written notice or in the case of Abacus by providing payment in lieu of notice.
The previous Managing Director, Dr Wolf, was employed under a rolling contract which commenced on 10 October 2002. Under the terms of the contract:
- Dr Wolf was able to resign from his position by giving 6 months written notice; and
- Abacus was able to terminate the employment agreement by providing 12 months written notice or providing payment in lieu of notice.
Dr Wolf died on 18 April 2018 and the following amounts were paid in accordance with the terms of his employment contract:
- The 800,044 SARs held by Dr Wolf that vested at the date of his death;
- Accrued leave entitlements; and
- Dr Wolf’s estate will receive his current variable remuneration award for the year ended 30 June 2018.
The other executives are employed on an ongoing basis under letter agreements until one month’s notice is given by either party. Abacus may terminate an executive’s service at any time without notice if serious misconduct has occurred. Where termination with cause occurs the executive is only entitled to remuneration up to the date of termination. Deferred variable remuneration allocations vest according to the SARs Plan rules.
Non-executive director remuneration
Objective
The Committee assesses the appropriateness of the nature and amount of remuneration of non-executive directors on a periodic basis by reference to market rates with the overall objective of attracting and retaining Board members with an appropriate combination of industry and specialist functional knowledge and experience.
Structure
Abacus’ constituent documents and the ASX Listing Rules specify that the maximum aggregate remuneration of non-executive directors must be approved by securityholders. The last determination was at the annual general meeting held on 14 November 2017 when securityholders approved an aggregate remuneration limit of $1,000,000 per year. (This is a limit on non-executive directors’ total fees. The actual fees paid to non-executive directors are in Table 8.)
The aggregate remuneration limit and the fee structure are reviewed annually and fees were last increased in July 2017.
Fees payable, inclusive of superannuation, to non-executive directors are as follows:
Table 8: Non-Executive Director fee levels Board/Committee Role Fee
Board Chairman* $232,050
Board Member $105,000
Audit & Risk Committee Chairman $27,300
Audit & Risk Committee Member $10,500
Compliance Committee Chairman $14,700
Compliance Committee Member $10,500
Nomination & Remuneration Committee Chairman $15,750
Nomination & Remuneration Committee Member $10,500
* The Chairman is an ex-officio member of all Board committees but does not receive any committee membership fees.
The non-executive directors do not receive retirement benefits. Nor do they participate in any incentive programs.
For
per
sona
l use
onl
y

ABACUS PROPERTY GROUP
28
DIRECTORS’ REPORT
30 June 2018
Table 9: Remuneration of Key Management Personnel
2018 Short-term benefits Long-term
Security-
based Total Performance
employment benefits payment related
Salary & fees
Current
variable
incentive
Non-
monetary
benefits
Total cash
payments
and short
term
benefits Superannuation
Long
service
leave*
Security
acquisition
rights
(SARs)*
$ $ $ $ $ $ $ $ %
Non-executive directors
J Thame - Chairman 212,001 - - 212,001 20,049 - - 232,050 -
W Bartlett 126,495 - - 126,495 12,017 - - 138,512 -
M Irving ** 53,393 - - 53,393 5,072 - - 58,465 -
J Qian # 87,719 - - 87,719 8,333 - - 96,052 -
M Salkinder 115,068 - - 115,068 10,931 - - 125,999 -
P Spira 104,934 - - 104,934 9,968 - - 114,902
Sub-total non-executive directors 699,610 - - 699,610 66,370 - - 765,980
Executive Directors
S Sew ell - Managing Director ## 636,323 480,000 - 1,116,323 15,036 - - 1,131,359 42%
F Wolf - Managing Director ### 1,129,127 480,000 6,467 1,615,594 13,603 27,982 1,352,246 3,009,425 61%
Other key management personnel
R Baulderstone - Chief Financial Off icer 485,000 300,000 - 785,000 25,000 10,390 152,579 972,969 47%
C Laird - Director Property Developments 485,000 250,000 6,467 741,467 25,000 9,640 178,215 954,322 45%
P Strain - Director Property Investments 485,000 250,000 6,467 741,467 25,000 10,550 159,085 936,102 44%
Sub-total executive KMP 3,220,450 1,760,000 19,401 4,999,851 103,639 58,562 1,842,125 7,004,177
Total 3,920,060 1,760,000 19,401 5,699,461 170,009 58,562 1,842,125 7,770,157
Post
*Accrued but not presently entitled except F Wolf ** Retired on 14 November 2017 # Appointed on 26 September 2017 ## Commenced on 3 October 2017 and appointed Managing Director on 18 April 2018 ### Died on 18 April 2018 which resulted in the vesting of all entitlements to SARs
For
per
sona
l use
onl
y

ABACUS PROPERTY GROUP
29
DIRECTORS’ REPORT
30 June 2018
Table 9: Remuneration of Key Management Personnel
2017 Short-term benefits Long-term
Security-
based Total Performance
employment benefits payment related
Salary & fees
Current
variable
incentive
Non-
monetary
benefits
Total cash
payments
and short
term
benefits Superannuation
Long
service
leave*
Security
acquisition
rights
(SARs)*
$ $ $ $ $ $ $ $ %
Non-executive directors
J Thame - Chairman 201,828 - - 201,828 19,172 - - 221,000 -
W Bartlett 114,155 - - 114,155 10,845 - - 125,000 -
M Irving 140,028 - - 140,028 9,828 - - 149,856 -
M Salkinder 109,589 - - 109,589 10,411 - - 120,000 -
P Spira 91,324 - - 91,324 8,676 - - 100,000
Sub-total non-executive directors 656,924 - - 656,924 58,932 - - 715,856
Executive Directors
F Wolf - Managing Director 1,375,411 900,000 6,673 2,282,084 24,589 27,621 569,887 2,904,181 51%
Other key management personnel
E Varejes - Chief Operating Officer # 252,333 - 3,336 255,669 15,167 4,273 64,470 339,579 19%
R Baulderstone - Chief Financial Off icer 465,000 270,000 - 735,000 35,000 10,122 138,910 919,032 44%
C Laird - Director Property Developments 465,000 270,000 6,673 741,673 35,000 9,362 165,435 951,470 46%
P Strain - Director Property Investments 465,000 270,000 6,673 741,673 35,000 10,284 151,579 938,536 45%
Sub-total executive KMP 3,022,744 1,710,000 23,355 4,756,099 144,756 61,662 1,090,281 6,052,798
Total 3,679,668 1,710,000 23,355 5,413,023 203,688 61,662 1,090,281 6,768,654
Post
*Accrued but not presently entitled # Ceased to meet the definition of a key management person in December 2016
For
per
sona
l use
onl
y

ABACUS PROPERTY GROUP
30
DIRECTORS’ REPORT
30 June 2018
REMUNERATION REPORT (audited) (continued)
Table 10: Grants under the Deferred Security Acquisition Rights Plan
The table below discloses unvested SARs held by key management personnel as well as the number of SARs that vested or lapsed during the year.
Year Grant dateSARs
granted
Fair
value
per right
at grant
date
Vesting
date
No.
vested
during
the year
No.
lapsed
during
the year
Director
F Wolf 2018 14/11/2017 216,420 $3.566 18/04/2018 216,420 -
2017 14/11/2016 13/09/2017 57,565 -
2017 14/11/2016 18/04/2018 172,695 -
2016 21/11/2015 13/09/2017 58,294 -
2016 21/11/2015 18/04/2018 116,588 -
2015 21/11/2014 13/09/2017 54,565 -
2015 21/11/2014 18/04/2018 54,565 -
2014 29/11/2013 13/09/2017 69,352 -
Executives
R Baulderstone 2018 14/11/2017 48,868 $3.566 over 4 years - -
2017 14/11/2016 13/09/2017 14,391 -
2016 21/11/2015 13/09/2017 13,324 -
2015 21/11/2014 13/09/2017 14,550 -
2014 29/11/2013 13/09/2017 16,644 -
C Laird 2018 14/11/2017 55,852 $3.566 over 4 years - -
2017 14/11/2016 13/09/2017 16,447
2016 21/11/2015 13/09/2017 16,655 -
2015 21/11/2014 13/09/2017 18,188 -
2014 29/11/2013 13/09/2017 16,644 -
P Strain 2018 14/11/2017 48,868 $3.566 over 4 years - -
2017 14/11/2016 13/09/2017 14,391 -
2016 21/11/2015 13/09/2017 16,655 -
2015 21/11/2014 13/09/2017 14,550 -
2014 29/11/2013 13/09/2017 16,644 -
Table 11: The value of SARs granted, exercised and lapsed during the year
Value of SARs
granted during
the year
Value of SARs
exercised
during the year
Value of SARs
lapsed during
the year
$ $ $
F Wolf 771,754 3,168,963 -
R Baulderstone 174,263 255,356 -
C Laird 199,168 293,668 -
P Strain 174,263 269,368 -
Refer to Note 20 for details on the valuation the SARs, including models and assumptions used.
There were no alterations to the terms and conditions of the SARs since their grant date.
For
per
sona
l use
onl
y

ABACUS PROPERTY GROUP
31
DIRECTORS’ REPORT
30 June 2018
REMUNERATION REPORT (audited) (continued)
Table 12: Securities acquired on exercise of options
Securities
acquired
Paid per
security
No. $
F Wolf 272,442 3.80
R Baulderstone 66,939 3.80
C Laird 76,982 3.80
P Strain 70,612 3.80
The number of securities acquired is based on the SARs that vested in the year and the distributions that would have been paid on that number of securities from the grant date to the allocation date.
Dr Wolf held 603,303 SARs at the date of his death. Ordinarily, the rights are satisfied with the purchase of Abacus securities. The Board exercised its discretion as provided in the plan and instead paid the estate of the late Dr Wolf the cash amount of $2,129,658.
Table 13: Movements in SARs holdings of key management personnel during the year
Balance Granted as SARs Balance Vested
1 July 2017 remuneration exercised 30 June 2018 30 June 2018
Director
F Wolf 583,624 216,420 (800,044) - -
Executives
R Baulderstone 143,280 48,868 (58,909) 133,239 -
C Laird 168,773 55,852 (67,934) 156,691 -
P Strain 153,273 48,868 (62,240) 139,901 -
Total 1,048,950 370,008 (989,127) 429,831 -
Table 14: Securityholdings of key management personnel
Balance Vesting of Purchases/ Balance
1 July 2017 SARs (sales) 30 June 2018
Directors
J Thame 84,590 - - 84,590
W Bartlett 33,125 - - 33,125
Executives
R Baulderstone 191,202 66,939 - 258,141
C Laird 165,514 76,982 (33,000) 209,496
P Strain 255,004 70,612 16,213 341,829
Total 729,435 214,533 (16,787) 927,181
All equity transactions with key management personnel other than those arising from the vesting of the security acquisition rights have been entered into under terms and conditions no more favourable than those the Group would have adopted if dealing at arm’s length.
Loans to key management personnel
There were no loans to key management personnel and their related parties at any time in 2018 or in the prior year.
For
per
sona
l use
onl
y

ABACUS PROPERTY GROUP
32
DIRECTORS’ REPORT
30 June 2018
REMUNERATION REPORT (audited) (continued)
Other transactions with key management personnel
During the year, transactions occurred between the Group and key management personnel which are within normal employee and investor relationships.
Table 15: Glossary of terms used in the Remuneration Report
Term Definition
allocation date for an award of SARS the first business day after a period of 10 trading days on ASX starting from the second trading day after the full year results announcement for the Group for the previous financial year has elapsed
Executives the Managing Director and the other senior executives of Abacus who are members of the KMP
Key Management Personnel or KMP those executives who for the purposes of the accounting standards are considered to have authority and responsibility for planning, directing and controlling the major activities of Abacus, and includes the directors
Security acquisition rights or SARs SARs are awarded under the deferred security acquisition rights plan. If a SAR vests, it will convert into ABP security on a one for one basis or (exceptionally, subject to the discretion of the Board where an executive already has a significant holding of ABP securities) a cash amount equal to the face value of an ABP security at around the time of vesting
For
per
sona
l use
onl
y

ABACUS PROPERTY GROUP
33
DIRECTORS’ REPORT 30 June 2018
Signed in accordance with a resolution of the directors. Abacus Group Holdings Limited (ABN 31 080 604 619)
John Thame Steven Sewell Chairman Managing Director Sydney, 17 August 2018
For
per
sona
l use
onl
y

Ernst & Young 200 George Street Sydney NSW 2000 Australia GPO Box 2646 Sydney NSW 2001
Tel: +61 2 9248 5555 Fax: +61 2 9248 5959 ey.com/au
Auditor’s Independence Declaration to the Directors of Abacus Group Holdings Limited
As lead auditor for the audit of Abacus Group Holdings Limited for the financial year ended 30 June 2018, I declare to the best of my knowledge and belief, there have been:
a) no contraventions of the auditor independence requirements of the Corporations Act 2001 in relation to the audit; and
b) no contraventions of any applicable code of professional conduct in relation to the audit. This declaration is in respect of Abacus Group Holdings Limited and the entities it controlled during the financial year.
Ernst & Young
Kathy Parsons Partner 17 August 2018
For
per
sona
l use
onl
y

ABACUS PROPERTY GROUP
35
CONSOLIDATED INCOME STATEMENT YEAR ENDED 30 JUNE 2018
2018 2017
Notes $'000 $'000
REVENUE
Rental income 152,444 150,634
Hotel income 26,211 30,968
Finance income 1 48,405 44,637
Management and other fee income 4,282 5,470
Sale of inventory 76,575 16,192
Total Revenue 307,917 247,901
OTHER INCOME
Net change in fair value of investment properties derecognised 15,265 45,267
Net change in fair value of investments and financial instruments derecognised 9,004 7,167
Net profit on sale of property, plant and equipment 2,039 11,762
Net change in fair value of investment properties and property, plant & equipment held at
balance date 60,724 84,948
Net change in fair value of derivatives 730 4,458
Share of profit from equity accounted investments 8(a) 73,749 54,273
Other income 4,279 7,656
Total Revenue and Other Income 473,707 463,432
Property expenses and outgoings (46,766) (43,477)
Hotel expenses (20,491) (23,415)
Depreciation and amortisation expenses 3(a) (5,179) (2,481)
Cost of inventory sales (55,941) (10,968)
Net change in fair value of investments held at balance date 3(b) (6,363) (15,554)
Finance costs 3(c) (31,258) (35,826)
Administrative and other expenses 3(d) (31,938) (29,483)
PROFIT BEFORE TAX 275,771 302,228
Income tax expense 4(a) (28,813) (10,140)
NET PROFIT AFTER TAX 246,958 292,088
PROFIT ATTRIBUTABLE TO:
Equity holders of the parent entity (AGHL) 54,135 66,005
Equity holders of other stapled entities
AT members 108,865 157,181
AGPL members 4,937 5,189
AIT members 3,263 3,391
ASPT members 25,188 13,395
ASOL members 47,321 39,936
Stapled security holders 243,709 285,097
Net profit attributable to external non-controlling interests 3,249 6,991
NET PROFIT 246,958 292,088
Basic and diluted earnings per stapled security (cents) 2 42.18 49.91
For
per
sona
l use
onl
y

ABACUS PROPERTY GROUP
36
CONSOLIDATED STATEMENT OF COMPREHENSIVE INCOME YEAR ENDED 30 JUNE 2018
2018 2017
$'000 $'000
NET PROFIT AFTER TAX 246,958 292,088
OTHER COMPREHENSIVE INCOME
Items that will not be reclassified subsequently to the income statement
Revaluation of assets, nil tax effect 10,053 10,565
Items that may be reclassified subsequently to the income statement
Foreign exchange translation adjustments, net of tax (2,022) (42)
TOTAL COMPREHENSIVE INCOME FOR THE YEAR 254,989 302,611
Total comprehensive income attributable to:
Members of the APG Group 247,733 291,414
External non-controlling interests 7,256 11,197
TOTAL COMPREHENSIVE INCOME FOR THE YEAR 254,989 302,611
Total comprehensive income attributable to members of the Group analysed by amounts
attributable to:
AGHL members 60,181 72,364
AT members 108,865 157,181
AGPL members 4,937 5,189
AIT members 3,263 3,391
ASPT members 23,208 13,353
ASOL members 47,279 39,936
TOTAL COMPREHENSIVE INCOME AFTER TAX ATTRIBUTABLE
TO MEMBERS OF THE GROUP 247,733 291,414
For
per
sona
l use
onl
y

ABACUS PROPERTY GROUP
37
CONSOLIDATED STATEMENT OF FINANCIAL POSITION AS AT 30 JUNE 2018
2018 2017
Notes $'000 $'000
CURRENT ASSETS
Investment properties held for sale 5 209,606 8,000
Inventory 6(a) 28,548 8,474
Property loans 7(a) 212,509 72,597
Cash and cash equivalents 9 103,256 56,267
Property, plant and equipment held for sale 16 88,500 -
Trade and other receivables 21,145 18,457
Derivatives at fair value - 1,667
Other 3,413 3,263
TOTAL CURRENT ASSETS 666,977 168,725
NON-CURRENT ASSETS
Investment properties 5 1,726,394 1,563,523
Inventory 6(b) 76,157 96,479
Property loans 7(b) 117,782 274,070
Equity accounted investments 8 154,890 167,248
Deferred tax assets 4(c) 8,236 6,954
Property, plant and equipment 16 4,800 84,734
Other financial assets 7(c) 7,987 42,543
Intangible assets and goodwill 21 32,394 32,394
TOTAL NON-CURRENT ASSETS 2,128,640 2,267,945
TOTAL ASSETS 2,795,617 2,436,670
CURRENT LIABILITIES
Trade and other payables 88,568 27,865
Interest-bearing loans and borrowings 11(a) 38,765 -
Derivatives at fair value 61 5,469
Income tax payable 20,906 740
Other 8,108 6,910
TOTAL CURRENT LIABILITIES 156,408 40,984
NON-CURRENT LIABILITIES
Interest-bearing loans and borrowings 11(b) 693,742 549,184
Derivatives at fair value 12,847 16,814
Deferred tax liabilities 4(c) 12,218 10,358
Other 3,700 4,709
722,507 581,065
TOTAL LIABILITIES 878,915 622,049
NET ASSETS 1,916,702 1,814,621
TOTAL EQUITY 1,916,702 1,814,621
TOTAL NON-CURRENT LIABILITIES
For
per
sona
l use
onl
y

ABACUS PROPERTY GROUP
38
CONSOLIDATED STATEMENT OF FINANCIAL POSITION (continued) AS AT 30 JUNE 2018
2018 2017
Notes $'000 $'000
Equity attributable to members of AGHL:
Contributed equity 348,331 344,284
Reserves 21,940 18,373
Retained earnings 127,033 72,899
Total equity attributable to members of AGHL: 497,304 435,556
Equity attributable to unitholders of AT:
Contributed equity 942,690 935,977
Accumulated losses (40,062) (23,340)
Total equity attributable to unitholders of AT: 902,628 912,637
Equity attributable to members of AGPL:
Contributed equity 27,413 27,150
Retained earnings 21,567 16,630
Total equity attributable to members of AGPL: 48,980 43,780
Equity attributable to unitholders of AIT:
Contributed equity 131,300 130,556
Accumulated losses (91,631) (80,300)
Total equity attributable to unitholders of AIT: 39,669 50,256
Equity attributable to members of ASPT:
Contributed equity 124,167 122,535
Reserves 170 2,148
Retained earnings / (accumulated losses) 8,150 (2,100)
Total equity attributable to members of ASPT: 132,487 122,583
Equity attributable to members of ASOL:
Contributed equity 21,087 20,654
Reserves 130 174
Retained earnings 227,780 180,459
Total equity attributable to members of ASOL: 248,997 201,287
Equity attributable to external non-controlling interest:
Contributed equity 61,139 68,809
Reserves 11,854 7,847
Accumulated losses (26,356) (28,134)
Total equity attributable to external non-controlling interest: 46,637 48,522
TOTAL EQUITY 1,916,702 1,814,621
Contributed equity 13 1,594,988 1,581,156
Reserves 22,240 20,695
Retained earnings 252,837 164,248
Total stapled security holders' interest in equity 1,870,065 1,766,099
Total external non-controlling interest 46,637 48,522
TOTAL EQUITY 1,916,702 1,814,621
For
per
sona
l use
onl
y

ABACUS PROPERTY GROUP
39
CONSOLIDATED STATEMENT OF CASH FLOW YEAR ENDED 30 JUNE 2018
2018 2017
Notes $'000 $'000
CASH FLOWS FROM OPERATING ACTIVITIES
Income receipts 390,428 289,763
Interest received 939 1,329
Income tax paid (8,067) (2,944)
Finance costs paid (28,571) (35,409)
Operating payments (107,465) (102,757)
Payments for inventory costs (52,998) (33,772)
NET CASH FLOWS FROM OPERATING ACTIVITIES 9 194,266 116,210
CASH FLOWS FROM INVESTING ACTIVITIES
Payments for investments and funds advanced (65,727) (92,770)
Proceeds from sale and settlement of investments and funds repaid 126,590 153,354
Purchase of property, plant and equipment (2,105) (1,100)
Disposal of property, plant and equipment 2,089 72,698
Purchase of investment properties (346,821) (141,049)
Disposal of investment properties 58,050 182,070
Payment for other investments (3,860) (2,124)
NET CASH FLOWS FROM / (USED IN) INVESTING ACTIVITIES (231,784) 171,079
CASH FLOWS FROM FINANCING ACTIVITIES
Proceeds from issue of stapled securities - 17,550
Return of capital (42) (4,213)
Payment of issue / finance costs (1,734) (1,436)
Repayment of borrowings (63,685) (260,130)
Proceeds from borrowings 243,794 37,152
Distributions paid (93,745) (63,767)
NET CASH FLOWS (USED IN) / FROM FINANCING ACTIVITIES 84,588 (274,844)
NET INCREASE IN CASH AND CASH EQUIVALENTS 47,070 12,445
Net foreign exchange differences (81) 30
Cash and cash equivalents at beginning of year 56,267 43,792
CASH AND CASH EQUIVALENTS AT END OF YEAR 9 103,256 56,267
For
per
sona
l use
onl
y

ABACUS PROPERTY GROUP
40
CONSOLIDATED STATEMENT OF CHANGES IN EQUITY YEAR ENDED 30 JUNE 2018
External
Asset Foreign Employee Non-
Issued revaluation currency equity Retained controlling Total
capital reserve translation benefits earnings interest Equity
CONSOLIDATED $'000 $'000 $'000 $'000 $'000 $'000 $'000
At 1 July 2017 1,581,156 11,880 2,322 6,493 164,248 48,522 1,814,621
Other comprehensive income - 6,046 (2,022) - - 4,007 8,031
Net income for the year - - - - 243,709 3,249 246,958
Total comprehensive income for
the year - 6,046 (2,022) - 243,709 7,256 254,989
Return of capital - - - - - (7,670) (7,670)
Distribution reinvestment plan 13,831 - - - - - 13,831
Security acquisition rights - - - (2,479) - - (2,479)
Acquisition of units in subsidiary - - - - (476) - (476)
Distribution to security holders - - - - (154,643) (1,471) (156,114)
At 30 June 2018 1,594,987 17,926 300 4,014 252,838 46,637 1,916,702
External
Asset Foreign Employee Non-
Issued revaluation currency equity Retained controlling Total
capital reserve translation benefits earnings interest Equity
CONSOLIDATED $'000 $'000 $'000 $'000 $'000 $'000 $'000
At 1 July 2016 1,523,878 5,521 2,364 7,273 (23,054) 43,295 1,559,277
Other comprehensive income - 6,359 (42) - - 4,206 10,523
Net income for the year - - - - 285,097 6,991 292,088
Total comprehensive income for
the year - 6,359 (42) - 285,097 11,197 302,611
Equity raisings 17,347 - - - - 203 17,550
Return of capital - - - - - (4,213) (4,213)
Issue costs (104) - - - - - (104)
Distribution reinvestment plan 40,035 - - - - - 40,035
Security acquisition rights - - - (780) - - (780)
Distribution to security holders - - - - (97,795) (1,960) (99,755)
At 30 June 2017 1,581,156 11,880 2,322 6,493 164,248 48,522 1,814,621
Attributable to the stapled security holder
Attributable to the stapled security holder
For
per
sona
l use
onl
y

ABACUS PROPERTY GROUP
41
CONTENTS 30 JUNE 2018
Notes to the financial statements
About this report Page 42
Segment information Page 44
Results for the year
Operating assets and liabilities
Capital structure and financing costs
Group Structure Other Items
1. Revenue
5. Investment properties
9. Cash and cash equivalents
15. Parent entity information
16. Property, plant and equipment
2. Earnings per stapled security
6. Inventory 10. Capital management
17. Commitments and contingencies
3. Expenses 7. Property loans and other financial assets
11. Interest bearing loans and borrowings
18. Related party disclosures
4. Income tax 8. Investments accounted for using the equity method
12. Financial instruments
19. Key management personnel
13. Contributed equity
20. Security based payments
14. Distributions paid and proposed
21. Intangible assets and goodwill
22. Summary of significant accounting policies
23. Auditors remuneration
24. Events after balance date
Signed reports
Directors’ declaration Page 95
Independent auditor’s report Page 96
For
per
sona
l use
onl
y
ABACUS PROPERTY GROUP
42
NOTES TO THE FINANCIAL STATEMENTS – About this Report 30 JUNE 2018
Abacus Property Group (“APG” or the “Group”) is comprised of Abacus Group Holdings Limited (“AGHL”) (the nominated parent entity), Abacus Trust (“AT”), Abacus Group Projects Limited (“AGPL”), Abacus Income Trust (“AIT”), Abacus Storage Property Trust (“ASPT”) and Abacus Storage Operations Limited (“ASOL”). Shares in AGHL, AGPL and ASOL and units in AT, AIT and ASPT have been stapled together so that neither can be dealt with without the other. The securities trade as one security on the Australian Securities Exchange (the “ASX”) under the code ABP.
The financial report of the Group for the year ended 30 June 2018 was authorised for issue in accordance with a resolution of the directors on 17 August 2018.
The nature of the operations and principal activities of the Group are described in the Directors’ Report.
SIGNIFICANT ACCOUNTING JUDGMENTS, ESTIMATES AND ASSUMPTIONS
In applying the Group’s accounting policies management continually evaluates judgements, estimates and assumptions based on experience and other factors, including expectations of future events that may have an impact on the Group. All judgements, estimates and assumptions made are believed to be reasonable, based on the most current set of circumstances available to management. Actual results may differ from these judgements, estimates and assumptions. Significant judgements, estimates and assumptions made by management in the preparation of these financial statements are outlined below:
(a) Significant accounting judgements
Accounting policy – financial assets and liabilities at fair value through profit and loss
A financial asset or financial liability is designated by the entity as being at fair value through profit or loss upon initial recognition. The Group uses this designation where doing so results in more relevant information, because it is a group of financial assets and liabilities which is managed and its performance is evaluated on a fair value basis, in accordance with the Group’s documented risk management and investment strategy, and information about the instruments is provided internally on that basis to the entity’s key management personnel and the Board.
Control and significant influence
In determining whether the Group has control over an entity, the Group assesses its exposure or rights to variable returns from its involvement with the entity and whether it has the ability to affect those returns through its power over the investee. The Group may have significant influence over an entity when it has the power to participate in the financial and operating policy decisions of the entity but is not in control or joint control of those policies.
(b) Significant accounting estimates and assumptions
Valuation of investment properties and property, plant and equipment held at fair value
The Group makes judgements in respect of the fair value of investment properties and property, plant and equipment (Note 22(n)). The fair value of these properties are reviewed regularly by management with reference to external independent property valuations and market conditions existing at reporting date, using generally accepted market practices. The assumptions underlying estimated fair values are those relating to the receipt of contractual rents, expected future market rentals, maintenance requirements, capitalisation rates and discount rates that reflect current market conditions and current or recent property investment prices. If there is any material change in these assumptions or regional, national or international economic conditions, the fair value of investment properties and property, plant and equipment may differ and may need to be re-estimated.
Impairment of property loans and financial assets
In considering the impairment of property loans and financial assets, the Group undertakes a market analysis of the secured property development and other securities being utilised to support the underlying loan and financial assets and identifies if a deficiency of security exists and the extent of that deficiency, if any. If there is an indicator of impairment, fair value calculations of expected future cashflows are determined and if there are any differences to the carrying value of the loan, an impairment is recognised.
For
per
sona
l use
onl
y

ABACUS PROPERTY GROUP
43
NOTES TO THE FINANCIAL STATEMENTS – About this Report (continued)
30 JUNE 2018
Net realisable value of inventory
Inventories are carried at the lower of cost and net realisable value. Net realisable value is the estimated selling price in the ordinary course of business less the estimated costs of completion and selling expenses. The estimates take into consideration fluctuations of price or cost directly relating to events occurring after the end of the period to the extent that such events confirm conditions existing at the end of the period. The key assumptions that require the use of management judgment are reviewed half-yearly and these assumptions include the number of lots/units sold per year and the average selling price per lot/unit. If the net realisable value is less than the carrying value of inventory, an impairment loss is recognised in the income statement.
Fair value of derivatives
The fair value of derivatives is determined using closing quoted market prices (where there is an active market) or a suitable pricing model based on discounted cash flow analysis using assumptions supported by observable market rates. Where derivatives are not quoted in an active market their fair value has been determined using (where available) quoted market inputs and other data relevant to assessing the value of the financial instrument, including financial guarantees granted by the Group, estimates of the probability of exercise.
Fair value of financial assets
The Group holds investments in unlisted securities and enters into loans and receivables with associated options that provide for a variety of outcomes including repayment of principal and interest, satisfaction through obtaining interests in equity or property or combinations thereof.
Impairment of goodwill and intangibles with indefinite useful lives
The Group determines whether goodwill and intangibles with indefinite useful lives are impaired at least on an annual basis. This requires an estimation of the recoverable amount of the cash-generating units to which the goodwill and intangibles with indefinite useful lives are allocated. For goodwill this involves value in use calculations which incorporate a number of key estimates and assumptions around cash flows and fair value of investment properties upon which these determine the revenue / cash flows. The assumptions used in the estimations of the recoverable amount and the carrying amount of goodwill and intangibles with indefinite useful lives are discussed in Note 21.
For
per
sona
l use
onl
y

ABACUS PROPERTY GROUP
44
NOTES TO THE FINANCIAL STATEMENTS – Segment Information 30 JUNE 2018
The Group predominately operates in Australia. Following are the Group’s operating segments, which are regularly reviewed by the Chief Operating Decision Maker (“CODM”) to make decisions about resources allocation and to assess performance:
(a) Property Investments: the segment is responsible for the investment in and ownership of commercial, retail, industrial properties and self-storage facilities. This segment also includes the equity accounting of co-investments in property entities not engaged in development and construction projects; and
(b) Property Development: provides secured lending and related property financing solutions and is also responsible for the Group’s investment in joint venture developments and construction projects, which includes revenue from debt and equity investments in joint ventures.
Segment result includes transactions between operating segments which are then eliminated.
The Group has consolidated the Abacus Hospitality Fund and Abacus Wodonga Land Fund. The performances of these entities which are operated as externally managed investment schemes are considered to be non-core segments and are reviewed separately to that of the performance of the Group’s business segments.
* The operating segments reported by the Group have changed from the prior year. Accordingly, prior year comparatives have been restated to reflect the change.
For
per
sona
l use
onl
y

ABACUS PROPERTY GROUP
45
NOTES TO THE FINANCIAL STATEMENTS – Segment Information (continued) 30 JUNE 2018
Property Total Core
Commercial Storage Developments Unallocated Segments Other Eliminations Consolidated
Year ended 30 June 2018 $'000 $'000 $'000 $'000 $'000 $'000 $'000 $'000
Revenue
Rental income 78,607 73,825 - - 152,432 12 - 152,444
Hotel income - - - - - 26,211 - 26,211
Finance income - - 47,460 - 47,460 5 - 47,465
Management and other fee income 7,888 - - - 7,888 - (3,606) 4,282
Sale of inventory - - 63,821 - 63,821 12,754 - 76,575
Net change in fair value of investment properties derecognised 8,300 6,965 - - 15,265 - - 15,265
Net change in fair value of investments and financial instruments
derecognised 2,318 - 6,686 - 9,004 - - 9,004
Net gain on sale of property, plant & equipment - 2,039 - - 2,039 - - 2,039
Net change in investment properties and property, plant & equipment
held at balance date 18,410 42,314 - - 60,724 - - 60,724
Net change in fair value of derivatives - - - 730 730 - - 730
Share of profit from equity accounted investments ^ 42,849 - 30,900 - 73,749 - - 73,749
Other income 4,111 - 136 - 4,247 32 - 4,279
Other unallocated revenue - - - 295 295 645 - 940
Total consolidated revenue 162,483 125,143 149,003 1,025 437,654 39,659 (3,606) 473,707
Property expenses and outgoings (19,568) (26,976) - - (46,544) (222) - (46,766)
Hotel expenses - - - - - (20,491) - (20,491)
Depreciation and amortisation expense (2,312) (424) - - (2,736) (2,443) - (5,179)
Cost of inventory sales - - (50,388) - (50,388) (9,977) 1,764 (58,601)
Net change in fair value of investments held at balance date 284 (42) (6,605) - (6,363) - - (6,363)
Impairment charges (reversal) - - 2,660 - 2,660 - - 2,660
Administrative and other expenses (21,091) - (9,040) - (30,131) (1,365) (442) (31,938)
Segment result 119,796 97,701 85,630 1,025 304,152 5,161 (2,284) 307,029
Finance costs (30,473) (2,884) 2,099 (31,258)
Profit before tax 273,679 2,277 (185) 275,771
Income tax expense (28,813) - - (28,813)
Net profit for the year 244,866 2,277 (185) 246,958
Less non-controlling interest 12 (3,261) (3,249)
244,878 (984) (185) 243,709
Core Segments Non Core Segments
Property Investments
Net profit for the year attributable to members of the Group
^ includes fair value gain of $4.6 million
For
per
sona
l use
onl
y

ABACUS PROPERTY GROUP
46
NOTES TO THE FINANCIAL STATEMENTS – Segment Information (continued)
30 JUNE 2018
Property Total Core
Commercial Storage Developments Unallocated Segments Other Eliminations Consolidated
Year ended 30 June 2017 $'000 $'000 $'000 $'000 $'000 $'000 $'000 $'000
Revenue
Rental income 71,634 69,687 - - 141,321 9,313 - 150,634
Hotel income - - - - - 30,968 - 30,968
Finance income - - 43,891 - 43,891 4 - 43,895
Management and other fee income 12,620 - - - 12,620 - (7,150) 5,470
Sale of inventory - - - - - 16,192 - 16,192
Net change in fair value of investment properties derecognised 36,775 - - - 36,775 8,492 - 45,267
Net change in fair value of investments and financial instruments
derecognised 11,534 - - - 11,534 493 (4,860) 7,167
Net gain on sale of property, plant & equipment - - - - - 11,077 685 11,762
Net change in investment properties and property, plant & equipment
held at balance date 47,440 27,333 - - 74,773 10,175 - 84,948
Net change in fair value of derivatives - - - 4,317 4,317 141 - 4,458
Share of profit from equity accounted investments ^ 33,557 - 20,716 - 54,273 - - 54,273
Other income 6,102 - 1,057 - 7,159 825 (328) 7,656
Other unallocated revenue - - - 365 365 377 - 742
Total consolidated revenue 219,662 97,020 65,664 4,682 387,028 88,057 (11,653) 463,432
Property expenses and outgoings (15,174) (25,939) - - (41,113) (2,665) 301 (43,477)
Hotel expenses - - - - - (23,415) - (23,415)
Depreciation and amortisation expense (1,872) (406) - - (2,278) (203) - (2,481)
Cost of inventory sales - - - - - (13,490) 2,522 (10,968)
Impairment charges - - (3,000) - (3,000) 3,000 - -
Administrative and other expenses (17,754) - (7,609) - (25,363) (1,549) (2,571) (29,483)
Segment result 184,862 70,675 55,055 4,682 315,274 49,735 (11,401) 353,608
Net change in fair value of investments held at balance date (15,537) (28,015) 27,998 (15,554)
Finance costs (32,898) (7,183) 4,255 (35,826)
Profit before tax 266,839 14,537 20,852 302,228
Income tax expense (7,863) (2,277) - (10,140)
Net profit for the year 258,976 12,260 20,852 292,088
less non-controlling interest (1,044) (5,947) - (6,991)
257,932 6,313 20,852 285,097
Core Segments Non Core Segments
Property Investments
Net profit for the year attributable to members of the Group
^ includes fair value gain of $0.7 million
For
per
sona
l use
onl
y

ABACUS PROPERTY GROUP
47
NOTES TO THE FINANCIAL STATEMENTS – Segment Information (continued) 30 JUNE 2018
Property Property
Investment Development Unallocated Total Other Eliminations Consolidated
As at 30 June 2018 $'000 $'000 $'000 $'000 $'000 $'000 $'000
Current assets 250,106 232,410 96,673 579,189 128,298 (40,510) 666,977
Non-current assets 1,880,362 217,025 41,529 2,138,916 620 (10,896) 2,128,640
Total assets 2,130,468 449,435 138,202 2,718,105 128,918 (51,406) 2,795,617
Current liabilities 25,160 11,468 85,644 122,272 104,170 (70,034) 156,408
Non-current liabilities 942 404 702,218 703,564 7,265 11,678 722,507
Total liabilities 26,102 11,872 787,862 825,836 111,435 (58,356) 878,915
Net assets 2,104,366 437,563 (649,660) 1,892,269 17,483 6,950 1,916,702
Total facilities - bank loans 891,000 - 891,000
Facilities used at reporting date - bank loans (694,970) - (694,970)
Facilities unused at reporting date - bank loans 196,030 - 196,030
As at 30 June 2017 $'000 $'000 $'000 $'000 $'000 $'000 $'000
Current assets 8,000 72,596 49,925 130,521 38,204 - 168,725
Non-current assets 1,823,107 375,686 39,825 2,238,618 87,757 (58,430) 2,267,945
Total assets 1,831,107 448,282 89,750 2,369,139 125,961 (58,430) 2,436,670
Current liabilities 19,354 8,486 6,494 34,334 6,650 - 40,984
Non-current liabilities 1,423 481 552,074 553,978 91,123 (64,036) 581,065
Total liabilities 20,777 8,967 558,568 588,312 97,773 (64,036) 622,049
Net assets 1,810,330 439,315 (468,818) 1,780,827 28,188 5,606 1,814,621
Total facilities - bank loans 873,000 - 873,000
Facilities used at reporting date - bank loans (513,691) - (513,691)
Facilities unused at reporting date - bank loans 359,309 - 359,309
Core Segments Non Core Segments
For
per
sona
l use
onl
y
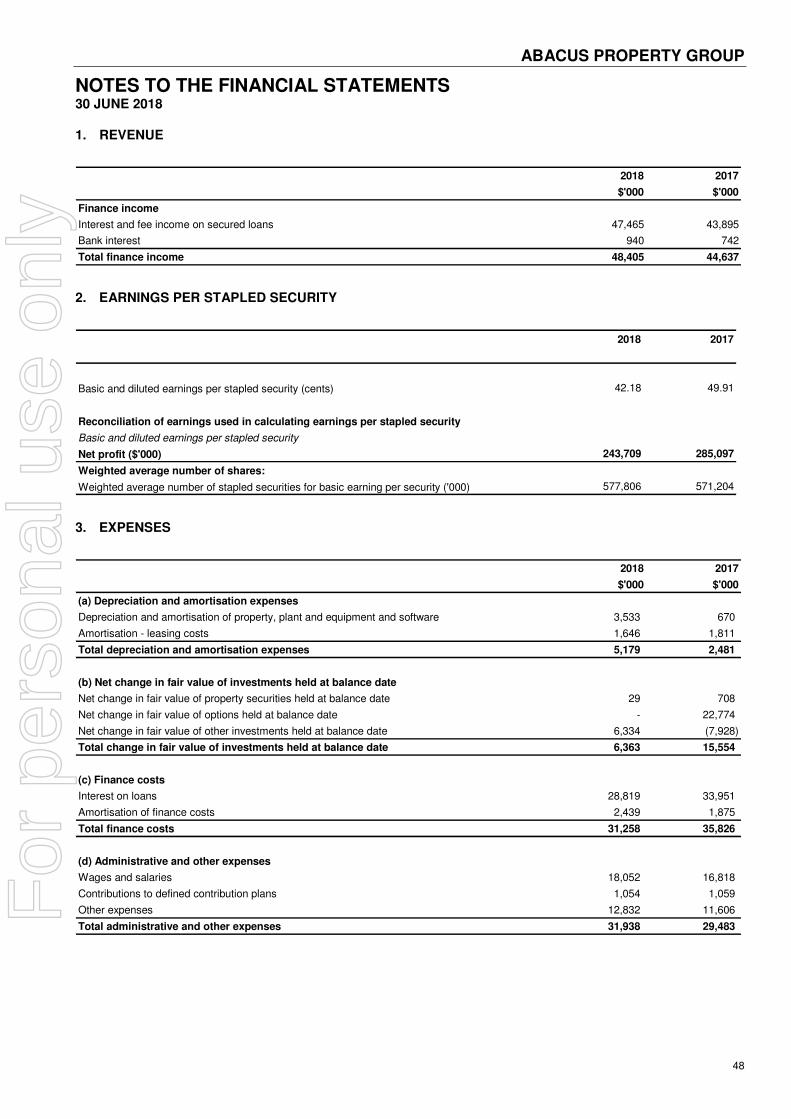
ABACUS PROPERTY GROUP
48
NOTES TO THE FINANCIAL STATEMENTS 30 JUNE 2018
1. REVENUE
2018 2017
$'000 $'000
Finance income
Interest and fee income on secured loans 47,465 43,895
Bank interest 940 742
Total finance income 48,405 44,637
2. EARNINGS PER STAPLED SECURITY
2018 2017
Basic and diluted earnings per stapled security (cents) 42.18 49.91
Reconciliation of earnings used in calculating earnings per stapled security
Basic and diluted earnings per stapled security
Net profit ($'000) 243,709 285,097
Weighted average number of shares:
Weighted average number of stapled securities for basic earning per security ('000) 577,806 571,204
3. EXPENSES
2018 2017
$'000 $'000
(a) Depreciation and amortisation expenses
Depreciation and amortisation of property, plant and equipment and software 3,533 670
Amortisation - leasing costs 1,646 1,811
Total depreciation and amortisation expenses 5,179 2,481
(b) Net change in fair value of investments held at balance date
Net change in fair value of property securities held at balance date 29 708
Net change in fair value of options held at balance date - 22,774
Net change in fair value of other investments held at balance date 6,334 (7,928)
Total change in fair value of investments held at balance date 6,363 15,554
(c) Finance costs
Interest on loans 28,819 33,951
Amortisation of finance costs 2,439 1,875
Total finance costs 31,258 35,826
(d) Administrative and other expenses
Wages and salaries 18,052 16,818
Contributions to defined contribution plans 1,054 1,059
Other expenses 12,832 11,606
Total administrative and other expenses 31,938 29,483
For
per
sona
l use
onl
y

ABACUS PROPERTY GROUP
49
NOTES TO THE FINANCIAL STATEMENTS 30 JUNE 2018
4. INCOME TAX
2018 2017
$'000 $'000
(a) Income tax expense
The major components of income tax expense are:
Income Statement
Current income tax
Current income tax charge 26,989 10,851
Adjustments in respect of current income tax of previous years 1,271 1,209
Deferred income tax
Relating to origination and reversal of temporary differences 553 (1,920)
Income tax expense reported in the income statement 28,813 10,140
(b) Numerical reconciliation between aggregate tax expense recognised in the income statement and tax
expense calculated per the statutory income tax rate
A reconciliation between tax expense and the product of the accounting profit before income tax multiplied by the Group's
applicable income tax rate is as follows:
Profit before income tax expense 275,771 302,228
Prima facie income tax expense calculated at 30% (AU) 81,775 89,176
Prima facie income tax expense calculated at 28% (NZ) 893 833
Less prima facie income tax expense on profit from Trusts (56,327) (80,187)
Prima Facie income tax of entities subject to income tax 26,340 9,822
Adjustment of prior year tax applied 1,271 1,209
Unrecognised tax losses brought to account 7 (400)
Other items (net) 1,195 (491)
Income tax expense reported in the income statement 28,813 10,140
For
per
sona
l use
onl
y

ABACUS PROPERTY GROUP
50
NOTES TO THE FINANCIAL STATEMENTS 30 JUNE 2018
4. INCOME TAX (continued)
2018 2017
$'000 $'000
(c) Recognised deferred tax assets and liabilities
Deferred income tax relates to the following:
Deferred tax liabilities
Revaluation of investment properties at fair value 10,675 8,540
Capital allowances 1,976 1,080
Other 2,209 4,948
Gross deferred income tax liabilities 14,860 14,568
Set off against deferred tax assets (2,642) (4,210)
Net deferred income tax liabilities 12,218 10,358
Deferred tax assets
Revaluation of investments and financial instruments at fair value 6,024 6,451
Provisions - other 1,500 1,500
Provisions - employee entitlements 2,272 2,929
Derecognition of deferred tax asset (losses - AHF) (607) (600)
Losses available for offset against future taxable income 655 682
Other 1,034 202
Gross deferred income tax assets 10,878 11,164
Set off of deferred tax liabilities (2,642) (4,210)
Net deferred income tax assets 8,236 6,954
Tax consolidation
AGHL and its 100% owned Australian resident subsidiaries, ASOL and its 100% owned Australian resident subsidiaries and AHL and its 100% owned Australian resident subsidiaries have formed separate tax consolidated groups. AGHL, ASOL and AHL are the head entity of their respective tax consolidated groups. The head entity and the controlled entities in the tax consolidated group continue to account for their own current and deferred tax amounts. These amounts are measured in a manner that is consistent with the broad principles in AASB 112 Income Taxes. The nature of the tax funding agreements are discussed further below.
Nature of the tax funding agreement
Members of the respective tax consolidated groups have entered into tax funding agreements. The tax funding agreements require payments to/from the head entity to be recognised via an inter-entity receivable (payable) which is at call. To the extent that there is a difference between the amount allocated under the tax funding agreement and the allocation under UIG 1052, the head entity accounts for these as equity transactions.
The amounts receivable or payable under the tax funding agreements are due upon receipt of the funding advice from the head entity, which is issued as soon as practicable after the end of each financial year. The head entity may also require payment of interim funding amounts to assist with its obligations to pay tax instalments.
For
per
sona
l use
onl
y

ABACUS PROPERTY GROUP
51
NOTES TO THE FINANCIAL STATEMENTS 30 JUNE 2018
5. INVESTMENT PROPERTIES
2018 2017
$'000 $'000
Leasehold investment properties 1 12,690 13,592
Freehold investment properties 1,923,310 1,557,931
Total investment properties 1,936,000 1,571,523
1. The carrying amount of the leasehold property is presented gross of the finance liability of $2.7 million (2017: $2.3 million).
2018 2017
$'000 $'000
Investment properties held for sale
Retail 209,606 -
Office - 8,000
Total investment properties held for sale 209,606 8,000
Investment properties
Retail 190,427 377,500
Office 809,284 487,200
Industrial 44,400 55,100
Storage 661,953 625,232
Other 20,330 18,491
Total investment properties 1,726,394 1,563,523
Total investment properties including held for sale 1,936,000 1,571,523
Reconciliation
A reconciliation of the carrying amount of investment properties at the beginning and end of the year is as follows. All investment properties are classified as Level 3 in accordance with the fair value hierarchy outlined in Note 12(d):
2018 2017
Leasehold investment properties $'000 $'000
Carrying amount at beginning of the financial year 13,592 11,092
Net change in fair value as at balance date (902) 2,500
Carrying amount at end of the year 12,690 13,592
2018 2017 2018 2017
Freehold investment properties $'000 $'000 $'000 $'000
Carrying amount at beginning of the financial year 8,000 186,550 1,549,931 1,323,977
Additions - - 297,000 116,951
Capital expenditure - 890 54,126 24,945
Net change in fair value as at balance date - 224 61,627 82,223
Net change in fair value derecognised - 41,929 15,265 3,337
Disposals - (206,672) (57,956) (5,603)
Effect of movements in foreign exchange - - (4,683) (164)
Transfer to inventory - - - (10,656)
Properties transferred to / from held for sale 201,606 (14,921) (201,606) 14,921
Carrying amount at end of the year 209,606 8,000 1,713,704 1,549,931
Non-current
Held for sale Non-current
For
per
sona
l use
onl
y

ABACUS PROPERTY GROUP
52
NOTES TO THE FINANCIAL STATEMENTS 30 JUNE 2018
5. INVESTMENT PROPERTIES (continued)
Investment properties are carried at the Directors’ determination of fair value. The determination of fair value includes reference to the original acquisition cost together with capital expenditure since acquisition and either the latest full independent valuation, latest independent update or directors’ valuation. Total acquisition costs include incidental costs of acquisition such as property taxes on acquisition, legal and professional fees and other acquisition related costs.
Sensitivity Information
Significant input Fair value measurement sensitivity to significant increase in input
Fair value measurement sensitivity to significant decrease in input
Adopted capitalisation rate Decrease Increase
Optimal occupancy Increase Decrease
Adopted discount rate Decrease Increase
The adopted capitalisation rate forms part of the income capitalisation approach.
When calculating the income capitalisation approach, the net market rent has a strong interrelationship with the adopted capitalisation rate given the methodology involves assessing the total net market income receivable from the property and capitalising this in perpetuity to derive a capital value. In theory, an increase in the net market rent and an increase (softening) in the adopted capitalisation rate could potentially offset the impact to the fair value. The same can be said for a decrease in the net market rent and a decrease (tightening) in the adopted capitalisation rate. A directionally opposite change in the net market rent and the adopted capitalisation rate could potentially magnify the impact to the fair value.
The adopted discount rate of a discounted cashflow has a strong interrelationship in deriving at a fair value given the discount rate will determine the rate in which the terminal value is discounted to the present value.
External valuations are conducted by qualified independent valuers who are appointed by the Director of Property who is also responsible for the Group’s internal valuation process. He is assisted by an in-house certified professional valuer who is experienced in valuing the types of properties in the applicable locations.
Investment properties are independently valued on a staggered basis every two years unless the underlying financing requires a different valuation cycle.
The majority of the investment properties are used as security for secured bank debt outlined in Note 11.
Abacus*
The weighted average capitalisation rate for Abacus is 6.62% (2017: 7.13%) and for each significant category above is as follows:
- Retail – 5.76% (2017: 6.22%)
- Office – 6.29% (2017: 6.99%)
- Industrial – 8.44% (2017: 8.42%)
- Storage – 7.45% (2017: 7.72%)
The optimal occupancy rate utilised in the valuation process ranged from 80.0% to 95.0% (2017: 80.0% to 100.0%). The current occupancy rate for the principal portfolio excluding development and self-storage assets is 91.3% (2017: 90.5%). The current occupancy rate for self-storage assets is 89.4% (2017: 89.2%).
During the year ended 30 June 2018, 56% (2017: 44%) of the number of investment properties in the portfolio were subject to external valuations, the remaining 44% (2017: 56%) were subject to internal valuation.
* Excludes Abacus Hospitality Fund. For
per
sona
l use
onl
y

ABACUS PROPERTY GROUP
53
NOTES TO THE FINANCIAL STATEMENTS 30 JUNE 2018
6. INVENTORY
2018 2017
$'000 $'000
(a) Current
Hotel supplies 237 214
Property developments1
- purchase consideration 50,112 876
- development costs 19,161 7,384
- provision (40,962) -
28,548 8,474
(b) Non-current
Property developments1
- purchase consideration 72,803 117,418
- development costs 3,354 22,783
- provision - (43,722)
76,157 96,479
Total inventory 104,705 104,953
1. Inventories are held at the lower of cost and net realisable value.
For
per
sona
l use
onl
y

ABACUS PROPERTY GROUP
54
NOTES TO THE FINANCIAL STATEMENTS 30 JUNE 2018
7. PROPERTY LOANS AND OTHER FINANCIAL ASSETS
2018 2017
$'000 $'000
(a) Current property loans
Secured loans - amortised cost1 154,701 65,034
Interest receivable on secured loans - amortised cost 57,808 7,563
212,509 72,597
(b) Non-current property loans
Secured loans - amortised cost1 110,484 219,379
Interest receivable on secured loans - amortised cost 7,298 54,691
117,782 274,070
(c) Non-current other financial assets
Investment in securities and options - unlisted - fair value 1,329 6,792
Investments in debt instruments - unlisted - amortised cost2 - 22,488
Derivatives - property developments - fair value 6,658 13,263
7,987 42,543
1. Mortgages are secured by real property assets. The current facilities are scheduled to mature and are expected to be realised on or before 30 June 2019 and the non-current facilities will mature between 1 July 2019 and 27 January 2021.
2. Abacus had a 50% investment in a joint venture St Leonards JV Unit Trust held via preference shares which were realised during the year.
For
per
sona
l use
onl
y

ABACUS PROPERTY GROUP
55
NOTES TO THE FINANCIAL STATEMENTS 30 JUNE 2018
8. INVESTMENTS ACCOUNTED FOR USING THE EQUITY METHOD
(a) Extract from joint ventures’ profit and loss statements
2018 2017 2018 2017 2018 2017 2018 2017
$'000 $'000 $'000 $'000 $'000 $'000 $'000 $'000
Revenue 23,722 9,646 192,389 20 557,993 478,570 774,104 488,236
Expenses (10,699) (14,152) (161,082) (1,751) (482,296) (350,060) (654,077) (365,963)
Net profit / (loss) 13,023 (4,506) 31,307 (1,731) 75,697 128,510 120,027 122,273
Share of net profit / (loss) 8,659 (2,253) 15,403 (852) 49,687 57,378 73,749 54,273
TotalOther Joint VenturesFordtrans Pty Ltd* Merivale Pty Ltd
* Included in the net profit of Fordtrans Pty Ltd for the year ended 30 June 2018: interest income $1.4 million (2017: $1.9 million) and interest expense $2.9 million (2017: $2.8 million).
(b) Extract from joint ventures’ balance sheets
2018 2017 2018 2017 2018 2017 2018 2017
$'000 $'000 $'000 $'000 $'000 $'000 $'000 $'000
Current assets 1,073 15,436 95,677 1,085 70,800 100,316 167,550 116,837
Non-current assets 215,214 183,031 - 119,359 243,328 547,362 458,542 849,752
216,287 198,467 95,677 120,444 314,128 647,678 626,092 966,589
Current liabilities (18,128) (3,265) (1,745) (157) (156,147) (83,010) (176,020) (86,432)
Non-current liabilities (64,800) (64,800) - (59,401) (22,372) (347,411) (87,172) (471,612)
Net assets 133,359 130,402 93,932 60,886 135,609 217,257 362,900 408,545
Share of net assets 66,679 65,201 45,625 27,490 42,586 74,557 154,890 167,248
Fordtrans Pty Ltd* Other Joint Ventures TotalMerivale Pty Ltd
* Included in the net assets of Fordtrans Pty Ltd as at 30 June 2018: cash and cash equivalents $0.3 million (2017: $0.7 million), current interest bearing loans and borrowings $Nil (2017: $Nil) and non-current interest bearing loans and borrowings $64.8 million (2017: $64.8 million).
There were no impairment losses or contingent liabilities relating to the investment in the joint ventures.
1. Fordtrans Pty Ltd (Virginia Park) (“VP”)
Abacus has a 50% interest in the ownership and voting rights of Fordtrans Pty Ltd. VP’s principal place of business is in Bentleigh East, Victoria.
VP owns a sizeable Business Park providing a mixture of industrial and office buildings as well as supporting facilities including gymnasium, swim centre, child care centre, children’s play centre and cafe. Abacus jointly controls the venture with the other partner under the terms of Unitholders Agreement and requires unanimous consent for all major decisions over the relevant activities.
Abacus’ share of distributions (including capital distributions) for the year ended 30 June 2018 was $7.2 million (2017: $2.0 million).
2. Merivale Pty Ltd (Ivy & Eve)
Abacus has a 49.2% interest in the ownership and voting rights of Merivale Pty Ltd. Merivale’s principal place of business is in South Brisbane.
Merivale Pty Ltd owns a residential development in Merivale Street, South Brisbane, Queenland. The development consists of two 30 storey residential towers, Ivy and Eve accommodating 472 one, two and three bedroom apartments overlooking the Brisbane River and CBD. Abacus jointly controls the venture with the other partners under the terms of Unitholders Agreement and requires major consent for all major decisions over the relevant activities.
Abacus did not receive any distributions during the year ended 30 June 2018 (2017: $Nil).
For
per
sona
l use
onl
y

ABACUS PROPERTY GROUP
56
NOTES TO THE FINANCIAL STATEMENTS 30 JUNE 2018
9. CASH AND CASH EQUIVALENTS
2018 2017
$'000 $'000
Reconciliation to Statement of Cash Flow
For the purposes of the Statement of Cash Flow, cash and cash equivalents comprise the following at 30 June 2018
Cash at bank and in hand1 103,256 56,267
1. Cash at bank earns interest at floating rates. The carrying amounts of cash and cash equivalents represent fair value.
Net profit 246,958 292,088
Adjustments for:
Depreciation and amortisation of non-current assets 5,179 2,481
Net change in fair value of derivatives (730) (4,458)
Net change in fair value of investment properties held at balance date (60,724) (84,948)
Net change in fair value of investments held at balance date 6,363 15,554
Net change in fair value of investment properties derecognised (15,265) (45,267)
Net change in fair value of investment and financial instruments derecognised (9,004) (7,167)
Net (gain) / loss on disposal of property, plant and equipment (2,039) (11,762)
Share of profit from equity accounted investments (73,749) (54,273)
Increase / (decrease) in payables 23,476 15,617
(Increase) / decrease in inventories 1,524 (22,043)
(Increase) / decrease in receivables and other assets 72,277 20,388
Net cash from operating activities 194,266 116,210
(a) Disclosure of financing facilities
Refer to Note 11.
(b) Disclosure of non-cash financing facilities
Non-cash financing activities include capital raised pursuant to the Abacus distribution reinvestment plan. During the year 3.79 million (2017: 13.35 million) stapled securities were issued with a cash equivalent of $12.1 million (2017: $40.0 million).
For
per
sona
l use
onl
y

ABACUS PROPERTY GROUP
57
NOTES TO THE FINANCIAL STATEMENTS 30 JUNE 2018
10. CAPITAL MANAGEMENT
Abacus
Abacus seeks to manage its capital requirements through a mix of debt and equity funding. It also ensures that Group entities comply with capital and distribution requirements of their constitutions and/or trust deeds, the capital requirements of relevant regulatory authorities and continue to operate as a going concern. Abacus also protects its equity in assets by taking out insurance.
Abacus assesses the adequacy of its capital requirements, cost of capital and gearing (i.e. debt/equity mix) as part of its broader strategic plan. In addition to tracking actual against budgeted performance, Abacus reviews its capital structure to ensure sufficient funds and financing facilities (on a cost effective basis) are available to implement its strategy, that adequate financing facilities are maintained and distributions to members are made within the stated distribution guidance (i.e. paid out of underlying profits).
The following strategies are available to the Group to manage its capital: issuing new stapled securities, its distribution reinvestment plan, electing to have the distribution reinvestment plan underwritten, adjusting the amount of distributions paid to members, activating a security buyback program, divesting assets, active management of its fixed rate swaps and collars, directly purchasing assets in managed funds and joint ventures, or (where practical) recalibrating the timing of transactions and capital expenditure so as to avoid a concentration of net cash outflows.
Abacus has a total gearing covenant as a condition of the current $480m Syndicated facility and the $11m Bilateral facility. The total gearing covenant requires Abacus to have total liabilities (net of cash) to be less than or equal to 50% of total tangible assets (net of cash). As at date of reporting period, Abacus was compliant in meeting all its debt covenants.
Consolidated Funds
The Capital Management approach and strategies employed by the Group are also deployed for the funds Abacus manages and which are consolidated in these accounts – AHF and AWLF (or the Consolidated Funds).
Points unique to the capital management of these respective funds are:
- The Consolidated Funds via their responsible entities comply with capital and distribution requirements of their constitutions and/or deeds, the capital requirements of relevant regulatory authorities and continue to operate as going concerns; and
- There is currently no Distribution Reinvestment Plan for any of the Funds.
For
per
sona
l use
onl
y

ABACUS PROPERTY GROUP
58
NOTES TO THE FINANCIAL STATEMENTS 30 JUNE 2018
11. INTEREST BEARING LOANS AND BORROWINGS
2018 2017
$'000 $'000
Other
Current
Other loans - A$ 38,765 -
(a) Total current 38,765 -
2018 2017
$'000 $'000
Abacus*
Non-current
Bank loans - A$ 624,636 440,657
Bank loans - A$ value of NZ$ denominated loan 70,334 73,033
Other loans - A$ - 37,426
Less: Unamortised borrowing costs (1,228) (1,932)
(b) Total non-current 693,742 549,184
* Excludes Abacus Hospitality Fund and Abacus Wodonga Land Fund.
2018 2017
$'000 $'000
(c) Maturity profile of current and non-current interest bearing loans
Due within one year 38,765 -
Due between one and five years 413,742 419,184
Due after five years 280,000 130,000
732,507 549,184
For
per
sona
l use
onl
y

ABACUS PROPERTY GROUP
59
NOTES TO THE FINANCIAL STATEMENTS 30 JUNE 2018
11. INTEREST BEARING LOANS AND BORROWINGS (continued)
Abacus*
Abacus maintains a range of interest-bearing loans and borrowings. The sources of funding are spread over a number of counterparties and the terms of the instruments are negotiated to achieve a balance between capital availability and cost of debt.
Bank loans are $A and $NZ denominated and are provided by several banks at interest rates which are set periodically on a floating basis. The loans term to maturity varies from July 2019 to July 2024. The bank loans are secured by charges over the investment properties, certain inventory and certain property, plant and equipment.
Approximately 41.7% (2017: 48.6%) of bank debt drawn was subject to fixed rate hedges with a weighted average term to maturity of 3.8 years (2017: 3.4 years). Hedge cover as a percentage of available facilities at 30 June 2018 is 32.6% (2017: 28.6%).
Abacus’ weighted average interest rate as at 30 June 2018 was 4.27% (2017: 5.23%). Line fees on undrawn facilities contributed to 0.40% of the weighted average interest rate at 30 June 2018 (2017: 0.36%). Abacus’ weighted average interest rate excluding the undrawn facilities line fees as at 30 June 2018 was 3.87% (2017: 4.87%).
* Excludes Abacus Hospitality Fund.
(d) Assets pledged as security
The carrying amounts of assets pledged as security for current and non-current interest bearing liabilities are:
2018 2017
$'000 $'000
Current
First mortgage
Investment properties held for sale 162,948 8,000
Total current assets pledged as security 162,948 8,000
Non-current
First mortgage
Inventory 12,481 36,231
Investment properties 1,636,334 1,524,431
Total non-current assets pledged as security 1,648,815 1,560,662
Total assets pledged as security 1,811,763 1,568,662
For
per
sona
l use
onl
y

ABACUS PROPERTY GROUP
60
NOTES TO THE FINANCIAL STATEMENTS 30 JUNE 2018
12. FINANCIAL INSTRUMENTS
Financial Risk Management
The risks arising from the use of the Group’s financial instruments are credit risk, liquidity risk and market risk (interest rate risk, price risk and foreign currency risk).
The Group’s financial risk management focuses on mitigating the unpredictability of the financial markets and its impact on the financial performance of the Group. The Board reviews and agrees policies for managing each of these risks, which are summarised below.
Primary responsibility for identification and control of financial risks rests with the Treasury Management Committee under the authority of the Board. The Board reviews and agrees policies for managing each of the risks identified below, including the setting of limits for trading in derivatives, hedging cover of interest rate risks and cash flow forecast projections.
The main purpose of the financial instruments used by the Group is to raise finance for the Group’s operations. The Group has various other financial assets and liabilities such as trade receivables and trade payables, which arise directly from its operations. The Group also enters into derivative transactions principally interest rate derivatives. The purpose is to manage the interest rate exposure arising from the Group’s operations and its sources of finance.
Details of the significant accounting policies and methods adopted, including the criteria for recognition, the basis of measurement and the basis on which income and expenses are recognised, in respect of each class of financial asset, financial liability and equity instruments are disclosed in the section about this report and Note 22 to the financial statements.
(a) Credit risk
Credit risk is the risk of financial loss to the Group if a customer or counterparty to a financial instrument fails to meet its contractual obligations, and arises principally from the Group’s receivables from customers, investment in securities and options, secured property loans and interest bearing loans and derivatives with banks.
The Group manages its exposure to risk by:
- derivative counterparties and cash transactions are limited to high credit quality financial institutions;
- policy which limits the amount of credit exposure to any one financial institution;
- providing loans as an investment into joint ventures, associates, related parties and third parties where it is satisfied with the underlying property exposure within that entity;
- regularly monitoring loans and receivables balances on an ongoing basis;
- regularly monitoring the performance of its associates, joint ventures, related parties and third parties on an ongoing basis; and
- obtaining collateral as security (where required or appropriate).
The Group’s credit risk is predominately driven by its Property Developments business which provides loans to third parties, those using the funds for property development and / or investment. The Group mitigates the exposure to this risk by evaluation of the application before acceptance. The analysis will specifically focus on:
- the Loan Valuation Ratio (LVR) at drawdown;
- mortgage ranking;
- background of the developer (borrower) including previous developments;
- background of the owner (borrower) including previous investment track record;
- that the terms and conditions of higher ranking mortgages are acceptable to the Group;
- appropriate property insurances are in place with a copy provided to the Group; and
- market analysis of the completed development being used to service drawdown.
The Group also mitigates this risk by ensuring adequate security is obtained and timely monitoring of the financial instrument to identify any potential adverse changes in the credit quality.
For
per
sona
l use
onl
y

ABACUS PROPERTY GROUP
61
NOTES TO THE FINANCIAL STATEMENTS 30 JUNE 2018
12. FINANCIAL INSTRUMENTS (continued)
(a) Credit risk (continued)
Credit risk exposures
The Group’s maximum exposure to credit risk at the reporting date was:
2018 2017
$'000 $'000
Receivables 21,145 18,457
Secured property loans 330,291 346,667
Other financial assets 7,987 42,543
Cash and cash equivalents 103,256 56,267
462,679 463,934
Carrying Amount
As at 30 June 2018, the Group had the following concentrations of credit risk:
- Secured property loans: cross-collateralised loans which were secured by two large developments at Riverlands and Camellia and other small developments collectively represent 56% (2017: 48%) of the portfolio.
Secured property loans
The Group has a total investment of $330.3 million in secured property loans as at 30 June 2018 (2017: $346.7 million). Of these loans $76.0 million has been renewed / extended beyond the original term on commercial terms (2017 $64.5 million).
There was no movement in the allowance for impairment in respect of secured property loans and receivables during the year where no loans are past due and not impaired.
For
per
sona
l use
onl
y

ABACUS PROPERTY GROUP
62
NOTES TO THE FINANCIAL STATEMENTS 30 JUNE 2018
12. FINANCIAL INSTRUMENTS (continued)
(b) Liquidity Risk
Prudent liquidity risk management implies maintaining sufficient cash and marketable securities, the availability of funding through an adequate and diverse amount of committed credit facilities, the ability to close out market positions and the flexibility to raise funds through the issue of new stapled securities or the distribution reinvestment plan.
The Group’s policy is to maintain an available loan facility with banks sufficient to meet expected operational expenses and to finance investment acquisitions for a period of 90 days, including the servicing of financial obligations. Current loan facilities are assessed and extended for a maximum period based on the Group’s expectations of future interest and market conditions.
The table below shows an analysis of the contractual maturities of key liabilities which forms part of the Group’s assessment of liquidity risk.
Carrying
Amount
Contractual
cash flows
1 Year or
less
Over 1 year
to 5 years
Over
5 years
30 June 2018 $'000 $'000 $'000 $'000 $'000
Liabilities
Trade and other payables 88,568 88,568 88,568 - -
Interest bearing loans and borrowings incl derivatives# 745,415 863,123 73,285 503,225 286,613
Total liabilities 833,983 951,691 161,853 503,225 286,613
Carrying
Amount
Contractual
cash flows
1 Year or
less
Over 1 year
to 5 years
Over
5 years
30 June 2017 $'000 $'000 $'000 $'000 $'000
Liabilities
Trade and other payables 27,865 27,865 27,865 - -
Interest bearing loans and borrowings incl derivatives# 571,467 655,906 32,704 493,132 130,070
Total liabilities 599,332 683,771 60,569 493,132 130,070
# Carrying amount includes fair value of derivative liabilities. Contractual cash flows includes contracted debt and net swap payments using prevailing forward rates
(c) Market Risk
Market risk is the risk that changes in market prices, such as foreign exchange rates, interest rates and equity prices will affect the Group’s income or the value of its holdings of financial instruments. The objective of market risk management is to manage and control market risk exposures within acceptable parameters, while optimising the return.
Interest rate risk / Fair value interest rate risk
The Group’s exposure to the risk of changes in market interest rates relates primarily to its long-term bank debt obligations which are based on floating interest rates. The Group has a policy to maintain a mix of floating exposure and fixed interest rate hedging with fixed rate cover highest in years 1 to 5.
The Group hedges to minimise interest rate risk by entering variable to fixed interest rate swaps which also helps deliver interest covenant compliance and positive carry (net rental income in excess of interest expense) on the property portfolio. Interest rate swaps have the economic effect of converting borrowings from variable rates to fixed rates. Under the interest rate swaps, the Group agrees to exchange, at specified intervals, the difference between fixed and variable rate interest amounts calculated by reference to the agreed notional principal amounts. At 30 June 2018, after taking into account the effect of interest rate swaps, approximately 41.7% (2017: 48.6%) of the Group’s drawn debt is subject to fixed rate hedges. Hedge cover as a percentage of available facilities at 30 June 2018 is 32.6% (2017: 28.6%). As the Group holds interest rate swaps against its variable rate debt there is a risk that the economic value of a financial instrument will fluctuate because of changes in market interest rates.
For
per
sona
l use
onl
y

ABACUS PROPERTY GROUP
63
NOTES TO THE FINANCIAL STATEMENTS 30 JUNE 2018
12. FINANCIAL INSTRUMENTS (continued)
(c) Market Risk (continued)
Interest rate risk / Fair value interest rate risk (continued)
The Group’s exposure to interest rate risk and the effective weighted average interest rates for each class of financial asset and financial liability are:
Abacus^
Floating
interest rate
Fixed interest
less than
1 year
Fixed interest
1 to 5 years
Fixed interest
over 5 years
Non interest
bearing Total
30 June 2018 $'000 $'000 $'000 $'000 $'000 $'000
Financial Assets
Cash and cash equivalents 73,262 - - - - 73,262
Receivables - - - - 20,133 20,133
Secured loans - 262,976 67,537 - - 330,513
Total financial assets 73,262 262,976 67,537 - 20,133 423,908
Weighted average interest rate* 1.60% 10.91% 9.96%
Financial liabilities
Interest bearing liabilities - bank 694,970 - - - - 694,970
Interest bearing liabilities - other - 12,078 - - - 12,078
Derivatives - - - - 12,908 12,908
Payables - - - - 82,099 82,099
Total financial liabilities 694,970 12,078 - - 95,007 802,055
Notional principal swap balance
maturities* - 110,000 180,000 - - 290,000
Weighted average interest rate on
drawn bank debt* 4.27%
Floating
interest rate
Fixed interest
less than
1 year
Fixed interest
1 to 5 years
Fixed interest
over 5 years
Non interest
bearing Total
30 June 2017 $'000 $'000 $'000 $'000 $'000 $'000
Financial Assets
Cash and cash equivalents 27,638 - - - - 27,638
Receivables - - - - 17,531 17,531
Secured loans - 93,148 253,518 - - 346,666
Derivatives - - - - 1,667 1,667
Total financial assets 27,638 93,148 253,518 - 19,198 393,502
Weighted average interest rate* 1.60% 8.41% 11.27%
Financial liabilities
Interest bearing liabilities - bank 513,691 - - - - 513,691
Interest bearing liabilities - other - - 11,525 - - 11,525
Derivatives - - - - 22,283 22,283
Payables - - - - 21,653 21,653
Total financial liabilities 513,691 - 11,525 - 43,936 569,152
Notional principal swap balance
maturities* - 130,000 119,500 - - 249,500
Weighted average interest rate on
drawn bank debt* 5.23%
* calculated at 30 June ^ excludes Abacus Hospitality Fund and Abacus Wodonga Land Fund
For
per
sona
l use
onl
y

ABACUS PROPERTY GROUP
64
NOTES TO THE FINANCIAL STATEMENTS 30 JUNE 2018
12. FINANCIAL INSTRUMENTS (continued)
(c) Market Risk (continued)
Interest rate risk / Fair value interest rate risk (continued)
Other^
Floating
interest rate
Fixed interest
less than
1 year
Fixed interest
1 to 5 years
Fixed interest
over 5 years
Non interest
bearing Total
30 June 2018 $'000 $'000 $'000 $'000 $'000 $'000
Financial Assets
Cash and cash equivalents 29,994 - - - - 29,994
Receivables - - - - 1,012 1,012
Total financial assets 29,994 - - - 1,012 31,006
Weighted average interest rate* 1.60%
Financial liabilities
Payables - - - - 6,469 6,469
Total financial liabilities - - - - 6,469 6,469
Floating
interest rate
Fixed interest
less than
1 year
Fixed interest
1 to 5 years
Fixed interest
over 5 years
Non interest
bearing Total
30 June 2017 $'000 $'000 $'000 $'000 $'000 $'000
Financial Assets
Cash and cash equivalents 28,650 - - - - 28,650
Receivables - - - - 926 926
Total financial assets 28,650 - - - 926 29,576
Weighted average interest rate* 1.60%
Financial liabilities
Payables - - - - 6,212 6,212
Total financial liabilities - - - - 6,212 6,212
* calculated at 30 June ^ Includes Abacus Hospitality Fund and Abacus Wodonga Land Fund
For
per
sona
l use
onl
y

ABACUS PROPERTY GROUP
65
NOTES TO THE FINANCIAL STATEMENTS 30 JUNE 2018
12. FINANCIAL INSTRUMENTS (continued)
(c) Market Risk (continued)
Interest rate risk / Fair value interest rate risk (continued)
The following table is a summary of the interest rate sensitivity analysis:
Floating Profit Equity Profit Equity
30 June 2018 $'000 $'000 $'000 $'000 $'000
Financial assets 103,256 (1,033) - 1,033 -
Financial liabilities 719,956 (1,400) - 1,294 -
Floating Profit Equity Profit Equity
30 June 2017 $'000 $'000 $'000 $'000 $'000
Financial assets 56,267 (562) - 562 -
Financial liabilities 547,499 (3,828) - 3,558 -
Carrying amount -1% +1%
AUD
Carrying amount -1% +1%
AUD
The analysis for the interest rate sensitivity of financial liabilities includes derivatives.
For
per
sona
l use
onl
y

ABACUS PROPERTY GROUP
66
NOTES TO THE FINANCIAL STATEMENTS 30 JUNE 2018
12. FINANCIAL INSTRUMENTS (continued)
(d) Fair values
The fair value of the Group’s financial assets and liabilities are approximately equal to that of their carrying values.
Class of assets /
liabilities
Fair value
hierarchy Valuation technique Inputs used to measure fair value
Investment properties Level 3 Discounted Cash Flow ("DCF") and
Income capitalisation method
Adopted capitalisation rate
Optimal occupancy
Adopted discount rate
Property, plant and
equipment
Level 3 Income capitalisation method Net market EBITDA
Optimal occupancy
Adopted capitalisation rate
Derivative - project
entitlement
Level 3 Residual cash flow analysis Project cash flow forecast
Project payment priorities
Securities and options
- unlisted
Level 3 Pricing models Security price
Underlying net asset
Property valuations
Derivative - financial
instruments
Level 2 DCF (adjusted for counterparty credit
worthiness)
Interest rates
Consumer Price Index ("CPI")
Volatility
Level 1 Quoted prices (unadjusted) in active market for identical assets or liabilities;
Level 2 Inputs other than quoted prices included in level 1 that are observable for the asset or liability, either directly (i.e. as prices) or indirectly (i.e. derived from prices); and
Level 3 Inputs for the asset or liability that are not based on observable market data.
There were no transfers between Levels 1, 2 and 3 during the period.
Income capitalisation method This method involves assessing the total net market income receivable from the property and capitalising this in perpetuity to derive a capital value, with allowances for capital expenditure reversions.
Discounted cash flow method Under the DCF method, the fair value is estimated using explicit assumptions regarding the benefits and liabilities of ownership over the assets’ or liabilities’ life including an exit or terminal value. The DCF method involves the projection of a series of cash flows from the assets or liabilities. To this projected cash flow series, an appropriate, market-derived discount rate is applied to establish the present value of the cash flow stream associated with the assets or liabilities.
Residual cash flow analysis The analysis takes into account the time value of money in a more detailed way than simply a developer’s profit margin as it considers the timing of all costs and income associated with the project.
Pricing models – unlisted securities
The fair value is determined by reference to the net assets which approximates fair value of the underlying entities.
Pricing models – options The fair value is determined using generally accepted pricing models including Black-Scholes and adjusted for specific features of the options including share price, underlying net assets and property valuations and prevailing exchange rates.
For
per
sona
l use
onl
y

ABACUS PROPERTY GROUP
67
NOTES TO THE FINANCIAL STATEMENTS 30 JUNE 2018
12. FINANCIAL INSTRUMENTS (continued)
(d) Fair values (continued)
The following table is a reconciliation of the movements in derivatives (property developments), unlisted securities and options classified as Level 3 for the year ended 30 June 2018.
Derivatives -
property
developments
Unlisted
securities/
options
Total
$'000 $'000 $'000
Opening balance as at 30 June 2017 13,263 6,792 20,055
Fair value movement through the income statement (6,605) (29) (6,634)
Disposals - (5,434) (5,434)
Closing balance as at 30 June 2018 6,658 1,329 7,987
Derivatives -
property
developments
Unlisted
securities/
options
Total
$'000 $'000 $'000
Opening balance as at 30 June 2016 4,007 22,774 26,781
Fair value movement through the income statement 9,256 (23,482) (14,226)
Additions - 7,500 7,500
Closing balance as at 30 June 2017 13,263 6,792 20,055
Sensitivity of Level 3 – derivatives - property developments
The potential effect of using reasonable possible alternative assumptions based on a change in the underlying property developments’ returns by 5% would have the effect of reducing the fair value by up to $0.3 million (2017: $0.7 million) or increase the fair value by $0.3 million (2017: $0.7 million).
Sensitivity of Level 3 – unlisted securities and options
The potential effect of using reasonable possible alternative assumptions based on a change in the property valuations by 5% would have the effect of reducing the fair value by up to $0.1 million (2017: $0.8 million) or increase the fair value by $0.1 million (2017: $0.8 million).
13. CONTRIBUTED EQUITY
2018 2017
(a) Issued stapled securities $'000 $'000
Stapled securities 1,635,046 1,622,897
Issue costs (40,058) (41,741)
Total contributed equity 1,594,988 1,581,156
Number Number
(b) Movement in stapled securities on issue '000 '000
At beginning of financial year 575,570 556,577
- equity raisings - 5,642
- distribution reinvestment plan 3,793 13,351
Securities on issue at end of financial year 579,363 575,570
Stapled securities
For
per
sona
l use
onl
y

ABACUS PROPERTY GROUP
68
NOTES TO THE FINANCIAL STATEMENTS 30 JUNE 2018
14. DISTRIBUTIONS PAID AND PROPOSED
2018 2017
Abacus $'000 $'000
(a) Distributions paid during the year
June 2017 half: 8.75 cents per stapled security (2016: 8.50 cents) 50,362 47,309
December 2017 half: 9.00 cents per stapled security (2016: 8.75 cents) 51,975 50,486
(b) Distributions proposed and recognised as a liability^
June 2018 half: 9.00 cents per stapled security (2017: 8.75 cents) 52,143 50,362
Distributions were paid from Abacus Trust, Abacus Income Trust and Abacus Storage Property Trust (which do not pay tax provided they distribute all their taxable income) hence, there were no franking credits attached.
^ The final distribution of 9.00 cents per stapled security was declared on 21 June 2018. The distribution being paid on or around 31 August 2018 will be approximately $52.1 million.
2018 2017
Non-core funds $'000 $'000
(a) Distributions paid during the year
Abacus Hospitality Fund 1,471 1,349
Abacus Diversified Income Fund II - 5,052
1,471 6,401
(b) Distributions proposed
Abacus Hospitality Fund - not recognised 368 368
The total amount of franking credits available for the subsequent financial years including franking credits that will arise from the payment of income tax payable at the end of the financial year, based on a tax rate of 30 per cent, is $62 million (2017: $35 million).
For
per
sona
l use
onl
y

ABACUS PROPERTY GROUP
69
NOTES TO THE FINANCIAL STATEMENTS 30 JUNE 2018
15. PARENT ENTITY FINANCIAL INFORMATION
2018 2017
$'000 $'000
Results of the parent entity
Profit / (Loss) for the year 6,388 (9,871)
Total comprehensive expense for the year 6,388 (9,871)
Financial position of the parent entity at year end
Current assets 35,551 1,512
Total assets 353,113 336,195
Current liabilities 29,931 146
Total liabilities 74,256 62,566
Net assets 278,857 273,629
Total equity of the parent entity comprising of:
Issued capital 348,331 347,011
Accumulated losses (73,488) (79,875)
Employee options reserve 4,014 6,493
Total equity 278,857 273,629
(a) Parent entity contingencies
As at 30 June 2018, the parent entity has entered into, or still bound by, the following agreements:
- Act as guarantor for borrowings for certain joint venture arrangements to a guarantee limit of $3.5 million (30 June 2017: $18.5 million). No property security has been provided by the parent.
(b) Parent entity capital commitments
There are no capital commitments of the parent entity as at 30 June 2018 (2017: Nil).
For
per
sona
l use
onl
y

ABACUS PROPERTY GROUP
70
NOTES TO THE FINANCIAL STATEMENTS 30 JUNE 2018
16. PROPERTY, PLANT AND EQUIPMENT
The following table is a reconciliation of the movements of property, plant and equipment for the year ended 30 June 2018.
2018 2017
$'000 $'000
Property, plant and equipment held for sale
Current
Hotel property 88,500 -
Total current property, plant and equipment held for sale 88,500 -
Non-current
Hotel property - 80,000
Storage properties 3,848 4,226
Office equipment / furniture and fittings 952 508
Total non-current property, plant and equipment 4,800 84,734
Total property, plant and equipment including held for sale 93,300 84,734
The hotel property held for sale is measured at the lower of their carrying amount and fair value less costs to sell.
2018 2017
$'000 $'000
Land and buildings
At the beginning of the year net of accumulated depreciation 71,828 121,411
Additions 109 99
Fair value movement through comprehensive income 10,052 12,282
Disposal - (61,964)
Depreciation charge for the year (921) -
At the end of the year net of accumulated depreciation 81,068 71,828
Gross value 91,300 81,139
Accumulated depreciation (10,232) (9,311)
Net carrying amount at end of the year 81,068 71,828
Plant and equipment
Gross value 33,155 31,546
Accumulated depreciation (20,923) (18,640)
Net carrying amount at end of the year 12,232 12,906
Total 93,300 84,734
If property, plant and equipment was carried under the cost model, the carrying amount would be $63.5 million (2017: $62.7 million).
For
per
sona
l use
onl
y

ABACUS PROPERTY GROUP
71
NOTES TO THE FINANCIAL STATEMENTS 30 JUNE 2018
17. COMMITMENTS AND CONTINGENCIES
Abacus
(a) Operating lease commitments – Group as lessee
The Group has entered into a commercial lease on its offices. The lease has a term of five years with an option to renew for another five years.
Future minimum rentals payable under non-cancellable operating leases as at 30 June 2018 are as follows:
2018 2017
$'000 $'000
Within one year 1,034 1,030
After one year but not more than five years 3,357 3,227
More than five years - 1,163
4,391 5,420
(b) Operating lease commitments – Group as lessor
Future minimum rentals receivable under non-cancellable operating leases as at 30 June 2018 are as follows:
2018 2017
$'000 $'000
Within one year 65,911 72,465
After one year but not more than five years 163,353 163,080
More than five years 62,749 76,649
292,013 312,194
These amounts do not include contingent rentals which may become receivable under certain leases on the basis of retail sales in excess of stipulated minimums and, in addition, do not include recovery of outgoings.
(c) Capital and other commitments
At 30 June 2018 the Group had numerous commitments and contingent liabilities which principally related to property acquisition settlements, loan facility guarantees for the Group's interest in the jointly controlled property developments and funds management vehicles, commitments relating to property refurbishing costs and unused mortgage loan facilities to third parties.
Commitments planned and/or contracted at reporting date but not recognised as liabilities are as follows:
2018 2017
$'000 $'000
Within one year
- gross settlement of property acquisitions 15,750 -
- property refurbishment costs 6,574 15,136
- property development costs 19,546 11,176
- unused portion of loan facilities to outside parties 35,694 28,087
77,564 54,399
Contingent liabilities:
Within one year
- corporate guarantee 3,520 18,712
3,520 18,712
For
per
sona
l use
onl
y

ABACUS PROPERTY GROUP
72
NOTES TO THE FINANCIAL STATEMENTS 30 JUNE 2018
18. RELATED PARTY DISCLOSURES
(a) Subsidiaries
The consolidated financial statements include the financial statements of the following entities:
2018 2017
Entity % %
Abacus Group Holdings Limited and its subsidiariesAbacus Castle Hill Trust 100 100
Abacus Cobar Trust 100 100
Abacus Finance Pty Limited 100 100
Abacus Funds Management Limited 100 100
Abacus Griffith Avenue Trust 100 100
Abacus Hampstead Trust 100 -
Abacus Investment Pty Ltd 100 100
Abacus Mortgage Fund 100 100
Abacus Mount Druitt Trust 100 100
Abacus Musswellbrook Pty Ltd 100 100
Abacus Nominee Services Pty Limited 100 100
Abacus Nominees (No 5) Pty Limited 100 100
Abacus Nominees (No 7) Pty Limited 100 100
Abacus Nominees (No 9) Pty Limited 100 100
Abacus Nominees (No 11) Pty Limited 100 -
Abacus Note Facilities Pty Ltd 100 100
Abacus Property Services Pty Ltd 100 100
Abacus SP Note Facility Pty Ltd 100 100
Abacus Storage Funds Management Limited 100 100
Abacus Wodonga Land Commercial Trust 100 100
Amiga Pty Limited 75 75
Fitzroy Street Pty Ltd 100 -
Oasis Staffing Pty Ltd 100 100
Yarradale Developments Trust 100 100
Abacus Hobart Growth Trust 100 100
Abacus Melbat Trust 100 100
Hurstbat Pty Limited 100 100
Villemel Pty Limited 100 100
Abacus Group Projects Limited and its subsidiariesAbacus Property Pty Ltd 100 100
Abacus Allara Street Trust* 50 50
Abacus Repository Trust* 50 50
Abacus Ventures Trust* 51 51
equity interest
* These entities are wholly owned by Abacus
For
per
sona
l use
onl
y

ABACUS PROPERTY GROUP
73
NOTES TO THE FINANCIAL STATEMENTS 30 JUNE 2018
18. RELATED PARTY DISCLOSURES (continued)
(a) Subsidiaries (continued)
2018 2017
Entity % %
Abacus Trust and its subsidiaries:Abacus 1769 Hume Highway Trust 100 100
Abacus Abbotsford Trust 100 -
Abacus AGIT Trust 100 100
Abacus Alderley Trust 100 100
Abacus Ann Street Trust 100 -
Abacus Ashfield Mall Property Trust 100 100
Abacus Australian Aggregation Holding Trust 100 100
Abacus Australis Drive Trust 100 100
Abacus Bacchus Marsh Trust 100 100
Abacus Birkenhead Point Trust - 100
Abacus Bowden Street Trust 100 -
Abacus Browns Road Trust 100 100
Abacus Campbell Property Trust - 100
Abacus Jetstream Trust 100 100
Abacus Liverpool Plaza Trust 100 100
Abacus Lutwyche Trust 100 100
Abacus Macquarie Street Trust 100 100
Abacus Moore Street Trust 100 100
Abacus Northshore Trust 1* 25 25
Abacus Northshore Trust 2* 25 25
Abacus Oasis Trust 100 100
Abacus Premier Parking Trust 100 100
Abacus Sanctuary Holdings Pty Limited* - 24
Abacus Shopping Centre Trust 100 100
Abacus Short Street Trust 100 100
Abacus SP Fund 100 100
Abacus St Leonards Trust 100 100
Abacus Varsity Lakes Trust 100 100
Abacus Virginia Trust 100 100
Abacus Westpac House Trust 100 100
Abacus Westpac House No. 2 Trust 100 100
Abacus WTC Trust 100 100
Abacus 14 Martin Place Trust 100 100
Abacus 324 Queen Street Trust 100 100
Abacus 33 Queen Street Trust 100 100
Abacus 37 Epping Road Trust - 100
Abacus 464 St Kilda Road Trust 100 -
Abacus 710 Collins Street Trust 100 100
444 Queen Street Trust 100 100
Lutwyche City Shopping Centre Unit Trust 100 75
Abacus Income Trust and its subsidiaries:Abacus Brendale Trust 100 -
Abacus Eagle Farm Trust 100 100
Abacus Grant Street Trust 100 100
Abacus Independent Retail Property Trust - 75
Abacus Retail Property Trust 100 100
Abacus Todd Road Trust 100 -
equity interest
* These entities are wholly owned by Abacus
For
per
sona
l use
onl
y

ABACUS PROPERTY GROUP
74
NOTES TO THE FINANCIAL STATEMENTS 30 JUNE 2018
18. RELATED PARTY DISCLOSURES (continued)
(a) Subsidiaries (continued)
2018 2017
Entity % %
Abacus Storage Operations Limited and its subsidiaries:
Abacus Storage NZ Operations Pty Limited 100 100
Abacus Storage Solutions Pty Limited 100 100
Abacus Storage Solutions NZ Pty Limited 100 100
Abacus USI C Trust 100 100
Abacus U Stow It A1 Trust 100 100
Abacus U Stow It B1 Trust 100 100
Abacus U Stow It A2 Trust 100 100
Abacus U Stow It B2 Trust 100 100
U Stow It Holdings Limited 100 100
U Stow It Pty Limited 100 100
Abacus SK Pty Limited 100 -
Abacus Storage Property Trust and its subsidiary:
Abacus Storage NZ Property Trust 100 100
Abacus Hospitality Fund 10 10
Abacus Wodonga Land Fund 15 15
equity interest
Subsidiaries controlled by the Group with material non-controlling interest
(Profit)/loss
Principal allocated to Accumulated
place of % held by NCI NCI
business NCI $'000 $'000
30 June 2018
Abacus Hospitality Fund Australia 90 (5,017) 44,536
Abacus Wodonga Land Fund Australia 85 (2,101) 2,101
30 June 2017
Abacus Hospitality Fund Australia 90 (7,821) 40,840
(b) Ultimate parent
AGHL has been designated as the parent entity of the Group.
(c) Key management personnel
Details of payments are disclosed in Note 19.
For
per
sona
l use
onl
y

ABACUS PROPERTY GROUP
75
NOTES TO THE FINANCIAL STATEMENTS 30 JUNE 2018
18. RELATED PARTY DISCLOSURES (continued)
(d) Transactions with related parties
2018 2017
$'000 $'000
Transactions with related parties other than associates and joint ventures
Revenues
Property management fees received / receivable 206 196
Transactions with associates and joint ventures
Revenues
Management fees received / receivable from joint ventures 3,510 4,316
Revenue received / receivable from joint ventures 82,743 61,186
Other transactions
Loan advanced to joint ventures (13,158) (12,019)
Loan repayments from joint ventures 48,735 18,161
Loan advanced from joint ventures 785 762
Terms and conditions of transactions
Sales and fees to and purchases and fees charged from related parties are made in arm’s length transactions both at normal market prices and on normal commercial terms.
Outstanding balances at year-end are unsecured and settlement occurs in cash.
No provision for doubtful debts has been recognised or bad debts incurred with respect to amounts payable or receivable from related parties during the year.
Entity with significant influence
Calculator Australia Pty Ltd (“Kirsh”) is a significant securityholder in the Group with a holding of approximately 49% of the ordinary securities of the Group (2017: 49%).
During the year, Abacus Property Services Pty Ltd was engaged to manage the following properties:
Property Relationship with Kirsh Charge per annum 2018 2017
$ $
14 Martin Place Tenants-in-common 3% of gross rental 181,422 195,782
4 Martin Place 100% owned by Kirsh 3% of gross rental 206,237 177,492
Mrs Myra Salkinder is a non-executive director of the Group and is a senior executive of Kirsh.
For
per
sona
l use
onl
y

ABACUS PROPERTY GROUP
76
NOTES TO THE FINANCIAL STATEMENTS 30 JUNE 2018
19. KEY MANAGEMENT PERSONNEL
(a) Compensation for key management personnel
2018 2017
$ $
Short-term employee benefits 5,699,461 5,413,023
Post-employment benefits 170,009 203,688
Other long-term benefits 58,562 61,662
Security-based payments 1,842,125 1,090,281
7,770,157 6,768,654
(b) Loans to key management personnel
There were no loans to key management personnel and their related parties at any time in 2018 or in the prior year.
(c) Other transactions and balances with key management personnel and their related parties
During the financial year, transactions occurred between the Group and Key Management Personnel which are within normal employee and investor relationships.
For
per
sona
l use
onl
y

ABACUS PROPERTY GROUP
77
NOTES TO THE FINANCIAL STATEMENTS 30 JUNE 2018
20. SECURITY BASED PAYMENTS
(a) Recognised security payment expenses
The expense recognised for employee services received during the year is as follows:
2018 2017
$'000 $'000
Expense arising from equity-settled payment transactions 3,296 2,062
(b) Type of security – based payment plan
Security Acquisition Rights (SARs)
The deferred variable incentive plan has been designed to align the interests of executives with those of securityholders by providing for a significant portion of the remuneration of participating executives to be linked to the delivery of sustainable underlying profit that covers the distribution level implicit in the Group’s security price.
Key executives have been allocated SARs in the current financial year generally equal to the last current variable incentive paid. Allocations were based on the performance assessment completed in determining current variable incentive awards for the prior financial year, adjusted to take into account other factors that the Board considers specifically relevant to the purpose of providing deferred variable incentives.
The SARs granted during the year vest as follows:
Vesting date Amount Vested* Potential number to vest
September 2018 One quarter of the initial issue 128,456
September 2019 One quarter of the initial issue 128,456
September 2020 One quarter of the initial issue 128,456
September 2021 One quarter of the initial issue 128,456
* The Board is able to claw back unvested SARs if the distribution level fails by more than 10% below the sustainable annual distribution rate
For valuation purposes the SARs are equivalent to European call options (in that they may be “exercised” only at their maturity (i.e. vesting date)). The fair value of the SARs granted is estimated at the date of the grant using a trinomial tree model (using 500 steps) cross checked by a modified Black-Scholes model. The trinomial tree model and the Black-Scholes model generally produce the same values for an option over a non-dividend paying share, or where the option is entitled to the same distributions as are paid on the underlying security, as is assumed in this case, and if the time to exercise is the same, (i.e. at the end of the term).
When SARs vest they will convert into ABP securities on a one for one basis or at the Board’s discretion a cash equivalent amount will be paid.
For
per
sona
l use
onl
y

ABACUS PROPERTY GROUP
78
NOTES TO THE FINANCIAL STATEMENTS 30 JUNE 2018
20. SECURITY BASED PAYMENTS (continued)
(c) Summary of SARs granted
The following table illustrates movements in SARs during this year:
2018 2017
No. No.
Opening balance 2,098,316 2,111,757
Granted during the year 730,244 865,092
Forfeited during the year - (13,519)
Vested during the year (1,404,023) (865,014)
Outstanding at the end of the year 1,424,537 2,098,316
Exercisable at the end of the year - -
The weighted average remaining life of the instrument at 30 June 2018 was 1.2 years (2017: 1.2 years) and the weighted average fair value of the SARs granted during the year was $3.57 (2017: $2.38).
The following table lists the inputs to the model used for the SARs plan for the years ended 30 June 2018 and 30 June 2017:
2018 2017
Expected volatility (%) 19 18
Risk-free interest rate (%) 1.53 - 2.04 1.41 - 1.68
Life of instrument (years) 0.8 - 3.8 0.8 - 3.8
Model used Trinomial Trinomial
The expected life of the SARs is based on historical data and current expectations and is not necessarily indicative of exercise patterns that may occur. The expected volatility reflects the assumption that the historical volatility over a period similar to the life of the SARs is indicative of future trends, which may not necessarily be the actual outcome.
For
per
sona
l use
onl
y

ABACUS PROPERTY GROUP
79
NOTES TO THE FINANCIAL STATEMENTS 30 JUNE 2018
21. INTANGIBLE ASSETS AND GOODWILL
Description of the Group’s intangible assets
2018 2017
$'000 $'000
Goodwill
Balance at 1 July 32,394 32,394
Balance at 30 June 32,394 32,394
Impairment tests for goodwill with indefinite useful lives
(i) Description of the cash generating units and other relevant information
Goodwill acquired through business combinations for the purposes of impairment testing is allocated to one of the Group’s property / asset management business or a cash generating unit relating to one of the Group’s segment. The recoverable amount of the unit has been determined based on a fair value less costs to sell calculation using cash flow projections as at 30 June 2018 covering a five-year period.
(ii) Key assumptions used in valuation calculations
Goodwill – the calculation of fair value less costs to sell is most sensitive to the following assumptions:
a. Management and other fee income: based on actual income and funds under management within the financial year.
b. Discount rates: reflects management’s estimate of the time value of money and the risks specific to each unit that are not reflected in the cash flows
c. Property values of the funds/properties under management: based on the fair value of properties
d. Selling costs: management’s estimate of costs to sell the funds/properties under management
e. A pre-tax discount rate of 9.40% (2017: 9.40%) and a terminal growth rate of 2.7% (2017: 2.7%) have been applied to the cash flow projections
(iii) Sensitivity to changes in assumptions
Significant and prolonged property value falls and market influences which could increase discount rates could cause goodwill to be impaired in the future, however, the goodwill valuation as at 30 June 2018 has significant head room thus no reasonable changes in the assumptions would cause or give rise to an impairment.
For
per
sona
l use
onl
y

ABACUS PROPERTY GROUP
80
NOTES TO THE FINANCIAL STATEMENTS 30 JUNE 2018
22. SUMMARY OF SIGNIFICANT ACCOUNTING POLICIES
(a) Basis of Preparation
The financial report is a general-purpose financial report, which has been prepared in accordance with the requirements of the Corporations Act 2001 and Australian Accounting Standards. The financial report has also been prepared on a historical cost basis, except for investment properties and derivative financial instruments which have been measured at fair value, interests in joint ventures and associates which are accounted for using the equity method, and certain investments and financial assets measured at fair value.
The financial report is presented in Australian dollars and all values are rounded to the nearest thousand dollars ($'000) unless otherwise stated under the option available to the Group under ASIC Corporations Instrument 2017/191. The Group is an entity to which the class order applies.
(b) Statement of Compliance
The financial report complies with Australian Accounting Standards and International Financial Reporting Standards (IFRS), as issued by the AASB and IASB respectively.
(c) New accounting standards and interpretations
(i) Changes in accounting policy and disclosures
The accounting policies adopted are consistent with those of the previous financial year except for the adoption of new standards and interpretations effective as of 1 July 2017.
The Group has adopted the following new or amended standards which became applicable on 1 July 2017:
- AASB 2016-1 Amendments to Australian Accounting Standards – Recognition of Deferred Tax Assets for Unrealised Losses
- AASB 2016-2 Amendments to Australian Accounting Standards – Disclosure Initiative: Amendments to AASB 107
The adoption of these amended standards has no material impact on the financial statements of the Group.
(ii) Accounting Standards and Interpretation issued but not yet effective
Australian Accounting Standards and Interpretations that have recently been issued or amended but are not yet effective have not been adopted by the Group for the annual reporting period ended 30 June 2018. The significant new standards or amendments are outlined below:
- AASB 9 Financial Instruments (effective 1 January 2018 / applicable for Group 1 July 2018)
This standard includes requirement to improve and simplify the approach for classification and measurement of financial assets compared with the requirements of AASB 139 Financial Instruments: Recognition and Measurement. The Standard contains requirements in the areas of classification, measurement, hedge accounting and derecognition.
The most significant change for the adoption of AASB 9 will be the introduction of the new impairment model relating to the Group’s property loans. The Group is currently finalising its quantification of the impairment that will be recognised on initial application of the accounting standard. As the year ending 30 June 2019 will be the first time application of the Standard, the Group has elected to adjust the retained earnings of the Group as at 1 July 2018 as opposed to restating the previous year amounts.
For
per
sona
l use
onl
y

ABACUS PROPERTY GROUP
81
NOTES TO THE FINANCIAL STATEMENTS 30 JUNE 2018
22. SUMMARY OF SIGNIFICANT ACCOUNTING POLICIES
(c) New accounting standards and interpretations (continued)
- Revenue from Contracts with Customers (effective 1 January 2018 / applicable for Group 1 July 2018)
AASB15 replaces the current revenue recognition standards AASB 111 Construction Contracts, AASB 118 Revenue and related Interpretations.
AASB 15 specifies the accounting treatment for revenue arising from contracts with customers (except for contracts within the scope of other accounting standards such as leases or financial instruments). The core principle of IFRS 15 is that an entity recognises revenue to depict the transfer of promised goods or services to customers in an amount that reflects the consideration to which the entity expects to be entitled in exchange for those goods or services.
Early adoption of this Standard is permitted.
The Group has undertaken an analysis to scope out its revenue streams to identify specific impacts of the Standard. The revenue streams identified are:
- Rental / hotel income
- Finance income
- Management and other fee income
- Sale of inventory
The majority of the Group’s revenue streams have application under other relevant standards and therefore, application of AASB 15 does not apply (rental income, finance income). Where the Standard does apply, the Group has assessed that there will likely be no change to the recognition or measurement of revenue upon application of the Standard or has considered that the impact to the Group’s results to be immaterial.
- Leases (effective 1 January 2019 / applicable for Group 1 July 2019)
AASB 16 supersedes: AASB 117 Leases and associated interpretations.
The key features of AASB 16 are as follows:
Lessee accounting
- Lessees are required to recognise assets and liabilities for all leases with a term of more than 12 months, unless the underlying asset of low value
- A lessee measures right-of-use assets similarly to other non-financial assets and lease liabilities similarly to other financial liabilities
- Assets and liabilities arising from a lease are initially measured on a present value basis. The measurement includes non-cancellable lease payments (including inflation-linked payments), and also includes payments to be made in optional periods if the lessee is reasonably certain to exercise an option to extend the lease, or not to exercise an option to terminate the lease
- AASB 16 contains disclosure requirements for lessees
Lessor accounting
- AASB 16 substantially carries forward the lessor accounting requirements in AASB 117. Accordingly, a lessor continues to classify its leases as operating leases or finance leases, and to account for those two types of leases differently
- AABB 16 also requires enhanced disclosures to be provided by lessors that will improve information disclosed about a lessor’s risk exposure, particularly to residual value risk
Early adoption is permitted, provided the new revenue standard, AASB15 Revenue from Contracts with Customers, has been applied, or is applied at the same date as AASB 16.
The Group has reviewed terms of its lease agreement and has considered that the impact to the Group’s results to be immaterial.
For
per
sona
l use
onl
y

ABACUS PROPERTY GROUP
82
NOTES TO THE FINANCIAL STATEMENTS
30 JUNE 2018
22. SUMMARY OF SIGNIFICANT ACCOUNTING POLICIES
(c) New accounting standards and interpretations (continued)
AASB 2014-10, AASB 2016-5, AASB 2017-1, AASB 2017-2, AASB 2017-5 and AASB Interpretation 23 are applicable to the Group, however will have no significant impact on the Group.
AASB 2016-6, AASB 2017-3, AASB 2017-4, AASB 2017-6 AASB 2018-1, AASB 2018-2, AASB Interpretation 22, AASB 2017-8 and AASB 17 will have no application to the Group.
(d) Basis of consolidation
The consolidated financial statements comprise the financial statements of AGHL and its subsidiaries, AT and its subsidiaries, AGPL and its subsidiaries, AIT and its subsidiaries, ASPT and its subsidiaries and ASOL and its subsidiaries collectively referred to as the Group.
Subsidiaries are all those entities over which the Group has power over the investee such that the Group is able to direct the relevant activities, has exposure or rights to variable returns from its involvement with the investee and has the ability to use its power over the investee to affect the amount of the investor’s returns.
The adoption of AASB 10 resulted in the consolidation of Abacus Hospitality Fund and Abacus Wodonga Land Fund. This is due to the combination of the Group’s role as responsible entity and its exposure to variable returns arising from its collective equity and loan investments in these funds and certain guarantees.
The financial statements of subsidiaries are prepared for the same reporting period as the parent company, using consistent accounting policies with adjustments made to bring into line any dissimilar accounting policies that may exist.
All intercompany balances and transactions, including unrealised profits from intra-group transactions, have been eliminated in full and subsidiaries are consolidated from the date on which control is transferred to the Group and cease to be consolidated from the date on which control is transferred out of the Group. Where there is a loss of control of a subsidiary, the consolidated financial statements include the results for the part of the reporting period during which the Group has control.
The acquisition of subsidiaries is accounted for using the purchase method of accounting. The purchase method of accounting involves allocating the cost of the business combination to the fair value of the assets acquired and the liabilities and contingent liabilities assumed at the date of acquisition.
Non-controlling interests are allocated their share of net profit after tax in the consolidated income statement and are presented within equity in the consolidated statement of financial position, separately from the equity of the owners of the parent.
Non-controlling interests represent those equity interests in Abacus Hospitality Fund, Abacus Wodonga Land Fund, Abacus Jigsaw Trust, Lutwyche City Shopping Centre Unit Trust and Abacus Independent Retail Property Trust that are not held by the Group and are presented separately in the income statement and within equity in the consolidated statement of financial position.
For
per
sona
l use
onl
y

ABACUS PROPERTY GROUP
83
NOTES TO THE FINANCIAL STATEMENTS 30 JUNE 2018
22. SUMMARY OF SIGNIFICANT ACCOUNTING POLICIES
(e) Foreign currency translation
Functional and presentation currency
Both the functional and presentation currency of the Group are in Australian dollars. Each entity in the Group determines its own functional currency and items are included in the financial statements of each entity are measured using that functional currency.
Transactions and balances
Transactions in foreign currencies are initially recorded in the functional currency by applying the exchange rates ruling at the date of the transaction. Monetary assets and liabilities denominated in foreign currencies are retranslated at the rate of exchange ruling at the balance sheet date.
All exchange differences in the consolidated financial report are taken to profit or loss with the exception of differences on foreign currency borrowings on translation of foreign operations that provide a hedge against a net investment in a foreign operation. These are taken directly to equity until the disposal of the net investment, at which time they are recognised in profit or loss. On disposal of a foreign operation, the cumulative amount recognised in equity relating to that particular foreign operation is recognised in profit or loss. Tax charges and credits attributable to exchange differences on those borrowings are also recognised in equity.
Non-monetary items that are measured in terms of historical cost in a foreign currency are translated using the exchange rate as at the date of the initial transaction. Non-monetary items measured at fair value in a foreign currency are translated using the exchange rates at the date when the fair value was determined.
At reporting date the assets and liabilities of foreign operations are translated into the presentation currency of the Group at the rate of exchange prevailing at balance date and the financial performance is translated at the average exchange rate prevailing during the reporting period. The exchange differences arising on translation are taken directly to the foreign currency translation reserve in equity.
(f) Revenue recognition
Revenue is recognised and measured at the fair value of the consideration received or receivable to the extent it is probable that the economic benefits will flow to the Group and the revenue can be reliably measured. The following specific recognition criteria must also be met before revenue is recognised:
Rental income
Rental income from investment properties is accounted for on a straight-line basis over the lease term. Lease incentives granted are recognised as an integral part of the total rental income.
Hotel income
Revenue from rooms is recognised and accrued on the provision of rooms or on the date which rooms are to be provided in accordance with the terms and conditions of the bookings. Advance deposits from customers received are not recognised as revenue until such time when the rooms have been provided or when the customers forfeit the deposits due to failure of attendance.
Finance income
Revenue is recognised as interest accrues using the effective interest method. This is a method of calculating the amortised cost of a financial asset and allocating the interest income over the relevant period using the effective interest rate, which is the rate that exactly discounts estimated future cash receipts through the expected life of the financial asset to the net carrying amount of the financial asset.
Management and other fee income
Revenue from rendering of services is recognised in accordance with the terms and conditions of the service agreements and the accounting standards. F
or p
erso
nal u
se o
nly

ABACUS PROPERTY GROUP
84
NOTES TO THE FINANCIAL STATEMENTS 30 JUNE 2018
22. SUMMARY OF SIGNIFICANT ACCOUNTING POLICIES
(f) Revenue recognition (continued)
Dividends and distributions
Revenue is recognised when the Group’s right to receive the payment is established.
Net change in fair value of investments and financial instruments derecognised during the year
Revenue from sale of investments is recognised on settlement when the significant risks and rewards of the ownership of the investments have been transferred to the buyer. Risks and rewards are generally considered to have passed to the buyer at the time of settlement of the sale. Financial instruments are derecognised when the right to receive or pay cash flows from the financial derivative has expired or when the entity transfers substantially all the risks and rewards of the financial derivative through termination. Gains or losses due to derecognition are recognised in the statement of comprehensive income.
Net change in fair value of investments held at balance date
Changes in market value of investments are recognised as revenue or expense in determining the net profit for the period.
Sale of inventory
Revenue from property development sales is recognised when the significant risks, rewards of ownership and effective control has been transferred to the purchaser which has been determined to occur upon settlement and after contractual duties are completed.
No revenue is recognised if there are significant uncertainties regarding recovery of the consideration due, the costs incurred or to be incurred cannot be measured reliably, there is a risk of return or there is continuing management involvement to the degree usually associated with ownership.
(g) Expenses
Expenses including rates, taxes and other outgoings, are brought to account on an accrual basis and any related payables are carried at cost.
(h) Cash and cash equivalents
Cash and cash equivalents in the balance sheet comprise cash at bank and in hand and short-term deposits with an original maturity of three months or less that are readily convertible to known amounts of cash which are subject to an insignificant risk of changes in value.
For the purposes of the Statement of Cash Flow, cash and cash equivalents consist of cash and cash equivalents as defined above.
(i) Trade and other receivables
Trade receivables, which generally have 30 day terms, are recognised at amortised cost, which in the case of the Group, is the original invoice amount less an allowance for any uncollectible amounts.
Collectability of trade receivables is reviewed on an ongoing basis. An allowance for doubtful debts is raised when there is objective evidence that collection of the full amount is no longer probable. Bad debts are written off when identified.
(j) Derivative financial instruments and hedging
The Group utilises derivative financial instruments, both foreign exchange and interest rate derivatives to manage the risk associated with foreign currency and interest rate fluctuations. Such derivative financial instruments are recognised at fair value.
The Group has set defined policies and implemented hedging policies to manage interest and exchange rate risks. Derivative instruments are transacted in line with these policies to achieve the economic outcomes in line with the Group’s treasury and hedging policy. They are not transacted for speculative purposes.
The Group does not employ hedge accounting and as such derivatives are recorded at fair value with gains or losses arising from the movement in fair values recorded in the income statement.
For
per
sona
l use
onl
y

ABACUS PROPERTY GROUP
85
NOTES TO THE FINANCIAL STATEMENTS 30 JUNE 2018
22. SUMMARY OF SIGNIFICANT ACCOUNTING POLICIES
(k) Investments and other financial assets
All investments are initially recognised at cost, being the fair value of the consideration given.
Financial assets in the scope of AASB 139 Financial Instruments: Recognition and Measurement are classified as either financial assets at fair value through profit or loss, loans and receivables, held to maturity investments, or available-for-sale financial assets. The Group determines the classification of its financial assets after initial recognition and, when allowed and appropriate, re-evaluates this designation at each financial year-end. At 30 June the Group’s investments in listed and unlisted securities have been classified as financial assets at fair value through profit or loss and property loans are classified as loans and receivables.
Recognition and derecognition
Purchases and sales of financial assets that require delivery of assets within the time frame generally established by regulation or convention in the market place are recognised on the trade date i.e. the date that the Group commits to purchase the assets. Financial assets are derecognised when the right to receive cash flows from the financial assets have expired or been transferred.
After initial recognition, investments, which are classified as held for trading, are measured at fair value. Financial assets are classified as held for trading if they are acquired for the purpose of selling in the near term with the intention of making a profit. Gains or losses on investments held for trading are recognised in the income statement.
For investments where there is no quoted market or unit price, fair value is determined by reference to the current market value of another instrument which is substantially the same or is calculated based on the expected cash flows of the underlying net asset base of the investment.
Financial assets at fair value through profit or loss
A financial asset or financial liability at fair value is designated by the entity at fair value through the profit and loss upon initial recognition. APG uses this designation where doing so results in more relevant information. This group of financial assets and liabilities are managed and their performance evaluated on a fair value basis, in accordance with APG’s documented risk management and investment strategy which outlines that these assets and liabilities are managed on a total rate of return basis, and information about the instruments is provided internally on that basis to the entity’s key management personnel and the Board.
APG holds investments in unlisted securities and enters into loans and receivables with associated options that provide for a variety of outcomes including repayment of principal and interest, satisfaction through obtaining interests in equity or property or combinations thereof.
Loans and receivables
Loans and receivables are non-derivative financial assets with fixed or determinable payments that are not quoted in an active market. Such assets are carried at amortised cost using the effective interest method. Gains and losses are recognised in profit or loss when the loans and receivables are derecognised or impaired, as well as through the amortisation process.
Subsidiaries
Investment in subsidiaries are held at lower of cost or recoverable amount.
For
per
sona
l use
onl
y

ABACUS PROPERTY GROUP
86
NOTES TO THE FINANCIAL STATEMENTS 30 JUNE 2018
22. SUMMARY OF SIGNIFICANT ACCOUNTING POLICIES
(l) Interest in joint arrangements
The Group’s interest in joint venture entities is accounted for under the equity method of accounting in the consolidated financial statements. The investment in the joint venture entities is carried in the consolidated balance sheet at cost plus post-acquisition changes in the Group’s share of net assets of the joint ventures, less any impairment in value. The consolidated income statement reflects the Group’s share of the results of operations of the joint ventures.
Investments in joint ventures are held at the lower of cost or recoverable amount in the investing entities.
The Group’s interest in joint operations that give the parties a right to the underlying assets and obligations themselves is accounted for by recognising the Group’s share of those assets and obligations.
(m) Property, plant and equipment
Hotel property, plant and equipment
Property (including land and buildings), plant and equipment represent owner-occupied properties and are initially
measured at cost including transaction costs and acquisition costs. Subsequent to initial recognition, properties
are measured at fair value less accumulated depreciation and any impairment in value after the date of
revaluation.
Depreciation is calculated on a straight-line basis over the estimated useful life of the asset as follows:
Buildings – 50 years Plant and equipment – 3 to 20 years
Revaluations of land and buildings
Any revaluation increment is credited to the asset revaluation reserve included in the equity section of the balance sheet except to the extent that it reverses a revaluation decrease of the same asset previously recognised in profit or loss, in which case the increase is recognised in profit or loss.
Any revaluation decrease is recognised in profit or loss except to the extent that it offsets a previous revaluation increase for the same asset in which case the decrease is debited directly to the asset revaluation reserve to the extent of the credit balance existing in the revaluation reserve for that asset.
Gains and losses on disposals are determined by comparing proceeds with the carrying amount. These are included in the income statement.
Any accumulated depreciation as at the revaluation date is eliminated against the gross carrying amounts of the assets and the net amounts are restated to the revalued amounts of the assets.
Hotel property, plant and equipment are independently valued on an annual basis unless the underlying financing requires a more frequent independent valuation cycle.
Other property, plant and equipment
Land and buildings are measured at fair value, based on periodic valuations by external independent valuers, less
accumulated depreciation on buildings and less any impairment losses recognised after the date of the
revaluation.
Plant and equipment is stated at historical cost less accumulated depreciation and any impairment losses.
Depreciation is calculated on a straight-line basis over the estimated useful life of the asset as follows:
Buildings – 40 years Plant and equipment – over 5 to 15 years
For
per
sona
l use
onl
y

ABACUS PROPERTY GROUP
87
NOTES TO THE FINANCIAL STATEMENTS 30 JUNE 2018
22. SUMMARY OF SIGNIFICANT ACCOUNTING POLICIES
(m) Property, plant and equipment (continued)
Impairment
The carrying values of property, plant and equipment are reviewed for impairment when events or changes in circumstances indicate the carrying value may not be recoverable. For an asset that does not generate largely independent cash inflows, the recoverable amount is determined for the cash-generating unit to which the asset belongs.
If any such indication exists and where the carrying values exceed the estimated recoverable amount, the assets or cash-generating units are written down to their recoverable amount.
The recoverable amount of property (including land and buildings), plant and equipment is the greater of fair value less costs to sell and value in use. In assessing value in use, the estimated future cash flows are discounted to their present value using a pre-tax discount rate that reflects current market assessments of the time value of money and the risks specific to the assets.
Impairment losses are recognised in the income statement.
Independent valuations are performed with sufficient regularity to ensure that the carrying amount does not differ materially from the asset’s fair value at the balance sheet date.
Disposal An item of property, plant and equipment is derecognised upon disposal or when no future economic benefits are expected to arise from the continued use of the asset.
Any gain or loss arising on derecognition of the asset (calculated as the difference between the net disposal proceeds and the carrying amount of the asset) is included in the income statement in the year the asset is derecognised.
Other property, plant and equipment are independently valued on a staggered basis every two years unless the underlying financing requires a more frequent independent valuation cycle.
(n) Investment properties
Investment properties are measured initially at cost, including transaction costs. The carrying amount includes the cost of replacing parts of an existing investment property at the time that the cost is incurred if the recognition criteria are met, and excludes the costs of day-to-day servicing of an investment property. Subsequent to initial recognition, investment properties are stated at fair value, which reflects market and property specific conditions at the balance sheet date. Gains or losses arising from changes in the fair values of investment properties are recognised in the income statement in the year in which they arise.
Investment properties are derecognised either when they have been disposed of or when the investment property is permanently withdrawn from use and no future economic benefit is expected from its disposal. Any gains or losses on the retirement or disposal of an investment property are recognised in the income statement in the year of retirement or disposal.
Investment properties under construction are carried at fair value. Fair value is calculated based on estimated fair value on completion after allowing for the remaining expected costs of completion plus an appropriate risk adjusted development margin.
Transfers are made to investment property when, and only when, there is a change in use, evidenced by commencement of an operating lease to another party or ending of construction or development. Transfers are made from investment property when, and only when, there is a change in use, evidenced by commencement of development with a view to sale.
For a transfer from investment property to inventories, the deemed cost of property for subsequent accounting is its fair value at the date of change in use. For a transfer from inventories to investment property, any difference between the fair value of the property at that date and its previous carrying amount is recognised in profit or loss.
Land and buildings that meet the definition of investment property are considered to have the function of an investment and are therefore regarded as a composite asset, the overall value of which is influenced by many factors, the most prominent being income yield, rather than diminution in value of the building content due to the passing of time. Accordingly, the buildings and all components thereof, including integral plant and equipment, are not depreciated.
For
per
sona
l use
onl
y

ABACUS PROPERTY GROUP
88
NOTES TO THE FINANCIAL STATEMENTS 30 JUNE 2018
22. SUMMARY OF SIGNIFICANT ACCOUNTING POLICIES
(n) Investment properties (continued)
Investment properties are independently valued on a staggered basis every two years unless the underlying financing requires a more frequent independent valuation cycle. In determining fair value, the capitalisation of net income method and the discounting of future cashflows to their present value have been used.
Lease incentives provided by the Group to lessees, and rental guarantees which may be received by the Group from third parties (arising from the acquisition of investment properties) are included in the measurement of fair value of investment property. Leasing costs and incentives are included in the carrying value of investment property and are amortised over the respective lease period, either using a straight-line basis, or a basis which is more representative of the pattern of benefits.
Under AASB 140, investment properties, including any plant and equipment, are not subject to depreciation. However, depreciation allowances in respect of certain buildings, plant and equipment are currently available to investors for taxation purposes.
(o) Leases
The determination of whether an arrangement is or contains a lease is based on the substance of the arrangement and requires an assessment of whether the fulfilment of the arrangement is dependent on the use of a specific asset or assets and the arrangement conveys a right to use the asset.
Group as lessee
Operating lease payments are recognised as an expense in the income statement on a straight-line basis over the lease term. Lease incentives are recognised in the income statement as an integral part of the total lease expense.
Group as a lessor
Leases in which the Group retains substantially all the risks and benefits of ownership of the lease assets are classified as operating leases.
(p) Goodwill and intangibles
Goodwill
Goodwill on acquisition is initially measured at cost being the excess of the cost of the business combination over the acquirer’s interest in the net fair value of the identifiable assets, liabilities and contingent liabilities. Following initial recognition, goodwill is measured at cost less any accumulated impairment losses and is not amortised. Goodwill is reviewed for impairment, annually or more frequently if events or changes in circumstances indicate that the carrying value may be impaired.
For the purpose of impairment testing, goodwill acquired in a business combination is, from the acquisition date, allocated to each of the Group’s cash-generating units, or groups of cash-generating units, that are expected to benefit from the synergies of the combination, irrespective of whether other assets or liabilities of the Group are assigned to those units or groups of units. Each unit or group of units to which the goodwill is so allocated:
- Represents the lowest level within the Group at which the goodwill is monitored for internal management purposes; and
- Is not larger than a segment based on either the Group’s primary or the Group’s secondary reporting format determined in accordance with AASB 8 Operating Segments.
Impairment is determined by assessing the recoverable amount of the cash-generating unit (group of cash-generating units), to which the goodwill relates. When the recoverable amount of the cash-generating unit (group of cash-generating units) is less that the carrying amount, an impairment loss is recognised. When goodwill forms part of a cash-generating unit (group of cash-generating units) and an operation within that unit is disposed of, the goodwill associated with the operation disposed of is included in the carrying amount of the operation when determining the gain or loss on disposal of the operation. Goodwill disposed of in this manner is measured based on the relative values of the operation disposed of and the portion of the cash-generating unit retained.
Impairment losses recognised for goodwill are not subsequently reversed.
For
per
sona
l use
onl
y

ABACUS PROPERTY GROUP
89
NOTES TO THE FINANCIAL STATEMENTS 30 JUNE 2018
22. SUMMARY OF SIGNIFICANT ACCOUNTING POLICIES
(q) Impairment of non-financial assets other than goodwill
Intangible assets that have an indefinite useful life are not subject to amortisation and are tested annually for impairment, or more frequently if events or changes in circumstances indicate that they might be impaired. Other assets are tested for impairment whenever events or changes in circumstances indicate that the carrying amount may not be recoverable. An impairment loss is recognised for the amount by which the asset’s carrying amount exceeds its recoverable amount. Recoverable amount is the higher of an asset’s fair value less costs to sell and value in use. For the purposes of assessing impairment, assets are grouped at the lowest levels for which there are separately identifiable cash inflows that are largely independent of the cash inflows from other assets or groups of assets (cash-generating units). Non-financial assets other that goodwill that suffered an impairment are tested for possible reversal of the impairment whenever events or changes in circumstances indicate that the impairment may have reversed.
(r) Trade and other payables
Trade payables and other payables are carried at amortised cost. They represent liabilities for goods and services provided to the Group prior to the end of the financial year that are unpaid and arise when the Group becomes obliged to make future payments in respect of the purchase of these goods and services. The amounts are unsecured and are usually paid within 30 days of recognition.
(s) Provisions and employee leave benefits
Provisions are recognised when the Group has a present obligation (legal or constructive) as a result of a past event and it is probable that an outflow of resources embodying economic benefits will be required to settle the obligation and a reliable estimate can be made of the amount of the obligation.
Provisions are measured at the present value of management’s best estimate of the expenditure required to settle the present obligation at the balance sheet date. If the effect of the time value of money is material, provisions are discounted using a current pre-tax rate that reflects the time value of money and the risks specific to the liability. The increase in the provision resulting from the passage of time is recognised in finance costs.
Employee leave benefits
(i) Wages, salaries, annual leave and sick leave
Liabilities for wages and salaries, including non-monetary benefits, annual leave and accumulating sick leave expected to be settled within 12 months of the reporting date are recognised in respect of employees’ services up to the reporting date. They are measured at the amounts expected to be paid when the liabilities are settled. Expenses for non-accumulating sick leave are recognised when the leave is taken and are measured at the rates paid or payable.
ii) Long service leave
The liability for long service leave is recognised and measured as the present value of expected future payments to be made in respect of services provided by employees up to the reporting date using the projected unit credit method. Consideration is given to expected future wage and salary levels, experience of employee departures, and periods of service. Expected future payments are discounted using market yields at the reporting date on national government bonds with terms to maturity and currencies that match, as closely as possible, the estimated future cash outflows.
(t) Distributions and dividends
Trusts generally distribute their distributable assessable income to their unitholders. Such distributions are determined by reference to the taxable income of the respective trusts. Distributable income may include capital gains arising from the disposal of investments and tax-deferred income. Unrealised gains and losses on investments that are recognised as income are usually retained and are generally not assessable or distributable until realised. Capital losses are not distributed to security holders but are retained to be offset against any future realised capital gains.
A liability for dividend or distribution is recognised in the Balance Sheet if the dividend or distribution has been declared, determined or publicly recommended prior to balance date.
For
per
sona
l use
onl
y

ABACUS PROPERTY GROUP
90
NOTES TO THE FINANCIAL STATEMENTS 30 JUNE 2018
22. SUMMARY OF SIGNIFICANT ACCOUNTING POLICIES
(u) Interest-bearing loans and borrowings
All loans and borrowings are initially recognised at cost, being the fair value of the consideration received net of transaction costs associated with the borrowing.
After initial recognition, interest-bearing loans and borrowings are subsequently measured at amortised cost using the effective interest method. Fees paid in the establishment of loan facilities are included as part of the carrying amount of loans and borrowings.
Borrowings are classified as non-current liabilities where the Group has an unconditional right to defer settlement of the liability for at least 12 months after the balance sheet date.
Borrowing Costs
Borrowing costs are recognised as an expense when incurred unless they relate to a qualifying asset or to upfront borrowing establishment and arrangement costs, which are deferred and amortised as an expense over the life of the facility. A qualifying asset is an asset that generally takes more than 12 months to get ready for its intended use or sale. In these circumstances, the financing costs are capitalised into the cost of the asset. Where funds are borrowed by the Group for the acquisition or construction of a qualifying asset, the amount of the borrowing costs capitalised are those incurred in relation to the borrowing.
(v) Contributed equity
Issued and paid up capital is recognised at the fair value of the consideration received by the Group. Stapled securities are classified as equity. Incremental costs directly attributable to the issue of new securities are shown in equity as a deduction, net of tax, from the proceeds.
(w) Non-current assets held for sale
Before classification as held for sale the measurement of the assets is updated. Upon classification as held for sale, assets are recognised at the lower of carrying amount and fair value less costs to sell with the exception of investment properties which are valued in accordance with Note 22(n).
Gains and losses from revaluations on initial classification and subsequent re-measurement are recognised in the income statement.
(x) Inventories
Property Development
Inventories are stated at the lower of cost and net realisable value. Net realisable value is determined on the basis of sales in the ordinary course of business. Expenses of marketing, selling and distribution to customers are estimated and deducted to establish net realisable value. Where the net realisable value of inventory is less than cost, an impairment expense is recognised in the consolidated income statement. Reversals of previously recognised impairment charges are recognised in the consolidated income statement such that the inventory is always carried at the lower of cost and net realisable value. Cost includes the purchase consideration, development costs and holding costs such as borrowing costs, rates and taxes.
Hotel
Inventories are valued at the lower of cost and net realisable value.
Net realisable value is the estimated selling price in the ordinary course of business, less the estimated costs necessary to make the sale.
For
per
sona
l use
onl
y

ABACUS PROPERTY GROUP
91
NOTES TO THE FINANCIAL STATEMENTS 30 JUNE 2018
22. SUMMARY OF SIGNIFICANT ACCOUNTING POLICIES
(y) Taxation
The Group comprises taxable and non-taxable entities. A liability for current and deferred tax and tax expense is only recognised in respect of taxable entities that are subject to income tax and potential capital gains tax as detailed below.
Trust income tax
Under current Australian income tax legislation AT, AIT, ASPT, AHT and ADIFII are not liable to Australian income tax provided security holders are presently entitled to the taxable income of the trusts and the trusts generally distribute their taxable income.
Company income tax
AGHL and its Australian resident wholly-owned subsidiaries, ASOL and its Australian resident wholly-owned subsidiaries and AHL and its Australian resident wholly-owned subsidiaries have formed separate tax consolidation groups. AGHL, ASOL and AHL have entered into tax funding agreements with their Australian resident wholly-owned subsidiaries, so that each subsidiary agrees to pay or receive its share of the allocated tax at the current tax rate.
The head tax entity and the controlled entities in each tax consolidated group continue to account for their own current and deferred tax amounts.
In addition to its own current and deferred tax amounts, the head tax entity also recognises the current tax liabilities (or assets) and the deferred tax assets arising from unused tax losses and unused tax credits assumed from controlled entities in the tax consolidated group.
Assets or liabilities arising under tax funding agreements with the tax consolidated entities are recognised as amounts receivable from or payable to other entities in the group.
Any difference between the amounts assumed and amounts receivable or payable under the tax funding agreements are recognised as a contribution to (or distribution from) wholly-owned tax consolidated entities.
Current tax assets and liabilities for the current and prior periods are measured at the amount expected to be recovered from or paid to the taxation authorities. The tax rates and tax laws used to compute the amount are those that are enacted or substantively enacted by the balance sheet date.
Deferred income tax assets are recognised for all deductible temporary differences, carry forward of unused tax assets and unused tax losses, to the extent that it is probable that taxable profit will be available against which the deductible temporary differences, and the carry-forward of unused tax assets and unused tax losses can be utilised, except:
- when the deferred income tax asset relating to the deductible temporary difference arises from the initial recognition of an asset or liability in a transaction that is not a business combination and, at the time of the transaction, affects neither the accounting profit nor taxable profit or loss; or
- when the deductible temporary differences associated with investments in subsidiaries, associates and interests in joint ventures, deferred tax assets are only recognised to the extent that it is probable that the temporary differences will reverse in the foreseeable future and taxable profit will be available against which the temporary differences can be utilised.
The carrying amount of deferred income tax assets is reviewed at each balance sheet date and reduced to the extent that it is no longer probable that sufficient taxable profit will be available to allow all or part of the deferred income tax asset to be utilised.
Unrecognised deferred income tax assets are reassessed at each balance sheet date and are recognised to the extent that it has become probable that future taxable profit will allow the deferred tax asset to be recovered.
Deferred income tax is provided on all temporary differences at the balance sheet date between the tax bases of assets and liabilities and their carrying amounts for financial reporting purposes.
For
per
sona
l use
onl
y

ABACUS PROPERTY GROUP
92
NOTES TO THE FINANCIAL STATEMENTS 30 JUNE 2018
22. SUMMARY OF SIGNIFICANT ACCOUNTING POLICIES
(y) Taxation (continued)
Deferred income tax liabilities are recognised for all taxable temporary differences, except:
- when the deferred income tax liability arises from the initial recognition of an asset or liability in a transaction that is not a business combination and, at the time of the transaction, affects neither the accounting profit nor taxable profit or loss; or
- when the taxable temporary differences associated with investments in subsidiaries, associates and interests in joint ventures, and the timing of the reversal of the temporary differences can be controlled and it is probable that the temporary differences will not reverse in the foreseeable future.
Deferred income tax assets and liabilities are measured at the tax rates that are expected to apply to the year when the asset is realised or the liability is settled, based on tax rates (and tax laws) that have been enacted or substantively enacted at the balance sheet date.
Income taxes relating to items recognised directly in equity are recognised in equity and not in the income statement.
Deferred tax assets and deferred tax liabilities are offset only if a legally enforceable right exists to set off current tax assets against current tax liabilities and the deferred tax assets and liabilities relate to the same taxable entity and the same taxation authority.
New Zealand
The trusts that operate in New Zealand (“NZ”) are treated as a company for NZ income tax purposes and are taxed at the corporate tax rate of 28% (2017: 28%). NZ income tax paid by the Trusts can be claimed as foreign tax credits to offset against foreign income and distributable to security holders. NZ tax losses are carried forward provided the continuity test of ownership is satisfied. Interest expense from the Trusts are fully deductible subject to thin capitalisation considerations. Property revaluation gains or losses are to be excluded from taxable income, with no deferred tax implications as capital gains are not taxed in NZ.
Income derived by companies which are incorporated in Australia and registered in NZ as overseas companies is exempt from tax in Australia where the income has been taxed in NZ. This income is regarded as non-assessable non-exempt income. As such, income tax is calculated on the companies’ NZ taxable income and taxed at the NZ corporate rate of 28% (2017: 28%).
Goods and services tax (GST)
Revenues, expenses and assets are recognised net of the amount of GST except when the GST incurred on a purchase of goods and services is not recoverable from the taxation authority, in which case the GST is recognised as part of the cost of acquisition of the asset or as part of the expense item as applicable; and receivables and payables are stated with the amount of GST included.
The net amount of GST recoverable from, or payable to, the taxation authority is included as part of receivables or payables in the balance sheet.
Cash flows are included in the Cash Flow Statement on a gross basis and the GST component of cash flows arising from investing and financing activities, which is recoverable from, or payable to, the taxation authority are classified as operating cash flows.
Commitments and contingencies are disclosed net of the amount of GST recoverable from, or payable to, the taxation authority.
For
per
sona
l use
onl
y

ABACUS PROPERTY GROUP
93
NOTES TO THE FINANCIAL STATEMENTS 30 JUNE 2018
22. SUMMARY OF SIGNIFICANT ACCOUNTING POLICIES
(z) Earnings per stapled security (EPSS)
Basic EPSS is calculated as net profit attributable to stapled security holders, adjusted to exclude costs of
servicing equity (other than distributions) divided by the weighted average number of stapled securities on issue
during the period under review.
Diluted EPSS is calculated as net profit attributable to stapled security holders, adjusted for:
- costs of servicing equity (other than distributions);
- the after tax effect of dividends and interest associated with dilutive potential stapled securities that have been recognised as expenses; and
- other non-discretionary changes in revenues or expenses during the period that would result from the dilution of potential stapled securities;
divided by the weighted average number of stapled securities and dilutive potential stapled securities, adjusted for any bonus element.
(za) Security based payment plans
Executives of the Group receive remuneration in the form of security based payments, whereby Executives render services as consideration for equity instruments (equity-settled transactions).
The cost of equity-settled transactions is determined by the fair value at the date when the grant is made, using an appropriate valuation model and is recognised, together with a corresponding increase in other capital reserves in equity, over the period in which the performance and/or service conditions are fulfilled. The cumulative expense recognised for equity-settled transactions at each reporting date until the vesting date reflects the extent to which the vesting period has expired and the Group’s best estimate of the number of equity instruments that will ultimately vest. The income statement expense or credit for a period represents the movement in cumulative expense recognised as at the beginning and end of that period and is recognised in employee benefits expense (Note 20).
No expense is recognised for awards that do not ultimately vest, except for equity-settled transactions for which vesting is conditional upon a market or non-vesting condition. These are treated as vesting irrespective of whether or not the market or non-vesting conditions are satisfied, provided that all other performance and / or service conditions are satisfied.
When the terms of an equity-settled award are modified, the minimum expense recognised is the expense had the terms not been modified, if the original terms of the award are met. An additional expense is recognised for any modification that increases the total fair value of the security based payment transaction, or is otherwise beneficial to the employee as measured at the date of modification.
When an equity-settled award is cancelled, it is treated as if it vested on the date of cancellation, and any expense not yet recognised for the award is recognised immediately. This includes any award where non-vesting conditions within the control of either the entity or the employee are not met.
For
per
sona
l use
onl
y

ABACUS PROPERTY GROUP
94
NOTES TO THE FINANCIAL STATEMENTS 30 JUNE 2018
23. AUDITOR’S REMUNERATION
2018 2017
$ $
Amounts received or due and receivable by Ernst & Young Australia for:
- An audit of the financial report of the entity and any other entity in the consolidated group 1,037,571 1,104,110
- Other services in relation to the entity and any other entity in the consolidated group
- assurance services 95,895 116,420
- compliance services 38,200 37,150
1,171,666 1,257,680
24. EVENTS AFTER BALANCE SHEET DATE
Other than as disclosed in this report, there has been no other matter or circumstance that has arisen since the end of the financial year that has significantly affected, or may affect, the Group’s operations in future financial years, the results of those operations or the Group’s state of affairs in future financial years.
For
per
sona
l use
onl
y

ABACUS PROPERTY GROUP
95
DIRECTORS’ DECLARATION
In accordance with a resolution of the Directors of Abacus Group Holdings Limited, we state that:
In the opinion of the directors:
a. the financial statements, notes and the additional disclosures included in the directors’ report designated as audited, of the company and of the consolidated entity are in accordance with the Corporations Act 2001, including:
(i) giving a true and fair view of the company’s and consolidated entity’s financial position
as at 30 June 2018 and of their performance for the year ended on that date; and
(ii) complying with Australian Accounting Standards (including Australian Accounting
Interpretations) and the Corporations Regulations 2001;
b. the financial report also complies with International Financial Reporting Standards as disclosed in Note 22(b); and
c. there are reasonable grounds to believe that the Company will be able to pay its debts as and when they become due and payable.
This declaration has been made after receiving the declarations required to be made to the directors in accordance with sections 295A of the Corporations Act 2001 for the financial year ended 30 June 2018.
On behalf of the Board
John Thame Steven Sewell Chairman Managing Director Sydney, 17 August 2018
For
per
sona
l use
onl
y

Ernst & Young 200 George Street Sydney NSW 2000 Australia GPO Box 2646 Sydney NSW 2001
Tel: +61 2 9248 5555 Fax: +61 2 9248 5959 ey.com/au
Independent Auditor's Report to the Members of Abacus Group Holdings Limited
Report on the Audit of the Financial Report
Opinion
We have audited the financial report of Abacus Group Holdings Limited (the Company) and its subsidiaries (collectively the Group), which comprises the consolidated statement of financial position as at 30 June 2018, the consolidated statement of comprehensive income, the consolidated statement of changes in equity and the consolidated statement of cash flows for the year then ended, notes to the financial statements, including a summary of significant accounting policies, and the Directors’ Declaration.
In our opinion, the accompanying financial report of the Group is in accordance with the Corporations Act 2001, including:
(i) giving a true and fair view of the consolidated financial position of the Group as at 30 June 2018 and of its consolidated financial performance for the year ended on that date; and
(ii) complying with Australian Accounting Standards and the Corporations Regulations 2001.
Basis for Opinion
We conducted our audit in accordance with Australian Auditing Standards. Our responsibilities under those standards are further described in the Auditor’s Responsibilities for the Audit of the Financial Report section of our report. We are independent of the Group in accordance with the auditor independence requirements of the Corporations Act 2001 and the ethical requirements of the Accounting Professional and Ethical Standards Board’s APES 110 Code of Ethics for Professional Accountants (the Code) that are relevant to our audit of the financial report in Australia. We have also fulfilled our other ethical responsibilities in accordance with the Code.
We believe that the audit evidence we have obtained is sufficient and appropriate to provide a basis for our opinion.
Key Audit Matters
Key audit matters are those matters that, in our professional judgment, were of most significance in our audit of the financial report of the current year. These matters were addressed in the context of our audit of the financial report as a whole, and in forming our opinion thereon, but we do not provide a separate opinion on these matters. For each matter below, our description of how our audit addressed the matter is provided in that context. We have fulfilled the responsibilities described in the Auditor’s Responsibilities for the Audit of the Financial Report section of our report, including in relation to these matters. Accordingly, our audit included the performance of procedures designed to respond to our assessment of the risks of material misstatement of the financial report. The results of our audit procedures, including the procedures performed to address the matters below, provide the basis for our audit opinion on the accompanying financial report.
For
per
sona
l use
onl
y

Ernst & Young 200 George Street Sydney NSW 2000 Australia GPO Box 2646 Sydney NSW 2001
Tel: +61 2 9248 5555 Fax: +61 2 9248 5959 ey.com/au
Investment Properties
Why significant How our audit addressed the key audit matter
The Group’s total assets include investment properties either held directly or via interests in Joint Ventures. These assets are carried at fair value, which is assessed by the directors with reference to either external independent property valuations or internal valuations, and are based on market conditions existing at the reporting date.
This was considered a key audit matter due to the number of judgments required in determining fair value. These judgments include assessing the capitalisation rate, discount rate, market rent, re-leasing costs and forecast occupancy levels.
Disclosure of investment properties and significant judgments are included in Note 5 of the financial report.
Our audit procedures included the following:
We assessed the effectiveness of relevant controls over the leasing process and associated tenancy reports which are used as source data in the property valuations by testing a sample of the relevant controls.
For a sample of internal and external valuations, we evaluated the key assumptions and tested key inputs to tenancy schedules. These assumptions and inputs included market and contractual rent, occupancy rates including forecast occupancy levels, lease terms, re-leasing costs, operating expenditure and future capital expenditure.
For a sample of internal valuations we tested the mathematical accuracy of the valuation.
For selected properties we involved our real estate specialists to assist with the assessment of the valuation.
Where relevant we evaluated the movement in the capitalisation rates across the portfolio based on our knowledge of the property portfolio, published industry reports and comparable external valuations.
Where relevant we assessed the reasonableness of comparable transactions utilised in the valuation process.
We evaluated the suitability of the valuation methodology across the portfolio based on the type of asset; and
We assessed the qualifications, competence and objectivity of the valuers.
For
per
sona
l use
onl
y

Ernst & Young 200 George Street Sydney NSW 2000 Australia GPO Box 2646 Sydney NSW 2001
Tel: +61 2 9248 5555 Fax: +61 2 9248 5959 ey.com/au
Property Loans
Why significant How our audit addressed the key audit matter
The Group provides mortgage loans to external parties for which the underlying security is primarily development property assets.
This was considered a key audit matter as the assessment of the recoverability of the loans, including any capitalised interest, is subject to significant judgment as to the value of underlying security or performance of the underlying development. Changes in feasibility assumptions impacting project cashflows may give rise to an impairment of the loans.
Some of the loan arrangements include a profit share component that entitles the Group to additional returns, depending on the outcome of the underlying development. There are complex accounting judgments relating to the amount and timing of revenue recognition for these participation rights.
Disclosure of property loans is included in note 7 of the financial report.
Disclosure of revenue recognition policies is included in Note 22(f) of the financial report.
Our audit procedures included the following:
We considered the Group’s assessment of recoverability of the loans.
We evaluated the adequacy of the security on a sample of loans by assessing the feasibilities of the underlying development asset. For this sample we assessed the feasibility by performing procedures consistent with those performed on Inventories as set out in the inventories key audit matter below.
For a sample of properties, where a valuation was obtained as part of the recoverability assessment performed by the Group, we assessed the valuation by performing procedures consistent with those performed on Investment property valuations referred to in the preceding key audit matter.
We assessed the qualifications, competence and objectivity of the valuers, the assumptions used in the valuations and evaluated the suitability of the valuation methodology for valuations obtained.
We evaluated the classification of loans and the status of the underlying property supporting recoverability based on the expected timing of settlement and the status of the underlying developments.
We assessed the Group’s framework for recognising additional revenue for loans with profit share arrangements and re-performed the Group’s calculations based on the underlying development financial information.
For
per
sona
l use
onl
y

Ernst & Young 200 George Street Sydney NSW 2000 Australia GPO Box 2646 Sydney NSW 2001
Tel: +61 2 9248 5555 Fax: +61 2 9248 5959 ey.com/au
Inventories
Why significant How our audit addressed the key audit matter
The Group’s total assets include development property assets either held directly or via interests in Joint Ventures. Development assets are carried at the lower of cost or net realisable value. The net realisable value is determined through a feasibility model for each project that estimates the revenue and costs of the development over the life of the project.
This was considered a key audit matter as the determination of net realisable value is affected by subjective elements within the estimated costs and projected revenues over an assumed development life. These values are sensitive to changes in the underlying assumptions.
Disclosure of inventories is included in Note 6 of the financial report.
Disclosure of revenue recognition policies is included in Note 22(f) of the financial report.
Our audit procedures included the following:
We Interviewed Project Managers employed by the Group, to understand the status and progress of the developments
We assessed the historical accuracy of previous forecast development outcomes
We assessed the feasibility models prepared by the Group for a sample of developments currently in progress
Where applicable we evaluated the assumptions adopted in light of current market evidence by: comparing the sales revenue assumed to the
most recent historical or comparable sales; corroborating the costs projected to signed
contracts, recent or actual costs incurred for current or comparable projects; and
assessed contingency estimates for remaining development risks.
Where relevant, we performed sensitivity analyses in relation to the key forward looking assumptions including sales price achieved, finance costs, time to completion, and escalation rates.
We tested the mathematical accuracy of the feasibilities.
For
per
sona
l use
onl
y

Ernst & Young 200 George Street Sydney NSW 2000 Australia GPO Box 2646 Sydney NSW 2001
Tel: +61 2 9248 5555 Fax: +61 2 9248 5959 ey.com/au
Equity Accounted Investments
Why significant How our audit addressed the key audit matter
The Group has entered into a number of joint venture arrangements which are involved in property investment or property development. The application of the equity method of accounting for the joint venture investments is predicated on the Group having joint control with the other party(ies) under the arrangements.
We have focused on this area as a key audit matter due to the judgment involved in assessing whether the entities are controlled or joint ventures. Some joint arrangements include the potential to earn variable returns subject to reaching certain performance thresholds. The determination of the variable returns is based on a calculation that is specified under the relevant joint venture agreement.
Disclosure of equity accounted investments is included in Note 8 of the financial report.
Our audit procedures included the following:
For new joint ventures entered into during the year we assessed the joint venture agreements to understand the ownership interest and rights of each joint venture party. We considered the Group’s assessment of joint control and the determination of applying equity accounting to the investment.
For existing joint ventures we confirmed with the Group that there had been no changes to the joint arrangements with respect to decision making power and entitlement to profits nor in the underlying operation and performance of the arrangement, which would amend the conclusion from prior periods.
We assessed the Group’s variable return calculation against the provisions of the joint venture agreement and tested the calculation methodology.
For
per
sona
l use
onl
y

Ernst & Young 200 George Street Sydney NSW 2000 Australia GPO Box 2646 Sydney NSW 2001
Tel: +61 2 9248 5555 Fax: +61 2 9248 5959 ey.com/au
Information Other than the Financial Report and Auditor’s Report Thereon
The directors are responsible for the other information. The other information comprises the information included in the Group’s 2018 Annual Report, other than the financial report and our auditor’s report thereon. We obtained the Directors’ Report that is to be included in the Annual Report, prior to the date of this auditor’s report, and we expect to obtain the remaining sections of the Annual Report after the date of this auditor’s report.
Our opinion on the financial report does not cover the other information and we do not and will not express any form of assurance conclusion thereon, with the exception of the Remuneration Report and our related assurance opinion.
In connection with our audit of the financial report, our responsibility is to read the other information and, in doing so, consider whether the other information is materially inconsistent with the financial report or our knowledge obtained in the audit or otherwise appears to be materially misstated.
If, based on the work we have performed, we conclude that there is a material misstatement of this other information, we are required to report that fact. We have nothing to report in this regard.
Responsibilities of the Directors’ for the Financial Report
The directors of the Company are responsible for the preparation of the financial report that gives a true and fair view in accordance with Australian Accounting Standards and the Corporations Act 2001 and for such internal control as the directors determine is necessary to enable the preparation of the financial report that gives a true and fair view and is free from material misstatement, whether due to fraud or error.
In preparing the financial report, the directors are responsible for assessing the Group’s ability to continue as a going concern, disclosing, as applicable, matters relating to going concern and using the going concern basis of accounting unless the directors either intend to liquidate the Group or to cease operations, or have no realistic alternative but to do so.
Auditor’s Responsibilities for the Audit of the Financial Report
Our objectives are to obtain reasonable assurance about whether the financial report as a whole is free from material misstatement, whether due to fraud or error, and to issue an auditor’s report that includes our opinion. Reasonable assurance is a high level of assurance, but is not a guarantee that an audit conducted in accordance with the Australian Auditing Standards will always detect a material misstatement when it exists. Misstatements can arise from fraud or error and are considered material if, individually or in the aggregate, they could reasonably be expected to influence the economic decisions of users taken on the basis of this financial report.
As part of an audit in accordance with Australian Auditing Standards, we exercise professional judgment and maintain professional scepticism throughout the audit. We also:
Identify and assess the risks of material misstatement of the financial report, whether due to fraud or error, design and perform audit procedures responsive to those risks, and obtain audit evidence that is sufficient and appropriate to provide a basis for our opinion. The risk of not detecting a material misstatement resulting from fraud is higher than for one resulting from error, as fraud may involve collusion, forgery, intentional omissions, misrepresentations, or the override of internal control.
For
per
sona
l use
onl
y

Ernst & Young 200 George Street Sydney NSW 2000 Australia GPO Box 2646 Sydney NSW 2001
Tel: +61 2 9248 5555 Fax: +61 2 9248 5959 ey.com/au
Obtain an understanding of internal control relevant to the audit in order to design audit procedures that are appropriate in the circumstances, but not for the purpose of expressing an opinion on the effectiveness of the Group’s internal control.
Evaluate the appropriateness of accounting policies used and the reasonableness of
accounting estimates and related disclosures made by the directors.
Conclude on the appropriateness of the directors’ use of the going concern basis of accounting and, based on the audit evidence obtained, whether a material uncertainty exists related to events or conditions that may cast significant doubt on the Group’s ability to continue as a going concern. If we conclude that a material uncertainty exists, we are required to draw attention in our auditor’s report to the related disclosures in the financial report or, if such disclosures are inadequate, to modify our opinion. Our conclusions are based on the audit evidence obtained up to the date of our auditor’s report. However, future events or conditions may cause the Group to cease to continue as a going concern.
Evaluate the overall presentation, structure and content of the financial report, including the
disclosures, and whether the financial report represents the underlying transactions and events in a manner that achieves fair presentation.
Obtain sufficient appropriate audit evidence regarding the financial information of the
entities or business activities within the Group to express an opinion on the financial report. We are responsible for the direction, supervision and performance of the Group audit. We remain solely responsible for our audit opinion.
We communicate with the Directors regarding, among other matters, the planned scope and timing of the audit and significant audit findings, including any significant deficiencies in internal control that we identify during our audit.
We also provide the directors with a statement that we have complied with relevant ethical requirements regarding independence, and to communicate with them all relationships and other matters that may reasonably be thought to bear on our independence, and where applicable, related safeguards.
From the matters communicated to the directors, we determine those matters that were of most significance in the audit of the financial report of the current year and are therefore the key audit matters. We describe these matters in our auditor’s report unless law or regulation precludes public disclosure about the matter or when, in extremely rare circumstances, we determine that a matter should not be communicated in our report because the adverse consequences of doing so would reasonably be expected to outweigh the public interest benefits of such communication.
For
per
sona
l use
onl
y

Ernst & Young 200 George Street Sydney NSW 2000 Australia GPO Box 2646 Sydney NSW 2001
Tel: +61 2 9248 5555 Fax: +61 2 9248 5959 ey.com/au
Report on the Audit of the Remuneration Report
Opinion on the Remuneration Report
We have audited the Remuneration Report included in pages 19 to 32 of the Directors' Report for the year ended 30 June 2018.
In our opinion, the Remuneration Report of Abacus Group Holdings Limited for the year ended 30 June 2018, complies with section 300A of the Corporations Act 2001.
Responsibilities
The Directors of the Company are responsible for the preparation and presentation of the Remuneration Report in accordance with section 300A of the Corporations Act 2001. Our responsibility is to express an opinion on the Remuneration Report, based on our audit conducted in accordance with Australian Auditing Standards.
Ernst & Young
Kathy Parsons Partner Sydney 17 August 2018
For
per
sona
l use
onl
y