
Abab presents today. A closer look at the production process of a movie soundtrack. What elements...
32
ab presents today
-
Upload
theodora-hamilton -
Category
Documents
-
view
213 -
download
0
Transcript of Abab presents today. A closer look at the production process of a movie soundtrack. What elements...

abpresents today

A closer look at the production
process of a movie soundtrack.
What elements are affecting recorded sound quality ?

Back to basics for only a moment...
- Silver halide crystals were found to be light sensitive
- Being light sensitive means that these grains are able to absorb photons or quanta of light energy.
- Absorption is not evident, but function of different parameters (photon energy, angle of incidence…)
- Having absorbed the threshold number of quanta makes a grain developable.
- Photon energy is defined by it’s wavelength, and to be high enough, wavelength must be shorter than 495 nm.
- Once the threshold is reached, any further absorbed quanta are wasted and have no further contribution to image forming.
- For practical reasons, grains are dispersed in a light sensitive emulsion and coated on a transparent base.
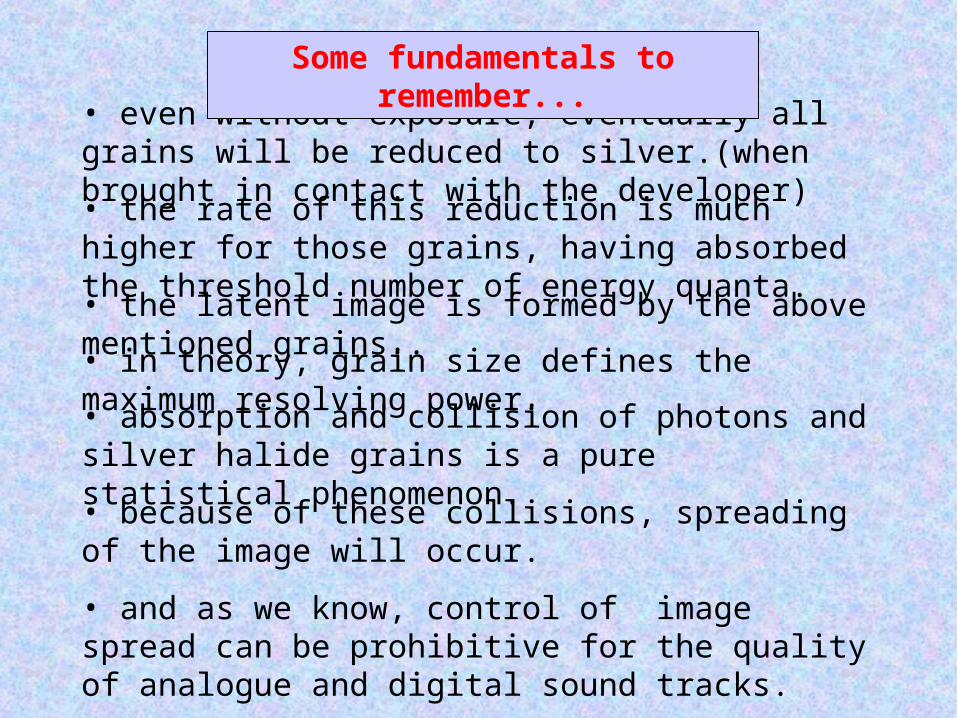
• even without exposure, eventually all grains will be reduced to silver.(when brought in contact with the developer)
• the rate of this reduction is much higher for those grains, having absorbed the threshold number of energy quanta.
• the latent image is formed by the above mentioned grains..
• absorption and collision of photons and silver halide grains is a pure statistical phenomenon.
• because of these collisions, spreading of the image will occur.
• and as we know, control of image spread can be prohibitive for the quality of analogue and digital sound tracks.
• in theory, grain size defines the maximum resolving power.
Some fundamentals to remember...

emulsion layer
base (polyester)
Let’s have a look at this phenomenon.

reduce thickness of the emulsion layer
increase base density
because of the low printing speed in “those” days,
and hence the availability of enough light, increasing base density was an acceptable solution.
this is why “grey base” was introduced
years ago.
1 2
How to reduce image spread.

How does it work.
- An increased base density reduces intensity of the reflected light.
- This reduction decreases probability of absorption.
- However this probability will never be zero.
- So if there’s a collision, image spread can be relatively high also.
An elegant solution for this problem is,
- To add an extra (anti halation) high density layer between the emulsion package and the base, of which
- To use a normal transparent polyester base, and
- dye’s are loosing (in a controlled way) density during processing.
The result will be...
Less spreading of the image and hence and increased sharpness !

• to increase resolving power (sharpness) of the material, grain size can be reduced.
• to increase the probability of collision between photons and grains (and therefore increase speed), grain size must be increased.
0.0
0.2
0.4
0.6
0.8
1.0
1.2
1.4
1.6
1.8
-2.0 -1.0 0.0 1.0log (a) mm2
log
(spe
ed)
Therefore the higher the sharpness of a material(with the same amount of silver),
the lower the sensitivity.
A few complications...

• increasing sharpness will result in a reduced image spread.
• therefore, to obtain the same level of image spread, a sharper material needs a higher aim density.
Conclusion
Whatever a film manufacturer will change in photographic characteristics, it will always have
an impact upon practical settings as aim densities and or exposure values.
And even more...

sound negative
colour positive
And what about contact printing ?

Sound negative characteristics
Sound camera exposure
Black & White processing
Colour positive characteristics
Printingprocess
Colour processing
Reproduction
(projector characteristics)
0.0%
50.0%
100.0%
1000 100000
0.0%
50.0%
100.0%
1000 100000
sound camera
0.0%
50.0%
100.0%
1000 100000
CP20 PAN
CP20ORTHO
0.0%
50.0%
100.0%
1000 100000
projector
Conclusion
The final quality (frequency response) depends upon every detail in the production process.
Elements affecting sound quality.

0.0%
10.0%
20.0%
30.0%
40.0%
50.0%
60.0%
70.0%
80.0%
90.0%
100.0%
110.0%
120.0%
1000 10000 100000Frequency (Hz)
Res
po
nse
(%
) CP20ORTHO
ST9
CP20 PAN
Total Film
projector
sound camera
projector + camera
System response
Let’s have a look at the total frequency response.

light source and optics detector and optics
colour print
Dmax
Dmin
S(t)=Sin (t)
10Dmin+
1 - Sin (t)
10Dmax
And what about the sound level ?

S(t) =Sin (t)
10Dmin+
1 - Sin (t)
10Dmax
S(t) =Sin (t)
10Dmin-
Sin (t)
10Dmax+
1
10Dmax
with 1/10Dmax neglected,
S(t) = ( - ) Sin (t)1
10Dmax
One slide with some mathematics
Example: with Dmin = 0.20 and Dmax = 1.2 we obtain S(t) = 0.57. Sin(t) + 0.06
10Dmin
1

The previous formula visualized
Dmin = 0.21
Dmin = 0.1
0%
10%
20%
30%
40%
50%
60%
70%
80%
90%
100%
0 0.5 1 1.5 2 2.5Dmax
Res
pons
e
Conclusions
Cyan dye tracks (on a red reader) produce 33% more output.
At Dmax = 1.5 the output level reaches more than 95% !!

Reference to measurements, carried out on the Dolby Digital signal.
Both sources of information, shape of the dots as well as density scans are
used in an attempt to reveal the digital printing process.
And what about digital tracks ..?

Camera setting 11 Camera setting 15 Camera setting 19
Influence of B&W chemistry upon density reconstruction in a sound negativePROCESSINGCONDITIONS
A
B
Camerasetting

S1
S10
S19
S28
S37
S46
S55
S64
0
0.2
0.4
0.6
0.8
1
1.2
1.4
1.2-1.4
1-1.2
0.8-1
0.6-0.8
0.4-0.6
0.2-0.4
0-0.2
Densitometrical dot shape is very importantDensitometrical dot shape is very important
And therefore, a standardized B&W chemistry is an issue.

0.0
0.2
0.4
0.6
0.8
1.0
1.2
1.4
1.6
0 20 40 60 80 100 120 140 160Distance (microns)
Den
sity
Chemistry (A)
Chemistry (B)

0.0
1.0
2.0
3.0
4.0
5.0
6.0
0 5 10 15 20 25
Let’s make a simulation...
Exposure energy
Den
sity
Starting with the characteristic curve

0.0
1.0
2.0
3.0
4.0
5.0
6.0
0 5 10 15 20 250 2 4 6 8 10
12
14
16
18
20
05
01
001
50
20
02
50
0.0
1.0
2.0
3.0
4.0
5.0
6.0
0 50 100 150 200 250

0.0
1.0
2.0
3.0
4.0
5.0
6.0
0 5 10 15 20 25
0 2 4 6 8 10 12 14 16 18 20
05
01
001
502
00
250
0.0
1.0
2.0
3.0
4.0
5.0
6.0
0 50 100 150 200 250

0.0
1.0
2.0
3.0
4.0
5.0
6.0
0 5 10 15 20 250 2 4 6 8 10 12 14 16 18 20
05
01
001
502
00
250
0.0
1.0
2.0
3.0
4.0
5.0
6.0
0 50 100 150 200 250

0.0
1.0
2.0
3.0
4.0
5.0
6.0
0 5 10 15 20 25
0.0
1.0
2.0
3.0
4.0
5.0
6.0
0 50 100 150 200 250 0 2 4 6 8 10
12
14
16
18
20
05
01
001
50
20
02
50

0.0
0.5
1.0
1.5
2.0
2.5
3.0
3.5
4.0
4.5
1 6 11 16 21

0.0
1.0
2.0
3.0
4.0
5.0
6.0
0 5 10 15 20 25
0.0
1.0
2.0
3.0
4.0
5.0
6.0
0 50 100 150 200 250 0 2 4 6 8 10
12
14
16
18
20
05
01
001
50
20
02
50
If we define a detection range
as being the difference inminimum and maximum
signal level..
D

0.0
0.1
0.2
0.3
0.4
0.5
0.6
0.7
0.8
0.9
1.0
1.1
1.2
1.3
1.4
0 0.3 0.6 0.9 1.2 1.5 1.8 2.1 2.4Log E shift
Det
ectio
n ra
nge
(log)
We can calculate the range D
as a function of exposure level.
Or even the maximum density value
of the dots in the colour print.
0
1
2
3
4
5
6
0 0.3 0.6 0.9 1.2 1.5 1.8 2.1 2.4Log E shift
Pix
el d
ensity
And therefore if the glitches where the only players in the game,
it would be easy to make the optimum parameter choices !!

But, there’s also image spread !!
0
1
2
3
4
5
6
0 0.3 0.6 0.9 1.2 1.5 1.8 2.1 2.4Log E shift
Pix
el d
ensity
0
4
8
12
16
20
24
Imag
e s
prea
d (m
icro
ns)
18m
0%
20%
40%
60%
80%
100%
120%
0 20 40 60 80 100 120distance (micron)
Sig
na
l le
vel
0%
20%
40%
60%
80%
100%
120%
0 20 40 60 80 100 120distance (micron)
Sig
na
l le
vel
0%
20%
40%
60%
80%
100%
120%
0 20 40 60 80 100 120
distance (micron)
Sig
na
l le
vel
0%
20%
40%
60%
80%
100%
120%
0 20 40 60 80 100 120
distance (micron)
Sig
na
l le
vel
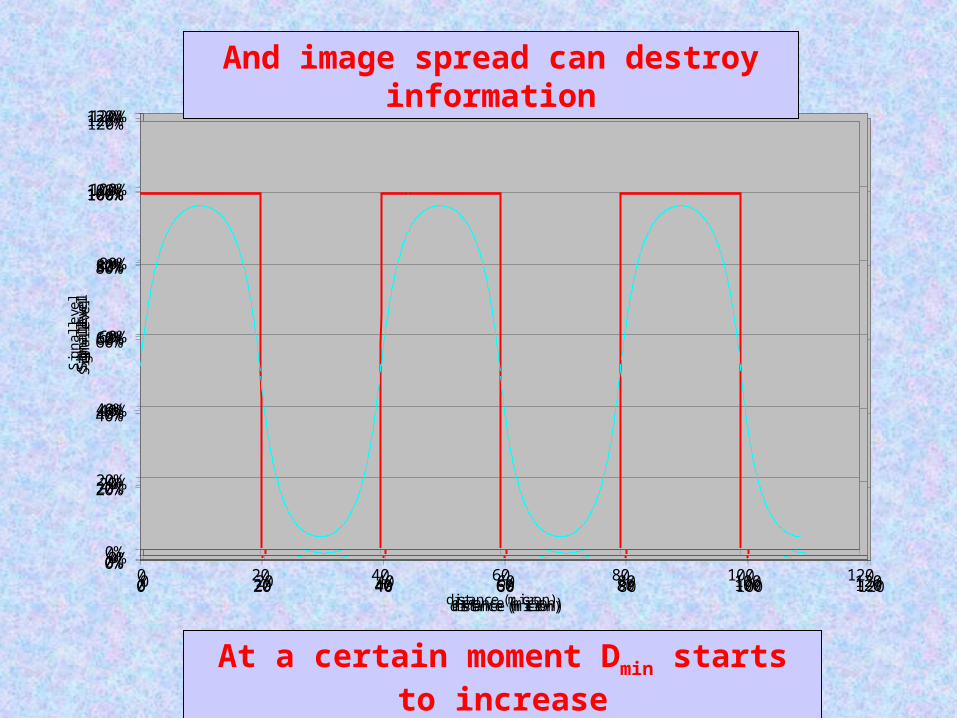
And image spread can destroy information
At a certain moment Dmin starts to increase

Let’s therefore have a look at the relationship between detection margin and image spread...
5 to 6m
0.0
0.2
0.4
0.6
0.8
1.0
1.2
1.4
0 0.3 0.6 0.9 1.2 1.5 1.8 2.1 2.4Log E shift
Dete
ctio
n r
ange (
log)
0
4
8
12
16
20
24
28
Image s
pre
ad (
mic
rons)
Dred= 1.3

General Conclusions.
- a standardization of aim densities would be very welcome
- with high magenta tracks being a reality and cyan dye technology coming up, also filter characteristics should be “common knowledge”.
- there’s a need for a stable and “easy to use” black & white processing.
Our proposal
A- Is to set up a specialized committee, with the objective to determine, for all kinds of motion picture sound recording technologies, a standardized practical set of aim densities and filter characteristics.
B- To act quickly and to communicate the findings of this committee asap to all participants.

Finally, what’s new from AGFA ?
We improved our ST9 significantly !
- Because they have been good all the time, there was no need to improve the photographic characteristics.
- So we concentrated on physical performances...
- And we improved the mechanical resistance dramatically!
- We made our sound negative permanent anti static !
That’s it for now ...