
Ab initio Study of Tantalum Nitride and Silver Adatoms by ... · Ab initio Study of Tantalum...
106
Ab initio Study of Tantalum Nitride and Silver Adatoms by Michael Grumski A Dissertation Presented in Partial Fulfillment of the Requirements for the Degree Doctor of Philosophy Approved April 2012 by the Graduate Supervisory Committee: James Adams, Chair Stephen Krause Terry Alford ARIZONA STATE UNIVERSITY May 2012
-
Upload
phungkhanh -
Category
Documents
-
view
214 -
download
0
Transcript of Ab initio Study of Tantalum Nitride and Silver Adatoms by ... · Ab initio Study of Tantalum...

Ab initio Study of Tantalum Nitride and Silver Adatoms
by
Michael Grumski
A Dissertation Presented in Partial Fulfillment of the Requirements for the Degree
Doctor of Philosophy
Approved April 2012 by the Graduate Supervisory Committee:
James Adams, Chair
Stephen Krause Terry Alford
ARIZONA STATE UNIVERSITY
May 2012
i
ABSTRACT
In 2022, integrated circuit interconnects will approach 10 nm and the diffusion
barrier layers needed to ensure long lasting devices will be at 1 nm. This dimension
means the interconnect will be dominated by the interface and it has been shown the
interface is currently eroding device performance. The standard interconnect system has
three layers – a Copper metal core, a Tantalum Adhesion layer and a Tantalum Nitride
Diffusion Barrier Layer.
An alternate interconnect schema is a Tantalum Nitride barrier layer and Silver as
a metal. The adhesion layer is removed from the system along with changing to an
alternate, low resistivity metal. First principles are used to assess the interface of the
Silver and Tantalum Nitride. Several stoichiometric 1:1 Tantalum Nitride polymorphs
are assessed and it is found that the Fe2P crystal structure is actually the most stable
crystal structure which is at odds with the published phase diagram for ambient crystal
structure. The surface stability of Fe2P-TaN is assessed and the absorption enthalpy of
Silver adatoms is calculated. Finally, the thermodynamic stability of the TaN-Ag
interconnect system is assessed.
ii
DEDICATION
The little fur ball who often gave me more trouble than any human could, but still makes
me smile. She was always and still is beside me.
The man who will always be an example of who I am and what I should strive to be.
Thank you Elmer (Grandpap) Wolf and Pepper Grumski, you both are in my heart
forever.
Pepper Grumski – 2000 to 2010
Elmer Wolf – 1918 to 2012

iii
ACKNOWLEDGMENTS
I would like to thank all of those who have been at my side over the years,
pressing and pushing me forward.
To my Intel Peers, Scott Buck, Subra Iyer, Matt Knowles, Kevin Heidrich and
Bruce Gilmore, for their patience. To James Clarke, Adam Schafer, Ron Woodbeck and
Rick Livengood who always provide support on how to improve and drive myself both
intellectually and personally.
To my academic peers, Pratik Dholabhai and Shahriar Anwar, thank you for all
of your guidance on ab initio Studies and on how to engage in an academic environment.
Dr Amery and Dr Widenhouse as examples of what I can strive to be in industry.
To my committee, Dr Krause who always provided good guidance on both my
early work and how to approach my current dissertation. To Dr Alford for his direct and
generous feedback. To Dr James Adams for his constant sanity and intellectually insights
on what the actual information means.
To my parents who always supported me through my education. To my Sister,
In-laws and extended family who provide me with connections to what I should be on a
regular basis.
To my pups’, Liberty and Bella, who often remind me of the important aspects of
life like; dessert and sleep. To my sons’, Joshua and David, who often give me an
opportunity to see what I really am and provide me incentive to improve. And finally to
my intellectual peer and love, my wife, Bonnie, who often points out she did way, way
better than I in the State Science fair prior to us meeting in college.

iv
TABLE OF CONTENTS
Page
LIST OF TABLES .................................................................................................................. vi
LIST OF FIGURES ................................................................................................................ vii
PREFACE...... ........................................................................................................................ viii
CHAPTER
1 INTRODUCTION ............................................................................................. 1
Interconnects ................................................................................................. 2
Barrier Layers and Interface Considerations ................................................ 7
Methods for Interface Studies ....................................................................... 9
Summary ..................................................................................................... 11
2 LITERATURE REVIEW OF MATERIAL SYSTEMS ............................... 12
Metal Interconnects ..................................................................................... 12
Tantalum Nitride ......................................................................................... 14
Research Goals ............................................................................................ 21
3 AB INITIO THEORY ...................................................................................... 23
Density Functional Theory ......................................................................... 24
Exachange Correlation ................................................................................ 26
Planewave Basis Set .................................................................................... 27
Periodic Boundary Conditions and K Space .............................................. 28
Pseudopotentials .......................................................................................... 28
Energies and Forces .................................................................................... 29
VASP Implementation and Reliability ....................................................... 30
Geometry ..................................................................................................... 32
Charge Density Plots ................................................................................... 33

v
CHAPTER Page
Density of States.......................................................................................... 33
Electron Localization Functional ................................................................ 34
Bader Analysis ............................................................................................ 35
4 AB INITIO STUDIES OF BULK TANTALUM NITRIDE ......................... 36
Bulk Studies Calculations Methods ............................................................ 37
Lattice Calculations ..................................................................................... 40
Bulk Studies - Modulus .............................................................................. 42
Thermodynamic Properties Results and Discussion .................................. 42
Density of States, Electron Localization Functional and Bader Analysis . 45
System Discussion and Summary............................................................... 48
5 POINT DEFECTS IN BULK TANTALUM NITRIDE ................................ 51
Defect Analysis Methods ............................................................................ 51
CoSn-TaN Vacancies .................................................................................. 53
Fe2P-TaN Vacancies ................................................................................... 56
NaCl-TaN Vacancies .................................................................................. 57
Summary ..................................................................................................... 58
6 TANTALUM NITRIDE SURFCE AND ADATOMS.................................. 60
Bond Energy calculations ........................................................................... 60
Surface Energy Calculations ....................................................................... 61
Methods of Ag Adatoms on TaN ............................................................... 70
Ag Adatom on CoSn-TaN .......................................................................... 72
Ag Adatom on Fe2P-TaN ........................................................................... 75
Summary ..................................................................................................... 76
7 SUMMARY ..................................................................................................... 78

vi
CHAPTER Page
Bulk Tantalum Nitride ................................................................................ 78
Surface Studies ............................................................................................ 79
Concluding remarks on Interconnect Directions ........................................ 79
Potential Future Research ........................................................................... 80
REFERENCES ...................................................................................................................... 81
APPENDIX
A POSCAR FOR HEXAGONAL STRUCTURES ........................................ 88
B COPYWRITE PERMISSION ...................................................................... 91
BIOGRAPHICAL SKETCH ................................................................................................. 96

vii
LIST OF TABLES
Table Page
1. Modern Interconnect dimensions ...................................................................... 4
2. Crystal structure of aluminum, copper, gold and silver. ................................. 14
3. Table of Tantalum Nitride Polymorphs ......................................................... 17
4. Table of Ab Initio Studies run on TaN in CoSn phase. EX is the Exchange Correlation Functional.................................................................................. 18
5. Published Ab Initio summary statistics .......................................................... 18
6. Table of the various crystal phases used in this study. ................................... 33
7. Results for the lattice parameters, previously published studies and
experimental results found in the literature. ................................................ 41
8. Ab initio results for Bulk Modulus (GPa) for the 3 phases, experimentally found results and published ab inito values. ................................................ 43
9. Calculated Cohesive Energy for NaCl, CoSn and Fe2P phases ..................... 43
10. Ab initio results for Heat of Formation (eV/atom) for the 3 phases,
experimentally found results and published ab initio values. ..................... 44
11. Bader Analysis Results for all 3 phases. ........................................................ 48
12. The enthalpy of formation for the vacancy formation energies in the crystal phases studied. ............................................................................................. 55
13. Assessment of supercell distortions for Vacancy defects and perfect cells ... 55
14. Table of the Enthalpy for additional vacancies in at 64 atom supercell of
NaCl-TaN. ................................................................................................... 58
15. Surface energy calculated for Fe2P. ................................................................ 68
16. Slab information for the Fe2P surface calculations. ....................................... 69
17. Adatom surface energies and atomic movements calculated for the (0001) CoSn-TaN surface ........................................................................................ 75
18. Enthalpies of Hollow Adatoms on Fe2P-TaNstudies. ..................................... 77

viii
LIST OF FIGURES
Figure Page
1. Cross Section of Integrated Circuit ................................................................... 3
2. Cross Section showing all materials of an Interconnect. ................................... 4
3. Resistivity scaling of Interconnect lines upon line width scaling. ................... 7
4. Graph of Metal Resistivity with respect to temperature. ................................. 13 5. Phase Diagram of Tantalum Nitride1. .............................................................. 16 6. Figure of the atomic movements of Nitrogens and Tantalums ....................... 20 7. Total publications on Density Functional Theory as determined by performing
a search on Web of Science .......................................................................... 32 8. Calculated energy vs. volume curves for the NaCl, CoSn and Fe2P phases of
Tantalum Nitride ........................................................................................... 41 9. Density of States of Tantalum Nitride. The three phases appear metallic.
Fermi Energy for all three phases is shifted to 0 eV .................................... 46 10. Location of different types of Tantalums compared to Nitrogen in the CoSn
and Fe2P phases. ............................................................................................ 49 11. Iso-contours for the Charge Density and Electron Localization Functional for
NaCl-TaN ...................................................................................................... 47 12. Iso-contours for the Charge Density and Electron Localization Functional for
CoSn-TaN ...................................................................................................... 47 13. Iso-contours for the Charge Density and Electron Localization Functional for
Fe2P-TaN. ..................................................................................................... 48 14. Crystal structures for CoSn and Fe2P TaN. The Nitrogens and Tantalums
shifts can be seen in and are slight between the two phases. ....................... 52
15. CoSn-TaN Nearest Neighbor movements around vacancies .......................... 54
16. NaCl-TaN 64 atom supercell showing location of vacancies......................... 59
17. Graph of the Enthalpy and Gibbs Free Energy at 1993 K (Enthalpy + Entropy-Configurational) curve for varied atomic compositions of the NaCl-TaN phase.. ........................................................................................................... 59
18. Energy convergence for bond energy calculations for Nitrogen-Silver and
Tantalum-Silver. ........................................................................................... 61

ix
Figure Page
19. Graphs of the Vacuum expansion calculations of the Fe2P 96 atom cell. Left side graph has the bulk cell energy/at for reference included in it. .............. 62
20. Surface Energy of the Fe2P-TaN with (0001) and (0002) surfaces. The
Tantalum chemical potential is varied as described. ................................... 65
21. Atomic Movement of the (0001) terminated Fe2P slab ................................... 69
22. Atomic Movement of the (0002) terminated Fe2P slab. .................................. 70 23. Atomic Movement of the mixed surface Fe2P slab. ........................................ 70 24. Surface energy calculation for the Fe2P-TaN at 300K .................................... 70 25. Surface energy calculation for the Fe2P-TaN at 1000K .................................. 71 26. Location of Adatoms for both Fe2P and CoSn phases. ................................... 73 27. Location of proximity effects of adatoms with Hollow A locations populated
with Ag adatoms.. .......................................................................................... 74 28. Adatom movements for the CoSn-TaN (0001) surface ................................... 76

1
Chapter 1
INTRODUCTION
The semiconductor industry has been following Moore’s law for approximately
50 years. The law is based on the economic scaling of the integrated circuits used in
products from cell phones to laptops to supercomputers. The law basically predicts the
doubling of the density of transistors in a device every two years or so. The continued
compaction of devices and increased densities has allowed the growth and expansion of
computational and technological innovations we are seeing over the course of the past 50
years. The continued pace of the semiconductor industry is reliant upon understanding
how materials behave on atomic scales as the devices are approaching atomic
dimensions.
In the 2020 timeframe, the interconnects will approach sub-10 nm's in width and
the barrier/adhesion layers necessary for the metal lines to be produced will be < 2 nm in
thickness. At these aggressive thicknesses, the interface of the metal line and the
adhesion/barrier layer will become a critical barrier to further improvement in IC speed
performance as the interface will be a primary contributor to the devices switching time.
The time delay induced by the interface is due to electron scatter.
Currently, interconnects are layered structures of 3 materials with copper for the
metal, tantalum for the adhesion layer and tantalum nitride for the barrier layer. Research
is underway to assess alternate barrier/adhesion layer materials, but there are limited
studies on alternate metals with barrier/adhesion layers. Silver has been suggested in the
literature as an alternate metal to copper due to its improved bulk resistivity properties.
This dissertation will attempt to assess an alternate path to allow for continued scaling of
the interconnect by simplifying the material makeup. The work will be based on ab initio
studies to help understand if there is a better material set for the interconnect.
2
The dissertation is organized as follows: The First Chapter discusses the
Interconnect system and projected issues facing the metal wiring as it is scaled to
continue the pace of Moore’s Law. The Second Chapter reviews the materials typically
used along with an overview of the selected alternate materials will be presented. The
Third Chapter is a review of the ab initio technique employed in the studies. The
remaining chapters are dedicated to the studies performed and the results of the
dissertation.
This chapter is organized to highlight key technical underpinnings for the
interconnect, issues with scaling of the system and proposes an alternate way of looking
at the system. First an overview of the Interconnects is provided along with the key
issues faced with the systems.
Interconnects
Modern Integrated Circuits (IC) have features on the order of 32 nm.2 Figure 1
shows a cross section of an IC and the interconnects have around 10 levels. The levels
include metal wiring in the plane of the wafer and metal VIA’s which connect between
layers. With continued scaling, IC interconnects will begin to approach 10 nm in width
by 2020. The interconnects need low resistivity with copper being the most widely used
metal. The move to Copper was induced by the fact that the first interconnect metal,
Aluminum, had high resistivity and long term stability issue, namely electromigration.
Copper has issues with its use as it readily reacts with ILD and shorts devices. A
barrier layer is used. The barrier is needed for copper and other highly conductive
metals including silver or gold. State of the art metallization schemas use dual
damascene processing where the interlayer dielectric (ILD) is patterned for 2 layers and

3
then a barrier layer is deposited followed by an adhesion layer with the metal deposited in
a multiple step process.
Figure 1. Cross Section of Integrated Circuit 2
The adhesion layers are in place to enhance coating of the metal to the barrier
layers. This results in a multi-layer, heterogeneous system that has 4 interfaces as shown
in Figure 2. The complexity of the processing schema adds cost and potential yield
issues due to integration complexity. In 2022, the barrier layer approaches atomic
thicknesses with dimensions for the interconnect system provided in Table 1 along with
typical materials used for the layer. 2
The barrier and adhesion materials can change or be changed stoichiometrically,
crystallographically, or chemically depending on the processing characteristics of the
individual integrated circuit manufacturer. The common materials for barrier layers are
refractory metals, nitrides and oxides as these show good resistance to copper diffusivity.

4
The barrier materials typically are not conducive to conformal coating by the interconnect
metal. These composite systems are starting to have issues as they are approaching
atomic dimensions.
Figure 2. Cross Section showing all materials of an Interconnect. Layer A (red) is the Barrier Layer, Layer B (dark blue) is the Adhesion Layer.
Table 1. Modern Interconnect dimensions 2 Layer Width (nm) in
2022 Common Production Material
Metal Line 8 to 12 Copper Adhesion Layer 0.8 Tantalum Barrier Layer 0.8 to 1 tantalum nitride or titanium nitride Interlayer Dielectric (ILD)
NA carbon doped silicon dioxide
Interconnect Scaling Issues: Resistivity and Electromigration
The issues seen with Aluminum which prompted the move to the Copper
Interconnect system are once again showing up as the dimensions of the device
approaches atomic scale. The interface of the copper Interconnect system is central to the
constraints of scaling the interconnects. The two issues associated with Aluminum,
resistivity and electromigration are being seen in the system. Resistivity results in power
consumption occurring by the device above the theoretical operational power of the
gates. In addition, it results in a delay in the Resistivity Capacitance (RC) delay which is
induced by the electrical characteristics of the complete barrier/adhesion layer and metal
Interlayer Dielectric (ILD)
MetalAB
Interlayer Dielectric (ILD)
MetalAB

5
line as a complete system. The metal line length contributes to the phenomena. As
shown in figure 1, the interconnect lengths can be divided into three different lengths:
Local, Intermediate and Global. Local interconnects connect close electrical devices, are
very short from line length perspective, and do not have significant RC delay. The
intermediate and global interconnects do have considerable length and ultimately can
contribute to the overall RC delay, constraining the IC’s overall speed and thus are a
central concern for device performance. Devices shrink at a fairly constant rate per
generation and the generation iteration has historically been on a 2 year interval.
Moore’s law accounts for this pattern from an economic sense. RC delay per generation
can be described via a very simple, general equation: 3
+=
2
2
2
2
0 42T
L
P
LRC ρεε
1
Where ρ is the specific resistance, ε is the ILD permittivity, ε0 is vacuum permittivity, L
is the line length, P is the pitch between lines, T is the line thickness. This provides a
measure of RC delay scaling which contributes a significant portion to the overall speed
of an integrated device.4 If the lines are too close together, there will be a capacitance
delay induced by the coupling of the electrical fields. In addition to the general scaling
effect, the continued interconnect shrinking pushes the need to understand how interfaces
can contribute to the overall device performance. It has been shown that the sidewall
barrier properties are among the single largest contributors to the RC delay at aggressive
dimensions.2, 5 The RC delay becomes more prevalent upon metal lines shrinking as the
surface contribution of the electron scatter in the metal line goes up relative to the bulk
electron transport. This phenomenon is shown in Figure 3.

6
In addition to the RC Delay issue, electromigration is a pervasive issue with
copper interconnects. Electromigration is a phenomenon that occurs over time and is a
critical failure mechanism for IC’s.2, 6, 7 It occurs due to a momentum exchange between
electrons and metal atoms. The interaction leads to a net diffusion of metal atoms in one
direction. At the cathode end of the line, a void is formed. At the anode end, a metal
extrusion forms. This leads to device failure as the interconnect will short to another
interconnect or become unconnected. The phenomenon occurs at the surface of the
copper and is believed to be driven by copper diffusion at the interface of the adhesion
layer or the copper grain boundaries. Better adhesion and greater chemical bond
reactivity of the barrier layer to the metal layer is believed to slow the phenomena and
could explain early copper interconnect lifetimes being short due to the barrier/liner
systems not being optimized.8
The scaling of the interconnect system is associated with the interfaces of the
system and the complexity of the interconnect system. Research is ongoing to assess
other barrier and adhesion layers to eliminate the side wall RC delay and allow
interconnect scaling. Another approach is to assess the interconnect system as a
composite and attempt to optimize the overall structure, this basically means to not just
change the adhesion/barrier layers, but to determine if a change in the metal could enable
improved scaling.
The author is assuming that low resistive metals, Copper, Silver or Gold, will
provide the best interconnect electrical performance and hence a barrier layer will be
needed. The choice of the metal and the barrier layer will be discussed in chapter 2.
Before this, a review of what is needed for a barrier layer and stability of an interface
should be reviewed.

7
Figure 3. Resistivity scaling of Interconnect lines upon linewidth scaling.9
Barrier Layers and Interface Considerations
The properties of nanometer size systems are defined by the interface.10 A key
part of the assessment of a new metal will be if the interconnect system is mechanically
stable as a composite and if it can be scaled to the needed dimensions while maintaining
mechanical stability, relatively inert from a thermodynamic perspective and its electrical
characteristics are unchanged.
Interfaces are the region between two dis-similar substances either in terms of
chemical composition, crystal structure or both. An alternative way of interpreting an
interface is by considering it a buried structure or defect.10 The interface is a 2-
Dimensional structure and typically contains unique chemical and physical
characteristics. The ability of two materials to adhere to each other is not always dictated
by their ability to form compounds.8 The adhesion between a ceramic and a metal is
strongly influenced and even dominated by the surface energy and not by the interface
energy. In addition, large interface strain or incoherent interface bonding may limit the
formation of a stable interface.11

8
A surface can be viewed as a system which has broken bonds. These broken
bonds allow for lower energy bonding occurring between species which may not
typically react or the reaction maybe sterically hindered due to the constraints imposed by
the two surfaces. The interface maybe formed by species which typically interact or by
the fact that the chemical constituents of the system want to ensure all of their bonding is
complete relative to the preferred state. This is supported by the current barrier layer
material choice. Copper is immiscible in tantalum and immiscible in tantalum nitride,
but these materials are used as a composite system for interconnects. This highlights the
fact that adhesion and chemical reaction are separate phenomena.
One particular problem with heterogeneous interfaces is the lattice mis-match
between the two different phases. Epitaxial thin film growth experiments show that the
lattice dimensions of the substrate are maintained in the growth film when the thickness
is small.10 This occurs up to a critical thickness value and then the systems stress pulls
the film back into the expected lattice dimensions for the thin film. This suggests for Ab
Initio studies, the “deposited” film should match the lattice of the substrate, or it may
result in high residual stress of the deposited thin film. An alternative way of looking at
this problem from an interface setup perspective is to increase the size of the small lattice
with repeat cells until an alignment can be reached in terms of the atomic alignments.10
The system could end up having strain relieved and lower interface energy due to atomic
voids or atomic re-arrangements.
Barrier layer materials need to have several key properties.12 First, they have to
be thin and stable. They cannot readily react with either the metal or the ILD. Second,
they need to be highly conformal to avoid void formation or allow the metal to make
contact with the ILD. In the case of copper and carbon doped silicon dioxide (CDSIO),
this is very problematic as copper has a high diffusivity rate in CDSIO and will rapidly

9
cause a short and kill the device. Third, they have to promote adhesion between the
metal and ILD to ensure mechanical stability of the interface. Fourth, they need to have
good conductance as the metal lines shrink and the total cross section of the barrier layer
ultimately takes up a significant percent of the overall metal cross section. The interface
of barrier layer and the metal is critical to the composites performance. Now a key
question is how to assess such a system.
Methods for Interface Studies
Study of the interfaces is not a trivial task, as one has to first create the interface
of interest without defects or experimental issues inducing an unexpected system.
Creation of interface systems can occur through advanced, in vacuum processing. These
can include various vapor phase deposition techniques. Included in this list are Physical
Vapor Deposition (PVD), Chemical Vapor Deposition (CVD) and Atomic Layer
Deposition (ALD) techniques. PVD and CVD rely upon evaporation and deposition of
atomic species. On can control surfaces, stoichiometry and thickness by modulating
input parameters such as gas pressure, temperature gradients and fluctuations in the
evaporated species composition. ALD is slightly different as it is step wise chemical
buildup of a surface. One would produce precursors that would allow for controlled
deposition of systems and eliminate thickness and compositional fluctuations as the
precursor chemistry is the control mechanism at the micro level. While these techniques
provide the ability to form various thin films at the atomic scale, they have an inherent
flaw for early studies on novel concepts. They require significant time and effort to
ensure that the correct material crystal structure and composition of interest is the actual
one being deposited. Significant changes from a known system require complex

10
experiments and research time to understand the proper processing conditions. In
addition to this problem of sample creation, is the need to actually study the interface.
There is a shortage of experimental tools to study interfaces, but it can be studied by
analytical means such as Transmission Electron Microscopy, Electron Energy Loss
Spectroscopy or Grazing Angle X-ray Scattering to name a few techniques. The
techniques are limitation in terms of their abilities to study just the interface as they have
to have more material than a monolayer to analyze or cannot access a buried interface as
their surface sensitivity is a result of surface stability in ultra-high vacuum
environments.13 In addition, the buried structure maybe metastable and by studying it the
interface could allow enough energy into the system to change to a more stable phase or
structure.
First Principle or Ab Initio modeling offers an alternate way of studying the
interface as 1.) All conditions and properties can be controlled, 2.) The specific nature of
the interface can be analyzed and 3.) Specific chemical constituents can be accessed.
Others have looked at the way systems form interfaces for various carbides, nitrides and
oxides. In particular, nitride systems were examined as to how Aluminum would adhere
to polar and non-polar nitride and carbide surfaces including Vanadium Nitride,
Vanadium Carbide and Boron Nitride.14, 15 The studies show that the adhesion of the
metal surface preferred bonding to the metalloid species (nitrogen or carbon). The work
suggests that the work of adhesion should be highest when the metal surface can align to
the metalloids on the surface. Siegel goes on to show that polar surfaces are dominated
even further by the metalloid which causes the interface to have even greater adhesion
when compared to other potential surfaces in the same crystal system16
.

11
An ab initio study into the Interconnect system would provide insight into
processing and electrical properties that would allow one to understand what
experimental systems may be the best to invest physical research time to study systems
further. This study will employ this technique to help understand an alternate
Interconnect path.
Summary
The continued scaling and adherence to Moore’s Law has pushed the
semiconductor device manufacturing into atomic scale systems. By 2022, Interconnects
will be 10 nm in width and the barrier layer that ensures the stability of the metal will be
1 nm in thickness. The continued scaling will result in the system being dominated by
surface effects. The current, industry standard set of materials used for Interconnects,
Copper, Tantalum, Tantalum Nitride, appear to have long term scaling issues including
RC delay associated with the interface and electromigration resistance.
The author is proposing to study an alternate metal and barrier layer to determine
if there is a better “composite” system one could use for Interconnects. The study will be
ab initio based and intended to provide guidance on interconnect direction. The next
chapter will provide an overview of what those materials are in the interconnect and
where the research will focus for those systems.

12
Chapter 2
LITERATURE REVIEW OF MATERIAL SYSTEMS
In this chapter, a review of the materials of interest will be provided. The first
topic will be on which metal to choose of the low resistance group. There is significant
data on Copper and study of an alternate metal could provide insight into whether an
industry shift may be needed to overcome copper’s inherent flaws as an interconnect
metal.
The second topic and higher importance is the selection of the barrier layer
material. As the interface of the barrier layer and the metal is dictating the way the
interconnect is behaving, careful consideration will have to be given on a system that
may provide insight into what might be a good course for a viable, scalable interconnect
system.
Metal Interconnects
In the early 2000’s, copper was introduced into IC production to replace
aluminum. Research and development was on going in the 1990’s to incorporate the
product. The reasons for the change to copper from aluminum include better RC delay,
electromigration and better mechanical properties.17 Copper offers significantly lower
bulk resistivity compared to aluminum and Al alloys.3, 4 A Copper alloy of Al-0.5%to
1% Cu is typically used in the industry.18, 19 The alloy improves electromigration
performance, films are topographically smoother, and the aluminum forms a protective
oxide on the copper.18 As noted in chapter 1, Copper does have a set of new issues
associated with it. It requires a barrier layer as it can diffuse into various ILD materials
and short out the device.

13
The use of silver in this study is based on the fact that it has a lower bulk
resistivity than copper and is shown in figure 4.20 Silver may be a possible future
replacement for copper. It should be noted that silver suffers from the same scaling issue
as copper with respect to the line shrink, but little effort appears in the literature on
engineering of silver as an alternative metal. The publications to date seem to indicate
integration issues which could be related to maturity of silver processing. Issues such as
material defects and formation of various nitrides and oxides at the interface of the silver
metal line and the barrier layer are more indicative of a lack of development effort than a
scientific, physical reason the material not to be used.8, 21-23 In addition, it has been noted
that Silver may have the same electromigration issues as copper.2
However, copper has seen drastic improvements in electromigration issues due to
alloy research. Development of silver alloys could be possible to also overcome the
electromigration issues observed in the literature.
Figure 4. Graph of Metal Resistivity with respect to temperature.20
In order for there to be a move to silver from copper as the primary metal for
interconnects, there would have to be significant development. The development effort
Metal Resistivity
1
2
3
4
5
6
7
300 400 500 600 700 800Temperature (K)
Ele
ctric
al R
esis
tivity
(1
0^–8
Ω m
)
Aluminum
Copper
Gold
Silver

14
would require some projected success level to help justify the time and cost investment
necessary to enable such a drastic change from copper.
The concept is that silver may have different adhesion properties to barrier layer
when compared to copper. In this study, Tantalum Nitride has been chosen as the lattice
mismatch between Ag and TaN is smaller compared to Cu lattice when looking at the
(111) planes of these metals. Table 2 is provided for reference and shows the various
lattice parameters for silver, gold and copper. Silver has the largest lattice constant when
compared with gold, copper, or aluminum. In the next section, the crystal structure of
Tantalum Nitride will be discussed and the specific crystal structure will be selected.
Table 2. Crystal structure of aluminum, copper, gold and silver.20 Material Lattice Constant (a0, nm) Atomic Radius (nm) Space Group
Silver (Ag) 0.4085 0.144 mFm 3 Gold (Au) 0.4078 0.144 mFm 3
Copper (Cu) 0.362 0.128 mFm 3 Aluminum (Al) 0.405 0.143 mFm 3
Tantalum Nitride
Typical materials used for barrier layers and adhesion layers are tantalum nitride
and tantalum, respectively. The TaN:Ta system is indicated in numerous studies and
experimentally seems to be a good choice as it has high thermal stability, low electrical
resistivity, and low diffusivity for copper. The standard process currently uses CVD or
PVD deposition for the TaN and Ta. The deposition technique and conditions will
dictate the crystal phase and stoichiometry of the layers.
TaN will need to be deposited by Atomic Layer Deposition (ALD) at these
aggressive dimensions.12 The crystallographic characteristics of an ALD film are
strongly dictated by the precursors and the processing conditions used for the film

15
creation. The literature currently lists the cubic phase of TaN being deposited, but there
is no reason that the thermodynamically more stable CoSn phase of TaN could not be
deposited and more importantly that it is not used in modern IC devices as the actual
crystal structure used in production devices is publically known.12 In addition, ALD
starts from organo-metallic or halide-metallic based precursors which may leave defect
centers such as carbon, vacancies, or halides at the system interface.2
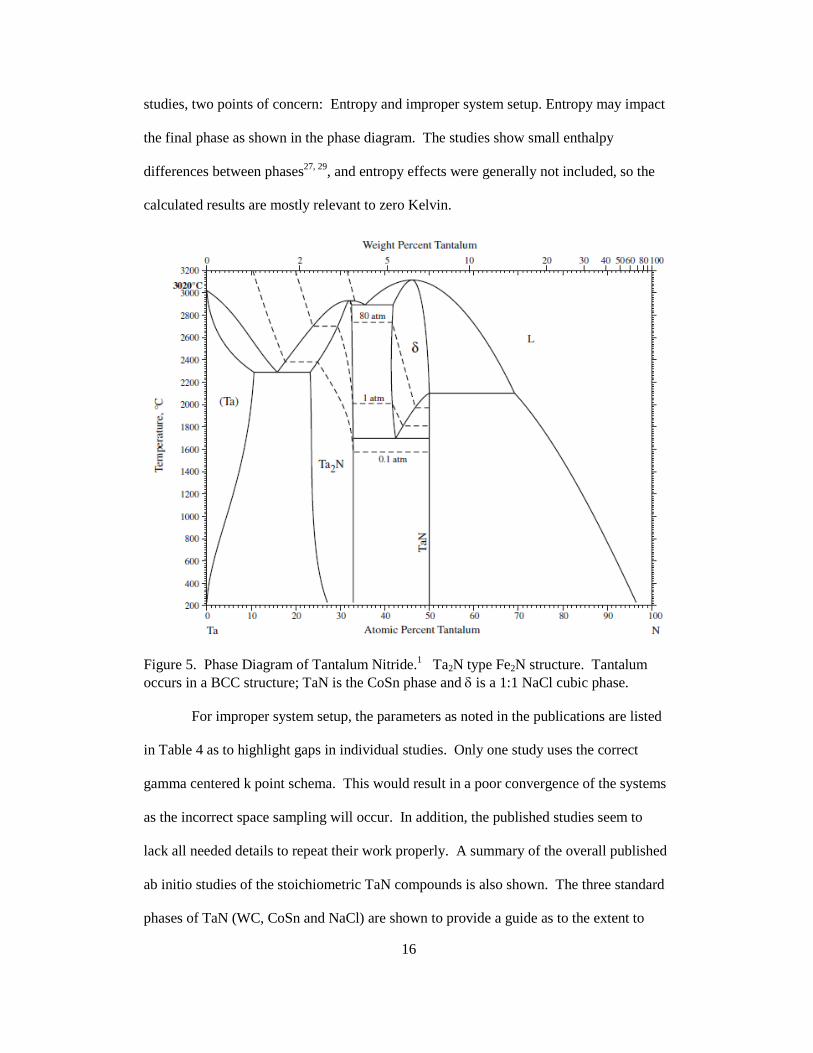
The phase diagram for TaN is shown in Figure 5. The 1:1 stoichiometric CoSn
phase is thermodynamically stable up to relatively high temperatures and the crystal
structures with regions of thermodynamic stability for TaN are CoSn and NaCl, with
Ta2N having the NiAs phase. The tantalum-nitride systems has a significant number of
poly-morphs and at least 3 poly-morphs at varied conditions for the 1:1 stoichiometric
compound and are listed in Table 3.24
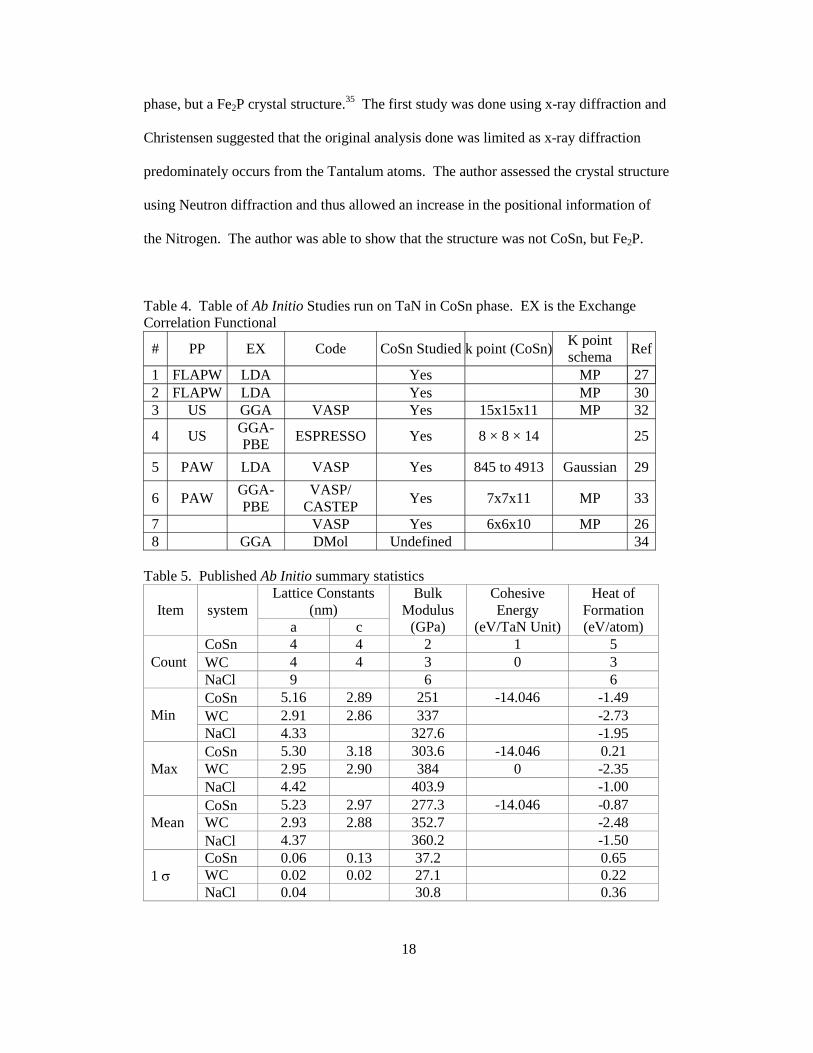
There are few first principle studies of the TaxNy polymorphs and fewer include
the CoSn phase. The studies are listed in Table 4 with calculation information extracted
from the publications. Table 5 provides the statistical overview of the Ab Initio studies of
the 1:1 stoichiometry TaN systems and reported values for various parameters including
lattice constants, heat of formation, and bulk. While there are reports of CoSn and NaCl
phases being thermodynamically stable and preferred25, 26, there are other reports of
thermodynamic stability of some stoichiometry’s (Ta5N6 and Ta3N5) that do not occur in
the published phase diagram.27, 28 The stable phases from these studies are NiAs-Ta2N,
Ta5N6, Ta3N5 and WC-TaN phases. 26-28 In addition, the NaCl and CoSn are proposed to
be meta-stable from first principle calculations.27, 28 Experimentally, WC phase is
formed by compression of CoSn Phase.
There could be several reasons for the discrepancies between the experimentally
derived phase diagram and the ab initio determined stable phases. For the ab initio
16
studies, two points of concern: Entropy and improper system setup. Entropy may impact
the final phase as shown in the phase diagram. The studies show small enthalpy
differences between phases27, 29, and entropy effects were generally not included, so the
calculated results are mostly relevant to zero Kelvin.
Figure 5. Phase Diagram of Tantalum Nitride.1 Ta2N type Fe2N structure. Tantalum occurs in a BCC structure; TaN is the CoSn phase and δ is a 1:1 NaCl cubic phase.
For improper system setup, the parameters as noted in the publications are listed
in Table 4 as to highlight gaps in individual studies. Only one study uses the correct
gamma centered k point schema. This would result in a poor convergence of the systems
as the incorrect space sampling will occur. In addition, the published studies seem to
lack all needed details to repeat their work properly. A summary of the overall published
ab initio studies of the stoichiometric TaN compounds is also shown. The three standard
phases of TaN (WC, CoSn and NaCl) are shown to provide a guide as to the extent to

17
which the systems have been studied. Comparison across the result sets will be done
upon completion of the work in this dissertation, but the results seem to suggest fairly
good calculation convergence for lattice parameters across phases, but few studies look at
the stability or modulus of CoSn and the WC phases. These crystal structures are more
sensitive to proper convergence when determined via first principles.
Table 3. Table of Tantalum Nitride Polymorphs 24 Phase Stoichiometry Structure/Comments α-TaN TaN0.04 N in BCC-Ta β-TaN TaN0.05 Same as α-TaN γ-TaN TaN0.5 HPC Ta w/ N Atoms occupying half of octahedral sites ε-TaN TaN1.0 HPC, CoSn δ-TaN TaN0.92-0.97 FCC-NaCl Θ/ν-TaN TaN1 HPC-WC, formed from CoSn under high pressure Ta5N6 TaN1.2 Hexagonal Ta4N5 TaN1.25 Tetragonal Ta2N3 TaN1.5 Fluorite structure with N vacancies Ta3N5 TaN1.66 Orthorhombic, Fe2TiO5
The results of the Ab Initio studies do provide guidance on the electrical
characteristics of TaxNy. Ta2N has been shown to have strong metallic nature initially,
but with increasing nitrogen, the resistivity increases until it finally transitions to
insulating.27 The N-rich structures were found to have dramatically increased resistivity
once beyond the 1:1 stoichiometry.30 Once past the 1:1 stoichiometry, increasing N
content results in decreased barrier performance.26 The incorporation of nitrogen helps in
one of two ways: First it results in nano-size to amorphous crystal formation which helps
to delay the formation of larger grain, polycrystalline TaN. The second way the excess
Nitrogen helps is to delay the rate of diffusion of Silicon into the TaN from the other side.
Overall, this improves electromigration performance.31
While there are numerous polymorphs for TaN, there is another phase that is
suggested in the literature both in ab initio studies and in experimental studies. In 1978,
Christensen suggested that the correct crystal structure of the 1:1 TaN was not the CoSn
18
phase, but a Fe2P crystal structure.35 The first study was done using x-ray diffraction and
Christensen suggested that the original analysis done was limited as x-ray diffraction
predominately occurs from the Tantalum atoms. The author assessed the crystal structure
using Neutron diffraction and thus allowed an increase in the positional information of
the Nitrogen. The author was able to show that the structure was not CoSn, but Fe2P.
Table 4. Table of Ab Initio Studies run on TaN in CoSn phase. EX is the Exchange Correlation Functional
# PP EX Code CoSn Studied k point (CoSn)K point schema
Ref
1 FLAPW LDA Yes MP 27 2 FLAPW LDA Yes MP 30 3 US GGA VASP Yes 15x15x11 MP 32
4 US GGA- PBE
ESPRESSO Yes 8 × 8 × 14 25
5 PAW LDA VASP Yes 845 to 4913 Gaussian 29
6 PAW GGA- PBE
VASP/ CASTEP
Yes 7x7x11 MP 33
7 VASP Yes 6x6x10 MP 26 8 GGA DMol Undefined 34
Table 5. Published Ab Initio summary statistics
Item system Lattice Constants
(nm) Bulk
Modulus (GPa)
Cohesive Energy
(eV/TaN Unit)
Heat of Formation (eV/atom) a c
Count CoSn 4 4 2 1 5 WC 4 4 3 0 3 NaCl 9 6 6
Min CoSn 5.16 2.89 251 -14.046 -1.49 WC 2.91 2.86 337 -2.73 NaCl 4.33 327.6 -1.95
Max CoSn 5.30 3.18 303.6 -14.046 0.21 WC 2.95 2.90 384 0 -2.35 NaCl 4.42 403.9 -1.00
Mean CoSn 5.23 2.97 277.3 -14.046 -0.87 WC 2.93 2.88 352.7 -2.48 NaCl 4.37 360.2 -1.50
1 σ CoSn 0.06 0.13 37.2 0.65 WC 0.02 0.02 27.1 0.22 NaCl 0.04 30.8 0.36

19
In 2011, an ab initio study also looked at the enthalpic stability of the NaCl,
CoSn and Fe2P phases. The work suggested Fe2P was more stable enthalpically than
CoSn. In addition, the Energy vs. volume curves showed that the Fe2P was lower in
enthalpy than the NaCl phase. This coupled with the Neutron diffraction study, suggests
that the Fe2P phase is the correct one. As noted above, the CoSn phase has been noted as
having lower stability when compared to other polymorphs of TaN. In addition, as
researchers have been analyzing CoSn as the correct phase, there has only been 3 studies
noting Fe2P phase as a more stable crystal structure and running simulations with this
understanding of crystal structure.26, 28, 36 There is no crystal defect data on the phase or
ab initio study on surface of Fe2P-TaN. In Figure 6, the amount of motion expected in
the nitrogen’s is shown. Only the basis set is drawn and the arrows show the direction
and amount of shifting of the Nitrogen’s when going from the CoSn phase to the Fe2P
phase.
Few studies have analyzed the interface of CoSn-TaN phase with respect to a
metal.32, 34 The interface strain energy was shown to be lowest for the (001) TaN-CoSn
and the (111) copper interface at 0.01 eV/atom compared to the (111) Cu interface and
(111) NaCl-TaN, (001) Ta2N, and (110) BCC-Ta which had 0.33 eV/at, 0.33 eV/at, and
0.26 eV/at, respectively.32 The interface strain is associated with how much the two
crystal structures need to deform to align to adhesion sites at the interface. Cohesive
energies are lowest for the Cu-TaN-CoSn interface with the Tantalum rich (0002)
interface and the (111) Cu interface with the copper’s sitting on top of the Tantalum’s.
Compared to other crystal structures, the CoSn seems to have similar energies with the
order of cohesive energy from highest to lowest for the copper (111) interface being TaN-
NaCl>Ta>TaN-CoSn, but separated by < 0.7 J/m^2.

20
For a mixed surface (tantalum and nitrogen), it was shown that the copper atoms
prefer to sit on top of nitrogen atoms for the (0001) surface of the TaN-CoSn phase and
Copper forms strong ionic bonds with the Nitrogen. For the tantalum terminated
surfaces, copper atoms either take the bridge sites or form bridge sites to form an
interface that is a mixture of metallic and covalent bonds, thus the copper lattice forms a
mixture of the lattice. Another study has no information on crystal structure of the
system analyzed, but did utilize PVD for deposition of the TaN. The study suggests the
need to match cohesive energies of 2 materials and why the current barrier-adhesion
(TaN-Ta) layer is used today. However, the work does show that a TaN-Cu stack
survives the mechanical testing.34
Figure 6. Figure of the atomic movements of Nitrogens ( ) and Tantalums (). The arrows show the basis atom movement direction and magnitude of movement to scale. The left, blue box shows the (0001) and the right, red box shows the (0010) with a slight rotation to allow one to see all atoms.
Interface adhesion of the metal with a metalloid terminated ceramics is stronger
for polar interfaces and metal atoms located on metalloid atoms have strongest adhesion
for non-polar surfaces.10 Matching the adhesive strength and cohesion strength allows for
the barrier layer to be optimal.34 Layer matching in a multilayer stack along with
21
composition control have been shown to achieve this match both experimentally and
from models. This is a primary reason why multistacks are used in a IC process. Models
can be used to screen barrier layer selection by analyzing the adhesive and cohesive
energy trends for various barrier layer metallization schemes. This dissertation will
focus on the ambient phase (CoSn or Fe2P) as phase diagram indicates stability. This
particular structure has limited studies and there is no known study on the
surface/interface of the system.
Research Goals
The published phase diagram suggests CoSn as the ambient forming crystal
structure at a 50/50 Ta:N composition. This is both supported and negated by studies by
others.25-27, 36 This dissertation will attempt to assess which crystal structure is the stable
one from ab initio studies and determine if other crystal structures are metastable. The
work will then use the thermodynamically favorable crystal structure to assess the
viability of the silver interfacing with the preferred, ambient crystal structure surface. If
the calculations show that the system has both favorable absorption and adhesion
enthalipies, then an interconnect with silver and a stable Tantalum Nitride barrier should
be considered as an alternate for future interconnect systems. Further experimental study
will be needed to validate the conclusions of the work, but the fundamentals of the
interconnect will be shown. In addition to overcoming the limitations of the scaling of
the current multilayer interconnect systems, the Silver:Tantalum Nitride system may
provide an easier, more cost effective interconnect system for the IC industry as a whole
step in the process flow is eliminated with the removal of an adhesion layer. For this
assessment, as mentioned previously, ab initio methods will be used. This reduces the
experimental burden and provides a path to disposition options. The next chapter will

22
review the Density Functional Theory used to study the system. Chapter 4 will review
the Bulk Studies of Tantalum Nitride. Chapter 5 will analyze vacancy stability in the
Tantalum Nitride to understand the phase stability further. Chapter 6 will assess the
Adatom and adhesion properties of silver on the stable Tantalum Nitride phase.

23
Chapter 3
AB INITIO THEORY
First Principle studies are based on Quantum Mechanics which was proposed and
developed by Schrödinger. The basis of the theory is that a system is defined by its wave
function and the Schrödinger Equation can describe how matter behaves37 The time
independent Schrödinger Equation is given 38
( ) ( ),,....,,,...., 2121 nkknk qqqEqqqH Ψ=Ψ 2
Where H is the Hamiltonian, Ek is the Eigen values, qi are the subatomic particles, and Ψ
is the Eigen functional. The Schrödinger Equation has 3N spatial coordinates for each N
interacting electrons of a system and 3M for each ion leading to 3N+3M variables. The
Schrodinger calculates an Energy based on the Hamiltonian operator.39, 40 The particles
interact pair wise and expansion of the Hamiltonian is given by the following equation:
2
2
1
2 | |,
12
1
2
3
The first two terms are the kinetic energy of each electron and ion, respectively. The next
3 terms are the electron-electron, electron-ion, and ion-ion interaction terms, respectively.
Schrödinger Equation cannot be solved analytically except for the simplest system.
However, it can be approximated numerically thus numerical techniques can provide an
approximate solution.
A key theorem that enables such numerical techniques to be computationally
tractable is the Born-Oppenheimer Theorem.38, 41 The theorem states that since there is
24
such a large discrepancies in the mass of the electrons and the nucleus that the two are
effectively decoupled with respect to motion. Electrons are dragged by the nuclei and
electrons do not affect the motion of the nucleus. This effect can be seen in the rate of
motion of the particles with electrons moving at 1 femtosecond and atomic vibrations
(nuclei motion) occurring on the order of 1 picoseconds.41, 42 This reduces the
complexity of the Schrödinger equation to a 3N many body problem. A further
reduction in the complexity was attempted by others.14, 37, 43 Hartree is based on a central
field theory which can be easily explained by electron screening and proposed a single,
non-interacting particle calculation. It would suggest that the electron farthest from the
ionic core would only sense a partial charge as the rest of the inner electrons would just
result in the total potential field being lowered. The pairwise interactions of the electrons
are reduced to a mean field. A major issue with Hartree is that it ignores Pauli exclusions
and could allow two electrons to occupy the same spin state.
Hartree-Folk (HF) was built off of Hartree. It accounts for spin and imposes
Fermi-Dirac statistics on the electrons. The calculation requires the energy calculation of
each individual electron and also handles exchange. Electrons all are attempting to get to
their lowest energy states in an atom. They will move in unison and will increase their
kinetic energy if it means their potential energy is reduced. This effort is called
exchange. These two techniques impose single particle wavefunction in their
calculations. An early example of this was the work by Thomas-Fermi-Dirac, but Kohn
created the modern day theorem allowing density functional theory (DFT) to be used to
solve the Schrödinger equations in a computationally attainable manner.
Density Functional Theory
The Hohenberg-Kohn (HK) theorem and the Kohn-Sham (KS) equations define
the DFT method, and Kohn is considered the father of the technique.37, 43 In 1964, the

25
HK theorem was developed and states the system energy is a functional of the charge
density and therefore the ground state (GS) charge density is the systems ground state
energy.37, 39, 41, 44 The ground state functional can be inverted, allowing ground state
observables to be functions of the ground state functional. There are 4 parts to the
theorem:
1. Non-Degenerate ground state wave function is unique to the ground state density
2. The key observable is ground state energy and the system energy can never go below the ground state
3. Kinetic and interacting energies of non-relativistic coulomb systems defined by universal operators on that system.
4. If density functional is held fixed, by determining GS wave and potential of the system is known. (i.e. the whole system Hamiltonian is known)
This method was adapted to determine the Eigen states of the KS Hamiltonian. To
minimize the ground state energy the sum of the kinetic, interacting and potential
energies should be minimized.
The implementation of DFT is done by the Kohn-Sham (KS) Equation.
( ) ( ) ( ) ( )rrrnvr iiiKSi Ψ=Ψ+Ψ∇
− ε][2
2
4
Where Ψ are the Eigen functional and νKS is the KS potential. The Kohn-Sham equation
transforms the many body problem to look like a single particle orbital problem.37, 39 The
basis set is used to expand the KS Eigen Functional and can be classified by either plane
wave or local basis sets. This allows single particle theory to be applied, but leads to the
need to apply exchange correlations to describe the interactions of the electrons in the
system. No “direct” exchange correlation functional exists, so approximations have been

26
developed to describe the atomic interactions. The exchange correlation functional will
determine the calculations physical “accuracy” and all other computational specifics of
the simulation will determine the numerical aspects of the calculation.39 The KS
potential (νKS) is defined to have the following terms and is acting on the electron density
(n).
)]([)]([)()]([ rnvrnvrvrnv xcHartreeextKS ++= 5
The vxc(r) is the exchange-correlation functional of the equation, vext is the external
potential (nuclei), vHartree is the Hartree potential.45
Exchange-Correlation
There are several methods to estimate the exchange correlations energy. The
first approach is called Local Density Approximation (LDA), in which the exchange-
correlation energy of each local region of space is estimated to be equal to the exchange-
correlation energy of a uniform electron gas of that density (which can be solved
exactly). Vxc in LDA from the νKS equation is only defined by the local density of
electrons with a total electron density assigned to the whole system and the Kohn-Sham
equation is then solved self consistently.45
The second approach is the Generalize Gradient Approximation (GGA). The
general difference between GGA and LDA is GGA includes both the local electron
density and its gradient in estimating the exchange-correlation functional. There is only
one LDA, but there are many types of approximate GGA’s. The LDA, GGA-PW91and
GGA- PBE are well established exchange correlations.43, 45, 46 There are additional
methods such as Meta-GGA and Hybrid, but these are beyond the scope of this paper and
can be found elsewhere. 43, 47

27
LDA and GGA appear to over and under estimate parameters. LDA
overestimates the bonding energy and leads to lattice parameters that are too small by a
few percent when compared to experiments and over estimates the cohesive energy.
GGA underestimates the bonding energy which leads to lattice parameters being
overestimated and cohesive energy being underestimated by approximately the same
percent that LDA calculates.43, 45, 48
Planewave Basis Set
There are two typical methods to represent the single particle wavefunctions:
Atomic Orbital and Planewave. The Atomic Orbital (AO) actually represents the local
charge density and one has to predefine the basis set used for the calculation. AO’s are
good for quantum chemistry simulations as the molecular orbital often look like atomic
orbital and defining them can often be done with a few functions. It is very hard to
ensure the basis set is complete and not selecting the proper AO’s can severely limit the
calculation accuracy and the convergence would be incorrect if the basis set is incorrectly
defined.
Planewave Basis sets do not need to be defined a prior as do AO basis sets. They
are orthogonal and are complete by themselves. The user sets a cut-off energy that
defines the number of the planewaves, which affects the accuracy of the calculation. The
calculations of planewave basis sets are executed rapidly in modern day code due to the
ability to utilize Fourier Transfer Functions from real to momentum space allowing rapid
calculation of the potential and kinetic energies. However, the control of the exchange
calculation needs to be carefully considered.43
One example is they place charge where there may be no charge due to the
calculation methods. With that said, PW and AO have been shown to result in the same

28
ground state energy. This dissertation uses PW’s for all calculations, so all further
analysis will assume them. One reason to select PW’s is due to their ability to represent
crystalline materials as one can consider them an infinite slab.
Periodic Boundary Conditions and K Space
An infinite slab allows Periodic Boundary Conditions to be implemented via
Bloch’s theorem, and the periodic part of the wavefunction can be expanded in a discrete
set of PW’s in reciprocal space. The periodicity allows one to look at a single cell which
replicates and thus you can ignore the infinite slab issue, but requires one to work in
inverse space which brings up how to setup the proper K points.43, 49, 50
K points are the points chosen in inverse space and the correct choice of k points
is tied to the crystal symmetry. The k points can be reduced so that they only calculate
symmetrical points. The standard method for this is to use a Monkhourst and Pack
method to select a reduced set of points for the analysis. MP will assume a centering of
the cell and samples in space from that assumption. It has been shown that MP grids will
not converge if not centered on the Gamma point for hexagonal crystal structures.47
Pseudopotentials
Pseudopotentials are commonly used to simplify the problem by replacing the
core electrons with Pseudopotentials which approximates how the core electrons interact
with valence electrons. This can often be a very good approximation because most
chemical bonding primarily involves only the valence electrons.11, 43, 45 This reduction is
needed also to make larger systems computationally tractable as it can allow one to treat
a high atomic number species in a similar manner as a smaller one with respect to the
number of electrons that need to be included in the calculation. From a precision

29
perspective, the impact to the calculations is minimal when comparing a complete
electron system to a valence electron system and is on the order of 1000th of an impact to
the system if the valence electrons are only used in the calculations11, for cases involving
typical chemical bonding at thermal energies. However, if atoms move too close
together, then the core electrons can also be involved in chemical bonding, and then all-
electron calculations are needed. In general, the replacement of core electrons with
Pseudopotentials allows a reduction in the planewave sets and thus improves
computational time.
The Pseudopotentials have several implementations with Ultrasoft-pseudo
potentials and projected augment wave (PAW) potentials being two common types.
Ultrasoft potentials are easily used to describe 1st row elements and system with d-/f -
electrons are feasible. The PAW potentials take into account nodal features of the
valance electrons and are orthonomal.43, 50 In this dissertation, only PAW potentials are
used as the size of the elements are large. The correct metric for how well a PAW
potential is constructed is to validate it with the full-potential linearized augmented plane
wave (FP-LAPW) and determine how well the PAW reproduces the FP-LAPW results. It
has been shown that PAW and FP-LAPW reproduce simple atomic constants to <2% of
experimental data and in some cases, the FP-LAPW is out performed by as much as 1%
by PAW implementations in VASP.43, 51
Energies and Forces
Static DFT calculations are run where the ionic cores are not allowed to move.
This is basically an electronic density minimization. This study is interested in atomic
movements and thus needs to be able to reliably determine ionic locations. Ionic
movements can also be allowed in DFT studies. This requires the determination of the

30
forces and resulting movement of the ions. VASP uses the Hellman-Feynman Theorem
to do this and is based on knowing the gradient of the electronic density relative to the
ionic species. The implementation for the theorem works in an iterative manner where the
ground state energy is calculated, the force on the ions are determined and then the ions
are moved in the direction of the force and then the process is repeated.
VASP Implementation and Reliability
The software used is the Vienna Ab Initio Simulation Package (VASP4.6)
developed by Georg Kresse, Martijn Marsman, and Jürgen Furthmüller at the Universität
Wien, Austria. VASP is implemented with a planewave basis set for single particle
Kohn-Sham wavefunction along with PAW Pseudopotentials to describe the electron-ion
interaction for more complex orbital systems.52, 53 Ground state electron density and
energy are calculated with a conjugate gradient method. The cell stress and forces acting
on the ions are determined by Hellman-Feynman method augmented with a Pulay stress
calculations with minimization done by a quasi-Newton method.43 The exchange
correlation functional used in this dissertation for bulk calculations are Local Density
Approximation (LDA), Generalized Gradient Approximation Perdew Wang 91 (GGA-
PW91) and Generalized Gradient Approximation Perdew Burke Ernzerhof (GGA-PBE)
exchange-correlation functionals.54, 5554-59 The defect cell and surface slab was only
analyzed with the GGA-PBE to save on computational time. The defect and
surface/Adatom calculations used GGA-PBE and used the planewave increased by 30%
to help ensure proper convergence and avoid Pulay stresses. The analysis as to why
GGA-PBE will be discussed later after bulk calculations. The lattice constants calculated
in the bulk calculations were used as input values to the defect and surface calculations.

31
The calculations are divided up into three parts: Bulk calculations, Defect
calculations, and Surface/Adatom Calculations. The flow was as follows for each of the
calculations and crystal structure analyzed in the thesis:
1. Build cell using experimental lattice constants
2. Select a reasonable K space and increase k-space until the change in energy per
an atom is less than 10 meV/at, unless otherwise noted for the calculation. Use
the smallest K space for future runs.
3. Increase planewave cut off and monitor convergence of the energy until < 10
meV/at.
DFT has been implemented in several codes similar to VASP (Quantum
Espresso, Abinit) and there are slight differences between the implementations.
Ultimately, the theory of DFT needs to be correlated to real world experiments. The
simulation results must come predict the results seen in the experimental world. If the
DFT simulation is correctly done and the error of the real world experiment is controlled,
it has been shown that the techniques result in close agreement.
DFT studies have been increasing significantly in recent years. A quick survey
of publications in the academic space by looking at Web of Sciences shows a significant
increase in the publications in the space and shown in Figure 7. The graph is a
cumulative total of publications based on Web of Science data. This suggests a growing
number of researchers using the tool, but not necessarily the quality of the data or of its
relevance to the experimental world. For this, I will look at a few review publications.
For instance, crystal lattice constants have been tabulated by Hafner and suggest that
VASP is capable of matching experimental and theoretical to within 1% of each other.43

32
Mechanical properties show better than 10% to experimental values both by Hafner and
Mavromaras.43, 60 In addition, Adatom absorption energies have been calculated to within
0.5 eV of experimental values with the GGA-PBE.43
As mentioned, the results of simulation studies have to be carefully assessed as to
the real world implications and analysis. Throughout the dissertation, references to
experimental values will be provided an assessed to the simulated results when possible.
These should be used as a guide to the validity and reliability of the results provided
where there is no such experimental data or where the experimental data is not clear.
Figure 7. Total publications on Density Functional Theory as determined by performing a search on Web of Science.
Geometry
The calculations looked at include several different crystal structures and are
captured in table 6. The Tantalum Nitride was analyzed in a NaCl, CoSn, and Fe2P
phase. For the CoSn and Fe2P phases, K space was centered on the gamma point to
ensure k point symmetry was properly accounted for in the calculations. Isolated atoms
of Ta, N, Ag and Cu were run in a larger isolated box. The Tantalum Bulk calculation as
0
10000
20000
30000
40000
50000
60000
70000
80000
Prior to
2002
2002 2003 2004 2005 2006 2007 2008 2009 2010 2011
Cum
Tot
al D
FT
Pub
licat
ions
Year

33
done a BCC structure. Calculations of Silver and Copper were done on FCC structures.
The crystal structures were visualized with either VMD or Visit.61, 62
Table 6. Table of the various crystal phases used in this study. Space Group International Symbol
NaCl-TaN 225 Fm3m CoSn-TaN 191 P6/mmm Fe2P-TaN 189 P62m Tantalum-BCC 229 Im3m Nitrogen Gas NA NA Silver-FCC 225 Fm3m
Charge Density Plots
The Charge density of the Bulk systems was calculated and provides insight into
the distribution of charge for the system. This is done by DFT calculations by assigning
a grid to the system and then overlaying the charge at each point as determined at the
ground state. It is then visualized by either contour plots or 3-D isosurfaces. The plotting
of the system allows one to see where electrons and charge reside and thus where
bonding is occurring. Historically, plotting of charge was an issue as the core electrons
typically would have large values associated with them from a density perspective. In the
implementation used, only charge associated with the valance electrons is provided as
PAW’s only include these electrons and therefore the core electrons will not obscure the
plots.50, 63
Density of States
The density of states (DOS) is a count of the total number of states electrons
occupy or can occupy by energy level. It provides insight into how the system is
bonding, but needs to be carefully analyzed in doing so. Once the eigenfunctions (states)
and eiganvalues (energy) are known for a particular system, one can construct the DOS.
34
By looking at the point where the Fermi-energy occurs, one can distinguish the overall
systems characteristics and whether a system is a conductor (i.e. metallic in nature) or an
insulator (i.e. semiconductor or dielectric). If the Fermi-energy lies in a region where
there is no states present and between two peaks in the spectrum, the material is either
semiconducting or a dielectric. The separation of the peaks determines if the system is
one or the other (i.e. large separation is dielectric, small separate is semiconductor). If
there are states occurring in the DOS spectrum, then the material is metallic. To compare
different system on a graph, it is common to re-align the energies of all systems to their
Fermi-Energy.63
Electron Localization Functional
The Electron Localization Functional (ELF) provides a way of understanding the
location of an electron. It is a scalar quantity between 0 and 1 which has a value of 0 for
a vacuum (perfect insulator) 0.5 for a metallic bond and a value of 1 for a covalent
bonding. It will provide how the electrons are populating the spaces in terms of Pauli
exclusion. The function for the ELF calculation is as follows
1 1 ! "
# " "
6
Where K(r) is the Pauli Exclusion Kinetic energy at some distance, r and J(r) is the
Kinetic Energy of a homogenous electron gas at the same point in space. The function is
plotted over top the ionic locations to understand where electrons are paired or not.50 The
function is visualized to help understand how the ELF fills space and then assessments
can be done to understand how bonding is occurring in a system.

35
Bader Analysis
A common method to do charge transfer analysis is called Mullikan analysis.
Mullikan analysis needs to have the basis set localized on the ions. In Planewave based
calculations, such as those used in this dissertation, the plane waves are not associated
with a particular ion in the system. So, the traditional Mullikan analysis is not possible.64
An alternate analysis is to use the charge density of the system and divide the
system up into a grid. By then analyzing the planes to see where there is effectively no
change in the density of the electrons going from one point to the next, one can segregate
out volumes. These volumes are called Bader regions. The bader regions can then be
assigned a charge based on the total charge in that volume.
Algorithmically, this is quite simple and the quality of the results is heavily dictated by
the incoming grid. Original algorithms would preferentially trace the lattice and result in
erroneous division of the bader region. Tang has corrected this anomaly by two means, 1
increasing the space grid sufficiently to ensure the charge gradient can be determined and
also by interpolating slightly off the grid of the charge density.65
This results in the systematic error for simple ionic systems such as NaCl
having charge assignment errors < 0.01 e.
The use of DFT is a very valuable tool for studying materials. The calculations
provide access to the ground state energy on bulk crystals, surfaces of crystals and
interface structures. The ground state energy is the enthalpy of the system at zero Kelvin
and then by applying various analysis techniques, it is possible to explore various
material systems and propose further research either via additional experiments or
simulations.

36
Chapter 4
AB INITIO STUDIES OF BULK TANTALUM NITRIDE
This chapter of the dissertation provides clarity to which of the 1:1 stoichiometric
phases of Tantalum Nitride are thermodynamically stable at ambient conditions. DFT is
used to calculate the lattice parameters; bulk modulus and Heat of Formation of TaN in
the NaCl, CoSn, and Fe2P phases using 3 types of exchange correlation functionals. In
addition, the Density of States (DOS), Electron Localization Functional (ELF) and Bader
analysis were calculated and provide insight into the bonding between the Nitrogen and
the Tantalum. Vacancy formation enthalpies for NaCl-TaN CoSn-TaN and Fe2P-TaN are
calculated to help understand phase stability and composition range.
The Vienna Ab-initio Simulation Package (VASP 4.6) was used to perform the
calculations. The bulk systems used Localized Density Approximation (LDA),
Generalized Gradient Approximation Perdew Wang 91 and Generalized Gradient
Approximation Perdew Burke Ernzerhof (GGA-PBE) exchange-correlation
functionals.54-59 Projector augmented wave Pseudopotentials were used to describe the
core electrons, and the valence electron wave functions were described with a plane wave
basis set cutoff of 400eV for the perfect crystals52, 53 The 3 phases are CoSn-TaN (Space
group: 191; Short international symbol: P6/mmm), Fe2P-TaN (Space group: 189; Short
International Symbol: P62m) and NaCl-TaN (Space group: 225; Short International
Symbol: Fm3m). CoSn-TaN and NaCl-TaN are documented on the phase diagram.
Bulk Studies Calculations Methods
The published, experimental lattice constants were used to initiate all bulk
studies, and were optimized by analyzing the energy vs volume curves. As the CoSn and

37
Fe2P phases are HCP, the choice of a and c were done to ensure that both directions were
changed by the same amount. The k-space was 15x15x13 and 9x9x9 for hexagonal
phases (CoSn and Fe2P) and NaCl phases, respectively. Systems were converged to <1
meV/at. The k space was gamma centered for CoSn and Fe2P to avoid issues with the
symmetry of the K space and convergence issues. The NaCl phase K point schema
followed the standard Monkhorst Pack method. All three kspaces were generated using
the Monkhourst Pack method. The Volume and associated ground state energy of the
systems was calculated and fitting to a third order polynomial for minimal calculations.
Bulk Modulus, Heat of Formation and Cohesive Energy were calculated for the
CoSn, Fe2P and NaCl phases. The isothermal bulk modulus (B) can be defined by this
equation of state (EOS):
TV
PVB
∂∂
−= 7
Where V is the volume of the material, P is the pressure applied to the material at a
specified temperature. The equation assumes the material responses in a linear fashion
regardless of the applied pressure direction. The Murnaghan Bulk modulus EOS was
used in this dissertation with the cell volume modulated by ± 1%.66
8
Where E0 is ground state energy, B0 is the bulk modulus at the ground state, V0 is the
ground state volume and V is the system volume. B’0 is value of the bulk modulus first
derivative value at the minimal energy. The numerical approach to solving this is as
follows:
1. Vary the size of the unit cell by a few percent. In the case of a HCP cell, the unit
lattice constants of a and c need to be varied independently.
( )1
11 '
0
00'0
0
'0
00
'0
−−
+−
+=B
VB
B
VV
B
VBEVE
B

38
2. The resulting curve of Energy vs. Volume is fitted via a least squares technique
to the Murnaghad equation.
Materials can and do behave asymmetrically with respect to applied stresses
vectors (i.e. applying stress to a unit cell in a particular vector will distort the cell a
different amount as compared to stress vector in a different vector). This asymmetric
response is due to the crystal structure of materials. Calculations were carefully analyzed
in the Energy vs. Volume curves to ensure this does not happen by only modulating the
volume of the whole cell in fixed steps.
Heat of formation (Hf) was calculated using the following formulation27, 28, 33
totalBulkTaTa
totalNN
NTaCellTaN
NTaf
E
E
nm
mnEH
−=
=+
−−≈
µ
µ
µµµµ
25.0
),(
9
The ECellTaN, E
totalN2, and Etotal
Ta-Bulk are the enthalpies of TaN (bulk), N2 (gas) and
Ta (BCC), respectively and n are the number of Tantalums in the unit cell and m is the
number of nitrogens in the unit cell. Reference chemical potential states for Ta and N
were considered to be Ta-BCC and N2 (gas), and were also calculated using VASP. Ta-
BCC had a k-space of 11x11x11 with Monkhourst Pack with a planewave cut off of
400eV and a0 was 3.30 Ang with convergence to < 1 meV/at and found to have chemical
potential of -11.8653 eV/at. Chemical potential for N2 was calculated in a large
supercell box of 20x20x20 Angstroms, 1x1x1 k point with a planewave cutoff of 400 eV
and found to be -8.2996 eV/at with a bond length of 1.109 Ang.
The cohesive energy is the energy needed to dissociate the material into isolated
atoms. 50

39
∑∑
=
=
−=
Ni
NiiCell
C i
iHHE
...1
...1 10
Where Ec is the Cohesive Energy, Hcell is the ground state energy of the unit cell. Hi is
the energy for the individual, isolated atoms of the system. The cohesive energy gives
the difference between the ground state of chemical materials to the energy of the isolated
species and provides a measure of the energy needed to dissociate the system. This
would be an important metric where vacuum based depositions are involved such as PVD
or CVD. Cohesive energy and heat of formation provide similar information on phase
stability, but with different reference states.
The Density of States (DOS), Charge Density Plot and Electron Localized
Functional (ELF) were determined and analyzed for both the NaCl and hexagonal phases
(CoSn and Fe2P) with the k-space increased to 21x21x21 and 21x21x19, respectively.
The DOS for all systems was shifted so the Fermi-energy was zero. The charge density
and ELF plots were qualitatively analyzed with the Visual Molecular Dynamics (VMD,
version 1.8.7) program.61 To quantify charge and ionic radii, a Bader analysis was
completed on the system with the Fourier transform grid increased significantly. The
NaCl had a 210x210x210 mesh, the CoSn had a 224x224x125 mesh, and the Fe2P had a
240x240x140 mesh. All calculations used a GGE-PBE exchange correlation functional.
The analysis was based off the fast algorithm described by Tang.65
Lattice Calculations
Table 7 has results of the lattice parameters for all three phases along with
published experimental values (at room temperature) and ab initio studies in the
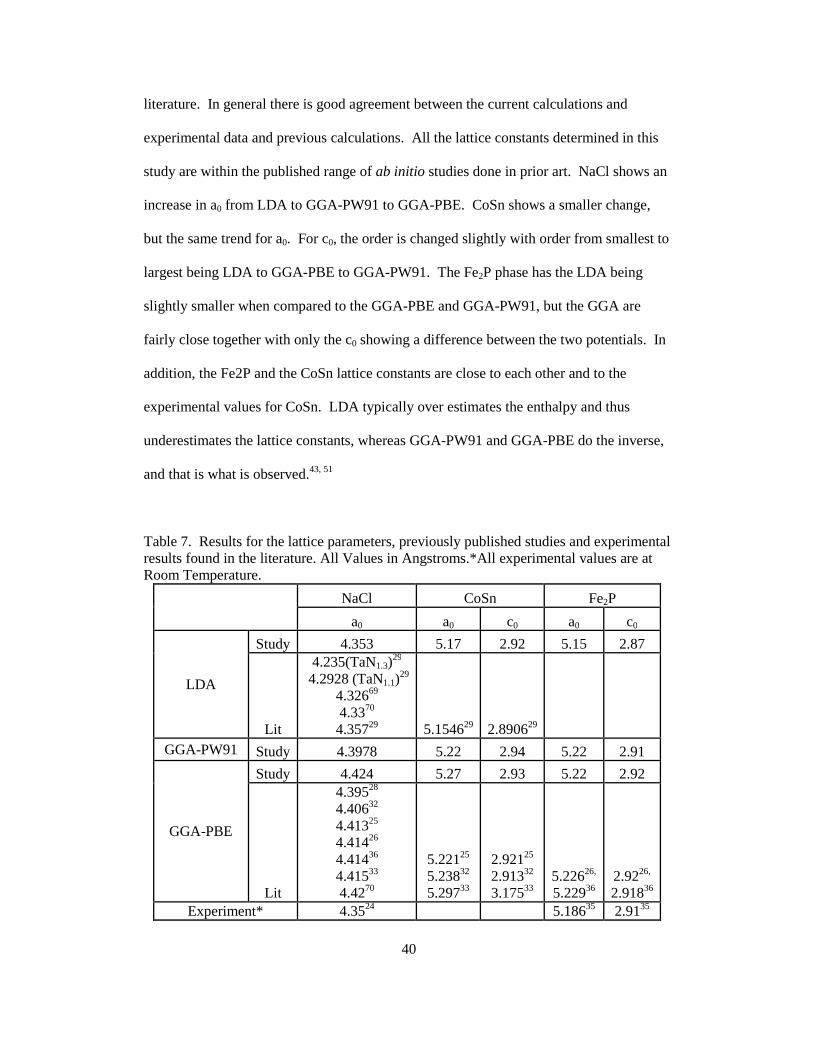
40
literature. In general there is good agreement between the current calculations and
experimental data and previous calculations. All the lattice constants determined in this
study are within the published range of ab initio studies done in prior art. NaCl shows an
increase in a0 from LDA to GGA-PW91 to GGA-PBE. CoSn shows a smaller change,
but the same trend for a0. For c0, the order is changed slightly with order from smallest to
largest being LDA to GGA-PBE to GGA-PW91. The Fe2P phase has the LDA being
slightly smaller when compared to the GGA-PBE and GGA-PW91, but the GGA are
fairly close together with only the c0 showing a difference between the two potentials. In
addition, the Fe2P and the CoSn lattice constants are close to each other and to the
experimental values for CoSn. LDA typically over estimates the enthalpy and thus
underestimates the lattice constants, whereas GGA-PW91 and GGA-PBE do the inverse,
and that is what is observed.43, 51
Table 7. Results for the lattice parameters, previously published studies and experimental results found in the literature. All Values in Angstroms.*All experimental values are at Room Temperature.
NaCl CoSn Fe2P
a0 a0 c0 a0 c0
LDA
Study 4.353 5.17 2.92 5.15 2.87
Lit
4.235(TaN1.3)29
4.2928 (TaN1.1)29
4.32669 4.3370 4.35729 5.154629 2.890629
GGA-PW91 Study 4.3978 5.22 2.94 5.22 2.91
GGA-PBE
Study 4.424 5.27 2.93 5.22 2.92
Lit
4.39528 4.40632 4.41325 4.41426 4.41436 4.41533 4.4270
5.22125 5.23832 5.29733
2.92125 2.91332 3.17533
5.22626,
5.22936 2.9226,
2.91836 Experiment* 4.3524 5.18635 2.9135

41
The Energy vs. Volume curve (Figure 8) suggests that the Fe2P phase is the
preferred thermodynamic crystal structure of the three, by ~ 0.3 eV/at, with the order of
the stability being Fe2P > NaCl > CoSn.. This relative stability is consistent for all three
exchange-correlation functionals. This calculation is consistent with the phase diagram,
as the NaCl phase does not occur until high temperature. Figure 8 shows the PBE
calculations; the results are similar for LDA and GGA-PW91. .
Figure 8. Calculated energy vs volume curves for the NaCl, CoSn and Fe2P phases of Tantalum Nitride Bulk Studies - Modulus
The bulk modulus calculations are shown in Table 8 alongside the experimental
values for bulk modulus. The experimental data is taken at room temperature and it
should be noted that there should be a small increase in the modulus at zero Kelvin.67 For
example, Silicon Nitride (Si3N4) experiences a 2% increase when going from room
temperature to 30 K.68
In general there is reasonable agreement between the present results and
experimental measurements and previous calculations. For all three methods (LDA,
GGA-PW91, GGA-PBE) the results are in close agreement with experiment for the Fe2P
phase (when the measurement was done, it was believed to have been for the CoSn

42
phase, but it was likely to actually have been for the Fe2P phase). For the CoSn phase,
the comparison of the present calculations with experiment is slightly worse for the LDA
and GGA-PW91, but this is likely due to the experimental value being for the Fe2P phase,
not the CoSn phase. For the NaCl phase, the three methods are in reasonable agreement
with the experimental value, with the LDA having a slightly lower value, and the GGA-
PBE having a slightly higher value.
Thermodynamic Properties Results and Discussion
For Cohesive Energy, the order of stability is Fe2P>CoSn>NaCl with the
difference between the phases being 0.2 to 0.06 eV/at for all exchange correlation
functions studied as shown in Table 9. The only published value found for the cohesive
energy is derived from a different calculation than what was used here as Cao used the
fitted energy minimum from the bulk modulus calculation as the cohesive energy value.25
The Heat of Formation calculation suggests a similar result as the Cohesive
Energy, where the CoSn phase is metastable when compared to the NaCl phase. For both
Cohesive Energy and Heat of Formation, Fe2P is the lowest.
Table 8. Ab initio results for Bulk Modulus (GPa) for the 3 phases, experimentally found results and published ab initio values. *Experiments are at Room Temperature. ** The value listed is for a phase which was believed to be CoSn, but could have been Fe2P.
NaCl CoSn Fe2P
LDA Study 341.74 280.78 327.87
Lit 379.669 403.8570
GGA-PW91 Study 297.79 268.32 333.61
GGA-PBE
Study 394.57 317.87 322.09
Lit
327.625 328.370 34733 34936 37528
25133 303.625
32036 31933
Experiment* 349*71
320 ± 1171**

43
Table 9. Calculated Cohesive Energy for NaCl, CoSn and Fe2P phases
NaCl CoSn Fe2P
LDA -10.71 -10.53 -10.96
GGA-PW91 -9.6 -9.46 -9.83
GGA-PBE -9.45 -9.39 -9.78
Ab Initio Studies -13.3825 -14.05 25
The results for Heat of Formation are listed in Table 10 for all phases and include
experimental and theoretical literature values. For the present calculations, all three
methods (LDA, GGA-PW91, and GGA-PBE) find that the heat of formation is largest for
the Fe2P phase, suggesting that it is the most stable. The calculated values for the Fe2P
phase are in good agreement with the experimental value, which was believed to be for a
CoSn phase, but likely could have been the Fe2P phase. There is no experimental value
for the NaCl phase for comparison, but since it is less stable at low temperatures it must
have a lower heat of formation, consistent with the present calculation. All three methods
find that the heat of formation is slightly larger in magnitude for the NaCl phase
compared to the CoSn phase, in agreement with previous calculations for heat of
formation, and contradicts the Cohesive Energy results of Cao.25
Fe2P appears to be the more stable phase when compared to CoSn. The location
of the Tantalums is the same between the two crystal structures. The change in the
distance and a symmetric distribution of the Nitrogens in the Fe2P structure is the
difference. For the two crystal structures, it can be seen that there are two types of
Tantalums as shown in figure 9 and labeled to highlight the two types of Tantalums in the
two crystal structures. The redistribution of the Nitrogens is the reason for the stronger
bonding occurring through the Fe2P structure. In addition, the difference in the Tantalum
bonding should be obvious in the bond and electric characterization.

44
Table 10. Ab initio and experimental results for Heat of Formation (eV/atom) for the 3 phases. *Experiments are at Room Temperature, and the value listed is for a phase which was believed to be CoSn, but was probably Fe2P. ** Values were calculated based on functional units of TaN and not atom based.
NaCl CoSn Fe2P
LDA
study -1.33 -1.15 -1.58
Lit
-1.2929 -1.30527,
-1.39 (TaN1.1)29
-1.4 (TaN1.3)29
-1.11727,
-1.1129
GGA-PW91
Study -0.98 -0.856 -1.22
GGA-PBE
Study -0.872 -0.809 -1.20
Lit
-0.8633, -0.87526 -0.97628
-132
0.1133, -0.74526 -0.8632
-1.18533 -1.19526
Experiment
-1.372
Figure 9. Location of different types of Tantalums compared to Nitrogen in the CoSn and Fe2P phases based on Basis set.
Density of States, Electron Localization Functional and Bader Analysis
The Density of States (DOS) are shown in Figure 10. Based on the DOS, NaCl,
Fe2P and CoSn are metallic and are comparable to other ab initio studies.25, 26, 36 The
large number of states in the -10 to -3 eV region suggest a significant amount of covalent
bonding occurring between the N2p and the Ta5d. As there are 2 types of tantalums in
the Fe2P and CoSn phases, both are shown and the DOS shows significant differences in
the DOS of the Tantalums in the CoSn’s and the Ta-2 atom having greater bonding than
Tantalum
Tantalum

45
the Ta-1 atom. The Fe2P phase suggests that this bonding difference is less when
comparing the Ta-1 to Ta-2 DOS’s. The NaCl DOS suggest a significant amount of
states at the Fermi level which is dominated by the Ta5d orbitals.
The Charge Density and Electron localization functional were plotted and
analyzed and shown in Figure 11, 12, and 13. The ELF and Charge density plots indicate
the NaCl-TaN bonding is ionic with charge residing on the nitrogen as there are no other
electrons associated with the other ionic species. The CoSn-TaN charge density shows
the bonding to be occurring between the Ta-2 and the Nitrogen. The ELF suggests the
bonding occurring between the Nitrogen and Ta-2 is metallic to ionic. The Fe2P charge
density of this system suggests there is bonding occurring similarly for the Tantalum’s to
the Nitrogen’s.
The Bader analysis results are shown in Table 11. For CoSn and Fe2P, Tantalum
1 is located on (0001) and Tantalum 2&3 are located on (0002). The charge on each of
the atoms is based on taking the difference of the valence electrons as defined by the
PAW’s and subtracting the number of electrons as determined by the analysis. Tantalum
has 11 valence electrons and Nitrogen has 5 valence electrons. For all three structures
there is a large transfer of charge from the Ta to the N, but for the CoSn and Fe2P
structures there is a difference between the two Tantalum sites, with the CoSn having a
larger difference between the two Ta sites (1.4 electrons) than in the Fe2P structure (0.6
electrons). The radii and Bader Volume follow a similar trend where the Tantalums have
a larger difference in the CoSn phase compared to the Fe2P. N has a larger radius in the
NaCl phase than in the other two phases. However, the Bader Analysis, ELF, and
volume vs. energy curves support Fe2P as the more stable phase

46
Figure 10. Density of States of Tantalum Nitride. The three phases appear metallic. Fermi Energy for all three phases is shifted to 0 eV.
The percent ionicity was calculated based on Equation 11 as shown below.
% &'()*)+, 1 -..01|23456789:5;5< =>>684|? 11
Nitrogen and Tantalum have an Allen Electronegative of 3.066 and 1.34, respectively. 20
This means the % ionicity of a Ta-N bond is 53%. The structure should exhibit more
covalent bonding than an ionic bonding. The calculation ignores the fact that there are
two types of Tantalums in the system.
-10 -5 0 5 10 15
NaCl - Ta
NaCl - N
-10 -8 -6 -4 -2 0 2 4
CoSn - Ta-1
CoSn - Ta-2
CoSn - N
-10 -8 -6 -4 -2 0 2 4
Fe2P - Ta-1
Fe2P - Ta-2
Fe2P - N
Co
Sn
Ph
ase
Fe
2P
Ph
ase
NaC
l P
hase

47
Figure 11. Iso-contours for the Charge Density and Electron Localization Functional for NaCl-TaN.
Figure 12. Iso-contours for the Charge Density and Electron Localization Functional for CoSn-TaN.
Figure 13. Iso-contours for the Charge Density and Electron Localization Functional for Fe2P-TaN.

48
Table 11. Bader Analysis Results for all 3 phases. NaCl CoSn Fe2P
Valence Electrons
Tantalum 1
9.06 10.20 9.67
2 &3 8.77 9.04 Nitrogen 6.94 6.75 6.75
Charge Tantalum
1 1.94 0.80 1.33 2 &3 2.23 1.96
Nitrogen -1.94 -1.75 -1.75
Bader volume (Ang3)
Tantalum 1 11.56 17.95 14.85
2 &3 10.39 11.44 Nitrogen 11.45 10.58 10.48
Radius (Ang)
Tantalum 1 1.12 1.28 1.03
2 &3 1.04 1.07 Nitrogen 1.11 0.99 0.97
Summary
The existence of the Fe2P phase for TaN has been noted in experimental work
and ab initio work has proposed this phase over the CoSn phase. 26, 33, 36 All three
exchange-functionals result in the same relative order of stability, Fe2P>CoSn>NaCl.
This is consistent with one study by Zhao who investigated all three structures using one
exchange-correlation functional PBE-GGA and consistent with two other ab initio
studies finding CoSn metastable when compared to either Fe2P or NaCl.27, 28 The
stability of the phase has been shown over three different exchange correlation
functionals.
The bulk studies show good agreement with experimental lattice constants for all
three phases. The Bulk modulus for the Fe2P phase show reasonable agreement across all
of the methods and appear close to the experimental Bulk modulus reported for the CoSn
phase, but probably was the Fe2P phase. The Fe2P phase has the lowest Heat of
Formation energy across all methods. In addition, the Bader Analysis finds that the two
Ta sites in the the Fe2P phase have more similar charge than in the CoSn structure. The
Bader Analysis is qualitatively supported by the ELF study. Figure 9 also shows the
49
different Tantalum’s determined by the ELF, Charge Density Plots and Bader Analysis.
It would be expected that these different Tantalums would have different vacancy
formation enthalpies and that the (0001) and (0002) surfaces should be different in
energy.
For the next chapter, we will focus on just one functional, to reduce
computational cost and since the three funcationals give very similar results. We choose
the GGA-PBE, since it yields slightly better comparison with experiment First, looking at
the lattice constants and bulk modulus, the GGA-PBE comes very close to the
experimental value for the CoSn and Fe2P phases. Second, the focus of the surface
studies is on the CoSn and Fe2P phases as these are unexplored and one of the crystal
structures is the ambient system. It should be noted, if the author was interested in the
surface of NaCl-TaN, a different conclusion is reached and the LDA exchange
correlation function would be used.

50
Chapter 5
POINT DEFECTS IN BULK TANTALUM NITRIDE
Crystal materials have point defects which result in different physical
phenomenal possible, such as diffusion and atomic re-arrangement to other crystal
structures. The defects in a material can significantly alter the macroscopic properties.
Examples of this are semiconductor doping and electrical properties, dislocation glide
and yield strength of materials. There are several types of point defects including
interstitials, vacancies, and anti-site defects. This work is focused on point defects of the
CoSn, Fe2P and NaCl phases. There are 3 types of vacancies in the hexagonal crystal
structures as can be seen in the basis of the crystal and in Figure 14. The NaCl phase
forms a eutectic with the Fe2P and the Ta2N as can be seen in the phase diagram. The
vacancy formation energy is a very important factor in determining the composition
range of ordered compounds like NaCl, CoSn, and Fe2P, and will be investigated in this
chapter.
Defect Analysis Methods
Point defect stability in tantalum nitride will be assessed for CoSn-TaN. The
vacancy formation energy (Ef) is defined as the energy needed to form a vacancy and is
calculated as follows32
−−= − nnf E
n
nEE
11 12
Where En is the energy of the system without a vacancy, n is the number of atoms in the
system, and En-1 is the energy of the system with a vacancy.
As TaN is a binary compound, the Energy of Formation for the defect is then
related to the chemical species that is

E
Where the Energy of Formation with respect to the specific vacancy species is defined by
the energy as calculated with atomic species missing, in this case Tantalum or Nitrogen.
En is the calculated energy of the system with no vacancy, and
of the species removed from the system.
Figure 14. Crystal structures for CoSn and FeTantalums ( ) shifts can be seen in and are slight between the two phases. The Two types of vacancies are highlighted in the diagrams. Tantalum Vacancy location 1 is circled in Green and Tantalum Vacancy location 2 is circl
The chemical potentials of the system are constrained by looking at the systems
energy and comparing the summation of the chemical potentials of the systems defined
by the following in a binary system
51
Xn
XnVacc
Xf EEE µ+−= −1,
Where the Energy of Formation with respect to the specific vacancy species is defined by
calculated with atomic species missing, in this case Tantalum or Nitrogen.
is the calculated energy of the system with no vacancy, and µ is the chemical potential
of the species removed from the system.
Crystal structures for CoSn and Fe2P TaN. The Nitrogens ( ) and ) shifts can be seen in and are slight between the two phases. The Two
types of vacancies are highlighted in the diagrams. Tantalum Vacancy location 1 is circled in Green and Tantalum Vacancy location 2 is circled in Orange.
The chemical potentials of the system are constrained by looking at the systems
energy and comparing the summation of the chemical potentials of the systems defined
by the following in a binary system
NTan yxE µµ +=
13
Where the Energy of Formation with respect to the specific vacancy species is defined by
calculated with atomic species missing, in this case Tantalum or Nitrogen.
is the chemical potential
) and ) shifts can be seen in and are slight between the two phases. The Two
types of vacancies are highlighted in the diagrams. Tantalum Vacancy location 1 is
The chemical potentials of the system are constrained by looking at the systems
energy and comparing the summation of the chemical potentials of the systems defined
14

52
Where µX is the chemical potential for chemical species X (Ta or N) and x, y are the
number of species in the compound. In addition, the chemical potential could be looked
up in various thermodynamic tables or calculated from first principles.
For calculations involving more than 1 vacancy, the equation becomes
m
mEEE
Xn
XmnVaccX
f
µ+−= −, 15
Where the equation is the same as the single vacancy formation energy except it is
corrected for m number of vacancies. The calculation is done only with the NaCl-TaN
phase as it is the only one that suggests it is stable off stoichiometry.
The crystals were 96 atom systems, GGA-PBE exchange correlation functional
and planewave cutoff at 520 eV was used as the crystal system will have a vacancy in it
and the planewave needs to be expanded enough to ensure convergence in the vacancy
location as advised in the VASP manual. A 5x5x3 K space with Gamma centering was
also used. A conjugant gradient method was used for the relaxation of the system with 8
ionic steps at a minimum and converged to < 1 meV/at.
CoSn-TaN Vacancies
In this study, the vacancies have positive formation energy as shown in Table 12
indicating vacancies are enthalpically unfavorable as expected. Table 13 summarizes the
atomic movements during relaxation. The Ta vacancies have a higher formation energy
associated with them compared to the Nitrogen vacancy. The nearest neighbor
movements are shown for the surrounding lattice, atomic movements of all 3 defect types
in Figure 15.
The Nitrogen vacancy (VN) has a reduction in the supercell volume with a
reduction in the (0001) area, but an increase in the [0001]. The VN shows a large

53
displacement of the surrounding nitrogen atoms around the defect center as shown in
figure15. The tantalum atoms nearest neighbors show little movement relative to the
nitrogen atom. The nitrogen atoms are drawn toward the defect center and show a
symmetric response around the defect center. The Nitrogen is slightly smaller than either
of the Tantalums and therefor would move slightly easier than either.
Figure 15. CoSn-TaN Nearest Neighbor movements around vacancies. The Nitrogens
( ) Tantalums ( ) , and Vacanies ( ) are shown.
The Tantalum-1 vacancy (VTa-1) type defect resulted in little change in length in
the (0001), but a small increase in [0001], which results in a small, net increase in the
crystal volume. The VTa-1 defect results in a symmetric movement of the Ta and N
nearest neighbors away from the defect center as shown in Figure 15. The N atoms in the
same (0001) as the VTa-1 defect symmetrically moves away from the defect center at the
same magnitude. The Tantalum atoms on the [0001] direction above and below the VTa-1
move away from the defect center. This system repulsion seems to allow for little
Nit
roge
nT
anta
lum
-1Ta
ntal
um-2
100 010 001 Vector info

54
reduction in the overall super lattice size and would result in a large vacancy in the center
of the crystal that could allow for easy movement of other defect types. The ELF and
Bader Analysis suggest that the Ta-1 location is less bound than the Ta-2 location to the
N as noted in Chapter 4.
Table 12. The enthalpy of formation for vacancy formation energies in the crystal phases studied. NaCl has 64 and 63 atom cells for perfect and defect systems, respectively. The hexagonal phases have 96 and 95 atoms for the perfect and defect crystals, respectively
Phase Cell Formation
Energy (eV)
Crystal Vectors (Ang) Cell Vol
(Ang3)
Vol Change (Ang3)
%Vol Change
x y z
NaCl Base
8.85
692.24
VN 0.108 8.84
690.82 1.42 -0.2%
VTa -1.508 8.82
685.73 6.51 -0.9%
CoSn
Base
10.54 10.54 11.71 1126.05
VN 1.28 10.49 10.49 11.73 1120.96 -5.1 -0.45% VTa-1 1.00 10.54 10.54 11.72 1126.40 0.4 0.03% VTa-2 2.57 10.51 10.51 11.72 1120.32 -5.7 -0.51%
Fe2P
Base
10.47 10.47 11.7 1110.51
VN 3.07 10.45 10.45 11.72 1108.30 -2.2 -0.20% VTa-1 3.48 10.47 10.47 11.67 1107.14 -3.4 -0.30% VTa-2 2.51 10.46 10.46 11.68 1107.03 -3.5 -0.31%
The Tantalum-2 Vacancy (VTa-2 ) shows a reduction in the supercell volume with
a reduction in the (0001) area, but an increase in the [0001] dimension. The VTa-2 defect
shows movement of nearest neighbor Ta atoms towards the defect center with the
nitrogen moving very little as shown in Figure 15. The difference in the VTa-1 and VTa-2
defects suggest a potential preferred path for vacancy diffusion and substitutional
diffusion. The VTa-2 defect shows a greater release of energy upon relaxation than all of
the studied defects. This is consistent with the ELF and Bader Analysis results as these
two types of Tantalum sites have different bonding natures in the crystal as Ta-2 has the
largest positive charge on it.

55
Table 13. Assessment of supercell distortions for Vacancy defects and perfect cells. NN is Nearest Neighbor for CoSn vacancies largest absolute move is relative to perfect crystal position.
Vacancy type
Largest atomic movement
Largest atomic movement
species Position
Largest absolute
movement (Ang)
Total species moving
max
VN Towards
defect center Nitrogen 2nd NN 0.083 4
VTa-1
Away from defect center
Nitrogen NN 0.156 6
Away from defect center
Tantalum Mirror
Ta 0.156 2
VTa-2 Towards
Defect center Tantalum 2nd NN 0.188 6
Fe2P-TaN Vacancies
The convention of naming the vacancies was maintained from the CoSn phase.
The defect energies are all larger than the CoSn phase defects, which means they are less
favored to form energetically compared to the CoSn phase defects. The defect studies
were repeated with a slight increase in the crystal lattice dimension to ensure the values
reportedly converged the same and there was limited numerical noise in the calculation.
It should be noted that the crystal lattice did not change much with the volume decreasing
by 0.2% to 0.3% for all 3 vacancies. The tantalum vacancies showed a larger decrease
compared to the Nitrogen vacancy volume decrease. The majority of the volume change
is associated with a compression in the Z axis for the tantalums and the nitrogen showed
~ 0.2% reductions in all directions.
The nearest neighbors of the defects in the Fe2P supercell, showed no movement.
The Tantalum in the (0001) shows similar energy released compared to the nitrogen, but
greater than the energy associated with the other Tantalum vacancy. The Bader analysis
suggests that the Tantalum is larger compared to the other tantalum and thus would leave
a larger vacancy in the system. A VTa-2 should be more stable as it would create less of a

56
volume change. This would be balanced by the fact that the Ta-2 has a different number
of bonds to the Nitrogens when compared to the Ta-1. The Ta-2 should leave greater
number of dangling bonds associated with the surrounding Nitrogens. Comparing the
Bader analysis results to the defect formation energies calculated show similar trends.
The Vacancy Energy of the CoSn phase show wide variance between the two sites
compared to the Fe2P, similar to larger variations in the ionic charge. The VTa-2 defect is
lower in formation energy than the VN or VTa-1 defects. The Bader analysis suggests that
the Nitrogen and Tantalum-1 have less of an absolute charge when compared to the
Tantalum-2 species.
NaCl-TaN Vacancies
The NaCl phase has small, but positive formation energy for the Nitrogen
vacancy. The Tantalum vacancy in the NaCl phase shows a relatively large, negative
enthalpy for formation, so formation is very favorable. This was studied further by
removing additional Tantalums for the 64 atom cell. Supercells with Two and 8
Vacancies were created, corresponding to compositions of 48% and 43% N, respectively.
The two vacancy cell involves placing the two vacancies fare from one another. The 8
Vacancy cell was evenly distributed in the 64 atom cell by using the fact that the cell is
made up of 8 smaller cells. Since the vacancies are charged, it is likely that they would
distribute evenly to maximize their separation. The 8 vacancy cell corresponds to a 43 at
% which is the eutectoid point for the NaCl structure. . The results of the additional
vacancies are plotted in Figure 16 and the Enthalpies are provided in Table 14. Since the
NaCl phase forms at high temperatures, entropy effects are significant, so the ideal
Entropy of mixing was added to each of the cells by a calculation of the configurational
entropy using Boltzmann’s Entropy formula: 73
57
@ AB( C D!∏ D!
G 16
Where S is the entropy kB is Boltzmann’s Constant, N is the total number of sites in the
cell. Ni is the number of sites either occupied by Tantalum or Nitrogen. The entropy is
then input into a Gibb’s Free energy calculation with G = H –ST where H is the enthalpy
and T is the temperature. The analysis was done at the eutectoid temperature (T = 1993
K) from the phase diagram. The Figure 17 shows Enthalpy and the Configurational
Entropy. The result is a drop in the Gibbs energy for the Tantalum nitride curve. The
shift in of the Enthalpy+Entropy curve would be more if one adds in the vibrational
entropy component (not calculated), and would shift the eutectoid point towards a lower
composition, and would increase agreement with experiment. .
Overall, the results show that vacancy formation is favorable in the NaCl
structure. The difference in Gibb’s free energy is small across a wide composition range,
from 43% to 50%, consistent with the experimental phase diagram which shows that the
NaCl phase forms from 42 at% to 50 at%..
Nitrogen vacancy has a small volume change. The Tantalum vacancy has a large
change volume and largest of the studied vacancies. For the Nearest Neighbors (NN) for
VN in the NaCl phase moved inward by 6% and for the VTa vacancy, NN moved inward
by 2%. This is comparable to other studies which found a 7 to 10% and 3 % in ward
movement for the VN and VTa, respectively.
Summary
The enthalpy of vacancy formation shows the Fe2P phase to have larger energies
for ions to be removed compared to the CoSn phase, which is consistent with the Fe2P
phase being more stable. The high vacancy formation energy on the Ta and N sites

suggests that Fe2P would exist as a line compound, which is what is observed on the
experimental phase diagram. In contrast, in the NaCl structure, vacancy formation on the
Ta sites is favorable, with only small dif
N, which is consistent with the experimental phase diagram showing that the NaCl
structure forms from 42 at% to 50 at%.
Figure 16. NaCl-TaN 64 atom supercell showing location of vacancies. Upper left is thperfect crystal. Upper right has a single Tantalum Vacancy. Lower left has 2 Tantalum Vacancies. Lower Right has 8 Tantalum Vacancies placed by repeating an 8 atom lattice.
The Nitrogen ( ) Tantalums (
Table 14. Table of the Enthalpy for additional vacancies in at 64 atom supercell of NaClTaN.
Cell Enthalpy (eV/at)
Perfect -10.94
VN -10.98
VTa -10.95
2VTa -10.97
8VTa -10.82
58
suggests that Fe2P would exist as a line compound, which is what is observed on the
experimental phase diagram. In contrast, in the NaCl structure, vacancy formation on the
Ta sites is favorable, with only small differences in Gibb’s free energy from 43% to 50%
N, which is consistent with the experimental phase diagram showing that the NaCl
structure forms from 42 at% to 50 at%.
TaN 64 atom supercell showing location of vacancies. Upper left is th
perfect crystal. Upper right has a single Tantalum Vacancy. Lower left has 2 Tantalum Vacancies. Lower Right has 8 Tantalum Vacancies placed by repeating an 8 atom lattice.
Tantalums ( ) , and Vacancies ( ) are shown.
Table of the Enthalpy for additional vacancies in at 64 atom supercell of NaCl
a0 (Ang) Cell Vol (Ang3)
Vol Change (Ang3)
%Vol Change
4.424 692.24
4.42 690.82 1.42 -
4.41 685.73 6.51 -
4.40 679.87 12.37 -
4.30 637.41 54.83 -
suggests that Fe2P would exist as a line compound, which is what is observed on the
experimental phase diagram. In contrast, in the NaCl structure, vacancy formation on the
ferences in Gibb’s free energy from 43% to 50%
N, which is consistent with the experimental phase diagram showing that the NaCl
TaN 64 atom supercell showing location of vacancies. Upper left is the
perfect crystal. Upper right has a single Tantalum Vacancy. Lower left has 2 Tantalum Vacancies. Lower Right has 8 Tantalum Vacancies placed by repeating an 8 atom lattice.
Table of the Enthalpy for additional vacancies in at 64 atom supercell of NaCl-
%Vol Change
-0.2%
-0.9%
-1.8%
-7.9%

59
Figure 17. Graph of the Enthalpy and Gibbs Free Energy at1993K (Enthalpy + Entropy-Config) curve for varied atomic compositions of the NaCl-TaN phase.
-11.2
-11.1
-11.0
-10.9
-10.8
42% 44% 46% 48% 50%
Gib
b's
Fre
e E
nerg
y (e
V/a
t)
Tantalum (at%)Enthalpy Enthalpy + Entropy-Config

60
Chapter 6
TANTALUM NITRIDE SURFCE AND ADATOMS
As the metal interconnects can be formed by atomic deposition techniques,
adatoms begin the early stages of nucleation and interface formation. At the surface,
diffusion, re-arrangement and interlattice changes attempt to lower the systems energy.
Atomic deposition techniques are constrained by these physical phenomena from a
thermodynamic perspective. A key to this is the understanding of the TaN surface and
Adatom adhesion. Adatoms drive the way interfaces may form as they provide insight
into how two different elements may interact at an interface.
This chapter first calculates bonding energy between isolated (gas phase) single
atoms of Tantalums and Nitrogens to a single Silver atom. Then the surface energy of 2
close packed surfaces of Fe2P-TaN are calculated and assessed as a function of partial
pressure of Nitrogen to understand which surface will be stable in a vacuum environment.
Next a study of the absorption enthalpies for Silver adatoms will be done to understand
which sites are preferred for adsorption, including single atoms, two adatoms, and a sub-
monolayer. Finally, a calculation of the thin 4-layer slab of silver on a Tantalum Nitride
surface will be calculated to understand the interface of Tantalum Nitride and Silver thin
films.
Bond Energy calculations
A single atom of Silver was placed in a large supercell with either a Tantalum or
Nitrogen. The molecule was allowed to relax. The k-space is set at 1x1x1 according to
the standard method to assess isolated atoms or isolated molecules. The exchange
correlation functional used was the GGA-PBE. The planewave cutoff and cell size were
increased to ensure convergence which was determined to be < 1 meV/at. Figure 18

61
shows the results of the convergence which was very stable across the calculations. The
Bond energy was determined by the following equation
H78= I9JK: 76 L K: 76 L I9 17
Where the Bond Energy and Calculated Energy are EBond, and EAg+ Ta or N, respectively.
The isolated atoms, ETa or N and EAg , are the same values as used in the Cohesive Energy
calculations of Chapter 4. The Tantalum-Silver bond energy was determined to be -2.93
eV and the Nitrogen-Silver bond energy was found to be -4.47 eV at a planewave cutoff
of 520 eV. This is a theoretical value for a bond between the two elements and provides
insight into which bonding sites may be preferred on the surface of the Tantalum Nitride.
In this case, it suggests that the silver will prefer to bond to nitrogen, not tantalum. This
will be taken into consideration when looking at bonding sites for surface absorption
studies.
Figure 18. Energy convergence for bond energy calculations for Nitrogen-Silver and Tantalum-Silver.
Surface Energy Calculations
This study looks at the stability of the close packed layers of the Fe2P to
determine which surface is thermodynamically more stable. There are 2 surfaces that
were analyzed in this study, the (0001) and the (0002). The (0001) is a mixed Nitrogen
-5.9-5.8-5.7-5.6-5.5-5.4-5.3-5.2-5.1-5.0
200 300 400 500 600
Tot
al C
al E
nerg
y (e
V)
Planewave Cutoff (eV)
N-Ag
Ta-Ag
-5.9-5.8-5.7-5.6-5.5-5.4-5.3-5.2-5.1-5.0
20 25 30
Tot
al C
al E
nerg
y (e
V)
Box Size (Ang)
N-Ag
Ta-Ag
62
and Tantalum surface which has a ratio of 2:1 and is Nitrogen rich. The (0002) surface is
only Tantalum. The method to calculate this was to use 2 different slabs which were not
stoichiometric and correct for the differences as noted in the surface section.
Surfaces can have reconstruction and/or relaxation. Surface relaxation involves
the inter-plane distances contracting or expanding to help compensate for the additional
energy associated with the exposed surface. Surface relaxation occurs in the plane of the
exposed surface and atoms move in the plane to compensate for the loss of the nearest
neighbors. The reconstruction/relaxation energy can be calculated, but only by taking an
un-relaxed slab with the exact same terminations on both sides of the slab and then
computing the relaxation of that slab50
M N NM"DN
18
Where ER is the energy associated with the relaxation or reconstruction. EIS is the Energy
of the slab un-relaxed and ERS is the energy of the slab after relaxation. NS is the number
of atoms involved in that relaxation.
Slabs of Fe2P-TaN terminated either with the (0001), (0002) or mixed surface
were analyzed. The lattice constants used were the ones calculated in previous chapters.
The (0001) slab had 88 atoms (40 Tantalums and 48 Nitrogens), the (0002) slab had 80
atoms (44 Ta and 36 N) and the mixed slab had 1:1 stoichiometry with 96 atoms. Using
the 96 atom slab which had both (0001) and (0002) surfaces the vacuum layer was
determined and expanded until the energy converged (< 0.3 meV/at) and was 11 Ang for
all calculations. Results of the vacuum expansion are shown in Figure 19 and show

63
convergence of the slabs energy even at 7 Ang vacuum thickness. A thicker vacuum
(11Ang) was selected to allow for the Adatom experiments to be run.
Figure 19. Graphs of the Vacuum expansion calculations of the Fe2P 96 atom cell, at different scales. Left side graph has the bulk cell energy/at for reference included in it.
To compare the surface energies between the two slabs, the following derivation
is provided starting from an equation to calculate surface energy 74
O 12P N3:B QK:RK: QLRL ST U@"
19
Where A is the surface area of the slab, ESlab is the energy of the slab. P, V, T and S are
the pressure, volume, temperature and entropy, respectively. The number of Tantalums
and Nitrogens in the slab are xTa and xN, respectively. The chemical potentials (µTa and
µN) are for the chemical potentials of the elements in the compound. In ab initio
calculations, T = 0 and PV ~ 0 and the equation is then
O V 12P N3:B QK:RK: QLRL" 20
The sum of the chemical potentials should be the chemical potential for the compound
(µTa + µN = µTaN) and therefore the chemical potentials for the elements should be less.
RW X RW3Y 21
-11.3-11.2-11.1-11.0-10.9-10.8-10.7
Bulk Cell
7 8 11 14Ene
rgy
(eV
/at)
Vacuum Size (Ang)
-10.7995-10.7994-10.7993-10.7992-10.7991-10.7990-10.7989
7 8 11 14
Ene
rgy
(eV
/at)
Vacuum Size (Ang)

64
Where Y is either Ta or N. This is true or else the compound is not thermodynamically
stable and would decompose into its constituents. For ab initio studies, the Gibb’s free
energy is the enthalpy (G = H – TS = H) as the calculations are done at T = 0 and the
Enthalpy and Gibb’s Free Energy are equivalent to the cohesive energy of a system. This
gives the chemical potential for TaN.
RK:L RK: RL RK:3Y RL3Y ∆K:L 23
Where ∆HTaN is the Heat of Formation for TaN. Heat of Formation was calculated
previously as calculated in Chapter 3 and was -1.19998 eV/at with a GGA-PBE PP,
planewave cutoff of 520 eV, Kspace of 15x15x13 and gamma centered. In this case,
Nitrogen is assumed to be in the N2 gas state and Tantalum is in a BCC solid. Ta-BCC
had a k-space of 9x9x9 with Monkhourst Pack centering and a0 found to be 3.32 Ang
with a planewave cut off was 520 eV using a GGA-PBE exchange correlation functional.
The chemical potential was found to be -11.8324 eV/at. For the N2 gas, planewave
cutoff was set at 400 eV in a 30 Ang box and found to have a bond length of 1.11 Ang,
and chemical potential was found to be -8.2996 eV/at.
By placing equation 6.6 into equation 6.4, a relationship between surface energy
and chemical potential can be shown.
O V 12P N3:B QK:RK:L QK: QL"RL" 24
Using this equation, it is possible to understand the relative surface energies of various
planes based off this equation at 0 K and in a vacuum. Figure 20 shows the relative
stability with varied chemical potential of Tantalum. It suggests that the (0001) surface is

65
most stable which is in agreement with single chemical potential point calculation that
assumes the chemical potentials in the solid are the same as the chemical potentials of the
individual atoms (i.e. decomposition/formation point). The Surface energy of the (0001)
surface is always less than (0002) surface. It should be made clear that this is a relative
measure of surface stability and conclusions about absolute surface stability are not
complete.
Figure 20. Surface Energy of the Fe2P-TaN with (0001) and (0002) surfaces. The Tantalum chemical potential is varied as described.
To understand how the surface energy changes with increasing temperature and
nitrogen gas pressure, the chemical potential for nitrogen can be written as27, 74
RL RL,9:[\ AU](SL 25
Where k is Boltzmann’s constant (8.62x10⁻⁵ eV/K), T is temperature in Kelvin. PN2 is the
partial pressure of the nitrogen. Combining equation 5 and 6 gives a means to calculate
-1
-0.5
0
0.5
1
-35 -30 -25 -20 -15 -10
Surf
ace
Ene
rgy
(eV
/Ang
^3)
Tantalum Chemcial Potential (eV/at)
(0001) Surface
(0002) Surface

66
the stability of the surfaces with increasing partial pressure of nitrogen and with
increasing temperature. The equation is only valid if, Ta in TaN is thermodynamically
favored (µTa < µOTa, Bulk) and Nitrogen is more stable in the TaN (µN < µO
N2, gas). The
final relation can be found by placing equation 24 and 25 into a single equation
O V 12P N3:B QK:RK:L QK: QL" RL,9:[\ AU](SL"" 26
A range of validity can be established for the calculation and by combining equations 23
and 25; the range can be shown to be
∆K:L\
AU ^ ](SL ^ 0 27
The calculation will not be valid up to the triple point of the phase diagram depending on
the partial pressure of nitrogen, but provides insight as to the stability region.
The surface energy of the (0001) and (0002) systems is shown in Table 15. The
(0002) surface has a positive energy and therefore is unstable. The (0001) is lower in
surface energy than the (0002) and therefore more stable. It should be noted that this
technique is a relative technique and not intended to be used as an absolute measure of
surface stability. Table 16 shows the Slab dimensional information. The (0001) surface
shows an increase in the overall volume of the supercell after relaxation compared to the
starting cell volume by 3.8% of the volume. The slab expands in the direction normal to
the surface very little (-0.1% of the initial z), but the surface area for the slab increases by
4% compared to the starting surface. Looking at the atomic movements as shown in
figure 6.4, the atoms move mostly normal to the surface, but do have a slight movement
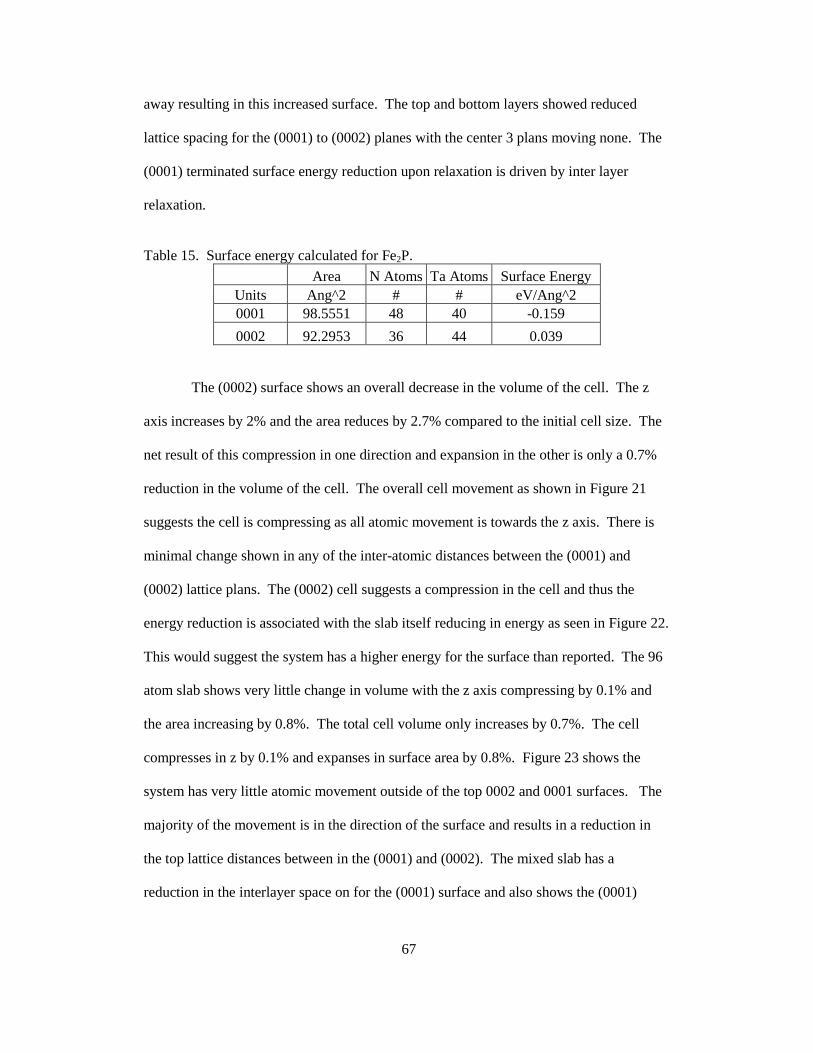
67
away resulting in this increased surface. The top and bottom layers showed reduced
lattice spacing for the (0001) to (0002) planes with the center 3 plans moving none. The
(0001) terminated surface energy reduction upon relaxation is driven by inter layer
relaxation.
Table 15. Surface energy calculated for Fe2P.
Area N Atoms Ta Atoms Surface Energy Units Ang^2 # # eV/Ang^2 0001 98.5551 48 40 -0.159
0002 92.2953 36 44 0.039
The (0002) surface shows an overall decrease in the volume of the cell. The z
axis increases by 2% and the area reduces by 2.7% compared to the initial cell size. The
net result of this compression in one direction and expansion in the other is only a 0.7%
reduction in the volume of the cell. The overall cell movement as shown in Figure 21
suggests the cell is compressing as all atomic movement is towards the z axis. There is
minimal change shown in any of the inter-atomic distances between the (0001) and
(0002) lattice plans. The (0002) cell suggests a compression in the cell and thus the
energy reduction is associated with the slab itself reducing in energy as seen in Figure 22.
This would suggest the system has a higher energy for the surface than reported. The 96
atom slab shows very little change in volume with the z axis compressing by 0.1% and
the area increasing by 0.8%. The total cell volume only increases by 0.7%. The cell
compresses in z by 0.1% and expanses in surface area by 0.8%. Figure 23 shows the
system has very little atomic movement outside of the top 0002 and 0001 surfaces. The
majority of the movement is in the direction of the surface and results in a reduction in
the top lattice distances between in the (0001) and (0002). The mixed slab has a
reduction in the interlayer space on for the (0001) surface and also shows the (0001)

68
surface re-arranged. This could support the fact that the (0001) is much more dynamic
and capable of reducing its energy compared to the (0002).
Table 16. Slab information for the Fe2P surface calculations.
Slab
Starting Cell Vectors Ending Cell Vectors Cell Vol (Ang^3)
X Y Z X Y Z Starting Ending
Mixed 10.47 10.47 11.70 10.51 10.51 11.69 1118.00 1110.51
(0001) 10.47 10.47 10.24 10.67 10.67 10.23 1008.48 971.70
(0002) 10.47 10.47 10.24 10.32 10.32 10.45 964.60 971.70
Using the above derived equation for surface energies, further analysis was done
to understand if there could be an inversion of the lowest energy surface upon changes in
the temperature or upon introduction of a nitrogen atmosphere. The results of the
analysis are shown in figure 24 and 25. As can be seen, there is no change in the fact that
the (0001) is more stable than the (0002) surface. In addition, the (0002) surface only has
a negative value at very high Temperature (1000K). Based on these results, the (0001)
surface is used for all further Adatom calculations for both the Fe2P phase and the CoSn
phase.
Methods of Ag Adatoms on TaN
The absorption Enthalpy for silver on the surfaces of (0001) TaN-Fe2P and TaN-
CoSn is calculated with a GGA-PBE exchange correlation functional and a projector
augmented wave (PAW) Pseudopotentials as previously described in Chapter 3. The
planewave cutoff was 520 eV and the K space was 5x5x1 using a gamma centered K-
space. The system relaxation was done by VASP’s quasi-Newton algorithm for at least 4
ionic steps and convergence to 20 meV/at for ionic steps and electronic convergence to <
1 meV/at.

69
Figure 21. Atomic Movement of the (0001) terminated Fe2P slab. Tantalum ( ) and
Nitrogen ( )are shown.
Figure 22. Atomic Movement of the (0002) terminated Fe2P slab. Tantalum ( ) and
Nitrogen ( ) are shown.
Figure 23. Atomic Movement of the mixed surface Fe2P slab. Tantalum ( ) and
Nitrogen ( )are shown.
(0001) Terminated Slab (0001) Plane (0001) Terminated Slab (0010) Plane
(0002) Terminated Slab (0001) Plane (0002) Terminated Slab (0010) Plane
96 atom (0001) atom movements 96 atom (0010) atom movements

70
Figure 24. Surface energy calculation for the Fe2P-TaN at 300K
Figure 25. Surface energy calculation for the Fe2P-TaN at 1000K
Slabs of CoSn and Fe2P phases were analyzed to determine Adatom Absorption
energies of silver on the lowest surface energy surface. The Ag Adatom energy was
determined by the following equation.
IB[76`578 N3:BJI9 N3:B (I9 28
Where the ESlab+Ag, ESlab, n and EAg are the energies for the slab with Ag Adatom(s), the
slab without the Ag Adatom, the number of Ag Adatom and the energy of a single Ag
atom in the gas phase, respectively. The starting location of the Silver Adatom was set
-0.20
-0.15
-0.10
-0.05
0.00
0.05
1.E-09 1.E-08 1.E-07 1.E-06 1.E-05 1.E-04 1.E-03 1.E-02 1.E-01
Surf
ace
Ene
rgy
(eV
)
Partial Pressure N2(0001) @ 300 K (0002) @ 300 K
-0.17
-0.14
-0.11
-0.08
-0.05
-0.02
0.01
0.04
1.E-07 1.E-06 1.E-05 1.E-04 1.E-03 1.E-02 1.E-01
Surf
ace
Ene
rgy
(eV
)
Partial Pressure N2(0001) @ 1000 K (0002) @ 1000 K

71
away from the near surface atom(s) as determined by the radius calculated from the Ag
bulk calculations.
The silver atom in the gas and solid phase was calculated with a GGA-PBE PAW
and a planewave cutoff of 450 eV. For the solid, K space was 17x17x17 and Monkhourst
Pack centered. Solid phase was assumed to be FCC and the final lattice constant was
4.17 Ang. Heat of formation was -2.824 eV/at and -0.27157 eV/at for the solid and gas
phases, respectively.
The 4 locations investigated for the CoSn phase are shown in Figure 6.9 and
include the Hollow location above the (0002) Tantalum (Hollow A), the Hollow formed
by the (0001) Nitrogens and Tantalum (Hollow B), Atop the Nitrogen and Atop the
(0001) Tantalum. The CoSn phase system was a 216 base cell with the Silver Adatom
added to the above listed locations.
For the Fe2P system, only the Hollow A and Hollow B sites were investigated,
since the structure is similar to CoSn, and the Atop Nitrogen and Atop Tantalum sites
were very unfavorable for CoSn.
For investigations of two silver adatoms on Fe2P, two geometries were considered, one
with the Ag adatoms close together on Hollow-A sites, and one with them far apart on
Hollow-A sites – see figure 27.
The sub-monolayer study had a 66 % ML of Ag on the Fe2P-TaN (0001) surface with the
entire Hollow A locations filled on the slab. Work of adhesion was calculated from this
by the following equation75, 76
Wadh = EAB – EB, Strained - EA 28
Where Wadh is the work of adhesion, EAB is the Enthalpy of the Slab of A and B,
EB, Strained is the strained slab of B (in this case Silver) and EA is the slab of A (in this case
Fe2P-TaN).
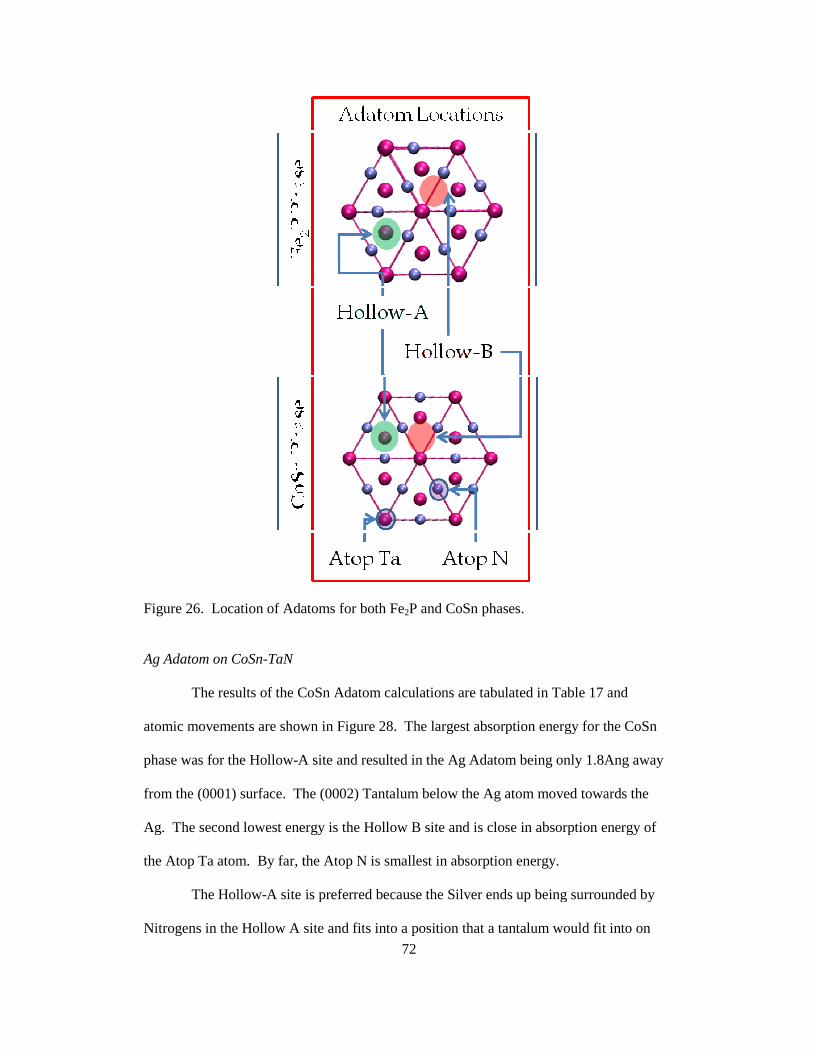
Figure 26. Location of Adatoms for both Fe
Ag Adatom on CoSn-TaN
The results of the CoSn Adatom calculations are tabulated in Table
atomic movements are shown in Figure
phase was for the Hollow-A site and resulted in the Ag Adatom being only 1.8Ang away
from the (0001) surface. The (0002) Tantalum below the Ag atom moved towards the
Ag. The second lowest energy is the Hollow B site and is close in absorption energy of
the Atop Ta atom. By far, the Atop N is smallest in absorption energy.
The Hollow-A site is pre
Nitrogens in the Hollow A site and fits into a position that a tantalum would fit into on
72
Location of Adatoms for both Fe2P and CoSn phases.
The results of the CoSn Adatom calculations are tabulated in Table 17 and
atomic movements are shown in Figure 28. The largest absorption energy for the CoSn
A site and resulted in the Ag Adatom being only 1.8Ang away
01) surface. The (0002) Tantalum below the Ag atom moved towards the
Ag. The second lowest energy is the Hollow B site and is close in absorption energy of
the Atop Ta atom. By far, the Atop N is smallest in absorption energy.
A site is preferred because the Silver ends up being surrounded by
Nitrogens in the Hollow A site and fits into a position that a tantalum would fit into on
and
The largest absorption energy for the CoSn
A site and resulted in the Ag Adatom being only 1.8Ang away
01) surface. The (0002) Tantalum below the Ag atom moved towards the
Ag. The second lowest energy is the Hollow B site and is close in absorption energy of
the Silver ends up being surrounded by
Nitrogens in the Hollow A site and fits into a position that a tantalum would fit into on
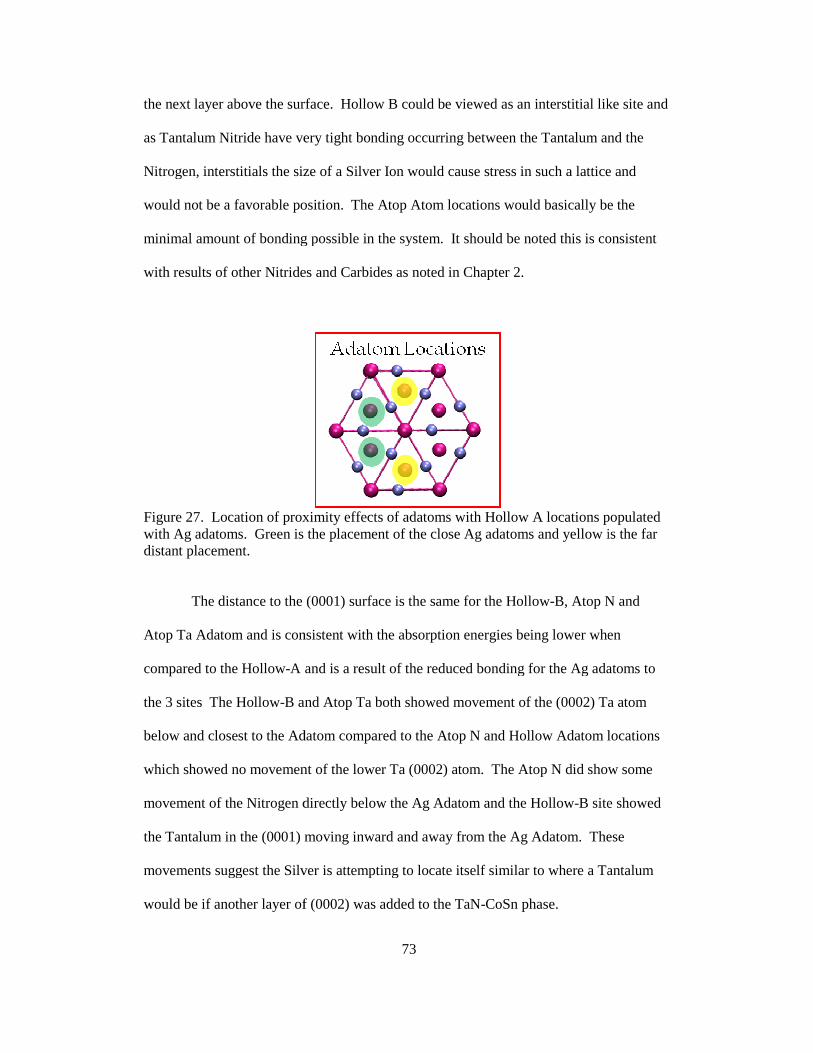
the next layer above the surface. Hollow B could be viewed as an interstitial like site and
as Tantalum Nitride have very tight bonding occurring between the Tantalum and the
Nitrogen, interstitials the size of a Silver Ion would cause stress in such a lattice and
would not be a favorable position. The Atop Atom locations would basically be the
minimal amount of bonding possible in the system. It should be noted this is consistent
with results of other Nitrides and Carbides as noted in Chapter 2.
Figure 27. Location of proximity effects of adatoms with Hollow A locations populated with Ag adatoms. Green is the placement of the close Ag adatoms and yellow is the far distant placement.
The distance to the (0001) surface is the same for the Hollow
Atop Ta Adatom and is consistent with the absorption energies being lower when
compared to the Hollow-A and is a result of the reduced
the 3 sites The Hollow-B and Atop Ta both showed movement of the (0002) Ta atom
below and closest to the Adatom compared to the Atop N and Hollow Adatom locations
which showed no movement of the lower Ta (0002) atom. The Atop N did show some
movement of the Nitrogen directly below the Ag Adatom and the Hollow
the Tantalum in the (0001) moving inward and away from the Ag Adatom. These
movements suggest the Silver is attempting to locate itself similar to
would be if another layer of (0002) was added to the TaN
73
the next layer above the surface. Hollow B could be viewed as an interstitial like site and
have very tight bonding occurring between the Tantalum and the
Nitrogen, interstitials the size of a Silver Ion would cause stress in such a lattice and
would not be a favorable position. The Atop Atom locations would basically be the
onding possible in the system. It should be noted this is consistent
of other Nitrides and Carbides as noted in Chapter 2.
Location of proximity effects of adatoms with Hollow A locations populated
with Ag adatoms. Green is the placement of the close Ag adatoms and yellow is the far
The distance to the (0001) surface is the same for the Hollow-B, Atop N
and is consistent with the absorption energies being lower when
A and is a result of the reduced bonding for the Ag adatoms to
and Atop Ta both showed movement of the (0002) Ta atom
and closest to the Adatom compared to the Atop N and Hollow Adatom locations
which showed no movement of the lower Ta (0002) atom. The Atop N did show some
movement of the Nitrogen directly below the Ag Adatom and the Hollow-B site showed
the Tantalum in the (0001) moving inward and away from the Ag Adatom. These
movements suggest the Silver is attempting to locate itself similar to where a Tantalum
if another layer of (0002) was added to the TaN-CoSn phase.
the next layer above the surface. Hollow B could be viewed as an interstitial like site and
have very tight bonding occurring between the Tantalum and the
Nitrogen, interstitials the size of a Silver Ion would cause stress in such a lattice and
would not be a favorable position. The Atop Atom locations would basically be the
onding possible in the system. It should be noted this is consistent
Location of proximity effects of adatoms with Hollow A locations populated with Ag adatoms. Green is the placement of the close Ag adatoms and yellow is the far
, Atop N and
and is consistent with the absorption energies being lower when
bonding for the Ag adatoms to
and Atop Ta both showed movement of the (0002) Ta atom
and closest to the Adatom compared to the Atop N and Hollow Adatom locations
which showed no movement of the lower Ta (0002) atom. The Atop N did show some
site showed
the Tantalum in the (0001) moving inward and away from the Ag Adatom. These
a Tantalum

74
Table 17. Adatom surface energies and atomic movements calculated for the (0001) CoSn-TaN surface.
Adatom Location
Ag Absorption Energy (eV/at)
Ag Distance to 0001 (Ang)
NN Movement
NN Movement distance (Ang)
Direction moved
Atop N -0.98 2.7 N 0.1 Towards Ag Atop Ta -1.15 2.7 Ta (0001) 0.1 Away from Ag
Hollow B -1.16 2.7 Ta (0001) 0.1 Away from Ag Hollow-A -1.72 1.8 Ta (0002) 0.14 Towards Ag
Ag Adatom on Fe2P-TaN
The 2 hollows of the Fe2P-TaN (0001) surface were analyzed and it was found
the Hollow-A location showed greater absorption energy when compared to the Hollow-
B site with the Absorption Energies in Table 18. The Hollow A location has a larger
number of Nitrogens for the Silver to bond to and is in the same location that another
(0002) Tantalum would occur, thus allowing the Nitrogens to reduce the amount of
broken bonds they have in the structure and approach the 5 fold coordination of the
nitrogens in the bulk. The hollow B location is actually not a repeat site from the (0002)
layer in addition to placing the Tantalum and Silvers in close proximity and resulting in
them sharing the same Nitrogen’s. The single Adatom study shows that the Hollow A
location appears to be the lowest of two studied. There are other places such as bridge
sites and Atop sites that the Adatom could be placed. The Hollow A site should be more
stable when compared to these other sites. The reason is the other sites result in the
surface atoms deviating further from the bulk state and due to the fact that the Adatom
has less to interact with for bonding. The Hollow-A site is considered to be the most
stable absorption site on the (0001) TaN-Fe2P surface.
Next, 2 two-Adatom studies were done with one having adjacent Hollow A
location (distance Ag to Ag is 3.01 Ang) and the other one having the Hollow A sites
separated as far as possible in the supercell (distance is 6.02 Ang) as shown in Figure 27.
This resulted in the Absorption energy being 1.160 and 1.159 eV/at for the close and far

75
Adatom results, respectively. The distances are provided in Table 18. The stability of
the far and close absorption values suggest that additional Ag adatoms would fill all
available Hollow A sites on the surface, forming a sub-monolayer of a FCC (111) plane
with a small lattice mismatch of about 2%.
Figure 28. Adatom movements for the CoSn-TaN (0001) surface. Tantalum ( ), Silver
( ) and Nitrogen ( )are shown. Vector magnitudes are varied with legend provided.
Table 18. Enthalpies of Hollow Adatoms on Fe2P-TaNstudies.
Hollow Location Enthalpy of absorption
(eV/at) dAg-N (Ang)
dAg-Ta (Ang)
A -1.335 2.22 2.77
Hollow B -0.833 2.15; 2.26; 2.70
2.56
A, 2 Adatoms - close -1.160 2.18 2.71 A, 2 Adatoms far -1.159 2.18 2.70
Ato
p T
a
Plane view Side View Vector
Hol
low
BA
top
NH
ollo
w A

76
Several studies were done on smaller cells to investigate the adhesion of Ag
submonolayers (0.33 ML and 0.66 ML) and a 5 layer Ag slab to Fe2P-TaN. The smaller
cell was a 24 atom TaN cell with same dimensions as the 216 cell used in the Adatom
studies. All other parameters were the same between the 216 cell and the small 24 atom
cell. The k points for the 24 atom cell showed convergence to< 1 meV/at for 5x5x1 k
points. The smaller cell had 2 Hollow-A locations. The initial starting point for how far
the silvers were placed was based on the adatom distances. For all calculations involving
the TaN slab, only the ionic positions were allowed to relax with the cell shape and
volume held constant. At least 8 ionic convergence steps were used for each of the
studies and it was found that ionic convergence was < 1 meV/at for all calculations. For
the work of adhesion calculation with the silver slab, the slab enthalpy was determined 2
different ways. First for the unrelaxed silver slab, it was electronically converged only
with all ion positions held constant based off the full slab of TaN-Ag. For the relaxed
silver slab, the ionic positions, cell shape and cell volume was allowed to relax
completely. Results of the calculations are shown in table 19.
The Work of Adhesion is negative for all results and actually has the highest
value for the unrelaxed 4-layer slab. This suggests that an interface between Silver and
(0001) Fe2P-TaN should be stable. In addition, the monolayer energies are slightly lower
when compared to the slab values. This would cause an issue during creation of the
interface as the bonding is not strong between the Silver and Tantalum Interface initially.
This drop in energy for the monolayer work of adhesion to when a thin slab of Tantalum
nitride is formed can be explained by the fact that the bonding is changing between the
Silver slab versus the ML structure vs the 4 Layer structure. This is supported by the

77
fact that the distances between the silver and the nitrogen are increasing with the
following order noted 1 Adatom<0.33 ML<0.66 ML< 4 layer slab.
Table 19: Work of Adhesion calculations for Silver on Tantalum Nitride
Silver Slab Structure
Work of Adhesion (J/m2)
dAg-N (Ang)
dAg-Ta (Ang)
0.33 ML -0.65 2.37 3.08
0.66 ML -0.61 2.51 3.18 4 Layer - strained -1.03 2.59 3.3 4 Layer - unstrained -0.77 NA NA
Summary
Calculation of the bond strength of a single Ag atom with a single Ta or N atom
found that the Nitrogen-Silver bond energy was higher. This suggests that a Ag film
would adhere more strongly to a Nitrogen rich surface than to a Tantalum rich surface.
The lowest energy surface was shown to be the (0001) for the Fe2P-TaN surface
as compared to the (0002) surface. The major difference between the two surfaces is the
(0002) is Tantalum rich and has no Nitrogen terminations. The (0001) surface has a 3:1
ratio of Nitrogen to Tantalum. The (0001) was chosen as it would be enthalpically more
stable. The (0001) surface was used for Adatom studies with Fe2P-TaN and CoSn-TaN
studies. For the CoSn-TaN (0001) surface, Silver adatoms were placed at 4 locations. It
was found that the site of absorption would be a hollow site (Hollow A) which would
result in the continuation of the crystal from the (0002) layer. The other sites were found
to be less energcially stable. For the Fe2P-TaN (0001) surface, Silver adatoms were
placed on 2 hollow locations. The hollow site which continued the crystal structure
(hollow A) was shown to be significantly lower in energy. Investigations of 2 Ag
Adatom studies showed that the distance between the Ag adatoms did not significantly
78
affect their adsorption energy, which was slightly less than that of the single adatom.
This suggests that silver deposited on a (0001) Fe2P-TaN surface should form initially by
adatoms adhering to the Hollow A locations and continuing the crystal structure of the
Fe2P-TaN. This results in the formation of a (111) FCC surface, slightly strained, with
1/3 of the first monolayer missing due to the presence of Ta adatoms in the (0001) plane.
The work of adhesion was calculated from a 0.66 ML of Silver and resulted in a 0.61J/m2
surface energy, which is modest.
The 2 atom and Adatom studies suggest that silver and TaN should form a stable
interface. Upon calculation of the monolayers and slab, it is found that the silver has a
modest work of adhesion on the Tantalum Nitride surface. This suggests that Fe2P-
TaN/Ag maybe a viable candidate for interconnects. Further increase in the Ag slab
thickness may not be stable. The slab will be epitaxial or result in Silver islands forming
on the surface due to the lattice mismatch. An adhesion layer maybe still necessary for
the Silver-TaN interconnect system.

79
Chapter 7
SUMMARY
Bulk Tantalum Nitride
The stability of three 1:1 stoichiometric compounds of Tantalum Nitride was
investigated with three separate exchange correlation functionals (LDA, GGA-PBE, and
GGA-PW91). For all exchange-correlation functionals, the order of stability of the
crystal structures are Fe2P > NaCl > CoSn at zero Kelvin. This demonstrates that the
TaN-Fe2P crystal structure is the ambient phase and should be used as such in future
studies.
The bonding of the 3 systems was studied. It is shown that all three are metallic
in nature, this is consistent with other ab initio studies. The NaCl bonding has the
simplest structure where as the Fe2P and CoSn phases are a little more complex. The
Fe2P system appears to have a small difference in how the two types of Tantalums bond
to the Nitrogen with a slightly greater bonding associated with the Tantalum residing in
the (0002) layer. The CoSn seems to have the Tantalum in the (0001) plane not
significantly bonding with the (0002) Tantalum nor with the Nitrogen’s in the system.
In addition, it was shown that the Fe2P and also the CoSn phase showed fairly
high vacancy formation energy. This would support a line compound as shown in the
phase diagram. In contrast, the NaCl phase has a negative formation energy associated
with Tantalum vacancy, suggesting it prefers a composition somewhat to the Ta rich side
of the 1:1 stoichiometry, consistent with the phase diagram. Additional vacancies are also
easily formed from 43at% to 50at% Ta suggesting that the NaCl phase will exist at a
broad range of compositions, consistent with the phase diagram.

80
Surface Studies
The (0001) and (0002) surfaces were analyzed for their relative surface energies
in the Fe2P phase. It has been shown that the (0001) surface should be the lower surface
energy system and that it could be easily maintained in a Nitrogen rich atmosphere. The
(0001) surface was used for subsequent Adatom studies for both the CoSn and the Fe2P
systems.
The surface studies showed that the Hollow A location, which is where the
(0002) surface continues for both the Fe2P and CoSn, was the most enthalpically
favorable location for the Silver Adatom. In addition for the Fe2P phase, it was shown
that 2 adatoms in either adjacent or farther way locations would have equivalent
adsorption energies, slightly less per atom than for the single adatom. Finally, the work
of adhesion for silver monolayer and four layer slabs appears to have modest to low
adhesion to the TaN surface studied. The bonding appears to be ionic in nature based on
the charge density plots. The monolayer has lower adhesion than when compared to the
slab and maybe due to the second Ag layer interacting with the Tantalums on the (0001)
at the interface.
Concluding remarks on Interconnect Directions
This study focused on the thermodynamics and adhesion of the TaN/Ag
interconnect system. It suggests that Ag Adatoms binds strongly to TaN, but an adhesion
layer such as Ta may still be needed as the Silver Monolayer binds weakly to the
Tantalum Nitride. If one could eliminates the Tantalum adhesion layer, it would reduce
the interconnect cross section, and greatly simplifies the interconnect processing. Further
study is needed to understand subtleties of the integration to determine if the switch to
TaN/Ag interconnects system would be worthwhile.

81
Potential Future Research
For the Tantalum Nitride system, the stability of the various Polymorphs of TaN
should be studied further and in more depth. Experimentally, an assessment of the crystal
structures should be done with Neutron scattering to validate the hypothesized results.
For the TaN-Ag system, additional studies on the electrical properties and adhesion
characteristics of low resistive metals such as silver, gold or copper should be done to
understand if there are alternate barrier layers which may eliminate the need for adhesion
layers or to propose alternate interconnect systems. In addition, the electrical properties
of the interconnect should be studied to understand in an ideal case if the Tantalum
Nitride-Silver interconnect has better conduction than currently shown by experiments.
Further studies could help understand how to increase the work of adhesion
between Silver and Fe2P-TaN by alloying the metal, inducing surface defects in the TaN
surface or both and adhesion layers for improving the binding of silver to Tantalum
Nitride should be explored. In addition, studies should be run as to how various Adatom
elements, such as Ruthenium, may interact with the interface to allow direct
electroplating of Silver to the Interconnect. Larger slabs of TaN-Silver should be run to
understand how this system behaves with additional layers.

82
REFERENCES
1. Okamoto H. N-Ta (nitrogen-tantalum). Journal of Phase Equilibria and Diffusion 2008; 29(3):291
2. Interconnect. In: International technology roadmap for semiconductors. ; 2009. 3. Bohr MT. Interconnect scaling - the real limiter to high performance ULSI. Solid State
Technol 1996 SEP; 39(9):105 4. Badenes G, Deferm L. Integration challenges in sub-0.25 mu m CMOS-based
technologies. Microelectron J 2000; 31(11-12):861-71. 5. Travaly Y, Bamal M, Carbonell L, Iacopi F, Stucchi M, Van Hove M, Beyer GP. A
novel approach to resistivity and interconnect modeling. Microelectronic Engineering 2006;83(11-12):2417-21.
6. Li W, Tan CM, Hou Y. Dynamic simulation of electromigration in polycrystalline
interconnect thin film using combined monte carlo algorithm and finite element modeling. J Appl Phys 2007;101(10).
7. Li BZ, Sullivan TD, Lee TC, Badami D. Reliability challenges for copper
interconnects. Microelectronics Reliability 2004;44(3):365-80. 8. Lane MW, Liniger EG, Lloyd JR. Relationship between interfacial adhesion and
electromigration in cu metallization. J Appl Phys 2003;93(3):1417-21. 9. Interconnect. In: International technology roadmap for semiconductors. ; 2007. 10. Wang SQ, Ye HQ. Theoretical studies of solid-solid interfaces. Current Opinion in
Solid State & Materials Science 2006;10:26-32. 11. Siegel DJ, Hector LG, Adams JB. Ab initio study of al-ceramic interfacial adhesion.
Physical Review B 2003;67(9). 12. Kim H. Atomic layer deposition of metal and nitride thin films: Current research
efforts and applications for semiconductor device processing. Journal of Vacuum Science & Technology B 2003 NOV-DEC;21(6):2231-61.
13. Lundqvist BI, Bogicevic A, Carling K, Dudiy SV, Gao S, Hartford J, Hyldgaard P,
Jacobson N, Langreth DC, Lorente N, et al. Density-functional bridge between surfaces and interfaces. Surf Sci 2001;493(1-3):253-70.
14. Ooi N, Hector LG, Jr., Adams JB, Stanzione D, Jr. First principles study of the
aluminum-cubic boron nitride interface. J Adhesion 2006 Aug;82(8):779-803. 15. Siegel D, Hector L, Adams J. First-principles study of metal-carbide/nitride adhesion:
Al/VC vs. Al/VN. Acta Materialia 2002 FEB 8;50(3):619-31.

83
16. Siegel D, Hector L, Adams J. Ab initio study of al-ceramic interfacial adhesion. Physical Review B 2003 MAR 1;67(9):092105.
17. Pletea M, Wendrock H, Kaltofen R, Schmidt OG, Koch R. Stress evolution during
and after sputter deposition of thin cu-al alloy films. Journal of Physics-Condensed Matter 2008;20(25).
18. Ding PJ, Lanford WA, Hymes S, Murarka SP. Effects of the addition of small
amounts of al to copper - corrosion, resistivity, adhesion, morphology, and diffusion. J Appl Phys 1994;75(7):3627-31.
19. Strehle S, Menzel S, Bartha JW, Wetzig K. Electroplating of cu(ag) thin films for
interconnect applications. Microelectronic Engineering 2010 2;87(2):180-6. 20. CRC handbook of chemistry and physics. 1978. 21. Alford TL, Misra E, Bhagat SK, Mayer JW. Influence of joule heating during
electromigration evaluation of silver lines. Thin Solid Films 2009 JAN 1;517(5):1833-6.
22. Alford TL, Misra E, Bhagat SK, Mayer JW. Influence of joule heating during
electromigration evaluation of silver lines. Thin Solid Films 2009 JAN 1;517(5):1833-6.
23. Bhagat SK, Theodore ND, Alford TL. Thermal stability of tungsten-titanium
diffusion barriers for silver metallization. Thin Solid Films 2008 SEP 1;516(21):7451-7.
24. Baunemann A. Precursor chemistry of tantalum and niobium nitride for MOCVD and
ALD applications. zur Erlangung der Doktorwürde der Fakultät für Chemie der Ruhr-Universität Bochum; 2006.
25. Cao CL, Hou ZF, Yuan G. First-principles study of the structural stability and
electronic structures of TaN. Physica Status Solidi B-Basic Solid State Physics 2008;245(8):1580-5.
26. Kim TE, Han S, Son WJ, Cho E, Ahn HS, Shin S. Phase stability and electronic
structures of stoichiometric tantalum mononitrides. Computational Materials Science 2008;44(2):577-80.
27. Stampfl C, Freeman AJ. Stable and metastable structures of the multiphase tantalum
nitride system. Physical Review B 2005 JAN;71(2):024111. 28. Zhao EJ, Wu ZJ. Electronic and mechanical properties of 5d transition metal
mononitrides via first principles. Journal of Solid State Chemistry 2008;181(10):2814-27.
29. Violet P, Blanquet E, Le Bacq O. Density functional study of the stability and
electronic properties of TaxNy compounds used as copper diffusion barriers. Microelectronic Engineering 2006;83:2077-81.
84
30. Stampfl C, Freeman AJ. Metallic to insulating nature of TaNx: Role of ta and N vacancies. Physical Review B 2003 FEB 1;67(6):064108.
31. Zhou J, Chen H, Li Y. Diffusion barrier performance of nanoscale TaNx thin-film.
Transactions of Nonferrous Metals Society of China 2007 8;17(4):733-8. 32. Zhao Y, Lu G. First-principles simulations of copper diffusion in tantalum and
tantalum nitride. Physical Review B 2009;79(21). 33. Zhao EJ, Hong B, Meng J, Wu ZJ. First principles investigation on the ultra-
incompressible and hard TaN. Journal of Computational Chemistry 2009;30(14):2358-63.
34. Iwamoto N, Truong N, Lee E. New metal layers for integrated circuit manufacture:
Experimental and modeling studies. Thin Solid Films 2004;469:431-7. 35. CHRISTENSEN A, LEBECH B. Reinvestigation of structure of epsilon-tantalum
nitride. Acta Crystallographica Section B-Structural Science 1978;34(JAN):261-3. 36. Ren F, Wang Y. Pressure-induced phase transition of tantalum mononitride. Thin
Solid Films 2011 MAR 31;519(11):3954-8. 37. Capelle K. A bird's-eye view of density-functional theory. Brazilian Journal of
Physics 2006;36(4A):1318-43. 38. Spencer ND, Moore JH. Encyclopedia of chemical physics and physical chemistry.
Bristol ; Philadelphia: Institute of Physics Pub; 2001. 3 v. 39. Mattsson AE, Schultz PA, Desjarlais MP, Mattsson TR, Leung K. Designing
meaningful density functional theory calculations in materials science - a primer. Model Simul Mater Sci Eng 2005;13(1):R1-R31.
40. Hummel RE. Electronic properties of materials. 2nd ed. Berlin ; New York: Springer-
Verlag; 1992. xv; ill. ; 24 cm. 41. Reuter K, Stampfl C, Scheffler M. Ab initio atomistic thermodynamics and statistical
mechanics of surface properties and functions. Handbook of materials modeling. 2005.
42. Ellis DE, Warschkow O. Evolution of classical/quantum methodologies: Applications
to oxide surfaces and interfaces. Coord Chem Rev 2003;238:31-53. 43. Hafner J. Ab-initio simulations of materials using VASP: Density-functional theory
and beyond. Journal of Computational Chemistry 2008;29(13):2044-78. 44. Pacchioni G. Ab initio theory of point defects in oxide materials: Structure,
properties, chemical reactivity. Solid State Sciences 2000;2(2):161-79. 45. Fiolhais C, Nogueira F, Marques M. A primer in density functional theory. Berlin ;
New York: Springer; 2003. xii; ill. ; 24 cm.

85
46. Mishin Y, Asta M, Li J. Atomistic modeling of interfaces and their impact on microstructure and properties. Acta Materialia 2010 2;58(4):1117-51.
47. Kresse G, Marsman M, Furthmuller J. VASP the guide. ; 2009. 48. Jahnatek M, Krajci M, Hafner J. Interatomic bonding, elastic properties, and ideal
strength of transition metal aluminides: A case study for al-3(V,ti). Physical Review B 2005;71(2).
49. Siegel DJ. First-principles study of metal-ceramic interfaces. University of Illinois at
Urbana-Champaign; 2001. 50. Ooi N. Theoretical study of aluminum ceramic interfaces. Arizona State University;
2005. 51. Hafner J. Materials simulations using VASP - a quantum perspective to materials
science. Comput Phys Commun 2007;177(1-2):6-13 . 52. Blochl PE. Phys Rev B 1994(50):17953. 53. Kresse G, Joubert J. From ultrasoft pseudopotentials to the projector augmented wave
method. Phys Rev B 1999;59:1758. 54. Perdew JP, Burke K, Wang Y. Generalized gradient approximation for the exchange-
correlation hole of a many-electron system. Physical Review B 1996 DEC 15;54(23):16533-9.
55. Perdew J, Chevary J, Vosko S, Jackson K, Pederson M, Singh D, Fiolhais C. Atoms,
molecules, solids, and surfaces - applications of the generalized gradient approximation for exchange and correlation (vol 46, pg 6671, 1992). Physical Review B 1993 AUG 15;48(7):4978.
56. Perdew J, Burke K, Ernzerhof M. Generalized gradient approximation made simple
(vol 77, pg 3865, 1996). Phys Rev Lett 1997 FEB 17;78(7):1396. 57. Perdew J, Burke K, Ernzerhof M. Generalized gradient approximation made simple.
Phys Rev Lett 1996 OCT 28;77(18):3865-8. 58. Perdew J, Chevary J, Vosko S, Jackson K, Pederson M, Singh D, Fiolhais C. Atoms,
molecules, solids, and surfaces - applications of the generalized gradient approximation for exchange and correlation. Physical Review B 1992 SEP 15;46(11):6671-87.
59. Perdew J, Zungar A. Self-interaction correction to density-functional approximations
for many-electron systems. Physical Review B 1981;23(10):5048-79. 60. Mavromaras A, Rigby D, Wolf W, Christensen M, Halls M, Freeman C, Saxe P,
Wimmer E. Computational materials engineering: Capabilities of atomic-scale prediction of mechanical, thermal, and electrical properties of microelectronic

86
materials. 11th. Int. Conf. on Thermal, Mechanical and Multiphysics Simulation and Experiments in Micro-Electronics and Micro-Systems, EuroSimE 2010 2010.
61. Humphrey W, Dalke A, Schulten K,. VMD - visual molecular dynamics. Journal of
Molecular Graphics 1996;14:33. 62. VisIT Visualization Tool [Internet]; c2012 [cited 2012 3/18]. Available from:
https://wci.llnl.gov/codes/visit/home.html. 63. Siegel D, Hector L, Adams J. Ab initio study of al-ceramic interfacial adhesion.
Physical Review B 2003 MAR 1;67(9):092105. 64. Henkelman G, Arnaldsson A, Jonsson H. A fast and robust algorithm for bader
decomposition of charge density. Computational Materials Science 2006 JUN;36(3):354-60.
65. Tang W, Sanville E, Henkelman G. A grid-based bader analysis algorithm without
lattice bias. Journal of Physics-Condensed Matter 2009 FEB 25;21(8):084204. 66. Murnaghan FD. The compressibility of media under extreme pressures. Proc Natl
Acad Sci U S A 1944;30:244-7. 67. Wang H, Hon H. Temperature dependence of ceramic hardness. Ceramics
International 1999;25:267. 68. Chuang W, Luger T, Fettig R, Ghodssi R. Mechanical property characterization of
LPCVD silicon nitride thin films at cryogenic temperatures. J Microelectromech Syst 2004 OCT;13(5):870-9.
69. Patil SKR, Mangale NS, Khare SV, Marsillac S. Super hard cubic phases of period VI
transition metal nitrides: First principles investigation. Thin Solid Films 2008 11/28;517(2):824-7.
70. Sahnoun M, Daul C, Driz M, Parlebas JC, Demangeat C. FP-LAPW investigation of
electronic structure of TaN and TaC compounds. Computational Materials Science 2005;33(1-3):175-83.
71. Portnoi, Mukaseev, Gribkov, Levinskii, Prokof'ev. Modulus of elasticity of some
refractory compounds. 1967:185. 72. Mah G. Heats of formation of niobium nitride, tantalum nitride and zirconium nitride
from combustion calorimetry. 1956;78:3261. 73. DeHoff RT. Thermodynamics in materials science. McGraw-Hill; 1993. 74. Jiang Y. Gas-solid interface reactons of metals and metal oxides. Arizona State
University; 2005. 75. Hashibon A, Elsasser C, Ruhle M. Structure at abrupt copper-alumina interfaces: An
ab initio study. Acta Materialia 2005;53(20):5323-32.

87
76. Finnis MW. The theory of metal–ceramic interfaces. Journal of Physics-Condensed Matter 1996;8:5811.

88
APPENDIX A
POSCAR FOR HEXAGONAL STRUCTURES

89
Fe2P-TaN Base cell
5.49031026300000
0.7900851066372291 -0.4783611630944735 0.2270683073954599
0.0000000000000000 0.9567223261889469 0.0000000000000000
-0.1411284651367380 0.0000000000000000 0.5123937291282264
3 3
Direct
0.0000000000000000 0.0018710991651716 0.0000000000000000
0.3340839407777310 0.6665966571857496 0.4984335890447085
0.6659160592222690 0.3325127164080257 0.5015664109552915
0.3916426385735434 0.9984020752827405 0.0005600333088580
0.0000000000000000 0.3938580152491156 0.0000000000000000
0.6083573614264566 0.6067594367091971 0.9994399666911420

90
CoSn-TaN Base Cell
5.27 ! Run 3
0.500000 -0.866025 0.000000
0.500000 0.866025 0.000000
0.000000 0.000000 0.555977
3 3
Direct
0.00000000 0.00000000 0.00000000
0.33333333 0.66666667 0.50000000
0.66666667 0.33333333 0.50000000
0.50000000 0.00000000 0.00000000
0.00000000 0.50000000 0.00000000
0.50000000 0.50000000 0.00000000

91
APPENDIX B
COPYWRITE PERMISSION

92

93

94

95

96
BIOGRAPHICAL SKETCH
Michael G. Grumski graduated from University of Florida for his Masters and Bachelors of Science in Material Science and Engineering in 2000. In 2000, he married Bonnie Allyson Davis and moved to Arizona to work at Intel. As of 2012, he is a Staff Engineering at Intel focused on advanced process and technology development for products projected for production in 10 to 15 years.


