AAPA Shifting Trade Patterns - Results...
17
AAPA Shifting Trade Patterns The Changing Asia Market
Transcript of AAPA Shifting Trade Patterns - Results...

AAPA Shifting Trade Patterns The Changing Asia Market

Today’s objective
• Provide a 30,000’ perspective on the Asian economy and its short-term outlook
• Focus on three topics 1. Economic growth 2. Trade growth 3. Short-term
• Hopefully provide a useful context for Greg’s remarks

Short-term outlook: it changes by the minute!
“Debt Haunts Emerging Markets”, WSJ 1/20/16 • Mounting debt burdens, particularly in Asia and Latin America
threaten to become a drag on global growth • Emerging markets are caught between fading growth and tighter
lending conditions • China……is the epicenter of fear jolting emerging markets • Beijing’s ability to manage its economy is the single biggest
unknown • Indonesia’s PT Trikomsel Oke Tbk (telecom) has defaulted on
$460M in debt

North America & China account for 53% of global GDP
Page 4
Asia EU Russia North America All Other
27%
26%
24%
21%

All other countries and China accounted for 83% of the 2014 global population
Asia EU Russia North America All Other
Source: IMF Page 5
31%
52%
7%
8%

The Chinese economy dominated Asian economic growth between 2009 and 2014
Source: IMF Page 6
0.0%1.0%2.0%3.0%4.0%5.0%6.0%7.0%8.0%9.0%
0 500 1,000 1,500 2,000 2,500 3,000 3,500 4,000 4,500
Com
poun
d An
nual
Gro
wth
Rat
e
2009-2014 GDP Growth (Billions 2014 $U.S.)
ChinaNFESEA
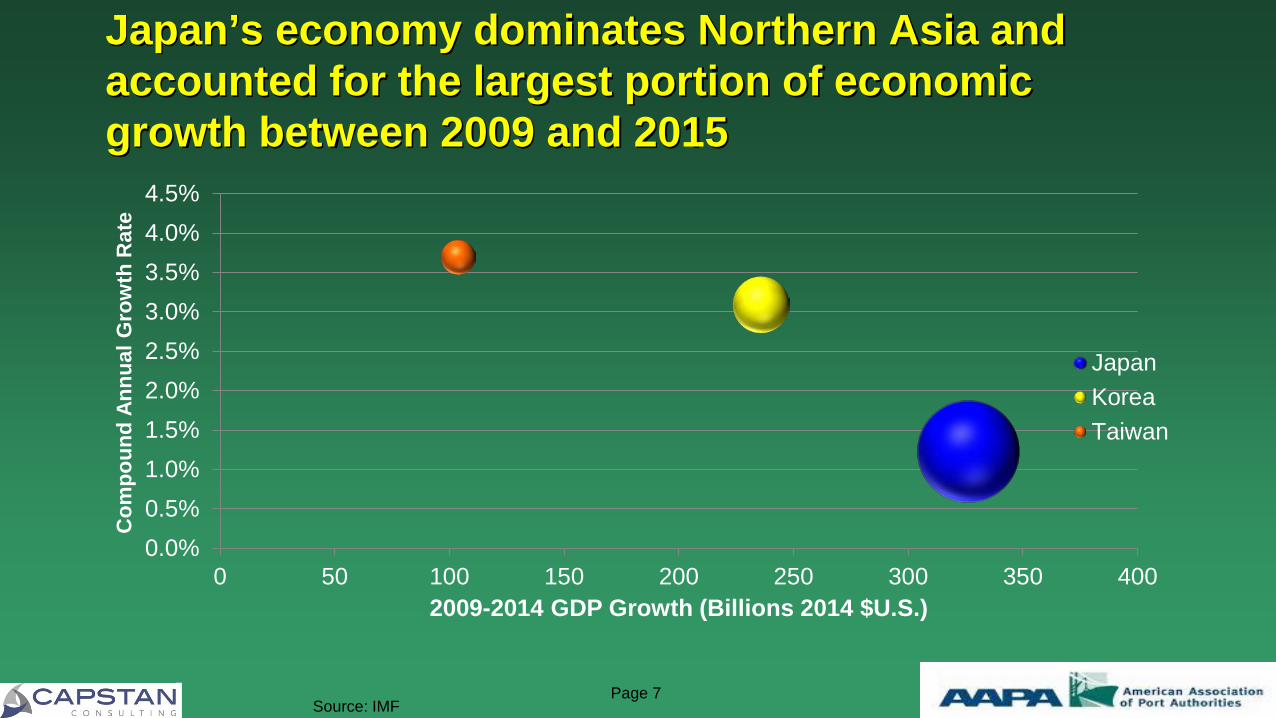
Japan’s economy dominates Northern Asia and accounted for the largest portion of economic growth between 2009 and 2015
Source: IMF Page 7
0.0%0.5%1.0%1.5%2.0%2.5%3.0%3.5%4.0%4.5%
0 50 100 150 200 250 300 350 400
Com
poun
d An
nual
Gro
wth
Rat
e
2009-2014 GDP Growth (Billions 2014 $U.S.)
JapanKoreaTaiwan

Indonesia is Southeast Asia’s largest economy and drove regional economic growth between 2009 and 2014
Source: IMF Page 8
0.0%
1.0%
2.0%
3.0%
4.0%
5.0%
6.0%
7.0%
8.0%
0 50 100 150 200 250 300
Com
poun
d An
nual
Gro
wth
Rat
e
2009-2014 GDP Growth (Billions 2014 $U.S.)
IndonesiaMalaysiaPhilippinesSingaporeThailandVietnamCambodiaLao P.D.R.

China accounted for an estimated 64% percent of total Asia-US loaded container trade in 2014 & two thirds of 2009-2014 growth
Source: PIERS Page 9
0%1%1%2%2%3%3%4%4%5%
0 500,000 1,000,000 1,500,000 2,000,000 2,500,000 3,000,000 3,500,000
Com
poun
d An
nual
Gro
wth
Rat
e
2009-2014 Trade Growth (TEUs)
ChinaNFESEA
2.9M 13.2M
4.0M

Northern Asia-US loaded container trade is roughly divided among Japan, Korea and Taiwan
Source: PIERS Page 10
0%1%1%2%2%3%3%4%4%5%
190,000 195,000 200,000 205,000 210,000 215,000 220,000 225,000 230,000 235,000
Com
poun
d An
nual
Gro
wth
Rat
e
2009-2014 Trade Growth (TEUs)
JapanKoreaTaiwan
1.4M
1.2M 1.4M
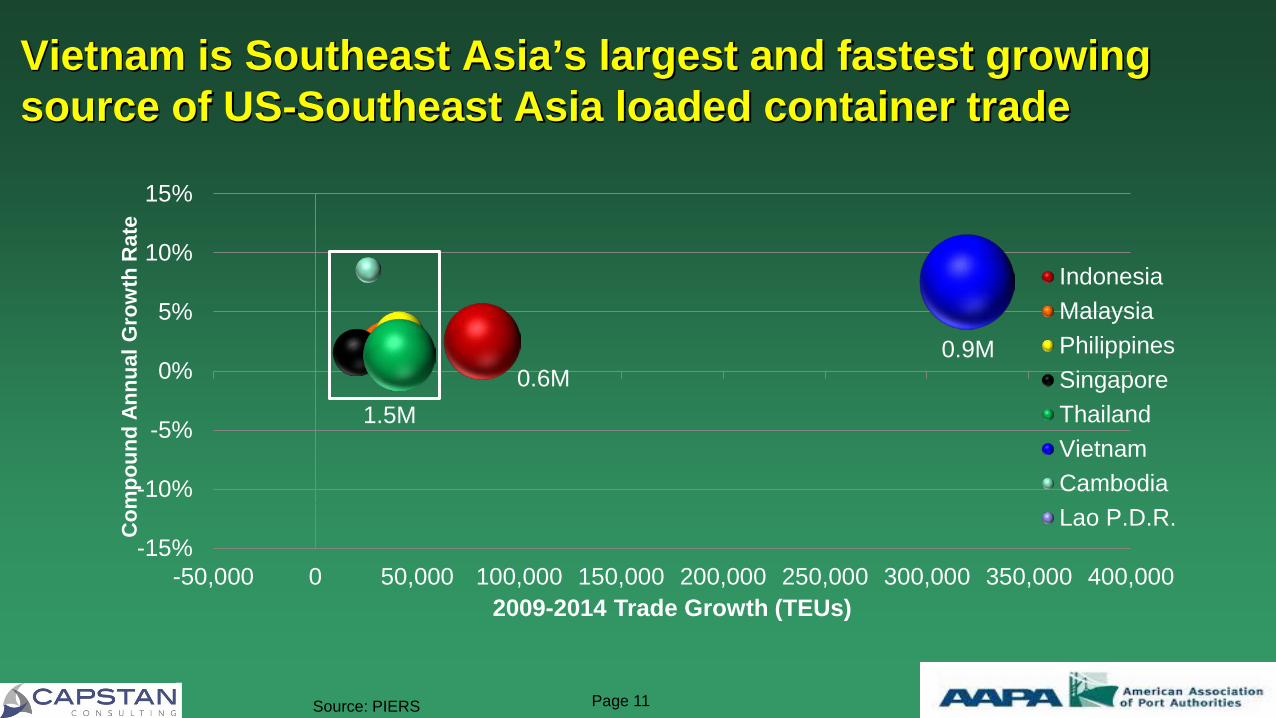
Vietnam is Southeast Asia’s largest and fastest growing source of US-Southeast Asia loaded container trade
Source: PIERS Page 11
-15%
-10%
-5%
0%
5%
10%
15%
-50,000 0 50,000 100,000 150,000 200,000 250,000 300,000 350,000 400,000
Com
poun
d An
nual
Gro
wth
Rat
e
2009-2014 Trade Growth (TEUs)
IndonesiaMalaysiaPhilippinesSingaporeThailandVietnamCambodiaLao P.D.R.
0.9M 0.6M
1.5M

China Outlook
Economic • GDP Outlook:
–2014: 7.3%, 2015: 6.8%, 2016: 6.3% • Inflation Outlook (AVG consumer prices):
–2014: 2%, 2015: 1.5%, 2016: 1.8% • Trade Outlook (Volume of Goods):
–Imports-2014: 4.6%, 2015: 2.5%, 2016: 3.5% –Exports-2014: 5.1%, 2015: 3%, 2016: 3.5%
• Helped By: –Low oil and commodity prices –Increased consumer spending –Structural reform
• Hurt By: –Correcting real estate market –High household and corporate debt –Slowing investment –Less foreign demand
Government Policy • Five Year Plan (2016-2020):
–Target GDP growth expected at 6.5% vs. the current plan’s 7%
• With high debt, the government would struggle to stimulate the economy if it is below target.
–Likely will include • Expansion of welfare • Further relaxation or abolishment of one-child policy • Environmental protection and pollution controls • Investment in high-tech industries
• One Belt, One Road Policy: –The “Belt”: new overland link to Europe
• Could reach Moscow, Rotterdam, and Venice • Set up in corridors: China-Mongolia-Russia, China-Central and West Asia, China-Indochina Peninsula,
China-Pakistan, Bangladesh-China-India-Myanmar
–The “Road” represents the maritime component • Link from South and Southeast Asia to East Africa and The Mediterranean • Series of ports and infrastructure
–Could include up to 65 countries representing 40% of world GDP and significant funding
• $40 billion in New Silk Road Fund, expected significant lending from the Asia Infrastructure Investment Bank’s $100 billion, and China Development Bank is reported to plan to invest $900 billion in 900 projects including 60 countries.
Source: IMF WEO Database Oct 2015; IMF “WEO Report Apr 2015”; IMF “WEO Report October 2015”; UN ESCAP “Economic and Social Survey of Asia and the Pacific 2015: Year End Update”; “Command Performance”. The Economist, OCT 24, 2015; Hoffman, Bert. “China’s One Belt One Road Initiative: What we know thus far”. JOC, Dec 04, 2015; Capstan Analysis
Page 12

Northern Asia Economic Outlook Japan
• GDP Outlook (IMF): – 2014: -0.1%, 2015: 0.6%, 2016: 1%
• Inflation Outlook (AVG consumer prices):
– 2014: 2.7%, 2015: 0.7%, 2016: 0.4% • Trade Outlook (Volume of Goods):
– Imports-2014: 5%, 2015: 0.5%, 2016: 2.5%
– Exports-2014: 5%, 2015: 1.3%, 2016: 2.5%
• Helped By: – Higher real compensation – Higher equity prices – Low oil and commodity prices
• Hurt By: – Slowing exports due to China slowdown
(China is second largest export market)
Korea • GDP Outlook (IMF):
– 2014: 3.3%, 2015: 2.7%, 2016: 3.2% • Inflation Outlook (AVG consumer
prices): – 2014: 1.3%, 2015: 0.7%, 2016: 1.8%
• Trade Outlook (Volume of Goods): – Imports-2014: 4.7%, 2015: 2.5%, 2016:
4.2% – Exports-2014: 4.4%, 2015: 1.5%, 2016:
3.6% • Helped By:
– Low prices for commodity imports • Hurt By:
– Contracting consumption and investment – Slowing exports due to China slowdown
(China is largest export market) – Export losses outweigh benefits of low
prices for commodity imports
Taiwan • GDP Outlook (IMF):
– 2014: 3.8%, 2015: 2.2%, 2016: 2.6% • Inflation Outlook (AVG consumer
prices): – 2014: 1.2%, 2015: -0.1%, 2016: 1%
• Trade Outlook (Volume of Goods): – Imports-2014: 4.7%, 2015: 2.5%, 2016:
3.7% – Exports-2014: 4.6%, 2015: 3.9%, 2016:
4.5% • Hurt By:
– Slowing exports due to China slowdown (China is largest export market)
Source: IMF WEO Database October 2015; IMF “WEO Report April 2015”; IMF “WEO Report October 2015”; UN ESCAP “Economic and Social Survey of Asia and the Pacific 2015: Year End Update”; Capstan Analysis Page 13

South East Asia Economic Outlook
Indonesia • GDP Outlook (IMF):
– 2014: 5%, 2015: 4.7%, 2016: 5.1% • Inflation Outlook (AVG consumer
prices): – 2014: 6.4%, 2015: 6.8%, 2016: 5.4%
• Trade Outlook (Volume of Goods): – Imports-2014: -1%, 2015: -5.1%, 2016:
7.9% – Exports-2014: 2%, 2015: -1.3%, 2016: 5.3%
• 2015 Hurt By: – Weaker terms of trade (Import prices rising faster than export
prices) – Delays in significant government investment due to
bureaucratic barriers – Export losses outweigh benefits of low prices for commodity
imports – Hurt as exporter by low commodity prices – Domestic consumption hurt by high inflation and weak
currency
• 2016 Helped By: – Lower inflation – More public infrastructure outlays – Higher private investment
Malaysia • GDP Outlook (IMF):
– 2014: 6%, 2015: 4.7%, 2016: 4.5% • Inflation Outlook (AVG consumer
prices): – 2014: 3.1%, 2015: 2.4%, 2016: 3.8%
• Trade Outlook (Volume of Goods): – Imports-2014: 4.3%, 2015: -0.4%, 2016:
5.2% – Exports-2014: 5.8%, 2015: -2.2%, 2016:
7.5% • Hurt By:
– Weaker terms of trade (Import prices rising faster than export prices)
– Slowing exports due to China slowing (China is largest export market)
– Export losses outweigh benefits of low prices for commodity imports
– Weak export prospects hurt investment – Fixed investment contributions to growth trending downward
(fixed investments need significant updates) – Hurt as exporter by low commodity prices – Downward trend in domestic consumption partially due to
high household debt
Philippines • GDP Outlook (IMF):
– 2014: 6.1%, 2015: 6%, 2016: 6.3% • Inflation Outlook (AVG consumer
prices): – 2014: 4.2%, 2015: 1.9%, 2016: 3.4%
• Trade Outlook (Volume of Goods): – Imports-2014: 5.3%, 2015: 18.7%, 2016:
7.8% – Exports-2014: 8.9%, 2015: 9%, 2016: 5.6%
• Helped by: – Low prices for commodity imports
• Hurt by: – Slowing exports due to China slowing
(China is largest export market) – Export losses outweigh benefits of low
prices for commodity imports
Source: IMF WEO Database October 2015; IMF “WEO Report April 2015”; IMF “WEO Report October 2015”; UN ESCAP “Economic and Social Survey of Asia and the Pacific 2015: Year End Update”; Capstan Analysis Page 14

South East Asia Economic Outlook (cont.)
Singapore • GDP Outlook (IMF):
– 2014: 2.9%, 2015: 2.2%, 2016: 2.9% • Inflation Outlook (AVG consumer
prices): – 2014: 1%, 2015: 0%, 2016: 1.8%
• Trade Outlook (Volume of Goods): – Imports-2014: 2.4%, 2015: 3%, 2016:
5.5% – Exports-2014: 2.5%, 2015: 2.1%, 2016:
3.3% • Hurt By:
– Slowing exports due to China slowing (China is largest export market)
– Export losses outweigh benefits of low prices for commodity imports
Thailand • GDP Outlook (IMF):
– 2014: 0.9%, 2015: 2.5%, 2016: 3.2% • Inflation Outlook (AVG consumer
prices): – 2014: 1.9%, 2015: -0.9%, 2016: 1.5%
• Trade Outlook (Volume of Goods): – Imports-2014: -6.8%, 2015: 4.8%,
2016: 4.2% – Exports-2014: 0.7%, 2015: 2.2%, 2016:
3.8% • Helped By:
– More certainty in near-term governmental policies
• Hurt By: – Slowing exports due to China slowing
(China is largest export market) – Weak export prospects hurt investment – Downward trend in domestic
consumption partially due to high household debt
Vietnam • GDP Outlook (IMF):
– 2014: 6%, 2015: 6.5%, 2016: 6.4% • Inflation Outlook (AVG consumer
prices): – 2014: 4%, 2015: 2.2%, 2016: 3.1%
• Trade Outlook (Volume of Goods): – Imports-2014: 14.8%, 2015: 22.2%,
2016: 11.6% – Exports-2014: 16.2%, 2015: 16.2%,
2016: 10.6% • Helped By:
– Low food and oil prices lead to low inflation and therefore more enticing monetary policy and increased investment and consumption
– Low cost labor intensive manufacturing relocating from China
• Hurt By: – Potentially hurt due to China slowing
(China is second largest export market)
Source: IMF WEO Database October 2015; IMF “WEO Report April 2015”; IMF “WEO Report October 2015”; UN ESCAP “Economic and Social Survey of Asia and the Pacific 2015: Year End Update”; Capstan Analysis Page 15

Panama vs Suez Routing for Asia-US & Gulf Coasts 2009
• Panama Route – 16 Services – 4,000-5,000 TEU Vessels
• Suez Route – 3 Services – 4,648-5,900 TEU Vessels
2015 • Panama Route
– 12 Services – 4,552 Average Vessel Size
• Suez Route – 7 Services – 7,593 Average Vessel Size
What will 2017-2018 look like?