
Aalto- DD effects in ytterbium-doped laser...
101
Departme nt of Micro- a nd Na noscie nces Anal ysis o f photo darke ning e ffect s in ytte rbium- do pe d l ase r fibe rs Joa n J. Mo ntiel i Po nsoda DOCTORAL DISSERTATIONS
Transcript of Aalto- DD effects in ytterbium-doped laser...

9HSTFMG*afcbgi+
ISBN 978-952-60-5216-8 ISBN 978-952-60-5217-5 (pdf) ISSN-L 1799-4934 ISSN 1799-4934 ISSN 1799-4942 (pdf) Aalto University School of Electrical Engineering Department of Micro- and Nanosciences www.aalto.fi
BUSINESS + ECONOMY ART + DESIGN + ARCHITECTURE SCIENCE + TECHNOLOGY CROSSOVER DOCTORAL DISSERTATIONS
Aalto-D
D 101
/2013
Fiber lasers and amplifiers have become very important for many applications, such as telecommunications, materials processing, and medicine. Ytterbium (Yb) doped fibers are the preferred gain media in high peak and average power laser sources. However, the photodarkening effect, which manifests as a time dependent increase of loss in the doped core, is one of the main threats to the efficiency of the Yb-doped gain media leading to degradation of the laser performance. This thesis focused on developing accurate methods to characterize photodarkening and the associated thermal effects in Yb-doped silica fibers. Parallel to the experimental work on photodarkening, a new all vapor phase fabrication method was implemented to produce Yb-doped fibers by atomic layer deposition (ALD) in combination with the conventional modified chemical vapor deposition (MCVD) technique.
Joan J. Montiel i P
onsoda A
nalysis of photodarkening effects in ytterbium-doped laser fibers
Aalto
Unive
rsity
Department of Micro- and Nanosciences
Analysis of photodarkening effects in ytterbium-doped laser fibers
Joan J. Montiel i Ponsoda
DOCTORAL DISSERTATIONS

Aalto University publication series DOCTORAL DISSERTATIONS 101/2013
Analysis of photodarkening effects in ytterbium-doped laser fibers
Joan J. Montiel i Ponsoda
A doctoral dissertation completed for the degree of Doctor of Science (Technology) (Doctor of Philosophy) to be defended, with the permission of the Aalto University School of Electrical Engineering, at a public examination held at the large seminar room of the Micronova building (Tietotie 3, Espoo, Finland) on the 7th of June 2013 at 12 noon.
Aalto University School of Electrical Engineering Department of Micro- and Nanosciences Photonics Group

Supervising professors Prof. Seppo Honkanen Prof. Harri Lipsanen Thesis advisor Dr. Mikko Söderlund Preliminary examiners Prof. Risto Myllylä, University of Oulu, Finland Prof. Shibin Jiang, University of Arizona, USA Opponent Prof. Daniel Milanese, Politecnico di Torino, Italy
Aalto University publication series DOCTORAL DISSERTATIONS 101/2013 © Joan J. Montiel i Ponsoda ISBN 978-952-60-5216-8 (printed) ISBN 978-952-60-5217-5 (pdf) ISSN-L 1799-4934 ISSN 1799-4934 (printed) ISSN 1799-4942 (pdf) http://urn.fi/URN:ISBN:978-952-60-5217-5 Unigrafia Oy Helsinki 2013 Finland
Abstract Aalto University, P.O. Box 11000, FI-00076 Aalto www.aalto.fi
Author Joan J. Montiel i Ponsoda Name of the doctoral dissertation Analysis of photodarkening effects in ytterbium-doped laser fibers Publisher School of Electrical Engineering Unit Department of Micro- and Nanosciences
Series Aalto University publication series DOCTORAL DISSERTATIONS 101/2013
Field of research Photonics
Manuscript submitted 4 February 2013 Date of the defence 7 June 2013
Permission to publish granted (date) 14 May 2013 Language English
Monograph Article dissertation (summary + original articles)
Abstract Fiber lasers and amplifiers have become very important for many applications, such as
telecommunications, materials processing, and medicine. Ytterbium (Yb) doped fibers are the preferred gain media in high peak and average power laser sources. However, the photodarkening effect, which manifests as a time dependent increase of loss in the doped core, is one of the main threats to the efficiency of the Yb-doped gain media leading to degradation of the laser performance.
This thesis focused on developing accurate methods to characterize photodarkening and the associated thermal effects in Yb-doped silica fibers. In a first stage, a method for conducting repeatable photodarkening and thermal bleaching measurements over the same sample was developed. The activation energy associated with the thermal recovery of photodarkening-induced losses was determined. Moreover, thermal cycling studies revealed that a photodarkened sample exhibits a net increase of loss with increasing temperature prior to the initiation of thermal recovery. In addition, the photodarkening-induced absorption spectrum was found to broaden with increasing temperature, resulting in a non-permanent increase of loss in the near-infrared. At the same time, a method to quantify the fiber temperature during the course of photodarkening measurements was established. The fiber temperature was found to correlate with the pump power absorbed by the photodarkening-induced defects. Then, a thermal model was implemented to accurately parameterize the temperature increase of a photodarkened fiber as a function of the pump power. Furthermore, the photodarkening rate was found to follow a power law dependency of 4.5 on the inversion, in case the fiber temperature is properly controlled. Finally, the photodarkening-induced refractive index change, measured by a modal interference method, was found to be positive and in the order of 10^(-5) at around 1080 nm.
Parallel to the experimental work on photodarkening, a new all vapor phase fabrication method was implemented to produce Yb-doped fibers by atomic layer deposition (ALD) in combination with the conventional modified chemical vapor deposition (MCVD) technique. A large mode area Yb-doped aluminosilicate fiber fabricated by this method showed uniform Yb-doping, high lasing efficiency (slope efficiency of 80%) and low background losses. This fabrication method can potentially result in an integrated ALD-MCVD system.
Keywords fiber lasers, rare-earth doped materials, ytterbium, photodarkening, thermal effects
ISBN (printed) 978-952-60-5216-8 ISBN (pdf) 978-952-60-5217-5
ISSN-L 1799-4934 ISSN (printed) 1799-4934 ISSN (pdf) 1799-4942
Location of publisher Espoo Location of printing Helsinki Year 2013
Pages 157 urn http://urn.fi/URN:ISBN:978-952-60-5217-5


Preface
The journey that culminates with this thesis started a few years back, in
2006, at the School of Telecommunications Engineering of Valencia when
I was given the opportunity to come to Finland as an exchange student
under the Erasmus Programme. The initial plan of returning to Valencia
after completing my M.Sc. degree changed when, after being captivated
by the Finnish culture and the Nordic summer, I was offered the opportu-
nity to work with the excellent people of the Photonics group.
The work described in this thesis was carried out at the Department of
Micro- and Nanosciences in Aalto University (formerly Helsinki Univer-
sity of Technology), during the years 2008-2012. I would like to express
my deepest gratitude to Professor Seppo Honkanen, for his supervision,
support and encouragement throughout the course of this work. I also
want to thank Seppo for his friendship, and for countless hours of talk
about football (or soccer as he usually says). I am also grateful to my
supervisor Professor Harri Lipsanen, for taking care of me when I first
arrived to Micronova in 2007 and for offering me his help in the last stage
of my study.
I am specially grateful to Dr. Mikko Söderlund, with whom I have had
the privilege to share and enjoy the most interesting findings of this study.
I want to thank Mikko for introducing me to the topic of this thesis and
for providing me guidance on the research. I am also very thankful to
the co-authors of this work, Dr. Changgeng Ye and Dr. Joona Koponen,
for their important contribution to this work and helpful discussions, Dr.
Ari Tervonen for his valuable advice, comments on the articles and this
dissertation, and for providing a good atmosphere of work, and to Dr. Jeff
Koplow for his experimental ideas, helpful guidance, and for his help on
improving the articles. I am also indebted to Dr. Lars Norin, who has had
an important contribution to my last publication, and to Markus Bosund
i

Preface
for carrying out the doping of the soot by ALD.
In addition, I would like to express my gratitude to all my colleagues at
the Dep. of Micro- and Nanosciences, especially to Dr. Ya Chen, Lasse
Karvonen, Dr. Antti Säynätjoki, Dr. Tapani Alasaarela, Amit Khanna,
Aarni Iho, Janne Jaakola, Dr. Steffen Novotny, Henri Jussila, Dr. Sami
Kujala, Dr. Marko Mattila, and Pasi Kostamo, for their assistance in ex-
periments, for sharing their knowledge with me, and for providing a great
work environment. I acknowledge also Paula Heikkilä for her technical
advise.
During these years, I have also had the opportunity to collaborate with
the Valencia Nanophotonics Technology Center (NTC) and the Universitat
de València. Special thanks goes to Dr. Pere Pérez, for enthusiastic dis-
cussions in the lab and valuable suggestions, and to Prof. Javier Martí,
Prof. Miguel Andrés and Prof. José Luis Cruz for welcoming me in their
labs.
Furthermore, I am thankful to José Luis Peralta for his friendship, help,
and for tutoring me with LATEX. Without naming everyone, I would like to
thank all my friends for providing me wonderful and relaxing moments
during the years.
Finally, the warmest of my gratitude goes to my parents, for their unwa-
vering and unconditional support throughout my studies and in my life
that gave me the courage to embark on this journey, to my sister for car-
ing so much about me, and also for trying to improve my English, to my
grandparents for their love, to my precious niece Marina, who cheered me
up when I needed, and to my dear Rosa for her love, patience and help to
this work - You are the best thing that ever happened to me, I love you.
Espoo, May 15, 2013,
Joan J. Montiel i Ponsoda
ii

Contents
Preface i
Contents iii
List of Publications v
Author’s Contribution vii
List of Abbreviations ix
List of Symbols xi
1. Introduction 1
2. Rare-earth doped optical fibers 5
2.1 Basics of optical fibers . . . . . . . . . . . . . . . . . . . . . . 5
2.2 Rare-earth dopants . . . . . . . . . . . . . . . . . . . . . . . . 7
2.3 Spectral properties of Yb3+ . . . . . . . . . . . . . . . . . . . . 10
2.4 Inversion in Yb-doped fibers . . . . . . . . . . . . . . . . . . . 12
2.5 Power scaling . . . . . . . . . . . . . . . . . . . . . . . . . . . 14
2.5.1 Fundamental limitations . . . . . . . . . . . . . . . . . 15
2.5.2 Large mode area fibers . . . . . . . . . . . . . . . . . . 18
2.5.3 Optimization of the core material . . . . . . . . . . . . 19
3. Fabrication of rare-earth doped fibers 21
3.1 MCVD with solution doping method . . . . . . . . . . . . . . 23
3.2 Direct nanoparticle deposition (DND) . . . . . . . . . . . . . 24
3.3 Current limitations . . . . . . . . . . . . . . . . . . . . . . . . 25
4. Photodarkening in Yb-doped fibers 27
4.1 Inversion dependence . . . . . . . . . . . . . . . . . . . . . . . 28
4.2 Bleaching . . . . . . . . . . . . . . . . . . . . . . . . . . . . . . 29
iii

Contents
4.3 Combined photodarkening and thermal bleaching measure-
ment . . . . . . . . . . . . . . . . . . . . . . . . . . . . . . . . . 30
4.4 Thermal activation energy . . . . . . . . . . . . . . . . . . . . 33
4.5 Color center formation . . . . . . . . . . . . . . . . . . . . . . 35
4.6 Mitigation . . . . . . . . . . . . . . . . . . . . . . . . . . . . . 37
5. The role of temperature in the photodarkening-induced loss 39
5.1 Post-irradiation heat-induced darkening . . . . . . . . . . . . 40
5.2 Spectral broadening . . . . . . . . . . . . . . . . . . . . . . . . 41
5.3 Photodarkening-induced increase of fiber temperature . . . 44
5.4 Thermal model . . . . . . . . . . . . . . . . . . . . . . . . . . . 45
5.5 Temperature dependence of inversion . . . . . . . . . . . . . 47
5.6 Ion dependency discrepancy . . . . . . . . . . . . . . . . . . . 49
5.7 Isothermal measurements . . . . . . . . . . . . . . . . . . . . 51
6. Photodarkening- and thermal bleaching-induced refractive
index change 55
6.1 Measurement method . . . . . . . . . . . . . . . . . . . . . . . 56
6.2 Results . . . . . . . . . . . . . . . . . . . . . . . . . . . . . . . 57
7. Fabrication of Yb-doped fibers with atomic layer deposition
method 61
7.1 Fabrication process . . . . . . . . . . . . . . . . . . . . . . . . 61
7.2 Doping by atomic layer deposition . . . . . . . . . . . . . . . 62
7.3 Fiber results . . . . . . . . . . . . . . . . . . . . . . . . . . . . 64
7.4 Future work . . . . . . . . . . . . . . . . . . . . . . . . . . . . 66
8. Summary and outlook 67
Bibliography 71
Publications 83
iv

List of Publications
This thesis consists of an overview and of the following publications which
are referred to in the text by their Roman numerals.
I M. J. Söderlund, J. J. Montiel i Ponsoda, J. P. Koplow, and S. Honka-
nen. Heat-induced darkening and spectral broadening in photodark-
ened ytterbium-doped fiber under thermal cycling. Opt. Express, 17, 12,
9940-9946, June 2009.
II M. J. Söderlund, J. J. Montiel i Ponsoda, J. P. Koplow, and S. Honkanen.
Thermal bleaching of photodarkening-induced loss in ytterbium-doped
fibers. Opt. Letters, 34, 17, 2637-2639, September 2009.
III J. J. Montiel i Ponsoda, M. J. Söderlund, J. P. Koplow, J. J. Koponen,
and S. Honkanen. Photodarkening-induced increase of fiber tempera-
ture. Appl. Optics, 49, 22, 4139-4143, August 2010.
IV J. J. Montiel i Ponsoda, J. P. Koplow, M. J. Söderlund, J. J. Koponen,
and S. Honkanen. Analysis of temperature dependence of photodarken-
ing in ytterbium doped fibers. Opt. Eng., 50, 11, 111610-1–111610-9,
November 2011.
V C. Ye, J. J. Montiel i Ponsoda, A. Tervonen, and S. Honkanen. Refractive
index change in ytterbium-doped fibers induced by photodarkening and
thermal bleaching. Appl. Optics, 49, 30, 5799-5805, October 2010.
v

List of Publications
VI J. J. Montiel i Ponsoda, L. Norin, C. Ye, M. Bosund, M. J. Söderlund,
A. Tervonen, and S. Honkanen. Ytterbium-doped fibers fabricated with
atomic layer deposition method. Opt. Express, 20, 22, 25085-25095,
October 2012.
vi

Author’s Contribution
Publication I: “Heat-induced darkening and spectral broadening inphotodarkened ytterbium-doped fiber under thermal cycling”
The author participated in the design of the experiment and in conducting
the experiments. The author also participated in the data analysis, and
contributed to the preparation of the manuscript.
Publication II: “Thermal bleaching of photodarkening-induced lossin ytterbium-doped fibers”
The author participated in the design of the experiment, participated in
conducting the experiments, and contributed to the preparation of the
manuscript.
Publication III: “Photodarkening-induced increase of fibertemperature”
The author had a major role in designing the experiment, did the experi-
ments, analyzed the data, and prepared the manuscript.
Publication IV: “Analysis of temperature dependence ofphotodarkening in ytterbium doped fibers”
The author led the design of the experiment, did the experiments and
simulations, and prepared the manuscript.
vii

Author’s Contribution
Publication V: “Refractive index change in ytterbium-doped fibersinduced by photodarkening and thermal bleaching”
The author designed part of the experiment, contributed to the experi-
mental work, and participated in the preparation of the manuscript.
Publication VI: “Ytterbium-doped fibers fabricated with atomic layerdeposition method”
The author participated in the design of the experiment, did all the ex-
periments apart from the soot-preform doping and material analysis, did
most of the data analysis, and prepared the manuscript. The MCVD soot-
preforms were prepared in Acreo AB (Sweden).
viii

List of Abbreviations
ALD atomic layer deposition
ASE amplified spontaneous emission
CCC chirally coupled core
CT charge transfer
CW continuous wave
DCF double cladding fiber
DND direct nanoparticle deposition
EDFA erbium doped fiber amplifier
EDS energy dispersive spectrometer
ESR electron spin resonance
FBG fiber Bragg grating
FWHM full width at half maximum
KKR Kramers-Krönig relations
LCF leakage channel fiber
LMA large mode area
MCVD modified chemical vapor deposition
MMF multi-mode fiber
NA numerical aperture
NIR near infrared
ODC oxygen deficiency center
ix

List of Abbreviations
OVD outside vapor deposition
PCF photonic crystal fiber
RE rare-earth
SBS stimulated Brillouin scattering
SMF single-mode fiber
SPM self-phase modulation
SRS stimulated Raman scattering
RIC refractive index change
RT room temperature
SEM scanning electron microscope
SMF single-mode fiber
UV ultra violet
VAD vapor axial deposition
x
List of Symbols
αmax maximum absorption coefficient change [dB/m]
Γ overlap factor
Δα photodarkening-induced absorption coefficient change [dB/m]
ΔnPD photodarkening induced refractive index change
ΔTPD temperature increase associated with photodarkening [◦C]
ΔTQD temperature increase associated with quantum defect [◦C]
λ0 cross-over wavelength [nm]
σa absorption cross section [m2]
σe emission cross section [m2]
τ21 radiative lifetime [s]
1/τ photodarkening rate parameter [s−1]
Abs920nm ytterbium absorption at 920 nm wavelength [dB/m]
Aeff effective mode area [m2]
Ed demarcation energy [eV]
gB Brillouin peak gain coefficient [m/W]
gR Raman peak gain coefficient [m/W]
h convective coefficient [W/m2·K]
hp Planck constant [J·s]
I incident light intensity [W/m2]
k thermal conductivity [W/m·K]
xi

List of Symbols
kB Boltzmann constant [eV/K]
Leff effective nonlinear length [m]
N1 normalized lower state population
N2 normalized upper state population
Q0 heat density [W/m3]
R pump transition rate
Tc coolant temperature [K]
v0 vibrational frequency [s−1]
vs signal frequency [s−1]
vp pump frequency [s−1]
W signal transition rate
xii
1. Introduction
Fiber lasers and amplifiers have recently emerged as key devices in many
applications, including telecommunications, materials processing and me-
dicine. Fiber amplifiers are used, for example, in long distance optical
fiber communications to amplify the signals without the need for expen-
sive optoelectronic regenerators. This capability, enabled by the erbium-
doped fiber amplifier (EDFA), has permitted a dramatic increase in the
capacity of the telecommunications systems enabling high data rates nec-
essary for today’s Internet communication [1]. Recently, the use of fiber
amplifiers also in many free space communications networks has been re-
ported, both in terrestrial and satellite-based systems [2]. Fiber lasers
with high output power have been extensively employed in materials pro-
cessing applications. These applications include drilling, marking, cutting
and soldering, which play an important role in the automobile, aerospace
and building industry [3]. In addition, fiber lasers have also the potential
to make a significant impact in the field of medicine due to the intrinsic
geometry of the fiber, its compact size and high efficiency. These features
are well-suited for endoscopic and surgical procedures [4] such as track-
ing tumors [5], and for other ablative procedures beneficial for treating
kidneys, brain, skin and larynx [6].
The idea for a fiber laser was proposed in 1961 by Elias Snitzer [7, 8],
soon after the first detailed proposal of building a laser (at that time
called “optical maser”) by Schawlow and Townes in 1958 [9] and the first
demonstration of a laser by Maiman in 1960 [10]. Snitzer’s first experi-
mental demonstration used a barium crown glass fiber doped with triva-
lent neodymium ions [8]. A few years later (1964), Snitzer and Koester
demonstrated the first fiber optic laser amplifier [11]. This fiber ampli-
fier consisted of a neodymium-doped fiber and flash lamps for inducing
excitation of the Nd3+-ions (i.e. pumping). However, progress was slow
1

Introduction
until mid 1980’s when the chemical vapor deposition process used to pro-
duce low loss fibers [12] was modified to incorporate doping of rare-earth
(RE) ions [13–15]. Soon thereafter, research groups at the University of
Southampton and AT&T Bell Laboratories developed in parallel the first
EDFAs [16, 17]. The ability of the EDFAs to provide gain at the third
telecommunication window attracted much interest and resources from
the telecommunications industry, which boosted the development of the
fiber laser and amplifier technology. Since then, fiber lasers and ampli-
fiers have shown rapid progress in terms of power scalability [18] and
operating wavelength regimes [19–22].
The maximum output power of fiber lasers in continuous wave (CW)
operation has grown exponentially over the last decade [18], reaching a
record power of 10 kW in the single-mode regime in 2010 [23]. The high
output power and other excellent properties offered by the fiber lasers,
both CW and pulsed ones, make them highly attractive for a variety of
applications. The intrinsic geometry of the optical fiber offers excellent
thermo-optical properties, owing to the high surface area to volume ra-
tio, resulting in excellent heat dissipation and distribution of the thermal
load over a long length [24]. In addition, optical fibers are excellent in
achieving diffraction-limited beam quality (single-mode fibers), high gain
and power independent mode distortions [25]. Furthermore, advances
in the development of passive components such as fiber Bragg gratings
(FBG) and pump-combiners, allows for all-fiber laser systems, making
them alignment-free, compact and robust.
Ytterbium (Yb) doped fibers are the preferred gain media for building
high power laser systems. Yb-doped fibers benefit from having a broad ab-
sorption band at the infrared wavelength region, where high power pump
diodes are available. In addition, the practical absorption wavelengths
are close to the emission wavelength, resulting in a high energy efficiency,
and thus low thermal load. However, high power Yb-doped fiber laser
systems suffer from some detrimental effects that reduce the reliability
of these laser sources [25]. The photodarkening effect is one of the main
threats to the efficiency of the Yb-doped gain media and manifests as a
time dependent increase of a background loss in the doped core. Although
this effect was already observed in 1997 [26], its importance was not rec-
ognized and it was not studied until 2005 when the first scientific paper on
photodarkening was published [27]. Since then, progress has been made
in understanding this effect and in reducing its impact, mainly through
2

Introduction
optimization of the core glass composition. However, a detailed descrip-
tion of the process driving the induced loss and methods to mitigate it
without important trade-offs are still under study.
The aim of this work has been to improve the understanding of the pho-
todarkening effect in Yb-doped silica fibers through the implementation of
accurate and repeatable characterization methods. Particular goals of the
study have been to investigate the influence of temperature on the pho-
todarkening process and to understand the thermodynamic properties of
the photodarkening-induced defects. In addition, a new all-vapor phase
fabrication method for producing Yb-doped fibers has been implemented
aiming to improve the homogeneity of the core material and thus, en-
hancing the laser efficiency through reduction of clustering, and therefore
photodarkening.
The thesis is organized as follows. Chapter 2 introduces some basic and
fundamental properties of the rare-earth doped fibers and typical meth-
ods used for power scaling. Its fundamental limitations are also discussed.
Chapter 3 reviews the fabrication of rare-earth doped fibers and describes
the state-of-the-art fabrication techniques. In addition, current limita-
tions of these fabrication methods are discussed. Chapter 4 reviews the
photodarkening effect in Yb-doped fibers, describes the implemented mea-
surement method and presents a study of a thermal bleaching process.
Chapter 5 focuses on studying the temperature influence on the photo-
darkening process and characterizing the photodarkening-induced fiber
temperature change during irradiation. An isothermal method for con-
trolling the fiber core temperature is also presented. Chapter 6 presents
a measurement approach for determining the refractive-index change in-
duced by photodarkening. In Chapter 7 a new fabrication method of pro-
ducing Yb-doped fibers by the atomic layer deposition (ALD) in combina-
tion with the conventional modified chemical vapor deposition (MCVD)
technique is presented. Finally, in Chapter 8, a summary is presented
and future research directions are briefly discussed.
3

Introduction
4
2. Rare-earth doped optical fibers
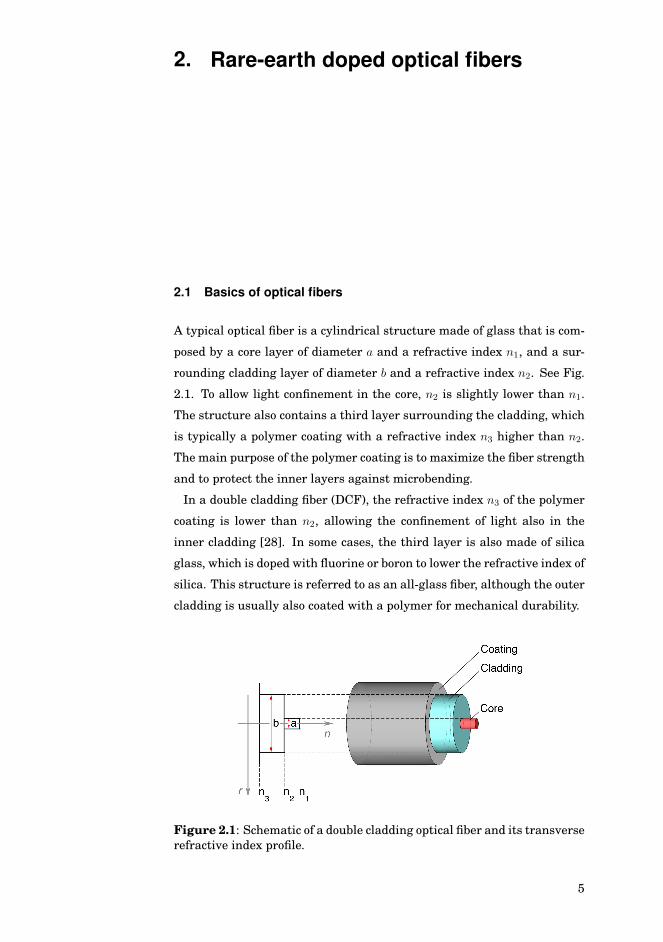
2.1 Basics of optical fibers
A typical optical fiber is a cylindrical structure made of glass that is com-
posed by a core layer of diameter a and a refractive index n1, and a sur-
rounding cladding layer of diameter b and a refractive index n2. See Fig.
2.1. To allow light confinement in the core, n2 is slightly lower than n1.
The structure also contains a third layer surrounding the cladding, which
is typically a polymer coating with a refractive index n3 higher than n2.
The main purpose of the polymer coating is to maximize the fiber strength
and to protect the inner layers against microbending.
In a double cladding fiber (DCF), the refractive index n3 of the polymer
coating is lower than n2, allowing the confinement of light also in the
inner cladding [28]. In some cases, the third layer is also made of silica
glass, which is doped with fluorine or boron to lower the refractive index of
silica. This structure is referred to as an all-glass fiber, although the outer
cladding is usually also coated with a polymer for mechanical durability.
Figure 2.1: Schematic of a double cladding optical fiber and its transverserefractive index profile.
5

Rare-earth doped optical fibers
The core refractive index n1 and the cladding refractive index n2 deter-
mine the maximum angle at which an incident ray can be coupled in the
fiber core. The sine of this maximum acceptance angle is the numerical
aperture (NA), and it can be calculated from the index difference:
NAcore =√n21 − n2
2. (2.1)
The NA of a single-mode fiber (SMF) has a value typically in the range
of 0.10 to 0.14, while the NA of a multi-mode fiber (MMF) is about 0.3.
In a DCF with a fluoroacrylate polymer as the outer layer the light is
coupled in the inner cladding with an NA that can be as high as 0.45. On
the other hand, in all-glass fibers the acceptance angle is smaller, the NA
is typically less than 0.22.
Figure 2.2: Schematic diagram of a double cladding fiber with acceptancecone.
Unlike in single cladding fibers, in DCFs the pump power is launched in
the inner cladding. The larger cross section of the inner cladding and the
higher NA enable a much simpler and more efficient launch of pump light
and the use of high power laser diodes with less demanding beam quality.
The cladding cross section is typically non-round as shown in Fig. 2.3,
which eliminates the propagation of rays with no overlap with the doped
core and thus increases the efficiency of the pump absorption.
Figure 2.3: Cross sections of two double cladding fibers: (a) Octagonalshape, (b) D-shape.
6

Rare-earth doped optical fibers
The number of modes supported by the fiber is determined by the nor-
malized frequency or V-number [29]:
V =2πaNA
λ, (2.2)
where a is the core radius and λ is the wavelength of the propagating light
in vacuum. A SMF satisfies the condition that V <2.405, meaning that
at higher values of V the fiber becomes multi-moded. The core radius of
a SMF is usually in the range of 3 to 5 μm, depending on the operating
wavelength. In MMFs the core radius is much higher, typically from 25 to
30 μm. The standard dimension for the inner cladding radius is 62.5 μm,
which is large enough to confine the fiber core propagating modes entirely,
both for single- and multi-mode fibers.
A way to couple the pump power into the inner cladding of a DCF is
to inject the multi-mode pump light from the side with the proper NA
and beam size, as shown in Fig. 2.2. This pump scheme, known as end-
pumping, has the advantage that it is easy to implement, but it limits the
access points of the fiber to only two. In addition to that, the thermal load
from uncoupled pump needs to be removed, which is generally a major is-
sue in high power lasers. Efficient pump coupling can be achieved using a
pump combiner. In this passive component, multiple fibers are thermally
tapered and fused to a single output fiber so that the light from multiple
inputs can be couple to the inner cladding of a single DCF [30].
2.2 Rare-earth dopants
Fiber lasers and fiber amplifiers are based on optical fibers doped with
rare-earth (RE) ions. The RE ions group is mainly composed of lanthanid-
es, which are 15 chemical elements of the periodic table with an atomic
number ranging from 57 to 71. The ions of the most interest are neodymi-
um (Nd3+), erbium (Er3+), ytterbium (Yb3+) and thulium (Tm3+), which
are incorporated into the fiber core as oxides. In a trivalent state, opti-
cal absorption and emission causes transitions between the energy states
within an inner shell (4f), while the outer shells (5d and 5p) remain intact
and prevent perturbations by external fields. In a pump process an RE-
ion in an initial ground state can absorb the energy of an incoming pump
photon of energy E1 = hpv1 reaching a higher energy level Eh (see Fig.
2.4(a)), where hp is the Planck constant, and v1 is the frequency of the in-
7

Rare-earth doped optical fibers
coming photon. When the ion is in the excited state it can rapidly relax to
a somewhat lower energy level Em through a non-radiative de-excitation
process that involves the creation of a phonon, i.e. a quantized vibration
of the surrounding medium. From this level, de-excitation to the ground
state can take place either by spontaneous or stimulated emission, and in
both cases a photon of energy E3 = Em − Eg is emitted.
In stimulated emission an incoming photon with energy E3 promotes
de-excitation of the ion from the upper lasing level Em, with the creation
of a photon having the same properties of phase, polarization and direc-
tion as the incoming photon, and thus leading to amplification of light.
On the other hand, if the ion is spontaneously de-excited, the photon is
emitted with random phase and direction. In an amplification process
the number of stimulated emissions exceeds by far the spontaneous emis-
sions. When the ion is relaxed directly to the ground state the process
follows a three level lasing scheme, which takes place, e.g. in Yb-doped
fibers when pumped at 920 nm or 976 nm with lasing at longer wave-
lengths. There exists the possibility that the ion is de-excited to another
level, from which it relaxes non-radiatively to the ground state completing
a four level lasing process. Fig. 2 shows the schemes of the three and four
level lasing processes. The lasing process can follow a different scheme
depending on the RE-ion and the pump wavelength of choice, but usually
it can be simplified to either a three or a four level laser scheme [1].
Figure 2.4: Energy level diagrams: (a) Three-level lasing scheme (b)Four-level lasing scheme.
In a three level scheme, absorption from the ground state to the upper
lasing level with energy Em can occur, provoking reabsorption of emitted
photons. As a consequence, in order to achieve gain, higher levels of pump
power are required. This is not the case in lasers following a four level
laser scheme, which benefit from having lower values of threshold powers
making them more suitable for many applications.
The wavelengths of pump absorption and signal emission depend on the
8

Rare-earth doped optical fibers
energy level arrangement of the ions in the host glass. Table 2.1 summa-
rizes the main laser active RE-ions with their common host glasses and
emission wavelengths appearing in an order of importance.
Neodymium was the first of the RE-ions that was used in a fiber laser [8]
and in a single-mode fiber laser [31], and it still remains as one of the most
used doping elements [32,33]. Additionally, the first double cladding fiber
laser used Nd3+ as the doping material [28]. Stimulated emission is ob-
tained at different wavelengths within three fluorescence bands centered
at 0.9, 1.06, and 1.35 μm, while inversion can be achieved by pumping at
0.8 and 0.9 μm. The strongest emission band of Nd3+ is the one at 1.06
μm, and with conventional 0.8 μm pumping it corresponds to a true four-
level laser scheme. However, in terms of energy the efficiency of Nd3+ is
low, and as a consequence it has been replaced by Yb3+ as the dopant of
choice for high-power fiber lasers.
Table 2.1: Rare-earth ions with common host glasses and important emis-sion wavelengths.
Erbium-doped fibers are the most important fibers for applications in
telecommunications due to their ability to amplify at about 1.55 μm, which
corresponds to the low-loss window of silica fibers. Initially, at the inven-
tion of the erbium-doped fiber amplifier (EDFA), the pump source used
was centered at visible wavelengths (e.g. at 514 nm) due to the lack of
more suitable pumps at longer wavelengths [16, 17]. The development
of diode lasers first at 1480 nm and later at 980 nm allowed for a more
efficient energy conversion and lower amplification noise [34, 35]. High-
power fiber sources are difficult to achieve with Er3+ mainly due to three
9
Rare-earth doped optical fibers
reasons. First, an erbium-doped fiber pumped at 980 nm has a low energy
efficiency due to the large energy difference between pump and signal
photons. Second, the absorption bands of the Er3+ are relatively weak for
980 and 1480 nm. Third, the Er3+ concentration level is strongly limited
by ion-to-ion interaction effects that degrade the fiber efficiency [1]. The
reduced pump absorption of Er-doped fibers can be partly overcome by co-
doping with Yb3+ [36]. The ytterbium ions can efficiently absorb pump
radiation, and then transfer the energy to a closely located Er3+ in the
ground state, promoting excitation to the upper lasing level.
Ytterbium has become a very important RE-ion for high-power applica-
tions due to its high pump-to-signal energy-conversion efficiency around
1 μm and a very simple electronic structure with only one upper lasing
level. A detailed analysis of the spectral properties of Yb3+ in silica fibers
is presented in section 2.3.
The growing interest in developing high power fiber sources emitting
around 2 μm has recently spurred the progress in optical fibers doped with
Tm3+. Tm3+ has an absorption peak centered at 790 nm, which makes it
especially suitable for diode pumping and allows efficient excitation of
two Tm ions with a single pump photon, through a cross-relaxation pro-
cess. By this approach, high power silica based fiber lasers with an output
power in excess of 1 kW have been demonstrated [22,37].
2.3 Spectral properties of Yb3+
Compared to other RE-ions, the energy level diagram of Yb3+ ions has
a simple structure consisting of two well-separated levels or manifolds:
the ground state 2F7/2 and the excited state 2F5/2. Further splitting of
these two manifolds into several sublevels (Stark levels) takes place due
to the permanent electric field generated by the charge distribution in the
host glass [38]. Figure 2.5(a) depicts the energy level diagram of Yb3+
ions within the optical spectral range from visible to the NIR [39]. The
upper manifold 2F5/2 and the lower manifold 2F7/2 have three and four
Stark sublevels, respectively (labeled with letters). Because of the Stark
splitting, laser transitions can take place between different combinations
of sublevels in the two manifolds. The corresponding transitions between
the sublevels are not discrete energy levels because of homogeneous and
inhomogeneous broadening in the glass at room temperature [40]. There-
fore, the pump and lasing wavelengths can be selected (or spontaneously
10

Rare-earth doped optical fibers
occur in the case of spontaneous emission) from a broad range of wave-
lengths as indicated in Fig. 2.5(a).
The cross sections represent the probability that an optically induced
transition takes place, corresponding to the absorption or the stimulated
emission of light. Thus, the amounts of absorbed and emitted light power
at a given frequency can be defined as
Pa,e = σa,eI, (2.3)
where the absorption and emission cross sections are σa and σe (in units of
m2), respectively, and I is the incident light intensity (in units of W/m2).
Figure 2.5(b) shows the absorption and emission cross sections of Yb3+
in aluminosilicate glass. The strong absorption and emission peaks at
975 nm correspond to the transition between levels a and e (a↔e). Those
levels are the most thermally populated sublevels according to the Boltz-
mann’s distribution, and thus, represent the most probable transition
[40,41].
Figure 2.5: (a) Energy level diagram illustrating the ytterbium ground2F7/2 and excited 2F5/2 state manifolds and possible transitions betweenthe sub-levels, and (b) absorption and emission cross sections of ytterbiumin aluminosilicate glass.
For cladding pumped fibers, pump signal at 975 nm is preferred due to
the high pump absorption of Yb-doped fibers at this wavelength. However,
pump wavelengths around 915 nm (a→f) are also used to provide more tol-
erance to the pump diode wavelength, given the broader absorption cross
section peak. Moreover, for the pump wavelength at 915 nm, higher inver-
sion can be achieved due to the low value of the emission cross section. On
the other hand, gain can be attained at the 975 nm emission peak or over
a range of wavelengths at the broader secondary peak centered at ∼1030
nm. Consequently, gain can only be realized at wavelengths longer than
11
Rare-earth doped optical fibers
the pump wavelength. Moreover, absorption and emission cross sections
are dependent on the host glass and the magnitude of the deviations from
one host to another was observed to be up to about 30% [41].
2.4 Inversion in Yb-doped fibers
The term inversion and population inversion are used indistinctly in this
dissertation to refer to the fraction of ions in the excited state over the
total RE-ion density. Inversion in Yb-doped fibers can be analyzed by con-
sidering a three level laser system (see Fig. 2.4(a)). The level 1 is the
ground state, with a normalized population of ions N1. The level 2 is the
metastable level or the lasing level, with a normalized population of ions
N2, and the level 3 is the pump level. For Yb3+ ions, the pump level is a
degenerate level (Stark sublevel) within the level 2. Since the thermal-
ization of the sublevel populations is very fast and the transition from the
pump level (level 3) to the metastable level (level 2) is non-radiative, the
system can be reduced to a two-level laser system [41]. This approxima-
tion was demonstrated to be valid also for fibers doped with Er3+ [42].
The rate equations corresponding to the upper (N2) and lower (N1) state
populations are:
dN2
dt= (R12 +W12)N1 − (R21 +W21 +A21)N2, (2.4)
dN1
dt= − (R12 +W12)N1 + (R21 +W21 +A21)N2, (2.5)
where R is the pump transition rate, W is the signal transition rate and
A is the spontaneous emission transition rate coefficient. In steady-state,
the populations are time-invariant, i.e. dNi/dt=0 (i=1,2), and therefore
these equations can be reduced to
N2 =R12 +W12
R12 +R21 +W12 +W21 +A21, and (2.6)
N1 = 1−N2. (2.7)
The transition rates are
R12,21 = σa,e(vp)Ip
hpvp, (2.8)
W12,21 = σa,e(vs)Is
hpvs, and (2.9)
12

Rare-earth doped optical fibers
A21 =1
τ21, (2.10)
where σa and σe are the effective absorption and emission cross sections,
and vp and vs are the pump and signal frequencies. Ip and Is are the pump
and signal intensities (in units of W/m2), hp is the Planck constant, and
τ21 is the radiative lifetime of the excited state. The upper-state lifetime is
defined as the time after which the upper-level population has decayed to
1/e in absence of pumping and stimulated emission [1]. In particular, ra-
diative lifetime takes into account only the decay caused by spontaneous
emission. Values for the radiative lifetime of around 0.8 ms are typically
measured, although it may vary by about 30% between fibers with differ-
ent host glass [41].
In this dissertation, cladding pumping is used to achieve controllable
and uniform inversion in Yb-doped fibers. For a double cladding fiber, the
pump intensity Ip can be calculated by dividing the pump power (in W)
with the cladding area [43]. The fiber samples used are short in length,
typically <2 cm, and consequently, the amplified spontaneous emission
(ASE) can be neglected (W12,21=0) [44]. Moreover, no signal in the Yb
amplification region is launched. Under these conditions, the normalized
inversion is well approximated using the relations
N2 =σa(vp)
σa(vp) + σe(vp)
1
1 + Isat/Ip, and (2.11)
Isat =hpvp
(σa(vp) + σe(vp)) τ21, (2.12)
which were derived from the equations (2.6)-(2.10). This shows that the
inversion can be controlled by tuning only one parameter, i.e. the pump
power. With strong cladding pumping at 915 nm, inversion levels well
above 90% can be reached, while a strong pump at 975 nm creates a
maximum of 50% inversion. This is due to the fact that at the 975 nm
wavelength Yb-absorption and -emission cross sections are equal [41]. A
detailed study on inversion distributions in short Yb-doped fibers with
different pumping configurations was published by Koponen et al. [44].
Furthermore, in Publications IV, V and VI inversion in the fiber was in
some cases estimated by simulation using a commercial software (Liekki
Application Designer). This simulation tool uses a full numerical spatial-
mode modeling, and thus, it is expected to give a better estimation of the
inversion as described above [45].
13
Rare-earth doped optical fibers
2.5 Power scaling
During the past decade, high power fiber lasers and amplifiers have ex-
perienced a tremendous progress in power scaling, reaching continuous
wave (CW) output power levels beyond 3 kW with near diffraction-limited
beam quality [46]. This increase in the output powers has mainly occurred
due to the advances in the fabrication and design of RE-doped fibers with
a double cladding structure, the excellent thermo-optical properties of op-
tical fibers, and the development of high power pump diode sources [25].
Optical fibers doped with Yb are particularly interesting due to their high
optical-to-optical energy efficiency, well above 80% [19]. This excellent
energy efficiency is mainly explained by the low energy difference be-
tween the pump and signal photon, i.e. the quantum defect that can be
expressed as
q = hpvp − hpvs = hpvp
(1− λp
λs
), (2.13)
where hp=6.626·10−34 Js is the Planck constant, and vp and vs are the
pump and signal frequencies, respectively. The quantum defect is often
expressed as a fraction of the absorbed pump photon energy, the term in
parenthesis, which dissipates as heat. Yb-doped fibers have typically a
quantum defect of less than 10%, which results in a low thermal load. In
addition to that, the simple energy structure of Yb allows for very high
dopant concentrations before the onset of concentration quenching pro-
cesses that would limit the laser efficiency [41].
Currently, the reported maximum available CW output power from an
Yb-doped fiber laser in the single-mode regime is as high as 10 kW [23].
This fiber laser uses an advanced method of pumping, named tandem-
pumping, in which one or several fiber lasers pump another one [25]. This
approach is mainly used to enable pumping close to the emission wave-
length so that the quantum defect is low and thereby also the thermal
load. The 10 kW fiber laser was pumped by an Yb-doped fiber pump lasers
at 1018 nm and emitted at 1070 nm, resulting in a quantum defect of less
than 5%.
Although the highest values of output powers have been achieved for Yb-
doped fibers, there is also interest in increasing the power of laser sources
working at longer wavelengths that are used in applications such as free-
space communications and light-imaging detection. At the 1.5-1.6 μm
wavelength range, the highest power levels have been demonstrated for
systems based on cladding-pumped Er/Yb co-doped fibers. By using this
14
Rare-earth doped optical fibers
approach, a record power level of 300 W of CW signal at 1567 nm has
been demonstrated by Jeong et al. [21]. However, the laser efficiency of
this type of lasers is reduced at high output powers due to strong co-lasing
at 1067 nm resulting from the emission of Yb ions. Tremendous success in
achieving power scaling also at 2.05 μm has been demonstrated by large
mode area (LMA) Tm-doped silica fibers showing >1 kW of output power
and a slope efficiency of roughly 53% [22].
2.5.1 Fundamental limitations
The two main limitations to the power scalability of fiber lasers are non-
linear effects and thermal management. The nonlinear effects are related
to the properties of the optical fiber itself, which entails laser radiation
with a small effective mode area and long propagation length. This spurs
the onset of nonlinear effects such as stimulated Raman scattering (SRS),
stimulated Brillouin scattering (SBS) and self-phase modulation (SPM),
although the latter effect can be neglected for CW fiber lasers [29]. The
SRS causes molecular vibrations that result in the frequency downshift
(by ∼13 THz) for a fraction of the propagating signal and the emission
of phonons. The large wavelength shift of the created signal, i.e. greater
than 60 nm for an Yb-doped fiber laser emitting around 1 μm, is unaccept-
able for most applications. The SBS creates also a signal with frequency
downshift that propagates in the backward direction with respect to the
incident beam (and phonons). The frequency shift is in this case relatively
small, about 15 GHz in Yb-doped fibers operated at around 1060 nm. The
threshold power for SRS is approximated by [29]
PSRSth
∼= 16Aeff
gRLeff, (2.14)
where Aeff is the effective mode area of the propagating mode, gR the
Raman peak gain coefficient (10−13 m/W for silica at 1 μm wavelength),
and Leff the effective nonlinear length. Similar expression can be derived
for the SBS:
PSBSth
∼= 21Aeff
gBLeff, (2.15)
where gB is the Brillouin peak gain coefficient, which is almost indepen-
dent of wavelength (5·10−11 m/W for silica fibers). These two nonlinear
effects manifest as a loss mechanism. The threshold of SBS is relatively
low in optical fibers and thereby introduces the strongest limitation to the
power scaling of single-frequency fiber lasers. It is therefore possible to
15
Rare-earth doped optical fibers
raise the Brillouin threshold by increasing the spectral bandwidth of the
signal. It is estimated that at a spectral bandwidth above approximately
0.5 GHz, the power scaling would be restricted by SRS. The effect of SBS
can be also suppressed by reducing the fiber length or longitudinally vary-
ing the fiber temperature [47]. On the other hand, the mitigation of the
SRS is only possible through the reduction of the fiber length or signal
power, or by means of specialty fiber designs [48–50].
The heat generation due to the quantum defect can damage an optical
fiber through coating degradation, fracture or even melting of the core
[24]. In Yb-doped fibers, the fraction of the pump power that is absorbed
and converted into heat is approximately 15%. This means a heat gener-
ation of more than 150 W per kilowatt of output power. Therefore, special
attention should be given to cooling of the fiber in order to maintain effi-
ciency and avoid damage [43,51].
Brown and Hoffmann have implemented a 2-dimensional model to sim-
ulate the radial temperature distribution of bare double cladding fibers
[24]. The model assumes the heat load generated by the quantum defect of
Yb is distributed uniformly in the core (with no variation along the fiber),
and that the core and the cladding regions have the same thermal and
mechanical properties. Figure 2.6(a) shows the geometry of the modeled
fiber. The steady-state heat equation for an isotropic medium (considering
two regions with cylindrical symmetry) can be expressed as [24]
1
r
∂
∂r
(r∂Tcore(r)
∂r
)= −Q0
k, (0 ≤ r ≤ a) (2.16)
for the core, and
1
r
∂
∂r
(r∂Tclad(r)
∂r
)= 0, (a ≤ r ≤ b) (2.17)
for the cladding, where k is the thermal conductivity (W/mK) and Q0 the
heat density (W/m3). The temperature distribution can be derived from
these equations by satisfying the boundary conditions: the temperature
and their derivatives must be continuous across the boundaries. In addi-
tion to that, considering Newton’s law of cooling, T (r = b) must satisfy
dTclad(r = b)
dr=
h
k(Tc − T (r = b)) , (2.18)
where h is the convective coefficient that defines the efficiency of the cool-
ing at the fiber surface in contact with the air, and Tc is the coolant tem-
16
Rare-earth doped optical fibers
perature. The equation describing the core and cladding radial tempera-
ture distribution are then [24]:
Tcore(r) = Tc +Q0a
2
4k
[2 ln
(b
a
)+
2k
bh
]+
Q0a2
4k
(1−
(ra
)2), (0 ≤ r ≤ a)
(2.19)
Tclad(r) = Tc +Q0a
2
2bh− Q0a
2
2kln(rb
).(a ≤ r ≤ b) (2.20)
These equations are plotted in Fig. 2.6(b) for a fiber that is cladding
pumped with 150 W of power at 915 nm and using a convective heat trans-
fer coefficient h of 1.35·10−2 W/cm2K, which is typical for fibers passively
cooled in air. The thermal conductivity k is taken to be 1.38·10−2 W/cmK
and the ambient temperature Tc is set to 303 K. The fiber has a core di-
ameter of about 20 μm and a cladding diameter of approximately 125 μm.
Moreover, the heat generation is assumed to be caused only by the quan-
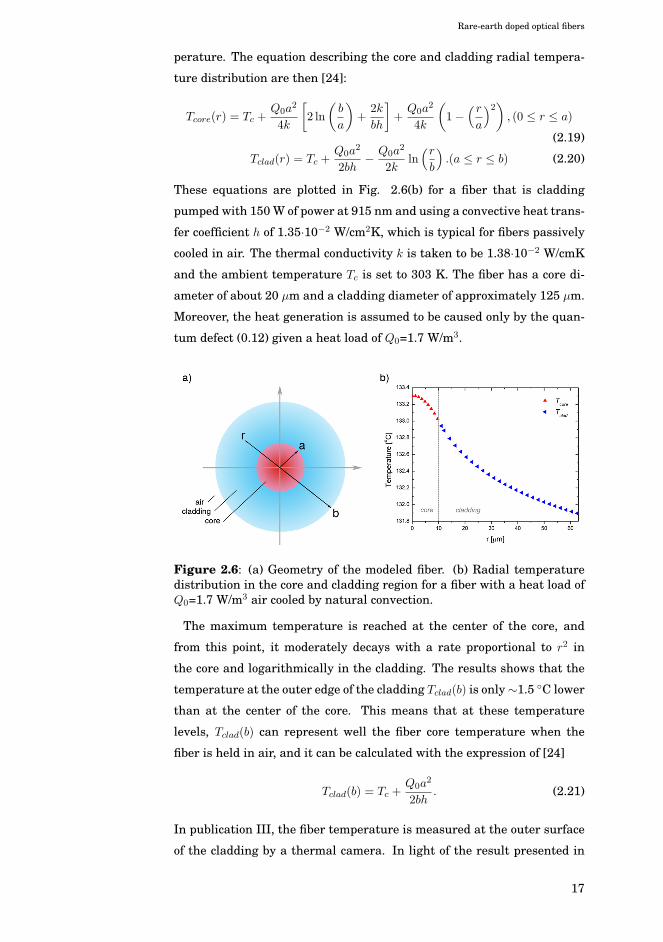
tum defect (0.12) given a heat load of Q0=1.7 W/m3.
Figure 2.6: (a) Geometry of the modeled fiber. (b) Radial temperaturedistribution in the core and cladding region for a fiber with a heat load ofQ0=1.7 W/m3 air cooled by natural convection.
The maximum temperature is reached at the center of the core, and
from this point, it moderately decays with a rate proportional to r2 in
the core and logarithmically in the cladding. The results shows that the
temperature at the outer edge of the cladding Tclad(b) is only ∼1.5 ◦C lower
than at the center of the core. This means that at these temperature
levels, Tclad(b) can represent well the fiber core temperature when the
fiber is held in air, and it can be calculated with the expression of [24]
Tclad(b) = Tc +Q0a
2
2bh. (2.21)
In publication III, the fiber temperature is measured at the outer surface
of the cladding by a thermal camera. In light of the result presented in
17

Rare-earth doped optical fibers
Fig. 2.6, and under the same cooling conditions, the fiber core temperature
is approximated well by the temperature at the outer surface.
2.5.2 Large mode area fibers
Engineering techniques to avoid the onset of nonlinear and thermal ef-
fects, which sets a limit on power scaling of high power fiber lasers, have
been extensively researched over the last years. An effective method to
raise the threshold of nonlinearities consists of using innovative fiber de-
signs with higher effective mode area, while maintaining single-mode op-
eration. Initially, this was accomplished by increasing the core diameter
while reducing the NA in order to maintain single-mode operation, ac-
cording to V < 2.405 [52]. The counterparts of this approach are weak
guidance and high bend loss. In fact, the minimum NA that can be used
in practice is about 0.05, resulting in a core diameter of ∼15 μm for a
wavelength of 1 μm. It should also be noted that very low values of the
NA would require high accuracy in controlling of the refractive index pro-
file, which complicates the fiber fabrication. Moreover, in double cladding
fibers, increasing the fiber core diameter (for a fixed inner-cladding diam-
eter) also results in an improved pump absorption.
Surpassing the single-mode restriction permits power scaling by work-
ing with step-index fibers with V > 2.405. However, the use of techniques
that ensure a single-mode operation become necessary. For example, the
application of bending losses can be used [53, 54], which takes advan-
tage of the fact that the fundamental mode is the least sensitive to bend
loss attenuation. Therefore, propagation of higher-order modes can be
suppressed by a correct selection of the fiber coiling diameter [55]. An-
other approach to ensure the single-mode operation is a proper design
of the rare-earth dopant distribution, thus obtaining preferential gain to
the fundamental mode [56–59]. Single-mode operation can also be fa-
vored by selective excitation of the fundamental mode [60]. This can be
accomplished by, e.g., under filling the optical fiber’s acceptance cone or
by inserting sections of a tapered fiber inside the laser cavity [61]. By the
implementation of the aforementioned methods, the effective mode area
in fiber laser systems with single-mode operation has increased from be-
low 100 μm2 (for a standard SMF) to values of hundreds or thousands of
μm2, with core diameters of at least 40 μm [19,62,63].
Besides the techniques mentioned above, more sophisticated fiber de-
signs such as photonic crystal fibers (PCFs), chirally coupled core (CCC)
18
Rare-earth doped optical fibers
fibers, and leakage channel fibers (LCFs) [64] have been developed to go
beyond the typical core diameters of LMA fibers. A PCF, drawn typically
from a stack of capillaries, can reach a core diameter of up to 100 μm
and still behave as a SMF, due to a better control of the refractive index
[65–67]. However, the practicality of these fibers is compromised beyond
core diameters of 40 μm, because they need to be kept straight due to bend
losses. Moreover, CCC fibers, which have a straight central core for sig-
nal propagation and another helical satellite core around, are designed to
resonantly couple the higher order modes to the satellite core. This leaves
the fundamental mode unaffected [68].
2.5.3 Optimization of the core material
Increasing the core material absorption by means of enhancing the RE-
dopant concentration N (in ions/m3) leads to a linear reduction of the
required fiber length. Hence, higher levels of dopant concentration are
beneficial for power scaling due to further decrease of nonlinear effects.
However, heavy RE-doping also suffers from some downside effects. RE-
ions are incorporated in silica glass by adding network modifiers such as
Al2O3 and P2O5 that improve the RE solubility [69, 70]. Unfortunately,
the extra refractive index inhomogeneities introduced by the RE-dopants
and co-dopants increase Rayleigh scattering loss. In addition to that, the
corresponding increase in NA needs to be compensated by the use of index
decreasing co-dopants (such as boron and fluorine).
High doping concentration may also lead to the formation of clusters of
RE-ions, resulting in quenching processes that can reduce the gain and
power efficiency of the material [71]. This effect takes place, for example,
in Er-doped fibers, where different well described processes involving en-
ergy transfer between Er-ions (such as energy-transfer upconversion) re-
sult in decreased efficiency [1]. On the other hand, the Yb-ion in principle
does not suffer from ion-to-ion energy transfer and upconversion processes
due to the simple energy level structure. However, the gain efficiency of
Yb-doped fibers is strongly degraded in fibers highly doped with Yb [72].
This troublesome effect was attributed to quenching processes induced by
the formation of clusters.
Another process based on interaction of Yb-ions is known as a cooper-
ative luminescence [73]. Two closely located Yb3+ ions relax simultane-
ously to their ground state resulting in the emission of a photon with a
combined energy in the visible wavelength region (∼500 nm). This effect
19

Rare-earth doped optical fibers
is relatively weak, and it is not considered as a threat to the efficiency
of Yb-doped fibers [41]. However, since the cooperative luminescence de-
pends on the degree of clusterization, it has been proposed as a method
for characterizing clustering and other related effects, such as photodark-
ening [74–76].
20
3. Fabrication of rare-earth doped fibers
The methods used to fabricate rare-earth doped (RE-doped) fibers are, in
general, variations of the manufacturing techniques used to produce con-
ventional low-loss silica (SiO2) based telecommunication fibers [1]. The
first step of the manufacturing process is related to the fabrication of the
core soot. The second step entails the fabrication of the so called preform,
a macroscopic scale glass rod that defines the final refractive index profile
and core/cladding ratio of the fiber. Preforms can vary in size over a wide
range, from few centimeters (specialty fibers) up to tens of centimeters
in diameter [77], with lengths from tens of centimeters to meters. In the
final step this preform is drawn to a fiber.
The core soot is typically fabricated by vapor deposition methods that
satisfy the requirements of high purity and precise control of the process.
Depending on the chemical reaction used to produce the submicron silica
particles the process is differentiated between hydrolysis and oxidation:
SiCl4 + 2H2O → SiO2 + 4HCl (Hydrolisis)
SiCl4 +O2 → SiO2 + 2Cl2 (Oxidation)
In a process based on hydrolysis, SiCl4 vapor is directed into an oxygen-
hydrogen flame to induce a reaction with water molecules, which results
in the formation of submicron particles of SiO2 that are collected in a ro-
tating target. The soot is then pre-treated at a high temperature to reduce
the content of OH. The main fabrication processes based on hydrolysis are
the outside vapor deposition (OVD), the vapor axial deposition (VAD), and
the direct nanoparticle deposition (DND). In the OVD process the silica
particles are deposited on a rotating target rod, with the burner travers-
ing back and forth [78]. After the deposition, the target rod is removed
and the soot-preform is then consolidated into a solid glass preform in a
21

Fabrication of rare-earth doped fibers
high temperature furnace. VAD is similar to OVD, but the deposition oc-
curs at the end of a rotating rod that slowly recedes from the burner with
an advantage that very long preforms can be made [79]. DND is also a
type of an outside soot deposition, but in this case the doping materials
are fed in liquid and vapor phase directly to the oxygen-hydrogen flame
[80,81].
In a process based on oxidation, SiCl4 reacts with oxygen to produce
silica particles that are deposited inside a rotating substrate tube. The
substrate is typically heated by an oxygen-hydrogen burner from the out-
side, with the burner traversing slowly along the rotating substrate. The
fabrication process based on oxidation that has received the most atten-
tion is the modified chemical vapor deposition (MCVD) method [82].
In addition to the deposition of SiO2 particles by hydrolysis or oxida-
tion reactions, it is necessary to add co-dopants to modify the refractive
index profile of the core and in some cases the cladding. Examples of in-
dex increasing co-dopants are germanium, phosphorus, and aluminum,
and examples of index decreasing co-dopants are boron and fluorine [1].
These co-dopants can be incorporated in the soot by using highly volatile
halides (e.g. GeCl4) as precursors that can react during the deposition by
hydrolysis or oxidation, similarly as SiCl4.
Fabrication of RE-doped fibers requires the incorporation of RE-ions into
the core material during the silica deposition or in a separate phase of the
fabrication process, prior to sintering and consolidation of the silica soot.
Direct doping of RE-ions during the soot deposition (by hydrolysis or oxi-
dation) is less straightforward compared to the incorporation of the index
modifiers (e.g. GeO2) due to the low volatility of the halide compounds
of RE-ions, such as ErCl3 or NdCl3 [82]. Different methods, suitable for
both hydrolysis and oxidation processes, have been implemented in order
to circumvent this problem. For example, placing the low vapor pressure
source close to the reaction zone or utilizing alternative vapor sources
such as aerosols or high vapor pressure organic compounds have been
demonstrated [1,82]. An interesting example is the use of RE-chelates as
highly volatile RE precursors (e.g. based on a beta-diketonate ligand) in
combination with a modified MCVD system. The dopant precursor can be
delivered to the MCVD system by a tube heated to about 200 ◦C. Fibers
with a high doping level in excess of 10 wt% of Yb2O3 and low background
losses could be prepared by this method [83].
As an alternative to the vapor phase doping methods, incorporation of
22

Fabrication of rare-earth doped fibers
RE-ions by liquid-phase techniques is widely used [82]. Among those tech-
niques, the most important method is the well-established solution doping
technique typically used in combination with the MCVD system.
The three state-of-the-art techniques used in the fabrication of RE-doped
fibers are: i) the MCVD technique with doping by RE-chelates, ii) the
MCVD technique with solution doping and iii) the DND process. The lat-
ter two manufacturing processes are described below in more detail.
Following the fabrication and doping of the core soot preform, the porous
soot is sintered at a high temperature to form a transparent glass before
collapsing it into a solid rod. The core/cladding ratio of the resultant fiber
is defined by the preform. Therefore, in order to achieve the designed
core/cladding ratio it is common to modify the cladding thickness by sleev-
ing the rod in a glass tube. In double clad fibers, the cladding is typically
machined to a desired shape.
The last step of the manufacturing process is the fiber drawing. The pre-
form is loaded vertically at the top of a fiber drawing tower. The tip of the
preform is heated by a furnace at a temperature between 1950-2200 ◦C.
When this temperature is reached, the glass melts and a tip is formed
that starts elongating due to gravity. The fiber is pulled down by a series
of rollers called capstans and the outer diameter of the fiber is controlled
by precisely adjusting the preform feed rate, the furnace temperature and
the fiber draw rate. Finally, once the fiber cools down, it passes through
one or multiple cups with coating polymers and through UV-curing fur-
naces in the case of UV-curable polymers before being spooled.
3.1 MCVD with solution doping method
As mentioned above, the process begins with the deposition of SiO2 par-
ticles inside a silica tube by the MCVD process. The deposition is carried
out at relatively moderate temperatures, so that the silica particles form
an unsintered porous soot layer. The substrate tube is then removed from
the lathe and soaked in an aqueous solution containing a RE-salt, which
is allowed to impregnate the porous layer for nearly an hour before drain-
ing the solution [15]. Index-increasing dopants can also be added to the
aqueous solution. After that, the tube is transferred back to the MCVD
system and it is carefully dried at a high temperature (∼600-1000 ◦C)
in the presence of a flow of chlorine and oxygen mixture [1]. Following
drying, the soot is sintered and collapsed in the usual manner.
23

Fabrication of rare-earth doped fibers
The fabrication of LMA fibers with low NA and core diameters of typ-
ically more than 20 μm requires the deposition of thick core soot layers
and an accurate control of the refractive index profile of the doped core.
This is achieved by repeating several times the process cycle consisting
of soot deposition, doping, drying and sintering of the soot. After several
cycles, large doped cores with multiple layers are obtained [1,84]. MCVD
with solution doping method has been shown to be suitable for producing
highly doped Yb fibers with large cores. In [19] a fiber fabricated with
this method with a core diameter of 40 μm and an NA below 0.05 was suc-
cessfully used to build a fiber laser generating 1.36 kW of continuous-wave
output power at 1.1 μm with a slope efficiency of 83% and near diffraction-
limited beam quality.
3.2 Direct nanoparticle deposition (DND)
DND is a well-proven fabrication method developed at nLIGHT Oy (Fin-
land), which has been positioned as an alternative to the MCVD method
in manufacturing commercial laser fibers. DND differentiates from other
OVD processes in that a broad variety of raw materials can be fed directly
to the oxygen-hydrogen flame, providing higher flexibility and allowing
the incorporation of materials with very different vapor pressures. The
glass is doped in-situ while the silica particles are formed and deposited
to a target mandrel, thus clustering tendency is low [80, 85]. The size of
the doped silica particles can be adjusted between 10 and 100 nm provid-
ing a high flexibility in the glass composition with hundreds of layers. The
large number of layers allows good control of the refractive index profile,
and RE and index-increasing dopant profiles in the fiber core. After the
deposition phase, the soot is inserted into a furnace for drying. Following
this, the soot is ready for sintering and collapsing to a preform. Fibers
with excellent mode behavior have been fabricated with this process [86].
Furthermore, this method has been shown to be highly suitable for pro-
ducing laser fibers with non-step-index profiles or partially doped cores
(e.g. confined-doped Yb LMA fibers), which is of great importance in fiber
laser engineering [59,81].
24
Fabrication of rare-earth doped fibers
3.3 Current limitations
MCVD in combination with the solution doping method is the most com-
mon technique in the fabrication of laser fibers. Despite the progress
made with this fabrication technique [19], it is not exempt from some
drawbacks. To achieve complex core structures, several core layer deposi-
tions are required. This implies that the soot preform has to be removed
from and reassembled to the lathe multiple times. As a result of that, the
usable length of the preform is reduced and, on the whole, the fabrication
process becomes rather time consuming and expensive. As a consequence,
the number of core layers observed in commercial fibers is typically rela-
tively low, limited to about 10 [80, 81, 84]. The low number of core layers
affects the production of active fibers by decreasing the degree of accu-
racy and flexibility of the dopant profiles, and consequently, the refractive
index profile.
Recently, various alternatives to the solution doping compatible with
the MCVD process have been proposed [84,87–89]. These techniques dif-
ferentiate from the previous, already available gas-phase techniques, in
that the incorporation of the RE-doping is improved for allowing higher
concentrations with increased uniformity and reduced clustering. Addi-
tionally, these methods eliminate repeating the quartz tube removal from
and the reassembly in the lathe. Boyland et al. developed a system
based on the high volatility of lanthanide chelate complexes at moder-
ately low temperatures that allows high RE-doping when the chelates are
heated in a crucible directly within the MCVD preform [87, 88]. Since
the incorporation of RE-ions and co-dopants occurs simultaneously with
the silica deposition, a further advantage is the possibility of reduced
RE-ion clustering compared to the standard solution doping technique.
Sekiya et al. reported on the use of low vapor pressure organic com-
pounds (e.g. Yb(DPM)3) in an improved gas-phase delivery system [89].
By means of this technique large core area Yb- and Al-doped silica pre-
forms were produced with more than 40 deposited layers and a rather
uniform dopant concentration profile. An alternative to these gas-phase
doping techniques consists of an in situ soaking of the porous soot with a
thin layer of dopant solvent with the substrate in the lathe, and drying
the solution by vaporization [84]. This technique permits the deposition
of multiple layers in a reasonable time making this method, compared to
the normal solution doping, more appropriate for fabrication of large-area
25

Fabrication of rare-earth doped fibers
core fibers.
Despite the advantages mentioned above, it has not been reported that
any of these recently proposed techniques have been widely implemented.
In this dissertation, a new fabrication method of producing Yb-doped fibers
is presented. It combines the well-established MCVD process with the
ability of atomic layer deposition (ALD) of depositing uniform thin films
of RE oxides. This method is described in detail in Publication VI and in
Chapter 7.
26

4. Photodarkening in Yb-doped fibers
The term photodarkening refers to the increase of transmission loss in
a gain medium caused by irradiation of light at a certain wavelengths.
In Yb-doped fibers photodarkening is manifested as a spectrally broad
transmission loss centered at the visible wavelengths and extending up
to the pump and signal wavelength region [90–92]. It is believed that
the formation of photodarkening is related to the creation of color centers.
In glass, color centers are created when electrons and holes generated
through excitation are trapped in a defect of the glass matrix, causing
an additional absorption to the transmitted light [93]. In a fiber laser
or amplifier application photodarkening is mainly driven by the energy
of pump and signal photons in interaction with the Yb-doped core of the
fiber [91]. However, the same damage can be induced also by UV light
[92,94] and 488 nm irradiation [95].
The shape of the photodarkening loss spectrum was observed to be con-
stant with progressing photodarkening [91]. Koponen et al. determined
that the induced loss at 633 nm was 71 times higher than at the sig-
nal wavelengths 1040-1070 nm, and it was corroborated for 22 different
fibers with similar composition. However, the photodarkening signature
is dependent on several material parameters such as the composition and
processing of the glass [96].
Photodarkening has also been observed in silica fibers doped with other
RE-ions such as Tm3+, Ce3+, Pr3+, Eu3+ and Tb3+ [97–101]. In these
cases, photodarkening has typically been attributed to the formation of
color centers and photoionization induced by UV photons, which could be
emitted by a RE-ion previously excited to a high energy state through a
multiphoton absorption process. Owing to the simple energy level dia-
gram of Yb3+, the mechanism driving photodarkening in Yb-doped fibers
may follow a different path. Initially, it was hypothesized that a UV pho-
27
Photodarkening in Yb-doped fibers
ton could be emitted via multi-excitation of Yb clusters [91, 92]. Despite
the models presented to explain the photodarkening process up to these
days, the mechanisms responsible of the formation of color centers in Yb-
doped fibers are still not fully understood.
4.1 Inversion dependence
The dependence of the photodarkening on the population inversion level
was first observed in Yb-doped fibers by Koponen et al. [27]. In this study,
the progress of photodarkening was measured with time at different in-
version levels by pumping short fiber samples, and the rate of change
was observed to increase with enhanced inversion. The relation of the
rate of change with other parameters like e.g. the pump power was ne-
glected based on the observation that by fully inverting the fiber sample,
the photodarkening decay curve was no longer dependent on the pump
power. This dependence of the photodarkening on the inversion was also
observed by Kitabayashi et al. by irradiating a 43 cm long sample using
two pump diodes with different wavelengths (i.e. 940 and 976 nm) [102].
The excess loss measured after 100 min of pumping was shown to vary
only with the population inversion regardless of the pump wavelength
used, and the rate of change followed a second-power dependence with
the inversion.
A more accurate and flexible measurement method for determining the
temporal characteristics of photodarkening as a function of the inversion
was presented in [91]. A key feature of this measurement method is the
use of cladding pumping instead of core pumping, which is capable of in-
ducing a radially and transversally homogeneous inversion in fiber sam-
ples with a large range of core diameters [44, 45]. The temporal charac-
teristic curve of photodarkening could not be described by a single expo-
nential function. Instead, the data results were fitted well by a stretched
exponential function. From this expression any physical interpretation is
very difficult, but it associates the photodarkening decay curve, measured
under time-invariant pump power, to a time constant. The inverse of the
time constant (1/τ ) was observed to be proportional to a power law of the
population inversion [91],1
τ∝ (N2)
n. (4.1)
The exponent factor n, also named the ion dependence factor, has been
28
Photodarkening in Yb-doped fibers
studied by several groups and it has been reported to have a value be-
tween 3 and 7 [45,91,103,104],[Publication IV]. This discrepancy between
the different studies is analyzed in detail in section 5.6. In an application
using an Yb-doped fiber, e.g. a fiber laser or an amplifier, the implica-
tions of the photodarkening effect in the device performance are closely
related to the induced inversion, which varies depending on the applica-
tion. Therefore, in applications using lower inversion, such as a cladding
pumped CW laser (∼5-10% inversion), the device can run for a long period
of time before severe performance degradation due to photodarkening. An
opposite case applies to applications that exhibit typically a high inversion
such as an amplifier setup [44].
4.2 Bleaching
Thermal bleaching of photodarkening was for the first time reported by
Jasapara et al. [105]. A fiber sample pre-photodarkened by pump irra-
diation at 976 nm was thermally treated with a complete recovery occur-
ring at 500 ◦C. By using a similar approach, another group showed full
bleaching at lower temperatures (400 ◦C). In Publication II, a method to
determine the activation energy associated with the thermal recovery of
the photodarkening losses was presented (see section 4.4). This method
can be implemented to calculate the combination of values of temperature
and exposure time that are necessary to achieve a partial or a complete
loss recovery.
Light-induced bleaching (or the photobleaching), was also reported to
reverse the photodarkening effect in Yb-doped fibers. Manek-Hönninger
et al. used UV light at 355 nm with a pulse energy of 90 μJ to successfully
recover the absorption spectrum to nearly its pristine state. Furthermore,
a comparison of the lasing properties between the photo-bleached and the
pristine sample showed very similar slope efficiency, even after several cy-
cles of photodarkening and photo-bleaching [106]. Guzman Chávez et al.
also detected partial bleaching under 1 mW of 543 nm irradiation of a pre-
photodarkened sample. They hypothesized that photodarkening and pho-
tobleaching can be explained in terms of light-induced Yb3+↔Yb2+ con-
version processes [107]. Evidence of equilibrium photodarkening states
dependent on the pump power was presented by Jetschke et al. [104]. In-
terestingly, for a given fiber sample photodarkened up to the equilibrium
level, extra pumping at lower pump power resulted in a partial bleach-
29

Photodarkening in Yb-doped fibers
ing of the induced losses, with the loss level progressing towards a new
equilibrium state. This reduction of the loss was attributed to the pump
power itself, i.e. photobleaching by 915 nm irradiation. It was concluded
that the equilibrium loss level depends on the fraction of excited Yb-ions.
In a more recent study, partial photobleaching of pump-induced photo-
darkened samples was also observed with 633 nm irradiation [108]. By
this approach, only roughly 80% of the total losses could be bleached sug-
gesting that a fraction of the color centers may require higher activation
energies. The percentage of bleached photodarkening was observed to be
lower for samples pre-photodarkened at a level close to saturation, and it
was identified that the defects created during the last period of the photo-
darkening process require higher energy to be bleached.
4.3 Combined photodarkening and thermal bleachingmeasurement
The applied measurement approach used in this thesis for characteri-
zation of photodarkening and thermal bleaching is presented schemati-
cally in Fig. 4.1. In a photodarkening measurement, the core absorption
coefficient change Δα in dB/m, normalized to the pristine fiber absorp-
tion, is monitored by a probe during cladding pumping at a wavelength of
915 nm. The probe generated by a halogen lamp is launched to the core of
a single cladding multi-mode fiber (MMF), after being filtered (typically
at 600 nm) and modulated by a chopper for lock-in detection. An MMF
coupler is used to extract a small portion of the light as a reference to
minimize measurement errors due to power fluctuations of the halogen
lamp, enabling very long measurement durations. The pump laser pig-
tail is spliced to the setup and the pump light is coupled to the cladding
of the sample through a pump combiner, so that the pump light and the
probe propagate in opposite directions. The non-absorbed cladding pump
light is removed by a mode stripper and a single-cladding passive fiber
(∼2 m in length). This prevents damaging of sensitive components by the
strong pump and avoids saturation of the detectors. In addition, the mode
stripper and the single cladding fiber also remove the cladding modes of
the probe light that have low overlap with the core and could underesti-
mate the loss measurement. More details of the setup were presented in
Publication IV and in a previous conference paper [109].
A typical combined photodarkening and thermal bleaching measure-
30
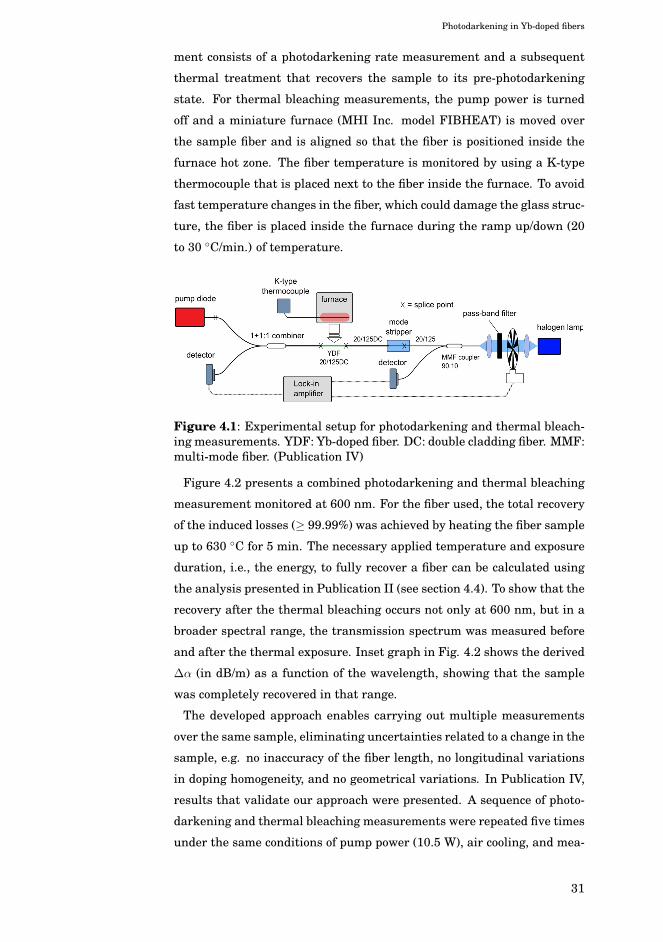
Photodarkening in Yb-doped fibers
ment consists of a photodarkening rate measurement and a subsequent
thermal treatment that recovers the sample to its pre-photodarkening
state. For thermal bleaching measurements, the pump power is turned
off and a miniature furnace (MHI Inc. model FIBHEAT) is moved over
the sample fiber and is aligned so that the fiber is positioned inside the
furnace hot zone. The fiber temperature is monitored by using a K-type
thermocouple that is placed next to the fiber inside the furnace. To avoid
fast temperature changes in the fiber, which could damage the glass struc-
ture, the fiber is placed inside the furnace during the ramp up/down (20
to 30 ◦C/min.) of temperature.
Figure 4.1: Experimental setup for photodarkening and thermal bleach-ing measurements. YDF: Yb-doped fiber. DC: double cladding fiber. MMF:multi-mode fiber. (Publication IV)
Figure 4.2 presents a combined photodarkening and thermal bleaching
measurement monitored at 600 nm. For the fiber used, the total recovery
of the induced losses (≥ 99.99%) was achieved by heating the fiber sample
up to 630 ◦C for 5 min. The necessary applied temperature and exposure
duration, i.e., the energy, to fully recover a fiber can be calculated using
the analysis presented in Publication II (see section 4.4). To show that the
recovery after the thermal bleaching occurs not only at 600 nm, but in a
broader spectral range, the transmission spectrum was measured before
and after the thermal exposure. Inset graph in Fig. 4.2 shows the derived
Δα (in dB/m) as a function of the wavelength, showing that the sample
was completely recovered in that range.
The developed approach enables carrying out multiple measurements
over the same sample, eliminating uncertainties related to a change in the
sample, e.g. no inaccuracy of the fiber length, no longitudinal variations
in doping homogeneity, and no geometrical variations. In Publication IV,
results that validate our approach were presented. A sequence of photo-
darkening and thermal bleaching measurements were repeated five times
under the same conditions of pump power (10.5 W), air cooling, and mea-
31
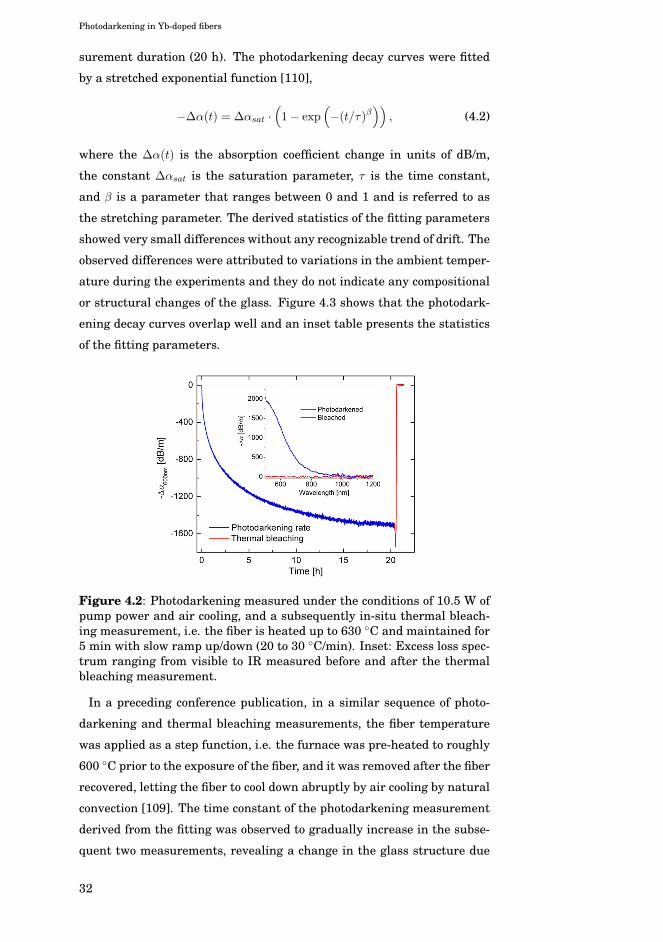
Photodarkening in Yb-doped fibers
surement duration (20 h). The photodarkening decay curves were fitted
by a stretched exponential function [110],
−Δα(t) = Δαsat ·(1− exp
(−(t/τ)β
)), (4.2)
where the Δα(t) is the absorption coefficient change in units of dB/m,
the constant Δαsat is the saturation parameter, τ is the time constant,
and β is a parameter that ranges between 0 and 1 and is referred to as
the stretching parameter. The derived statistics of the fitting parameters
showed very small differences without any recognizable trend of drift. The
observed differences were attributed to variations in the ambient temper-
ature during the experiments and they do not indicate any compositional
or structural changes of the glass. Figure 4.3 shows that the photodark-
ening decay curves overlap well and an inset table presents the statistics
of the fitting parameters.
Figure 4.2: Photodarkening measured under the conditions of 10.5 W ofpump power and air cooling, and a subsequently in-situ thermal bleach-ing measurement, i.e. the fiber is heated up to 630 ◦C and maintained for5 min with slow ramp up/down (20 to 30 ◦C/min). Inset: Excess loss spec-trum ranging from visible to IR measured before and after the thermalbleaching measurement.
In a preceding conference publication, in a similar sequence of photo-
darkening and thermal bleaching measurements, the fiber temperature
was applied as a step function, i.e. the furnace was pre-heated to roughly
600 ◦C prior to the exposure of the fiber, and it was removed after the fiber
recovered, letting the fiber to cool down abruptly by air cooling by natural
convection [109]. The time constant of the photodarkening measurement
derived from the fitting was observed to gradually increase in the subse-
quent two measurements, revealing a change in the glass structure due
32

Photodarkening in Yb-doped fibers
to the fast temperature changes to which the fiber was exposed, although
the fiber temperature was far from the melting temperature of glass (e.g.
1600 ◦C). A spectroscopy study of the fiber absorption revealed a decrease
in the Yb-absorption accompanied by a loss increase at the UV region.
In [111] a post-annealing of an Yb-doped fiber sample in reduced oxygen
atmosphere at 900 ◦C for 5 hours showed similar results attributed to
a conversion from Yb3+ to Yb2+, which is in a good agreement with the
aforementioned observations. These results highlight the importance of
avoiding a rapid temperature change during the thermal bleaching exper-
iments.
Figure 4.3: Photodarkening-induced absorption coefficient change Δα at600 nm as a function of time for 5 subsequent experiments at 10.5 W.Inset table shows the average and standard deviation of the calculatedstretched exponential parameters. (Publication IV)
4.4 Thermal activation energy
In Publication II and in a preceding conference paper [112], the activation
energy associated with the thermal recovery of photodarkening-induced
losses was measured using an isothermal measurement method. This
method was introduced by Erdogan et al. on predicting the thermal decay
of ultraviolet-induced fiber Bragg gratings (FBGs) [113]. The theoretical
model was based on the assumption that carriers (i.e. an electron or a
hole) excited during the UV-irradiation are trapped in a continuous dis-
tribution of energy states. The trapped charges can be freed or detrapped
via thermal excitation returning the charge to the initial non-absorbing
state with the rate of recovery being a function of the trap depth. This
33

Photodarkening in Yb-doped fibers
so-called master/demarcation energy curve approach has also been ap-
plied to analyze the recovery of gamma radiation-induced loss in Yb-Er
doped silica fibers [114]. Although the formation mechanism of photo-
darkening is very different from that used in writing FBGs, the host glass
used is similar, and therefore the freed charges are hypothesized to oc-
cupy similarly a distribution of trap sites of different energy-well depths.
The existence of a distribution of traps, rather than a single trap level
is suggested by the broad absorption spectrum of photodarkening. Thus,
the theoretical picture proposed by Erdogan et al. is expected to describe
well also the mechanism driving the thermal bleaching of photodarken-
ing. Figure 4.4 plots three isothermal thermal bleaching measurements,
with the Δα normalized with αmax, carried out over the same undisturbed
sample. The method used is the same as the one presented before, but in
this case the furnace is pre-heated and stabilized at a given temperature
before the fiber sample is introduced in the heat-zone, and at the end of
the measurement the fiber temperature is further increased to recover the
sample completely.
Central to the theoretical picture is the assumption that the (post-irradi-
ation) population of the trap sites as a function of temperature and time
is uniquely determined by a “demarcation energy” (Ed), given by
Ed = kBT ln (ν0t) , (4.3)
where kB=8.617 ·10−5 eV/K is the Boltzmann constant, and the parameter
ν0 represents the characteristic vibrational frequency at which a defect
“attempts” to escape from the trap state [113]. It is convenient then to
reinterpret the data from Fig. 4.4(a) in terms of the Ed, as it is shown
in (b). By varying ν0 it is possible to fit well the measured Δα on the
same curve, which validates the theoretical assumption. The best fit is
achieved for ν0=2.0 GHz. The dashed line represents a simple analyt-
ical form for the dependence of the Δα on Ed, called the “demarcation
energy curve”. The fit parameters indicate the peak of the energy dis-
tribution, e.g. ΔE=1.32 eV for the fiber in use. The inset graph shows
the initial defect energy distribution with a full width at half maximum
(FWHM) of 0.31 eV. Another commercial large mode area (LMA) fiber
was analyzed for comparison, resulting in ν0=2.0 GHz, ΔE=1.50 eV and
FWHM=0.34 eV. The differences in the defect energy distribution between
these two fibers are not well understood, but they are likely to be related
34

Photodarkening in Yb-doped fibers
to compositional differences or differences in the fabrication process.
There is a unique demarcation energy Ed associated with each value
of Δαn, with the trap states with an energy-well below Ed being bleach,
and the trap states with an energy-well with higher depth remaining un-
changed. Ed is determined by a combination of time and temperature.
Thus, a complete recovery of the photodarkening losses (i.e. Δα ≤0.01)
occurs at energies ≥1.9 eV, which can be achieved with e.g. a fiber tem-
perature of 600 ◦C for 47 s. It should be noted also that this result does
not necessarily predict a light absorption peak at 1.32 eV, since the exper-
iments only predict the thermal activation of trapped charges.
Figure 4.4: (a) Normalized absorption coefficient change Δα as a functionof time for thermal bleaching measurements at three different tempera-tures. (b) Normalized Δα plotted as a function of the demarcation energyEd. The attempt frequency ν0 is set to 2 GHz. Inset graph shows theinitial defect energy distribution. (Publication II)
4.5 Color center formation
Since the first reported experimental evidences of photodarkening [27],
several theories have been suggested to explain the photodarkening re-
lated color center formation. Jasapara et al. suggested that the photo-
darkening loss is caused due to the reduction of Yb3+ to Yb2+ through a
capture of excited electrons by Yb3+ pairs [105]. This was hypothesized
after observing that a loss spectrum similar to photodarkening could be
induced by exposing the Yb-doped fiber sample to a mixture of H2 and
N2 at elevated temperatures. Guzman Chávez et al. observed a tem-
poral decrease of the Yb3+ absorption peak at 977 nm with progressing
photodarkening. This change in the Yb absorption was attributed also to
conversion from Yb3+ to Yb2+, implying the capture of an electron from a
nearby ligand and the creation of a hole center responsible for the spectral
35
Photodarkening in Yb-doped fibers
loss at the visible wavelengths [107]. Moreover, Koponen et al. observed
a seventh order dependence of the photodarkening rate on the inversion
and suggested that Yb clusters with up to seven ions can emit a single
photon with combined energy that would be enough to photoionize the
silicate host [91].
Engholm et al. observed the existence of a strong absorption band in
the UV wavelengths for Yb-doped aluminosilicate fibers, and this absorp-
tion was attributed to several overlapping charge-transfer (CT) absorp-
tion bands [94, 111]. Excitation into a CT band located near 230 nm was
attributed to the temporal formation of an Yb2+ ion and a bound hole
[111]. A stable Yb2+ and a free hole were hypothesized to be generated
upon excitation to a CT band located near 190 nm, resulting in the forma-
tion of color centers [94]. Excitation into this higher energy CT band was
found to be correlated with the photodarkening induced losses. Moreover,
the Yb3+-doped SiO2−P2O5 fiber showed a shift to higher energy of the
CT band that correlated to the lower level of photodarkening observed
in phosphosilicate fibers [115]. Yoo et al. also investigated the UV ab-
sorption band in Yb-doped fiber preforms, but here, on the contrary, the
230 nm absorption band was assigned to an Yb-associated oxygen defi-
ciency center (ODC) [95]. Photodarkening was observed under 488 nm
irradiation, assuming a two-photon absorption process. Experiments on
oxygen loaded fibers showed decrease of photodarkening, which supported
their hypothesis. The nature of the UV absorption band is still under de-
bate [116–121].
Arai et al. implemented a different approach for studying the origin of
photodarkening through analyzing the formation of unpaired electrons by
electron spin resonance (ESR) measurements [122]. Their ESR measure-
ments indicated that both samples irradiated by 976 nm pump light and
gamma-rays mainly generate Al-oxygen hole centers (Al-OHC).
More recently, Peretti et al. reported enhanced photodarkening in a Tm
codoped Yb-doped fiber pump at 976 nm, and attributed photodarkening
to the formation of color centers by UV emission from Tm3+ ions fueled
from excited Yb3+ ions in a multistep upconversion process [123,124]. In
a similar fiber, without Tm co-doping, analysis of UV and visible emis-
sion showed that Tm3+ ions can exist in an ordinary Yb-doped fiber from
contaminations of the ytterbium raw material, and it was concluded that
even very small concentrations of Tm (below 1 mol-ppm) could cause pho-
todarkening. Later, Jetschke et al. published a detailed investigation on
36

Photodarkening in Yb-doped fibers
photodarkening of a series of Yb-doped fibers with varying Tm co-doping
(in a wide range; more than four orders of magnitude) [125]. Their results
confirmed that a Tm concentration above 10 mol-ppm in Yb-doped fibers
can assist photodarkening by accelerating the process of creation of color
centers through a multistep Tm excitation and the emission of UV light.
However, for lower contents of Tm (below 10 mol-ppm) the photodark-
ening parameters were not affected, and it was thereby concluded that
photodarkening is an intrinsic feature of Yb-doped aluminosilicate fibers
and not driven by Tm impurities.
4.6 Mitigation
Up to now, different methods have been used to reduce the effect of pho-
todarkening in Yb-doped laser fibers. Nevertheless, each method may
suffer from some intrinsic drawbacks. A reduction of the Yb concentra-
tion was suggested to ensure long-term operation of Yb-doped laser fibers
without photodarkening [126]. However, this approach contradicts with
the high pump power absorption required for power scaling. Kitabayashi
et al. showed remarkable reduction of photodarkening with enhanced
aluminum co-doping [102]. Aluminum (Al) is the preferred choice of co-
dopant in Yb-doped silicate fibers and in other RE-doped silicate fibers,
owing to its excellent capability of dissolving clustering [69]. Yb/Al-doped
fibers also benefit from having high absorption and emission cross sec-
tions and good thermal and mechanical properties.
Shubin et al. studied photodarkening in Yb-doped aluminosilicate and
phosphosilicate fibers [103]. Yb/P-doped fibers were observed to be much
more photodarkening resistant compared to the Yb/Al-doped fibers [115].
However, P co-doping has some disadvantages such as reduction of Yb
absorption and emission cross sections, high core background loss, lower
softening point and increased core numerical aperture [127]. Jetschke et
al. investigated photodarkening and lasing efficiency of Yb-doped fibers
co-doped with aluminum and phosphorous [128]. Core composition with
equal concentrations of Al and P (about 4 mol% each) was found to result
in much improved photodarkening resistivity, high laser efficiency and
low numerical aperture. However, the Yb absorption and emission cross
sections were still lower compared to the Yb/Al-doped fibers.
Finally, a strong improvement in the photodarkening resistance of Yb-
doped aluminosilicate fibers and high lasing efficiency was achieved by
37
Photodarkening in Yb-doped fibers
cerium (Ce3+) co-doping [129]. The reduced photodarkening was attributed
to the ability of the Ce3+/Ce4+ in trapping both hole- and electron-related
color centers. A downside with Ce co-doping is the enhanced numerical
aperture caused by the refractive index contribution of Ce.
38
5. The role of temperature in thephotodarkening-induced loss
The photochemical processes that lead to the color center formations re-
sponsible for the measured photodarkening losses are shown to be re-
versible when applying heat to the damaged fiber, which enables the fiber
to recover to its initial pristine state. The derived activation energy associ-
ated with the thermal recovery shows that even at moderate fiber temper-
atures a slow recovery is expected to take place, with the rate of recovery
being directly related to the fiber temperature.
Leich et al. have studied the temperature dependence of the photodark-
ening kinetics under conditions of constant pump power [130]. The ini-
tial increase of loss was examined by fitting a stretched exponential func-
tion to the photodarkening measurement with the derived rate parameter
(1/τ ) and the maximum loss level being examined as a function of temper-
ature. The results showed that the photodarkening process accelerated
almost exponentially with temperature, whereas the maximum loss level
was observed to decrease progressively with temperature. Yoo et al. ob-
served a similar trend, but in this case a complete bleaching was achieved
in about one hour of pumping at 573 K [131].
In these studies, however, very little attention was paid to key param-
eters that are relevant to the photodarkening process. First, the effect
of temperature on the distribution of the defect sites (either in presence
or absence of pump power) was not accounted for. Second, neither was
the role of the heat load generated by the photodarkening-induced pump
power absorption, which has an influence on the fiber core temperature.
Third, the effect of temperature on the population inversion, which is one
of the key parameters driving the photodarkening process [91, 104], was
overlooked.
This chapter is a summary of the main results presented in Publications
I, III, IV, in which the above mentioned parameters were studied. This re-
39

The role of temperature in the photodarkening-induced loss
search was carried out using commercially available 20 μm core diameter
large mode area fibers from two different manufacturers.
5.1 Post-irradiation heat-induced darkening
In Publication I, the thermal bleaching process was studied in detail by
applying triangular thermal ramp up/down cycles to a photodarkened
fiber sample. Two new effects were observed to take place during the
thermal cycling of a photodarkened sample when keeping the fiber tem-
perature below the level at which the recovery initiates: i) heat-induced
darkening (addressed in this section) and ii) spectral loss broadening (sec-
tion 5.2). A thermal bleaching cycle was applied to a fiber sample previ-
ously photodarkened up to saturation of the losses with 15 W of pump
power at 915 nm for 22 hours. The absorption coefficient change Δα mon-
itored at 600 nm showed an increase in the absolute magnitude before the
thermal recovery initiated, i.e., at a temperature of 325 ◦C for the fiber in
use. A more rigorous study of this effect is shown in Fig. 5.1, illustrat-
ing a case in which the fiber sample was photodarkened again and gently
thermally cycled between room temperature (RT) and 325 ◦C, before the
temperature was increased to 650 ◦C to fully recover the fiber sample.
Figure 5.1: Absorption coefficient change Δα during thermal cycling be-tween RT and 325 ◦C, followed by a cycle between RT and 650 ◦C. Heat-induced change of Δα at RT is indicated by an arrow between “start” andsecond “turning point”. (Publication I)
The results show that starting at 100 ◦C the Δα increases almost ex-
ponentially until the fiber temperature reaches 325 ◦C. Upon cooling the
fiber to RT, the Δα reaches about 570 dB/m. Thus, the post-irradiation
heat-induced darkening was estimated to constitute roughly 20% of to-
40

The role of temperature in the photodarkening-induced loss
tal induced losses. The same percentage change can also be derived from
spectral measurements of the absorption coefficient before and after the
thermal cycling between RT and 325 ◦C (shown in Fig. 5.2). The fiber sam-
ple can be bleached completely by a thermal cycle to ∼650 ◦C and back to
RT. The same thermal cycle applied to a pristine sample caused no change
to the Δα during the experiment, also at elevated temperatures.
Previous studies have reported a similar effect of post-irradiation in-
crease of loss [132–134]. Sahu et al. observed a room temperature post-
irradiation temporal loss growth at 1.28 μm in a 10 m Yb-doped alu-
minosilicate fiber sample after 488 nm irradiation [132]. In a more re-
cent publication by the same group, this effect was again reported for
a 2 m long Yb-doped aluminosilicate fiber at RT, and its temporal dy-
namics were seen to be enhanced by increasing the fiber temperature to
120 ◦C [133]. Leich et al. also observed heat-induced loss increase during
non-isothermal bleaching experiments prior to the activation of thermal
bleaching, which occurred at ∼230 ◦C. However, after reaching this tem-
perature level, the fiber was not returned back to RT, and, therefore, the
magnitude of the loss increase attributed solely to the enhancement of
permanent heat-induced darkening could not be derived [134]. Further-
more, early thermal bleaching studies on photodarkening do not report
any post-irradiation heat-induced darkening [103, 105]. These disagree-
ments may be due to differences in the setup configuration or in the com-
position of the measured fibers.
5.2 Spectral broadening
Another thermally activated feature that affects photodarkening-induced
losses found to cause non-permanent temperature dependent changes in
the Δα is spectral broadening. These studies were first presented in Pub-
lication I. The magnitude of the change in the absorption coefficient was
found to depend also on the wavelength used in measurements. Therefore,
this effect could be more easily interpreted when the Δα was presented as
a function of λ (wavelength), i.e. by performing spectral measurements.
Figure 5.2 shows two spectral measurements at elevated temperatures,
at 146 and 304 ◦C. Prior to these measurements, the fiber sample was
photodarkened and thermally cycled between RT and 325 ◦C to generate
heat-induced darkening.
The results show that at elevated temperatures the Δα spectrum is
41

The role of temperature in the photodarkening-induced loss
spectrally broadened, with the wavelengths shorter than λ0, the cross-
over wavelength , exhibiting decreased losses, and the wavelengths longer
than λ0 exhibiting increased losses with increasing temperature. The
magnitude of the change d(Δα)/dT , in the 550-850 nm spectral range,
was measured to be proportional to | λ − λ0 |. For example, a change of
0.19 (dB/m)/◦C at 670 nm was measured for the fiber in use. Gaussian fits
to the experimental data indicate that, within the wavelength range used,
the temperature dependent spectral broadening can be well described
by a spectral broadening of a single absorbing species. In [134], photo-
darkening spectral measurements at elevated temperatures revealed a
similar effect of temperature dependent spectral loss change, confirming
the results presented in Fig. 5.2. However, in this study the cross-over
wavelength λ0 was observed to be at a shorter wavelength (∼550 nm),
which may be explained by compositional differences between the mea-
sured fibers.
Figure 5.2: Absorption coefficient change spectra Δα(λ) measured af-ter photodarkening, after thermal cycling (from RT to 325 ◦C and back),and at 146 ◦C and 304 ◦C (after completing the first thermal cycling se-quence). Dashed lines show a Gaussian fit to the respective data sets.(Publication I)
The impact of the spectral broadening was also evaluated in the vicinity
of the pump wavelength in Publication III. As seen in Fig. 5.2, the spec-
tral measurements recorded at elevated temperatures are disturbed in
the Yb-absorption region due to thermal depopulation of the ground state
[135]. This effect complicates the analysis and has to be taken into ac-
count when deriving the photodarkening spectral broadening at the pump
wavelength.
42

The role of temperature in the photodarkening-induced loss
Accurate spectral broadening measurements at the second Yb-absorption
peak, i.e. at 920 nm, were presented in Publication III. The thermal de-
population effect was extracted from the data measured prior to the on-
set of significant photodarkening. Figure 5.3 shows the measured Yb-
absorption change due to thermal depopulation (Abs920nm) and the iso-
lated effect of the photodarkening-induced losses (Δα920nm) as a function
of temperature. For the characterized fiber, the net increase in Δα920nm
versus temperature was ∼0.89%/◦C.
Figure 5.3: Temperature response of the absorption coefficient change at920 nm (Δα920nm, primary axis) and the Yb-absorption coefficient change(Abs920nm, secondary axis). Dashed lines show a linear fit to the data.(Publication III)
Despite the excellent thermal management capabilities offered by the
optical fibers due to their very high surface to volume ratio, high power
fiber lasers are likely to operate at a temperature substantially above the
RT [136]. The results presented in Fig. 5.3 indicate that a photodarkened
fiber operating at 100 ◦C exhibits an increase in the loss level of >50%
with respect to the loss level at RT, i.e. an increase from 38.5 to 60 dB/m.
Therefore, under photodarkening conditions at temperatures above RT,
spectral broadening should be considered as an additional source of heat
due to pump absorption. This should be taken into account when predict-
ing the thermal load of active fibers used in high power fiber lasers.
The spectral broadening can distort photodarkening rate measurements
through variations of the fiber sample temperature. To mitigate this ef-
fect, the fiber should be actively cooled. Alternatively, one could ensure
that the measurement probe light is centered at a wavelength close to λ0
(i.e. 612 nm for the fiber used in Fig. 5.2). Preferably both methods should
be used to ensure accurate measurements.
43
The role of temperature in the photodarkening-induced loss
5.3 Photodarkening-induced increase of fiber temperature
In Publication I, the spectral broadening was observed to take place dur-
ing accelerated photodarkening rate measurements. During pump irra-
diation, Δα monitored at 670 nm was higher than expected from the ra-
tio of Δα670nm/Δα600nm measured from the loss spectrum at RT, and also
compared to the loss level measured with the pump off. Under those cir-
cumstances, it was estimated that the fiber could reach temperatures in
excess of 100 ◦C during the accelerated photodarkening measurements.
An accurate knowledge of the fiber temperature is important to under-
stand the photodarkening-related thermal processes that may take place
during IR irradiation, namely i) the influence of the spectral broadening
in the photodarkening rate measurements, ii) the activation of the heat-
induced darkening, and iii) the role of the thermal bleaching throughout
the photodarkening experiments.
The measurement of the fiber temperature during the recording of the
photodarkening decay curves was presented in Publication III for the first
time. For that, a high resolution thermal camera (FLIR A320) equipped
with a microscope objective was incorporated to our experimental setup.
The accuracy of the temperature measurements was estimated by a com-
parison of the thermal camera results to an indirect approach based on
the effect of the spectral broadening of the losses that uses an external
heat source. By following this approach, the accuracy of the thermal cam-
era was estimated to be < ±10 ◦C for the measured temperatures.
Figure 5.4(a) presents two measurements of the absorption coefficient
change Δα at 600 nm and the respective fiber temperature when using
5.7 W and 10.5 W of pump power at 915 nm. The fiber temperature was
assumed to be in a steady state for each level of induced losses. This
assumption was validated in a separate experiment, in which the pho-
todarkened fiber sample reached a steady state temperature of 120 ◦C
in a few seconds, in response to turning on a pump signal of 10.5 W. In
Fig. 5.4(b) the fiber temperature increase due to photodarkening ΔTPD is
presented versus the product of the absorption coefficient from Fig. 5.4(a)
and the pump power, Δα600nmPpump (dBm−1W). The thermal loading as-
sociated with the quantum defect ΔTQD was determined before the onset
of significant photodarkening, which allowed us to isolate the effect of
subsequent heating due to photodarkening effect ΔTPD. Some important
observations were made from Fig. 5.4. The fiber temperature recorded
44

The role of temperature in the photodarkening-induced loss
shows a clear relationship between the photodarkening losses measured
at 600 nm and the fiber thermal loading. Towards saturation of the losses,
the fiber temperature exceeding 120 ◦C is measured for a pump power of
10.5 W, which possibly activates the temperature related photodarkening
processes mentioned above. The relation between the ΔTPD and the prod-
uct of the loss level and the pump power (Δα600nmPpump) is approximately
linear.
Figure 5.4: (a) Photodarkening-induced absorption coefficient change Δαat 600 nm and simultaneous increase of fiber temperature (measured bya thermal camera) (secondary y-axis) as a function of time. (b) Photodark-ening induced temperature rise ΔTPD versus Δα600nmPpump. ΔTQD wasmeasured to be approximately 17 ◦C and 30 ◦C at a pump power of 5.7and 10 W, respectively. (Publication III)
5.4 Thermal model
In publication III, a model was implemented that predicts the fiber tem-
perature as a function of the pump power in a constant concentration of
defect sites. The model is based on a previously published 2-dimensional
model by D. C. Brown and H. J. Hoffman [24], which simulates the radial
temperature distribution of a double cladding fiber. This model assumes
that the core and the cladding region have the same thermal properties,
and that the heat load is generated uniformly in the doped core of the fiber.
This thermal model was presented in section 2.5.1, and it was concluded
that the fiber core temperature is approximated well by the temperature
at the outer surface of the cladding, for the given conditions of cooling by
natural convection.
Brown and Hoffman considered only the heat generated by the quantum
defect. In this study, however, two sources of heat were taken into account:
45

The role of temperature in the photodarkening-induced loss
i) the absorbed pump that is dissipated as heat due to the quantum defect
and ii) the fraction of the pump power absorbed by the photodarkening
losses. Therefore, the heat power density Q0 can be defined as
Q0 =ηPabs(T ) + Plost(T )
Vcore, (5.1)
where Q0 is in units of W/m3, η is the fractional quantum defect, Pabs is
the Yb-absorbed pump power, Plost is the lost pump power due to photo-
darkening, and Vcore is the core volume of the sample. Pabs and Plost can
be calculated using the expressions
Pabs[W ] = Ppump(1− 10−α915nmΓL/10), (5.2)
α915nm[dB/m] = 4.343Nc(N1σa(T )−N2σe), and (5.3)
Plost[W ] = Ppump(1− 10−Δα920nmΓL/10), (5.4)
where N1 and N2 are the normalized population for the ground state and
the excited state, respectively; Nc is the Yb-ion concentration in units of
ions/m3; Γ is a factor that defines the overlap of the pump signal with the
fiber core; L is the fiber length; and σa and σe are the absorption and emis-
sion cross sections at the pump wavelength. N2 is also dependent on σa,
and can be calculated using the equations presented in section 5.5. Since
σa is linearly proportional to the Yb small-signal absorption, the temper-
ature dependence is accounted for by using the linear fit to the Abs920nm
shown in Fig. 5.3, as a normalized percentage change (see section 5.2).
The additional increase of loss due to the temperature dependent spectral
broadening of photodarkening is accounted for by using the linear fit to
the measured Δα920nm in Fig. 5.3.
Note that to ensure a stable concentration of defect sites, this study
was carried out with a fiber in a state of saturation of photodarkening
losses (Δα600nm=1200 dB/m) induced by 10.5 W of pump at 915 nm. Fig-
ure 5.5 shows the simulated and measured fiber temperature at the outer
surface of the cladding as a function of the pump power. The convective
coefficient h is the only parameter that is adjusted to fit the simulation
with the measured data, with h = 1.35·10−2 W/cm2K giving the best fit.
The simulation follows the measured data well up to 9 W of pump power.
However, at higher powers the simulation shows a near exponential trend
that deviates from the measurement. The reason for this discrepancy is
not fully understood yet, but it might be related with the approach used
46

The role of temperature in the photodarkening-induced loss
in the characterization of the spectral broadening. Prior to that charac-
terization, the fiber temperature was thermally cycled between RT and
210 ◦C with the heat-induced darkening taking place. Here, the tem-
perature increase was induced by an external heat source in absence of
pump light [Publication I], [133, 134]. On the contrary, the measurement
of the fiber temperatures induced by pump power cannot be carried out
in presence of the heat-induced darkening. Although the heat-induced
darkening represents a small fraction of the total losses, and it has been
suggested that the losses are originated from the same type of defects, the
existence of different absorbing species cannot be ruled out. This would
imply a change in the spectral broadening that could not be characterized
with the external heat source.
Two other important observations can be made from Fig. 5.5. First,
the contribution of the quantum defect is relatively small compared to
the heat load generated by photodarkening. Second, the model data set,
in which spectral broadening is neglected, illustrates the importance of
including this effect when predicting the fiber thermal load.
Figure 5.5: Modeled and measured fiber temperature as a function ofpump power. Modeled data is fitted to the measured temperature usingthe convection coefficient h as the only adjustable parameter. The samevalue of h is used for all subsequent calculations. (Publication III)
5.5 Temperature dependence of inversion
The fiber population inversion is related to at least two parameters that
are affected by the fiber temperature, namely the Yb-absorption cross sec-
tion due to thermal depopulation of the ground state, and the upper state
47

The role of temperature in the photodarkening-induced loss
lifetime [135, 137]. In Publication IV the influence of temperature on the
population inversion is studied in a short fiber sample under cladding
pumping at 915 nm. Owing to the short length of the fiber sample, the
ASE can be neglected (see section 2.4) and the normalized inversion N2
can be approximated by the expressions
N2 =σa(T )
σa(T ) + σe
1
1 + Isat/Ip, (5.5)
Isat =hpvp
(σa(T ) + σe) τ21(T ), and (5.6)
τ21(T ) = τ21 − 0.027ΔT/100, (5.7)
where Ip is the pump intensity, hp is the Plank constant, vp is the pump
frequency, and τ21 is the upper state lifetime [44]. The temperature depen-
dence of τ21 is taken into account by a linear approximation of the results
observed by Newell et al. [137]. Figure 5.6 illustrates the temperature
dependence of the fiber population inversion in a range of temperatures
from RT to 300 ◦C, at a constant pump power of 10.5 W. The plot indi-
cates a noteworthy change in the inversion level with a drop of almost
15% when the fiber temperature is elevated up to 300 ◦C.
Figure 5.6: Temperature response of Yb-absorption coefficient at 920 nm(primary axis) and the derived inversion level at 10.5 W of cladding pumppower (secondary axis). (Publication IV)
Previous publications on photodarkening experiments (by pump irradi-
ation at 976 nm) at elevated temperatures assume a very small influence
of the temperature to the population inversion [130, 131]. Leich et al. re-
ported on characterization of photodarkening of Yb-doped fibers in a wide
temperature range from 77 to 773 K [130]. They assume that the Yb-
48

The role of temperature in the photodarkening-induced loss
inversion is maintained at a constant level of 46% for all experiments. In
a similar study, Yoo et al. consider a population inversion of 47% to be
constant with about 1% variation within a temperature range of 300 to
573 K [131]. However, taking into account that the thermal depopulation
of the ground state affects similarly the 915 and 976 nm absorption peaks
[135], the results presented in Fig. 5.6 indicate substantial variations in
the inversion for the temperature range used in the results presented in
[130, 131]. Therefore, the change in the inversion should be considered
in the analysis of the temperature dependence of the photodarkening pa-
rameters.
5.6 Ion dependency discrepancy
The photodarkening-induced increase of the fiber temperature that oc-
curs during the course of photodarkening measurements has been shown
to affect the different photodarkening parameters (e.g. the photodarken-
ing rate (1/τ ) and the saturation loss level), and also the inversion level.
Thus, the photodarkening ion dependence, extracted from the relation of
1/τ with the inversion, should be determined from the measurements car-
ried out under the same isothermal conditions at temperatures below the
activation of the thermal bleaching process (e.g. at RT).
Figure 5.7: (a) Rate of photodarkening losses (1/τ ) as a function of inver-sion in logarithm scale. (b) Photodarkening saturation level Δαsat versusinversion. (Publication IV)
For this reason, in publication IV a forced air cooling system was in-
corporated to the experimental setup in order to maintain the fiber tem-
perature at low values, close to the RT. The fiber sample has no coating,
which makes the heat removal more efficient. Figure 5.7(a) shows the 1/τ
49
The role of temperature in the photodarkening-induced loss
derived from the stretched exponential fit to the photodarkening measure-
ment as a function of the inversion, with both axes in logarithm scale. It
can be observed that a straight line fits well to the lowest four inversion
levels with a slope of ∼4.5. This result shows that the 1/τ follows a sim-
ple power law relation with the inversion. This relation, known as the ion
dependency, suggests that an average of 4 to 5 ions are involved in the
process of creation of a color center. Two measurements at higher inver-
sion levels appear off the initial trend, probably due to thermal related
processes when using high pump powers, and, therefore, these measure-
ments are not considered in the fitting.
In case the uncoated fiber sample is air cooled by natural convection,
a forced linear curve fit to the measured data set results in a poor fit-
ting with a slope of ∼7. This shows that the growth of the fiber thermal
load with progressive photodarkening clearly disturbs the ion dependency
measurement. In Fig. 5.7(b) the saturation loss level (Δαsat) is observed
to have a linear increase with the inversion for the data set measured
with forced air cooling and lower inversion levels. On the other hand,
the Δαsat measured with unforced air cooling shows an initial moderate
increase with the inversion, which is reversed at the higher inversion lev-
els.
The simple power law relation between 1/τ and the inversion level was
observed for the first time by Koponen et al. [91]. Since then, several
ion dependency values ranging between 3.5 and 7 have been reported for
different fibers [45,91,103,104,138]. In these studies, the fiber sample is
commonly held in air or is immersed in water. Recoating of the sample is
sometimes applied, which only exacerbates the heat load in the fiber core.
Additionally, the probe wavelength is not carefully chosen to alleviate the
effect of the spectral broadening with the fiber temperature. In Fig. 5.7(a),
the ion dependency is reduced from 7 to 4.5 with a simple air cooling
system and avoiding the use of high pump powers. This suggests that
the discrepancy in the reported ion dependencies might be partly caused
by an uncontrolled fiber temperature during the experiments, although
other compositional or experimental differences cannot be ruled out.
Moreover, Jetschke et al. performed a detailed analysis of the fitting
procedure that revealed a systematic error in determining the ion depen-
dency [110]. If the decay curve was not saturated, the rate constant was
found to be dependent on the measurement length. In a more recent pub-
lication by the same group, an ion dependency of 4.6 was observed, which
50

The role of temperature in the photodarkening-induced loss
is in agreement with the result presented in Fig. 5.7 [138]. In that case,
the fiber sample was immersed uncoated in pure water, which it is be-
lieved to be a more effective method of extracting heat from the fiber.
5.7 Isothermal measurements
The variations of the fiber temperature have a clear influence on the pho-
todarkening evolution. If these temperature changes are not controlled,
they introduce uncertainty in the measurement results, which are used to
derive and analyze the photodarkening effect. Therefore, controlling the
fiber core temperature at any conditions of pump power and photodark-
ening loss level is fundamental requirement to the progress in the charac-
terization of photodarkening, and thus, in improving the understanding
of the mechanisms driving the related color center formation.
Publication IV proposes a setup to control the fiber temperature based
on a bath of a liquid metal alloy with high thermal conductivity. The
choice for the liquid metal was Galinstan, which is an alloy of gallium,
indium and tin in proportions typically of 68.5%, 21.5%, and 10%, re-
spectively. Galinstan has a high thermal conductivity (about 30 times
of water) and it enables experiments at low and high temperatures. A
schematic of the isothermal bath is illustrated in Fig. 5.8. The melt con-
tainer is made of high quality graphite, which is a material with about 5
times higher thermal conductivity than Galinstan alloy. The use of this
container provides a good control of the fiber temperature, which is moni-
tored by a protected thermocouple immersed in the liquid Galinstan bath.
Furthermore, an array of linear halogen lamb tubes that are used for
heating enables measurements at higher temperatures.
Figure 5.8: Schematics of the isothermal Galinstan bath. Dimensionsare not to scale. (Publication IV)
51

The role of temperature in the photodarkening-induced loss
The presented experimental setup was used to carry out photodarkening
measurements at constant RT. In these experiments, the cladding pump-
ing method was changed to core pumping (at 976 nm) to avoid losses of the
pump power at the glass-Galinstan bath interface. The active fiber used
was a single mode fiber with a core diameter of 6 μm and a total diameter
of 125 μm. As it is typical in these experiments, the length of the active
fiber was only 4 mm. Photodarkening was induced by a pump power of
200 mW.
To show the appropriateness of the method on controlling the fiber core
temperature, the Galinstan bath was compared with three different meth-
ods of cooling: air cooling by natural convection (unforced air cooling),
forced air cooling, and water bath. All the measurements, including the
measurement with the Galinstan bath, were performed using the same
undisturbed fiber sample. A summary of the photodarkening parame-
ters derived from a stretched exponential fit to the measured curves is
presented in Table 5.1. Since the fiber temperature was only monitored
during the experiments with the Galinstan bath, a simulation model built
in COMSOL Multiphysics version 4.2 was used to estimate the fiber core
temperature at saturation of the losses in all the experiments, excluding
forced air cooling.
Table 5.1: Photodarkening parameters derived from stretched exponen-tial fit, and fiber core temperature determined by simulation.
Several observations were made from the results presented in Table 5.1.
First, simulations show that the Galinstan bath is the most efficient cool-
ing method, estimating a temperature change during the photodarkening
experiment of less than 1 ◦C with respect to RT (24.2 ◦C). Second, the time
constant was substantially different depending on the cooling method that
was used, and the direction of change (i.e. lower values of the time con-
stant) is consistent with an increase of the fiber temperature. This study
52

The role of temperature in the photodarkening-induced loss
shows that a small temperature change of only 20 ◦C (owing to the use of
unforced air cooling) can result in an increase of the rate parameter (1/τ )
by almost 40% in comparison to a measurement performed at the same
pump power but using the isothermal bath.
This study illustrates the importance of maintaining the temperature
constant during the experiments. It can also be concluded that the isother-
mal bath is an effective method of maintaining the fiber temperature con-
stant at low and at elevated temperatures. Thereby, by eliminating the
uncertainties in changing of the temperature, this method can be used
to accurately determine the temperature dependence of photodarkening,
and the ion dependence. Additionally, the isothermal bath approach can
be especially useful when studying photo-bleaching processes due to the
necessity of discriminating between thermal and photo-bleaching effects
during the characterization.
53

The role of temperature in the photodarkening-induced loss
54

6. Photodarkening- and thermalbleaching-induced refractive indexchange
The fiber core refractive index change (RIC) induced by photodarkening
can be theoretically determined by the well-known Kramers-Krönig re-
lations (KKR). However, an appropriate implementation of these rela-
tions requires an accurate measurement of the photodarkening spectrum,
which is not straightforward given that instruments that cover a spectral
range from NIR to deep into the UV are not commonly available. Ad-
ditionally, the formation of color centers entails an atomic relaxation in
the defect site taking place during the trapping of an electron or a hole
[93]. This relaxation may imply an increase in the volume of the mate-
rial, which may generate an additional RIC. Therefore, a direct measure-
ment approach is much more preferable in studying the RIC induced by
photodarkening, and also by thermal bleaching.
Calculations of the RIC based on the measurement of the photodarkening-
induced loss spectrum indicated that the magnitude of the change ex-
pected is relatively small, Δn about 1·10−5 at 1080 nm. Hence, interfer-
ometric methods have to be used to achieve sufficient resolution. Fotiadi
et al. used a Mach-Zehnder fiber interferometer to quantify the RIC in
single-mode Yb-doped fibers induced by population inversion [139]. In
that case, an Yb-doped fiber sample of 2 m was included in one arm of
the interferometer and it was core pumped at 980 nm (145 mW) with a
short pulse of 2.5 ms. A rapid phase shift at the output signal of up to
4π rad was accurately detected at 1550 nm. However, photodarkening
is a much slower effect and Mach-Zehnder fiber interferometers are not
suitable for long-term measurements because they have separate inter-
ference arms with relatively long lengths, which make them susceptible
to environmental perturbations, e.g., temperature variations and bend-
ing of the fiber, over a long period of time. Instead, in Publication V the
photodarkening induced RIC was studied by using a simple and stable
55

Photodarkening- and thermal bleaching-induced refractive index change
modal interference method [140] that could be easily integrated in the
photodarkening and thermal bleaching setup.
6.1 Measurement method
The modal interferometer was formed by splicing the Yb-doped fiber sam-
ple in the photodarkening setup with intentional core misalignment, as
illustrated in Fig. 6.1. This method was proposed earlier in [140] and was
used for measuring the RIC caused by UV irradiation [141].
Figure 6.1: Misaligned splices for modal interference.
The power in the LP01 mode that propagates in the input fiber couples
both to the LP01 and the LP11 mode at the first misalignment. The two
modes then propagate in the active fiber with a different propagation con-
stant, which leads to a phase mismatch. The interference then occurs at
the second splice when a fraction of the power of the LP11 mode couples
back to the LP01 mode of the output fiber. The stability of the interfer-
ometer is high as a consequence of the two modes sharing a short com-
mon interfering arm. This makes the method suitable for investigating
the photodarkening induced RIC for a long duration. The fringe phase is
given by φ = (β1 − β2)l, where β1 and β2 are the propagation constants
of LP01 and LP11 modes, respectively, and l is the length of the Yb-doped
fiber sample. Photodarkening affects the doped core uniformly, generat-
ing a small RIC (ΔnPD), with respect to the fiber sample in pristine state.
Thus, the modified propagation constants of the LP01 and the LP11 modes
are given by [142]
β′i = βi +
2π
ληiΔnPD, (i = 1, 2) (6.1)
where ηi (i = 1, 2) are the fractions of the power that propagate in the
core as the LP01 and LP11 modes (η1 ∼ 0.78, and η1 ∼ 0.1 in the spectral
56
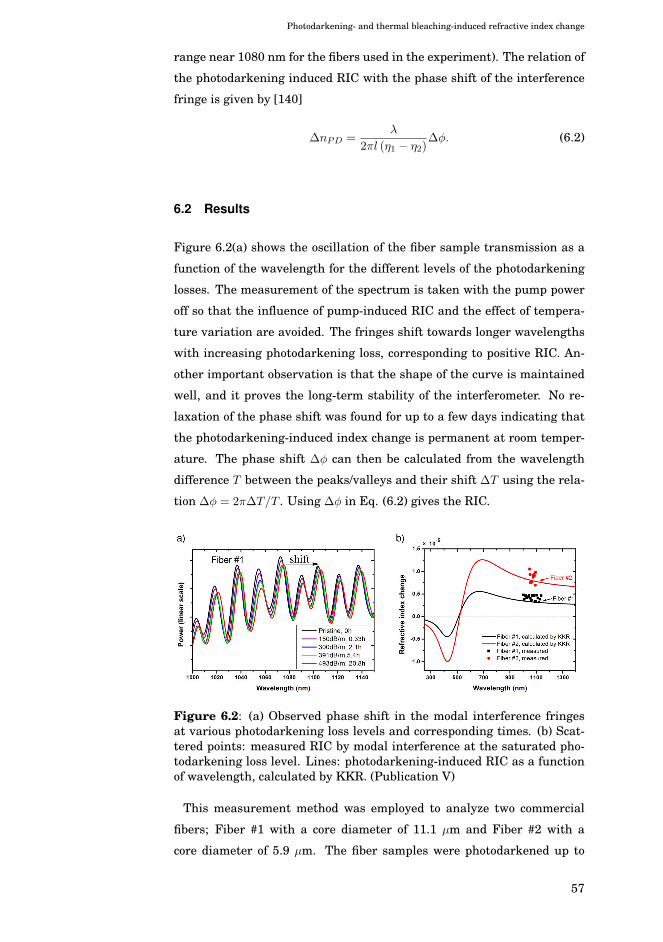
Photodarkening- and thermal bleaching-induced refractive index change
range near 1080 nm for the fibers used in the experiment). The relation of
the photodarkening induced RIC with the phase shift of the interference
fringe is given by [140]
ΔnPD =λ
2πl (η1 − η2)Δφ. (6.2)
6.2 Results
Figure 6.2(a) shows the oscillation of the fiber sample transmission as a
function of the wavelength for the different levels of the photodarkening
losses. The measurement of the spectrum is taken with the pump power
off so that the influence of pump-induced RIC and the effect of tempera-
ture variation are avoided. The fringes shift towards longer wavelengths
with increasing photodarkening loss, corresponding to positive RIC. An-
other important observation is that the shape of the curve is maintained
well, and it proves the long-term stability of the interferometer. No re-
laxation of the phase shift was found for up to a few days indicating that
the photodarkening-induced index change is permanent at room temper-
ature. The phase shift Δφ can then be calculated from the wavelength
difference T between the peaks/valleys and their shift ΔT using the rela-
tion Δφ = 2πΔT/T . Using Δφ in Eq. (6.2) gives the RIC.
Figure 6.2: (a) Observed phase shift in the modal interference fringesat various photodarkening loss levels and corresponding times. (b) Scat-tered points: measured RIC by modal interference at the saturated pho-todarkening loss level. Lines: photodarkening-induced RIC as a functionof wavelength, calculated by KKR. (Publication V)
This measurement method was employed to analyze two commercial
fibers; Fiber #1 with a core diameter of 11.1 μm and Fiber #2 with a
core diameter of 5.9 μm. The fiber samples were photodarkened up to
57
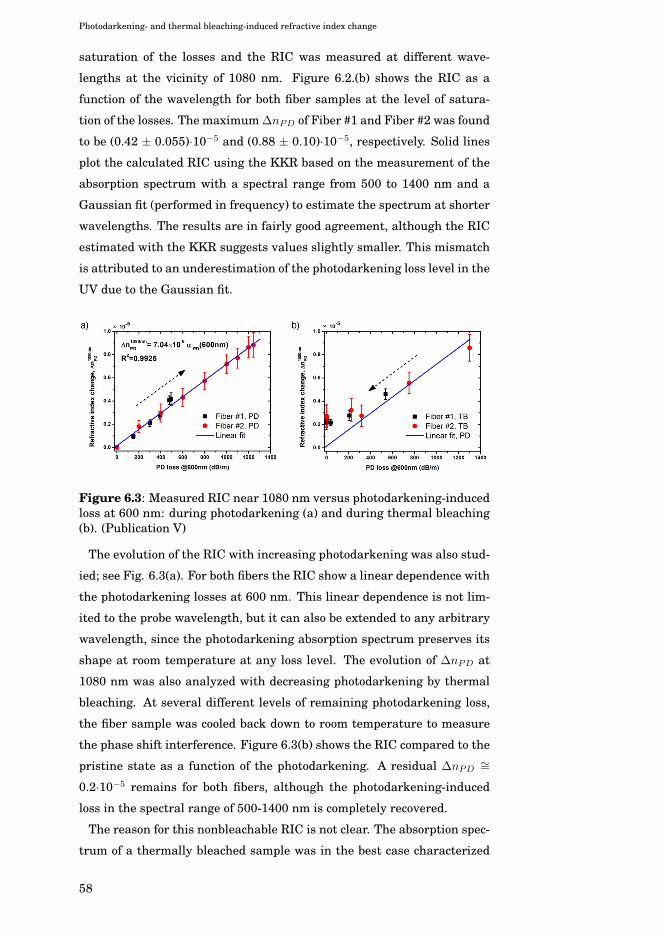
Photodarkening- and thermal bleaching-induced refractive index change
saturation of the losses and the RIC was measured at different wave-
lengths at the vicinity of 1080 nm. Figure 6.2.(b) shows the RIC as a
function of the wavelength for both fiber samples at the level of satura-
tion of the losses. The maximum ΔnPD of Fiber #1 and Fiber #2 was found
to be (0.42 ± 0.055)·10−5 and (0.88 ± 0.10)·10−5, respectively. Solid lines
plot the calculated RIC using the KKR based on the measurement of the
absorption spectrum with a spectral range from 500 to 1400 nm and a
Gaussian fit (performed in frequency) to estimate the spectrum at shorter
wavelengths. The results are in fairly good agreement, although the RIC
estimated with the KKR suggests values slightly smaller. This mismatch
is attributed to an underestimation of the photodarkening loss level in the
UV due to the Gaussian fit.
Figure 6.3: Measured RIC near 1080 nm versus photodarkening-inducedloss at 600 nm: during photodarkening (a) and during thermal bleaching(b). (Publication V)
The evolution of the RIC with increasing photodarkening was also stud-
ied; see Fig. 6.3(a). For both fibers the RIC show a linear dependence with
the photodarkening losses at 600 nm. This linear dependence is not lim-
ited to the probe wavelength, but it can also be extended to any arbitrary
wavelength, since the photodarkening absorption spectrum preserves its
shape at room temperature at any loss level. The evolution of ΔnPD at
1080 nm was also analyzed with decreasing photodarkening by thermal
bleaching. At several different levels of remaining photodarkening loss,
the fiber sample was cooled back down to room temperature to measure
the phase shift interference. Figure 6.3(b) shows the RIC compared to the
pristine state as a function of the photodarkening. A residual ΔnPD∼=
0.2·10−5 remains for both fibers, although the photodarkening-induced
loss in the spectral range of 500-1400 nm is completely recovered.
The reason for this nonbleachable RIC is not clear. The absorption spec-
trum of a thermally bleached sample was in the best case characterized
58

Photodarkening- and thermal bleaching-induced refractive index change
in a spectral range from 400 to 1400 nm. Therefore, the existence of non-
bleached absorption peaks located deep in the UV band generated by an-
other defect type cannot be ruled out. Upon using higher bleaching tem-
peratures above 650 ◦C, e.g. 800 ◦C, a much higher RIC was observed,
indicating that permanent structural changes in the host glass were cre-
ated. Moreover, the repeatability study in section 4.3 indicated that photo-
darkening measurements are not affected by the thermal bleaching, sug-
gesting that all the trapped charges are restored after thermal bleaching.
A more probable possibility is that the residual RIC could be caused by
a structural change in the host glass caused by the elevated temperature
at 650 ◦C, in a similar way, but in a much lesser effect as it was observed
when using 800 ◦C. In this case, it is interesting to observe that the mag-
nitude of the residual RIC is similar for the two fiber samples, although
the initial absolute levels of photodarkening losses were very different.
59

Photodarkening- and thermal bleaching-induced refractive index change
60

7. Fabrication of Yb-doped fibers withatomic layer deposition method
In Publication VI, a new all-vapor phase fabrication method for producing
Yb-doped fibers was implemented. This method combines the well estab-
lished modified chemical vapor deposition (MCVD) technique with atomic
layer deposition (ALD). ALD enables coating of complex shapes and even
porous structures with high aspect ratio. In this fabrication process, ALD
was used to introduce the dopants in the porous soot material.
The next generation of LMA fiber lasers requires further improvement
in terms of doping concentration, its uniformity, and accuracy in control
of dopant and refractive index profiles while maintaining low background
losses. The fabrication method presented in Publication VI can poten-
tially result in an integrated ALD-MCVD system enabling accurate de-
position/doping of tens of core layers that could allow the engineering of
complex doping and refractive index profiles.
7.1 Fabrication process
The fabrication process of the ALD-MCVD preform entails three fabrica-
tion phases as described in Fig. 7.1. In the first phase, a porous SiO2 is de-
posited inside a silica tube using a conventional MCVD-system (Nextrom
OFC12). In this process, the gaseous SiCl4 and O2 are passed through
the rotating silica tube and are heated by an external oxygen-hydrogen
burner that traverses slowly along the rotating tube.
In the second phase, the MCVD-soot is transferred to a separate ALD
equipment for doping with Yb2O3 and Al2O3. The soot-preform is posi-
tioned inside an in-house fabricated tube reactor for ensuring that the
gas flow of precursors is well directed inside the soot-preform and that the
purging of non-reacted chemicals is optimum. In this phase, the porous
soot surface is coated with thin films of Yb2O3 and Al2O3.
61

Fabrication of Yb-doped fibers with atomic layer deposition method
Finally, in a third phase the soot-preform is transferred back to the
MCVD-system, where the porous soot is, first, dried from adsorbed wa-
ter and, second, sintered at a high temperature to form a transparent
glass. After that, the soot-preform is collapsed into a solid rod and it is
drawn into a fiber.
Figure 7.1: Phases of the fabrication process of an ALD-MCVD soot pre-form.
7.2 Doping by atomic layer deposition
The ALD process is a gas-phase vapor deposition process where the reac-
tants are sequentially pulsed on the substrate surface to form a thin film
of less than a monolayer thickness per one cycle [143, 144]. In ALD, the
substrate is typically placed inside a chamber where it operates in vac-
uum. Before the ALD process starts, the soot-preform is stabilized to a
given temperature. An ALD cycle can be divided into four steps:
Step 1. The first precursor (reactant A) is pulsed on the substrate to form
a saturated layer by reacting with the soot surface.
Step 2. The continuous flow of nitrogen gas purges out the excess of pre-
cursor and reaction by-products.
Step 3. The soot surface is exposed to the second precursor (reactant B),
which reacts with the first precursor as a self-terminating process.
Step 4. The excess precursor and reaction by-products are purged out by
the nitrogen flow.
Figure 7.2 illustrates the steps of an ALD cycle. The gas reactants are
pulsed separately into the chamber so that they do not get in contact in
the gas phase. Therefore, the reaction can only occur on the surface. One
reaction cycle deposits less than a monolayer thickness of material, which
62

Fabrication of Yb-doped fibers with atomic layer deposition method
allows precise thickness control. Nitrogen is used as a carrier of the pre-
cursors and as a purging gas between precursors pulses. The ytterbium
and oxygen precursors used are β-diketonate Yb(thd)3 and ozone O3, re-
spectively. Furthermore, the aluminum and oxygen precursors used are
Al(CH3)3 and ozone O3 [145].
Figure 7.2: ALD reaction cycle steps. In Yb2O3 deposition, reactant A isYb(thd)3 and reactant B is O3. In Al2O3 deposition, reactant A is Al(CH3)3and reactant B is O3.
The self-terminating aspect of the reaction enables coating of extremely
high aspect ratio substrates such as the porous SiO2 layer of the soot-
preform [146]. In this case, the method of pulsing the precursors in steps
1 and 3 (see Fig. 7.2) is divided into two sub-steps (i.e., a micro-pulse and
a micro-purge step) that are repeated hundreds of times. This approach
is necessary to allow the penetration of the reactants at the pores located
deep inside the substrate [Publication VI]. The distribution of the dopants
in the porous soot layer was analyzed by an Scanning Electron Microscope
(SEM) equipped with an Energy Dispersive Spectrometer (EDS) in the
direction transversal to the soot preform length. The results revealed the
ALD recipe reported in [Publication VI] was capable of doping the full
depth of a 320 μm thick silica soot layer.
63

Fabrication of Yb-doped fibers with atomic layer deposition method
7.3 Fiber results
The presented manufacturing approach was used to fabricate a double
cladding fiber with core and cladding dimensions of 18 μm and 125 μm,
respectively, and a total length of 1 km. The resultant fiber had a core
NA that varied from 0.07 to 0.08, and a background attenuation of about
20 dB/km at 1200 nm. Using the cut-back method, the Yb absorption was
determined to be 107 dB/m at 920 nm, and showed an excellent uniformity
along the 1km-long fiber, resulting in a maximum variation of 4% from its
average value.
Moreover, the photodarkening propensity of the ALD-fiber was charac-
terized as a function of the Al concentration, using the undesired decrease
in the Al-concentration along the fiber. The distortion in the Al-doping
was caused by small leakages of ambient air into the ozone line, and was
fixed later [Publication VI]. Fiber samples of 2 cm length were cut out at
different fiber positions and were cladding pumped with 10 W of pump
power at 915 nm (inversion of 0.70) during 40 hours. Figure 7.3(a) shows
the photodarkening losses after 40 hours of pumping in dB/m versus the
Al concentration in atomic%. The plot can be fitted approximately by a lin-
ear curve, indicating that the concentration of defects can be reduced al-
most linearly in relation with the Al content. In a previous study, Jetschke
et al. analyzed the photodarkening propensity on a series of fabricated
fibers with a variable concentration of Al2O3 and a constant amount of
Yb2O3 (about 0.45 mol%) and P2O5 (0.5 mol%) [128]. In this case, the
photodarkening saturation loss level also decreased linearly with the Al
content, clearly in line with the results in Fig. 7.3(a).
A comparison in terms of photodarkening between the MCVD-ALD fiber
and a MCVD-solution doped fiber was performed. An MCVD-solution
doped fiber with core and cladding diameters of 20 μm and 140 μm was
prepared following the same MCVD recipe and same collapsing process
that were used in the preparation of the ALD fiber. The fiber parameters
and the measurement conditions are summarized in Table 7.1. A direct
comparison of photodarkening propensity required adjusting the pump
power to reach a similar density of the excited Yb ions ([Yb*]), i.e., the
product of the density of Yb-ions and the population inversion, resulting
in a very similar radial and longitudinal profile distribution. The results
in Fig. 7.3(b) clearly show that the ALD-doped fiber suffers from less
photodarkening in comparison to the fiber doped with solution doping. It
64

Fabrication of Yb-doped fibers with atomic layer deposition method
should also be noted that the Al/Yb concentrations ratio is lower in the
ALD fiber (see Table 7.1). Therefore, the improved photodarkening resis-
tance of the ALD-fiber compared to the solution doped-fiber is hypothe-
sized to result as a consequence of a reduction in the Yb-ion clustering,
due to the homogeneous Yb-ion incorporation by the ALD method before
sintering and collapsing.
Figure 7.3: (a) The absorption coefficient change (ΔαPD) at 600 nm af-ter 40 hours of pumping is plotted versus the Al content expressed inatomic%. (b) Photodarkening benchmarking between an ALD-doped fiberand an MCVD-solution doping fiber with similar doping. [Yb*] is tunedto be approximately the same. Photodarkening measurements were fittedby a stretched exponential function. (Publication VI)
Table 7.1: Fiber parameters and measurement conditions of the photo-darkening benchmarking
The different methods that have been used to reduce the effect of pho-
todarkening are usually based on increasing the solubility of the Yb-ions
in the host glass by adding co-dopants (see section 4.6). However, these
methods have typically downside effects such us reduction of the Yb ab-
sorption and emission cross sections, increasing the fiber background at-
tenuation or uncontrollably increasing the refractive index of the fiber.
This highlights the importance of developing a method that increases the
homogeneity of the doped material by means of improving the control and
distribution homogeneity of the RE-ions. The ALD-doping method showed
to have the potential to considerably promote diffusion of the RE-dopants
and therefore reduce the formation of clusters.
65

Fabrication of Yb-doped fibers with atomic layer deposition method
In addition, the ALD fiber was tested in a fiber laser configuration. Mea-
surements of the slope efficiency of a cladding-pumped fiber laser were
used as a method to evaluate the laser efficiency of the fiber. A schematic
of the fiber laser employed and the measured results are presented in
the Fig. 7.4. A good slope efficiency of 80% was observed with the laser
operating at 1080 nm and a pump wavelength of 915 nm.
Figure 7.4: (a) Fiber laser configuration (b) Laser output power as a func-tion of the absorbed pump power. Inset: laser spectrum for a laser outputpower of 6.5 W. (Publication VI)
7.4 Future work
The benefits in terms of reduction of Yb-ion clustering attributed to the
ALD method in comparison to the standard solution doping method needs
to be further studied. The direct relation between photodarkening and Yb
clustering has been clearly shown [92]. However, a more direct method
to determine the Yb-ions clustering (e.g. by measuring the cooperative
luminescence [74, 76]) in a series of ALD and solution doped fibers with
different dopant concentrations would be highly valuable and could con-
firm the results reported in [Publication VI].
The potential of the ALD method for soot doping encourages the devel-
opment of a fabrication process that integrates ALD with the MCVD sys-
tem. This system would allow several core layer deposition/doping cycles
without the need to remove the preform from the MCVD system. This,
in turn, would enable accurate in situ doping with significantly reduced
fabrication time.
66
8. Summary and outlook
The main goal of this study was to measure photodarkening in Yb-doped
silica fibers and to develop repeatable and accurate characterization meth-
ods to improve the understanding of the driving mechanism behind the
photodarkening effect. An additional goal was to develop a novel fabri-
cation method to produce advanced Yb-doped silica fibers with improved
core material properties suitable for high power amplification.
A measurement method was developed to characterize both photodark-
ening and thermal bleaching [Publication IV]. This measurement method
enables carrying out multiple measurements over the same sample, and
thus eliminates uncertainties related to a change in the sample. A sys-
tematic study with several subsequent photodarkening measurements re-
vealed only small differences in the derived parameters without any rec-
ognizable trend of drift, thus validating this approach.
In Publication II, the activation energy associated with the thermal re-
covery of photodarkening-induced losses was determined using the de-
marcation energy approach. The energy distribution of the photodarken-
ing defects was found to be well described by a Gaussian-shape curve with
a peak located at 1.32 eV and a FWHM of ∼0.31 eV. In this case, a com-
plete recovery of the photodarkening losses occurred at energies ≥1.9 eV,
which can be achieved with e.g. a fiber temperature of 600 ◦C for 47 s.
However, thermal bleaching can also occur at much lower temperature,
e.g. at 50 ◦C (although at much slower rate), which entails the necessity
of performing the photodarkening measurements at temperatures close to
the room temperature (or cooler) to avoid simultaneous recovery of defects
that can complicate the interpretation of the data.
In Publication I, two new phenomena related to photodarkening were
found, namely the post-irradiation heat-induced darkening and spectral
broadening. Heat-induced darkening manifests as a net increase of loss
67

Summary and outlook
with increasing temperature prior to the initiation of thermal recovery.
Similarities in the spectral shape of the induced losses indicated that the
heat induced loss originates from the same type of defects that are created
through pump irradiation. Additionally, the photodarkening-induced ab-
sorption spectrum was observed to exhibit a heat-induced spectral broad-
ening, and the magnitude of the associated change in loss was shown to
be proportional to | λ − λ0 | in the 550-850 nm spectral range, where
λ0 is the least temperature dependent wavelength (e.g. ∼600 nm for the
fiber studied) [Publication I]. Furthermore, a measurement of the spectral
broadening conducted at the pump wavelength (915 nm) in a photodark-
ened fiber was presented in Publication III. A noteworthy increase of loss
was detected even at moderate temperatures. For the studied fiber, a pho-
todarkened fiber operating at 100 ◦C exhibited an increase in the loss level
of >50% with respect to the loss level at room temperature.
A method to quantify the fiber temperature during the course of pho-
todarkening measurements was established in Publication III. The fiber
temperature measured by a high resolution thermal camera was observed
to increase with progressive photodarkening and reached up to 120 ◦C
upon saturation of photodarkening. Furthermore, a model was imple-
mented that took into account the combined effects of the Yb-silica quan-
tum defect, the temperature dependence of the Yb-absorption cross sec-
tion, and photodarkening-induced loss at 915 nm. This model accurately
parameterized the temperature increase of a photodarkened fiber as a
function of the pump power from room temperature to 120 ◦C. The ob-
served thermal loading effect can progressively activate the effects of heat-
induce darkening, spectral broadening and thermal bleaching during a
photodarkening measurement, and consequently, exert a significant in-
fluence on photodarkening kinetics.
The relation of the inversion with the fiber temperature was analyzed
using a simple model that takes into account the temperature dependence
of the Yb-absorption cross section and the upper state lifetime [Publica-
tion IV]. The inversion in a fiber pumped with 10.5 W was found to deplete
about 15% when the fiber temperature was increased from room temper-
ature to 300 ◦C. The influence of the fiber temperature on the inversion is
significant and should be considered when studying the thermal charac-
teristics of the photodarkening parameters within a broad range of tem-
peratures.
The aforementioned thermal effects illustrate the importance of accu-
68

Summary and outlook
rately controlling the fiber core temperature during photodarkening mea-
surements [Publication IV]. A cooling method based on a forced air cooling
system was employed to reduce the influence of temperature on the photo-
darkening measurement due to the absorbed pump power by photodark-
ening defects. By using this method, the photodarkening rate showed to
follow a power law dependency of 4.5 on the inversion (ion dependence),
suggesting that an average of 4 to 5 ions are involved in the process of
creation of a color center. A more sophisticated setup based on a bath of a
liquid metal alloy (Galinstan) was proposed to accurately control the fiber
temperature, and based on simulations it was shown to be more efficient
on extracting the thermal load compared to forced air cooling or using a
water bath [Publication IV].
A modal interference method was used to measure and analyze the re-
fractive index change induced by photodarkening and thermal bleaching
in Yb-doped fibers [Publication V]. The photodarkening induced refractive
index change was found to be positive and in the order of 10−5 at around
1080 nm in a sample photodarkened up to the saturation level. By using
thermal bleaching, the increase of refractive index was partially erased,
leaving a residual index change. The resulting increase of refractive index
caused by photodarkening may induce mode distortion or phase retarda-
tion, which can be a concern in some applications. Moreover, it can also
have an influence on the characteristics of fiber Bragg gratings inscribed
in Yb-doped fibers.
Finally, in Publication VI, a new all-vapor phase fabrication method for
producing Yb-doped fibers was implemented. This method combines the
well established modified chemical vapor deposition (MCVD) technique
with the ability of atomic layer deposition (ALD) to coat porous struc-
tures. A large mode area (LMA) Yb-doped aluminosilicate fiber was fab-
ricated, showing uniform Yb-doping along the fiber axis, high lasing effi-
ciency (with a characteristic slope efficiency of 80%), and low background
losses. Moreover, photodarkening measurements showed less photodark-
ening propensity compared to a fiber with similar doping fabricated by
the MCVD-solution doping technique with the same MCVD recipe. The
versatility of the ALD method enables the development of a fabrication
process that integrates ALD with the MCVD system allowing accurate
in-situ doping with significantly reduced time compared to other methods
such as solution doping.
69

Summary and outlook
70

Bibliography
[1] P. Becker, A. Olsson, and J. Simpson, Erbium-doped fiber amplifiers: fun-damentals and technology. Academic press, 1999.
[2] G. BuAbbud, “High power fiber lasers and amplifiers for applicationsin telecommunications,” in Optical Fiber Communication (OFC), collo-cated National Fiber Optic Engineers Conference, 2010 Conference on(OFC/NFOEC), march 2010, p. 1.
[3] I. P. Corporation. [Online]. Available: http://www.ipgphotonics.com
[4] J. Hazey, V. Narula, D. Renton, K. Reavis, C. Paul, K. Hinshaw, P. Mus-carella, E. Ellison, and W. Melvin, “Natural-orifice transgastric endo-scopic peritoneoscopy in humans: initial clinical trial,” Surgical endoscopy,vol. 22, no. 1, pp. 16–20, 2008.
[5] J. Kourambas, F. Delvecchio, and G. Preminger, “Low-power holmium laserfor the management of urinary tract calculi, strictures, and tumors,” Jour-nal of endourology, vol. 15, no. 5, pp. 529–532, 2001.
[6] S. Jackson, “Towards high-power mid-infrared emission from a fibre laser,”Nature Photonics, vol. 6, no. 7, pp. 423–431, 2012.
[7] E. Snitzer, “Proposed fiber cavities for optical masers,” Journal of AppliedPhysics, vol. 32, no. 1, pp. 36–39, 1961.
[8] ——, “Optical maser action of Nd3+ in a barium crown glass,” Phys. Rev.Lett., vol. 7, pp. 444–446, Dec 1961.
[9] A. Schawlow and C. Townes, “Infrared and optical masers,” Physical Re-view, vol. 112, no. 6, p. 1940, 1958.
[10] T. Maiman, “Stimulated optical radiation in ruby,” 1960.
[11] C. Koester and E. Snitzer, “Amplification in a fiber laser,” Applied Optics,vol. 3, no. 10, pp. 1182–1186, 1964.
[12] T. Miya, Y. Terunuma, T. Hosaka, and T. Miyashita, “Ultimate low-losssingle-mode fibre at 1.55 μm,” Electronics Letters, vol. 15, no. 4, pp. 106–108, 1979.
[13] S. Poole, D. Payne, and M. Fermann, “Fabrication of low-loss optical fibrescontaining rare-earth ions,” Electronics Letters, vol. 21, no. 17, pp. 737–738, 1985.
71

Bibliography
[14] S. Poole, D. Payne, R. Mears, M. Fermann, and R. Laming, “Fabricationand characterization of low-loss optical fibers containing rare-earth ions,”Lightwave Technology, Journal of, vol. 4, no. 7, pp. 870–876, 1986.
[15] J. Townsend, S. Poole, and D. Payne, “Solution-doping technique for fabri-cation of rare-earth-doped optical fibres,” Electronics letters, vol. 23, no. 7,pp. 329–331, 1987.
[16] R. Mears, L. Reekie, I. Jauncey, and D. Payne, “Low-noise erbium-dopedfibre amplifier operating at 1.54 μm,” Electronics Letters, vol. 23, no. 19,pp. 1026–1028, 1987.
[17] E. Desurvire, J. Simpson, and P. Becker, “High-gain erbium-dopedtraveling-wave fiber amplifier,” Optics Letters, vol. 12, no. 11, pp. 888–890,1987.
[18] A. Tünnermann, T. Schreiber, F. Röser, A. Liem, S. Höfer, H. Zellmer,S. Nolte, and J. Limpert, “The renaissance and bright future of fibrelasers,” Journal of Physics B: Atomic, Molecular and Optical Physics,vol. 38, no. 9, p. S681, 2005.
[19] Y. Jeong, J. Sahu, D. Payne, and J. Nilsson, “Ytterbium-doped large-corefiber laser with 1.36 kW continuous-wave output power,” Optics Express,vol. 12, no. 25, pp. 6088–6092, 2004.
[20] D. Kliner, F. Di Teodoro, J. Koplow, S. Moore, and A. Smith, “Efficient sec-ond, third, fourth, and fifth harmonic generation of a Yb-doped fiber am-plifier,” Optics communications, vol. 210, no. 3, pp. 393–398, 2002.
[21] Y. Jeong, S. Yoo, C. Coderaard, J. Nilsson, J. Sahu, D. Payne, R. Horley,P. Turner, L. Hickey, A. Harker et al., “Erbium: ytterbium codoped large-core fiber laser with 297-W continuous-wave output power,” Selected Topicsin Quantum Electronics, IEEE Journal of, vol. 13, no. 3, pp. 573–579, 2007.
[22] T. Ehrenreich, R. Leveille, I. Majid, K. Tankala, G. Rines, and P. Moulton,“1-kw, all-glass Tm: fiber laser,” in Proc. SPIE, vol. 7580, 2010, pp. 7580–112.
[23] V. Fomin, M. Abramov, A. Ferin, A. Abramov, D. Mochalov, N. Platonov, andV. Gapontsev, “10 kW single-mode fiber laser,” in SyTu-1.3, Symposiumon High-Power Fiber Lasers, 14th International Conference, Laser Optics,2010.
[24] D. Brown and H. Hoffman, “Thermal, stress, and thermo-optic effects inhigh average power double-clad silica fiber lasers,” Quantum Electronics,IEEE Journal of, vol. 37, no. 2, pp. 207–217, 2001.
[25] D. Richardson, J. Nilsson, and W. Clarkson, “High power fiber lasers: cur-rent status and future perspectives [invited],” JOSA B, vol. 27, no. 11, pp.B63–B92, 2010.
[26] R. Paschotta, J. Nilsson, P. Barber, J. Caplen, A. Tropper, and D. Hanna,“Lifetime quenching in yb-doped fibres,” Optics Communications, vol. 136,no. 5, pp. 375–378, 1997.
[27] J. J. Koponen, M. J. Söderlund, S. K. T. Tammela, and H. Po, “Photodark-ening in ytterbium-doped silica fibers,” pp. 599 008–599 008–10, 2005.
72

Bibliography
[28] E. Snitzer, H. Po, F. Hakimi, R. Tumminelli, and B. McCollum, “Doubleclad, offset core Nd fiber laser,” in Optical Fiber Sensors. Optical Societyof America, 1988.
[29] G. Agrawal, “Nonlinear fiber optics,” Nonlinear Science at the Dawn of the21st Century, pp. 195–211, 2000.
[30] D. DiGiovanni and A. Stentz, “Tapered fiber bundles for coupling lightinto and out of cladding-pumped fiber devices,” Jan. 26 1999, uS Patent5,864,644.
[31] R. Mears, L. Reekie, S. Poole, and D. Payne, “Neodymium-doped silicasingle-mode fibre lasers,” Electronics letters, vol. 21, no. 17, pp. 738–740,1985.
[32] D. Soh, S. Yoo, J. Nilsson, J. Sahu, K. Oh, S. Baek, Y. Jeong, C. Codemard,P. Dupriez, J. Kim et al., “Neodymium-doped cladding-pumped aluminosil-icate fiber laser tunable in the 0.9 μm wavelength range,” Quantum Elec-tronics, IEEE Journal of, vol. 40, no. 9, pp. 1275–1282, 2004.
[33] W. Koechner, Solid-state laser engineering. Springer, 2006, vol. 1.
[34] E. Snitzer, H. Po, F. Hakimi, R. Tumminelli et al., “Erbium fiber laseramplifier at 1.55 μm with pump at 1.49 μm and Yb sensitized Er oscillator,”in Optical Fiber Communication Conference. Optical Society of America,1988.
[35] M. Nakazawa, Y. Kimura, and K. Suzuki, “Efficient Er3+-doped opticalfiber amplifier pumped by a 1.48 μm InGaAsP laser diode,” Applied PhysicsLetters, vol. 54, no. 4, pp. 295–297, 1989.
[36] E. Snitzer and R. Woodcock, “Yb3+ - Er3+ glass laser,” Applied PhysicsLetters, vol. 6, no. 3, pp. 45–46, 1965.
[37] J. Wu, Z. Yao, J. Zong, and S. Jiang, “Highly efficient high-power thulium-doped germanate glass fiber laser,” Optics letters, vol. 32, no. 6, pp. 638–640, 2007.
[38] K. Lu and N. Dutta, “Spectroscopic properties of Yb-doped silica glass,”Journal of applied physics, vol. 91, no. 2, pp. 576–581, 2002.
[39] H. Pask, R. Carman, D. Hanna, A. Tropper, C. Mackechnie, P. Barber, andJ. Dawes, “Ytterbium-doped silica fiber lasers: versatile sources for the 1-1.2 μm region,” Selected Topics in Quantum Electronics, IEEE Journal of,vol. 1, no. 1, pp. 2–13, 1995.
[40] E. Desurvire, Erbium-doped fiber amplifiers: principles and applications.Wiley New York, 1994, vol. 19.
[41] R. Paschotta, J. Nilsson, A. Tropper, and D. Hanna, “Ytterbium-dopedfiber amplifiers,” Quantum Electronics, IEEE Journal of, vol. 33, no. 7,pp. 1049–1056, 1997.
[42] C. Giles and E. Desurvire, “Modeling erbium-doped fiber amplifiers,”Lightwave Technology, Journal of, vol. 9, no. 2, pp. 271–283, 1991.
[43] L. Zenteno, “High-power double-clad fiber lasers,” Lightwave Technology,Journal of, vol. 11, no. 9, pp. 1435–1446, 1993.
73

Bibliography
[44] J. Koponen, M. Laurila, and M. Hotoleanu, “Inversion behavior in core-andcladding-pumped Yb-doped fiber photodarkening measurements,” Appliedoptics, vol. 47, no. 25, pp. 4522–4528, 2008.
[45] J. Koponen, M. Söderlund, H. Hoffman, D. Kliner, J. Koplow, and M. Ho-toleanu, “Photodarkening rate in Yb-doped silica fibers,” Applied optics,vol. 47, no. 9, pp. 1247–1256, 2008.
[46] J. Limpert, F. Roser, S. Klingebiel, T. Schreiber, C. Wirth, T. Peschel,R. Eberhardt, and A. Tiinnermann, “The rising power of fiber lasers andamplifiers,” Selected Topics in Quantum Electronics, IEEE Journal of,vol. 13, no. 3, pp. 537–545, 2007.
[47] V. Kovalev and R. Harrison, “Suppression of stimulated brillouin scatter-ing in high-power single-frequency fiber amplifiers,” Optics letters, vol. 31,no. 2, pp. 161–163, 2006.
[48] L. Zenteno, J. Wang, D. Walton, B. Ruffin, M. Li, S. Gray, A. Crowley, andX. Chen, “Suppression of Raman gain in single-transverse-mode dual-hole-assisted fiber,” Optics express, vol. 13, no. 22, pp. 8921–8926, 2005.
[49] J. Kim, P. Dupriez, C. Codemard, J. Nilsson, and J. Sahu, “Suppression ofstimulated Raman scattering in a high power Yb-doped fiber amplifier us-ing a W-type core with fundamental mode cut-off,” Optics Express, vol. 14,no. 12, pp. 5103–5113, 2006.
[50] T. Alkeskjold, “Large-mode-area ytterbium-doped fiber amplifier with dis-tributed narrow spectral filtering and reduced bend sensitivity,” Optics Ex-press, vol. 17, no. 19, pp. 16 394–16 405, 2009.
[51] J. Kim, D. Shen, J. Sahu, and W. Clarkson, “Fiber-laser-pumped Er: YAGlasers,” Selected Topics in Quantum Electronics, IEEE Journal of, vol. 15,no. 2, pp. 361–371, 2009.
[52] D. Taverner, D. Richardson, L. Dong, J. Caplen, K. Williams, and R. Penty,“158-μJ pulses from a single-transverse-mode, large-mode-area erbium-doped fiber amplifier,” Optics letters, vol. 22, no. 6, pp. 378–380, 1997.
[53] D. Marcuse, “Field deformation and loss caused by curvature of opticalfibers,” JOSA, vol. 66, no. 4, pp. 311–320, 1976.
[54] J. Sakai and T. Kimura, “Bending loss of propagation modes in arbitrary-index profile optical fibers,” Applied Optics, vol. 17, no. 10, pp. 1499–1506,1978.
[55] J. Koplow, D. Kliner, and L. Goldberg, “Single-mode operation of a coiledmultimode fiber amplifier,” Optics Letters, vol. 25, no. 7, pp. 442–444, 2000.
[56] J. Sousa and O. Okhotnikov, “Multimode Er-doped fiber for single-transverse-mode amplification,” Applied physics letters, vol. 74, no. 11, pp.1528–1530, 1999.
[57] R. Farrow, G. Hadley, D. Kliner, and J. Koplow, “Design of refractive-index and rare-earth-dopant distributions for large-mode-area fibers usedin coiled high-power amplifiers,” in Lasers and Applications in Science andEngineering. International Society for Optics and Photonics, 2007, pp.64 531C–64 531C.
74

Bibliography
[58] J. Marciante, “Gain filtering for single-spatial-mode operation of large-mode-area fiber amplifiers,” Selected Topics in Quantum Electronics, IEEEJournal of, vol. 15, no. 1, pp. 30–36, 2009.
[59] C. Ye, J. Koponen, T. Kokki, J. Montiel i Ponsoda, A. Tervonen, andS. Honkanen, “Near-diffraction-limited output from confined-doped ytter-bium fibre with 41 μm core diameter,” Electronics letters, vol. 47, no. 14,pp. 819–821, 2011.
[60] M. Fermann, “Single-mode excitation of multimode fibers with ultrashortpulses,” Optics Letters, vol. 23, no. 1, pp. 52–54, 1998.
[61] J. Alvarez-Chavez, A. Grudinin, J. Nilsson, P. Turner, and W. Clarkson,“Mode selection in high power cladding pumped fibre lasers with taperedsection,” in Lasers and Electro-Optics, 1999. CLEO’99. Summaries of Pa-pers Presented at the Conference on. IEEE, 1999, pp. 247–248.
[62] A. Galvanauskas, M. Cheng, K. Hou, and K. Liao, “High peak power pulseamplification in large-core Yb-doped fiber amplifiers,” Selected Topics inQuantum Electronics, IEEE Journal of, vol. 13, no. 3, pp. 559–566, 2007.
[63] J. Jasapara, M. Andrejco, A. DeSantolo, A. Yablon, Z. Vrallyay, J. Nichol-son, J. Fini, D. DiGiovanni, C. Headley, E. Monberg et al., “Diffraction-limited fundamental mode operation of core-pumped very-large-mode-areaEr fiber amplifiers,” Selected Topics in Quantum Electronics, IEEE Journalof, vol. 15, no. 1, pp. 3–11, 2009.
[64] L. Dong, J. Li, and X. Peng, “Bend-resistant fundamental mode operationin ytterbium-doped leakage channel fibers with effective areas up to 3160μm2,” Optics Express, vol. 14, no. 24, pp. 11 512–11 519, 2006.
[65] J. Knight, T. Birks, P. Russell, and D. Atkin, “All-silica single-mode opti-cal fiber with photonic crystal cladding,” Optics letters, vol. 21, no. 19, pp.1547–1549, 1996.
[66] T. Birks, J. Knight, and P. Russell, “Endlessly single-mode photonic crystalfiber,” Optics letters, vol. 22, no. 13, pp. 961–963, 1997.
[67] P. Russell, “Photonic crystal fibers,” science, vol. 299, no. 5605, pp. 358–362, 2003.
[68] C. Liu, G. Chang, N. Litchinister, D. Guertin, N. Jacobson, K. Tankala, andA. Galvanauskas, “Chirally coupled core fibers at 1550-nm and 1064-nmfor effectively single-mode core size scaling,” in Conference on Lasers andElectro-Optics. Optical Society of America, 2007.
[69] K. Arai, H. Namikawa, K. Kumata, T. Honda, Y. Ishii, and T. Handa, “Alu-minum or phosphorus co-doping effects on the fluorescence and structuralproperties of neodymium-doped silica glass,” Journal of applied physics,vol. 59, no. 10, pp. 3430–3436, 1986.
[70] G. Vienne, W. Brocklesby, R. Brown, Z. Chen, J. Minelly, J. Roman, andD. Payne, “Role of aluminum in ytterbium-erbium codoped phosphoalumi-nosilicate optical fibers,” Optical Fiber Technology, vol. 2, no. 4, pp. 387–393, 1996.
75

Bibliography
[71] M. Shimizu, M. Yamada, M. Horiguchi, and E. Sugita, “Concentration ef-fect on optical amplification characteristics of Er-doped silica single-modefibers,” Photonics Technology Letters, IEEE, vol. 2, no. 1, pp. 43–45, 1990.
[72] J. Kirchhof, S. Unger, S. Jetschke, A. Schwuchow, M. Leich, and V. Reichel,“Yb-doped silica-based laser fibers: correlation of photodarkening kineticsand related optical properties with the glass composition,” in Proc. of SPIEVol, vol. 7195, 2009, pp. 71 950S–1.
[73] S. Magne, Y. Ouerdane, M. Druetta, J. Goure, P. Ferdinand, and G. Mon-nom, “Cooperative luminescence in an ytterbium-doped silica fibre,” Opticscommunications, vol. 111, no. 3, pp. 310–316, 1994.
[74] B. Schaudel, P. Goldner, M. Prassas, and F. Auzel, “Cooperative lumines-cence as a probe of clustering in yb3+ doped glasses,” Journal of alloys andcompounds, vol. 300, pp. 443–449, 2000.
[75] F. Auzel and P. Goldner, “Towards rare-earth clustering control in dopedglasses,” Optical Materials, vol. 16, no. 1, pp. 93–103, 2001.
[76] H. Gebavi, S. Taccheo, D. Milanese, A. Monteville, O. Le Goffic, D. Landais,D. Mechin, D. Tregoat, B. Cadier, and T. Robin, “Temporal evolution andcorrelation between cooperative luminescence and photodarkening in yt-terbium doped silica fibers,” Optics Express, vol. 19, no. 25, pp. 25 077–25 083, 2011.
[77] NEXTROM. [Online]. Available: http://www.nextrom.com
[78] J. Wang, D. Walton, and L. Zenteno, “All-glass high NA Yb-doped double-clad laser fibres made by outside-vapour deposition,” Electronics Letters,vol. 40, no. 10, pp. 590–592, 2004.
[79] S. Sudo, M. Kawachi, T. Edahiro, T. Izawa, T. Shioda, and H. Gotoh,“Low-OH-content optical fibre fabricated by vapour-phase axial-depositionmethod,” Electronics Letters, vol. 14, no. 17, pp. 534–535, 1978.
[80] S. Tammela, M. Soderlund, J. Koponen, V. Philippov, and P. Stenius, “Thepotential of direct nanoparticle deposition for the next generation of opticalfibers,” in Proceedings of SPIE Photonics West, vol. 6116, 2006, p. 16.
[81] J. Koponen, L. Petit, T. Kokki, V. Aallos, J. Paul, and H. Ihalainen,“Progress in direct nanoparticle deposition for the development of the nextgeneration fiber lasers,” Optical Engineering, vol. 50, no. 11, pp. 111 605–111 605, 2011.
[82] B. Ainslie, “A review of the fabrication and properties of erbium-dopedfibers for optical amplifiers,” Lightwave Technology, Journal of, vol. 9,no. 2, pp. 220–227, 1991.
[83] R. Tumminelli, B. McCollum, and E. Snitzer, “Fabrication of high-concentration rare-earth doped optical fibers using chelates,” LightwaveTechnology, Journal of, vol. 8, no. 11, pp. 1680–1683, 1990.
[84] A. Webb, A. Boyland, R. Standish, S. Yoo, J. Sahu, and D. Payne, “MCVDin-situ solution doping process for the fabrication of complex design largecore rare-earth doped fibers,” Journal of Non-Crystalline Solids, vol. 356,no. 18, pp. 848–851, 2010.
76

Bibliography
[85] S. Tammela, M. Hotoleanu, P. Kiiveri, H. Valkonen, S. Sarkilahti, andK. Janka, “Very short Er-doped silica glass fiber for L-band amplifiers,”in Optical Fiber Communications Conference, 2003. OFC 2003. IEEE,2003, pp. 376–377.
[86] M. Cheng, K. Hou, A. Galvanauskas, D. Engin, R. Changkakoti, andP. Mamidipudi, “High average power generation of single-transverse modeMW-peak power pulses using 80-μm core Yb-doped LMA fibers,” in Lasersand Electro-Optics, 2006 and 2006 Quantum Electronics and Laser ScienceConference. CLEO/QELS 2006. Conference on. IEEE, 2006, pp. 1–2.
[87] A. Boyland, A. Webb, M. Kalita, S. Yoo, C. Codemard, R. Standish, J. Nils-son, and J. Sahu, “Rare earth doped optical fiber fabrication using novelgas phase deposition technique,” in Conference on Lasers and Electro-Optics. Optical Society of America, 2010.
[88] A. Boyland, A. Webb, S. Yoo, F. Mountfort, M. Kalita, R. Standish, J. Sahu,D. Richardson, and D. Payne, “Optical fiber fabrication using novel gas-phase deposition technique,” Journal of Lightwave Technology, vol. 29,no. 6, pp. 912–915, 2011.
[89] E. Sekiya, P. Barua, K. Saito, and A. Ikushima, “Fabrication of Yb-dopedsilica glass through the modification of MCVD process,” Journal of Non-Crystalline Solids, vol. 354, no. 42, pp. 4737–4742, 2008.
[90] J. Koponen, M. Söderlund, H. Hoffman, and S. Tammela, “Measuring pho-todarkening from single-mode ytterbium doped silica fibers,” Opt. Express,vol. 14, no. 24, pp. 11 539–11 544, 2006.
[91] J. Koponen, M. Söderlund, H. Hoffman, D. Kliner, and J. Koplow, “Photo-darkening measurements in large mode area fibers,” in Lasers and Appli-cations in Science and Engineering. International Society for Optics andPhotonics, 2007, pp. 64 531E–64 531E.
[92] B. Morasse, S. Chatigny, É. Gagnon, C. Hovington, J. Martin, andJ. de Sandro, “Low photodarkening single cladding ytterbium fibre am-plifier,” in Lasers and Applications in Science and Engineering. Interna-tional Society for Optics and Photonics, 2007, pp. 64 530H–64 530H.
[93] L. Glebov, “Linear and nonlinear photoionization of silicate glasses,”GLASS SCIENCE AND TECHNOLOGY-FRANKFURT AM MAIN-,vol. 75, pp. 1–6, 2004.
[94] M. Engholm and L. Norin, “Preventing photodarkening in ytterbium-doped high power fiber lasers; correlation to the UV-transparency of thecore glass,” Optics express, vol. 16, no. 2, pp. 1260–1268, 2008.
[95] S. Yoo, C. Basu, A. Boyland, C. Sones, J. Nilsson, J. Sahu, and D. Payne,“Photodarkening in Yb-doped aluminosilicate fibers induced by 488 nmirradiation,” Optics letters, vol. 32, no. 12, pp. 1626–1628, 2007.
[96] K. Mattsson, S. Knudsen, B. Cadier, and T. Robin, “Photo darkening in yt-terbium co-doped silica material,” in Proceedings of SPIE, vol. 6873, 2008,p. 68731C.
77

Bibliography
[97] M. Broer, D. Krol, and D. DiGiovanni, “Highly nonlinear near-resonantphotodarkening in a thulium-doped aluminosilicate glass fiber,” Optics let-ters, vol. 18, no. 10, pp. 799–801, 1993.
[98] M. Broer, R. Cone, and J. Simpson, “Ultraviolet-induced distributed-feedback gratings in Ce3+-doped silica optical fibers,” Optics letters, vol. 16,no. 18, pp. 1391–1393, 1991.
[99] G. Atkins and A. Carter, “Photodarkening in Tb3+-doped phosphosilicateand germanosilicate optical fibers,” Optics letters, vol. 19, no. 12, pp. 874–876, 1994.
[100] E. Behrens, R. Powell, and D. Blackburn, “Characteristics of laser-inducedgratings in Pr3+-and Eu3+-doped silicate glasses,” JOSA B, vol. 7, no. 8,pp. 1437–1444, 1990.
[101] G. Atkins and F. Ouellette, “Reversible photodarkening and bleaching inTb3+-doped optical fibers,” Optics letters, vol. 19, no. 13, pp. 951–953, 1994.
[102] T. Kitabayashi, M. Ikeda, M. Nakai, T. Sakai, K. Himeno, and K. Ohashi,“Population inversion factor dependence of photodarkening of Yb-dopedfibers and its suppression by highly aluminum doping,” in Optical FiberCommunication Conference and Exposition and The National Fiber OpticEngineers Conference. Optical Society of America, 2006, p. OThC5.
[103] A. Shubin, M. Yashkov, M. Melkumov, S. Smirnov, I. Bufetov, and E. Di-anov, “Photodarkening of alumosilicate and phosphosilicate Yb-dopedfibers,” in Lasers and Electro-Optics, 2007 and the International Quan-tum Electronics Conference. CLEOE-IQEC 2007. European Conference on.IEEE, 2007, pp. 1–1.
[104] S. Jetschke, S. Unger, U. Röpke, and J. Kirchhof, “Photodarkening in Ybdoped fibers: experimental evidence of equilibrium states depending onthe pump power,” Optics express, vol. 15, no. 22, pp. 14 838–14 843, 2007.
[105] J. Jasapara, M. Andrejco, D. DiGiovanni, and R. Windeler, “Effect of heatand H2 gas on the photo-darkening of Yb+3 fibers,” in Conference on Lasersand Electro-Optics. Optical Society of America, 2006.
[106] I. Manek-Hönninger, J. Boullet, T. Cardinal, F. Guillen, S. Ermeneux,M. Podgorski, R. Bello Doua, and F. Salin, “Photodarkening and photo-bleaching of an ytterbium-doped silica double-clad LMA fiber,” Optics ex-press, vol. 15, no. 4, pp. 1606–1611, 2007.
[107] A. Guzman Chávez, A. Kir’yanov, Y. Barmenkov, and N. Il’Ichev, “Re-versible photo-darkening and resonant photobleaching of Ytterbium-dopedsilica fiber at in-core 977-nm and 543-nm irradiation,” Laser Physics Let-ters, vol. 4, no. 10, pp. 734–739, 2007.
[108] H. Gebavi, S. Taccheo, D. Tregoat, A. Monteville, and T. Robin, “Pho-tobleaching of photodarkening in ytterbium doped aluminosilicate fiberswith 633 nm irradiation,” Opt. Mater. Express, vol. 2, no. 9, pp. 1286–1291,Sep 2012.
[109] J. Montiel i Ponsoda, M. Söderlund, J. Koplow, J. Koponen, A. Iho, andS. Honkanen, “Combined photodarkening and thermal bleaching measure-ment of an ytterbium-doped fiber,” in SPIE LASE: Lasers and Applications
78

Bibliography
in Science and Engineering. International Society for Optics and Photon-ics, 2009, pp. 71 952D–71 952D.
[110] S. Jetschke and U. Röpke, “Power-law dependence of the photodarkeningrate constant on the inversion in Yb doped fibers,” Optics letters, vol. 34,no. 1, pp. 109–111, 2009.
[111] M. Engholm, L. Norin, and D. Åberg, “Strong UV absorption and visibleluminescence in ytterbium-doped aluminosilicate glass under UV excita-tion,” Optics letters, vol. 32, no. 22, pp. 3352–3354, 2007.
[112] M. Söderlund, J. Montiel i Ponsoda, and S. Honkanen, “Measurementof thermal binding energy of photodarkening-induced color centers inytterbium-doped silica fibers,” in Lasers and Electro-Optics 2009 and theEuropean Quantum Electronics Conference. CLEO Europe-EQEC 2009.European Conference on. IEEE, 2009, pp. 1–1.
[113] T. Erdogan, V. Mizrahi, P. J. Lemaire, and D. Monroe, “Decay of ultraviolet-induced fiber Bragg gratings,” Journal of Applied Physics, vol. 76, no. 1, pp.73 –80, jul 1994.
[114] S. Kannan, M. LuValle, R. Ahrens, and P. Lemaire, “Analysis of recov-ery in radiation-induced loss in rare-earth-doped fibers through mastercurve/demarcation energy diagrams,” in Optical Fiber CommunicationConference, 1999, and the International Conference on Integrated Opticsand Optical Fiber Communication. OFC/IOOC’99. Technical Digest, vol. 3.IEEE, 1999, pp. 93–95.
[115] Y. Lee, S. Sinha, M. Digonnet, R. Byer, and S. Jiang, “Measurement ofhigh photodarkening resistance in heavily Yb3+-doped phosphate fibres,”Electronics letters, vol. 44, no. 1, pp. 14–16, 2008.
[116] M. Engholm and L. Norin, “Comment on “photodarkening in Yb-doped alu-minosilicate fibers induced by 488 nm irradiation”,” Optics letters, vol. 33,no. 11, pp. 1216–1216, 2008.
[117] S. Yoo, C. Basu, A. Boyland, C. Sones, J. Nilsson, J. Sahu, and D. Payne,“Reply to comment on “photodarkening in Yb-doped aluminosilicate fibersinduced by 488 nm irradiation”,” Optics Letters, vol. 33, no. 11, pp. 1217–1218, 2008.
[118] A. Rybaltovsky, S. Aleshkina, M. Likhachev, M. Bubnov, A. Umnikov,M. Yashkov, A. Gur’yanov, and E. Dianov, “Luminescence and photoin-duced absorption in ytterbium-doped optical fibres,” Quantum Electronics,vol. 41, no. 12, pp. 1073–1079, 2011.
[119] F. Mady, M. Benabdesselam, and W. Blanc, “Thermoluminescence char-acterization of traps involved in the photodarkening of ytterbium-dopedsilica fibers,” Optics letters, vol. 35, no. 21, pp. 3541–3543, 2010.
[120] P. Dragic, C. Carlson, and A. Croteau, “Characterization of defect lumines-cence in yb doped silica fibers: part I NBOHC,” Optics Express, vol. 16,no. 7, pp. 4688–4697, 2008.
[121] P. Dragic, Y. Liu, T. Galvin, and J. Eden, “Ultraviolet absorption and excita-tion spectroscopy of rare-earth-doped glass fibers derived from glassy andcrystalline preforms,” in Proceedings of SPIE, vol. 8237, 2012, p. 82370T.
79

Bibliography
[122] T. Arai, K. Ichii, S. Tanigawa, and M. Fujimaki, “Defect analysis of pho-todarkened and gamma-ray irradiated ytterbium-doped silica glasses,” inOptical Fiber Communication Conference. Optical Society of America,2009.
[123] R. Peretti, A. Jurdyc, B. Jacquier, C. Gonnet, A. Pastouret, E. Burov, andO. Cavani, “How do traces of thulium explain photodarkening in Yb dopedfibers?” Optics Express, vol. 18, no. 19, pp. 20 455–20 460, 2010.
[124] R. Peretti, C. Gonnet, and A. Jurdyc, “Revisiting literature observationson photodarkening in Yb3+ doped fiber considering the possible presenceof Tm impurities,” Journal of Applied Physics, vol. 112, no. 9, pp. 093 511–093 511, 2012.
[125] S. Jetschke, M. Leich, S. Unger, A. Schwuchow, and J. Kirchhof, “Influenceof Tm-or Er-codoping on the photodarkening kinetics in Yb fibers,” OpticsExpress, vol. 19, no. 15, pp. 14 473–14 478, 2011.
[126] J. Dawson, M. Messerly, R. Beach, M. Shverdin, E. Stappaerts, A. Sridha-ran, P. Pax, J. Heebner, C. Siders, and C. Barty, “Analysis of the scalabilityof diffraction-limited fiber lasers and amplifiers to high average power,”Optics express, vol. 16, no. 17, pp. 13 240–13 266, 2008.
[127] S. Unger, A. Schwuchow, S. Jetschke, V. Reichel, A. Scheffel, andJ. Kirchhof, “Optical properties of Yb-doped laser fibers in dependence oncodopants and preparation conditions,” in Proc. SPIE, vol. 6890, 2008, pp.689 016–1.
[128] S. Jetschke, S. Unger, A. Schwuchow, M. Leich, and J. Kirchhof, “EfficientYb laser fibers with low photodarkening by optimization of the core com-position,” Optics express, vol. 16, no. 20, pp. 15 540–15 545, 2008.
[129] M. Engholm, P. Jelger, F. Laurell, and L. Norin, “Improved photodarken-ing resistivity in ytterbium-doped fiber lasers by cerium codoping,” Opticsletters, vol. 34, no. 8, pp. 1285–1287, 2009.
[130] M. Leich, S. Jetschke, S. Unger, and J. Kirchhof, “Temperature influenceon the photodarkening kinetics in Yb-doped silica fibers,” JOSA B, vol. 28,no. 1, pp. 65–68, 2011.
[131] S. Yoo, A. Boyland, R. Standish, and J. Sahu, “Measurement of photodark-ening in Yb-doped aluminosilicate fibres at elevated temperature,” Elec-tronics letters, vol. 46, no. 3, pp. 243–244, 2010.
[132] J. Sahu, S. Yoo, A. Boyland, C. Basu, M. Kalita, A. Webb, C. Sones, J. Nils-son, and D. Payne, “488 nm irradiation induced photodarkening study ofYb-doped aluminosilicate and phosphosilicate fibers,” in Quantum Elec-tronics and Laser Science Conference. Optical Society of America, 2008.
[133] C. Basu, S. Yoo, A. Boyland, A. Webb, C. Sones, and J. Sahu, “Influence oftemperature on the post-irradiation temporal loss evolution in Yb-dopedaluminosilicate fibers, photodarkened by 488 nm CW irradiation,” in TheEuropean Conference on Lasers and Electro-Optics. Optical Society ofAmerica, 2009.
80

Bibliography
[134] M. Leich, U. Röpke, S. Jetschke, S. Unger, V. Reichel, and J. Kirchhof, “Non-isothermal bleaching of photodarkened Yb-doped fibers,” Optics express,vol. 17, no. 15, pp. 12 588–12 593, 2009.
[135] D. Grukh, A. Kurkov, V. Paramonov, and E. Dianov, “Effect of heatingon the optical properties of Yb3+-doped fibres and fibre lasers,” QuantumElectronics, vol. 34, no. 6, pp. 579–582, 2004.
[136] Y. Wang, C. Xu, and H. Po, “Thermal effects in kilowatt fiber lasers,” Pho-tonics Technology Letters, IEEE, vol. 16, no. 1, pp. 63–65, 2004.
[137] T. Newell, P. Peterson, A. Gavrielides, and M. Sharma, “Temperature ef-fects on the emission properties of Yb-doped optical fibers,” Optics commu-nications, vol. 273, no. 1, pp. 256–259, 2007.
[138] S. Jetschke, U. Röpke, S. Unger, and J. Kirchhof, “Characterization of pho-todarkening processes in Yb doped fibers,” in Proc. SPIE, vol. 7195, 2009,p. 71952B.
[139] A. Fotiadi, O. Antipov, and P. Mugret, “Dynamics of pump-induced refrac-tive index changes in single-mode Yb-doped optical fibers,” Optics Express,vol. 16, no. 17, pp. 12 658–12 663, 2008.
[140] J. Canning and A. Carter, “Modal interferometer for in situ measurementsof induced core index change in optical fibers,” Optics letters, vol. 22, no. 8,pp. 561–563, 1997.
[141] J. Canning, A. Carter, and M. Sceats, “Correlation between photodarken-ing and index change during 193 nm irradiation of germanosilicate andphosphosilicate fibers,” Lightwave Technology, Journal of, vol. 15, no. 8,pp. 1348–1356, 1997.
[142] A. Snyder and J. Love, Optical waveguide theory. Springer, 1983, vol. 190.
[143] R. Puurunen, “Surface chemistry of atomic layer deposition: A case studyfor the trimethylaluminum/water process,” Journal of applied physics,vol. 97, no. 12, pp. 121 301–121 301, 2005.
[144] S. George, “Atomic layer deposition: An overview,” Chem. Rev., vol. 110,no. 1, pp. 111–131, 2010.
[145] J. Kim, K. Chakrabarti, J. Lee, K. Oh, and C. Lee, “Effects of ozone as anoxygen source on the properties of the Al2O3 thin films prepared by atomiclayer deposition,” Materials chemistry and physics, vol. 78, no. 3, pp. 733–738, 2003.
[146] J. Elam, D. Routkevitch, P. Mardilovich, and S. George, “Conformal coat-ing on ultrahigh-aspect-ratio nanopores of anodic alumina by atomic layerdeposition,” Chemistry of Materials, vol. 15, no. 18, pp. 3507–3517, 2003.
81

Bibliography
82
9HSTFMG*afcbgi+
ISBN 978-952-60-5216-8 ISBN 978-952-60-5217-5 (pdf) ISSN-L 1799-4934 ISSN 1799-4934 ISSN 1799-4942 (pdf) Aalto University School of Electrical Engineering Department of Micro- and Nanosciences www.aalto.fi
BUSINESS + ECONOMY ART + DESIGN + ARCHITECTURE SCIENCE + TECHNOLOGY CROSSOVER DOCTORAL DISSERTATIONS
Aalto-D
D 101
/2013
Fiber lasers and amplifiers have become very important for many applications, such as telecommunications, materials processing, and medicine. Ytterbium (Yb) doped fibers are the preferred gain media in high peak and average power laser sources. However, the photodarkening effect, which manifests as a time dependent increase of loss in the doped core, is one of the main threats to the efficiency of the Yb-doped gain media leading to degradation of the laser performance. This thesis focused on developing accurate methods to characterize photodarkening and the associated thermal effects in Yb-doped silica fibers. Parallel to the experimental work on photodarkening, a new all vapor phase fabrication method was implemented to produce Yb-doped fibers by atomic layer deposition (ALD) in combination with the conventional modified chemical vapor deposition (MCVD) technique.
Joan J. Montiel i P
onsoda A
nalysis of photodarkening effects in ytterbium-doped laser fibers
Aalto
Unive
rsity
Department of Micro- and Nanosciences
Analysis of photodarkening effects in ytterbium-doped laser fibers
Joan J. Montiel i Ponsoda
DOCTORAL DISSERTATIONS


![Лекция 11 ОПТИЧЕСКИЕ ВОЛОКНА И ВОЛОКОННЫЕ … · All-glass leakage channeL fibers The LCF used in the first demonstration [7] (left), the first ytterbium-doped](https://static.fdocuments.net/doc/165x107/605fcaefbcde8377c0284da4/-11-all-glass.jpg)

![Thermo-optical effects in high-power Ytterbium-doped fiber ... · average power [7–9]. Numerical studies have attributed the latter effect to thermal and pop-ulation inversion induced](https://static.fdocuments.net/doc/165x107/5e799ef506b2c95c9c41f958/thermo-optical-effects-in-high-power-ytterbium-doped-fiber-average-power-7a9.jpg)


