
Aalborg Universitet Radio Propagation in Open-pit Mines...
7
Aalborg Universitet Radio Propagation in Open-pit Mines a First Look at Measurements in the 2.6 GHz Band de Almeida, Erika Portela Lopes; Caldwell, George; Rodriguez Larrad, Ignacio; Abreu, Sergio; Vieira, Robson; Barbosa, Viviane S. B.; Sørensen, Troels Bundgaard; Mogensen, Preben Elgaard; Uzeda Garcia, Luis Guilherme Published in: IEEE 28th Annual International Symposium on Personal, Indoor, and Mobile Radio Communications (PIMRC), 2017 DOI (link to publication from Publisher): 10.1109/PIMRC.2017.8292345 Publication date: 2017 Document Version Accepted author manuscript, peer reviewed version Link to publication from Aalborg University Citation for published version (APA): Portela Lopes de Almeida, E., Caldwell, G., Rodriguez Larrad, I., Abreu, S., Vieira, R., Barbosa, V. S. B., ... Uzeda Garcia, L. G. (2017). Radio Propagation in Open-pit Mines: a First Look at Measurements in the 2.6 GHz Band. In IEEE 28th Annual International Symposium on Personal, Indoor, and Mobile Radio Communications (PIMRC), 2017 IEEE. I E E E International Symposium Personal, Indoor and Mobile Radio Communications https://doi.org/10.1109/PIMRC.2017.8292345 General rights Copyright and moral rights for the publications made accessible in the public portal are retained by the authors and/or other copyright owners and it is a condition of accessing publications that users recognise and abide by the legal requirements associated with these rights. ? Users may download and print one copy of any publication from the public portal for the purpose of private study or research. ? You may not further distribute the material or use it for any profit-making activity or commercial gain ? You may freely distribute the URL identifying the publication in the public portal ? Take down policy If you believe that this document breaches copyright please contact us at [email protected] providing details, and we will remove access to the work immediately and investigate your claim.
Transcript of Aalborg Universitet Radio Propagation in Open-pit Mines...
Aalborg Universitet
Radio Propagation in Open-pit Mines
a First Look at Measurements in the 2.6 GHz Band
de Almeida, Erika Portela Lopes; Caldwell, George; Rodriguez Larrad, Ignacio; Abreu,Sergio; Vieira, Robson; Barbosa, Viviane S. B.; Sørensen, Troels Bundgaard; Mogensen,Preben Elgaard; Uzeda Garcia, Luis GuilhermePublished in:IEEE 28th Annual International Symposium on Personal, Indoor, and Mobile Radio Communications (PIMRC),2017
DOI (link to publication from Publisher):10.1109/PIMRC.2017.8292345
Publication date:2017
Document VersionAccepted author manuscript, peer reviewed version
Link to publication from Aalborg University
Citation for published version (APA):Portela Lopes de Almeida, E., Caldwell, G., Rodriguez Larrad, I., Abreu, S., Vieira, R., Barbosa, V. S. B., ...Uzeda Garcia, L. G. (2017). Radio Propagation in Open-pit Mines: a First Look at Measurements in the 2.6 GHzBand. In IEEE 28th Annual International Symposium on Personal, Indoor, and Mobile Radio Communications(PIMRC), 2017 IEEE. I E E E International Symposium Personal, Indoor and Mobile Radio Communicationshttps://doi.org/10.1109/PIMRC.2017.8292345
General rightsCopyright and moral rights for the publications made accessible in the public portal are retained by the authors and/or other copyright ownersand it is a condition of accessing publications that users recognise and abide by the legal requirements associated with these rights.
? Users may download and print one copy of any publication from the public portal for the purpose of private study or research. ? You may not further distribute the material or use it for any profit-making activity or commercial gain ? You may freely distribute the URL identifying the publication in the public portal ?
Take down policyIf you believe that this document breaches copyright please contact us at [email protected] providing details, and we will remove access tothe work immediately and investigate your claim.
Radio Propagation in Open-pit Mines: a FirstLook at Measurements in the 2.6 GHz BandErika P. L. Almeida1,2, George Caldwell3, Ignacio Rodriguez1, Sergio Abreu2, Robson D. Vieira3,
Viviane S. B. Barbosa4, Troels B. Sørensen1, Preben Mogensen1 and Luis G. Uzeda Garcia5
1Wireless Communication Networks Section, Department of Electronic Systems, Aalborg University (AAU)2Technology Development Institude (INDT), 3Ektrum,
4Faculdade de Estudos Administrativos de Minas Gerais (FEAD), 5Instituto Tecnológico Vale (ITV)
Abstract—In this paper we present the results of an extensivemeasurement campaign performed at two large iron ore miningcenters in Brazil at the 2.6 GHz band. Although several studiesfocusing on radio propagation in underground mines have beenpublished, measurement data and careful analyses for open-pitmines are still scarce. Our results aim at filling this gap inthe literature. The research is motivated by the ongoing mineautomation initiatives, where connectivity becomes critical. Thispaper presents the first set of results comprising measurementsunder a gamut of propagation conditions. A second paperdetailing sub-GHz propagation is also in preparation. The resultsindicate that conventional wisdom is wrong, in other words,radio-frequency (RF) propagation in surface mines can be farmore elaborate than plain free-space line-of-sight conditions.Additionally, the old mining adage “no two mines alike” seemsto remain true in the RF domain.
I. INTRODUCTION
Mining is as old as human civilization, and still remains oneof the most essential industrial activities, being responsiblefor 1% of the workforce worldwide and a revenue of morethan 400 billion dollars per year. In traditional operations,radio network planning and optimization are afterthoughts,typically carried out on a reactive basis via trial-and-errorprocedures. Consequently, coverage holes and data serviceoutages are common. When bespoke Wi-Fi solutions becomean insurmountable bottleneck, self-healing IEEE 802.11 meshnetworks augmented by proprietary algorithms are the go-tosolutions for the vast majority of miners [1]. In short, radiopropagation was little more than a nuisance.
However, the decreasing prices of ores, combined with ahighly competitive market have been pushing this industry toincrease its operational efficiency. In this context, remotelyoperated, autonomous equipment and systems have emergedas the technical solution promising a broad range of benefits,including enhanced employee health and safety conditions,higher productivity, and reduced environmental impacts. But,given the mobile nature of surface mining equipment, wirelessnetworks have taken center stage as they form the backbone ofunmanned operations. As such, proper planning and constantoptimization can no longer be overlooked [2], [3].
The quality of radio network planning depends on theaccuracy of RF propagation models, and, while channel char-acterization, propagation measurement results, and models for
underground mines have been widely investigated [4], [5], thesame cannot be said about open-pit mines, in which only tworeferences were found. In [6], a geometric model is proposedbased on the complete knowledge of the environment, so thatthe direct, reflected and diffracted fields are calculated andused for the prediction of the received field strength at aspecific location. In [7] the authors present a study of thechannel impulse response in the 2.4 GHz band, based on aset of wideband measurements. Their conclusion is that theincreased delay spread, caused by multiple reflections, limitsthe performance of OFDM systems such as LTE and Wi-Fiwith standard cyclic prefix values.
More empirical data is clearly needed, in order to developand validate large-scale and small-scale channel characteriza-tion. While geographic information systems (GIS), ray-tracingtechniques and models such as the one proposed in [6] can alsoplay an important role in characterization and optimization ofsmaller areas, we believe that a simplified model can be helpfulfor quick determination of link budgets, dominance areas andnetwork capacity in open-pit mines.
Our paper presents a first look at large-scale channel charac-terization in open-pit mines, considering both macro cell andsmall cell deployments operating at the 2.6 GHz band. This setof results, collected in distinct scenarios, is used as a startingpoint for the definition of simple propagation models in thisatypical industrial environment.
The remainder of this paper is organized as follows. Sec-tion II describes the measurement scenarios and setup. SectionIII details the data processing and calibration procedures. InSection IV we discuss the measurement results and presentempirical path loss models considering the distinct scenariosand base station deployment configurations. Finally, SectionIV concludes the paper and outlines future research directions.
II. MEASUREMENT SCENARIO, SETUP AND CHALLENGES
The selected mines are located in the Iron Quadrangleregion in Minas Gerais, Brazil. This region supplies approxi-mately 200 million metric tons of iron ore per year. In order tostudy the propagation characteristics in open-pit mines, exten-sive drive-tests were carried out in April and May 2017 (dryweather periods). It is important to mention the many practical
challenges associated with measurement campaigns in suchrestricted and risky industrial environments: rigorous safetyand security protocols, rock blasting procedures that constrainand interrupt the measurement process, unpaved roads andtracks, absolute traffic priority given to haul trucks and largemachinery, limited infrastructure for this kind of activity dueto the mutant nature of mines, and business pressures. Thesedifficulties might help explain the lack of empirical data in theliterature. Considering all these impediments, the criteria usedfor selecting the transmitter locations were:
• Coverage Planning: with the help of a commercial pre-diction tool, transmitters were positioned with the aim tocover all relevant areas in the mine (crusher, waste piles,pits).
• Accessibility and safety: regular cars may not access allareas of the mine, especially during the periods when haultrucks are allowed to drive at high speed. Furthermore,the location of transmitters, especially small cells, needsto be safe, blocked and properly signaled. Therefore,this criterion was important in selecting the transmitterlocations in different periods of the day.
• Infrastructure availability: we used the existing infrastruc-ture in terms of power sources, towers and cell-on-wheels(COW).
• Coverage holes: prior to the field work, a series ofcoverage predictions were made in order to determine theideal location of small cells. The final decision combinedthis information with suggestions from mine personnel.
• Scenario diversity: whenever possible, small cell loca-tions were chosen to cover distinct scenarios within themine.
A. Measurement ScenarioDespite all challenges, a vast amount of measurement data
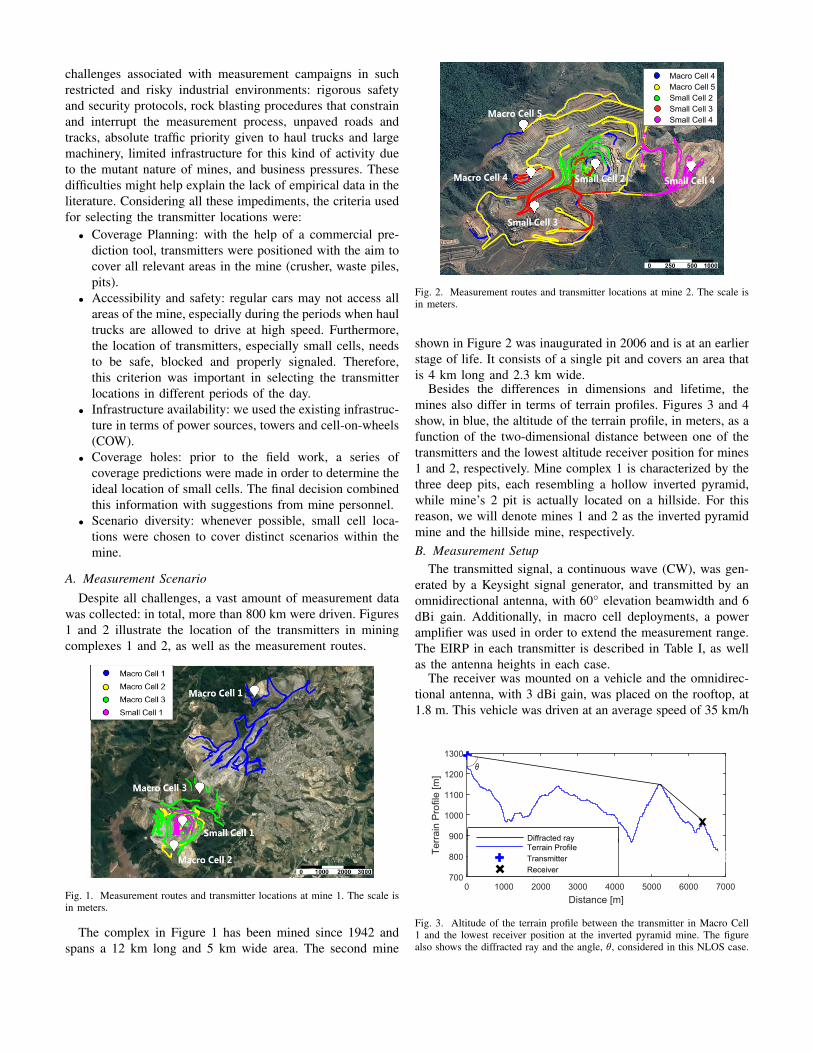
was collected: in total, more than 800 km were driven. Figures1 and 2 illustrate the location of the transmitters in miningcomplexes 1 and 2, as well as the measurement routes.
Fig. 1. Measurement routes and transmitter locations at mine 1. The scale isin meters.
The complex in Figure 1 has been mined since 1942 andspans a 12 km long and 5 km wide area. The second mine
Macro Cell 4
Macro Cell 5
Small Cell 2
Small Cell 3
Small Cell 4
Small Cell 3
Small Cell 4Small Cell 2
Macro Cell 5
Macro Cell 4
0 250 500 1000
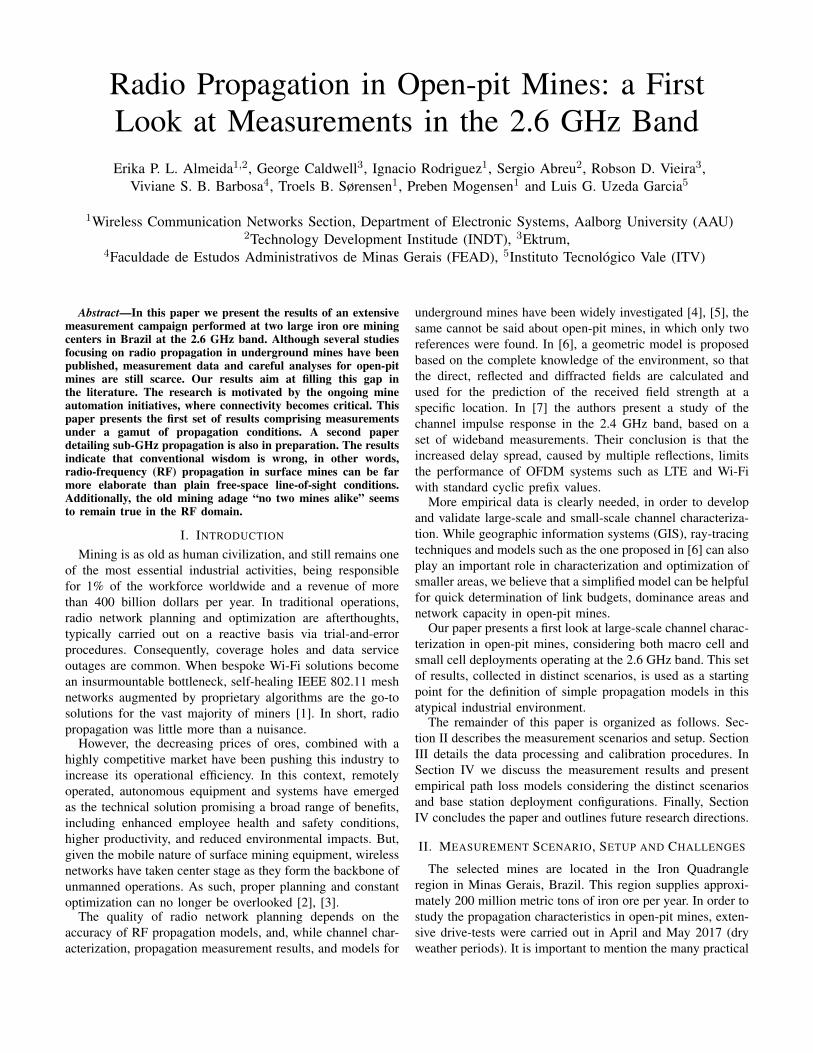
Fig. 2. Measurement routes and transmitter locations at mine 2. The scale isin meters.
shown in Figure 2 was inaugurated in 2006 and is at an earlierstage of life. It consists of a single pit and covers an area thatis 4 km long and 2.3 km wide.
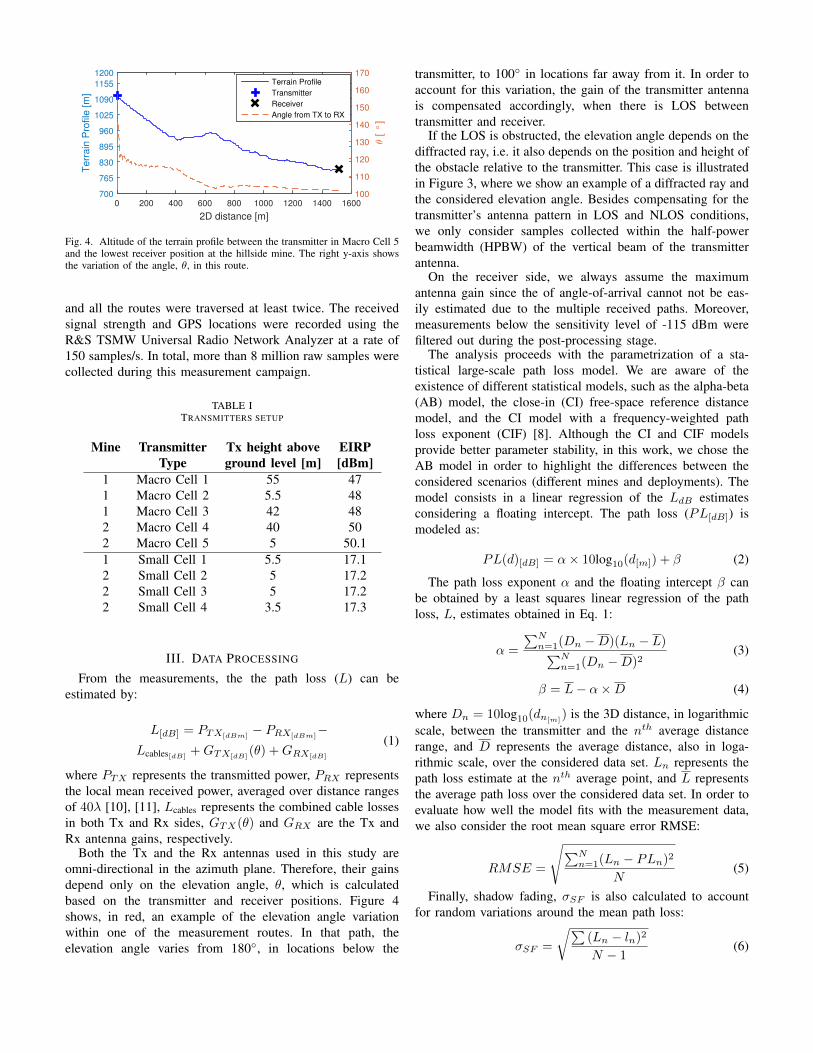
Besides the differences in dimensions and lifetime, themines also differ in terms of terrain profiles. Figures 3 and 4show, in blue, the altitude of the terrain profile, in meters, as afunction of the two-dimensional distance between one of thetransmitters and the lowest altitude receiver position for mines1 and 2, respectively. Mine complex 1 is characterized by thethree deep pits, each resembling a hollow inverted pyramid,while mine’s 2 pit is actually located on a hillside. For thisreason, we will denote mines 1 and 2 as the inverted pyramidmine and the hillside mine, respectively.B. Measurement Setup
The transmitted signal, a continuous wave (CW), was gen-erated by a Keysight signal generator, and transmitted by anomnidirectional antenna, with 60◦ elevation beamwidth and 6dBi gain. Additionally, in macro cell deployments, a poweramplifier was used in order to extend the measurement range.The EIRP in each transmitter is described in Table I, as wellas the antenna heights in each case.
The receiver was mounted on a vehicle and the omnidirec-tional antenna, with 3 dBi gain, was placed on the rooftop, at1.8 m. This vehicle was driven at an average speed of 35 km/h
Distance [m]
0 1000 2000 3000 4000 5000 6000 7000
Te
rra
inP
rofile
[m]
700
800
900
1000
1100
1200
1300
Terrain Profile
Transmitter
Receiver
x
Diffracted ray
θ
Fig. 3. Altitude of the terrain profile between the transmitter in Macro Cell1 and the lowest receiver position at the inverted pyramid mine. The figurealso shows the diffracted ray and the angle, θ, considered in this NLOS case.
2D distance [m]
0 200 400 600 800 1000 1200 1400 1600
Terr
ain
Pro
file
[m
]
700
765
830
895
960
1025
1090
1155
1200
θ [ °
]
100
110
120
130
140
150
160
170Terrain Profile
Transmitter
Receiver
Angle from TX to RX
Fig. 4. Altitude of the terrain profile between the transmitter in Macro Cell 5and the lowest receiver position at the hillside mine. The right y-axis showsthe variation of the angle, θ, in this route.
and all the routes were traversed at least twice. The receivedsignal strength and GPS locations were recorded using theR&S TSMW Universal Radio Network Analyzer at a rate of150 samples/s. In total, more than 8 million raw samples werecollected during this measurement campaign.
TABLE ITRANSMITTERS SETUP
Mine Transmitter Tx height above EIRPType ground level [m] [dBm]
1 Macro Cell 1 55 471 Macro Cell 2 5.5 481 Macro Cell 3 42 482 Macro Cell 4 40 502 Macro Cell 5 5 50.11 Small Cell 1 5.5 17.12 Small Cell 2 5 17.22 Small Cell 3 5 17.22 Small Cell 4 3.5 17.3
III. DATA PROCESSING
From the measurements, the the path loss (L) can beestimated by:
L[dB] = PTX[dBm]− PRX[dBm]
−Lcables[dB]
+GTX[dB](θ) +GRX[dB]
(1)
where PTX represents the transmitted power, PRX representsthe local mean received power, averaged over distance rangesof 40λ [10], [11], Lcables represents the combined cable lossesin both Tx and Rx sides, GTX(θ) and GRX are the Tx andRx antenna gains, respectively.
Both the Tx and the Rx antennas used in this study areomni-directional in the azimuth plane. Therefore, their gainsdepend only on the elevation angle, θ, which is calculatedbased on the transmitter and receiver positions. Figure 4shows, in red, an example of the elevation angle variationwithin one of the measurement routes. In that path, theelevation angle varies from 180◦, in locations below the
transmitter, to 100◦ in locations far away from it. In order toaccount for this variation, the gain of the transmitter antennais compensated accordingly, when there is LOS betweentransmitter and receiver.
If the LOS is obstructed, the elevation angle depends on thediffracted ray, i.e. it also depends on the position and height ofthe obstacle relative to the transmitter. This case is illustratedin Figure 3, where we show an example of a diffracted ray andthe considered elevation angle. Besides compensating for thetransmitter’s antenna pattern in LOS and NLOS conditions,we only consider samples collected within the half-powerbeamwidth (HPBW) of the vertical beam of the transmitterantenna.
On the receiver side, we always assume the maximumantenna gain since the of angle-of-arrival cannot not be eas-ily estimated due to the multiple received paths. Moreover,measurements below the sensitivity level of -115 dBm werefiltered out during the post-processing stage.
The analysis proceeds with the parametrization of a sta-tistical large-scale path loss model. We are aware of theexistence of different statistical models, such as the alpha-beta(AB) model, the close-in (CI) free-space reference distancemodel, and the CI model with a frequency-weighted pathloss exponent (CIF) [8]. Although the CI and CIF modelsprovide better parameter stability, in this work, we chose theAB model in order to highlight the differences between theconsidered scenarios (different mines and deployments). Themodel consists in a linear regression of the LdB estimatesconsidering a floating intercept. The path loss (PL[dB]) ismodeled as:
PL(d)[dB] = α× 10log10(d[m]) + β (2)
The path loss exponent α and the floating intercept β canbe obtained by a least squares linear regression of the pathloss, L, estimates obtained in Eq. 1:
α =
∑Nn=1(Dn −D)(Ln − L)∑N
n=1(Dn −D)2(3)
β = L− α×D (4)
where Dn = 10log10(dn[m]) is the 3D distance, in logarithmic
scale, between the transmitter and the nth average distancerange, and D represents the average distance, also in loga-rithmic scale, over the considered data set. Ln represents thepath loss estimate at the nth average point, and L representsthe average path loss over the considered data set. In order toevaluate how well the model fits with the measurement data,we also consider the root mean square error RMSE:
RMSE =
√∑Nn=1(Ln − PLn)2
N(5)
Finally, shadow fading, σSF is also calculated to accountfor random variations around the mean path loss:
σSF =
√∑(Ln − ln)2
N − 1(6)
where ln is the mean path loss over segments of 50 meters.
IV. RESULTS AND DISCUSSION
The results are shown for macro and small cells separately.However, although the deployment of macro and small cells isa reality in open-pit mines [1], there is no clear definition ofwhat a small cell and a macro cell are in this scenario. Macroand small cell scenarios are normally defined consideringheterogeneous networks deployed in urban environments. Inthat case, from a radio propagation perspective, macro cellsare defined as those deployed in elevated outdoor position,above the rooftop of the building, typically, with transmitpower higher than 24 dBm. Small cells, on the other hand,are defined as those deployed below rooftop of the building inoutdoor or indoor positions, with lower transmit power [12].The use of the same definition is clearly not possible in thisscenario.
Therefore, we propose the following definition, based onthe transmitter location relative to the terrain profile: a smallcell deployment is defined as the one where the transmitteris placed close to the ground level, below the median altitudeof the covered area. The macro cell deployment, on the otherhand, is defined as the one where the transmitter is placed inelevated positions, above the median altitude of the coveragearea.
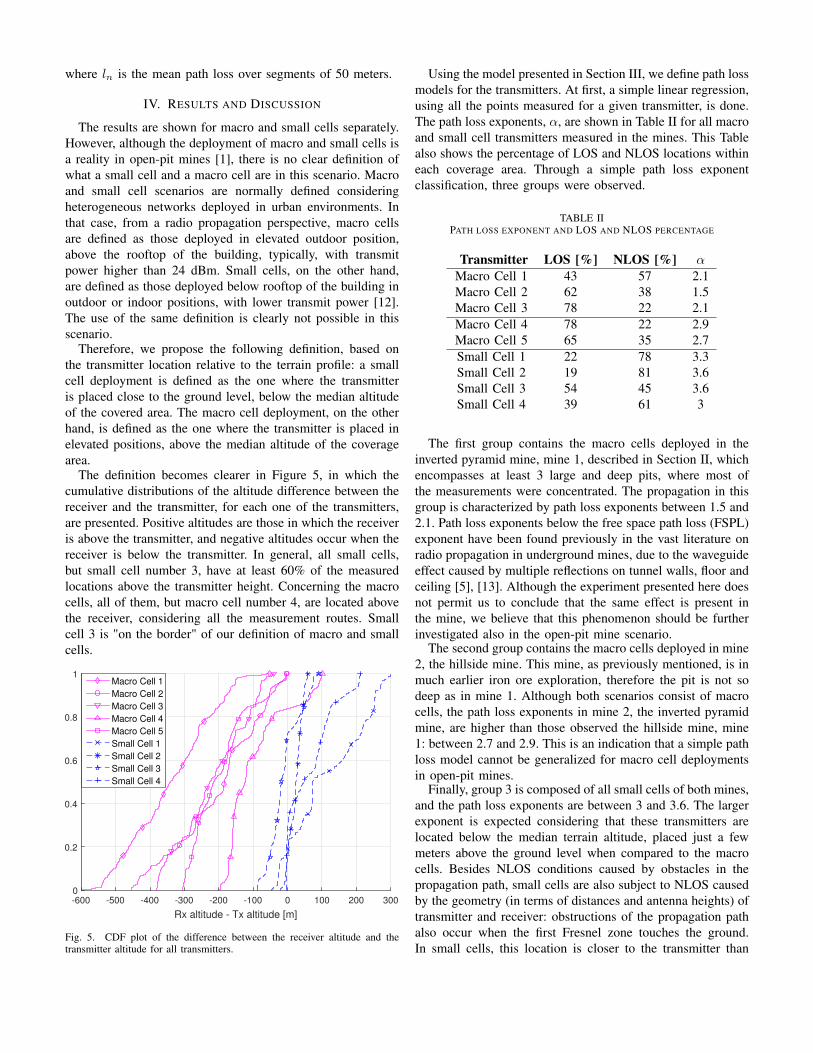
The definition becomes clearer in Figure 5, in which thecumulative distributions of the altitude difference between thereceiver and the transmitter, for each one of the transmitters,are presented. Positive altitudes are those in which the receiveris above the transmitter, and negative altitudes occur when thereceiver is below the transmitter. In general, all small cells,but small cell number 3, have at least 60% of the measuredlocations above the transmitter height. Concerning the macrocells, all of them, but macro cell number 4, are located abovethe receiver, considering all the measurement routes. Smallcell 3 is "on the border" of our definition of macro and smallcells.
Rx altitude - Tx altitude [m]
-600 -500 -400 -300 -200 -100 0 100 200 3000
0.2
0.4
0.6
0.8
1Macro Cell 1
Macro Cell 2
Macro Cell 3
Macro Cell 4
Macro Cell 5
Small Cell 1
Small Cell 2
Small Cell 3
Small Cell 4
Fig. 5. CDF plot of the difference between the receiver altitude and thetransmitter altitude for all transmitters.
Using the model presented in Section III, we define path lossmodels for the transmitters. At first, a simple linear regression,using all the points measured for a given transmitter, is done.The path loss exponents, α, are shown in Table II for all macroand small cell transmitters measured in the mines. This Tablealso shows the percentage of LOS and NLOS locations withineach coverage area. Through a simple path loss exponentclassification, three groups were observed.
TABLE IIPATH LOSS EXPONENT AND LOS AND NLOS PERCENTAGE
Transmitter LOS [%] NLOS [%] αMacro Cell 1 43 57 2.1Macro Cell 2 62 38 1.5Macro Cell 3 78 22 2.1Macro Cell 4 78 22 2.9Macro Cell 5 65 35 2.7Small Cell 1 22 78 3.3Small Cell 2 19 81 3.6Small Cell 3 54 45 3.6Small Cell 4 39 61 3
The first group contains the macro cells deployed in theinverted pyramid mine, mine 1, described in Section II, whichencompasses at least 3 large and deep pits, where most ofthe measurements were concentrated. The propagation in thisgroup is characterized by path loss exponents between 1.5 and2.1. Path loss exponents below the free space path loss (FSPL)exponent have been found previously in the vast literature onradio propagation in underground mines, due to the waveguideeffect caused by multiple reflections on tunnel walls, floor andceiling [5], [13]. Although the experiment presented here doesnot permit us to conclude that the same effect is present inthe mine, we believe that this phenomenon should be furtherinvestigated also in the open-pit mine scenario.
The second group contains the macro cells deployed in mine2, the hillside mine. This mine, as previously mentioned, is inmuch earlier iron ore exploration, therefore the pit is not sodeep as in mine 1. Although both scenarios consist of macrocells, the path loss exponents in mine 2, the inverted pyramidmine, are higher than those observed the hillside mine, mine1: between 2.7 and 2.9. This is an indication that a simple pathloss model cannot be generalized for macro cell deploymentsin open-pit mines.
Finally, group 3 is composed of all small cells of both mines,and the path loss exponents are between 3 and 3.6. The largerexponent is expected considering that these transmitters arelocated below the median terrain altitude, placed just a fewmeters above the ground level when compared to the macrocells. Besides NLOS conditions caused by obstacles in thepropagation path, small cells are also subject to NLOS causedby the geometry (in terms of distances and antenna heights) oftransmitter and receiver: obstructions of the propagation pathalso occur when the first Fresnel zone touches the ground.In small cells, this location is closer to the transmitter than
in macro cells, because they are placed closer to the groundlevel. However, due to terrain irregularities, the determinationof the exact breakpoint distance is trickier in mine scenarios.
The LOS/NLOS percentage, also in Table II, was investi-gated with the aid of digital terrain maps (DTM), with a 1m resolution. In general, as in other scenarios, macro cellshave a higher percentage of LOS samples, and small cellsdeployments present a higher percentage of NLOS samples.The exceptions are Macro cell 1 and Small cell 3. Macro cell1 coverage area is mostly obstructed by at least one hill, asin Figure 3, which explains the higher percentage of NLOSlocations. Small cell 3, on the other hand, is at the borderof our definition of macro and small cells, and part of themeasured points are below the transmitter altitude. LOS andNLOS percentages are strongly dependent on specific terraincharacteristics.
Based on the previous observations - path loss exponentsand percentages of LOS/NLOS samples - we propose singleslope models for macro cell deployments, one for each mine,and a dual slope model for small cell deployments in open-pitmines.
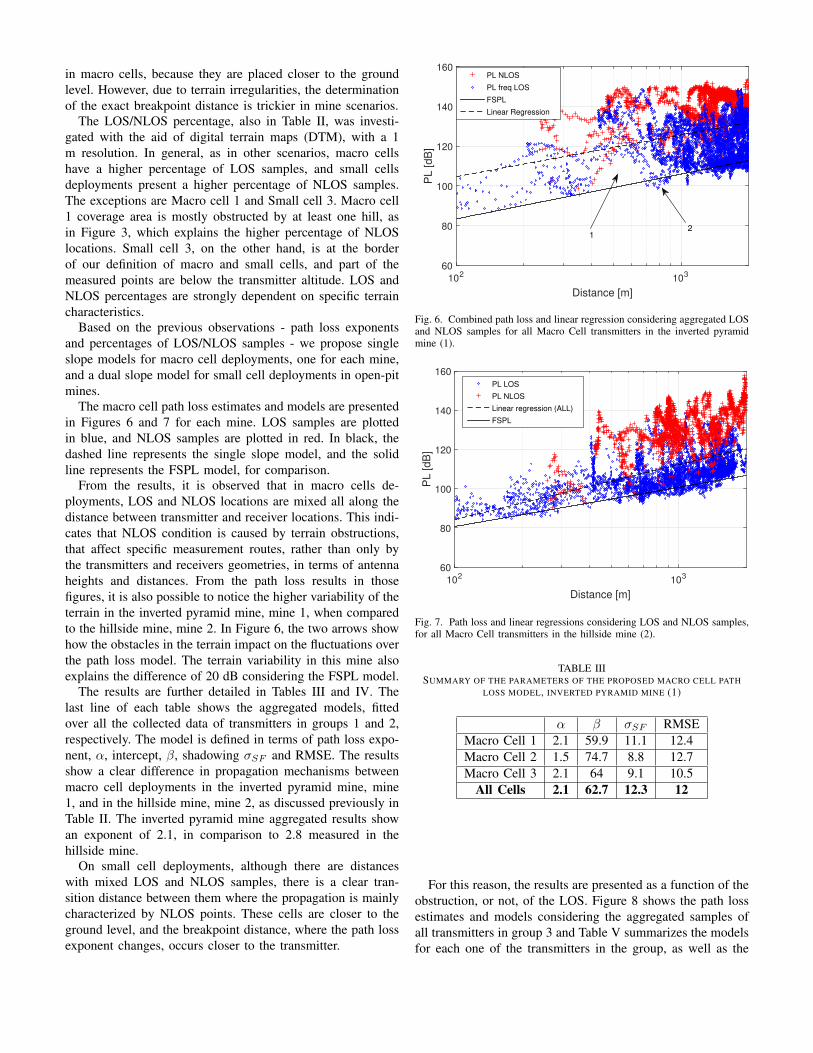
The macro cell path loss estimates and models are presentedin Figures 6 and 7 for each mine. LOS samples are plottedin blue, and NLOS samples are plotted in red. In black, thedashed line represents the single slope model, and the solidline represents the FSPL model, for comparison.
From the results, it is observed that in macro cells de-ployments, LOS and NLOS locations are mixed all along thedistance between transmitter and receiver locations. This indi-cates that NLOS condition is caused by terrain obstructions,that affect specific measurement routes, rather than only bythe transmitters and receivers geometries, in terms of antennaheights and distances. From the path loss results in thosefigures, it is also possible to notice the higher variability of theterrain in the inverted pyramid mine, mine 1, when comparedto the hillside mine, mine 2. In Figure 6, the two arrows showhow the obstacles in the terrain impact on the fluctuations overthe path loss model. The terrain variability in this mine alsoexplains the difference of 20 dB considering the FSPL model.
The results are further detailed in Tables III and IV. Thelast line of each table shows the aggregated models, fittedover all the collected data of transmitters in groups 1 and 2,respectively. The model is defined in terms of path loss expo-nent, α, intercept, β, shadowing σSF and RMSE. The resultsshow a clear difference in propagation mechanisms betweenmacro cell deployments in the inverted pyramid mine, mine1, and in the hillside mine, mine 2, as discussed previously inTable II. The inverted pyramid mine aggregated results showan exponent of 2.1, in comparison to 2.8 measured in thehillside mine.
On small cell deployments, although there are distanceswith mixed LOS and NLOS samples, there is a clear tran-sition distance between them where the propagation is mainlycharacterized by NLOS points. These cells are closer to theground level, and the breakpoint distance, where the path lossexponent changes, occurs closer to the transmitter.
Distance [m]
102 103
PL
[d
B]
60
80
100
120
140
160PL NLOS
PL freq LOS
FSPL
Linear Regression
12
Fig. 6. Combined path loss and linear regression considering aggregated LOSand NLOS samples for all Macro Cell transmitters in the inverted pyramidmine (1).
Distance [m]
102 103
PL
[d
B]
60
80
100
120
140
160
PL LOS
PL NLOS
Linear regression (ALL)
FSPL
Fig. 7. Path loss and linear regressions considering LOS and NLOS samples,for all Macro Cell transmitters in the hillside mine (2).
TABLE IIISUMMARY OF THE PARAMETERS OF THE PROPOSED MACRO CELL PATH
LOSS MODEL, INVERTED PYRAMID MINE (1)
α β σSF RMSEMacro Cell 1 2.1 59.9 11.1 12.4Macro Cell 2 1.5 74.7 8.8 12.7Macro Cell 3 2.1 64 9.1 10.5
All Cells 2.1 62.7 12.3 12
For this reason, the results are presented as a function of theobstruction, or not, of the LOS. Figure 8 shows the path lossestimates and models considering the aggregated samples ofall transmitters in group 3 and Table V summarizes the modelsfor each one of the transmitters in the group, as well as the
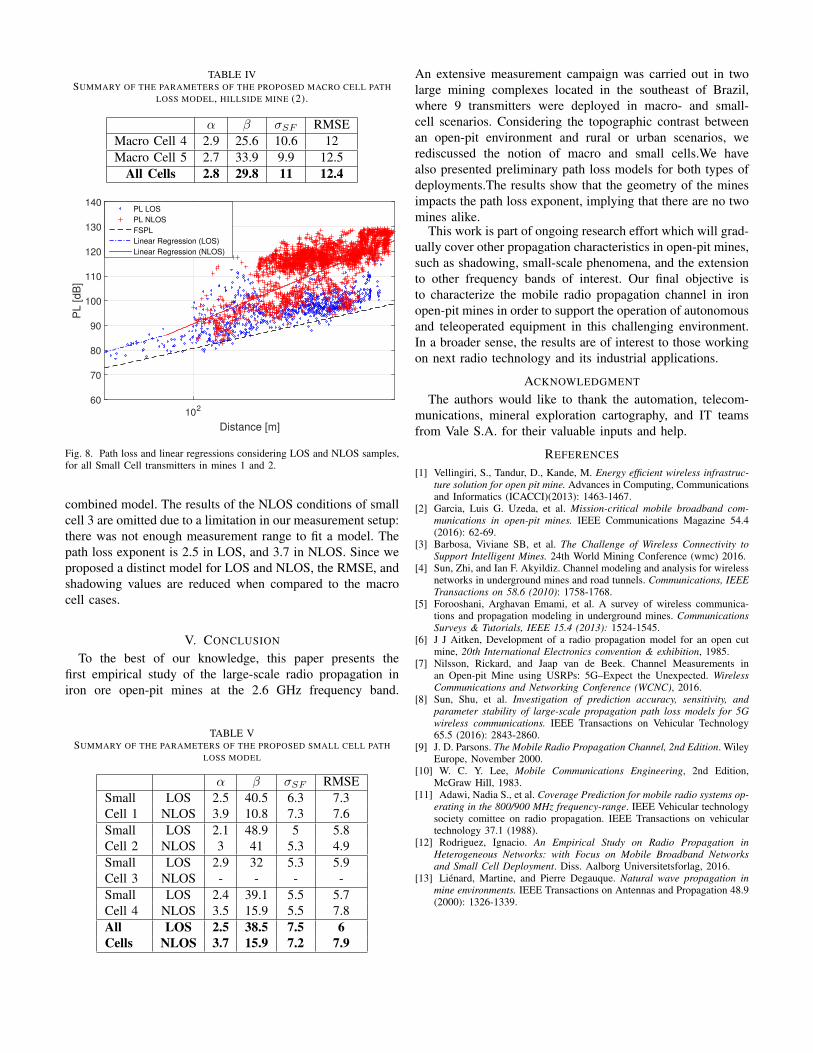
TABLE IVSUMMARY OF THE PARAMETERS OF THE PROPOSED MACRO CELL PATH
LOSS MODEL, HILLSIDE MINE (2).
α β σSF RMSEMacro Cell 4 2.9 25.6 10.6 12Macro Cell 5 2.7 33.9 9.9 12.5
All Cells 2.8 29.8 11 12.4
Distance [m]
102
PL
[d
B]
60
70
80
90
100
110
120
130
140PL LOS
PL NLOS
FSPL
Linear Regression (LOS)
Linear Regression (NLOS)
Fig. 8. Path loss and linear regressions considering LOS and NLOS samples,for all Small Cell transmitters in mines 1 and 2.
combined model. The results of the NLOS conditions of smallcell 3 are omitted due to a limitation in our measurement setup:there was not enough measurement range to fit a model. Thepath loss exponent is 2.5 in LOS, and 3.7 in NLOS. Since weproposed a distinct model for LOS and NLOS, the RMSE, andshadowing values are reduced when compared to the macrocell cases.
V. CONCLUSION
To the best of our knowledge, this paper presents thefirst empirical study of the large-scale radio propagation iniron ore open-pit mines at the 2.6 GHz frequency band.
TABLE VSUMMARY OF THE PARAMETERS OF THE PROPOSED SMALL CELL PATH
LOSS MODEL
α β σSF RMSESmallCell 1
LOS 2.5 40.5 6.3 7.3NLOS 3.9 10.8 7.3 7.6
SmallCell 2
LOS 2.1 48.9 5 5.8NLOS 3 41 5.3 4.9
SmallCell 3
LOS 2.9 32 5.3 5.9NLOS - - - -
SmallCell 4
LOS 2.4 39.1 5.5 5.7NLOS 3.5 15.9 5.5 7.8
AllCells
LOS 2.5 38.5 7.5 6NLOS 3.7 15.9 7.2 7.9
An extensive measurement campaign was carried out in twolarge mining complexes located in the southeast of Brazil,where 9 transmitters were deployed in macro- and small-cell scenarios. Considering the topographic contrast betweenan open-pit environment and rural or urban scenarios, werediscussed the notion of macro and small cells.We havealso presented preliminary path loss models for both types ofdeployments.The results show that the geometry of the minesimpacts the path loss exponent, implying that there are no twomines alike.
This work is part of ongoing research effort which will grad-ually cover other propagation characteristics in open-pit mines,such as shadowing, small-scale phenomena, and the extensionto other frequency bands of interest. Our final objective isto characterize the mobile radio propagation channel in ironopen-pit mines in order to support the operation of autonomousand teleoperated equipment in this challenging environment.In a broader sense, the results are of interest to those workingon next radio technology and its industrial applications.
ACKNOWLEDGMENT
The authors would like to thank the automation, telecom-munications, mineral exploration cartography, and IT teamsfrom Vale S.A. for their valuable inputs and help.
REFERENCES
[1] Vellingiri, S., Tandur, D., Kande, M. Energy efficient wireless infrastruc-ture solution for open pit mine. Advances in Computing, Communicationsand Informatics (ICACCI)(2013): 1463-1467.
[2] Garcia, Luis G. Uzeda, et al. Mission-critical mobile broadband com-munications in open-pit mines. IEEE Communications Magazine 54.4(2016): 62-69.
[3] Barbosa, Viviane SB, et al. The Challenge of Wireless Connectivity toSupport Intelligent Mines. 24th World Mining Conference (wmc) 2016.
[4] Sun, Zhi, and Ian F. Akyildiz. Channel modeling and analysis for wirelessnetworks in underground mines and road tunnels. Communications, IEEETransactions on 58.6 (2010): 1758-1768.
[5] Forooshani, Arghavan Emami, et al. A survey of wireless communica-tions and propagation modeling in underground mines. CommunicationsSurveys & Tutorials, IEEE 15.4 (2013): 1524-1545.
[6] J J Aitken, Development of a radio propagation model for an open cutmine, 20th International Electronics convention & exhibition, 1985.
[7] Nilsson, Rickard, and Jaap van de Beek. Channel Measurements inan Open-pit Mine using USRPs: 5G–Expect the Unexpected. WirelessCommunications and Networking Conference (WCNC), 2016.
[8] Sun, Shu, et al. Investigation of prediction accuracy, sensitivity, andparameter stability of large-scale propagation path loss models for 5Gwireless communications. IEEE Transactions on Vehicular Technology65.5 (2016): 2843-2860.
[9] J. D. Parsons. The Mobile Radio Propagation Channel, 2nd Edition. WileyEurope, November 2000.
[10] W. C. Y. Lee, Mobile Communications Engineering, 2nd Edition,McGraw Hill, 1983.
[11] Adawi, Nadia S., et al. Coverage Prediction for mobile radio systems op-erating in the 800/900 MHz frequency-range. IEEE Vehicular technologysociety comittee on radio propagation. IEEE Transactions on vehiculartechnology 37.1 (1988).
[12] Rodriguez, Ignacio. An Empirical Study on Radio Propagation inHeterogeneous Networks: with Focus on Mobile Broadband Networksand Small Cell Deployment. Diss. Aalborg Universitetsforlag, 2016.
[13] Liénard, Martine, and Pierre Degauque. Natural wave propagation inmine environments. IEEE Transactions on Antennas and Propagation 48.9(2000): 1326-1339.