AADT 016 Caroline 2009 - Virginia Department of ... G 1% 1% 2% 3% F 0.089 F 7300 G 16...
36
Virginia Department of Transportation Jurisdiction Report Daily Traffic Volume Estimates Including Vehicle Classification Estimates Town of Bowling Green Town of Port Royal where available Caroline County 2009 Prepared By Virginia Department of Transportation Traffic Engineering Division In Cooperation With U.S. Department of Transportation Federal Highway Administration 16
Transcript of AADT 016 Caroline 2009 - Virginia Department of ... G 1% 1% 2% 3% F 0.089 F 7300 G 16...

Virginia Department of Transportation
Jurisdiction Report
Daily Traffic Volume EstimatesIncluding Vehicle Classification Estimates
Town of Bowling GreenTown of Port Royal
where available
Caroline County
2009
Prepared ByVirginia Department of Transportation
Traffic Engineering Division
In Cooperation WithU.S. Department of TransportationFederal Highway Administration
16

Virginia Department of TransportationTraffic Engineering DivisionTraffic Monitoring Section
The Virginia Department of Transportation (VDOT) conducts a program where trafficcount data are gathered from sensors in or along streets and highways and other sources.From these data, estimates of the average number of vehicles that traveled each segmentof road are calculated. VDOT periodically publishes booklets listing these estimates.
One of these booklets, titled “Average Daily Traffic Volumes with Vehicle ClassificationData, on Interstate, Arterial and Primary Routes”includes a list of each Interstate andPrimary highway segment with the estimated Annual Average Daily Traffic (AADT) forthat segment. AADT is the total annual traffic estimate divided by the number of days inthe year. This booklet also includes information such as estimates of the percentage ofthe AADT made up by 6 different vehicle types, ranging from cars to double trailertrucks; estimated Annual Average Weekday Traffic (AAWDT), which is the number ofvehicles estimated to have traveled the segment of highway during a 24 hour weekdayaveraged over the year; as well as Peak Hour and Peak Direction factors used by plannersto formulate design criteria.
In addition to the Primary and Interstate publication, one hundred books are publishedperiodically, one for each of 100 areas across the state defined by VDOT for recordkeeping purposes. These books include traffic volume estimates for roads within thecounty, cities, and towns within the area. These books are titled “Daily Traffic VolumesIncluding Vehicle Classification Estimates, where available; Jurisdiction Report numbers00 through 99”.
Also available are a number of reports summarizing the average Vehicle Miles Traveled(VMT) in selected jurisdictions and other categories of highways. There are manydifferent ways to present traffic volume summary information. Because the userdetermines the value of each presentation, the reports have been redesigned based on userrequests and feedback. The people of the VDOT Traffic Engineering Division TrafficMonitoring Section who produce these books welcome requests for other helpful ways ofpresenting the summary information.
A compact disc (CD) is available that includes files in the Adobe® Portable DocumentFormat (PDF) that can be displayed, searched, and printed using common desktopcomputer equipment. The CD includes the publications described above as well as anumber of other reports, including specialized VMT summaries and smaller AADTreports for each city and town separately.
Publication Notes
Parallel Roads
For road inventory and management purposes, some roadways are counted separately bydirection and have separately published traffic estimates for each direction of travel.Examples of such roadways are the interstate system and routes with separated facilitiesand (usually) oneway traffic facilities in urban areas. In these publications, they arereferred to as parallel roads. As a convenience for the users of the publication, the listingfor segments of roads with parallel segments are published with both the traffic estimatesfor their own direction of travel (e.g. I95 Northbound) as well as the estimate of the totalof all traffic on the same route including parallel roadways (all directions of I95). Thepublication will have a “Combined Traffic Estimates for Parallel Roadways on thisRoute” or “Combined Traffic” identifiers for the combined direction of travel estimates.
Roadways such as I395 with a North segment, a South segment and a separateReversible lane segment will have the estimate for more than two parallel roadwaysincluded in the entire combined traffic estimate.
Some routes have very complicated paths through cities and towns. These parallel pathsmay be too complex to allow a relationship between nearby sections of the oppositedirection on the same route. In this case, to indicate that the traffic estimates for such aroad segment may not include all directions of traffic on that route, the line that wouldlist the combined values will indicate “NA” for not available.
VDOT’s traffic monitoring program includes more than 100,000 segments of roads andhighways ranging from several mile sections of Interstate highways to very short sectionsof city streets. Due to problems experienced obtaining some traffic count data, and thelevel of quality necessary to maintain confidence in the data, no estimate is currentlyavailable for some segments of roadway. These segments are included in thepublications indicating “NA” for not available. It is the intention of the VDOT TrafficEngineering Division Traffic Monitoring group to obtain the data necessary and to reporttraffic volume estimates on all road segments included in these publications.
Many of the road segments in this program are local secondary roads. The amount anddetail of data collected on these roads are not as great as the data collected on highervolume roads. The vehicle classification, average weekday traffic volumes, and thetheoretical design hour traffic volumes are not calculated for these roads. Thepublications indicate “NA” for the information that is not available.
This publication is based on a traffic monitoring program initiated in 1997. Because thedata collection techniques and statistical evaluation processes are different than thoseused in previous years, comparison with previous publications may be misleading.
Glossary of Terms:
Route: The Route Number assigned to this segment of roadway with the masterinventory route number if this is an overlapping route, with official street or highwayname if available.
Length: Length of the traffic segment in miles.
AADT: Annual Average Daily Traffic. The estimate of typical daily traffic on a roadsegment for all days of the week, Sunday through Saturday, over the period of one year.
QA: Quality of AADT:A Average of Complete Continuous Count DataB Average of Selected Continuous Count DataF Factored Short Term Traffic Count DataG Factored Short Term Traffic Count Data with Growth ElementH Historical EstimateM Manual Uncounted EstimateN AADT of Similar Neighboring Traffic LinkO Provided By External SourceR Raw Traffic Count, Unfactored
4Tire: Percentage of the traffic volume made up of motorcycles, passenger cars, vans andpickup trucks.
Bus: Percentage of the traffic volume made up of busses.
2Axle Truck: Percentage of the traffic volume made up of 2 axle single unit trucks (notincluding pickups and vans).
3+Axle Truck: Percentage of the traffic volume made up of single unit trucks with threeor more axles.
1Trail Truck: Percentage of the traffic volume made up of units with a single trailer.
2Trail Truck: Percentage of the traffic volume made up of units with more than onetrailer.
QC: Quality of Classification Data:A Average of Complete Continuous Count DataB Average of Selected Continuous Count DataC Short Term Classified Traffic Count DataF Factored Short Term Traffic Count DataH Historical EstimateM Mass Collective AverageN Classification Estimates of Similar Neighboring Traffic Link
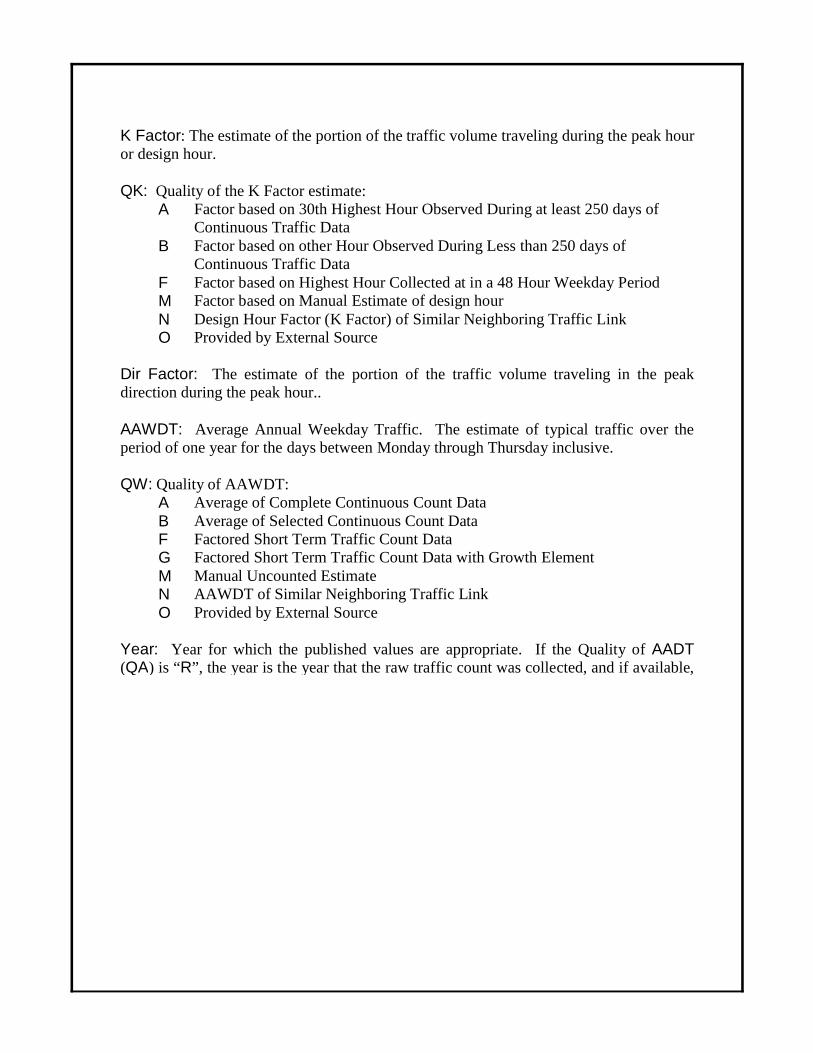
K Factor: The estimate of the portion of the traffic volume traveling during the peak houror design hour.
QK: Quality of the K Factor estimate:A Factor based on 30th Highest Hour Observed During at least 250 days of
Continuous Traffic DataB Factor based on other Hour Observed During Less than 250 days of
Continuous Traffic DataF Factor based on Highest Hour Collected at in a 48 Hour Weekday PeriodM Factor based on Manual Estimate of design hourN Design Hour Factor (K Factor) of Similar Neighboring Traffic LinkO Provided by External Source
Dir Factor: The estimate of the portion of the traffic volume traveling in the peakdirection during the peak hour..
AAWDT: Average Annual Weekday Traffic. The estimate of typical traffic over theperiod of one year for the days between Monday through Thursday inclusive.
QW: Quality of AAWDT:A Average of Complete Continuous Count DataB Average of Selected Continuous Count DataF Factored Short Term Traffic Count DataG Factored Short Term Traffic Count Data with Growth ElementM Manual Uncounted EstimateN AAWDT of Similar Neighboring Traffic LinkO Provided by External Source
Year: Year for which the published values are appropriate. If the Quality of AADT(QA) is “R”, the year is the year that the raw traffic count was collected, and if available,
Bus
29
600
7
29
North
81
154600
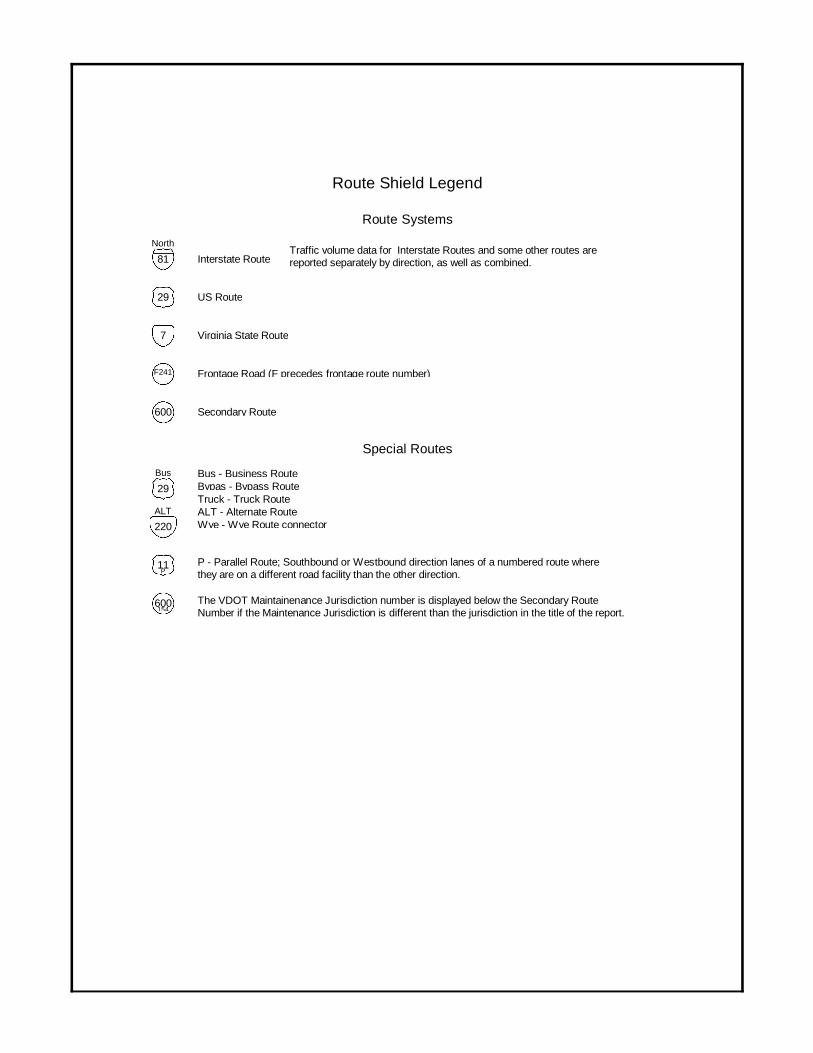
Interstate Route
US Route
Virginia State Route
ALT Alternate Route
Bus Business RouteBypas Bypass RouteTruck Truck Route
Wye Wye Route connector
Secondary Route
The VDOT Maintainenance Jurisdiction number is displayed below the Secondary RouteNumber if the Maintenance Jurisdiction is different than the jurisdiction in the title of the report.
P Parallel Route; Southbound or Westbound direction lanes of a numbered route wherethey are on a different road facility than the other direction.
ALT
220
11P
Traffic volume data for Interstate Routes and some other routes arereported separately by direction, as well as combined.
Route Shield Legend
Route Systems
Special Routes
Frontage Road (F precedes frontage route number)F241
Virginia Department of TransportationTraffic Engineering Division
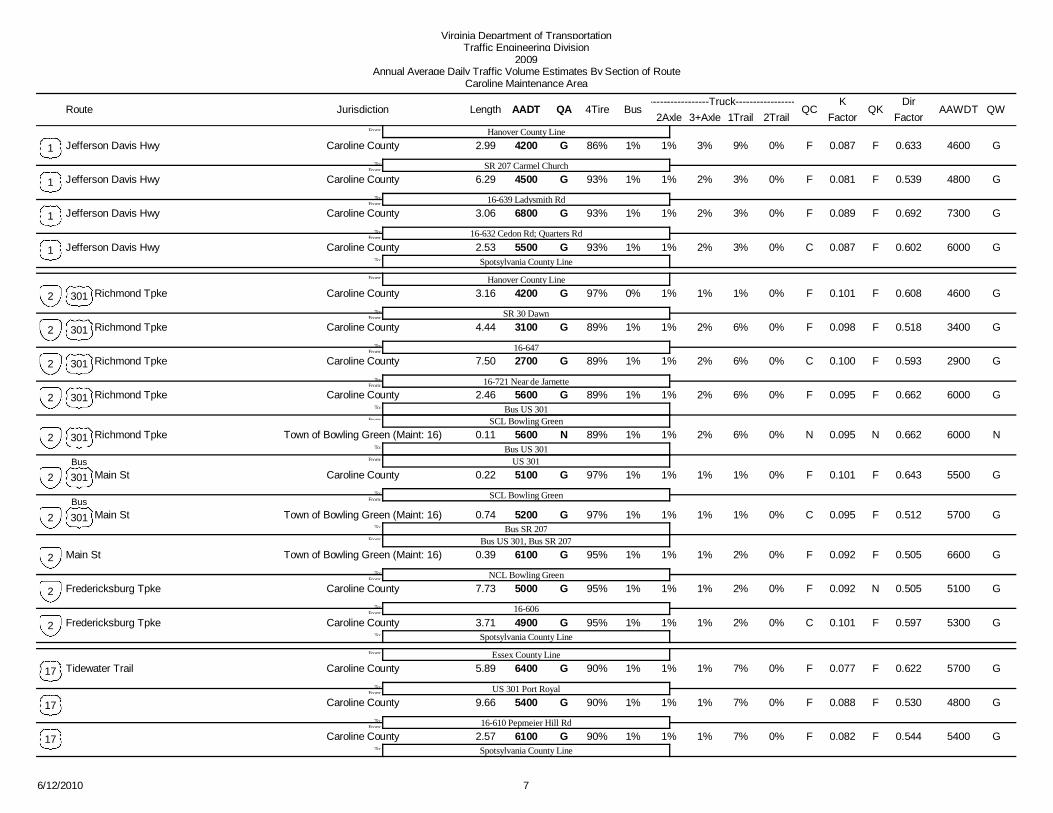
2009Annual Average Daily Traffic Volume Estimates By Section of Route
Caroline Maintenance Area
Route Jurisdiction AADT1Trail 2Trail
4TireK
QA2Axle 3+Axle
QC QKBusLengthTruck
FactorAAWDT QW
DirFactor
4200 1% 1% 0.087 4600G F3% 9% F GHanover County Line
SR 207 Carmel Church
86%
From:To:
From:
Caroline County 2.99 0%1 Jefferson Davis Hwy 0.633
4500 1% 1% 0.081 4800G F2% 3% F G
16639 Ladysmith Rd
93%
From:To:
Caroline County 6.29 0%1 Jefferson Davis Hwy 0.539
6800 1% 1% 0.089 7300G F2% 3% F G
16632 Cedon Rd; Quarters Rd
93%
From:To:
Caroline County 3.06 0%1 Jefferson Davis Hwy 0.692
5500 1% 1% 0.087 6000G F2% 3% C GSpotsylvania County Line
93%To:
Caroline County 2.53 0%1 Jefferson Davis Hwy 0.602
4200 0% 1% 0.101 4600G F1% 1% F GHanover County Line
SR 30 Dawn
97%
From:To:
From:
Caroline County301 3.16 0%2 Richmond Tpke 0.608
3100 1% 1% 0.098 3400G F2% 6% F G
16647
89%
From:To:
Caroline County301 4.44 0%2 Richmond Tpke 0.518
2700 1% 1% 0.100 2900G F2% 6% C G
16721 Near de Jarnette
89%
From:To:
Caroline County301 7.50 0%2 Richmond Tpke 0.593
5600 1% 1% 0.095 6000G F2% 6% F GBus US 301
89%
From:
To:
Caroline County301 2.46 0%2 Richmond Tpke
SCL Bowling Green
0.662
5600 1% 1% 0.095 6000N N2% 6% N NBus US 301
89%
Bus From:
To:
Town of Bowling Green (Maint: 16)301 0.11 0%2 Richmond Tpke
US 301
0.662
5100 1% 1% 0.101 5500G F1% 1% F G
SCL Bowling Green
97%
Bus From:To:
Caroline County301 0.22 0%2 Main St 0.643
5200 1% 1% 0.095 5700G F1% 1% C GBus SR 207
97%
From:
To:
Town of Bowling Green (Maint: 16)301 0.74 0%2 Main St
Bus US 301, Bus SR 207
0.512
6100 1% 1% 0.092 6600G F1% 2% F G
NCL Bowling Green
95%
From:To:
Town of Bowling Green (Maint: 16) 0.39 0%2 Main St 0.505
5000 1% 1% 0.092 5100G N1% 2% F G
16606
95%
From:To:
Caroline County 7.73 0%2 Fredericksburg Tpke 0.505
4900 1% 1% 0.101 5300G F1% 2% C GSpotsylvania County Line
95%To:
Caroline County 3.71 0%2 Fredericksburg Tpke 0.597
6400 1% 1% 0.077 5700G F1% 7% F GEssex County Line
US 301 Port Royal
90%
From:To:
From:
Caroline County 5.89 0%17 Tidewater Trail 0.622
5400 1% 1% 0.088 4800G F1% 7% F G
16610 Pepmeier Hill Rd
90%
From:To:
Caroline County 9.66 0%17 0.530
6100 1% 1% 0.082 5400G F1% 7% F GSpotsylvania County Line
90%To:
Caroline County 2.57 0%17 0.544
76/12/2010

Virginia Department of TransportationTraffic Engineering Division
2009Annual Average Daily Traffic Volume Estimates By Section of Route
Caroline Maintenance Area
Route Jurisdiction AADT1Trail 2Trail
4TireK
QA2Axle 3+Axle
QC QKBusLengthTruck
FactorAAWDT QW
DirFactor
5000 2% 1% 0.095 5400G F5% 16% C GHanover County Line
US 301, SR 2 Richmond Trnpk
77%
From:To:
From:
Caroline County 3.47 0%30 Dawn Blvd 0.602
3500 2% 2% 0.095 3800G F5% 19% C GKing William County Line
73%To:
Caroline County 3.18 0%30 Dawn Blvd 0.836
47000 1% 1% 0.067 43000F F1% 10% F FHanover County Line
SR 207 Rogers Clark Blvd
87%
North From:To:
From:
Caroline County 3.07 0%North
9596000 1% 1% NA 85000F 1% 10% F F87% 0%Combined Traffic Estimates for 2 Parallel Roadways on this Route:
45000 1% 1% 0.065 40000F F0% 11% F F
16639 Ladysmith Rd
87%
North From:To:
Caroline County 6.12 1%9591000 1% 1% NA 80000F 0% 7% F F91% 0%Combined Traffic Estimates for 2 Parallel Roadways on this Route:
48000 1% 1% 0.063 43000G F0% 11% F G
Spotsylvania County Line
87%
To:
Caroline County 6.35 1%9592000 1% 1% NA 81000G 0% 8% F G91% 0%Combined Traffic Estimates for 2 Parallel Roadways on this Route:
80 NA 100F FExit Rest Area Parking Lot
I95 North from Rest AreaTo:
From:
Caroline County 0.07North
95 Ladysmith Rest Area Ramp
48000 1% 1% 0.070 43000F F1% 10% F FHanover County Line
SR 207 Rogers Clark Blvd
87%
South From:To:
From:
Caroline County 3.67 0%South
9596000 1% 1% NA 85000F 1% 10% F F87% 0%Combined Traffic Estimates for 2 Parallel Roadways on this Route:
46000 0% 0% 0.073 40000F F0% 4% F F
16639 Ladysmith Rd
95%
South From:To:
Caroline County 6.02 0%9591000 1% 1% NA 80000F 0% 7% F F91% 0%Combined Traffic Estimates for 2 Parallel Roadways on this Route:
44000 0% 0% 0.07 38000G F0% 4% F G
Spotsylvania County Line
95%
To:
Caroline County 6.05 0%9592000 1% 1% NA 81000G 0% 8% F G91% 0%Combined Traffic Estimates for 2 Parallel Roadways on this Route:
7000 1% 2% 0.078 6700G F2% 28% C GUS 1 Jefferson Davis Hwy
I95
67%
From:To:
From:
Caroline County 0.46 0%207 Rogers Clark Blvd 0.549
9300 1% 1% 0.113 8800A A1% 8% C A
16601 S, Penola Rd
89%
From:To:
Caroline County 5.14 1%207 Rogers Clark Blvd 0.539
11000 1% 1% 0.084 10000G F1% 8% F G
16722 Milford
89%
From:To:
Caroline County 4.31 1%207 Rogers Clark Blvd 0.563
11000 1% 1% 0.082 11000G F1% 8% F GBus SR 207
89%To:
Caroline County 0.57 1%207 Rogers Clark Blvd 0.555
86/12/2010
Virginia Department of TransportationTraffic Engineering Division
2009Annual Average Daily Traffic Volume Estimates By Section of Route
Caroline Maintenance Area
Route Jurisdiction AADT1Trail 2Trail
4TireK
QA2Axle 3+Axle
QC QKBusLengthTruck
FactorAAWDT QW
DirFactor
8000 1% 1% 0.079 7600G F1% 8% F GBus SR 207
US 301 Richmond Tpke89%
To:
From:
Caroline County 1.45 1%207 0.584
2700 1% 2% 0.113 2600G F1% 32% C GSR 207 N, Rogers Clark Blvd
I95 South63%
To:
From:
Caroline County 0.32 0%East
207 Ramp
5300 1% 1% 0.073 5000G F2% 36% C GSR 207 S, Rogers Clark Blvd
I95 South59%
To:
From:
Caroline County 0.18 1%West
207 Ramp
3300 1% 1% 0.108 3600G F1% 2% C GSR 207 Rogers Clark Blvd
WCL Bowling Green
96%
Bus From:To:
From:
Caroline County 0.54 0%Bus
207 Rogers Clark Blvd 0.559
4800 1% 1% 0.095 5200G F0% 1% C GBus US 301, SR 2 Main St
97%To:
Town of Bowling Green (Maint: 16) 0.73 0%207 W Broaddus Ave 0.529
4200 0% 1% 0.101 4600G F1% 1% F GHanover County Line
SR 30 Dawn Boulevard
97%
From:To:
From:
Caroline County2 3.16 0%301 Richmond Tpke 0.608
3100 1% 1% 0.098 3400G F2% 6% F G
16647 Doggetts Fork Rd
89%
From:To:
Caroline County2 4.44 0%301 Richmond Tpke 0.518
2700 1% 1% 0.100 2900G F2% 6% C G
16721 Near De Jarnette
89%
From:To:
Caroline County2 7.50 0%301 Richmond Tpke 0.593
5600 1% 1% 0.095 6000G F2% 6% F G
SCL Bowling Green
89%
From:To:
Caroline County2 2.46 0%301 Richmond Tpke 0.662
5600 1% 1% 0.095 6000N N2% 6% N N
Bus US 301 Main St
89%
From:To:
Town of Bowling Green (Maint: 16)2 0.11 0%301 Richmond Tpke 0.662
5600 1% 1% 0.095 6000N N2% 6% N N
SR 207
89%
From:To:
Town of Bowling Green (Maint: 16) 0.23 0%301 Richmond Tpke 0.662
10000 1% 1% 0.086 9800G F1% 6% F G
Bus US 301, Bus SR 207 Broaddus Ave
91%
From:To:
Town of Bowling Green (Maint: 16) 1.03 0%301 Richmond Tpke 0.573
11000 1% 1% 0.09 10000G F1% 6% F GNCL Bowling Green; 16608 Lakewood Rd
91%
From:
To:
Town of Bowling Green (Maint: 16) 0.98 0%301 A P Hill Blvd
16608 Lakewood Rd
0.604
8700 1% 1% 0.088 8200G F1% 6% F G
US 17 Tidewater Trail
91%
From:To:
Caroline County 9.90 0%301 A P Hill Blvd 0.521
14000 1% 1% 0.088 13000G F1% 6% F G
SCL Port Royal
91%
From:To:
Caroline County 0.39 0%301 A P Hill Blvd 0.541
14000 1% 1% 0.088 13000N N1% 6% N N
NCL Port Royal
91%
From:To:
Town of Port Royal (Maint: 16) 0.47 0%301 A P Hill Blvd 0.541
14000 1% 1% 0.088 13000N N1% 6% N NKing George County Line
91%To:
Caroline County 0.29 0%301 A P Hill Blvd 0.541
96/12/2010
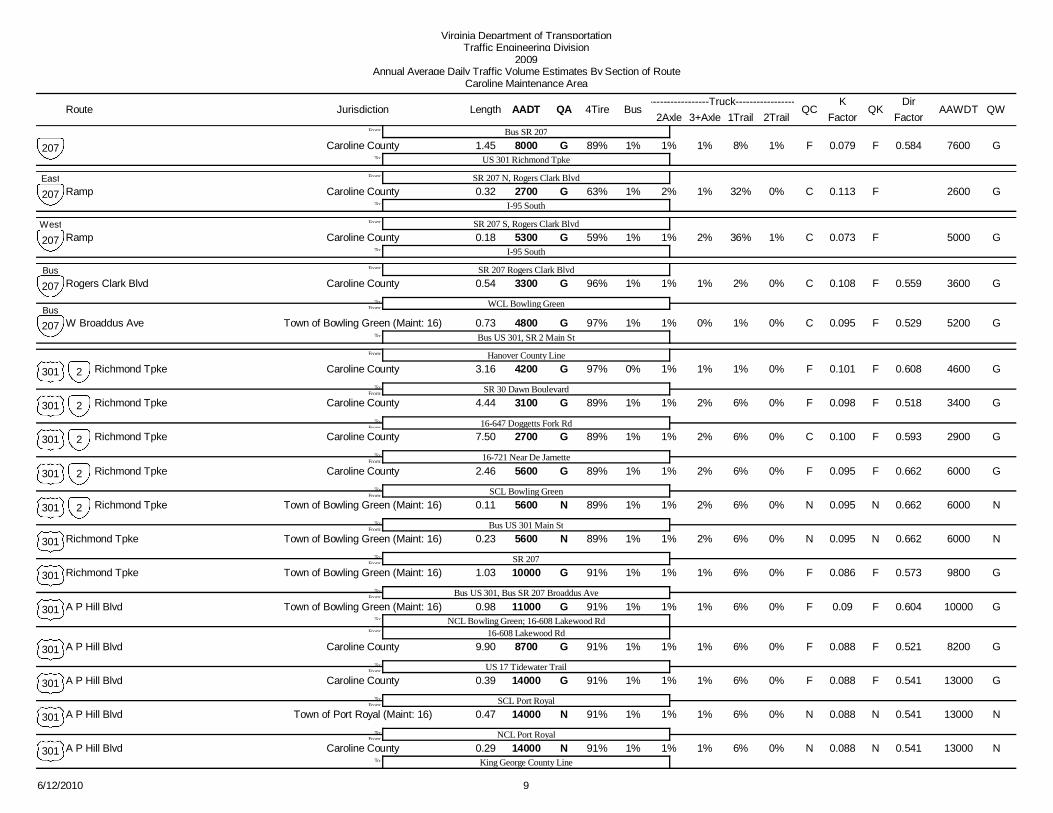
Virginia Department of TransportationTraffic Engineering Division
2009Annual Average Daily Traffic Volume Estimates By Section of Route
Caroline Maintenance Area
Route Jurisdiction AADT1Trail 2Trail
4TireK
QA2Axle 3+Axle
QC QKBusLengthTruck
FactorAAWDT QW
DirFactor
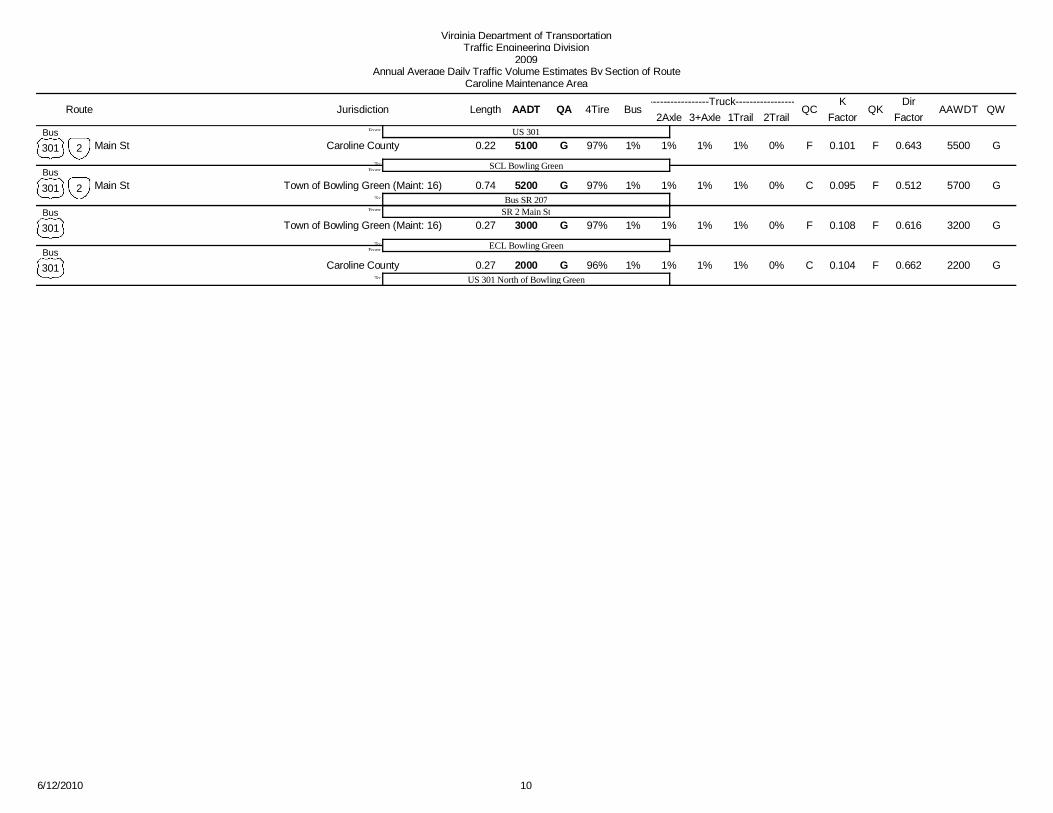
5100 1% 1% 0.101 5500G F1% 1% F GUS 301
SCL Bowling Green
97%
Bus From:To:
From:
Caroline County2 0.22 0%Bus
301 Main St 0.643
5200 1% 1% 0.095 5700G F1% 1% C GBus SR 207
97%
Bus From:
To:
Town of Bowling Green (Maint: 16)2 0.74 0%301 Main St
SR 2 Main St
0.512
3000 1% 1% 0.108 3200G F1% 1% F G
ECL Bowling Green
97%
Bus From:To:
Town of Bowling Green (Maint: 16) 0.27 0%301 0.616
2000 1% 1% 0.104 2200G F1% 1% C GUS 301 North of Bowling Green
96%To:
Caroline County 0.27 0%301 0.662
106/12/2010
Virginia Department of TransportationTraffic Engineering Division
2009Annual Average Daily Traffic Volume Estimates By Section of Route
Caroline Maintenance Area
Route AADT1Trail 2Trail
4TireK
QA2Axle 3+Axle
QC QKBusLengthTruck
FactorAAWDT QW Year
DirFactor
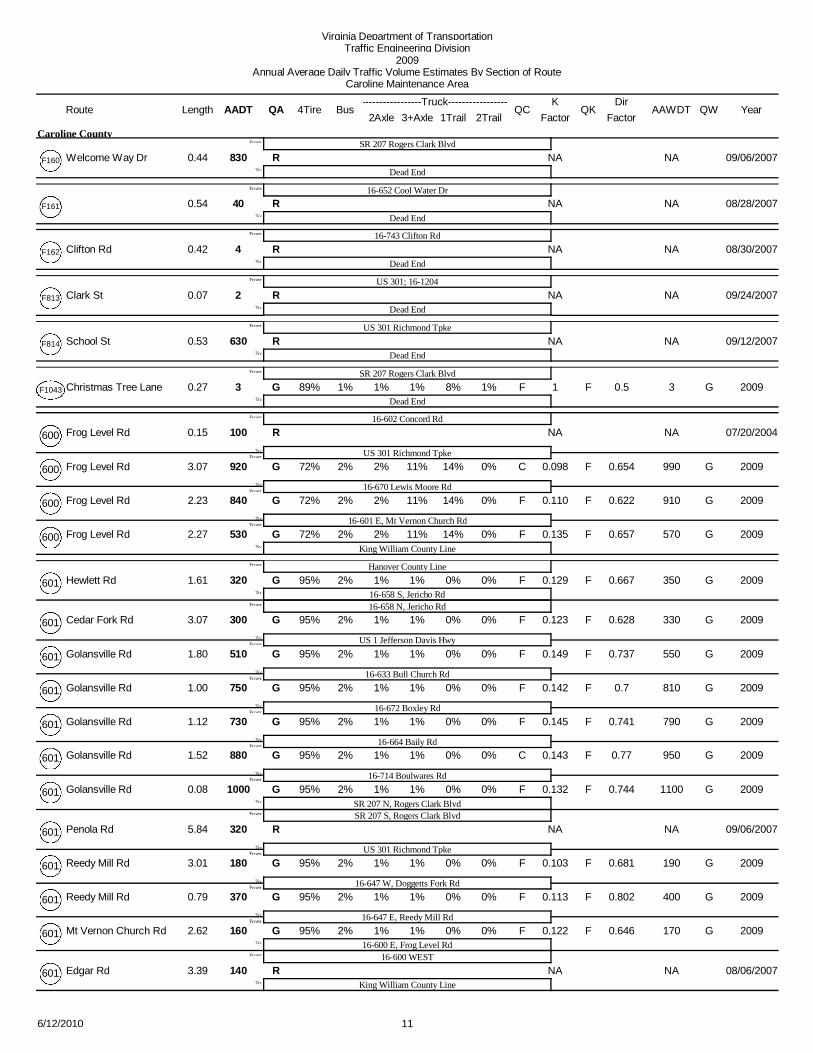
830 NA NARSR 207 Rogers Clark Blvd
Dead EndTo:
From:
0.44
Caroline County
09/06/2007F160 Welcome Way Dr
40 NA NAR16652 Cool Water Dr
Dead EndTo:
From:
0.54 08/28/2007F161
4 NA NAR16743 Clifton Rd
Dead EndTo:
From:
0.42 08/30/2007F162 Clifton Rd
2 NA NARUS 301; 161204
Dead EndTo:
From:
0.07 09/24/2007F813 Clark St
630 NA NARUS 301 Richmond Tpke
Dead EndTo:
From:
0.53 09/12/2007F814 School St
3 1% 1% 1 3G F1% 8% F GSR 207 Rogers Clark Blvd
Dead End89%
To:
From:
0.27 1% 2009F1043 Christmas Tree Lane 0.5
100 NA NAR16602 Concord Rd
US 301 Richmond TpkeFrom:To:
From:
0.15 07/20/2004600 Frog Level Rd
920 2% 2% 0.098 990G F11% 14% C G
16670 Lewis Moore Rd
72%
From:To:
3.07 0% 2009600 Frog Level Rd 0.654
840 2% 2% 0.110 910G F11% 14% F G
16601 E, Mt Vernon Church Rd
72%
From:To:
2.23 0% 2009600 Frog Level Rd 0.622
530 2% 2% 0.135 570G F11% 14% F GKing William County Line
72%To:
2.27 0% 2009600 Frog Level Rd 0.657
320 2% 1% 0.129 350G F1% 0% F GHanover County Line
16658 S, Jericho Rd95%
From:
To:
From:
1.61 0% 2009601 Hewlett Rd
16658 N, Jericho Rd
0.667
300 2% 1% 0.123 330G F1% 0% F G
US 1 Jefferson Davis Hwy
95%
From:To:
3.07 0% 2009601 Cedar Fork Rd 0.628
510 2% 1% 0.149 550G F1% 0% F G
16633 Bull Church Rd
95%
From:To:
1.80 0% 2009601 Golansville Rd 0.737
750 2% 1% 0.142 810G F1% 0% F G
16672 Boxley Rd
95%
From:To:
1.00 0% 2009601 Golansville Rd 0.7
730 2% 1% 0.145 790G F1% 0% F G
16664 Baily Rd
95%
From:To:
1.12 0% 2009601 Golansville Rd 0.741
880 2% 1% 0.143 950G F1% 0% C G
16714 Boulwares Rd
95%
From:To:
1.52 0% 2009601 Golansville Rd 0.77
1000 2% 1% 0.132 1100G F1% 0% F GSR 207 N, Rogers Clark Blvd
95%
From:
To:
0.08 0% 2009601 Golansville Rd
SR 207 S, Rogers Clark Blvd
0.744
320 NA NAR
US 301 Richmond TpkeFrom:To:
5.84 09/06/2007601 Penola Rd
180 2% 1% 0.103 190G F1% 0% F G
16647 W, Doggetts Fork Rd
95%
From:To:
3.01 0% 2009601 Reedy Mill Rd 0.681
370 2% 1% 0.113 400G F1% 0% F G
16647 E, Reedy Mill Rd
95%
From:To:
0.79 0% 2009601 Reedy Mill Rd 0.802
160 2% 1% 0.122 170G F1% 0% F G16600 E, Frog Level Rd
95%
From:
To:
2.62 0% 2009601 Mt Vernon Church Rd
16600 WEST
0.646
140 NA NARKing William County LineTo:
3.39 08/06/2007601 Edgar Rd
116/12/2010

Virginia Department of TransportationTraffic Engineering Division
2009Annual Average Daily Traffic Volume Estimates By Section of Route
Caroline Maintenance Area
Route AADT1Trail 2Trail
4TireK
QA2Axle 3+Axle
QC QKBusLengthTruck
FactorAAWDT QW Year
DirFactor
350 NA NAR16652 Signboard Rd
16662 Gregory RdFrom:To:
From:
1.79
Caroline County
08/08/2007602 Concord Rd
450 NA NARUS 301; 16651To:
1.20 08/08/2007602 Concord Rd
280 NA NARHanover County Line
16669 Sizer RdFrom:To:
From:
2.61 08/09/2004603 Landora Bridge Rd
400 NA NAR16639, Ladysmith Rd; Anderson Mill Rd
From:
To:
1.11 08/09/2004603 Landora Bridge Rd
16639, Anderson Mill Rd660 1% 1% 0.094 710G F1% 1% F G
16604 Blantons Rd
97%
From:To:
4.15 0% 2009603 County Line Church Rd 0.587
860 1% 1% 0.094 930G F1% 1% C G
16661 Cedon Rd
97%
From:To:
0.40 0% 2009603 Church Rd 0.707
760 NA NAR
16632 Quarters RdFrom:To:
2.01 08/16/2004603 Church Rd
1100 NA NARSpotsylvania County LineTo:
0.38 08/30/2007603 Arcadia Rd
390 NA NARSpotsylvania County Line
16603 N, Countyline Church RdFrom:
To:
From:
0.72 08/30/2007604 Blantons Rd
16603 S, Countyline Church Rd680 NA NAR
US 1 Jefferson Davis HwyTo:
2.88 08/30/2007604 Gatewood Rd
510 NA NARSpotsylvania County Line
US 1 Jefferson Davis HwyFrom:To:
From:
0.43 08/30/2007605 Marye Rd
850 1% 1% 0.1 920G F0% 0% C G
16633 Nancy Wrights Dr
98%
From:To:
0.71 0% 2009605 Paige Rd 0.511
780 1% 1% 0.09 850G F0% 0% F G
16632 E, Edgehill Academy Rd
98%
From:To:
1.57 0% 2009605 0.525
620 1% 1% 0.098 670G F0% 0% F G
16626 N, Woodford Rd
98%
From:To:
2.67 0% 2009605 0.507
510 1% 1% 0.103 550G F0% 0% F G
16638, S River Rd
98%
From:To:
1.94 0% 2009605 0.608
540 1% 1% 0.093 580G F0% 0% F GNCL Bowling Green
98%To:
4.08 0% 2009605 0.504
540 1% 1% 0.093 580G F0% 0% F GNCL Bowling Green
SR 2 Main St98%
To:
From:
0.04 0%
Town of Bowling Green
2009605 0.504
1800 2% 1% 0.092 2000G F2% 5% F GSpotsylvania County Line
16755 Guinea Dr
90%
From:To:
From:
3.51 0%
Caroline County
2009606 Stonewall Jackson Rd 0.575
1900 2% 1% 0.093 2100G F2% 5% F G
16607 EAST
90%
From:To:
0.19 0% 2009606 0.525
1700 2% 1% 0.093 1900G F2% 5% F G
16609 E, Rozell Rd
90%
From:To:
0.63 0% 2009606 0.51
1400 2% 1% 0.098 1500G F2% 5% C GSR 2 Fredericksburg Tpke
90%To:
2.30 0% 2009606 0.546
300 NA NARSpotsylvania County Line
16606 WESTTo:
From:
2.09 08/02/2004607
126/12/2010

Virginia Department of TransportationTraffic Engineering Division
2009Annual Average Daily Traffic Volume Estimates By Section of Route
Caroline Maintenance Area
Route AADT1Trail 2Trail
4TireK
QA2Axle 3+Axle
QC QKBusLengthTruck
FactorAAWDT QW Year
DirFactor
170 NA NAR16606 EAST
16609 W, Rozell RdFrom:
To:
From:
0.76
Caroline County
08/02/2004607
16609 E, Rozell Rd150 NA NAR
SR 2 Fredericksburg TpkeTo:
2.10 08/02/2004607
70 NA NAR16630
16621 SOUTHFrom:To:
From:
2.41 08/01/2007608 Seals Rd
60 NA NAR16641 Gap
From:
To:
1.20 08/01/2007608 Seals Rd
Dead End; Gap530 NA NAR
ECL Bowling GreenTo:
0.09 09/24/2007608 Lakewood Rd
390 NA NARECL Bowling Green
US 301 E, A P Hill BlvdFrom:To:
From:
0.01
Town of Bowling Green
10/01/2001608 Lakewood Rd
60 NA NARWCL Bowling GreenTo:
0.44 09/24/2007608 Lakewood Rd
70 NA NARWCL Bowling Green
NCL Bowling GreenTo:
From:
0.84
Caroline County
10/01/2001608
150 NA NARNCL Bowling Green
US 301 BUS WESTTo:
From:
0.35
Town of Bowling Green
10/01/2001608
220 NA NARSR 2 Fredericksburg Tpke
16780 Mt Pleasant BlvdFrom:To:
From:
0.61
Caroline County
07/30/2007609 Woodslane Rd
150 NA NAR16626 S, Woodford Rd
From:
To:
1.71 07/30/2007609 Woodslane Rd
16626 NORTH190 NA NAR
16607 EASTFrom:To:
1.30 08/01/2007609 Rozell Rd
450 NA NAR16606 E, Stonewall Jackson Rd
From:
To:
1.48 08/01/2007609 Rozell Rd
16606 W, Stonewall Jackson Rd590 0% 1% 0.104 640G F2% 0% C G
16668 S, Summit Crossing Rd
96%
From:To:
2.89 0% 2009609 Macedonia Rd 0.581
880 NA NARSpotsylvania County LineTo:
0.61 09/27/2007609 Macedonia Rd
480 1% 1% 0.099 520G F1% 1% C GSR 2 Fredericksburg Tpke
US 17 Tidewater Trail97%
To:
From:
4.73 0% 2009610 Pepmeier Hill Rd 0.574
20 NA NARDead End
US 17To:
From:
0.70 08/20/2007611 Prospect Hill Lane
30 NA NARUS 301; 16628
16703 Cannery RdTo:
From:
0.37 09/12/2007612 Gravatt Rd
130 NA NARUS 1 S, Jefferson Davis Hwy
US 1 N, Jefferson Davis HwyTo:
From:
1.15 09/06/2007613 Zion Rd
136/12/2010
Virginia Department of TransportationTraffic Engineering Division
2009Annual Average Daily Traffic Volume Estimates By Section of Route
Caroline Maintenance Area
Route AADT1Trail 2Trail
4TireK
QA2Axle 3+Axle
QC QKBusLengthTruck
FactorAAWDT QW Year
DirFactor
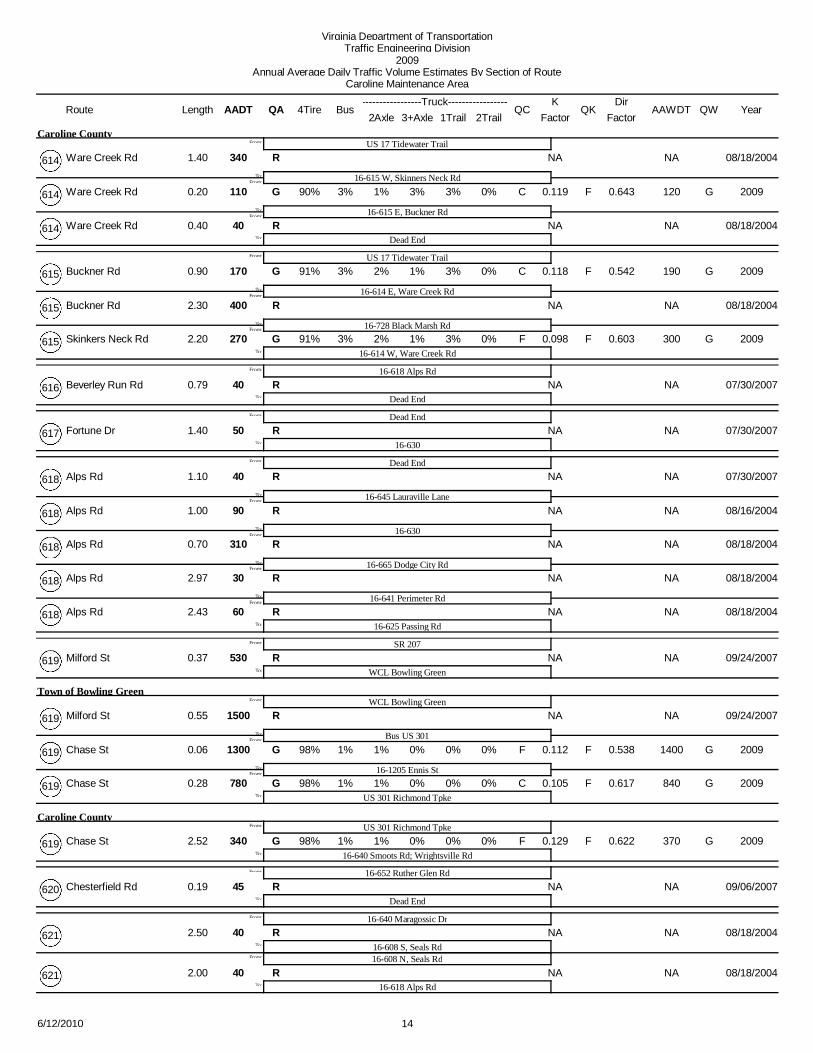
340 NA NARUS 17 Tidewater Trail
16615 W, Skinners Neck RdFrom:To:
From:
1.40
Caroline County
08/18/2004614 Ware Creek Rd
110 3% 1% 0.119 120G F3% 3% C G
16615 E, Buckner Rd
90%
From:To:
0.20 0% 2009614 Ware Creek Rd 0.643
40 NA NARDead EndTo:
0.40 08/18/2004614 Ware Creek Rd
170 3% 2% 0.118 190G F1% 3% C GUS 17 Tidewater Trail
16614 E, Ware Creek Rd
91%
From:To:
From:
0.90 0% 2009615 Buckner Rd 0.542
400 NA NAR
16728 Black Marsh RdFrom:To:
2.30 08/18/2004615 Buckner Rd
270 3% 2% 0.098 300G F1% 3% F G16614 W, Ware Creek Rd
91%To:
2.20 0% 2009615 Skinkers Neck Rd 0.603
40 NA NAR16618 Alps Rd
Dead EndTo:
From:
0.79 07/30/2007616 Beverley Run Rd
50 NA NARDead End
16630To:
From:
1.40 07/30/2007617 Fortune Dr
40 NA NARDead End
16645 Lauraville LaneFrom:To:
From:
1.10 07/30/2007618 Alps Rd
90 NA NAR
16630From:To:
1.00 08/16/2004618 Alps Rd
310 NA NAR
16665 Dodge City RdFrom:To:
0.70 08/18/2004618 Alps Rd
30 NA NAR
16641 Perimeter RdFrom:To:
2.97 08/18/2004618 Alps Rd
60 NA NAR16625 Passing RdTo:
2.43 08/18/2004618 Alps Rd
530 NA NARSR 207
WCL Bowling GreenTo:
From:
0.37 09/24/2007619 Milford St
1500 NA NARWCL Bowling Green
Bus US 301From:To:
From:
0.55
Town of Bowling Green
09/24/2007619 Milford St
1300 1% 1% 0.112 1400G F0% 0% F G
161205 Ennis St
98%
From:To:
0.06 0% 2009619 Chase St 0.538
780 1% 1% 0.105 840G F0% 0% C GUS 301 Richmond Tpke
98%To:
0.28 0% 2009619 Chase St 0.617
340 1% 1% 0.129 370G F0% 0% F GUS 301 Richmond Tpke
16640 Smoots Rd; Wrightsville Rd98%
To:
From:
2.52 0%
Caroline County
2009619 Chase St 0.622
45 NA NAR16652 Ruther Glen Rd
Dead EndTo:
From:
0.19 09/06/2007620 Chesterfield Rd
40 NA NAR16640 Maragossic Dr
16608 S, Seals RdFrom:
To:
From:
2.50 08/18/2004621
16608 N, Seals Rd40 NA NAR
16618 Alps RdTo:
2.00 08/18/2004621
146/12/2010
Virginia Department of TransportationTraffic Engineering Division
2009Annual Average Daily Traffic Volume Estimates By Section of Route
Caroline Maintenance Area
Route AADT1Trail 2Trail
4TireK
QA2Axle 3+Axle
QC QKBusLengthTruck
FactorAAWDT QW Year
DirFactor
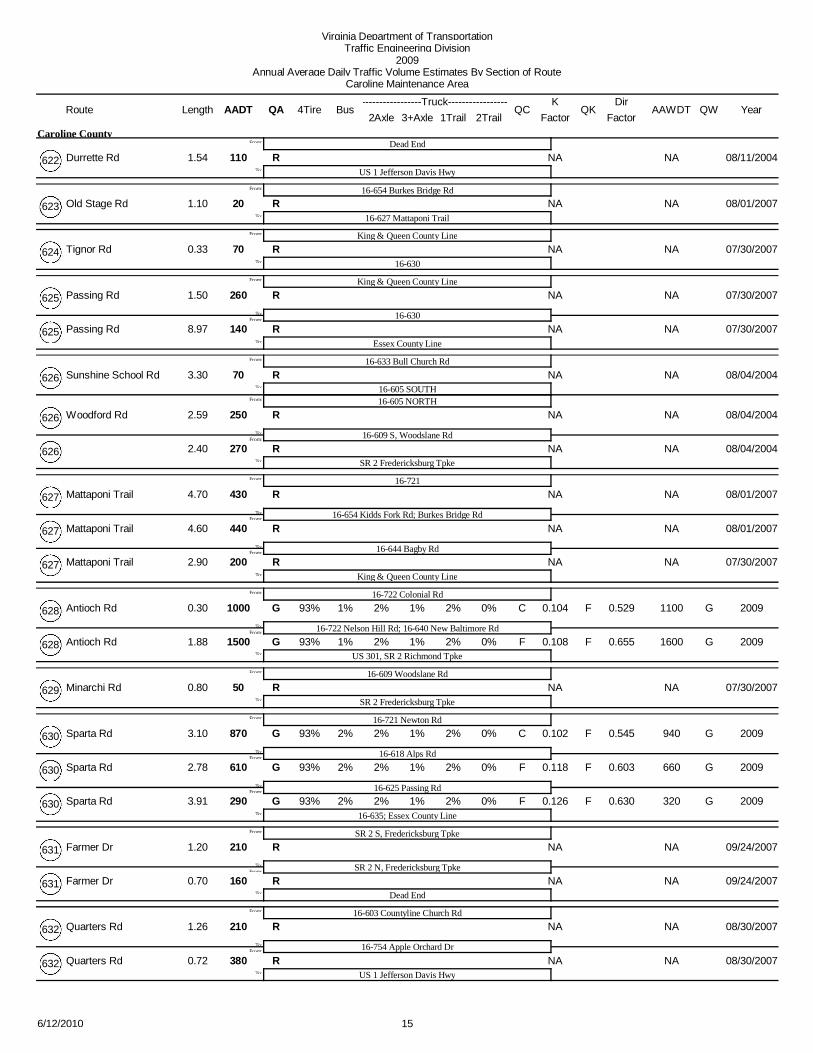
110 NA NARDead End
US 1 Jefferson Davis HwyTo:
From:
1.54
Caroline County
08/11/2004622 Durrette Rd
20 NA NAR16654 Burkes Bridge Rd
16627 Mattaponi TrailTo:
From:
1.10 08/01/2007623 Old Stage Rd
70 NA NARKing & Queen County Line
16630To:
From:
0.33 07/30/2007624 Tignor Rd
260 NA NARKing & Queen County Line
16630From:To:
From:
1.50 07/30/2007625 Passing Rd
140 NA NAREssex County LineTo:
8.97 07/30/2007625 Passing Rd
70 NA NAR16633 Bull Church Rd
16605 SOUTHFrom:
To:
From:
3.30 08/04/2004626 Sunshine School Rd
16605 NORTH250 NA NAR
16609 S, Woodslane RdFrom:To:
2.59 08/04/2004626 Woodford Rd
270 NA NARSR 2 Fredericksburg TpkeTo:
2.40 08/04/2004626
430 NA NAR16721
16654 Kidds Fork Rd; Burkes Bridge RdFrom:To:
From:
4.70 08/01/2007627 Mattaponi Trail
440 NA NAR
16644 Bagby RdFrom:To:
4.60 08/01/2007627 Mattaponi Trail
200 NA NARKing & Queen County LineTo:
2.90 07/30/2007627 Mattaponi Trail
1000 1% 2% 0.104 1100G F1% 2% C G16722 Colonial Rd
16722 Nelson Hill Rd; 16640 New Baltimore Rd
93%
From:To:
From:
0.30 0% 2009628 Antioch Rd 0.529
1500 1% 2% 0.108 1600G F1% 2% F GUS 301, SR 2 Richmond Tpke
93%To:
1.88 0% 2009628 Antioch Rd 0.655
50 NA NAR16609 Woodslane Rd
SR 2 Fredericksburg TpkeTo:
From:
0.80 07/30/2007629 Minarchi Rd
870 2% 2% 0.102 940G F1% 2% C G16721 Newton Rd
16618 Alps Rd
93%
From:To:
From:
3.10 0% 2009630 Sparta Rd 0.545
610 2% 2% 0.118 660G F1% 2% F G
16625 Passing Rd
93%
From:To:
2.78 0% 2009630 Sparta Rd 0.603
290 2% 2% 0.126 320G F1% 2% F G16635; Essex County Line
93%To:
3.91 0% 2009630 Sparta Rd 0.630
210 NA NARSR 2 S, Fredericksburg Tpke
SR 2 N, Fredericksburg TpkeFrom:To:
From:
1.20 09/24/2007631 Farmer Dr
160 NA NARDead EndTo:
0.70 09/24/2007631 Farmer Dr
210 NA NAR16603 Countyline Church Rd
16754 Apple Orchard DrFrom:To:
From:
1.26 08/30/2007632 Quarters Rd
380 NA NARUS 1 Jefferson Davis HwyTo:
0.72 08/30/2007632 Quarters Rd
156/12/2010
Virginia Department of TransportationTraffic Engineering Division
2009Annual Average Daily Traffic Volume Estimates By Section of Route
Caroline Maintenance Area
Route AADT1Trail 2Trail
4TireK
QA2Axle 3+Axle
QC QKBusLengthTruck
FactorAAWDT QW Year
DirFactor
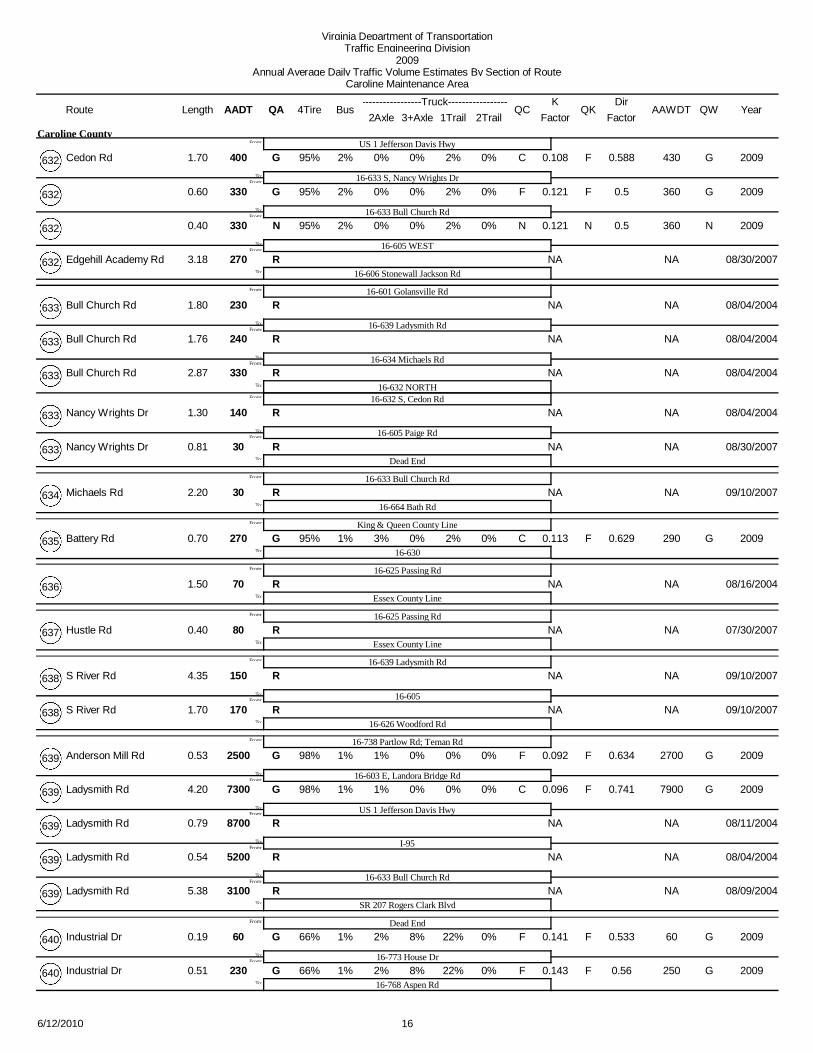
400 2% 0% 0.108 430G F0% 2% C GUS 1 Jefferson Davis Hwy
16633 S, Nancy Wrights Dr
95%
From:To:
From:
1.70 0%
Caroline County
2009632 Cedon Rd 0.588
330 2% 0% 0.121 360G F0% 2% F G
16633 Bull Church Rd
95%
From:To:
0.60 0% 2009632 0.5
330 2% 0% 0.121 360N N0% 2% N N
16605 WEST
95%
From:To:
0.40 0% 2009632 0.5
270 NA NAR16606 Stonewall Jackson RdTo:
3.18 08/30/2007632 Edgehill Academy Rd
230 NA NAR16601 Golansville Rd
16639 Ladysmith RdFrom:To:
From:
1.80 08/04/2004633 Bull Church Rd
240 NA NAR
16634 Michaels RdFrom:To:
1.76 08/04/2004633 Bull Church Rd
330 NA NAR16632 NORTH
From:
To:
2.87 08/04/2004633 Bull Church Rd
16632 S, Cedon Rd140 NA NAR
16605 Paige RdFrom:To:
1.30 08/04/2004633 Nancy Wrights Dr
30 NA NARDead EndTo:
0.81 08/30/2007633 Nancy Wrights Dr
30 NA NAR16633 Bull Church Rd
16664 Bath RdTo:
From:
2.20 09/10/2007634 Michaels Rd
270 1% 3% 0.113 290G F0% 2% C GKing & Queen County Line
1663095%
To:
From:
0.70 0% 2009635 Battery Rd 0.629
70 NA NAR16625 Passing Rd
Essex County LineTo:
From:
1.50 08/16/2004636
80 NA NAR16625 Passing Rd
Essex County LineTo:
From:
0.40 07/30/2007637 Hustle Rd
150 NA NAR16639 Ladysmith Rd
16605From:To:
From:
4.35 09/10/2007638 S River Rd
170 NA NAR16626 Woodford RdTo:
1.70 09/10/2007638 S River Rd
2500 1% 1% 0.092 2700G F0% 0% F G16738 Partlow Rd; Teman Rd
16603 E, Landora Bridge Rd
98%
From:To:
From:
0.53 0% 2009639 Anderson Mill Rd 0.634
7300 1% 1% 0.096 7900G F0% 0% C G
US 1 Jefferson Davis Hwy
98%
From:To:
4.20 0% 2009639 Ladysmith Rd 0.741
8700 NA NAR
I95From:To:
0.79 08/11/2004639 Ladysmith Rd
5200 NA NAR
16633 Bull Church RdFrom:To:
0.54 08/04/2004639 Ladysmith Rd
3100 NA NARSR 207 Rogers Clark BlvdTo:
5.38 08/09/2004639 Ladysmith Rd
60 1% 2% 0.141 60G F8% 22% F GDead End
16773 House Dr
66%
From:To:
From:
0.19 0% 2009640 Industrial Dr 0.533
230 1% 2% 0.143 250G F8% 22% F G16768 Aspen Rd
66%To:
0.51 0% 2009640 Industrial Dr 0.56
166/12/2010

Virginia Department of TransportationTraffic Engineering Division
2009Annual Average Daily Traffic Volume Estimates By Section of Route
Caroline Maintenance Area
Route AADT1Trail 2Trail
4TireK
QA2Axle 3+Axle
QC QKBusLengthTruck
FactorAAWDT QW Year
DirFactor
570 1% 2% 0.110 620G F8% 22% C G16768 Aspen Rd
16722 W, Nelson Hill Rd66%
From:
To:
From:
0.26 0%
Caroline County
2009640 Industrial Dr
16628 Antioch Rd; 16722 Nelson Hill Rd
0.75
570 1% 2% 0.103 620G F8% 22% F GUS 301, SR 2 S, Richmond Tpke
66%
From:
To:
1.92 0% 2009640 New Baltimore Rd
US 301, SR 2 N, Richmond Tpke
0.661
120 1% 2% 0.126 130G F8% 22% F G16619 Chase St
66%
From:
To:
2.06 0% 2009640 Wrightsville Rd
16619
0.617
230 NA NAR16641 W, Perimeter Rd
From:
To:
2.35 09/27/2007640 Smoots Rd
16641 E, Perimeter Rd70 NA NAR
16721 Sparta RdTo:
3.28 08/01/2007640 Maragossic Dr
130 NA NAR16721
16640 E, Maragossic DrFrom:To:
From:
3.25 09/27/2007641 Perimeter Rd
160 NA NAR16618 Alps RdTo:
5.90 08/01/2007641 Perimeter Rd
220 NA NAR16716 Moncure Dr
Dead EndTo:
From:
0.30 09/06/2007642 Cammack Rd
420 NA NAR16721
16654 E, Pendleton RdFrom:To:
From:
1.80 08/01/2007643 File Rd
120 NA NAR16644 Bagby RdTo:
2.20 08/01/2007643 File Rd
90 NA NAR16627 Mattaponi Trail
16643 File RdFrom:To:
From:
2.20 07/30/2007644 Bagby Rd
120 NA NAR16721To:
2.00 07/30/2007644 Bagby Rd
80 NA NAR16721
16618 Alps RdTo:
From:
1.65 07/30/2007645 Lauraville Lane
40 NA NAR16627 Mattaponi Trail
16721To:
From:
3.60 07/30/2007646 Fork Bridge Rd
830 NA NARUS 301 Richmond Tpke
161310From:To:
From:
0.55 08/06/2007647 Doggetts Fork Rd
210 NA NAR16601 WEST
From:
To:
2.06 08/06/2007647 Doggetts Fork Rd
16601 EAST280 NA NAR
16627 W, Mattaponi TrailFrom:
To:
1.90 08/06/2007647 Reedy Mill Rd
16627 E, Mattaponi Trail6 NA NAR
16654 Kidds Fork RdTo:
1.80 08/01/2007647 Asheville Rd
320 NA NARUS 301 S, Richmond Tpke
16663From:To:
From:
1.95 08/06/2007648 Sunshine Rd
110 NA NAR
16647 Doggetts Fork RdFrom:To:
1.90 08/06/2007648 Sunshine Rd
330 NA NARUS 301 N, Richmond TpkeTo:
0.53 08/06/2007648 Sunshine Rd
176/12/2010

Virginia Department of TransportationTraffic Engineering Division
2009Annual Average Daily Traffic Volume Estimates By Section of Route
Caroline Maintenance Area
Route AADT1Trail 2Trail
4TireK
QA2Axle 3+Axle
QC QKBusLengthTruck
FactorAAWDT QW Year
DirFactor
110 NA NAR16600
16648 Sunshine RdTo:
From:
0.55
Caroline County
10/29/2004649
170 NA NARDead End
SR 30 W, Dawn BlvdFrom:
To:
From:
2.07 08/06/2007650 Discovery Lane
SR 30 MID48 NA NAR
SR 30 E, Dawn BlvdTo:
0.60 08/06/2007650 Winston Loop
2 NA NARUS 301 S, Richmond Tpke
US 301 S MIDFrom:To:
From:
0.60 08/08/2007651 North Wales Rd
190 NA NAR
US 301 MIDFrom:To:
2.10 07/19/2004651 Mt Gideon Rd
420 NA NAR
US 301 N MIDFrom:To:
0.50 07/19/2004651 Baylor Rd
1300 NA NAR
SR 30 Dawn BlvdFrom:To:
0.22 07/19/2004651 Old Dawn Rd
840 NA NAR
16694 Courtney RdFrom:To:
0.20 07/19/2004651 Old Dawn Rd
360 NA NARUS 301 N, Richmond TpkeTo:
0.80 07/19/2004651 Old Dawn Rd
580 NA NAR16651 Baylor Rd
16725 Sadie Lane RdFrom:To:
From:
1.00 07/19/2004652 Riva Rd
70 NA NARSR 30 W, Dawn Blvd
From:
To:
3.03 07/19/2004652 Meadow Farm Rd
SR 30 E, Dawn Blvd1200 1% 0% 0.094 1300G F0% 2% C G
16654 Signboard Rd
96%
From:To:
3.83 0% 2009652 Signboard Rd 0.667
2000 1% 0% 0.098 2100G F0% 2% F G
SR 207 Rogers Clark Blvd
96%
From:To:
4.26 0% 2009652 Ruther Glen Rd 0.679
710 NA 710G G
16716 Moncure DrFrom:To:
0.95 2009652
370 NA NARUS 1 Jefferson Davis HwyTo:
2.80 08/09/2004652 Cool Water Dr
190 NA NAR16652 Signboard Rd
US 301 Richmond TpkeTo:
From:
3.45 07/19/2004653 Burruss Lane
420 NA NAR16652 Ruther Glen Rd
16656 W, Day Bridge RdFrom:
To:
From:
1.70 08/08/2007654 Signboard Rd
16656 E, Day Bridge Rd240 NA NAR
US 301; SR 2From:To:
2.60 08/08/2007654 Moores Mill Rd
290 NA NAR16601 WEST
From:
To:
0.10 08/08/2007654 Burkes Bridge Rd
16601 EAST90 NA NAR
16627 Mattaponi TrailFrom:To:
2.84 08/06/2007654 Burkes Bridge Rd
130 NA NAR16643 W, File Rd
From:
To:
3.40 08/01/2007654 Kidds Fork Rd
16643 E, File Rd120 NA NAR
16721To:
1.80 08/01/2007654 Pendleton Rd
186/12/2010
Virginia Department of TransportationTraffic Engineering Division
2009Annual Average Daily Traffic Volume Estimates By Section of Route
Caroline Maintenance Area
Route AADT1Trail 2Trail
4TireK
QA2Axle 3+Axle
QC QKBusLengthTruck
FactorAAWDT QW Year
DirFactor
160 NA NAR16656 Day Bridge Rd
16654 Moores Mill RdTo:
From:
1.76
Caroline County
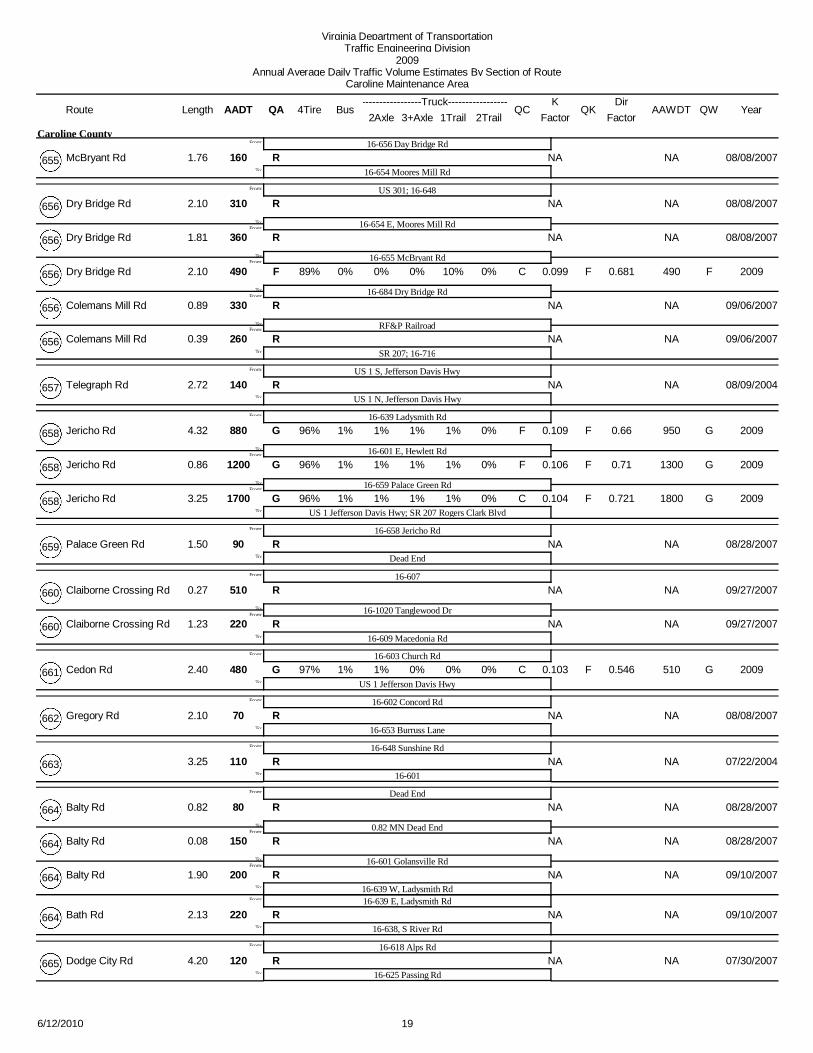
08/08/2007655 McBryant Rd
310 NA NARUS 301; 16648
16654 E, Moores Mill RdFrom:To:
From:
2.10 08/08/2007656 Dry Bridge Rd
360 NA NAR
16655 McBryant RdFrom:To:
1.81 08/08/2007656 Dry Bridge Rd
490 0% 0% 0.099 490F F0% 10% C F
16684 Dry Bridge Rd
89%
From:To:
2.10 0% 2009656 Dry Bridge Rd 0.681
330 NA NAR
RF&P RailroadFrom:To:
0.89 09/06/2007656 Colemans Mill Rd
260 NA NARSR 207; 16716To:
0.39 09/06/2007656 Colemans Mill Rd
140 NA NARUS 1 S, Jefferson Davis Hwy
US 1 N, Jefferson Davis HwyTo:
From:
2.72 08/09/2004657 Telegraph Rd
880 1% 1% 0.109 950G F1% 1% F G16639 Ladysmith Rd
16601 E, Hewlett Rd
96%
From:To:
From:
4.32 0% 2009658 Jericho Rd 0.66
1200 1% 1% 0.106 1300G F1% 1% F G
16659 Palace Green Rd
96%
From:To:
0.86 0% 2009658 Jericho Rd 0.71
1700 1% 1% 0.104 1800G F1% 1% C GUS 1 Jefferson Davis Hwy; SR 207 Rogers Clark Blvd
96%To:
3.25 0% 2009658 Jericho Rd 0.721
90 NA NAR16658 Jericho Rd
Dead EndTo:
From:
1.50 08/28/2007659 Palace Green Rd
510 NA NAR16607
161020 Tanglewood DrFrom:To:
From:
0.27 09/27/2007660 Claiborne Crossing Rd
220 NA NAR16609 Macedonia RdTo:
1.23 09/27/2007660 Claiborne Crossing Rd
480 1% 1% 0.103 510G F0% 0% C G16603 Church Rd
US 1 Jefferson Davis Hwy97%
To:
From:
2.40 0% 2009661 Cedon Rd 0.546
70 NA NAR16602 Concord Rd
16653 Burruss LaneTo:
From:
2.10 08/08/2007662 Gregory Rd
110 NA NAR16648 Sunshine Rd
16601To:
From:
3.25 07/22/2004663
80 NA NARDead End
0.82 MN Dead EndFrom:To:
From:
0.82 08/28/2007664 Balty Rd
150 NA NAR
16601 Golansville RdFrom:To:
0.08 08/28/2007664 Balty Rd
200 NA NAR16639 W, Ladysmith Rd
From:
To:
1.90 09/10/2007664 Balty Rd
16639 E, Ladysmith Rd220 NA NAR
16638, S River RdTo:
2.13 09/10/2007664 Bath Rd
120 NA NAR16618 Alps Rd
16625 Passing RdTo:
From:
4.20 07/30/2007665 Dodge City Rd
196/12/2010

Virginia Department of TransportationTraffic Engineering Division
2009Annual Average Daily Traffic Volume Estimates By Section of Route
Caroline Maintenance Area
Route AADT1Trail 2Trail
4TireK
QA2Axle 3+Axle
QC QKBusLengthTruck
FactorAAWDT QW Year
DirFactor
40 NA NARDead End
0.69 ME Dead EndFrom:To:
From:
0.69
Caroline County
09/12/2007666 Rixey Rd
80 NA NAR16631 Farmer DrTo:
0.21 09/12/2007666 Rixey Rd
260 NA NARSpotsylvania County Line
16609 S, Macedonia RdFrom:
To:
From:
0.42 09/27/2007668 Summit Crossing Rd
16609 N, Macedonia Rd270 NA NAR
SR 2 Fredericksburg TpkeTo:
3.08 09/27/2007668 Long Branch Rd
210 NA NARSpotsylvania County Line
16738 N, Anderson Mill RdFrom:
To:
From:
1.75 08/09/2004669 Trivette Rd
16738 S, Anderson Mill Rd60 NA NAR
16603 Landora Bridge RdTo:
1.10 08/09/2004669 Sizer Rd
140 NA NAR16600
16663To:
From:
1.60 08/06/2007670 Lewis Moore Rd
190 NA NAR16738 S, Anderson Mill Rd
16738 Mid, Partlow RdFrom:
To:
From:
1.90 08/28/2007671 Chilesburg Rd
16738 W, Partlow Rd300 NA NAR
16603 County Line Church RdTo:
1.37 08/28/2007671 Goose Hill Rd
100 NA NAR16601 Golansville Rd
16639 Ladysmith RdTo:
From:
1.90 09/10/2007672 Boxley Rd
10 NA NARSR 2 Fredericksburg Tpke
Dead EndTo:
From:
0.30 09/27/2007673 Old Grain Rd
90 NA NARDead End
16718 Allport LaneFrom:To:
From:
0.40 08/01/2007674 Burnetts Rd
280 NA NAR16627 Mattaponi TrailTo:
1.20 08/01/2007674 Burnetts Rd
70 NA NARUS 17 Tidewater Trail
Dead EndTo:
From:
1.43 08/20/2007675 Hazelwood Lane
470 3% 2% 0.146 510G F0% 0% C GSR 207 Rogers Clark Blvd
16722 Nelson Hill Rd; Colonial Rd96%
To:
From:
2.21 0% 2009676 Devils Three Jump Rd 0.625
280 NA NARSR 30 Dawn Blvd
16694 Courtney RdFrom:To:
From:
0.80 08/06/2007677 Camp Rd
20 NA NAR16693 Herring Creek RdTo:
1.00 08/06/2007677 Camp Rd
100 NA NAR16644 Bagby Rd
16721To:
From:
0.12 07/30/2007678 Jerusalem Rd
100 NA NAR16669 Trivette Rd
Spotsylvania County LineTo:
From:
1.20 08/28/2007679 Country Rd
40 NA NARDead End
16603 County Line Church RdTo:
From:
0.85 08/30/2007680 Rattletrap Rd
206/12/2010
Virginia Department of TransportationTraffic Engineering Division
2009Annual Average Daily Traffic Volume Estimates By Section of Route
Caroline Maintenance Area
Route AADT1Trail 2Trail
4TireK
QA2Axle 3+Axle
QC QKBusLengthTruck
FactorAAWDT QW Year
DirFactor
70 NA NARUS 17 Tidewater Trail
16758 Eva RdFrom:To:
From:
1.65
Caroline County
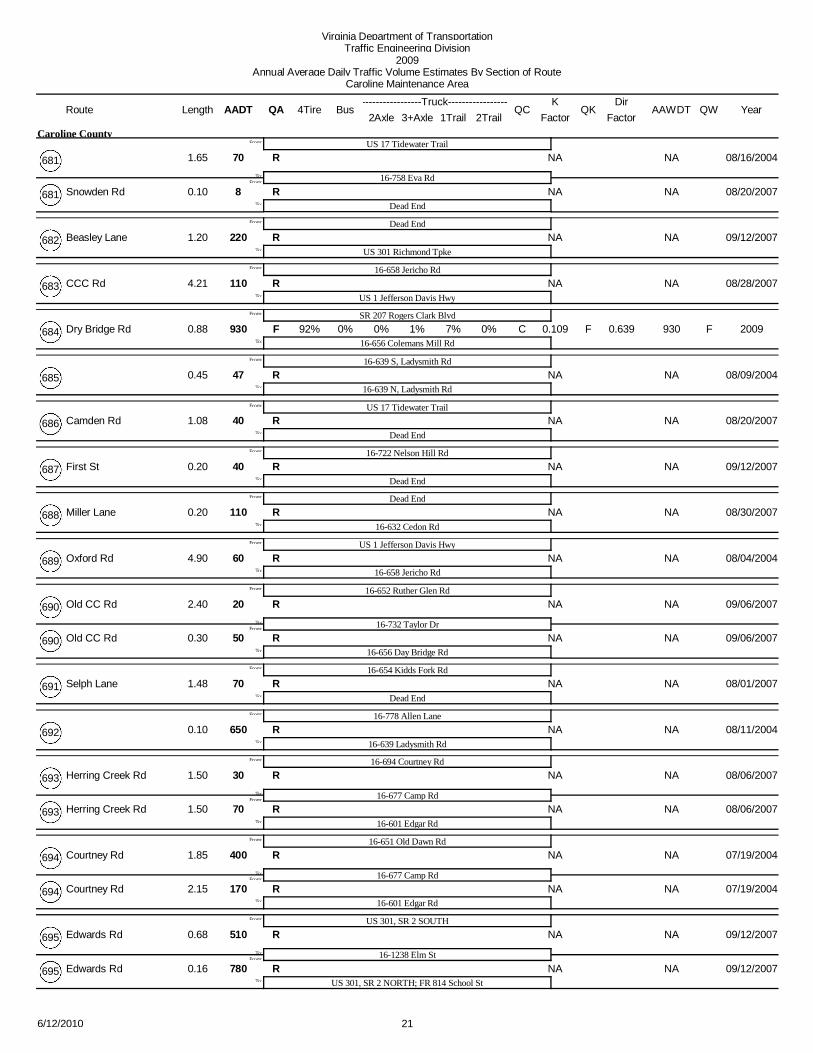
08/16/2004681
8 NA NARDead EndTo:
0.10 08/20/2007681 Snowden Rd
220 NA NARDead End
US 301 Richmond TpkeTo:
From:
1.20 09/12/2007682 Beasley Lane
110 NA NAR16658 Jericho Rd
US 1 Jefferson Davis HwyTo:
From:
4.21 08/28/2007683 CCC Rd
930 0% 0% 0.109 930F F1% 7% C FSR 207 Rogers Clark Blvd
16656 Colemans Mill Rd92%
To:
From:
0.88 0% 2009684 Dry Bridge Rd 0.639
47 NA NAR16639 S, Ladysmith Rd
16639 N, Ladysmith RdTo:
From:
0.45 08/09/2004685
40 NA NARUS 17 Tidewater Trail
Dead EndTo:
From:
1.08 08/20/2007686 Camden Rd
40 NA NAR16722 Nelson Hill Rd
Dead EndTo:
From:
0.20 09/12/2007687 First St
110 NA NARDead End
16632 Cedon RdTo:
From:
0.20 08/30/2007688 Miller Lane
60 NA NARUS 1 Jefferson Davis Hwy
16658 Jericho RdTo:
From:
4.90 08/04/2004689 Oxford Rd
20 NA NAR16652 Ruther Glen Rd
16732 Taylor DrFrom:To:
From:
2.40 09/06/2007690 Old CC Rd
50 NA NAR16656 Day Bridge RdTo:
0.30 09/06/2007690 Old CC Rd
70 NA NAR16654 Kidds Fork Rd
Dead EndTo:
From:
1.48 08/01/2007691 Selph Lane
650 NA NAR16778 Allen Lane
16639 Ladysmith RdTo:
From:
0.10 08/11/2004692
30 NA NAR16694 Courtney Rd
16677 Camp RdFrom:To:
From:
1.50 08/06/2007693 Herring Creek Rd
70 NA NAR16601 Edgar RdTo:
1.50 08/06/2007693 Herring Creek Rd
400 NA NAR16651 Old Dawn Rd
16677 Camp RdFrom:To:
From:
1.85 07/19/2004694 Courtney Rd
170 NA NAR16601 Edgar RdTo:
2.15 07/19/2004694 Courtney Rd
510 NA NARUS 301, SR 2 SOUTH
161238 Elm StFrom:To:
From:
0.68 09/12/2007695 Edwards Rd
780 NA NARUS 301, SR 2 NORTH; FR 814 School StTo:
0.16 09/12/2007695 Edwards Rd
216/12/2010
Virginia Department of TransportationTraffic Engineering Division
2009Annual Average Daily Traffic Volume Estimates By Section of Route
Caroline Maintenance Area
Route AADT1Trail 2Trail
4TireK
QA2Axle 3+Axle
QC QKBusLengthTruck
FactorAAWDT QW Year
DirFactor
60 NA NAR16639 Ladysmith Rd
16764 Scotts LaneFrom:To:
From:
0.01
Caroline County
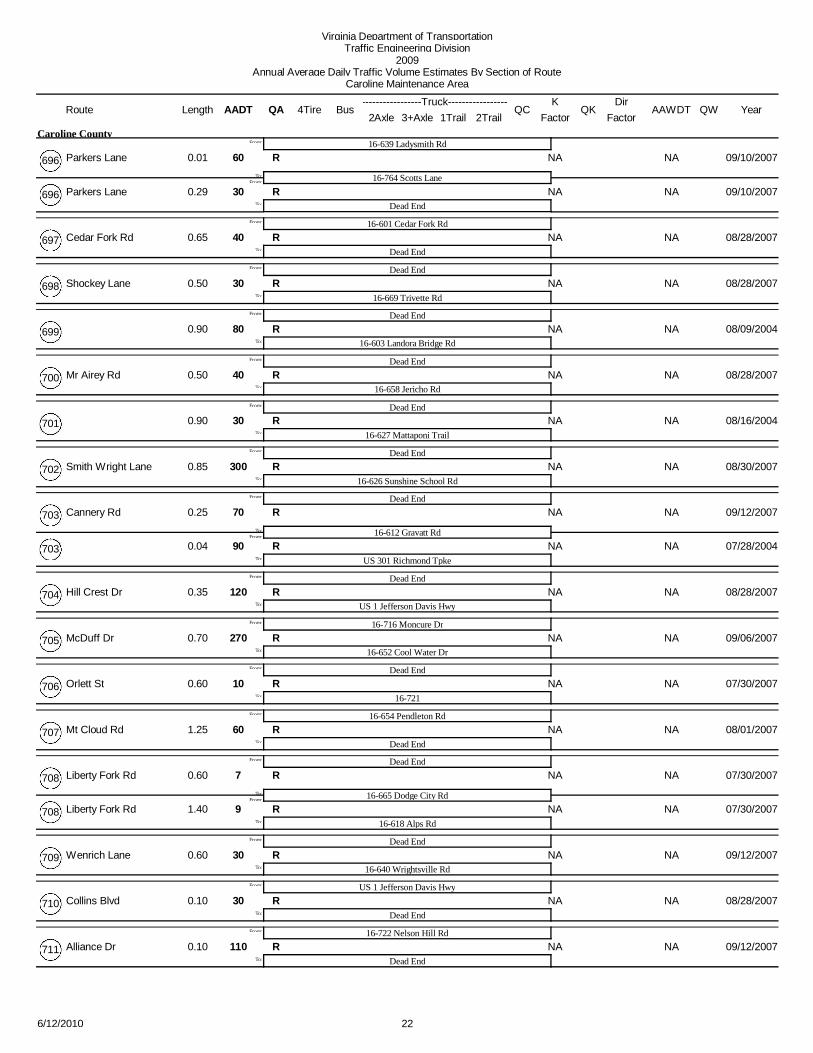
09/10/2007696 Parkers Lane
30 NA NARDead EndTo:
0.29 09/10/2007696 Parkers Lane
40 NA NAR16601 Cedar Fork Rd
Dead EndTo:
From:
0.65 08/28/2007697 Cedar Fork Rd
30 NA NARDead End
16669 Trivette RdTo:
From:
0.50 08/28/2007698 Shockey Lane
80 NA NARDead End
16603 Landora Bridge RdTo:
From:
0.90 08/09/2004699
40 NA NARDead End
16658 Jericho RdTo:
From:
0.50 08/28/2007700 Mr Airey Rd
30 NA NARDead End
16627 Mattaponi TrailTo:
From:
0.90 08/16/2004701
300 NA NARDead End
16626 Sunshine School RdTo:
From:
0.85 08/30/2007702 Smith Wright Lane
70 NA NARDead End
16612 Gravatt RdFrom:To:
From:
0.25 09/12/2007703 Cannery Rd
90 NA NARUS 301 Richmond TpkeTo:
0.04 07/28/2004703
120 NA NARDead End
US 1 Jefferson Davis HwyTo:
From:
0.35 08/28/2007704 Hill Crest Dr
270 NA NAR16716 Moncure Dr
16652 Cool Water DrTo:
From:
0.70 09/06/2007705 McDuff Dr
10 NA NARDead End
16721To:
From:
0.60 07/30/2007706 Orlett St
60 NA NAR16654 Pendleton Rd
Dead EndTo:
From:
1.25 08/01/2007707 Mt Cloud Rd
7 NA NARDead End
16665 Dodge City RdFrom:To:
From:
0.60 07/30/2007708 Liberty Fork Rd
9 NA NAR16618 Alps RdTo:
1.40 07/30/2007708 Liberty Fork Rd
30 NA NARDead End
16640 Wrightsville RdTo:
From:
0.60 09/12/2007709 Wenrich Lane
30 NA NARUS 1 Jefferson Davis Hwy
Dead EndTo:
From:
0.10 08/28/2007710 Collins Blvd
110 NA NAR16722 Nelson Hill Rd
Dead EndTo:
From:
0.10 09/12/2007711 Alliance Dr
226/12/2010
Virginia Department of TransportationTraffic Engineering Division
2009Annual Average Daily Traffic Volume Estimates By Section of Route
Caroline Maintenance Area
Route AADT1Trail 2Trail
4TireK
QA2Axle 3+Axle
QC QKBusLengthTruck
FactorAAWDT QW Year
DirFactor
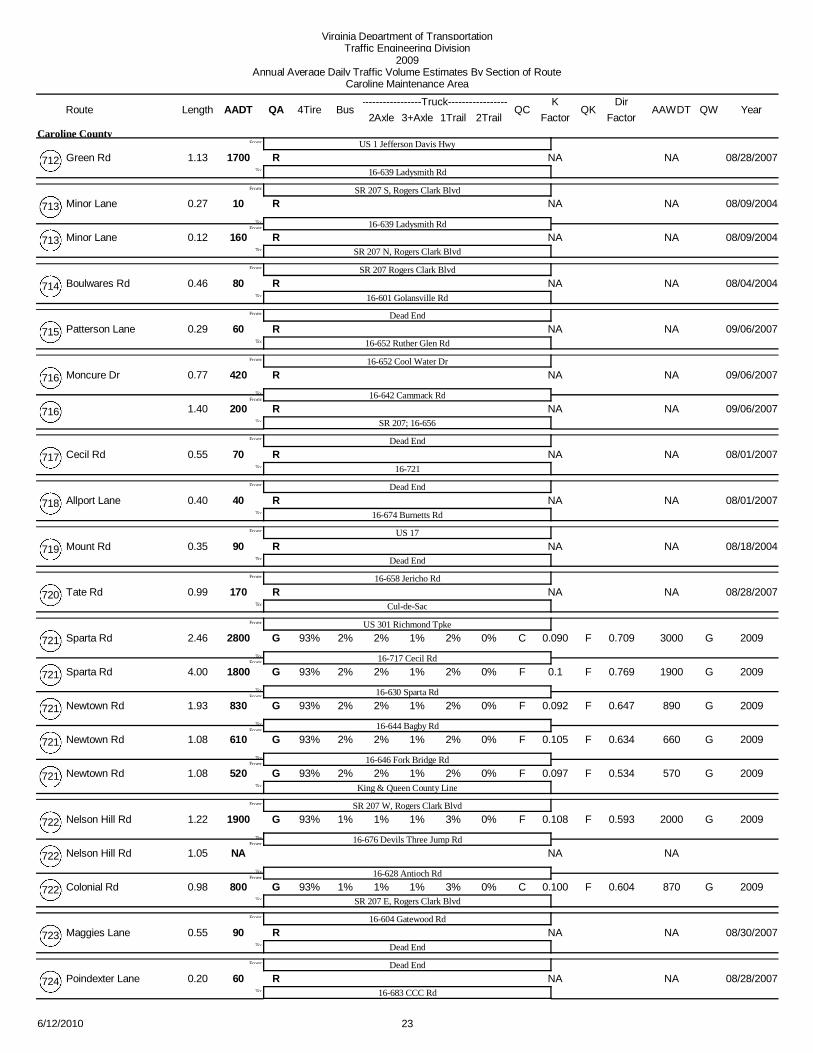
1700 NA NARUS 1 Jefferson Davis Hwy
16639 Ladysmith RdTo:
From:
1.13
Caroline County
08/28/2007712 Green Rd
10 NA NARSR 207 S, Rogers Clark Blvd
16639 Ladysmith RdFrom:To:
From:
0.27 08/09/2004713 Minor Lane
160 NA NARSR 207 N, Rogers Clark BlvdTo:
0.12 08/09/2004713 Minor Lane
80 NA NARSR 207 Rogers Clark Blvd
16601 Golansville RdTo:
From:
0.46 08/04/2004714 Boulwares Rd
60 NA NARDead End
16652 Ruther Glen RdTo:
From:
0.29 09/06/2007715 Patterson Lane
420 NA NAR16652 Cool Water Dr
16642 Cammack RdFrom:To:
From:
0.77 09/06/2007716 Moncure Dr
200 NA NARSR 207; 16656To:
1.40 09/06/2007716
70 NA NARDead End
16721To:
From:
0.55 08/01/2007717 Cecil Rd
40 NA NARDead End
16674 Burnetts RdTo:
From:
0.40 08/01/2007718 Allport Lane
90 NA NARUS 17
Dead EndTo:
From:
0.35 08/18/2004719 Mount Rd
170 NA NAR16658 Jericho Rd
CuldeSacTo:
From:
0.99 08/28/2007720 Tate Rd
2800 2% 2% 0.090 3000G F1% 2% C GUS 301 Richmond Tpke
16717 Cecil Rd
93%
From:To:
From:
2.46 0% 2009721 Sparta Rd 0.709
1800 2% 2% 0.1 1900G F1% 2% F G
16630 Sparta Rd
93%
From:To:
4.00 0% 2009721 Sparta Rd 0.769
830 2% 2% 0.092 890G F1% 2% F G
16644 Bagby Rd
93%
From:To:
1.93 0% 2009721 Newtown Rd 0.647
610 2% 2% 0.105 660G F1% 2% F G
16646 Fork Bridge Rd
93%
From:To:
1.08 0% 2009721 Newtown Rd 0.634
520 2% 2% 0.097 570G F1% 2% F GKing & Queen County Line
93%To:
1.08 0% 2009721 Newtown Rd 0.534
1900 1% 1% 0.108 2000G F1% 3% F GSR 207 W, Rogers Clark Blvd
16676 Devils Three Jump Rd
93%
From:To:
From:
1.22 0% 2009722 Nelson Hill Rd 0.593
NA NA NA
16628 Antioch RdFrom:To:
1.05722 Nelson Hill Rd
800 1% 1% 0.100 870G F1% 3% C GSR 207 E, Rogers Clark Blvd
93%To:
0.98 0% 2009722 Colonial Rd 0.604
90 NA NAR16604 Gatewood Rd
Dead EndTo:
From:
0.55 08/30/2007723 Maggies Lane
60 NA NARDead End
16683 CCC RdTo:
From:
0.20 08/28/2007724 Poindexter Lane
236/12/2010
Virginia Department of TransportationTraffic Engineering Division
2009Annual Average Daily Traffic Volume Estimates By Section of Route
Caroline Maintenance Area
Route AADT1Trail 2Trail
4TireK
QA2Axle 3+Axle
QC QKBusLengthTruck
FactorAAWDT QW Year
DirFactor
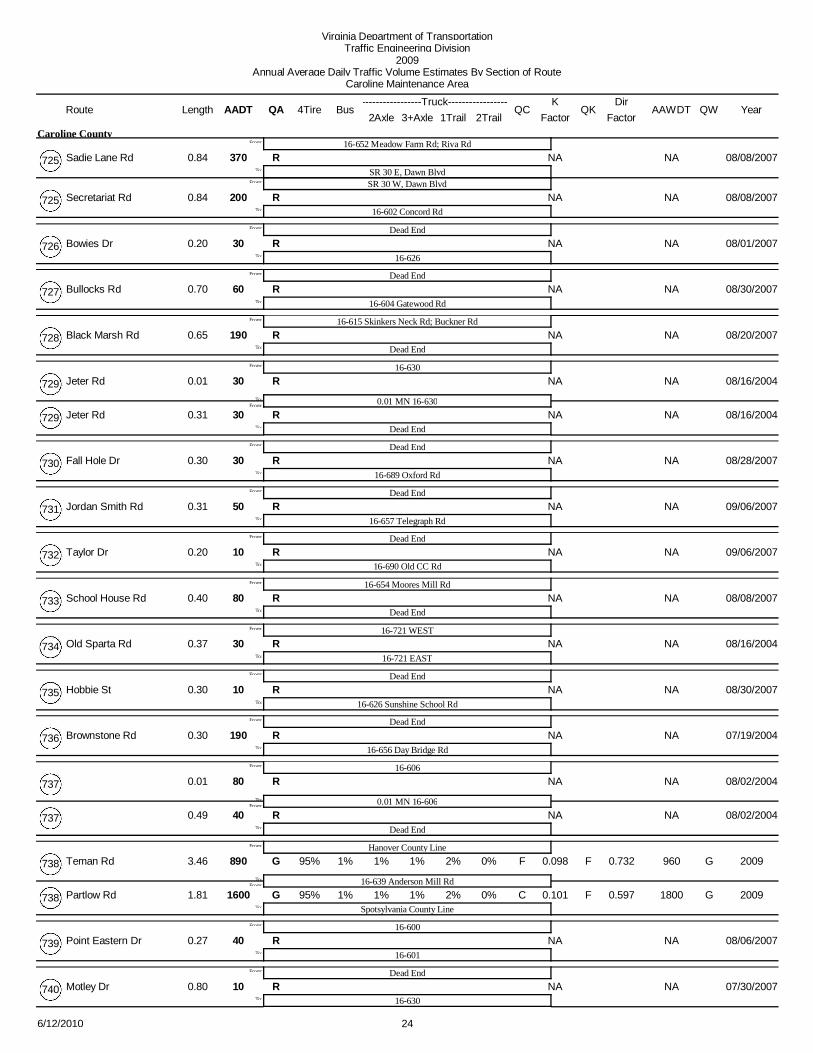
370 NA NAR16652 Meadow Farm Rd; Riva Rd
SR 30 E, Dawn BlvdFrom:
To:
From:
0.84
Caroline County
08/08/2007725 Sadie Lane Rd
SR 30 W, Dawn Blvd200 NA NAR
16602 Concord RdTo:
0.84 08/08/2007725 Secretariat Rd
30 NA NARDead End
16626To:
From:
0.20 08/01/2007726 Bowies Dr
60 NA NARDead End
16604 Gatewood RdTo:
From:
0.70 08/30/2007727 Bullocks Rd
190 NA NAR16615 Skinkers Neck Rd; Buckner Rd
Dead EndTo:
From:
0.65 08/20/2007728 Black Marsh Rd
30 NA NAR16630
0.01 MN 16630From:To:
From:
0.01 08/16/2004729 Jeter Rd
30 NA NARDead EndTo:
0.31 08/16/2004729 Jeter Rd
30 NA NARDead End
16689 Oxford RdTo:
From:
0.30 08/28/2007730 Fall Hole Dr
50 NA NARDead End
16657 Telegraph RdTo:
From:
0.31 09/06/2007731 Jordan Smith Rd
10 NA NARDead End
16690 Old CC RdTo:
From:
0.20 09/06/2007732 Taylor Dr
80 NA NAR16654 Moores Mill Rd
Dead EndTo:
From:
0.40 08/08/2007733 School House Rd
30 NA NAR16721 WEST
16721 EASTTo:
From:
0.37 08/16/2004734 Old Sparta Rd
10 NA NARDead End
16626 Sunshine School RdTo:
From:
0.30 08/30/2007735 Hobbie St
190 NA NARDead End
16656 Day Bridge RdTo:
From:
0.30 07/19/2004736 Brownstone Rd
80 NA NAR16606
0.01 MN 16606From:To:
From:
0.01 08/02/2004737
40 NA NARDead EndTo:
0.49 08/02/2004737
890 1% 1% 0.098 960G F1% 2% F GHanover County Line
16639 Anderson Mill Rd
95%
From:To:
From:
3.46 0% 2009738 Teman Rd 0.732
1600 1% 1% 0.101 1800G F1% 2% C GSpotsylvania County Line
95%To:
1.81 0% 2009738 Partlow Rd 0.597
40 NA NAR16600
16601To:
From:
0.27 08/06/2007739 Point Eastern Dr
10 NA NARDead End
16630To:
From:
0.80 07/30/2007740 Motley Dr
246/12/2010
Virginia Department of TransportationTraffic Engineering Division
2009Annual Average Daily Traffic Volume Estimates By Section of Route
Caroline Maintenance Area
Route AADT1Trail 2Trail
4TireK
QA2Axle 3+Axle
QC QKBusLengthTruck
FactorAAWDT QW Year
DirFactor
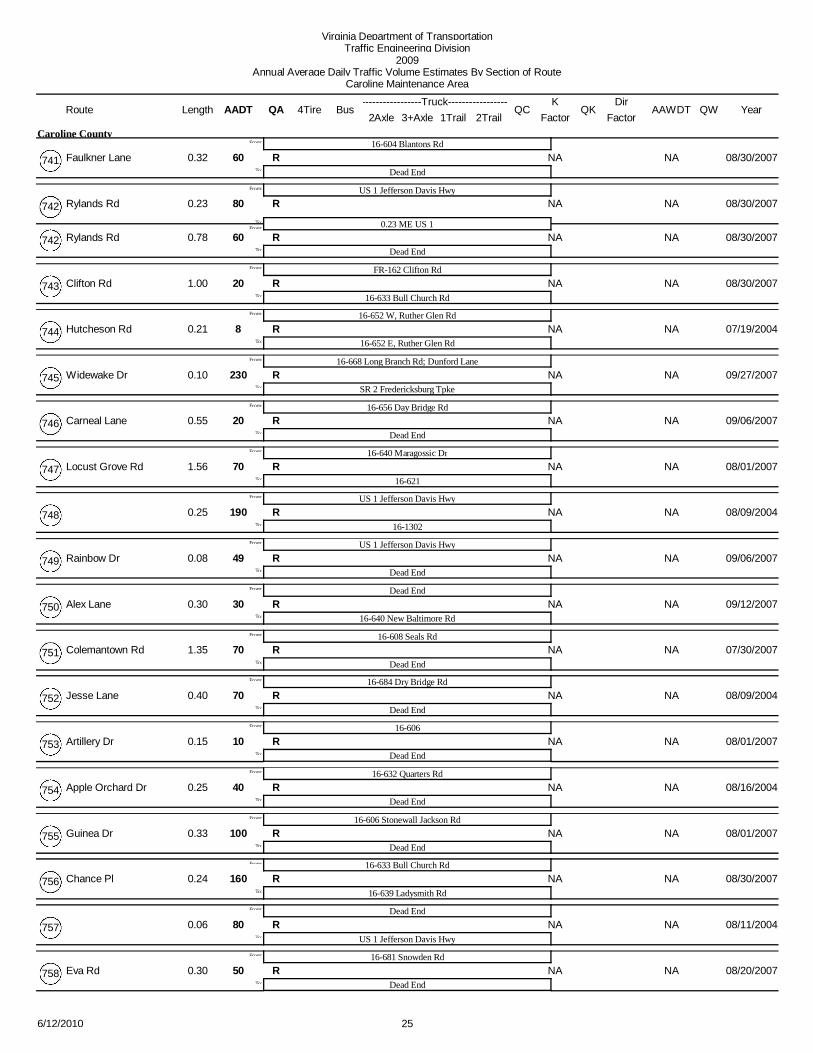
60 NA NAR16604 Blantons Rd
Dead EndTo:
From:
0.32
Caroline County
08/30/2007741 Faulkner Lane
80 NA NARUS 1 Jefferson Davis Hwy
0.23 ME US 1From:To:
From:
0.23 08/30/2007742 Rylands Rd
60 NA NARDead EndTo:
0.78 08/30/2007742 Rylands Rd
20 NA NARFR162 Clifton Rd
16633 Bull Church RdTo:
From:
1.00 08/30/2007743 Clifton Rd
8 NA NAR16652 W, Ruther Glen Rd
16652 E, Ruther Glen RdTo:
From:
0.21 07/19/2004744 Hutcheson Rd
230 NA NAR16668 Long Branch Rd; Dunford Lane
SR 2 Fredericksburg TpkeTo:
From:
0.10 09/27/2007745 Widewake Dr
20 NA NAR16656 Day Bridge Rd
Dead EndTo:
From:
0.55 09/06/2007746 Carneal Lane
70 NA NAR16640 Maragossic Dr
16621To:
From:
1.56 08/01/2007747 Locust Grove Rd
190 NA NARUS 1 Jefferson Davis Hwy
161302To:
From:
0.25 08/09/2004748
49 NA NARUS 1 Jefferson Davis Hwy
Dead EndTo:
From:
0.08 09/06/2007749 Rainbow Dr
30 NA NARDead End
16640 New Baltimore RdTo:
From:
0.30 09/12/2007750 Alex Lane
70 NA NAR16608 Seals Rd
Dead EndTo:
From:
1.35 07/30/2007751 Colemantown Rd
70 NA NAR16684 Dry Bridge Rd
Dead EndTo:
From:
0.40 08/09/2004752 Jesse Lane
10 NA NAR16606
Dead EndTo:
From:
0.15 08/01/2007753 Artillery Dr
40 NA NAR16632 Quarters Rd
Dead EndTo:
From:
0.25 08/16/2004754 Apple Orchard Dr
100 NA NAR16606 Stonewall Jackson Rd
Dead EndTo:
From:
0.33 08/01/2007755 Guinea Dr
160 NA NAR16633 Bull Church Rd
16639 Ladysmith RdTo:
From:
0.24 08/30/2007756 Chance Pl
80 NA NARDead End
US 1 Jefferson Davis HwyTo:
From:
0.06 08/11/2004757
50 NA NAR16681 Snowden Rd
Dead EndTo:
From:
0.30 08/20/2007758 Eva Rd
256/12/2010

Virginia Department of TransportationTraffic Engineering Division
2009Annual Average Daily Traffic Volume Estimates By Section of Route
Caroline Maintenance Area
Route AADT1Trail 2Trail
4TireK
QA2Axle 3+Axle
QC QKBusLengthTruck
FactorAAWDT QW Year
DirFactor
48 NA NARDead End
Spotsylvania County LineTo:
From:
0.55
Caroline County
08/30/2007759 Orrock Rd
50 NA NARDead End
16646 Fork Bridge RdTo:
From:
1.50 07/30/2007760 Sorrell Lane
60 NA NARDead End
16627 Mattaponi TrailTo:
From:
0.90 07/30/2007761 Gether Lane
70 NA NAR16689 Oxford Rd
Dead EndTo:
From:
0.20 08/28/2007762 Long Creek Dr
110 NA NARSR 30 W, Dawn Blvd
SR 30 E, Dawn BlvdTo:
From:
0.45 07/19/2004763
20 NA NAR16696 Parkers Lane
Dead EndTo:
From:
0.26 09/10/2007764 Scotts Lane
90 NA NAR16639 Ladysmith Rd
16638, S River RdTo:
From:
0.23 09/10/2007765 St Johns Church Rd
30 NA NARDead End
US 17To:
From:
2.30 08/20/2007766 Burma Rd
70 NA NAR16664 Bath Rd
Dead EndTo:
From:
0.65 09/10/2007767 McKinney Dr
160 NA NAR16640 Industrial Dr
Dead EndTo:
From:
0.23 09/12/2007768 Aspen Rd
40 NA NARDead End
16722 Colonial RdTo:
From:
0.19 08/28/2007770 Rock Lane
30 NA NARDead End
16639 Ladysmith RdTo:
From:
0.10 08/28/2007771 Miss Clara Lane
210 NA NAR16606
CuldeSacTo:
From:
0.45 08/01/2007772 Twin Cedars Dr
220 NA NAR16640 Industrial Dr
Dead EndTo:
From:
0.19 09/12/2007773 House Dr
130 NA NARDead End
US 1 Jefferson Davis HwyTo:
From:
0.36 08/16/2004774
60 NA NARDead End
SR 2 Fredericksburg TpkeTo:
From:
0.15 08/02/2004775
120 NA NAR16654 Moores Mill Rd
CuldeSacTo:
From:
0.14 07/19/2004776
90 NA NAR16653 Burruss Lane
CuldeSacTo:
From:
0.34 07/19/2004777 Jennings Dr
49 NA NARDead End
16692To:
From:
0.14 08/28/2007778 Allen Lane
266/12/2010
Virginia Department of TransportationTraffic Engineering Division
2009Annual Average Daily Traffic Volume Estimates By Section of Route
Caroline Maintenance Area
Route AADT1Trail 2Trail
4TireK
QA2Axle 3+Axle
QC QKBusLengthTruck
FactorAAWDT QW Year
DirFactor
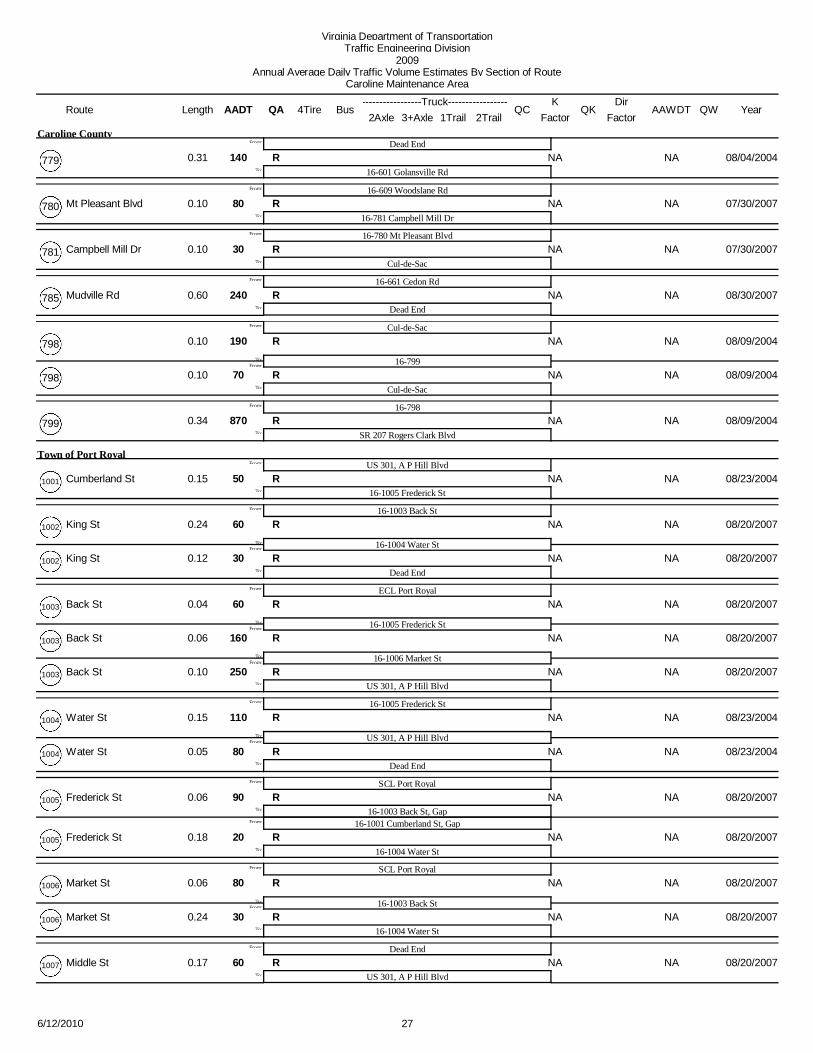
140 NA NARDead End
16601 Golansville RdTo:
From:
0.31
Caroline County
08/04/2004779
80 NA NAR16609 Woodslane Rd
16781 Campbell Mill DrTo:
From:
0.10 07/30/2007780 Mt Pleasant Blvd
30 NA NAR16780 Mt Pleasant Blvd
CuldeSacTo:
From:
0.10 07/30/2007781 Campbell Mill Dr
240 NA NAR16661 Cedon Rd
Dead EndTo:
From:
0.60 08/30/2007785 Mudville Rd
190 NA NARCuldeSac
16799From:To:
From:
0.10 08/09/2004798
70 NA NARCuldeSacTo:
0.10 08/09/2004798
870 NA NAR16798
SR 207 Rogers Clark BlvdTo:
From:
0.34 08/09/2004799
50 NA NARUS 301, A P Hill Blvd
161005 Frederick StTo:
From:
0.15
Town of Port Royal
08/23/20041001 Cumberland St
60 NA NAR161003 Back St
161004 Water StFrom:To:
From:
0.24 08/20/20071002 King St
30 NA NARDead EndTo:
0.12 08/20/20071002 King St
60 NA NARECL Port Royal
161005 Frederick StFrom:To:
From:
0.04 08/20/20071003 Back St
160 NA NAR
161006 Market StFrom:To:
0.06 08/20/20071003 Back St
250 NA NARUS 301, A P Hill BlvdTo:
0.10 08/20/20071003 Back St
110 NA NAR161005 Frederick St
US 301, A P Hill BlvdFrom:To:
From:
0.15 08/23/20041004 Water St
80 NA NARDead EndTo:
0.05 08/23/20041004 Water St
90 NA NARSCL Port Royal
161003 Back St, GapFrom:
To:
From:
0.06 08/20/20071005 Frederick St
161001 Cumberland St, Gap20 NA NAR
161004 Water StTo:
0.18 08/20/20071005 Frederick St
80 NA NARSCL Port Royal
161003 Back StFrom:To:
From:
0.06 08/20/20071006 Market St
30 NA NAR161004 Water StTo:
0.24 08/20/20071006 Market St
60 NA NARDead End
US 301, A P Hill BlvdTo:
From:
0.17 08/20/20071007 Middle St
276/12/2010

Virginia Department of TransportationTraffic Engineering Division
2009Annual Average Daily Traffic Volume Estimates By Section of Route
Caroline Maintenance Area
Route AADT1Trail 2Trail
4TireK
QA2Axle 3+Axle
QC QKBusLengthTruck
FactorAAWDT QW Year
DirFactor
70 NA NARECL Port Royal
US 301, A P Hill BlvdTo:
From:
0.18
Town of Port Royal
08/23/20041008 Caroline St
110 NA NARUS 17 Tidewater Trail
161010 Port St & Royal StTo:
From:
0.20
Caroline County
08/18/20041009 Townfield Dr
50 NA NARUS 17 Tidewater Trail
161009 Townfield DrTo:
From:
0.15 08/18/20041010 Port St & Royal St
270 NA NAR16639 Ladysmith Rd
Dead EndTo:
From:
0.13 09/27/20071011 Center St
400 NA NAR16660 Claiborne Crossing Rd
161021 Tanglewood DrFrom:To:
From:
0.29 09/27/20071020 Tanglewood Dr
NA NA NA161022To:
0.671020
48 NA NARCuldeSac
161020 Tanglewood DrTo:
From:
0.11 09/27/20071021 Tanglewood Dr
NA NA NACuldeSac
CuldeSacTo:
From:
0.181022
NA NA NACuldeSac
161020To:
From:
0.401023
70 NA NAR16648 Sunshine Rd
CuldeSacTo:
From:
0.09 08/08/20071026 Oak Ridge Lane
140 NA NARCuldeSac
16652 Ruther Glen RdTo:
From:
0.40 09/06/20071030 Holly Ridge Lane
30 NA NARCuldeSac
161030; 161032To:
From:
0.11 09/06/20071031 Harmony Court S
30 NA NARCuldeSac
161030; 161031To:
From:
0.10 09/06/20071032 Harmony Court N
NA NA NA161041
CuldeSacTo:
From:
0.101038
NA NA NA161041
CuldeSacTo:
From:
0.121039
230 NA NARUS 17 Tidewater Trail
161041 Begin LoopTo:
From:
0.09 08/20/20071040 Watermans Blvd
90 NA NAR161040 Begin Loop
161040 End LoopTo:
From:
2.01 08/20/20071041 Portobago Trail
49 NA NAR161041 Portobago Trail
CuldeSacTo:
From:
0.46 08/20/20071042 Goosepoint Ct
40 NA NARCuldeSac
161041 Portobago TrailTo:
From:
0.18 08/20/20071043 Canvasback Ct
286/12/2010

Virginia Department of TransportationTraffic Engineering Division
2009Annual Average Daily Traffic Volume Estimates By Section of Route
Caroline Maintenance Area
Route AADT1Trail 2Trail
4TireK
QA2Axle 3+Axle
QC QKBusLengthTruck
FactorAAWDT QW Year
DirFactor
30 NA NARCuldeSac
16631 Farmer DrTo:
From:
0.04
Caroline County
09/24/20071044 Rolling Hills Dr
NA NA NA16668 Long Branch Rd; Dunford Lane
Dead EndTo:
From:
0.561048
NA NA NA161048
Dead EndTo:
From:
0.331049
190 NA NAR16651 Mt Gideon Rd
161051 Arch Hill RdTo:
From:
0.25 08/08/20071050 Catalpa Dr
110 NA NAR161050 Catalpa Dr
161053 Pine Top School RdFrom:To:
From:
0.33 08/08/20071051 Arch Hill Rd
NA NA NACuldeSacTo:
0.231051
30 NA NARCuldeSac
161051 Arch Hill RdTo:
From:
0.08 08/08/20071052 Ashley Ct
50 NA NAR161051 Arch Hill Rd
CuldeSacTo:
From:
0.20 08/08/20071053 Pine Top School Rd
NA NA NACuldeSac
161051To:
From:
0.111054
1300 NA NARSR 207 Rogers Clark Blvd
161071 Omaha DrFrom:To:
From:
0.06 09/12/20071070 Belmont Blvd
NA NA NA161075To:
0.181070 Belmont Blvd
460 NA NAR161072 Johnstown Lane
161070 Belmont BlvdTo:
From:
0.05 09/12/20071071 Omaha Dr
290 NA NAR161071 Omaha Dr
161073 Whirlaway LaneFrom:To:
From:
0.17 09/12/20071072 Johnstown Lane
NA NA NA161074To:
0.481072 Johnstown Lane
150 NA NAR161072 Johnstown Lane
161072 Johnstown LaneTo:
From:
0.21 09/12/20071073 Whirlaway Lane
NA NA NA161075
161070To:
From:
0.401074
NA NA NA161074
CuldeSacTo:
From:
0.431075
20 NA NAR161102 Healy St
161104 Park AveFrom:To:
From:
0.09 07/22/20041101 Rowe St
30 NA NAR161103 Old Colonial RdTo:
0.09 07/22/20041101 Rowe St
40 NA NAR161101 Rowe St
161105 Frances AveTo:
From:
0.06 07/22/20041102 Healy St
296/12/2010

Virginia Department of TransportationTraffic Engineering Division
2009Annual Average Daily Traffic Volume Estimates By Section of Route
Caroline Maintenance Area
Route AADT1Trail 2Trail
4TireK
QA2Axle 3+Axle
QC QKBusLengthTruck
FactorAAWDT QW Year
DirFactor
60 NA NAR161105 Frances Ave
16722 Nelson Hill RdFrom:To:
From:
0.06
Caroline County
07/22/20041102 Healy St
240 NA NAR
161106 Blatt AveFrom:To:
0.05 07/22/20041102 Healy St
120 NA NAR
161108 Mathias AveFrom:To:
0.11 07/22/20041102 Healy St
60 NA NAR161109 Moter AveTo:
0.06 07/22/20041102 Healy St
80 NA NAR16722; 161110
161105 Frances AveFrom:To:
From:
0.06 07/22/20041103 Old Colonial Rd
40 NA NAR161101 Rowe StTo:
0.07 07/22/20041103 Old Colonial Rd
100 NA NAR16722 Nelson Hill Rd
161105 Frances AveFrom:To:
From:
0.06 07/22/20041104 Park Ave
30 NA NAR161101 Rowe StTo:
0.06 07/22/20041104 Park Ave
40 NA NAR161103 Old Colonial Rd
161104 Park AveFrom:To:
From:
0.09 07/22/20041105 Frances Ave
10 NA NAR161102 Healy StTo:
0.09 07/22/20041105 Frances Ave
100 NA NAR161107 Church St
161102 Healy StTo:
From:
0.20 07/22/20041106 Blatt Ave
90 NA NAR161109 Moter Ave
161108 Mathias AveFrom:To:
From:
0.06 07/22/20041107 Church St
210 NA NAR
161106 Blatt AveFrom:To:
0.07 07/22/20041107 Church St
250 NA NAR16722 Nelson Hill RdTo:
0.05 07/22/20041107 Church St
40 NA NAR161107 Church St
161102 Healy StFrom:To:
From:
0.20 07/22/20041108 Mathias Ave
20 NA NAR161111 Wagner StTo:
0.12 07/22/20041108 Mathias Ave
40 NA NAR161107 Church St
161102 Healy StTo:
From:
0.20 07/22/20041109 Moter Ave
60 NA NARDead End
16722; 161103To:
From:
0.20 07/22/20041110 Patrick Ave
30 NA NARDead End
161108 Mathias AveFrom:To:
From:
0.04 07/22/20041111 Wagner St
110 NA NAR16722 Nelson Hill RdTo:
0.17 07/22/20041111 Wagner St
100 NA NAR16601 Penola Rd
Dead EndTo:
From:
0.20 08/04/20041115 Paradise Lane
306/12/2010
Virginia Department of TransportationTraffic Engineering Division
2009Annual Average Daily Traffic Volume Estimates By Section of Route
Caroline Maintenance Area
Route AADT1Trail 2Trail
4TireK
QA2Axle 3+Axle
QC QKBusLengthTruck
FactorAAWDT QW Year
DirFactor
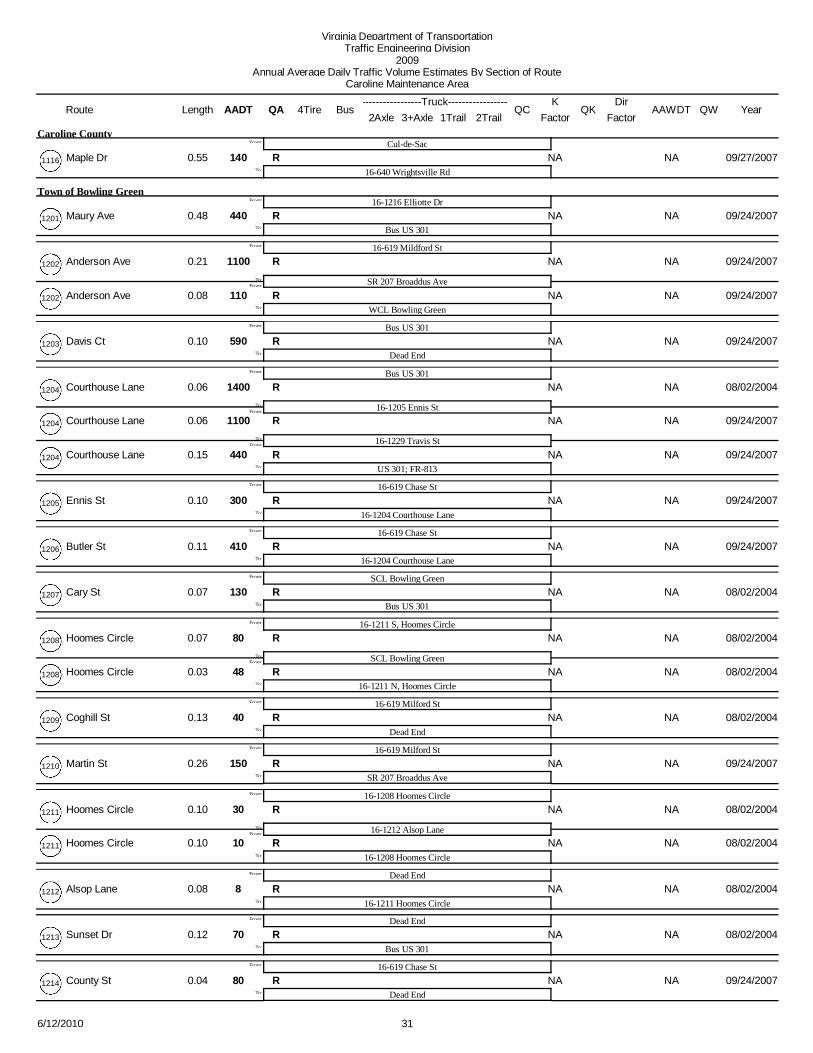
140 NA NARCuldeSac
16640 Wrightsville RdTo:
From:
0.55
Caroline County
09/27/20071116 Maple Dr
440 NA NAR161216 Elliotte Dr
Bus US 301To:
From:
0.48
Town of Bowling Green
09/24/20071201 Maury Ave
1100 NA NAR16619 Mildford St
SR 207 Broaddus AveFrom:To:
From:
0.21 09/24/20071202 Anderson Ave
110 NA NARWCL Bowling GreenTo:
0.08 09/24/20071202 Anderson Ave
590 NA NARBus US 301
Dead EndTo:
From:
0.10 09/24/20071203 Davis Ct
1400 NA NARBus US 301
161205 Ennis StFrom:To:
From:
0.06 08/02/20041204 Courthouse Lane
1100 NA NAR
161229 Travis StFrom:To:
0.06 09/24/20071204 Courthouse Lane
440 NA NARUS 301; FR813To:
0.15 09/24/20071204 Courthouse Lane
300 NA NAR16619 Chase St
161204 Courthouse LaneTo:
From:
0.10 09/24/20071205 Ennis St
410 NA NAR16619 Chase St
161204 Courthouse LaneTo:
From:
0.11 09/24/20071206 Butler St
130 NA NARSCL Bowling Green
Bus US 301To:
From:
0.07 08/02/20041207 Cary St
80 NA NAR161211 S, Hoomes Circle
SCL Bowling GreenFrom:To:
From:
0.07 08/02/20041208 Hoomes Circle
48 NA NAR161211 N, Hoomes CircleTo:
0.03 08/02/20041208 Hoomes Circle
40 NA NAR16619 Milford St
Dead EndTo:
From:
0.13 08/02/20041209 Coghill St
150 NA NAR16619 Milford St
SR 207 Broaddus AveTo:
From:
0.26 09/24/20071210 Martin St
30 NA NAR161208 Hoomes Circle
161212 Alsop LaneFrom:To:
From:
0.10 08/02/20041211 Hoomes Circle
10 NA NAR161208 Hoomes CircleTo:
0.10 08/02/20041211 Hoomes Circle
8 NA NARDead End
161211 Hoomes CircleTo:
From:
0.08 08/02/20041212 Alsop Lane
70 NA NARDead End
Bus US 301To:
From:
0.12 08/02/20041213 Sunset Dr
80 NA NAR16619 Chase St
Dead EndTo:
From:
0.04 09/24/20071214 County St
316/12/2010

Virginia Department of TransportationTraffic Engineering Division
2009Annual Average Daily Traffic Volume Estimates By Section of Route
Caroline Maintenance Area
Route AADT1Trail 2Trail
4TireK
QA2Axle 3+Axle
QC QKBusLengthTruck
FactorAAWDT QW Year
DirFactor
510 NA NAR161201 Maury St
16619 Milford StTo:
From:
0.09
Town of Bowling Green
08/02/20041215 White St
20 NA NARDead End
161201 Maury StFrom:To:
From:
0.03 08/02/20041216 Elliotte Dr
120 NA NAR16619 Milford StTo:
0.04 08/02/20041216 Elliotte Dr
80 NA NARBus US 301
161229 Travis StTo:
From:
0.19 09/24/20071217 Oak Ridge St
60 NA NARDead End
161219 Crystal CourtFrom:To:
From:
0.12
Caroline County
08/02/20041218 Tinder Dr
160 NA NAR
SR 2 Fredericksburg TpkeFrom:To:
0.17 08/02/20041218 Tinder Dr
40 NA NARDead EndTo:
0.11 08/02/20041218 Tinder Dr
80 NA NAR161218 Tinder Dr
Dead EndTo:
From:
0.16 08/02/20041219 Crystal Court
130 NA NARBus US 301
CuldeSacTo:
From:
0.26
Town of Bowling Green
07/28/20041220 Lafayette Ave
130 NA NARDead End
Bus US 301To:
From:
0.12 08/02/20041221 Dorsey St
180 NA NAR161202 Anderson Ave
SR 207 Broaddus AveTo:
From:
0.18 08/02/20041222 Lee St
70 NA NAR161224 Holly Ave
16695 Edwards RdTo:
From:
0.09
Caroline County
07/28/20041223 Mulberry Lane
30 NA NAR161225 White Meadow Dr
161223 Mulberry LaneTo:
From:
0.08 07/28/20041224 Holly Ave
110 NA NARCuldeSac
161224 Holly AveFrom:To:
From:
0.14 07/28/20041225 White Meadow Dr
30 NA NAR16695 Edwards RdTo:
0.13 07/28/20041225
100 NA NARBus US 301
CuldeSacTo:
From:
0.21
Town of Bowling Green
07/28/20041227 Gill St
60 NA NAR161229 Travis St
ECL Bowling GreenTo:
From:
0.05 09/24/20071228 Cedar Lane
270 NA NAR161204 Court House Lane
Bus US 301To:
From:
0.39 09/24/20071229 Travis St
326/12/2010

Virginia Department of TransportationTraffic Engineering Division
2009Annual Average Daily Traffic Volume Estimates By Section of Route
Caroline Maintenance Area
Route AADT1Trail 2Trail
4TireK
QA2Axle 3+Axle
QC QKBusLengthTruck
FactorAAWDT QW Year
DirFactor
120 NA NARDead End
16695 Edwards RdTo:
From:
0.30
Caroline County
07/28/20041230 Sarah St
70 NA NAR161217 Oak Ridge St
161229 Travis StFrom:To:
From:
0.16
Town of Bowling Green
07/28/20041231 Virginia Ave
100 NA NARDead EndTo:
0.27 07/28/20041231 Virginia Ave
150 NA NARUS 301 Richmond Tpke
161233 Pine Needle LaneFrom:To:
From:
0.11
Caroline County
07/28/20041232 White Pine Dr
110 NA NAR
Begin LoopFrom:To:
0.15 07/28/20041232 White Pine Dr
40 NA NAREnd LoopTo:
0.34 09/12/20071232 White Pine Dr
30 NA NARDead End
161232 White Pine DrTo:
From:
0.08 07/28/20041233 Pine Needle Lane
420 NA NARFR814 School St
161235 Tyler CtFrom:To:
From:
0.32 07/28/20041234 Harding Dr
410 NA NAR161237 Madison StTo:
0.18 09/12/20071234 Harding Dr
60 NA NAR161234 Harding Dr
CuldeSacTo:
From:
0.07 07/28/20041235 Tyler Ct
380 NA NAR161237 Madison St
161234 Harding DrTo:
From:
0.08 09/12/20071236 Monroe St
210 NA NARCuldeSac
161234 Harding DrTo:
From:
0.28 09/12/20071237 Madison St
170 NA NARCuldeSac
16695 Edwards RdTo:
From:
0.36 07/28/20041238 Elm St
120 NA NARCuldeSac
16619 Milford StTo:
From:
0.17 08/02/20041239 Milford St
40 NA NARDead End
161241 Mill Run LaneFrom:To:
From:
0.17 08/02/20041240 Wagon Wheel Rd
140 NA NARSCL Bowling GreenTo:
0.12 08/02/20041240 Wagon Wheel Rd
140 NA NANSCL Bowling Green
US 301, A P Hill BlvdTo:
From:
0.04
Town of Bowling Green
08/02/20041240 Wagon Wheel Rd
80 NA NAR161242 Mill Stone Lane
161240 Wagon Wheel RdTo:
From:
0.20
Caroline County
08/02/20041241 Mill Run Lane
20 NA NAR161241 Mill Run Lane
Dead EndTo:
From:
0.16 08/02/20041242 Mill Stone Lane
336/12/2010
Virginia Department of TransportationTraffic Engineering Division
2009Annual Average Daily Traffic Volume Estimates By Section of Route
Caroline Maintenance Area
Route AADT1Trail 2Trail
4TireK
QA2Axle 3+Axle
QC QKBusLengthTruck
FactorAAWDT QW Year
DirFactor
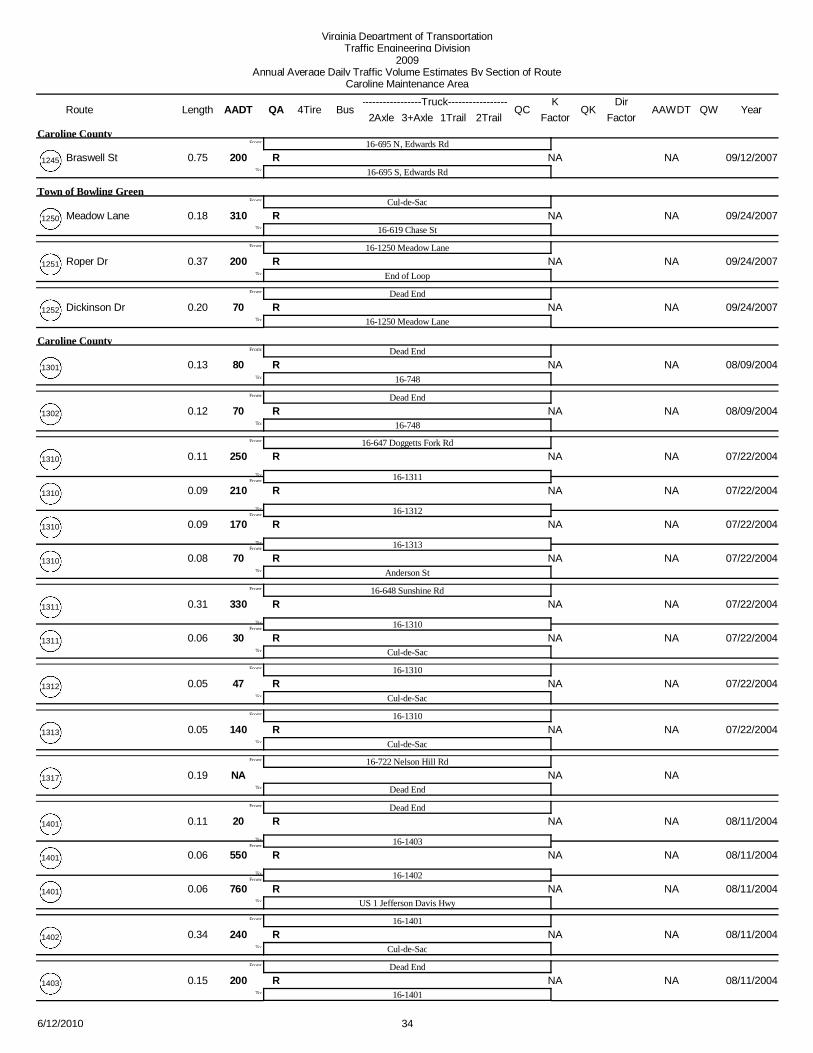
200 NA NAR16695 N, Edwards Rd
16695 S, Edwards RdTo:
From:
0.75
Caroline County
09/12/20071245 Braswell St
310 NA NARCuldeSac
16619 Chase StTo:
From:
0.18
Town of Bowling Green
09/24/20071250 Meadow Lane
200 NA NAR161250 Meadow Lane
End of LoopTo:
From:
0.37 09/24/20071251 Roper Dr
70 NA NARDead End
161250 Meadow LaneTo:
From:
0.20 09/24/20071252 Dickinson Dr
80 NA NARDead End
16748To:
From:
0.13
Caroline County
08/09/20041301
70 NA NARDead End
16748To:
From:
0.12 08/09/20041302
250 NA NAR16647 Doggetts Fork Rd
161311From:To:
From:
0.11 07/22/20041310
210 NA NAR
161312From:To:
0.09 07/22/20041310
170 NA NAR
161313From:To:
0.09 07/22/20041310
70 NA NARAnderson StTo:
0.08 07/22/20041310
330 NA NAR16648 Sunshine Rd
161310From:To:
From:
0.31 07/22/20041311
30 NA NARCuldeSacTo:
0.06 07/22/20041311
47 NA NAR161310
CuldeSacTo:
From:
0.05 07/22/20041312
140 NA NAR161310
CuldeSacTo:
From:
0.05 07/22/20041313
NA NA NA16722 Nelson Hill Rd
Dead EndTo:
From:
0.191317
20 NA NARDead End
161403From:To:
From:
0.11 08/11/20041401
550 NA NAR
161402From:To:
0.06 08/11/20041401
760 NA NARUS 1 Jefferson Davis HwyTo:
0.06 08/11/20041401
240 NA NAR161401
CuldeSacTo:
From:
0.34 08/11/20041402
200 NA NARDead End
161401To:
From:
0.15 08/11/20041403
346/12/2010
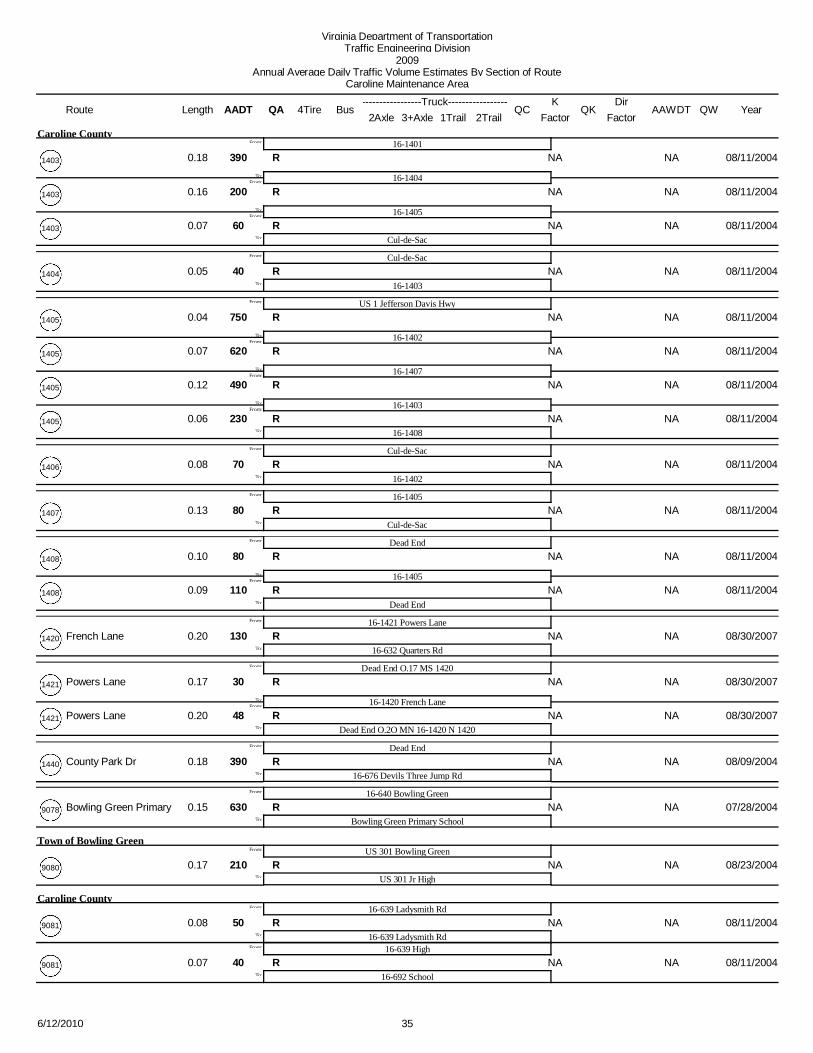
Virginia Department of TransportationTraffic Engineering Division
2009Annual Average Daily Traffic Volume Estimates By Section of Route
Caroline Maintenance Area
Route AADT1Trail 2Trail
4TireK
QA2Axle 3+Axle
QC QKBusLengthTruck
FactorAAWDT QW Year
DirFactor
390 NA NAR161401
161404From:To:
From:
0.18
Caroline County
08/11/20041403
200 NA NAR
161405From:To:
0.16 08/11/20041403
60 NA NARCuldeSacTo:
0.07 08/11/20041403
40 NA NARCuldeSac
161403To:
From:
0.05 08/11/20041404
750 NA NARUS 1 Jefferson Davis Hwy
161402From:To:
From:
0.04 08/11/20041405
620 NA NAR
161407From:To:
0.07 08/11/20041405
490 NA NAR
161403From:To:
0.12 08/11/20041405
230 NA NAR161408To:
0.06 08/11/20041405
70 NA NARCuldeSac
161402To:
From:
0.08 08/11/20041406
80 NA NAR161405
CuldeSacTo:
From:
0.13 08/11/20041407
80 NA NARDead End
161405From:To:
From:
0.10 08/11/20041408
110 NA NARDead EndTo:
0.09 08/11/20041408
130 NA NAR161421 Powers Lane
16632 Quarters RdTo:
From:
0.20 08/30/20071420 French Lane
30 NA NARDead End O.17 MS 1420
161420 French LaneFrom:To:
From:
0.17 08/30/20071421 Powers Lane
48 NA NARDead End O.2O MN 161420 N 1420To:
0.20 08/30/20071421 Powers Lane
390 NA NARDead End
16676 Devils Three Jump RdTo:
From:
0.18 08/09/20041440 County Park Dr
630 NA NAR16640 Bowling Green
Bowling Green Primary SchoolTo:
From:
0.15 07/28/20049078 Bowling Green Primary
210 NA NARUS 301 Bowling Green
US 301 Jr HighTo:
From:
0.17
Town of Bowling Green
08/23/20049080
50 NA NAR16639 Ladysmith Rd
16639 Ladysmith RdFrom:
To:
From:
0.08
Caroline County
08/11/20049081
16639 High40 NA NAR
16692 SchoolTo:
0.07 08/11/20049081
356/12/2010
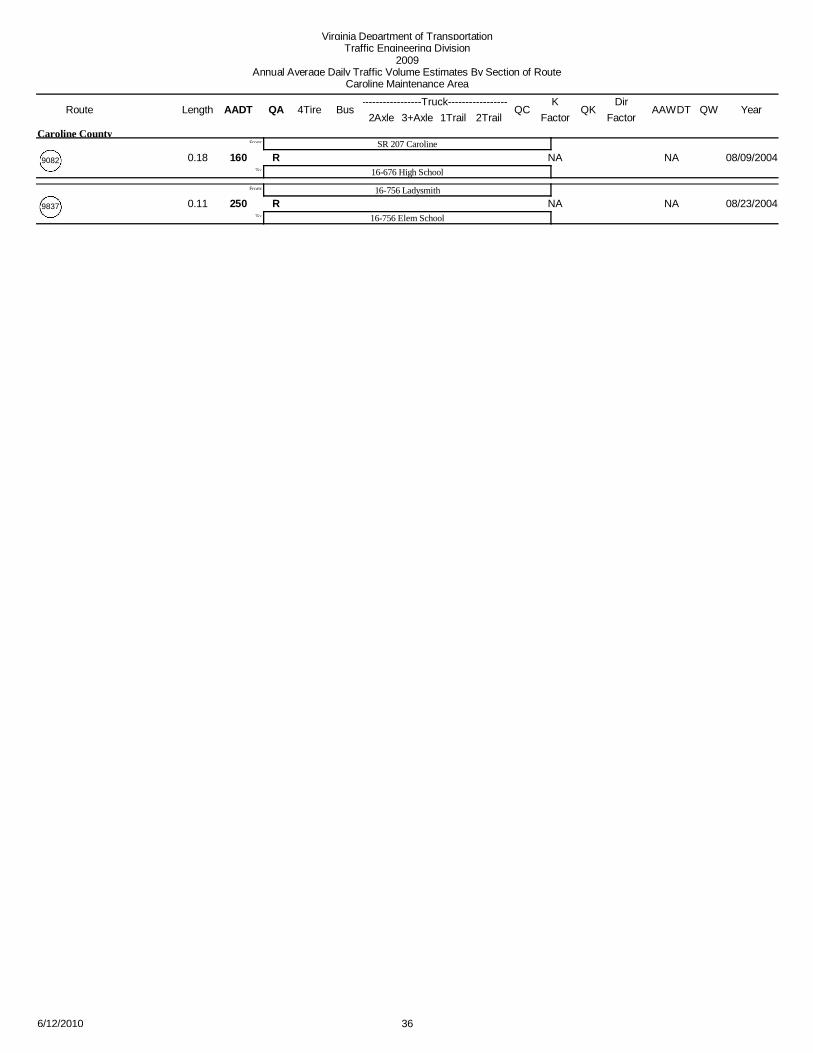
Virginia Department of TransportationTraffic Engineering Division
2009Annual Average Daily Traffic Volume Estimates By Section of Route
Caroline Maintenance Area
Route AADT1Trail 2Trail
4TireK
QA2Axle 3+Axle
QC QKBusLengthTruck
FactorAAWDT QW Year
DirFactor
160 NA NARSR 207 Caroline
16676 High SchoolTo:
From:
0.18
Caroline County
08/09/20049082
250 NA NAR16756 Ladysmith
16756 Elem SchoolTo:
From:
0.11 08/23/20049837
366/12/2010