AACD State of the Cosmetic Dentistry Industry...
25
Cosmetic Dentistry State of the Industry Survey 2013 American Academy of Cosmetic Dentistry www.AACD.com
Transcript of AACD State of the Cosmetic Dentistry Industry...
Cosmetic Dentistry State of the Industry Survey 2013
American Academy of Cosmetic Dentistry www.AACD.com
P a g e | 2
Please attribute all data to the American Academy of Cosmetic Dentistry (AACD) For more information, please contact [email protected] or visit www.AACD.com
Table of Contents About This Study .. . . . . . . . . . . . . . . . . . . . . . . . . . . . . . . . . . . . . . . . . . . . . . . . . . . . . . . . . . . . . . . . . . . . . . . . . . . . . . . . . . . . . . . . . 4
FINDINGS: Respondent Demographics .. . . . . . . . . . . . . . . . . . . . . . . . . . . . . . . . . . . . . . . . . . . . . . . . . . . . . . . . . . 5
AACD Member vs. Non-Member .............................................................................................. 5
Dentists Dominated ................................................................................................................... 5
Community of practice or “specialty” identification .................................................................... 6
A question of age ...................................................................................................................... 6
FINDINGS: Practice Profi le . . . . . . . . . . . . . . . . . . . . . . . . . . . . . . . . . . . . . . . . . . . . . . . . . . . . . . . . . . . . . . . . . . . . . . . . . . . . 7
Staying Power—How many years has your practice been in operation? ................................. 7
Cosmetic Dentistry Trending Urban—In what type of community is your practice located? ..... 7
Head Count—Total number of employees working at your practice ......................................... 8
FINDINGS: Let’s Talk Labs .. . . . . . . . . . . . . . . . . . . . . . . . . . . . . . . . . . . . . . . . . . . . . . . . . . . . . . . . . . . . . . . . . . . . . . . . . . . 9
Laboratory Loyalty—How many different dental labs does your practice patronize? ............... 9
When deciding which dental laboratory to use, what are your primary considerations? .......... 9
Locating a Lab—How did you find out about the lab(s) you're working with? ......................... 10
Lab + AACD Affiliation 1—Is your primary laboratory technician an AACD Member? ........... 10
Lab + AACD Affiliation 2—Is your primary laboratory technician an AACD Accredited Member? ................................................................................................................................. 11
FINDINGS: Comprehensive Cosmetic Dentistry . . . . . . . . . . . . . . . . . . . . . . . . . . . . . . . . . . . . . . . . . . . . . 12
A Team Effort—Primary individual initiating dialog about cosmetic dental procedures .......... 12
Referrals Rule—Importance of factors in driving cosmetic dentistry demands ....................... 12
Who are we treating?—Gender of cosmetic dentistry patients ............................................... 13
Who are we treating?—Age range of cosmetic dentistry patients .......................................... 13
To look and feel better, of course!—What reasons do your patients cite for wanting cosmetic dentistry treatments? .............................................................................................................. 14
Procedures Participated In ...................................................................................................... 14
Is there a particular procedure/treatment that you complete more frequently than others? ... 15
What is the most popular cosmetic procedure at your practice? ............................................ 15
The Doctor Will See You Now—Number of patients seen by your practice for cosmetic dentistry procedures in the previous year ............................................................................... 16
What Patients REALLY Care About—Issues of primary concern ........................................... 16
FINDINGS: Dollars and Sense .. . . . . . . . . . . . . . . . . . . . . . . . . . . . . . . . . . . . . . . . . . . . . . . . . . . . . . . . . . . . . . . . . . . . . 17
Show Me the Money I—Average production per cosmetic patient per visit ............................ 17
P a g e | 3
Please attribute all data to the American Academy of Cosmetic Dentistry (AACD) For more information, please contact [email protected] or visit www.AACD.com
Average spent per patient on cosmetic dentistry services per year ........................................ 17
Financial Assistance—Did your practice offer third-party financing options? ......................... 18
Case Acceptance Boosted—Did offering external financing help with treatment acceptance? ................................................................................................................................................ 18
What’s the Buzz?—How do most of your patients find you? .................................................. 19
Getting Social—Do you or your practice use social media to reach prospective and current patients? Which outlets do you use? ...................................................................................... 19
Show Me the Money II—Total revenues for ALL dentistry procedures (cosmetic and non-cosmetic) ................................................................................................................................. 20
Total revenues for cosmetic dentistry procedures .................................................................. 20
Revenue Change for Top Cosmetic Procedures .. . . . . . . . . . . . . . . . . . . . . . . . . . . . . . . . . . . . . . . . . . . . 21
FINDINGS: Executive Summary .. . . . . . . . . . . . . . . . . . . . . . . . . . . . . . . . . . . . . . . . . . . . . . . . . . . . . . . . . . . . . . . . . . . 24
General ................................................................................................................................... 24
Cosmetic Dental Practice Demographics ............................................................................... 24
A Bit about the Patients .......................................................................................................... 24
Cosmetic Dentistry in Dollars and Cents ................................................................................ 25
P a g e | 4
Please attribute all data to the American Academy of Cosmetic Dentistry (AACD) For more information, please contact [email protected] or visit www.AACD.com
AACD State of the Cosmetic Dentistry Industry 2013
About This Study This single-mode survey (email driving to an online instrument) of dental practices was conducted by the American Academy of Cosmetic Dentistry (AACD) to better understand the dynamics of the cosmetic dentistry market and determine the size and impact (in terms of procedures and revenues) and the patient makeup of this market. Previous benchmarking surveys were conducted in 2004, 2007, and 2011 by Levin Group, Inc., Readex Research, and AACD respectively. Data for the 2013 study was collected between October 17 and November 18, 2013. A total of 659 responses were tabulated, with fewer respondents completing the latter portion of the survey. The net number of respondents is noted on each exhibit. The invitation to participate was primarily offered via email to the AACD membership at large, but also distributed to non-AACD member dental professionals via social media to provide an outside-in view of non-member dental practices that derive income from cosmetic procedures.
P a g e | 5
Please attribute all data to the American Academy of Cosmetic Dentistry (AACD) For more information, please contact [email protected] or visit www.AACD.com
FINDINGS: Respondent Demographics
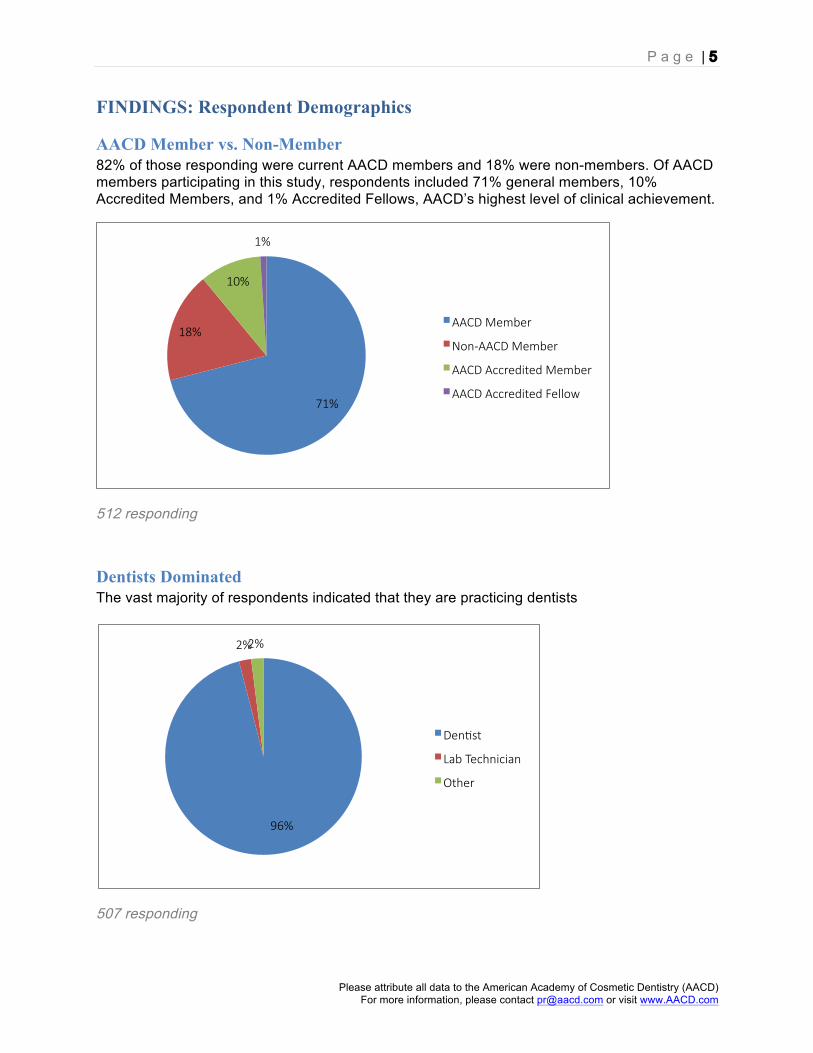
AACD Member vs. Non-Member 82% of those responding were current AACD members and 18% were non-members. Of AACD members participating in this study, respondents included 71% general members, 10% Accredited Members, and 1% Accredited Fellows, AACD’s highest level of clinical achievement.
512 responding
Dentists Dominated The vast majority of respondents indicated that they are practicing dentists
507 responding
71%
18%
10%
1%
AACD Member
Non-‐AACD Member
AACD Accredited Member
AACD Accredited Fellow
96%
2% 2%
Den>st
Lab Technician
Other
P a g e | 6
Please attribute all data to the American Academy of Cosmetic Dentistry (AACD) For more information, please contact [email protected] or visit www.AACD.com
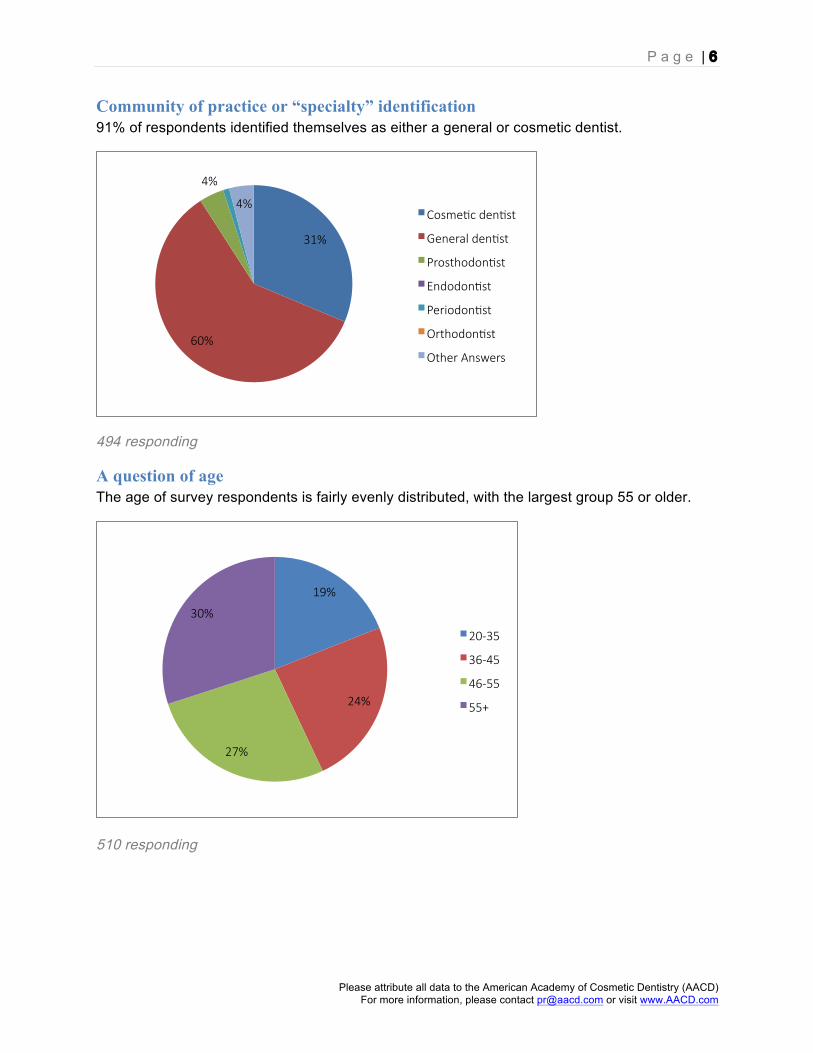
Community of practice or “specialty” identification 91% of respondents identified themselves as either a general or cosmetic dentist.
494 responding
A question of age The age of survey respondents is fairly evenly distributed, with the largest group 55 or older.
510 responding
31%
60%
4%
4% Cosme>c den>st
General den>st
Prosthodon>st
Endodon>st
Periodon>st
Orthodon>st
Other Answers
19%
24%
27%
30%
20-‐35
36-‐45
46-‐55
55+
P a g e | 7
Please attribute all data to the American Academy of Cosmetic Dentistry (AACD) For more information, please contact [email protected] or visit www.AACD.com
FINDINGS: Practice Profile
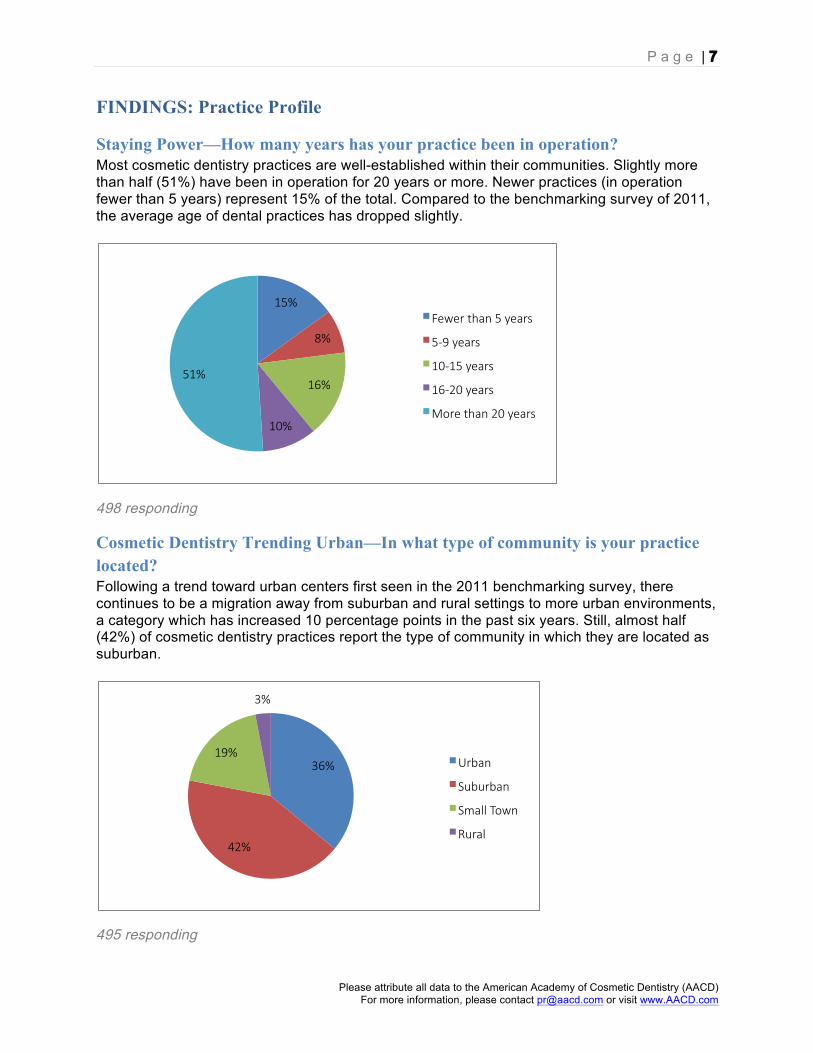
Staying Power—How many years has your practice been in operation? Most cosmetic dentistry practices are well-established within their communities. Slightly more than half (51%) have been in operation for 20 years or more. Newer practices (in operation fewer than 5 years) represent 15% of the total. Compared to the benchmarking survey of 2011, the average age of dental practices has dropped slightly.
498 responding
Cosmetic Dentistry Trending Urban—In what type of community is your practice located? Following a trend toward urban centers first seen in the 2011 benchmarking survey, there continues to be a migration away from suburban and rural settings to more urban environments, a category which has increased 10 percentage points in the past six years. Still, almost half (42%) of cosmetic dentistry practices report the type of community in which they are located as suburban.
495 responding
15%
8%
16%
10%
51%
Fewer than 5 years
5-‐9 years
10-‐15 years
16-‐20 years
More than 20 years
36%
42%
19%
3%
Urban
Suburban
Small Town
Rural
P a g e | 8
Please attribute all data to the American Academy of Cosmetic Dentistry (AACD) For more information, please contact [email protected] or visit www.AACD.com
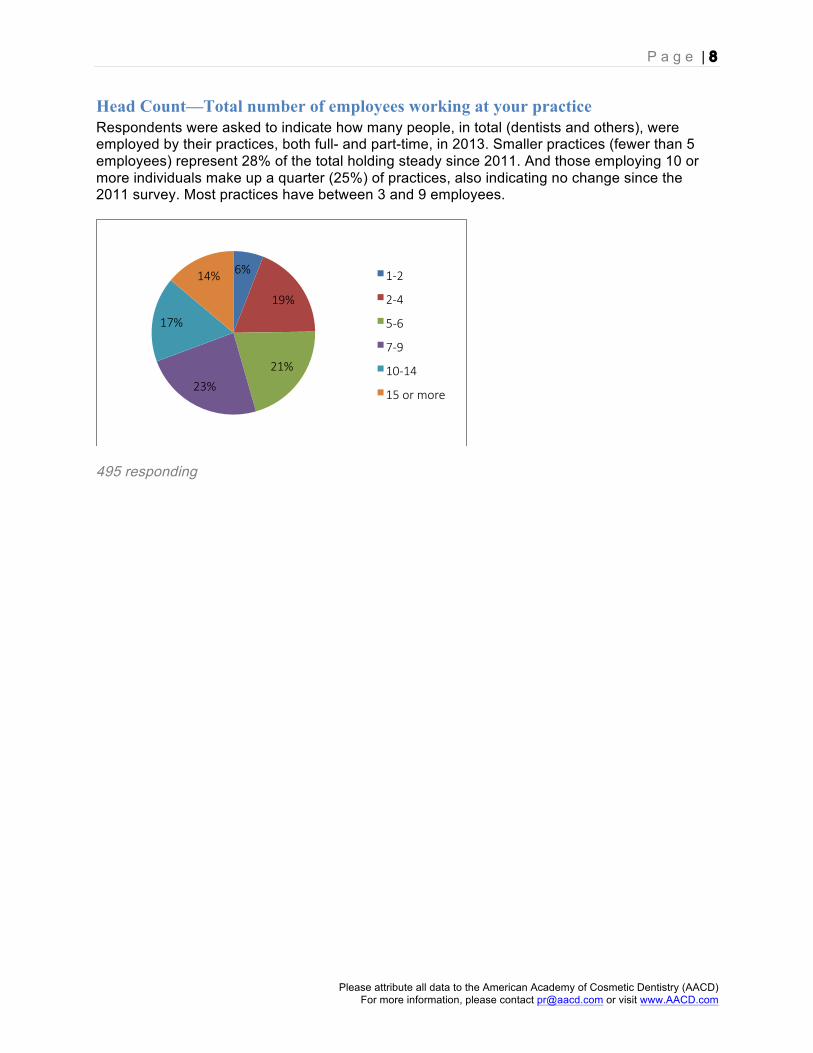
Head Count—Total number of employees working at your practice Respondents were asked to indicate how many people, in total (dentists and others), were employed by their practices, both full- and part-time, in 2013. Smaller practices (fewer than 5 employees) represent 28% of the total holding steady since 2011. And those employing 10 or more individuals make up a quarter (25%) of practices, also indicating no change since the 2011 survey. Most practices have between 3 and 9 employees.
495 responding
6%
19%
21%
23%
17%
14% 1-‐2
2-‐4
5-‐6
7-‐9
10-‐14
15 or more
P a g e | 9
Please attribute all data to the American Academy of Cosmetic Dentistry (AACD) For more information, please contact [email protected] or visit www.AACD.com
FINDINGS: Let’s Talk Labs
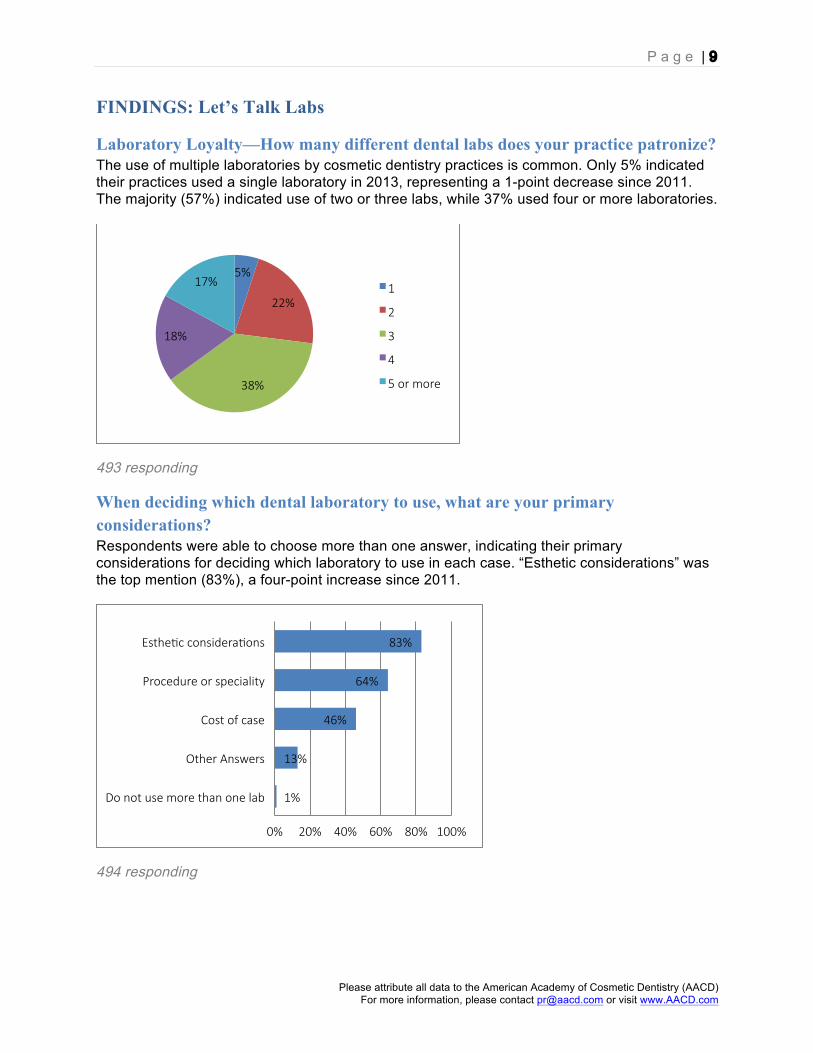
Laboratory Loyalty—How many different dental labs does your practice patronize? The use of multiple laboratories by cosmetic dentistry practices is common. Only 5% indicated their practices used a single laboratory in 2013, representing a 1-point decrease since 2011. The majority (57%) indicated use of two or three labs, while 37% used four or more laboratories.
493 responding
When deciding which dental laboratory to use, what are your primary considerations? Respondents were able to choose more than one answer, indicating their primary considerations for deciding which laboratory to use in each case. “Esthetic considerations” was the top mention (83%), a four-point increase since 2011.
494 responding
5%
22%
38%
18%
17% 1
2
3
4
5 or more
1%
13%
46%
64%
83%
0% 20% 40% 60% 80% 100%
Do not use more than one lab
Other Answers
Cost of case
Procedure or speciality
Esthe>c considera>ons
P a g e | 10
Please attribute all data to the American Academy of Cosmetic Dentistry (AACD) For more information, please contact [email protected] or visit www.AACD.com
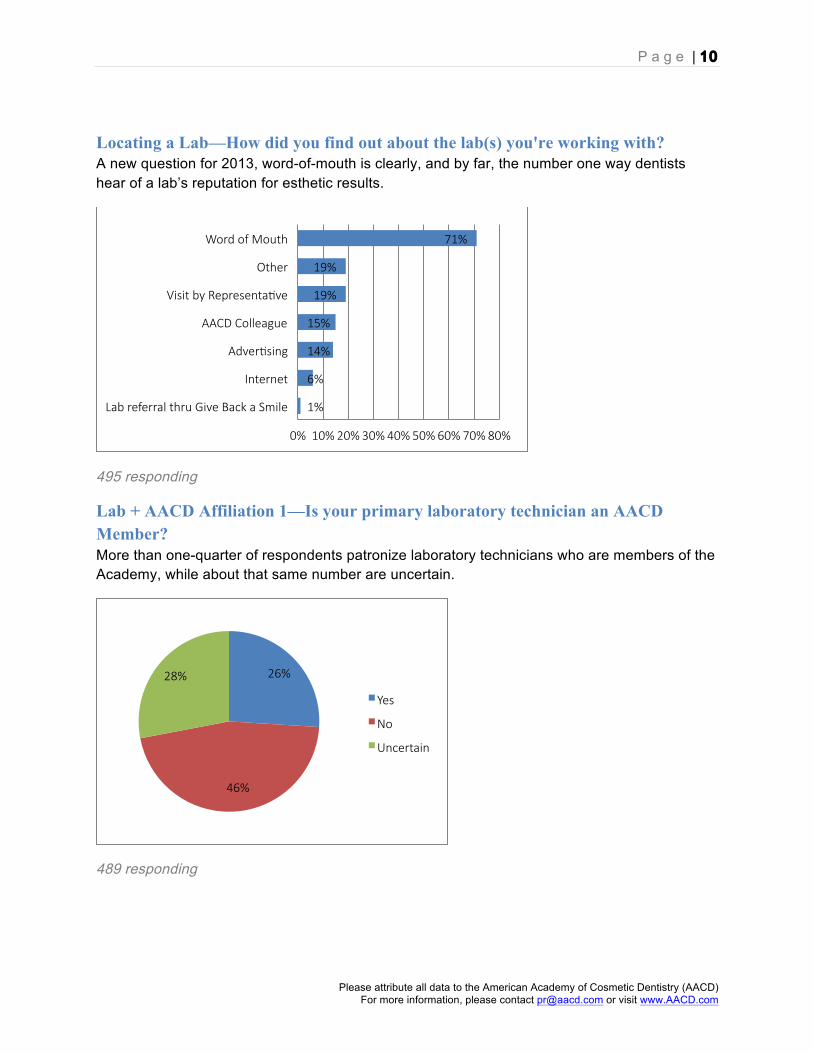
Locating a Lab—How did you find out about the lab(s) you're working with? A new question for 2013, word-of-mouth is clearly, and by far, the number one way dentists hear of a lab’s reputation for esthetic results.
495 responding
Lab + AACD Affiliation 1—Is your primary laboratory technician an AACD Member? More than one-quarter of respondents patronize laboratory technicians who are members of the Academy, while about that same number are uncertain.
489 responding
1%
6%
14%
15%
19%
19%
71%
0% 10% 20% 30% 40% 50% 60% 70% 80%
Lab referral thru Give Back a Smile
Internet
Adver>sing
AACD Colleague
Visit by Representa>ve
Other
Word of Mouth
26%
46%
28%
Yes
No
Uncertain
P a g e | 11
Please attribute all data to the American Academy of Cosmetic Dentistry (AACD) For more information, please contact [email protected] or visit www.AACD.com
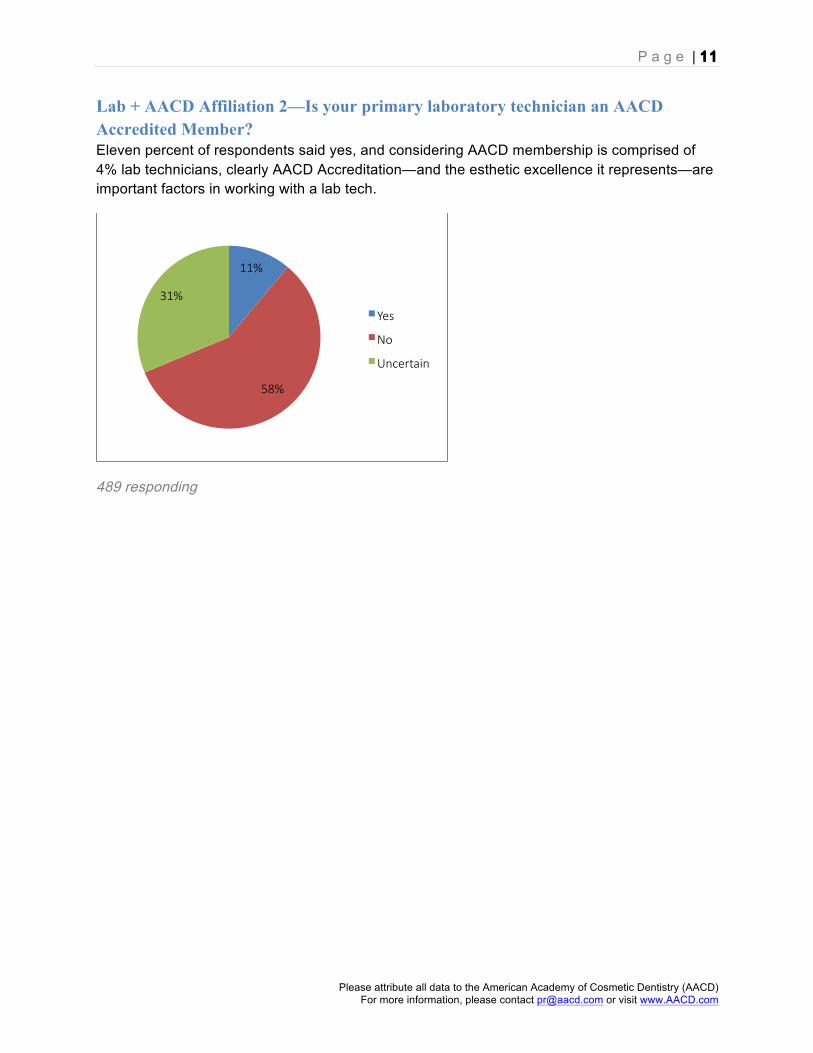
Lab + AACD Affiliation 2—Is your primary laboratory technician an AACD Accredited Member? Eleven percent of respondents said yes, and considering AACD membership is comprised of 4% lab technicians, clearly AACD Accreditation—and the esthetic excellence it represents—are important factors in working with a lab tech.
489 responding
11%
58%
31%
Yes
No
Uncertain
P a g e | 12
Please attribute all data to the American Academy of Cosmetic Dentistry (AACD) For more information, please contact [email protected] or visit www.AACD.com
FINDINGS: Comprehensive Cosmetic Dentistry
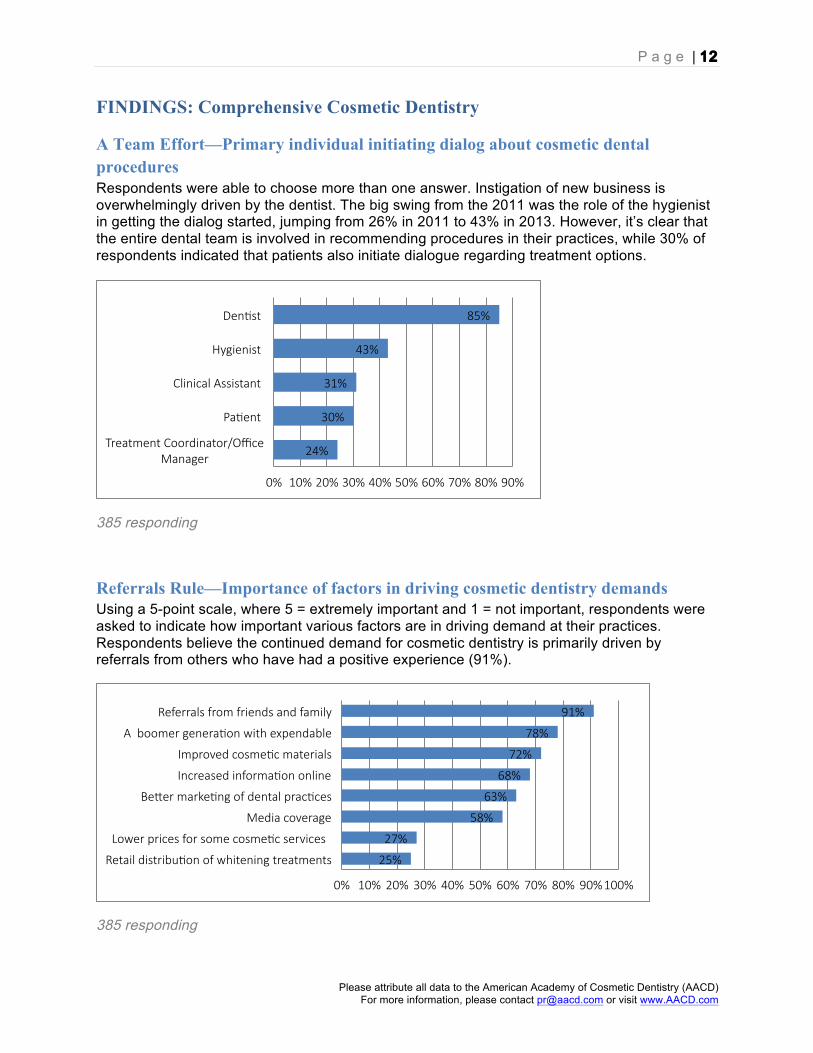
A Team Effort—Primary individual initiating dialog about cosmetic dental procedures Respondents were able to choose more than one answer. Instigation of new business is overwhelmingly driven by the dentist. The big swing from the 2011 was the role of the hygienist in getting the dialog started, jumping from 26% in 2011 to 43% in 2013. However, it’s clear that the entire dental team is involved in recommending procedures in their practices, while 30% of respondents indicated that patients also initiate dialogue regarding treatment options.
385 responding
Referrals Rule—Importance of factors in driving cosmetic dentistry demands Using a 5-point scale, where 5 = extremely important and 1 = not important, respondents were asked to indicate how important various factors are in driving demand at their practices. Respondents believe the continued demand for cosmetic dentistry is primarily driven by referrals from others who have had a positive experience (91%).
385 responding
24%
30%
31%
43%
85%
0% 10% 20% 30% 40% 50% 60% 70% 80% 90%
Treatment Coordinator/Office Manager
Pa>ent
Clinical Assistant
Hygienist
Den>st
25%
27%
58%
63%
68%
72%
78%
91%
0% 10% 20% 30% 40% 50% 60% 70% 80% 90% 100%
Retail distribu>on of whitening treatments
Lower prices for some cosme>c services
Media coverage
Be^er marke>ng of dental prac>ces
Increased informa>on online
Improved cosme>c materials
A boomer genera>on with expendable
Referrals from friends and family
P a g e | 13
Please attribute all data to the American Academy of Cosmetic Dentistry (AACD) For more information, please contact [email protected] or visit www.AACD.com
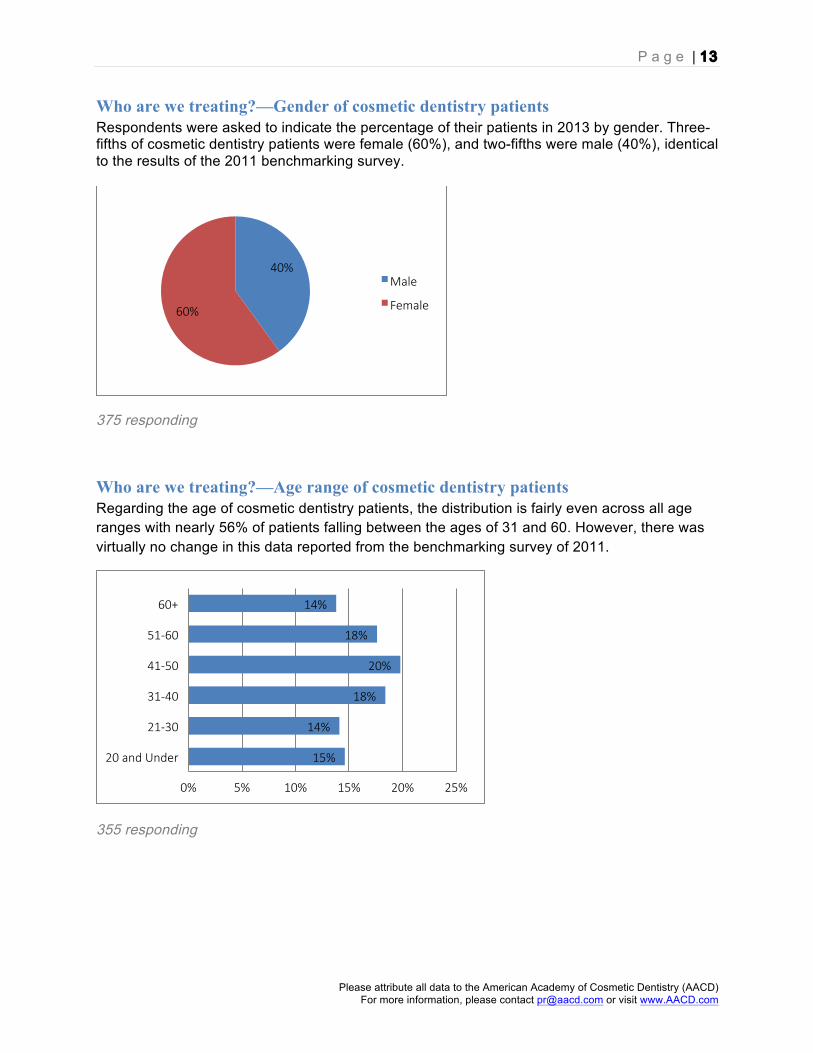
Who are we treating?—Gender of cosmetic dentistry patients Respondents were asked to indicate the percentage of their patients in 2013 by gender. Three-fifths of cosmetic dentistry patients were female (60%), and two-fifths were male (40%), identical to the results of the 2011 benchmarking survey.
375 responding
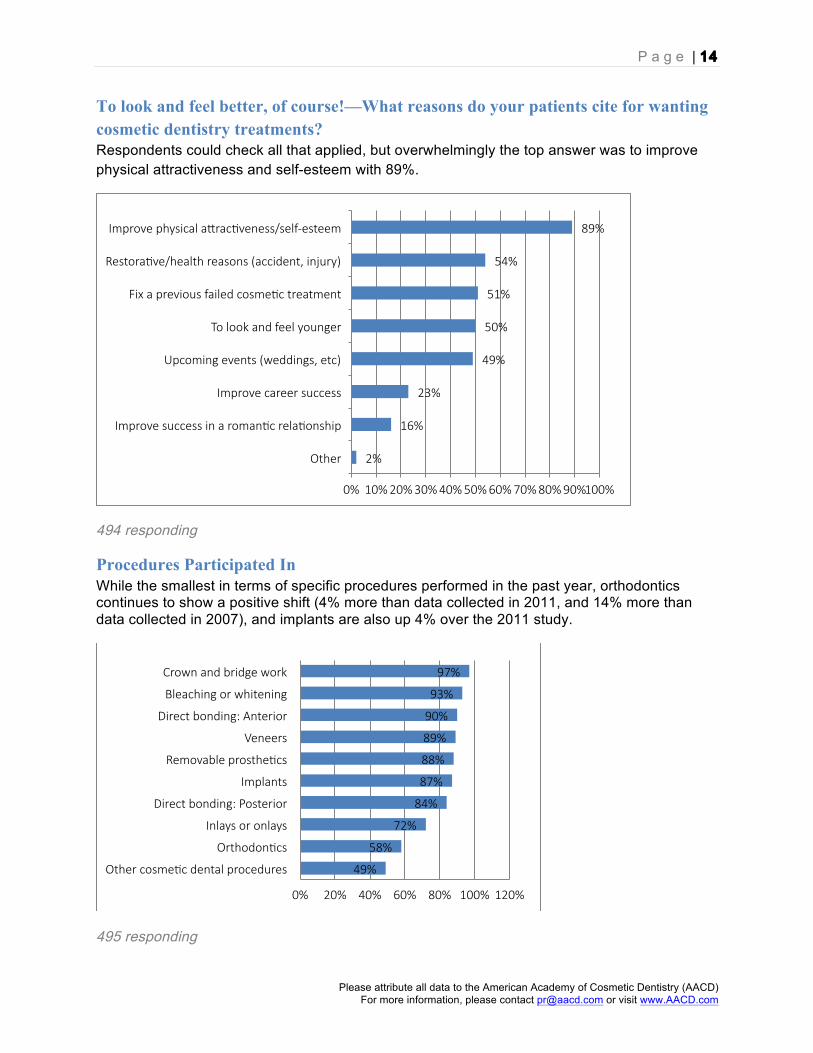
Who are we treating?—Age range of cosmetic dentistry patients Regarding the age of cosmetic dentistry patients, the distribution is fairly even across all age ranges with nearly 56% of patients falling between the ages of 31 and 60. However, there was virtually no change in this data reported from the benchmarking survey of 2011.
355 responding
40%
60%
Male
Female
15%
14%
18%
20%
18%
14%
0% 5% 10% 15% 20% 25%
20 and Under
21-‐30
31-‐40
41-‐50
51-‐60
60+
P a g e | 14
Please attribute all data to the American Academy of Cosmetic Dentistry (AACD) For more information, please contact [email protected] or visit www.AACD.com
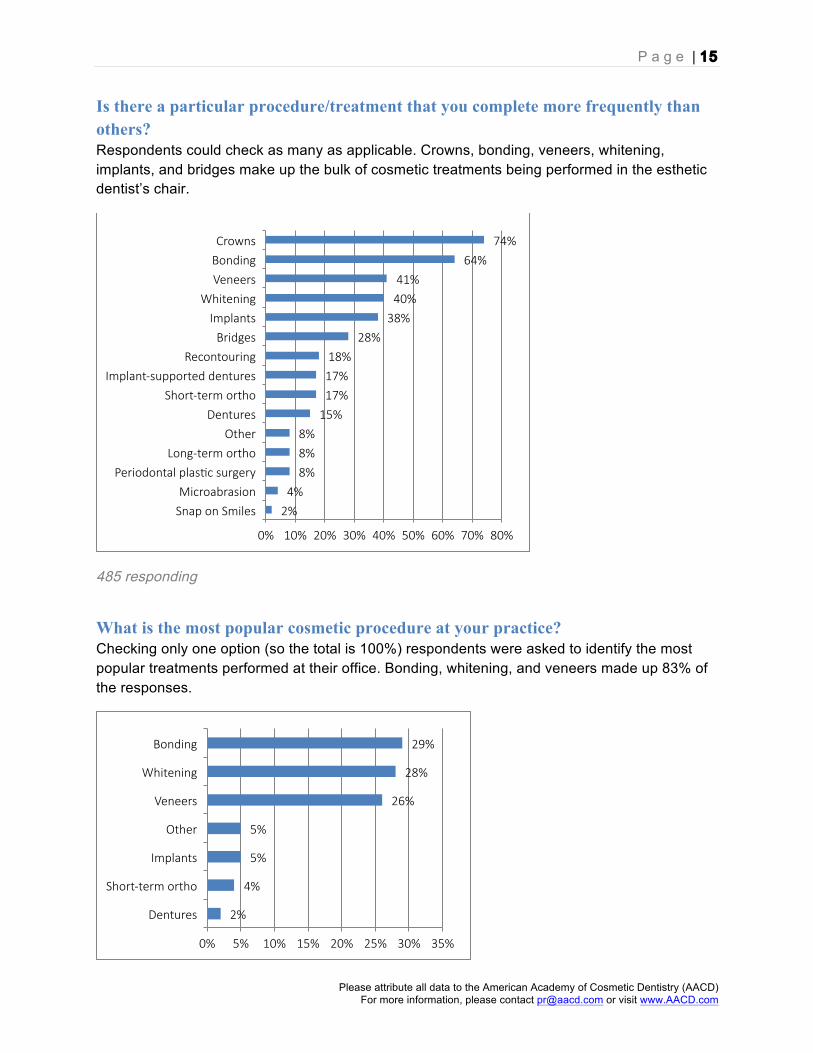
To look and feel better, of course!—What reasons do your patients cite for wanting cosmetic dentistry treatments? Respondents could check all that applied, but overwhelmingly the top answer was to improve physical attractiveness and self-esteem with 89%.
494 responding
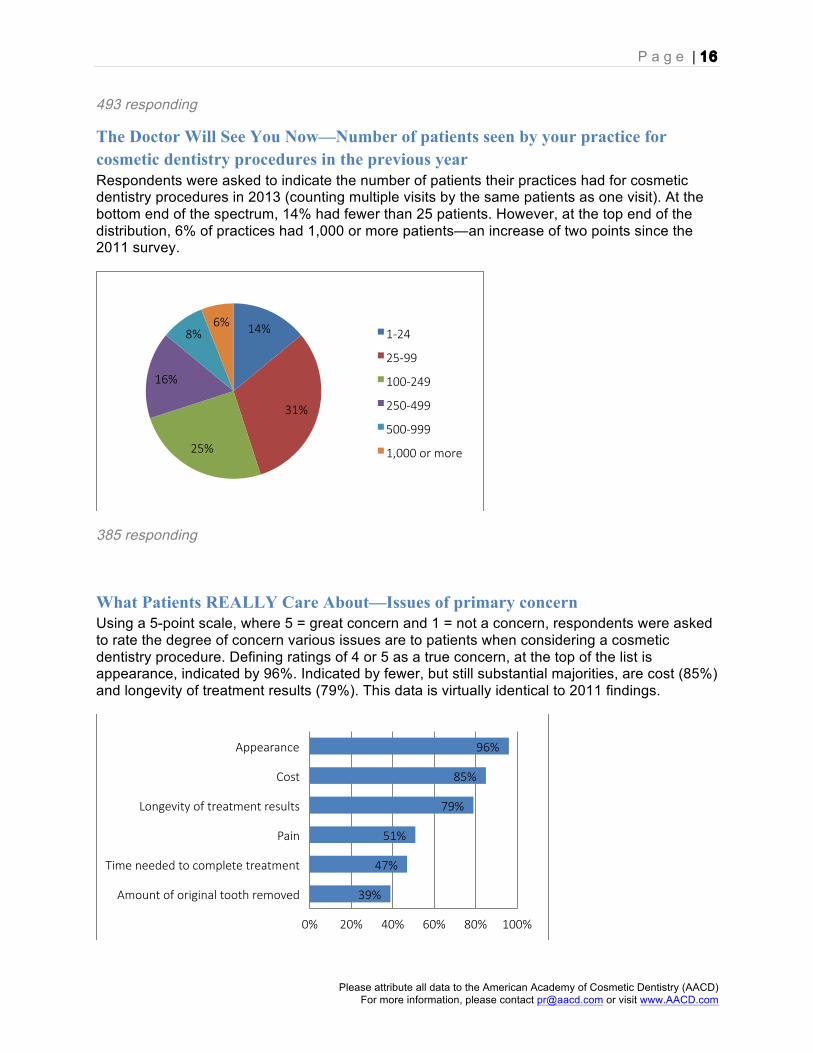
Procedures Participated In While the smallest in terms of specific procedures performed in the past year, orthodontics continues to show a positive shift (4% more than data collected in 2011, and 14% more than data collected in 2007), and implants are also up 4% over the 2011 study.
495 responding
2%
16%
23%
49%
50%
51%
54%
89%
0% 10% 20% 30% 40% 50% 60% 70% 80% 90% 100%
Other
Improve success in a roman>c rela>onship
Improve career success
Upcoming events (weddings, etc)
To look and feel younger
Fix a previous failed cosme>c treatment
Restora>ve/health reasons (accident, injury)
Improve physical a^rac>veness/self-‐esteem
49%
58%
72%
84%
87%
88%
89%
90%
93%
97%
0% 20% 40% 60% 80% 100% 120%
Other cosme>c dental procedures
Orthodon>cs
Inlays or onlays
Direct bonding: Posterior
Implants
Removable prosthe>cs
Veneers
Direct bonding: Anterior
Bleaching or whitening
Crown and bridge work
P a g e | 15
Please attribute all data to the American Academy of Cosmetic Dentistry (AACD) For more information, please contact [email protected] or visit www.AACD.com
Is there a particular procedure/treatment that you complete more frequently than others? Respondents could check as many as applicable. Crowns, bonding, veneers, whitening, implants, and bridges make up the bulk of cosmetic treatments being performed in the esthetic dentist’s chair.
485 responding
What is the most popular cosmetic procedure at your practice? Checking only one option (so the total is 100%) respondents were asked to identify the most popular treatments performed at their office. Bonding, whitening, and veneers made up 83% of the responses.
2%
4%
8%
8%
8%
15%
17%
17%
18%
28%
38%
40%
41%
64%
74%
0% 10% 20% 30% 40% 50% 60% 70% 80%
Snap on Smiles
Microabrasion
Periodontal plas>c surgery
Long-‐term ortho
Other
Dentures
Short-‐term ortho
Implant-‐supported dentures
Recontouring
Bridges
Implants
Whitening
Veneers
Bonding
Crowns
2%
4%
5%
5%
26%
28%
29%
0% 5% 10% 15% 20% 25% 30% 35%
Dentures
Short-‐term ortho
Implants
Other
Veneers
Whitening
Bonding
P a g e | 16
Please attribute all data to the American Academy of Cosmetic Dentistry (AACD) For more information, please contact [email protected] or visit www.AACD.com
493 responding
The Doctor Will See You Now—Number of patients seen by your practice for cosmetic dentistry procedures in the previous year Respondents were asked to indicate the number of patients their practices had for cosmetic dentistry procedures in 2013 (counting multiple visits by the same patients as one visit). At the bottom end of the spectrum, 14% had fewer than 25 patients. However, at the top end of the distribution, 6% of practices had 1,000 or more patients—an increase of two points since the 2011 survey.
385 responding
What Patients REALLY Care About—Issues of primary concern Using a 5-point scale, where 5 = great concern and 1 = not a concern, respondents were asked to rate the degree of concern various issues are to patients when considering a cosmetic dentistry procedure. Defining ratings of 4 or 5 as a true concern, at the top of the list is appearance, indicated by 96%. Indicated by fewer, but still substantial majorities, are cost (85%) and longevity of treatment results (79%). This data is virtually identical to 2011 findings.
14%
31%
25%
16%
8% 6%
1-‐24
25-‐99
100-‐249
250-‐499
500-‐999
1,000 or more
39%
47%
51%
79%
85%
96%
0% 20% 40% 60% 80% 100%
Amount of original tooth removed
Time needed to complete treatment
Pain
Longevity of treatment results
Cost
Appearance
P a g e | 17
Please attribute all data to the American Academy of Cosmetic Dentistry (AACD) For more information, please contact [email protected] or visit www.AACD.com
854 responding
FINDINGS: Dollars and Sense
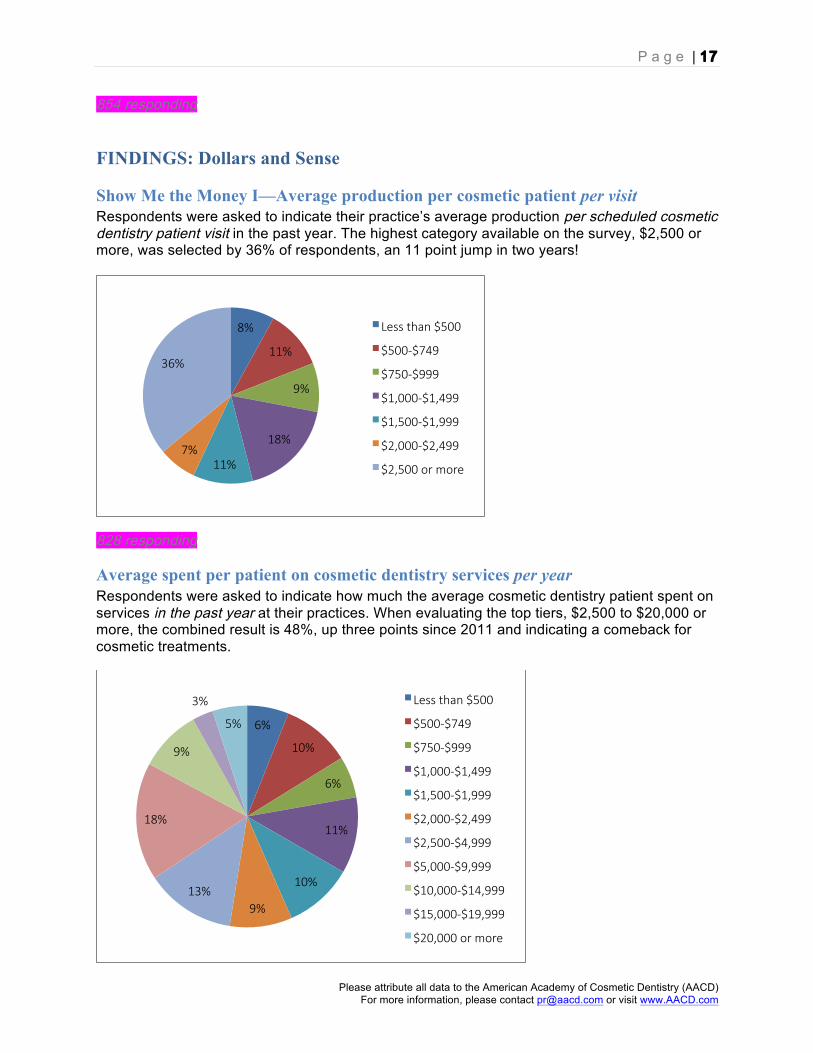
Show Me the Money I—Average production per cosmetic patient per visit Respondents were asked to indicate their practice’s average production per scheduled cosmetic dentistry patient visit in the past year. The highest category available on the survey, $2,500 or more, was selected by 36% of respondents, an 11 point jump in two years!
828 responding
Average spent per patient on cosmetic dentistry services per year Respondents were asked to indicate how much the average cosmetic dentistry patient spent on services in the past year at their practices. When evaluating the top tiers, $2,500 to $20,000 or more, the combined result is 48%, up three points since 2011 and indicating a comeback for cosmetic treatments.
8%
11%
9%
18%
11% 7%
36%
Less than $500
$500-‐$749
$750-‐$999
$1,000-‐$1,499
$1,500-‐$1,999
$2,000-‐$2,499
$2,500 or more
6%
10%
6%
11%
10%
9% 13%
18%
9%
3%
5%
Less than $500
$500-‐$749
$750-‐$999
$1,000-‐$1,499
$1,500-‐$1,999
$2,000-‐$2,499
$2,500-‐$4,999
$5,000-‐$9,999
$10,000-‐$14,999
$15,000-‐$19,999
$20,000 or more
P a g e | 18
Please attribute all data to the American Academy of Cosmetic Dentistry (AACD) For more information, please contact [email protected] or visit www.AACD.com
823 responding
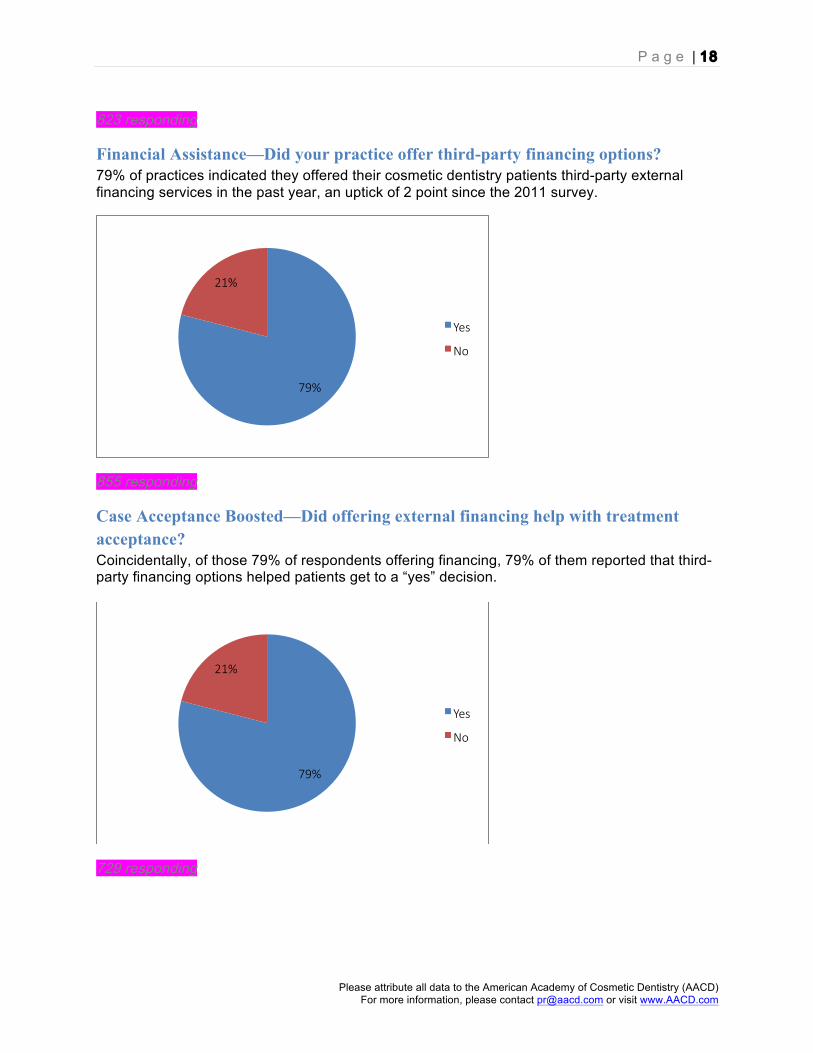
Financial Assistance—Did your practice offer third-party financing options? 79% of practices indicated they offered their cosmetic dentistry patients third-party external financing services in the past year, an uptick of 2 point since the 2011 survey.
855 responding
Case Acceptance Boosted—Did offering external financing help with treatment acceptance? Coincidentally, of those 79% of respondents offering financing, 79% of them reported that third-party financing options helped patients get to a “yes” decision.
729 responding
79%
21%
Yes
No
79%
21%
Yes
No
P a g e | 19
Please attribute all data to the American Academy of Cosmetic Dentistry (AACD) For more information, please contact [email protected] or visit www.AACD.com
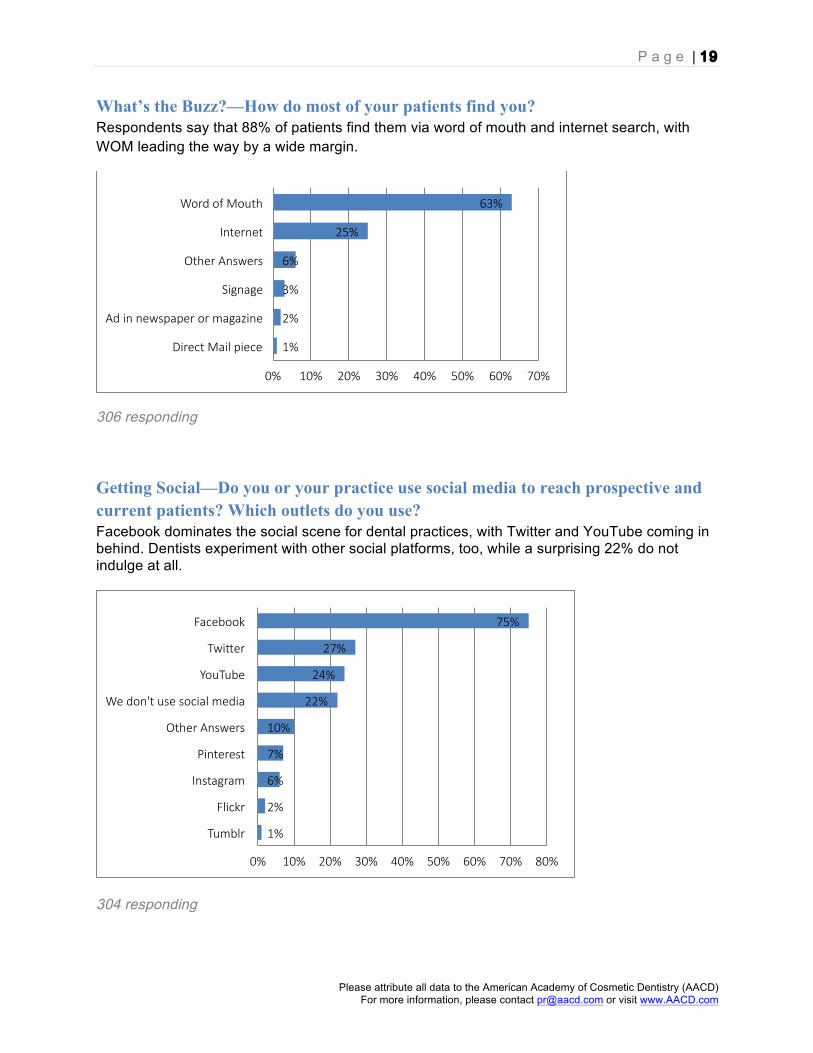
What’s the Buzz?—How do most of your patients find you? Respondents say that 88% of patients find them via word of mouth and internet search, with WOM leading the way by a wide margin.
306 responding
Getting Social—Do you or your practice use social media to reach prospective and current patients? Which outlets do you use? Facebook dominates the social scene for dental practices, with Twitter and YouTube coming in behind. Dentists experiment with other social platforms, too, while a surprising 22% do not indulge at all.
304 responding
1%
2%
3%
6%
25%
63%
0% 10% 20% 30% 40% 50% 60% 70%
Direct Mail piece
Ad in newspaper or magazine
Signage
Other Answers
Internet
Word of Mouth
1%
2%
6%
7%
10%
22%
24%
27%
75%
0% 10% 20% 30% 40% 50% 60% 70% 80%
Tumblr
Flickr
Other Answers
We don't use social media
YouTube
Twi^er
P a g e | 20
Please attribute all data to the American Academy of Cosmetic Dentistry (AACD) For more information, please contact [email protected] or visit www.AACD.com
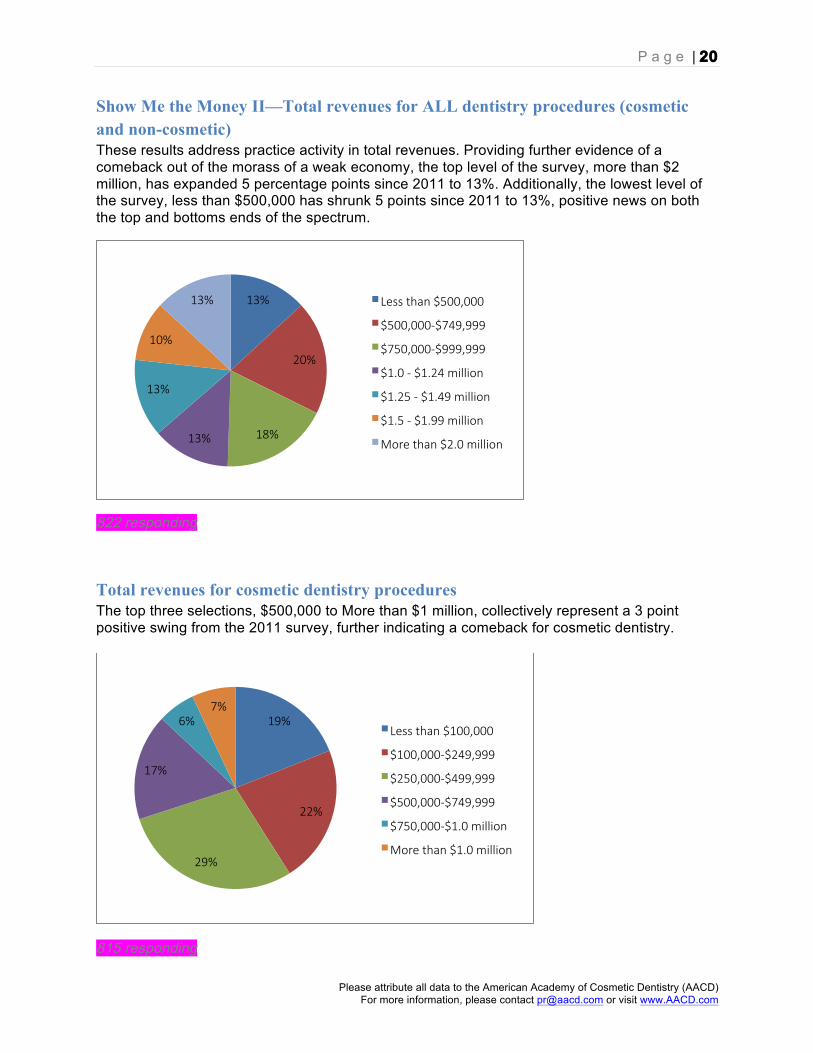
Show Me the Money II—Total revenues for ALL dentistry procedures (cosmetic and non-cosmetic) These results address practice activity in total revenues. Providing further evidence of a comeback out of the morass of a weak economy, the top level of the survey, more than $2 million, has expanded 5 percentage points since 2011 to 13%. Additionally, the lowest level of the survey, less than $500,000 has shrunk 5 points since 2011 to 13%, positive news on both the top and bottoms ends of the spectrum.
822 responding
Total revenues for cosmetic dentistry procedures The top three selections, $500,000 to More than $1 million, collectively represent a 3 point positive swing from the 2011 survey, further indicating a comeback for cosmetic dentistry.
815 responding
13%
20%
18% 13%
13%
10%
13% Less than $500,000
$500,000-‐$749,999
$750,000-‐$999,999
$1.0 -‐ $1.24 million
$1.25 -‐ $1.49 million
$1.5 -‐ $1.99 million
More than $2.0 million
19%
22%
29%
17%
6% 7%
Less than $100,000
$100,000-‐$249,999
$250,000-‐$499,999
$500,000-‐$749,999
$750,000-‐$1.0 million
More than $1.0 million
P a g e | 21
Please attribute all data to the American Academy of Cosmetic Dentistry (AACD) For more information, please contact [email protected] or visit www.AACD.com
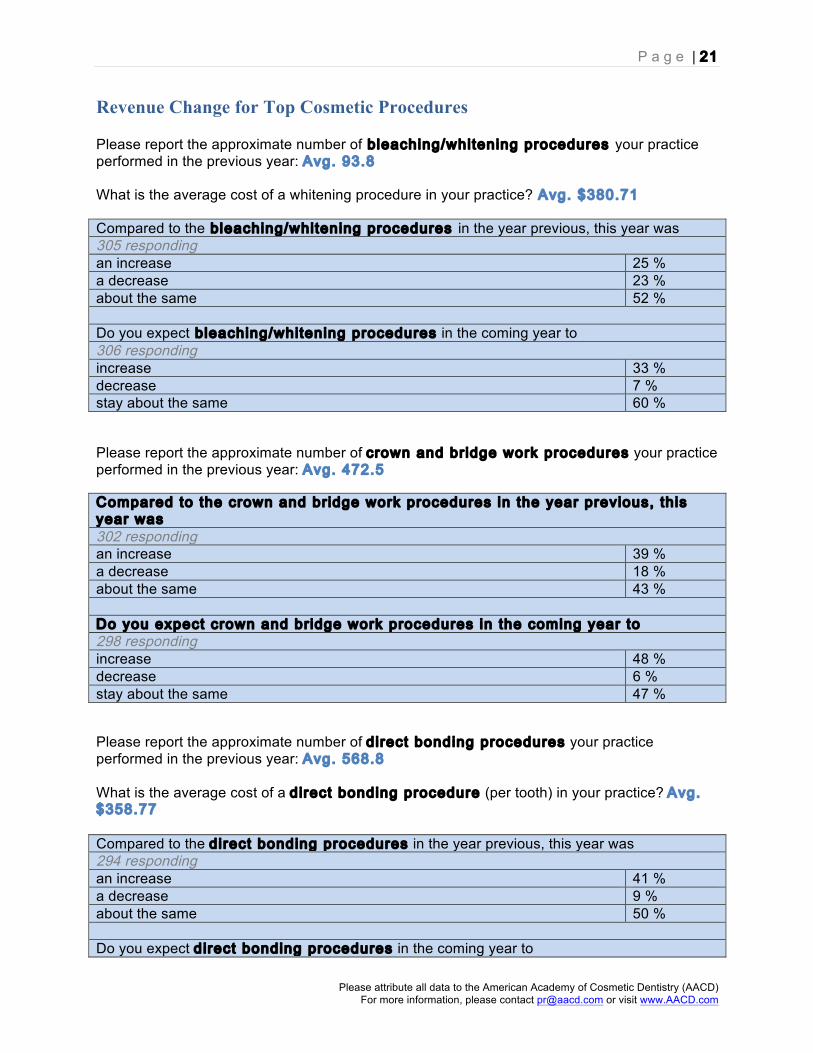
Revenue Change for Top Cosmetic Procedures Please report the approximate number of bleaching/whitening procedures your practice performed in the previous year: Avg. 93.8 What is the average cost of a whitening procedure in your practice? Avg. $380.71
Compared to the bleaching/whitening procedures in the year previous, this year was 305 responding an increase 25 % a decrease 23 % about the same 52 %
Do you expect bleaching/whitening procedures in the coming year to 306 responding increase 33 % decrease 7 % stay about the same 60 % Please report the approximate number of crown and bridge work procedures your practice performed in the previous year: Avg. 472.5 Compared to the crown and bridge work procedures in the year previous, this year was 302 responding an increase 39 % a decrease 18 % about the same 43 %
Do you expect crown and bridge work procedures in the coming year to 298 responding increase 48 % decrease 6 % stay about the same 47 % Please report the approximate number of direct bonding procedures your practice performed in the previous year: Avg. 568.8 What is the average cost of a direct bonding procedure (per tooth) in your practice? Avg. $358.77 Compared to the direct bonding procedures in the year previous, this year was 294 responding an increase 41 % a decrease 9 % about the same 50 %
Do you expect direct bonding procedures in the coming year to
P a g e | 22
Please attribute all data to the American Academy of Cosmetic Dentistry (AACD) For more information, please contact [email protected] or visit www.AACD.com
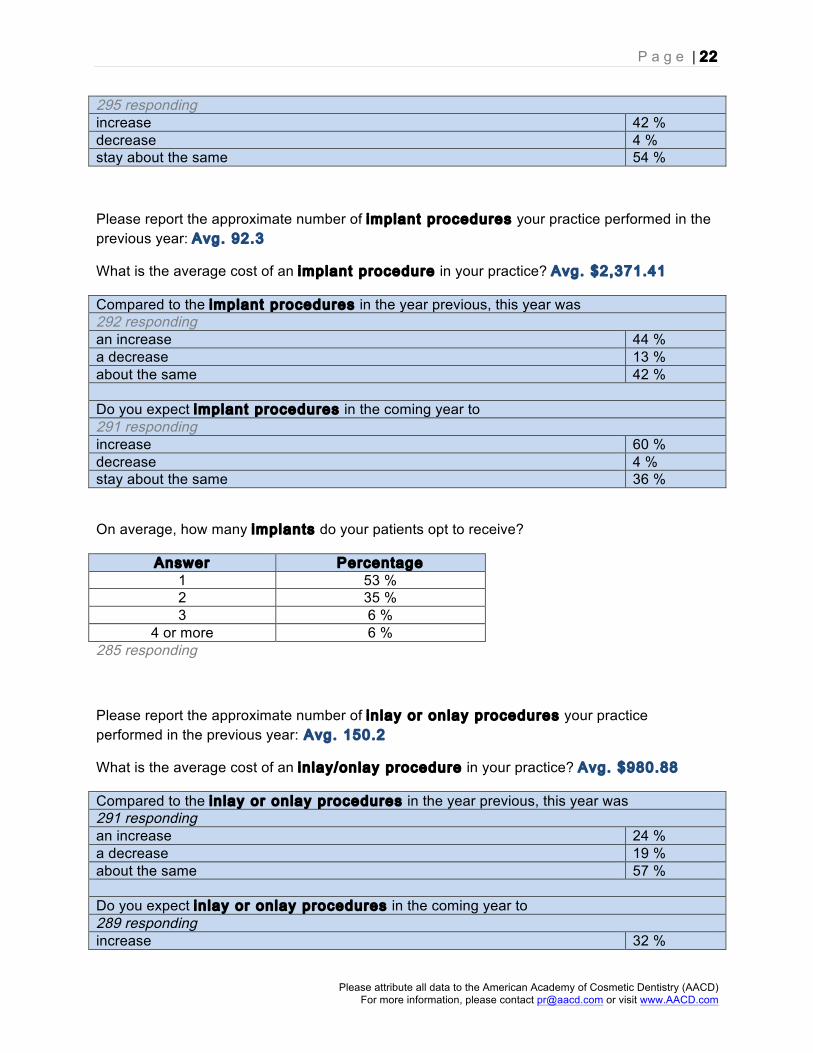
295 responding increase 42 % decrease 4 % stay about the same 54 %
Please report the approximate number of implant procedures your practice performed in the previous year: Avg. 92.3
What is the average cost of an implant procedure in your practice? Avg. $2,371.41
Compared to the implant procedures in the year previous, this year was 292 responding an increase 44 % a decrease 13 % about the same 42 %
Do you expect implant procedures in the coming year to 291 responding increase 60 % decrease 4 % stay about the same 36 %
On average, how many implants do your patients opt to receive?
Answer Percentage 1 53 % 2 35 % 3 6 %
4 or more 6 % 285 responding
Please report the approximate number of inlay or onlay procedures your practice performed in the previous year: Avg. 150.2
What is the average cost of an inlay/onlay procedure in your practice? Avg. $980.88
Compared to the inlay or onlay procedures in the year previous, this year was 291 responding an increase 24 % a decrease 19 % about the same 57 %
Do you expect inlay or onlay procedures in the coming year to 289 responding increase 32 %
P a g e | 23
Please attribute all data to the American Academy of Cosmetic Dentistry (AACD) For more information, please contact [email protected] or visit www.AACD.com
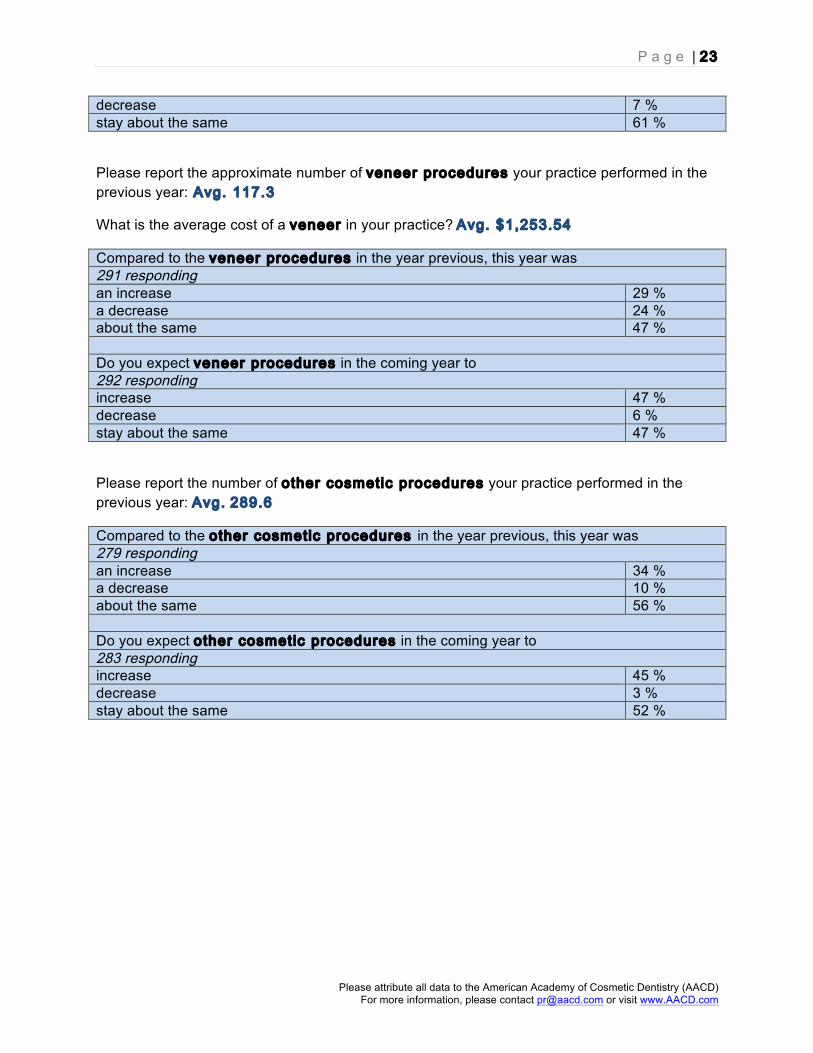
decrease 7 % stay about the same 61 %
Please report the approximate number of veneer procedures your practice performed in the previous year: Avg. 117.3
What is the average cost of a veneer in your practice? Avg. $1,253.54
Compared to the veneer procedures in the year previous, this year was 291 responding an increase 29 % a decrease 24 % about the same 47 %
Do you expect veneer procedures in the coming year to 292 responding increase 47 % decrease 6 % stay about the same 47 %
Please report the number of other cosmetic procedures your practice performed in the previous year: Avg. 289.6
Compared to the other cosmetic procedures in the year previous, this year was 279 responding an increase 34 % a decrease 10 % about the same 56 %
Do you expect other cosmetic procedures in the coming year to 283 responding increase 45 % decrease 3 % stay about the same 52 %
P a g e | 24
Please attribute all data to the American Academy of Cosmetic Dentistry (AACD) For more information, please contact [email protected] or visit www.AACD.com
FINDINGS: Executive Summary
General • A total of 659 responses were tabulated, with fewer respondents completing the latter
portion of the survey. 82% of respondents were American Academy of Cosmetic Dentistry (AACD) members.
• Previous benchmarking surveys were conducted in 2004, 2007, and 2011. • While the smallest in terms of procedures performed in the past year, orthodontics
showed the largest positive shift (10% more than data collected in 2007), while veneers have dropped 8% since the 2007 study. (See page 2)
Cosmetic Dental Practice Demographics • More than half of the practices reporting (57%) have been in operation for 20 years or
more. Since 2007, there’s been a migration away from suburban and rural settings to more urban environments, which increased 7 percentage points in the past four years. Still, 45% of cosmetic dentistry practices report the type of community in which they are located as suburban. (See page 4)
• Most practices have between 3 and 9 employees, with the average reported at 7.7. The total number of dentists performing cosmetic procedures at reporting practices average 1.6 cosmetic dentists per practice, an increase from 1.3 dentists in 2007. (See page 5)
• The average number of dental laboratories used is 3.15, an indication of lab loyalty over the 2007 average of 3.5 labs used. Esthetic considerations was the top concern (79%) in selecting which dental laboratory to use, with procedure or specialty not far behind at 64%. (See page 6)
• While it’s clear that the entire dental team is involved in initiating dialogue about cosmetic dentistry and recommending procedures, the instigation of new business is overwhelmingly driven by the dentist—a 20-point increase over previous benchmarks. (See page 7)
A Bit about the Patients • Respondents indicated that demand for cosmetic dentistry procedures was primarily
driven by referrals from others who have had a positive experience, while the biggest change from the 2007 benchmarking survey is the factor “increase in Internet usage by patients,” which—not surprisingly in this connected age—is up 25 points. (See page 7)
• Three-fifths of cosmetic dentistry patients were female (60%), two-fifths were male (40%) representing a 7-point swing toward males since the 2007 survey. (See page 8)
• Close to half of patients (49%), on average, are between the ages of 31 and 50. The number of patients age 20 and under grew significantly to 17% from only 5% in 2007. (See page 8)
• When asked to indicate the number of patients their practices had for cosmetic dentistry procedures in 2011 (counting multiple visits by the same patients as one visit), 4% of practices had 1,000 or more patients—a marked decline since 2007 when 16% of respondents reported 1,000 or more. At the opposite end of the spectrum, 11% had fewer than 25 patients. The average number of cosmetic patients per practice in 2011 was 247, down significantly from an average of 485 in 2007. (See page 9)
P a g e | 25
Please attribute all data to the American Academy of Cosmetic Dentistry (AACD) For more information, please contact [email protected] or visit www.AACD.com
• Respondents were asked to rate how much of a concern various issues are to patients when they consider a cosmetic dentistry procedure. Defining ratings of 4 or 5 as a true concern, at the top of the list is appearance, indicated by 97%. Indicated by fewer, but still substantial majorities, are cost (87%) and longevity of treatment results (79%). (See page 9)
Cosmetic Dentistry in Dollars and Cents • When asked to indicate their practice’s average production per scheduled cosmetic
dentistry patient visit in the past year, one out of four respondents (25%) indicated the highest category available on the survey: $2,500 or more. The average for per-patient visit is $1,603. (See page 10)
• When asked to indicate how much the average cosmetic dentistry patient spent on services at their practices in the past year, 3% of practices indicated an average amount of $20,000 or more spent per patient—the same as indicated in the 2007 benchmark survey. At the other extreme, 6% of practices reported average patient costs of less than $500—a 4-point increase since 2007. The modal (most often indicated) categories were $2,500 - $4,999 (19%) and $5,000 - $9,999 (15%), both down several points since 2007. (See page 10)
• 77% of practices indicated they offered their cosmetic dentistry patients third-party external financing services in the past year, a decrease of 10 points since the 2007 survey, but of those offering financing, 78% of respondents reported that third-party financing options helped patients get to a “yes” decision. (See page 11)
• The average practice reported total revenues for all dentistry procedures (both cosmetic and non-cosmetic) in 2011 at $1 million. Compared to the 2007 survey, the lowest category (less than $500,000) has increased by 6 points; however, this is offset by the 6-point positive swing in the $1.25 million to $1.99 million categories. The “more than $2 million” category remained unchanged since 2007 at 8% of those reporting. (See page 12)
• Nearly three-quarters of respondents (73%) reported total cosmetic procedure revenues at $500,000 or less for the previous year. The average revenue for cosmetic dentistry procedures for all those reporting is $375,000 per practice. (See page 12)
• The cosmetic dentistry industry has declined by 13% since the 2007 survey primarily driven by the poor economy and recessionary behavior of many seeking treatment. (See page 13)
• However, when looking at specific cosmetic dentistry procedures, participants overwhelmingly believe that revenues generated from these procedures have either increased or stayed the same year over year, and the expectation is that revenues will continue to increase or stay the same into next year. (See pages 13 – 16)