A.31 Traffic Modelling Report - Planning Documents
109
Appendix A A.3.1 Traffic Modelling Report
Transcript of A.31 Traffic Modelling Report - Planning Documents

Appendix A
A.3.1 Traffic Modelling Report

Galway County Council N6 Galway City Transport Project Phase 2 Traffic Modelling Report
GCOB-4.04-10.1 (Phase 2 TM Report)_Final Issue
Final Issue | 31 August 2015
This report takes into account the particular instructions and requirements of our client.
It is not intended for and should not be relied upon by any third party and no responsibility is undertaken to any third party.
Job number 223985-00
Ove Arup & Partners Ireland Ltd
Arup 15 Oliver Plunkett Street Cork Ireland www.arup.com
GCOB-4.04-10.1 (Phase 2 TM Report)_Final Issue | Final Issue | 31 August 2015 | Arup
\\GLOBAL\EUROPE\DUBLIN\JOBS\233000\233985-00\4. INTERNAL\4-04 REPORTS\4-04-03 INFRASTRUCTURE\10. TM\10.1 PHASE 2\GCOB-4.04-10.1 (TM REPORT)_FINAL ISSUE.DOCX
Document Verification
Job title N6 Galway City Transport Project Job number
223985-00 Document title Phase 2 Traffic Modelling Report Appendices File reference
4.04-10.1 Document ref GCOB-4.04-10.1 (Phase 2 TM Report)_Final Issue Revision Date Filename GCOB-4.04-10.1 (TM Report)_Final Issue Final Issue 31/8/15 Description Final Issue
Prepared by Checked by Approved by
Name Dan Brenan Andrew Archer Ian Byrne
Signature
Filename Description
Prepared by Checked by Approved by
Name
Signature
Filename Description
Prepared by Checked by Approved by
Name
Signature
Filename Description
Prepared by Checked by Approved by
Name
Signature
Issue Document Verification with Document

Galway County Council N6 Galway City Transport Project
Phase 2 Traffic Modelling Report Appendices
GCOB-4.04-10.1 (Phase 2 TM Report)_Final Issue | Final Issue | 31 August 2015 | Arup
\\GLOBAL\EUROPE\DUBLIN\JOBS\233000\233985-00\4. INTERNAL\4-04 REPORTS\4-04-03 INFRASTRUCTURE\10. TM\10.1 PHASE 2\GCOB-4.04-10.1 (TM REPORT)_FINAL
ISSUE.DOCX
Contents
Page
1 Introduction 4
1.1 Introduction 4 1.2 Background 4 1.3 Study Area 4 1.4 Existing Conditions 5 1.5 Proposed Scheme Options 19 1.6 Modelling Overview 24
2 Data Collection 26
2.1 Traffic Count Surveys 26 2.2 Traffic Signal Data 26 2.3 Journey Time Surveys 28
3 Model Development 30
3.1 Road Network Development 30 3.2 Public Transport Network Development 32 3.3 Model Zone System 32 3.4 Matrix Development 32 3.5 Demand Model Form 33 3.6 Assignment Method 34 3.7 Generalised Cost Parameters 34
4 Model Calibration & Validation 35
4.1 Overview of the Calibration and Validation Process 35 4.2 Highway Assignment Model Calibration Results 35 4.3 Trip Matrix Calibration 36 4.4 Link and Turn Flow Calibration 37 4.5 Journey Time Validation 47 4.6 Validation against Independent Counts 48 4.7 Impact of Matrix Estimation on Trip Length Distribution 49 4.8 Demand Model Calibration Results 51
5 Future Year Model Development 52
5.1 Introduction 52 5.2 Future Year Network Development 52 5.3 Future Year Matrix Development 53 5.4 Growth Scenario 55 5.5 Greenfield Sites 55 5.6 Vehicle Occupancy 55

Galway County Council N6 Galway City Transport Project
Phase 2 Traffic Modelling Report Appendices
GCOB-4.04-10.1 (Phase 2 TM Report)_Final Issue | Final Issue | 31 August 2015 | Arup
\\GLOBAL\EUROPE\DUBLIN\JOBS\233000\233985-00\4. INTERNAL\4-04 REPORTS\4-04-03 INFRASTRUCTURE\10. TM\10.1 PHASE 2\GCOB-4.04-10.1 (TM REPORT)_FINAL
ISSUE.DOCX
5.7 Car Ownership 56 5.8 Goods Vehicle Growth 56 5.9 Future Year Parameters 56 5.10 Future Year Matrix Totals 57 5.11 Future Year Matrix Analysis 57
6 Analysis of the Options 63
6.1 Introduction 63 6.2 Network Performance Indicators 63 6.3 Journey Times 64 6.4 Traffic Patterns 65 6.5 Mode Share 66 6.6 Annual Average Daily Traffic (AADT) 66
7 Emerging Preferred Route Corridor 80
7.1 Overview 80 7.2 Emerging Preferred Route Corridor Analysis 83 7.3 Network Performance 83 7.4 Journey Times 84 7.5 Annual Average Daily Traffic (AADT) 85 7.6 Galway Transport Strategy and Next Steps 88
Appendices
Appendix A
Traffic Count Locations
Appendix B
Tom Tom Speed Data Sample Sizes
Appendix C
Model Zone System
Appendix D
Highway Link and Turn Count
Appendix E
List of Future Year Do-Minimum
Appendix F
NTA NDFM Development Report
Appendix G
Cross-section selection

Galway County Council N6 Galway City Transport Project
Phase 2 Traffic Modelling Report Appendices
GCOB-4.04-10.1 (Phase 2 TM Report)_Final Issue | Final Issue | 31 August 2015 | Arup
\\GLOBAL\EUROPE\DUBLIN\JOBS\233000\233985-00\4. INTERNAL\4-04 REPORTS\4-04-03 INFRASTRUCTURE\10. TM\10.1 PHASE 2\GCOB-4.04-10.1 (TM REPORT)_FINAL
ISSUE.DOCX
Appendix H
AADT Expansion Factors
Appendix I
NTA GIM Forecasting - Briefing Note 1

Galway County Council N6 Galway City Transport Project
Phase 2 Traffic Modelling Report Appendices
GCOB-4.04-10.1 (Phase 2 TM Report)_Final Issue | Final Issue | 31 August 2015 | Arup
\\GLOBAL\EUROPE\DUBLIN\JOBS\233000\233985-00\4. INTERNAL\4-04 REPORTS\4-04-03 INFRASTRUCTURE\10. TM\10.1 PHASE 2\GCOB-4.04-10.1 (TM REPORT)_FINAL
ISSUE.DOCX
Page 4
1 Introduction
1.1 Introduction The purpose of this Traffic Modelling Report (TMR) is to describe the traffic forecasting that has been undertaken for Phase 2 Route Selection for the N6 Galway City Transportation Project (GCTP). It outlines the development of the base year transport model, the methodology for forecasting future year travel demands and the testing of scheme options.
1.2 Background Galway County Council and Galway City Council are fully committed to providing a transportation solution to the existing transportation issues in both Galway City and its environs.
The Galway City Outer Bypass, an earlier scheme, was previously developed and submitted to An Bord Pleanála (ABP) in 2006 for approval. However the scheme was ultimately quashed by the Supreme Court based on an interpretation of the Habitats Directive delivered by the Court of Justice of the European Union (CJEU) in April 2013. The process of developing a transportation solution for Galway city and environs therefore recommenced at Phase 1, feasibility and concept stage.
Arup have been appointed to provide multi-disciplinary engineering consultancy services for delivery of Phases 1, 2, 3 and 4 in compliance with the NRA1 Project Management Guidelines (NRA PMG) for the N6 Galway City Transport Project (GCTP). Arup have appointed SYSTRA Ltd to undertake the transport modelling elements of the project.
Phase 1 is now complete. The conclusion of Phase 1 is that there is a strong justification for advancing a scheme which includes construction works to provide infrastructure to deliver a solution to the transportation issues in Galway.
The purpose of Phase 2 Route Selection is to identify a suitable Study Area for the examination of all alternative routes and options, to identify key constraints within that Study Area, to develop feasible route options and alternatives and to carry out a systematic assessment of the options leading overall to the selection of a Preferred Route Corridor. This informs the detailed design to follow at Phase 3 Design.
1.3 Study Area For the purpose of Phase 2, a study area has been developed, within which transportation solutions will be assessed to determine the preferred transportation 1 The Minister for Transport, Tourism and Sport has signed the order for the merger of the National Roads Authority (NRA) with the Railway Procurement Agency (RPA) to establish a single new entity called Transport Infrastructure Ireland (TII). The National Roads Authority is known as Transport Infrastructure Ireland (TII) since 1st of August 2015. All references to guidance documents and standards within this report will retain the NRA reference until such time as these documents are updated.

Galway County Council N6 Galway City Transport Project
Phase 2 Traffic Modelling Report Appendices
GCOB-4.04-10.1 (Phase 2 TM Report)_Final Issue | Final Issue | 31 August 2015 | Arup
\\GLOBAL\EUROPE\DUBLIN\JOBS\233000\233985-00\4. INTERNAL\4-04 REPORTS\4-04-03 INFRASTRUCTURE\10. TM\10.1 PHASE 2\GCOB-4.04-10.1 (TM REPORT)_FINAL
ISSUE.DOCX
Page 5
option. The study area encompasses the city as a whole to the coastline, extends to the West as far as Bearna village, as far north as Lough Corrib and Eastwards to the interface with the M6 Galway to Dublin Motorway.
Figure 1.3.1 shows the study area.
Figure 1.3.1: Study Area
1.4 Existing Conditions
1.4.1 Existing Road Network The N6 is a National Primary route which connects the M6 / N6 on the east side of Galway at Ardaun to the N59 and the R338 on the north-west side of Galway at Newcastle, a total distance of 7.3km approximately. The existing N6 is a four lane carriageway from the M6 at-grade roundabout junction to the at-grade roundabout junction with the N59 at the western end.
The N6 terminates at the R338 at the at-grade roundabout junction with the N59/R338. The R338 then continues as a two lane single carriageway of varying width, including bus lanes on certain sections, to the R336, the coast road, thus completing a circumferential route around Galway City to the north of the city. See Figure 1.4.1 for a general layout of the existing road network. Areas which have been designated of high environmental importance are overlain on this graphic also.
There are eight at-grade junctions on the N6 between the M6 and the N59 at the intersections with the M6, R339, R865, N17, N84 and N59. Some of these are roundabouts and others are recently upgraded signalised junctions. There are various forms of at-grade junctions including roundabouts, signals and priority junctions on the R338 from its junction with the N59 to the R336.

Galway County Council N6 Galway City Transport Project
Phase 2 Traffic Modelling Report Appendices
GCOB-4.04-10.1 (Phase 2 TM Report)_Final Issue | Final Issue | 31 August 2015 | Arup
\\GLOBAL\EUROPE\DUBLIN\JOBS\233000\233985-00\4. INTERNAL\4-04 REPORTS\4-04-03 INFRASTRUCTURE\10. TM\10.1 PHASE 2\GCOB-4.04-10.1 (TM REPORT)_FINAL
ISSUE.DOCX
Page 6
1.4.2 Existing Natural Constraints Galway City is physically constrained as it is divided by the River Corrib and a sea inlet known as Lough Atalia and it is bounded along the entire southern boundary by Galway Bay, all of which are natural barriers to free movement and development. There are currently four bridges crossing the river, which cumulatively carry approximately 80,000 vehicles per day.
Three of the four bridges are in very close proximity to the city centre, thus drawing traffic into the city for the sole purpose of crossing the river.
Galway County and Connemara as far west as Clifden and onto Letterfrack are equally dependent on this narrow funnel for access as access to this area is restricted by the extents of Lough Corrib heading north, the Twelve Bens mountains, the Maamturk mountains and the many smaller lakes. Figure 1.4.2 highlights that access to this area is via the bridges across the River Corrib in Galway City due to the physical natural constraints. This is further compounded by the fact that a significant portion of this area is designated of environmental importance and therefore the options to provide multiple other access points are not readily available.

Galway County Council N6 Galway City Transport Project
Phase 2 Traffic Modelling Report Appendices
GCOB-4.04-10.1 (Phase 2 TM Report)_Final Issue | Final Issue | 31 August 2015 | Arup
\\GLOBAL\EUROPE\DUBLIN\JOBS\233000\233985-00\4. INTERNAL\4-04 REPORTS\4-04-03 INFRASTRUCTURE\10. TM\10.1 PHASE 2\GCOB-4.04-10.1 (TM REPORT)_FINAL
ISSUE.DOCX
Page 7
Figure 1.4.1: Existing Road Network

Galway County Council N6 Galway City Transport Project
Phase 2 Traffic Modelling Report Appendices
GCOB-4.04-10.1 (Phase 2 TM Report)_Final Issue | Final Issue | 31 August 2015 | Arup
\\GLOBAL\EUROPE\DUBLIN\JOBS\233000\233985-00\4. INTERNAL\4-04 REPORTS\4-04-03 INFRASTRUCTURE\10. TM\10.1 PHASE 2\GCOB-4.04-10.1 (TM REPORT)_FINAL
ISSUE.DOCX
Page 8
Figure 1.4.2: Existing Natural Constraints

Galway County Council N6 Galway City Transport Project
Phase 2 Traffic Modelling Report Appendices
GCOB-4.04-10.1 (Phase 2 TM Report)_Final Issue | Final Issue | 31 August 2015 | Arup
\\GLOBAL\EUROPE\DUBLIN\JOBS\233000\233985-00\4. INTERNAL\4-04 REPORTS\4-04-03 INFRASTRUCTURE\10. TM\10.1 PHASE 2\GCOB-4.04-10.1 (TM REPORT)_FINAL
ISSUE.DOCX
Page 9
1.4.3 Road Capacity Table 6/1 of the National Roads Authority (NRA) TD9/12 ‘Road Link Design’ indicates that the Annual Average Daily Traffic (AADT) flow of a Type 2 Dual operating at Level of Service D would not exceed 20,000 AADT. The NRA Project Appraisal Guidelines (PAG Unit 4: Definition of Alternatives) suggests that the AADT flow outlined in NRA TD9/12 should only be treated as a guideline and not as a definitive means in the selection of carriageway type.
Notwithstanding this, the following AADT flows were estimated based on traffic counts undertaken by Galway City Council November 2012 and 2013 along the existing N6:
N6 between Coolagh Roundabout and Monivea Road – 21,400 AADT; N6 at Galway Racecourse – 19,900 AADT; N6 between Tuam Road and Kirwan Roundabout – 22,400 AADT; and N6 River Corrib Crossing – 34,600 AADT.
At present, 24hr weekday flows on a number of sections of the N6 exceed the suggested AADT value of 20,000 for LOS D.
1.4.4 P-Factor NRA PAG Unit 16.2: Expansion of Short Period Traffic Counts, discusses the daily profile of traffic and the concept of ‘peaky’ or ‘flat’ profiles. The unit states that ‘In order to represent the ‘Peakiness’ of a traffic flow profile over a particular day, the concept of a ‘p-factor’ has been derived. The p-factor simply describes the scale of the reduction in flow between the AM Peak and the quietest period of the afternoon (the Inter-Peak), and from the Inter-Peak back up to the PM Peak’. It is defined as follows:
p = a + b - 2c
Where: p = the peakiness index a = the maximum hourly proportion of traffic between 00:00
and 12:00 on a weekday b = the maximum hourly proportion of traffic between 12:00
and 24:00 on a weekday c = the minimum hourly proportion of traffic between 08:00
and 18:00 on a weekday
The ‘p-factor’ has been calculated as 0.050 for the N6 based on the daily traffic profile illustrated in Figure 1.4.3. PAG draft Unit 16.2 states that “the maximum p-factor is 1.0, in which case all traffic flow would occur during two individual peak hours of the day, separated by a cessation of all traffic during the afternoon.
The national mean p-factor taken from the NRA Permanent counters located throughout the country was found to be 0.062. The p-factor for the N6 is well below the mean p-factor nationally which would indicate high inter peak traffic levels.

Galway County Council N6 Galway City Transport Project
Phase 2 Traffic Modelling Report Appendices
GCOB-4.04-10.1 (Phase 2 TM Report)_Final Issue | Final Issue | 31 August 2015 | Arup
\\GLOBAL\EUROPE\DUBLIN\JOBS\233000\233985-00\4. INTERNAL\4-04 REPORTS\4-04-03 INFRASTRUCTURE\10. TM\10.1 PHASE 2\GCOB-4.04-10.1 (TM REPORT)_FINAL
ISSUE.DOCX
Page 10
Figure 1.4.3: N6 Traffic Profile
1.4.5 Peak Hour Flows TA 79/99 of the UK DMRB is used to determine the capacity of urban roads. This standard is not formally implemented in Ireland but is considered as background reading which indicates good practice. Within this standard, classifications such as Urban Motorways or Urban All Purpose roads are used, with further sub-classification of Urban All Purpose Roads as UAP1 to UAP4. The N6 in Galway can be defined as a UAP2 which refers to a “good standard single/dual carriageway road with frontage access and two side roads per km”
The N6 Bóthar na dTreabh is generally a four lane single carriageway from the R338 Seamus Quirke Road to the R339 Monivea Road junction. The N6 then becomes a dual carriageway between the Monivea Road and the Coolagh Roundabout. From TA 79/99, a 2 lane UAP2 road has a capacity of approximately 1,470 vehicles per hour for a 7.3m wide 2 lane single carriageway. This capacity increases to 3,200 vehicles per hour for a 7.3m wide 2 lane dual carriageway
Average weekday peak hour traffic flows on the N6, within the Galway urban area have been derived from the November 2012 traffic surveys and are presented in Table 1.4.1.
0.0%
1.0%
2.0%
3.0%
4.0%
5.0%
6.0%
7.0%
8.0%
9.0%
0 1 2 3 4 5 6 7 8 9 10 11 12 13 14 15 16 17 18 19 20 21 22 23
PR
OP
OR
TIO
N O
F D
AIL
Y D
EMA
ND
HOUR BEGINNING
a = 0.077b = 0.081
c = 0.054

Galway County Council N6 Galway City Transport Project
Phase 2 Traffic Modelling Report Appendices
GCOB-4.04-10.1 (Phase 2 TM Report)_Final Issue | Final Issue | 31 August 2015 | Arup
\\GLOBAL\EUROPE\DUBLIN\JOBS\233000\233985-00\4. INTERNAL\4-04 REPORTS\4-04-03 INFRASTRUCTURE\10. TM\10.1 PHASE 2\GCOB-4.04-10.1 (TM REPORT)_FINAL
ISSUE.DOCX
Page 11
Table 1.4.1: N6 Peak Hour Traffic Volumes (November 2012) Road Location C’way Direction AM Peak
(08:00-09:00) PM Peak
(17:00-18:00) N6 Quincentenary Bridge Single Eastbound 1,614 1,357
Westbound 1,466 1,520 N6 North of Bodkin
Roundabout Single Northbound 1,315 1,132
Southbound 1,286 1,052 N6 Terrysland Single Eastbound 925 885
Westbound 1,000 1,000 N6 Galway Race Course Dual Eastbound 881 1,178
Westbound 905 1,357 N6 Coolagh Dual Northbound 1,274 731
Southbound 490 1,201 N6 Ardaun Dual Eastbound 601 1,183
Westbound 930 603
The single carriageway section of the N6 between the Quincentenary Bridge and Terryland carries the highest volumes of traffic in the peak hour. These are frequently at or above the capacity threshold defined in TA 79/99, which results in congestion on the route. Lower traffic volumes are carried on the dualled eastern section of the N6 Bóthar na dTreabh, however congestion is still experienced along this section, due to capacity restrictions at junctions.
1.4.6 Junction Capacity Assessment In the urban area, junction capacity is the key contributor to road congestion, over and above link capacity. Therefore an assessment of the volume / capacity (V/C) ratio was undertaken at signalised junctions and roundabouts, plus other key junctions in the study area as shown on Figure 1.4.4. Data was extracted from the AM peak base year traffic model to show the maximum volume-to-capacity ratio for the turns at each junction. The volume to capacity ratios are then related to level of delay and congestion at the junctions.

Galway County Council N6 Galway City Transport Project
Phase 2 Traffic Modelling Report Appendices
GCOB-4.04-10.1 (Phase 2 TM Report)_Final Issue | Final Issue | 31 August 2015 | Arup
\\GLOBAL\EUROPE\DUBLIN\JOBS\233000\233985-00\4. INTERNAL\4-04 REPORTS\4-04-03 INFRASTRUCTURE\10. TM\10.1 PHASE 2\GCOB-4.04-10.1 (TM REPORT)_FINAL
ISSUE.DOCX
Page 12
Figure 1.4.4: Volume / Capacity Ratios at Junctions (2012)
Table 1.4.2 summarises the number of junctions with a max turn V / C within standard ranges of 0.85-1.00, 1.00-1.15 and >1.15. Junctions with a V / C ratio greater than 1 are over capacity. Ideally junctions should operate at a V / C ratio of < 0.85, which would allow 15% spare capacity in the junction to cope with an unexpected event or natural growth.
This analysis demonstrates that the existing network is restricted by junction capacity. The junctions on the critical corridors accessing the city, namely the junctions of the N84, N17 and N59 junctions with the N6, are all currently over capacity at peak hour as shown on Figure 1.4.4 above. These junctions are operating at greater than 100% of their capacity, which in turn leads to the significant delays at these junctions. As these junctions are the main arteries into the city and the main junctions on the circumferential route around the city, this is a significant issue for the Gateway of Galway.
In addition, approximately 40% of all junctions on the key access routes across the study area are operating above 85% capacity. This demonstrates that the network is finely balanced with minimal spare capacity to allow for any unforeseen event or natural growth.

Galway County Council N6 Galway City Transport Project
Phase 2 Traffic Modelling Report Appendices
GCOB-4.04-10.1 (Phase 2 TM Report)_Final Issue | Final Issue | 31 August 2015 | Arup
\\GLOBAL\EUROPE\DUBLIN\JOBS\233000\233985-00\4. INTERNAL\4-04 REPORTS\4-04-03 INFRASTRUCTURE\10. TM\10.1 PHASE 2\GCOB-4.04-10.1 (TM REPORT)_FINAL
ISSUE.DOCX
Page 13
Table 1.4.2: Junction Volume / Capacity Ratio (2012) Sector Sector Name 0.85 – 1.00 1.00 – 1.15 > 1.15 1 City Centre 2 0 0 2 City West 2 0 0 3 City East 3 1 0 4 R338 West 5 1 0 5 R338 East 1 2 0 6 N6 8 4 1 7 Western Distributor 0 0 0 8 R336 4 0 0 9 N59 /Newcastle St 0 1 0 10 N84 0 0 1 11 N17 2 1 0 12 R339 0 0 0 13 N6 from M6 0 0 0 Total - 27 10 2
Figure 1.4.5: Sectors and Corridors used for Junction V/C Assessment
1.4.7 Journey Time Reliability Assessment Peak hour congestion on the road network in Galway, predominantly caused by junction capacity issues outlined above, results in increased journey times in peak periods in Galway. This leads to a reduction in journey time reliability in the city during these periods.
An analysis of observed journey times on three key routes around Galway and environs was carried out to show the variance in journey times between the peak and off-peak periods in the base year. The difference between the peak and off-peak journey times is a measure of the level of congestion during the peak, and increasing congestion results in worsening journey time reliability.
Observed travel times in 2012 Base Year on each of the routes in the inbound direction in the morning peak period versus the off-peak period are tabulated in Table 1.4.3 below.

Galway County Council N6 Galway City Transport Project
Phase 2 Traffic Modelling Report Appendices
GCOB-4.04-10.1 (Phase 2 TM Report)_Final Issue | Final Issue | 31 August 2015 | Arup
\\GLOBAL\EUROPE\DUBLIN\JOBS\233000\233985-00\4. INTERNAL\4-04 REPORTS\4-04-03 INFRASTRUCTURE\10. TM\10.1 PHASE 2\GCOB-4.04-10.1 (TM REPORT)_FINAL
ISSUE.DOCX
Page 14
This assessment of journey time shows that the travel times on these three key routes in the morning peak hour are on average more than double the off-peak travel times.
Table 1.4.3: Journey Time Reliability
Figure 1.4.6: Journey Time Reliability Routes
Off-peak
average hour
Morning
peak hour
Difference %Difference
Route 1 IN 14 28 14 100%
Roue 2 IN 14 25 11 79%
Route 3 IN 8 19 11 138%
0 0 0 0Average 12 24 12 105%
2012 Observed Journey Times (minutes)
Inb
ou
nd

Galway County Council N6 Galway City Transport Project
Phase 2 Traffic Modelling Report Appendices
GCOB-4.04-10.1 (Phase 2 TM Report)_Final Issue | Final Issue | 31 August 2015 | Arup
\\GLOBAL\EUROPE\DUBLIN\JOBS\233000\233985-00\4. INTERNAL\4-04 REPORTS\4-04-03 INFRASTRUCTURE\10. TM\10.1 PHASE 2\GCOB-4.04-10.1 (TM REPORT)_FINAL
ISSUE.DOCX
Page 15
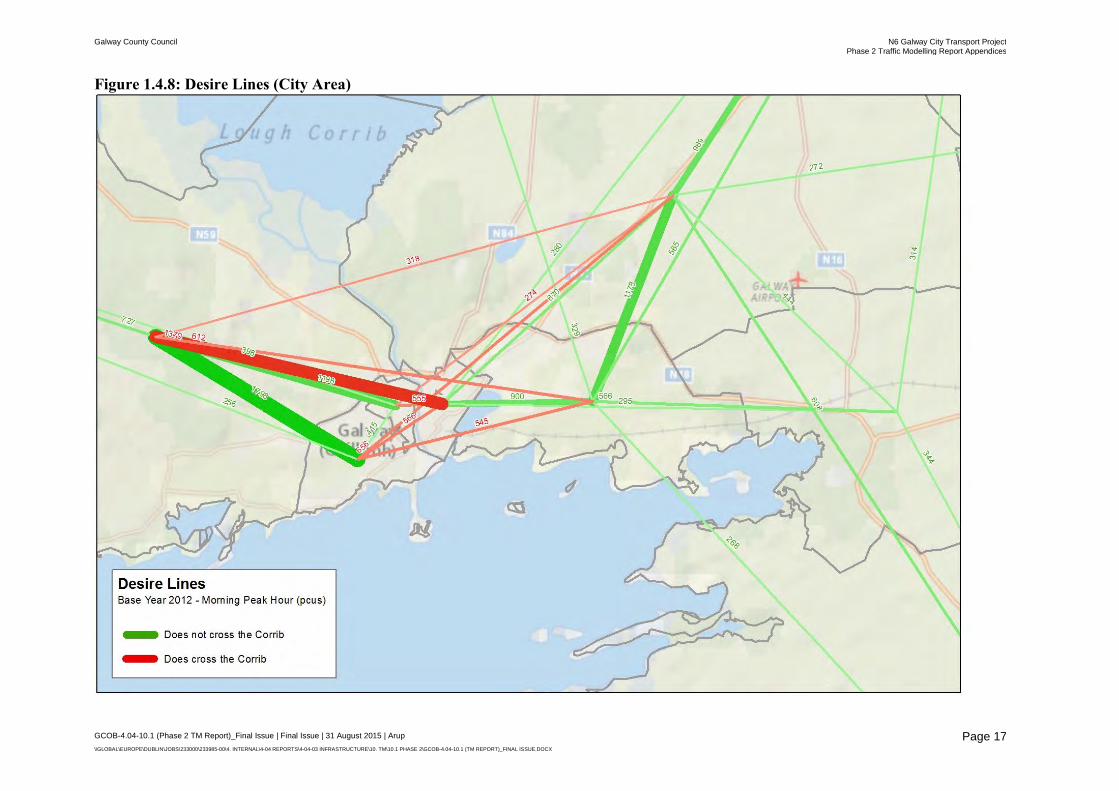
1.4.8 Desire Lines An analysis of desire lines for travel in Galway has been undertaken to gain an understanding of travel patterns in the study area. This has been developed using the extensive information on trip origins and destinations incorporated into the base year GCTP models.
The model is divided up into approximately 300 zones, which have been aggregated to 16 sectors for the purposes of establishing the desire lines or demand between the sectors. Figure 1.4.7 below shows the desire lines between all the sectors in the vicinity of Galway and environs. Figure 1.4.8 is zoomed into and highlights the city area.
The following should be noted when interpreting Figures 1.4.7 and 1.4.8:
Sectors are delineated by solid grey lines; Journeys from one sector to another sector are aggregated together and shown
as a single line. The thickness of the line highlights the level of demand and includes both directions of travel;
The aggregated journeys are shown from the centre of one sector to the centre of the destination sector(s);
Journeys undertaken and completed internally within sectors are not shown; Desire lines shown are not road based; Green lines denote journeys which commence and end without crossing the
River Corrib; Red lines denote journeys which include crossing the River Corrib, and Aggregate journeys which total less than 250 passenger car units per hour
(PCU.h) have been omitted from Figure 2.8 for clarity.
Figure 1.4.7 shows the demand towards the city, with a strong demand coming from all over the county to the city. It also shows many red desire lines which commence from sectors outside the city and terminate in sectors outside the city on the opposite side of the river, demonstrating the trips that are forced through the city to cross the river as part of their longer journey beyond the city.
Figure 1.4.8 shows a zoom closer into the city. As expected, there are strong desire lines matching the radial routes into the city. However, there also are strong desire lines crossing the city as demonstrated by the red lines, with 25% of all trips crossing the river. This demonstrates a significant cross-city travel pattern.
The appropriateness of a potential solution will be judged by assessment of its ability to serve these desire lines. Therefore, a bypass may be part of a potential solution if it is sufficiently close to capture these cross-city movements as well as the sector to sector movements which do not need to interact with the city.

Galway County Council N6 Galway City Transport Project
Phase 2 Traffic Modelling Report Appendices
GCOB-4.04-10.1 (Phase 2 TM Report)_Final Issue | Final Issue | 31 August 2015 | Arup
\\GLOBAL\EUROPE\DUBLIN\JOBS\233000\233985-00\4. INTERNAL\4-04 REPORTS\4-04-03 INFRASTRUCTURE\10. TM\10.1 PHASE 2\GCOB-4.04-10.1 (TM REPORT)_FINAL ISSUE.DOCX
Page 16
Figure 1.4.7: Desire Lines (All Sectors)
Galway County Council N6 Galway City Transport Project
Phase 2 Traffic Modelling Report Appendices
GCOB-4.04-10.1 (Phase 2 TM Report)_Final Issue | Final Issue | 31 August 2015 | Arup
\\GLOBAL\EUROPE\DUBLIN\JOBS\233000\233985-00\4. INTERNAL\4-04 REPORTS\4-04-03 INFRASTRUCTURE\10. TM\10.1 PHASE 2\GCOB-4.04-10.1 (TM REPORT)_FINAL ISSUE.DOCX
Page 17
Figure 1.4.8: Desire Lines (City Area)

Galway County Council N6 Galway City Transport Project
Phase 2 Traffic Modelling Report Appendices
GCOB-4.04-10.1 (Phase 2 TM Report)_Final Issue | Final Issue | 31 August 2015 | Arup
\\GLOBAL\EUROPE\DUBLIN\JOBS\233000\233985-00\4. INTERNAL\4-04 REPORTS\4-04-03 INFRASTRUCTURE\10. TM\10.1 PHASE 2\GCOB-4.04-10.1 (TM REPORT)_FINAL
ISSUE.DOCX
Page 18
1.4.9 Strategic Travel Patterns The desire line analysis can be further aggregated into a broad representation of strategic travel patterns in Galway focusing on trips that cross the River Corrib and that either travel into Galway City or travel through the city.
Figure 1.4.9 is a schematic diagram to illustrate the travel patterns for private car trips to, from or through Galway City in the 2012 Base year morning peak hour (extracted from the travel demand matrices). Red arrows show movements that cross the River Corrib and green arrows show movements that do not cross the River Corrib.
Figure 1.4.9: Travel Patterns 2012 Base Year Morning Peak Hour
In total 35% of total car trips into and around Galway City cross the River Corrib. Of this total number of cross-river trips, approximately 9% are bypass traffic. Some 40% of all trips remain on the same side of the city as where they started.
The strongest movements are from the west side of Galway city to the east side of Galway city which represents 20% of all trips, and from the east of Galway city to the west side of Galway city which represent a further 20%.
This analysis implies that the preferred option must cater for movements from one side of the city to the other in addition to through traffic, rather than a conventional bypass of the city which would mainly cater for through traffic. In particular, the preferred option should cater for movements to the east side of Galway city.
River Corrib
7%
5%
3%
20%
20%
18%22%
5%
Crosses the Corrib
Does not cross the Corrib
Travel patterns by Private Car
Galway County Council N6 Galway City Transport Project
Phase 2 Traffic Modelling Report Appendices
GCOB-4.04-10.1 (Phase 2 TM Report)_Final Issue | Final Issue | 31 August 2015 | Arup
\\GLOBAL\EUROPE\DUBLIN\JOBS\233000\233985-00\4. INTERNAL\4-04 REPORTS\4-04-03 INFRASTRUCTURE\10. TM\10.1 PHASE 2\GCOB-4.04-10.1 (TM REPORT)_FINAL
ISSUE.DOCX
Page 19
1.5 Proposed Scheme Options
1.5.1 Road Options Six route corridor options have been identified within the scheme study area, as shown on Figure 1.5.1, which are to be appraised according to the PAG Phase 2 Route Selection guidelines. Detailed descriptions of the six road route options are below.
Orange Route Option
The Orange Route Option ties into the existing R336 with a signalised junction at the eastern end of Bearna Village and proceeds north as per the Red Route Option to point D, generally in cut. On the Orange Route Option an at-grade roundabout is proposed with an associated link road, which provides a connection to the Cappagh Road and the Western Distributor Road. A second at-grade roundabout junction is proposed at Ballymoneen Road. The Orange Route Option then continues, at approximately the existing ground level, to Letteragh where a grade separated junction is proposed. A new link road, the Orange N59 Link, is required to facilitate this junction; it commences at point F at Bothar Stiofáin and terminates at point G on the existing N59. The Orange Route Option is descending into cut in this area and the Orange N59 Link is approximately at existing ground level at their crossing point, with the link road continuing at grade to the south, and in cut to the north.
The Orange Route Option enters a deep tunnel to the east of the new junction in Letteragh and crosses under the River Corrib towards the Terryland area. It emerges from the tunnel immediately adjacent to the existing Kirwan Roundabout on the existing N6 at Terryland. A three-level junction is located between Points L and O in the Terryland Park area which provides full movements between the proposed Orange Route Option and the existing N84. The Orange Route Option then follows the Red Route Option, utilising the exiting N6 and the same junction strategy as the Red Route Option until its termination point at Point S in Coolagh.
Green Route Option
At point A the Green Route Option ties into the existing R336 with an at-grade roundabout junction approximately 2km to the west of Bearna village. There are three at-grade roundabout junctions at approximately 2km spacing, on the Bearna to Moycullen road, at Cappagh Road and at Rahoon Road, with the Green Route Option generally in fill in this area. A grade separated signalised diamond junction is proposed at the crossing point of the N59 Galway to Clifden road.
The Green Route Option crosses the River Corrib on a bridge structure and continues east on embankments and viaducts. To the east of the River Corrib, the green option is generally in fill, and there is a grade separated junction to serve the N84 immediately west of the existing N84 in the townland of Ballindooley. A realignment of the existing N84 is included to facilitate this junction. The Green Route Option proceeds in an easterly direction and crosses over the N17. A grade separated junction is provided to facilitate connectivity with the N17. To the east of the N17 the option is in a deep cut. There is a further grade separated junction in the townland of Garraun to facilitate the interface between the existing N6 and the proposed Green Route Option.

Galway County Council N6 Galway City Transport Project
Phase 2 Traffic Modelling Report Appendices
GCOB-4.04-10.1 (Phase 2 TM Report)_Final Issue | Final Issue | 31 August 2015 | Arup
\\GLOBAL\EUROPE\DUBLIN\JOBS\233000\233985-00\4. INTERNAL\4-04 REPORTS\4-04-03 INFRASTRUCTURE\10. TM\10.1 PHASE 2\GCOB-4.04-10.1 (TM REPORT)_FINAL
ISSUE.DOCX
Page 20
Figure 1.5.1: Route Options
Galway County Council N6 Galway City Transport Project
Phase 2 Traffic Modelling Report Appendices
GCOB-4.04-10.1 (Phase 2 TM Report)_Final Issue | Final Issue | 31 August 2015 | Arup
\\GLOBAL\EUROPE\DUBLIN\JOBS\233000\233985-00\4. INTERNAL\4-04 REPORTS\4-04-03 INFRASTRUCTURE\10. TM\10.1 PHASE 2\GCOB-4.04-10.1 (TM REPORT)_FINAL
ISSUE.DOCX
Page 21
Yellow Route Option
The Yellow Route Option ties into the existing R336 at an at-grade roundabout junction approximately 2km to the west of Bearna Village at point D. There are six at-grade junctions between the R336 and the Ballymoneen Road. A roundabout is proposed at Na Foraí Maola, a staggered junction is proposed at Troscaigh Thiar Road. An at-grade roundabout is proposed at the crossing point of the Bearna to Moycullen road, and a staggered junction is proposed at Barr Aille Road. A further two roundabouts are proposed at Cappagh Road and at Ballymoneen Road, with the Yellow Route Option is generally at grade in these areas. The Yellow Route Option then connects to a grade separated junction in the townland of Letteragh, where it descends briefly into cutting. A new link road, the Yellow N59 Link, is required to facilitate this junction; it commences at point F and terminates at point G. This new link road connects the N59 and Bóthar Stiofáin with the Yellow Route Option, and is approximately at existing ground level at their crossing point, with the link road remaining at grade to the south, and in varying sections of cut and fill to the north.
The Yellow Route Option then crosses the River Corrib on a bridge structure. It continues on embankments and viaduct structures towards Coolagh, with sections of cut at high points in the terrain, and crosses over the N84. The Yellow Route Option travels southwards at point M to connect to the Red Route Option at Terryland. A signalised grade separated junction with all movements is proposed in the Terryland Park area to connect the Yellow Route Option to the Red Route Option. This facilitates access in both an easterly and westerly direction onto the Yellow Route Option from the existing road network. The Yellow Route Option then follows the Red Route Option, utilising the exiting N6 and the same junction strategy as the Red Route Option, until its termination point at Point S in Coolagh.
Blue Route Option
The Blue Route Option ties into the existing R336 at a signalised junction at the western end of Bearna and proceeds along an existing section of relief road parallel to and north of the R336. Signalised junctions accommodate the two local roads intersecting this existing relief road of Bearna and the eastern tie in of the Bearna Inner Relief Road to the R336 is provided via a signalised junction to the east of Bearna.
The Blue Route Option is generally in cut or at the existing ground level to the west of Cappagh Road. It then is mainly on embankments as far as the grade separated junction in Letteragh, with an at-grade roundabout junction at Ballymoneen Road. A new link road, the Blue N59 Link, is required to facilitate the grade separated junction. It commences at point F and terminates at point G, connecting the N59 and Bothar Stiofáin with the Blue Route Option, and is at approximately the existing ground level at the crossing point with the Blue Route Option, with the link road continuing mainly in fill to the south, and in varying sections of cut and fill to the north. The Blue Route Option is in cut at this point.
The Blue Route Option continues in sections of cut and fill, travelling over the N59, and coincides with the Yellow Route Option over the River Corrib on a bridge structure. To the east of the river, the Blue Route Option is generally on embankments or viaduct structures, before entering a section of cut preceding the tunnel at Lackagh Quarry. After exiting the tunnel, it continues on embankments and passes over the N84. A grade separated junction is provided to the east of the N84 and to the south of Ballindooley Lough to serve the N84.

Galway County Council N6 Galway City Transport Project
Phase 2 Traffic Modelling Report Appendices
GCOB-4.04-10.1 (Phase 2 TM Report)_Final Issue | Final Issue | 31 August 2015 | Arup
\\GLOBAL\EUROPE\DUBLIN\JOBS\233000\233985-00\4. INTERNAL\4-04 REPORTS\4-04-03 INFRASTRUCTURE\10. TM\10.1 PHASE 2\GCOB-4.04-10.1 (TM REPORT)_FINAL
ISSUE.DOCX
Page 22
Two half junctions, both with west facing slips only, serve the N17 and the Ballybrit and Parkmore Industrial Estates. The Blue Route Option crosses over the N17 and then proceeds into a tunnel below the Galway Racecourse and emerges to the east of the racetrack, still in cut. There is a further grade separated junction to the south-east of the existing Briarhill junction, which is at the existing ground level and is designed to accommodate the industrial estates in the Parkmore area, Ballybrit Business Park and the Briarhill areas of the city. The Blue Route Option is in cut under this junction.
Pink Route Option
Similar to the Blue Route Option, the Pink Route Option commences at a signalised junction at the western end of Bearna and follows the Blue Route Option as far as the tie in with the Bearna Inner Relief Road. The Pink Option continues on embankment with an at grade roundabout proposed with an associated link road, which provides a connection to the Cappagh Road and the Western Distributor Road. A further roundabout is proposed at Ballymoneen Road. It continues on embankments as far as Letteragh where a grade separated junction is proposed. The Pink N59 link is required to facilitate this junction and is as per the Yellow N59 Link, it commences at point F and terminates at point G. The Pink Route Option then continues in sections of cut and fill, travelling over the N59, and over the River Corrib on a bridge structure. To the east of the river, the Pink Route Option is generally on embankments or viaduct structures, before entering a section of cut preceding the tunnel at Lackagh Quarry. After exiting the tunnel, it continues on embankments and passes over the N84. A full grade separated diamond signalised junction is provided at the N84.
Similar to the Blue Option, the Pink Option continues on embankment to the south of Ballindooley Lough to the N17. Two half junctions, both with west facing slips only, serve the N17 and the Ballybrit and Parkmore Industrial Estates. The Pink Route Option crosses over the N17 and then proceeds into a tunnel to the north of the Galway Racecourse and emerges to the northeast of the racetrack, still in cut. There is a further free flow grade separated junction at the existing Coolagh roundabout location, which accommodates the interface between the existing N6, the proposed Pink Route Option and the R446 to and from the Martin Roundabout.
Red Route Option
The Red Route Option ties into the existing R336 at a signalised junction at the eastern end of Bearna village and proceeds north, generally in cut or shallow fill as far as Ballard Road. It incorporates some sections of steeper fill before joining with the existing Western Distributor Road at a proposed signalised junction replacing the existing Cappagh Road Roundabout. It follows the existing Western Distributor Road, at-grade, to Bóthar Stiofáin and includes the replacement of all the existing roundabout junctions along the Western Distributor Road with signalised junctions. The existing residential estate entrances are maintained as priority at-grade junctions along the extent of the Western Distributor Road.
A tunnel extends from Gort na Bró Road eastwards and is depressed underneath Seamus Quirke Road and Browne Roundabout via a cut & cover tunnel. The Red Route Option continues along on the existing N6 eastwards to the existing Quincentenary Bridge. The existing local road network functionality is maintained above the proposed tunnel over the extent of Seamus Quirke Road. The provision of a second bridge crossing over the River Corrib immediately south of and parallel

Galway County Council N6 Galway City Transport Project
Phase 2 Traffic Modelling Report Appendices
GCOB-4.04-10.1 (Phase 2 TM Report)_Final Issue | Final Issue | 31 August 2015 | Arup
\\GLOBAL\EUROPE\DUBLIN\JOBS\233000\233985-00\4. INTERNAL\4-04 REPORTS\4-04-03 INFRASTRUCTURE\10. TM\10.1 PHASE 2\GCOB-4.04-10.1 (TM REPORT)_FINAL
ISSUE.DOCX
Page 23
to the existing bridge provides for the existing local road network functionality of the Quincentenary Bridge for vehicles, pedestrians and cyclists The Quincentenary Bridge will be maintained for expressway traffic.
To the east of the River Corrib, the Red Route Option rises on embankments, passing over the N84 Headford Road and around the rear of the existing shopping centre at Terryland on a viaduct structure. It re-joins the existing N6 National Primary route to the east of the N84 junction at Kirwan Roundabout at its existing level. A split grade separated junction is provided between the existing N6 and the proposed Red Route Option in this area, with west-facing slips to/from the Red Route Option situated immediately east of the river crossing and east-facing slips to/from the Red Route Option situated immediately east of the existing N84 junction at Kirwan Roundabout.
The Red Route Option utilises the existing N6 corridor to connect to the M6 / N6 on the east side of Galway at Coolagh. It is depressed under the N17 and Ballybane Roads but has full connectivity to both roads via signalised diamond junctions and a parallel link road at the current road level. A full diamond grade separated junction is also provided to the south of existing Briarhill junction, which is designed to accommodate the industrial estates in the Parkmore area, Ballybrit Business Park and the Briarhill areas of the city.
The key features of the route options are summarised in Table 1.5.1 and Table 1.5.2.
Table 1.5.1: Summary of key features for each route option Route Option Length (km) No. of Junctions No. of Bridges
Orange 14.88 8 15 Green 20.16 8 19 Yellow 17.21 11 21 Blue 15.66* 9 23 Pink 15.66* 11 24 Red 15.07 20 18
Table 1.5.2: Summary of lengths of key features for each route option
Route Option
Total Length (km)
Type 1 Single (m)
Total Type 2 Dual (m)
Tunnel Length (m)
Viaduct Length (m)
Orange 14.88 2.35 12.53 4.00 - Green 20.16 4.10 16.06 0.85 0.90 Yellow 17.21 4.30 12.91 0.50 1.35 Blue 15.66* 2.40 13.26 1.60 0.95 Pink 15.66* 2.10 13.56 1.45 0.95 Red 15.07 2.60 12.47 1.80 1.20
* Blue and Pink Route Options tie to Bearna Inner Relief Road.
1.5.2 Public Transport Alternative Option In addition to the six road-based options, a Public Transport Alternative option was developed based on the recommendations in the Galway Public Transport Feasibility Study from 2010. The PT Alterative Option comprises:
A Bus Rapid Transit (BRT) operating at a 10 minute frequency from Knocknacarra to the West, through the city centre, to Oranmore in the East.

Galway County Council N6 Galway City Transport Project
Phase 2 Traffic Modelling Report Appendices
GCOB-4.04-10.1 (Phase 2 TM Report)_Final Issue | Final Issue | 31 August 2015 | Arup
\\GLOBAL\EUROPE\DUBLIN\JOBS\233000\233985-00\4. INTERNAL\4-04 REPORTS\4-04-03 INFRASTRUCTURE\10. TM\10.1 PHASE 2\GCOB-4.04-10.1 (TM REPORT)_FINAL
ISSUE.DOCX
Page 24
All existing city bus services increased to 10 minute frequency
Bus priority measures at signalised junctions along the BRT corridor
Re-allocating road space on the Salmon Weir Bridge from general traffic to Public Transport only.
It should be noted that the Galway Public Transport Feasibility Study from 2010 assumed that the Galway City Outer Bypass as proposed by the 2006 planning application was in place, thereby making it possible to consider reallocation of road space on the Salmon Weir Bridge. However, this Public Transport Alternative as modelled here does not include for such additional road infrastructure.
Further to the above, a wider transport strategy for Galway has been commenced which will identify the level of service requirements for each mode of transport including; walking, cycling, public transport and car. This strategy will examine the multi-modal transport needs of Galway in the context of the full, partial or non-delivery of the preferred route option for this study. An outline of the wider transport strategy for Galway is contained in Section 7.6 of this report.
1.6 Modelling Overview For the appraisal of the scheme options a new multi-modal transport model was developed by consultants SYSTRA and Jacobs on behalf of the National Transport Authority (NTA) during 2013. The model is called the Galway Interim Model (GIM) and was developed specifically for the GCTP in advance of the planned development of the NTA’s Regional Models of Ireland.
The GIM is capable of providing future year forecasts of travel demand, traffic flows and journey times for road and public transport schemes, and is a robust tool for assessing the traffic impacts and economic benefits of the GCTP Options.
The GIM comprises three main parts: a highway assignment model in SATURN software, a public transport assignment model in CUBE Voyager software, and a demand model in DIADEM software. These three parts work together as a modelling system to produce forecasts of travel demand and travel costs, as illustrated below.
Figure 1.6.1: GIM Model System

Galway County Council N6 Galway City Transport Project
Phase 2 Traffic Modelling Report Appendices
GCOB-4.04-10.1 (Phase 2 TM Report)_Final Issue | Final Issue | 31 August 2015 | Arup
\\GLOBAL\EUROPE\DUBLIN\JOBS\233000\233985-00\4. INTERNAL\4-04 REPORTS\4-04-03 INFRASTRUCTURE\10. TM\10.1 PHASE 2\GCOB-4.04-10.1 (TM REPORT)_FINAL
ISSUE.DOCX
Page 25
The modelling system works as follows. The travel costs from the assignment models are read into the demand model. The demand model then adjusts the travel demand according to changes between forecast travel costs (e.g. with scheme) and reference travel costs (e.g. without scheme). The adjusted demand is read back into the highway assignment model and the highway travel costs are re-calculated to take account of the impact of the changes to the travel demand. The demand model and highway assignment model are run iteratively until a solution is reached whereby the travel costs and travel demand are in equilibrium.
The assignment models were calibrated and validated against observed data for a 2012 Base Year for the morning peak hour (AM: 0800-0900) and average inter-peak hour (IP: average hour 1000-1600). The AM peak hour was selected following an analysis of traffic survey data. A selection of key ATC survey sites in the urban area were used to produce a profile of weighted average traffic flow in Galway over a typical weekday in November 2012. The resultant traffic profile graph is presented in Figure 1.6.2 which confirms the AM peak hour of 0800-0900.
Figure 1.6.2: Galway Traffic Flow Profile (Weighted Average)
It was agreed with NRA and the NTA that AM peak and Inter-peak models would be sufficient for the appraisal requirements for Phase 2 Route Selection. It is evident from the daily traffic profile above that the PM peak is more spread than the AM peak period and thus the AM peak represents the busiest period on the network. For the economic analysis of the scheme, PM benefits will be estimated from the AM model and adjusted based on factors developed from the traffic flow profile. For the Phase 3 Design Stage and onwards, a PM peak model will be developed and incorporated into the detailed appraisal of the preferred scheme.
0%
1%
2%
3%
4%
5%
6%
7%
8%
0 1 2 3 4 5 6 7 8 9 10 11 12 13 14 15 16 17 18 19 20 21 22 23
HOUR BEGINNING

Galway County Council N6 Galway City Transport Project
Phase 2 Traffic Modelling Report Appendices
GCOB-4.04-10.1 (Phase 2 TM Report)_Final Issue | Final Issue | 31 August 2015 | Arup
\\GLOBAL\EUROPE\DUBLIN\JOBS\233000\233985-00\4. INTERNAL\4-04 REPORTS\4-04-03 INFRASTRUCTURE\10. TM\10.1 PHASE 2\GCOB-4.04-10.1 (TM REPORT)_FINAL
ISSUE.DOCX
Page 26
2 Data Collection
2.1 Traffic Count Surveys A comprehensive set of traffic count data was available for November 2012, which had been collected by Abacus on behalf of Galway City Council. The data consisted of 58 1-day Manual Turning Counts (MTCs) collected over two weekdays and 58 1-week Automatic Traffic Counts (ATCs), covering all the key junctions and corridors in Galway City.
In addition to the November 2012 data, further traffic counts were collected in November 2013 at three junctions on the N18 to the east of Galway City specifically to ensure we had sufficient data to validate the model in this area.
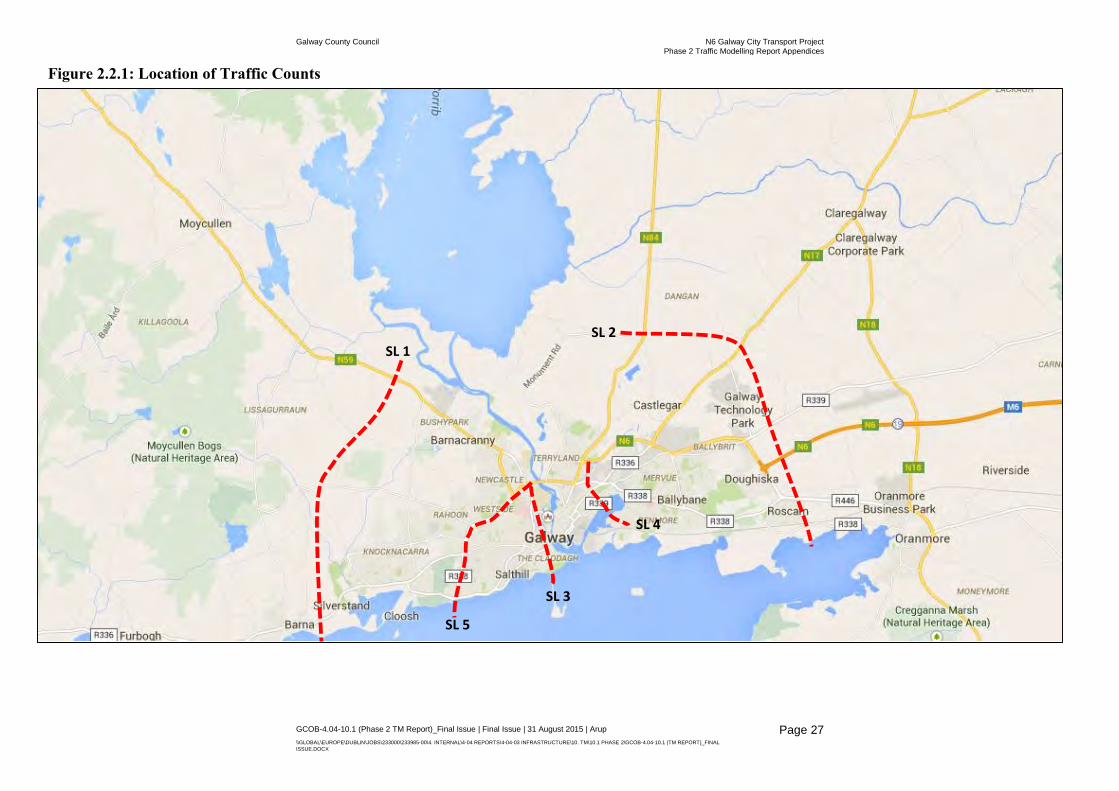
The coverage of the data allowed five screenlines to be identified for use in calibration and validation. A screenline is a groups of links along a defined corridor, such as crossings of a river or crossings of a railway line, which is used for validating strategic trip movements through a transport model.
Appendix A of this report shows the locations of the traffic counts used in model calibration and validation. Figure 2.2.1 below shows the screenlines used. Screenlines 1 and 3 were used in matrix estimation, whilst screenlines 2, 4 and 5 were excluded from matrix estimation and used to validate the model flows against independent counts.
Three NRA permanent counters are located some distance from Galway City: N17 at Loughgeorge, N84 near Curraghline and N59 near Knockaunranny. These counts were not used in the development of the GIM because they are too remote from the study area where the model was validated.
2.2 Traffic Signal Data Galway City Council provided traffic signal staging and green times for all signalised junctions within the city.
.
Galway County Council N6 Galway City Transport Project
Phase 2 Traffic Modelling Report Appendices
GCOB-4.04-10.1 (Phase 2 TM Report)_Final Issue | Final Issue | 31 August 2015 | Arup
\\GLOBAL\EUROPE\DUBLIN\JOBS\233000\233985-00\4. INTERNAL\4-04 REPORTS\4-04-03 INFRASTRUCTURE\10. TM\10.1 PHASE 2\GCOB-4.04-10.1 (TM REPORT)_FINAL
ISSUE.DOCX
Page 27
Figure 2.2.1: Location of Traffic Counts
SL 1
SL 2
SL 3
SL 5
SL 4

Galway County Council N6 Galway City Transport Project
Phase 2 Traffic Modelling Report Appendices
GCOB-4.04-10.1 (Phase 2 TM Report)_Final Issue | Final Issue | 31 August 2015 | Arup
\\GLOBAL\EUROPE\DUBLIN\JOBS\233000\233985-00\4. INTERNAL\4-04 REPORTS\4-04-03 INFRASTRUCTURE\10. TM\10.1 PHASE 2\GCOB-4.04-10.1 (TM REPORT)_FINAL
ISSUE.DOCX
Page 28
2.3 Journey Time Surveys Journey time data was purchased from TomTom providing observed flow weighted travel time of vehicles traversing each link in the city, to be used in the model validation process.
Data was extracted from TomTom for seven time periods as follows:
Off Peak 1900-0700
AM Peak 0800-0900
AM Shoulder 0700-0800 and 0900-1000
Inter-peak 1 1000-1300
Inter-peak 2 1300-1600
PM Peak 1700-1800
PM Shoulder 1600-1700 and 1800-1900
Data can be extracted from TomTom for any combination of days within a year. Three sets were examined:
1 month: November 2012
3 months: September 2012 to November 2012
9 months: September 2012 to May 2013
The average sample sizes per segment are shown in Appendix B for each of the above sets. The dates over which data was extracted were ultimately determined by the sample size of the data. In order to improve the reliability of the data it was necessary to maximise the sample size. Data was extracted for a whole year, excluding summer months which are not representative of typical traffic behaviour, from September 2012 to May 2013.
Weekends, bank holidays and school holidays were excluded.
All roads within class 0 to 6 were selected from the possible classes listed below:
Class 0: Motorways; Freeways; Major Roads;
Class 1: Major Roads less important than Motorways;
Class 2: Other Major Roads;
Class 3: Secondary Roads;
Class 4: Local Connecting Roads;
Class 5: Local Roads of High Importance;
Class 6: Local Roads;
Class 7: Local Roads of Minor Importance; and
Class 8: Other Roads.

Galway County Council N6 Galway City Transport Project
Phase 2 Traffic Modelling Report Appendices
GCOB-4.04-10.1 (Phase 2 TM Report)_Final Issue | Final Issue | 31 August 2015 | Arup
\\GLOBAL\EUROPE\DUBLIN\JOBS\233000\233985-00\4. INTERNAL\4-04 REPORTS\4-04-03 INFRASTRUCTURE\10. TM\10.1 PHASE 2\GCOB-4.04-10.1 (TM REPORT)_FINAL
ISSUE.DOCX
Page 29
The geographical coverage of the TomTom data obtained is shown in Figure 2.3.1.
Figure 2.3.1: TomTom Coverage by Road Class
Note that the origin-destination data that feeds into the development of travel demand matrices for the GIM was extracted largely from POWSCAR and the National Household Travel Survey, and is explained further in the next section.
Road Class
0
1
2
3
4
5
6

Galway County Council N6 Galway City Transport Project
Phase 2 Traffic Modelling Report Appendices
GCOB-4.04-10.1 (Phase 2 TM Report)_Final Issue | Final Issue | 31 August 2015 | Arup
\\GLOBAL\EUROPE\DUBLIN\JOBS\233000\233985-00\4. INTERNAL\4-04 REPORTS\4-04-03 INFRASTRUCTURE\10. TM\10.1 PHASE 2\GCOB-4.04-10.1 (TM REPORT)_FINAL
ISSUE.DOCX
Page 30
3 Model Development
3.1 Road Network Development The basic road network structure was created from HERE mapping and converted into SATURN node and link format, the nodes being the junctions and the links being the lengths of road that connect them. The SATURN network is divided into three areas of decreasing detail: simulation, buffer and external, as shown below. The Galway Model Extent (GME) comprises the simulation and buffer areas: this is the area within which the proposed schemes are likely to affect travel patterns.
Simulation Area
The simulation area covers Galway City and is coded in full simulation detail, where all junctions’ details are coded and the delays are calculated by SATURN based on the interaction of traffic at each junction. This form of delay calculation is recommended in urban areas, where much of the delay on the network is due to junction capacity issues.
Buffer Area
The buffer area extends into a large portion of Galway County and parts of north County Clare. In the buffer area junction details are not coded, instead delays on the road network are calculated by SATURN based on flow-delay curves coded on every link.
External Area
Within the rest of Connaught (County Mayo, Sligo, Leitrim and Roscommon) and County Clare, a reasonable level of network detail has been retained to maintain consistency with the planned development of the West Regional Model and to allow sufficient route choice to and from the GME. Outside this area the network is very sparse and includes just a ‘stub’ that represents where trips to/from the rest of Ireland will load onto the model network. The stubs are coded with representative distances and speeds, which is particularly important within the public transport assignment sub-mode choice (i.e. the choice between bus and rail). The external stubs include the N15/N16 north and east of Sligo, the N63/N5 east of Roscommon, the M6 and N55 east of Athlone, and the N20/N21 and N24 south of Limerick.
Within the external area delays on the road network are not included in the model.

Galway County Council N6 Galway City Transport Project
Phase 2 Traffic Modelling Report Appendices
GCOB-4.04-10.1 (Phase 2 TM Report)_Final Issue | Final Issue | 31 August 2015 | Arup
\\GLOBAL\EUROPE\DUBLIN\JOBS\233000\233985-00\4. INTERNAL\4-04 REPORTS\4-04-03 INFRASTRUCTURE\10. TM\10.1 PHASE 2\GCOB-4.04-10.1 (TM REPORT)_FINAL
ISSUE.DOCX
Page 31
Figure 3.1.1: Galway Model Extent
Figure 3.1.2: Galway Model Extent – SATURN Network
Simulation Buffer External
Simulation Buffer External

Galway County Council N6 Galway City Transport Project
Phase 2 Traffic Modelling Report Appendices
GCOB-4.04-10.1 (Phase 2 TM Report)_Final Issue | Final Issue | 31 August 2015 | Arup
\\GLOBAL\EUROPE\DUBLIN\JOBS\233000\233985-00\4. INTERNAL\4-04 REPORTS\4-04-03 INFRASTRUCTURE\10. TM\10.1 PHASE 2\GCOB-4.04-10.1 (TM REPORT)_FINAL
ISSUE.DOCX
Page 32
3.2 Public Transport Network Development The public transport (PT) network was created from the highway network, which ensures that the highway and PT network structures are identical. This approach enables the PT link speeds to be updated from congested highway link speeds.
Additional links to represent rail lines were then added and railway stations were added and connected to the road network for access to and from zones.
All bus and rail services to, from, through and within the Galway Model Extent (GME) were coded using data from the National Journey Planner in April 2013.
3.3 Model Zone System The model zones have been defined by aggregating Small Areas (SAs) such that the activity levels of each zone fall within a certain range, where activity levels are measured from the 2011 POWSCAR2. The zone system is also fully compatible with the NRA National Transport model zone system.
Other criteria taken into account in determining the zone size and shapes include:
Electoral District (ED) boundaries;
Large individual attractors;
Physical barriers and connectivity to the network; and
Land use.
In some cases it was necessary to split a SA into one or more zones in order to respect the above criteria, in particular to ensure accurate loading of trips from the zones onto the road network.
The GIM comprises 298 model zones. There are:
170 simulation zones;
97 buffer zones;
21 external zones; and
10 dummy zones.
The same model zone system is used for the road, PT and demand model.
The GIM model zone system is presented in Appendix C.
3.4 Matrix Development Travel demand matrices are an essential part of the modelling system. They represent the demand for travel between every pair of model zones and therefore represent the trips that people make by car and public transport.
2 POWSCAR (Place of Work, School or College – Census Anonymised Records) is produced by the Central Statistics Office based on the 2011 Census and contains geo-coded data on the place of work or education for all workers and students in Ireland.

Galway County Council N6 Galway City Transport Project
Phase 2 Traffic Modelling Report Appendices
GCOB-4.04-10.1 (Phase 2 TM Report)_Final Issue | Final Issue | 31 August 2015 | Arup
\\GLOBAL\EUROPE\DUBLIN\JOBS\233000\233985-00\4. INTERNAL\4-04 REPORTS\4-04-03 INFRASTRUCTURE\10. TM\10.1 PHASE 2\GCOB-4.04-10.1 (TM REPORT)_FINAL
ISSUE.DOCX
Page 33
The process of building the travel demand matrices for the 2012 Base Year can be summarised as follows:
Calculate 24 hour Production Attraction (PA) trip ends by purpose at the model zone level using a version of the National Trip End Model (NTEM) that has been developed specifically for the GIM (the NTEM has been calibrated against data in the 2012 National Household Travel Survey (NHTS) and 2011 POWSCAR);
Split the trip ends by travel mode and car availability, based on data from POWSCAR and NHTS;
For home based commute and education, create PA travel demand matrices from POWSCAR and control to the trip ends calculated from the NTEM using a row and column balancing procedure;
For the other purposes, create matrices as follows:
o using a gravity model for trips within the Galway Model Extent;
o using distributions extracted from POWSCAR for trips to or from Galway with one end at an external zone; and
Apply daily time profiles, return home probabilities and occupancy rates derived from NHTS to convert from 24-hour PA person trip matrices to peak hour Origin Destination (OD) vehicle trip matrices.
The National Trip End Model (NTEM) is a component of the NTA National Demand Forecasting Model (NDFM). The NDFM is a set of models and tools that are used to derive levels of trip making nationally from planning data, for input into each of the NTA Regional Models. The NTEM component converts planning data into person trips for a typical weekday. The main inputs into NTEM include zonal demographic and economic data such as population levels, employment, students and retail floor area.
The outputs of the NTEM include two-way PA trip ends and one way OD matrices, segregated by journey purpose. For further detail of the operation of the NDFM and NTEM, please see Appendix F.
3.5 Demand Model Form For the GIM it was decided to adopt an off-the-shelf demand model system that has been tried and tested on various schemes and would therefore be a reliable system. The UK Department for Transport’s (DfT’s) demand modelling software, DIADEM, has been designed for use in the development and appraisal of major transport infrastructure schemes, and was selected as the most appropriate tool for the GIM.
The main form of demand model available in DIADEM is the incremental hierarchical logit model, as recommended in the DfT’s Transport Analysis Guidance (WebTAG), and this is the form of demand model selected as most appropriate for the GIM. The incremental model works by adjusting the demand matrices according to changes between forecast travel costs (with scheme) and reference travel costs (without scheme). For the GIM, the demand model has been set up to model the two most sensitive demand responses, namely mode
Galway County Council N6 Galway City Transport Project
Phase 2 Traffic Modelling Report Appendices
GCOB-4.04-10.1 (Phase 2 TM Report)_Final Issue | Final Issue | 31 August 2015 | Arup
\\GLOBAL\EUROPE\DUBLIN\JOBS\233000\233985-00\4. INTERNAL\4-04 REPORTS\4-04-03 INFRASTRUCTURE\10. TM\10.1 PHASE 2\GCOB-4.04-10.1 (TM REPORT)_FINAL
ISSUE.DOCX
Page 34
choice and destination choice, with destination choice being more sensitive than mode choice, as recommended in WebTAG.
3.6 Assignment Method The standard Wardrop Equilibrium using the Frank-Wolfe algorithm have been adopted as the assignment procedures for the highway model, to be consistent with the Greater Dublin Area model and other regional models.
Tight highway assignment convergence is important in order to provide a robust appraisal. A highway assignment convergence with a %GAP<0.02% was achieved in the GIM, which considerably exceeds WebTAG guidance (%GAP<0.1%).
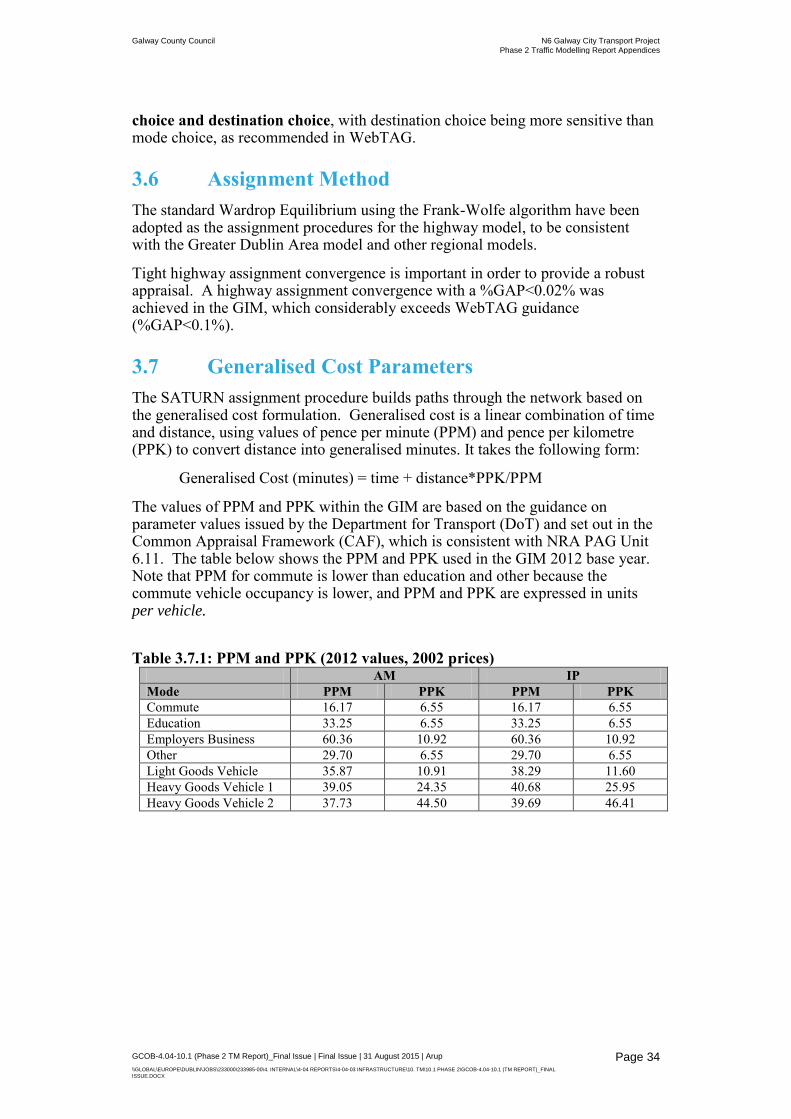
3.7 Generalised Cost Parameters The SATURN assignment procedure builds paths through the network based on the generalised cost formulation. Generalised cost is a linear combination of time and distance, using values of pence per minute (PPM) and pence per kilometre (PPK) to convert distance into generalised minutes. It takes the following form:
Generalised Cost (minutes) = time + distance*PPK/PPM
The values of PPM and PPK within the GIM are based on the guidance on parameter values issued by the Department for Transport (DoT) and set out in the Common Appraisal Framework (CAF), which is consistent with NRA PAG Unit 6.11. The table below shows the PPM and PPK used in the GIM 2012 base year. Note that PPM for commute is lower than education and other because the commute vehicle occupancy is lower, and PPM and PPK are expressed in units per vehicle.
Table 3.7.1: PPM and PPK (2012 values, 2002 prices)
AM IP Mode PPM PPK PPM PPK Commute 16.17 6.55 16.17 6.55 Education 33.25 6.55 33.25 6.55 Employers Business 60.36 10.92 60.36 10.92 Other 29.70 6.55 29.70 6.55 Light Goods Vehicle 35.87 10.91 38.29 11.60 Heavy Goods Vehicle 1 39.05 24.35 40.68 25.95 Heavy Goods Vehicle 2 37.73 44.50 39.69 46.41

Galway County Council N6 Galway City Transport Project
Phase 2 Traffic Modelling Report Appendices
GCOB-4.04-10.1 (Phase 2 TM Report)_Final Issue | Final Issue | 31 August 2015 | Arup
\\GLOBAL\EUROPE\DUBLIN\JOBS\233000\233985-00\4. INTERNAL\4-04 REPORTS\4-04-03 INFRASTRUCTURE\10. TM\10.1 PHASE 2\GCOB-4.04-10.1 (TM REPORT)_FINAL
ISSUE.DOCX
Page 35
4 Model Calibration & Validation
4.1 Overview of the Calibration and Validation Process
Calibration is the process of adjusting the model to improve the fit to observed data, such as traffic counts or passenger flows, journey times, delays and route choice. Validation is a comparison of the final model flows and journey times against observed data. Two sets of validation statistics are reported: one with the set of counts used during calibration; and the other with a set of independent counts not used during calibration.
For the GIM, calibration was undertaken in two stages:
Stage 1: sector-level adjustments to the matrices based on a comparison of the model flows against screenlines of observed counts to produce revised prior matrices;
Stage 2: adjustments to the matrices (through matrix estimation) and networks based on a comparison of the model flows against observed turn and link counts, and model journey times against observed journey times, to produce the final validated networks and matrices
4.2 Highway Assignment Model Calibration Results
4.2.1 Overview The GIM highway and public transport assignment models have been calibrated and validated to a 2012 base year. The calibration and validation process followed the guidelines in the National Roads Authority’s Project Appraisal Guidelines (PAG), and where appropriate the DfT’s WebTAG.
The models validate well against the observed data with some link and journey time statistics falling marginally short of the PAG validation criteria, e.g. achieving a GEH < 5 for 83% of links, marginally below the guidance of 85%. However for an urban model such complexity incorporating a sophisticated demand model and multi-modal components, it is a robust tool for the purposes of forecasting transport demand for scheme appraisal.
The results of the base model calibration and validation are presented in the following order:
Trip matrix calibration
Link and turn flow calibration
Journey time validation
Validation against independent counts
Impact of matrix estimation on trip length distribution

Galway County Council N6 Galway City Transport Project
Phase 2 Traffic Modelling Report Appendices
GCOB-4.04-10.1 (Phase 2 TM Report)_Final Issue | Final Issue | 31 August 2015 | Arup
\\GLOBAL\EUROPE\DUBLIN\JOBS\233000\233985-00\4. INTERNAL\4-04 REPORTS\4-04-03 INFRASTRUCTURE\10. TM\10.1 PHASE 2\GCOB-4.04-10.1 (TM REPORT)_FINAL
ISSUE.DOCX
Page 36
4.2.2 Summary of the Count Data used in Calibration & Validation
The table below provides a summary of the counts used in the various stages of calibration and validation. The number of counts in the table includes both directions, e.g. screenline 1 is made up of five 2-way counts. Refer to Figure 1 (presented earlier in this note) for the location of the counts and screenlines.
Table 4.2.1: Summary of Count Sets used in Calibration & Validation
4.2.3 Calibration/Validation Acceptability Criteria The NRA’s Project Appraisal Guidelines (PAG) Unit 5.2 provides guidance on the level of calibration and validation that should be achieved.
A standard measure used in model calibration and validation is called the GEH statistic, which is defined as:
GEH= √(𝐨𝐛𝐬𝐞𝐫𝐯𝐞𝐝 𝐟𝐥𝐨𝐰 – 𝐦𝐨𝐝𝐞𝐥𝐥𝐞𝐝 𝐟𝐥𝐨𝐰)𝟐
𝟎.𝟓.(𝐨𝐛𝐬𝐞𝐫𝐯𝐞𝐝 𝐟𝐥𝐨𝐰+𝐦𝐨𝐝𝐞𝐥𝐥𝐞𝐝 𝐟𝐥𝐨𝐰)
The GEH statistic is a measure that looks at both the difference between count and modelled flows, and at the size of each observation. Thus, where flows are high a low value of GEH can only be achieved where the percentage difference between observed and modelled flows are small. However, where flows are very low even quite sizeable percentage discrepancies are considered acceptable.
4.3 Trip Matrix Calibration PAG (Unit 5.2 Table 5.2.2 and 5.2.3) says that total screenline flows should be within 5% or GEH<4 in more than 85% of cases. .
The counts used for trip matrix calibration are the ATCs that form screenlines 1 and 3.
Table 4.3.1 and 4.3.2 show the percentage difference between model flows and observed counts for each of the screenlines used in matrix estimation. In both the morning peak and inter-peak 100% of screenlines satisfy the calibration criteria.
1 2 3 4 5
Number of Counts Available - *556* 55 10 12 8 14 16 -
Calibration Stage 1 - Sector Level Adjustments 60 Screenlines
Calibration Stage 2 - Matrix Estimation *629* Individual Counts
Trip Matrix Calibration 18 Screenlines
Link Flow Calibration 73 Individual Counts
Turn Flow Calibration *556* Individual Counts
Validation Against Independent Counts 42 Individual Counts
* Includes link counts derived from turn counts
** Excludes ATCs that form part of a screenline
Used as individual
counts or screenlinesCalibration/Validation Stage
No. of
counts used
Screenlines (ATCs)MTCs ATCs**

Galway County Council N6 Galway City Transport Project
Phase 2 Traffic Modelling Report Appendices
GCOB-4.04-10.1 (Phase 2 TM Report)_Final Issue | Final Issue | 31 August 2015 | Arup
\\GLOBAL\EUROPE\DUBLIN\JOBS\233000\233985-00\4. INTERNAL\4-04 REPORTS\4-04-03 INFRASTRUCTURE\10. TM\10.1 PHASE 2\GCOB-4.04-10.1 (TM REPORT)_FINAL
ISSUE.DOCX
Page 37
Table 4.3.1: Trip Matrix Calibration for Screenlines used in Matrix Estimation – Morning Peak Hour
Screenline Total Flows (pcus)
Obs Mod Diff GEH
1 IN 2,109 1,997 -5% 2.5
1 OUT 739 716 -3% 0.8
3 EB 3,730 3,744 0% 0.2
3 WB 3,144 3,031 -4% 2.0
Total Flow within 5% 100%
Total GEH < 4 100%
Table 4.3.2: Trip Matrix Calibration for Screenlines used in Matrix Estimation – Inter-peak Average Hour
Screenline Total Flows (pcus)
Obs Mod Diff GEH
1 IN 905 896 -1% 0.3
1 OUT 862 851 -1% 0.4
3 EB 2,781 2,779 0% 0.0
3 WB 2,600 2,483 -5% 2.3
Total Flow within 5% 100%
Total GEH < 4 100%
4.4 Link and Turn Flow Calibration PAG (Unit 5.2 Table 5.2.2 and 5.2.3) says that at least one of the following two criteria should be met in 85% of cases:
Criteria 1: links should have a GEH value of less than 5;
Criteria 2:
o where modelled flows are less than 700, the model flow should be within 100 vehicles of the count;
o where modelled flows are between 700 and 2700 the modelled flows should be within 15% of observed flows; and
o where modelled flows are greater than 2700 the modelled flows should be within 400 vehicles of the observed flows.
Table 4.4.1 presents the link count validation for counts used in matrix estimation. The results indicate that the model is calibrated as per the requirements of PAG for link flows. The tables in Appendix D present the calibration results for each link.
Galway County Council N6 Galway City Transport Project
Phase 2 Traffic Modelling Report Appendices
GCOB-4.04-10.1 (Phase 2 TM Report)_Final Issue | Final Issue | 31 August 2015 | Arup
\\GLOBAL\EUROPE\DUBLIN\JOBS\233000\233985-00\4. INTERNAL\4-04 REPORTS\4-04-03 INFRASTRUCTURE\10. TM\10.1 PHASE 2\GCOB-4.04-10.1 (TM REPORT)_FINAL
ISSUE.DOCX
Page 38
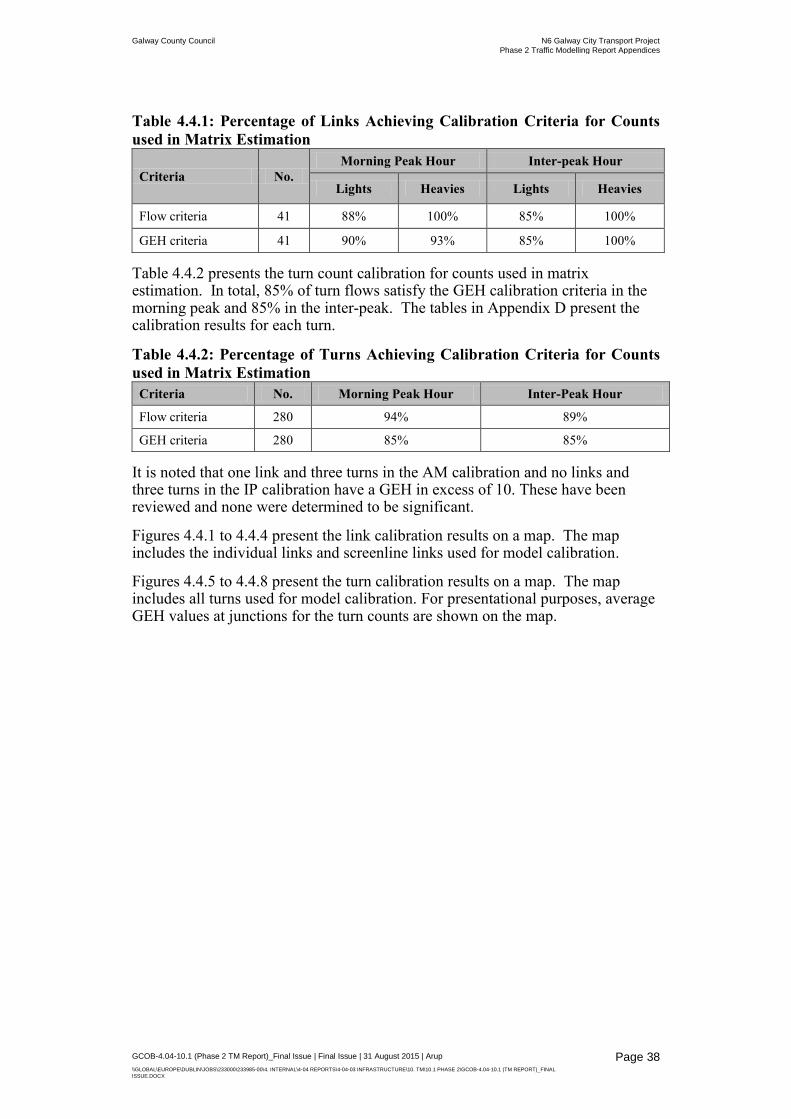
Table 4.4.1: Percentage of Links Achieving Calibration Criteria for Counts used in Matrix Estimation
Criteria No. Morning Peak Hour Inter-peak Hour
Lights Heavies Lights Heavies
Flow criteria 41 88% 100% 85% 100%
GEH criteria 41 90% 93% 85% 100%
Table 4.4.2 presents the turn count calibration for counts used in matrix estimation. In total, 85% of turn flows satisfy the GEH calibration criteria in the morning peak and 85% in the inter-peak. The tables in Appendix D present the calibration results for each turn.
Table 4.4.2: Percentage of Turns Achieving Calibration Criteria for Counts used in Matrix Estimation
Criteria No. Morning Peak Hour Inter-Peak Hour
Flow criteria 280 94% 89%
GEH criteria 280 85% 85%
It is noted that one link and three turns in the AM calibration and no links and three turns in the IP calibration have a GEH in excess of 10. These have been reviewed and none were determined to be significant.
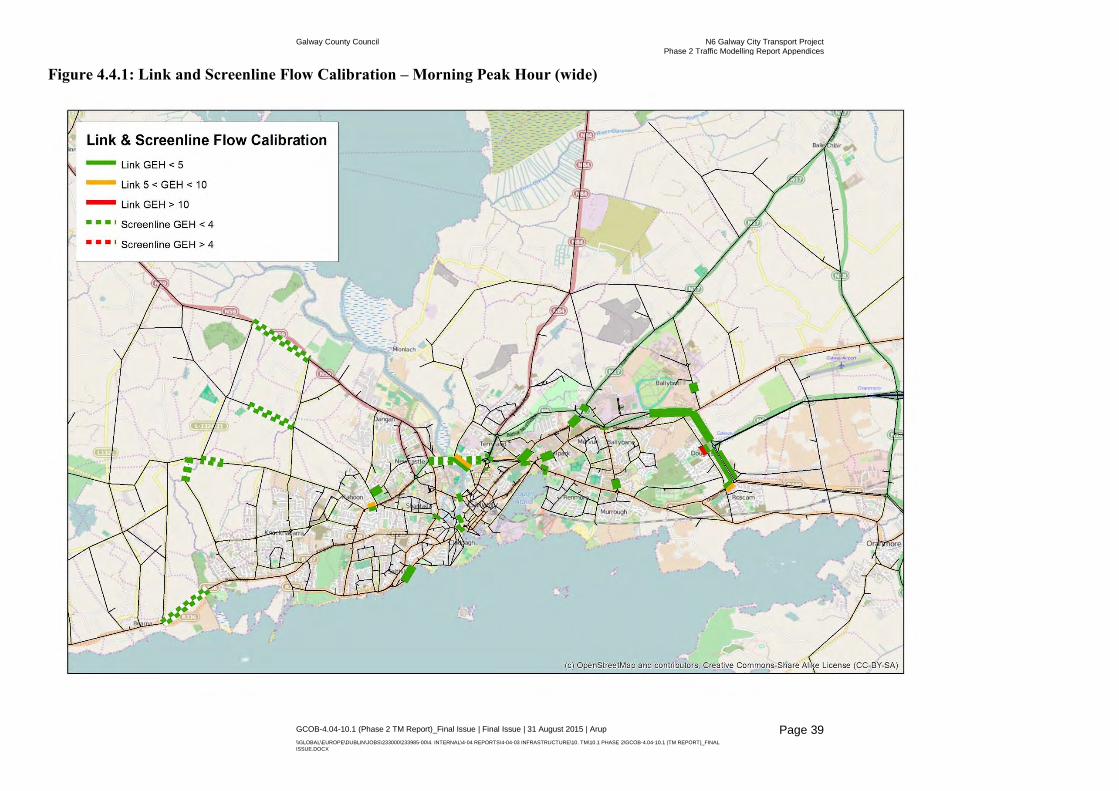
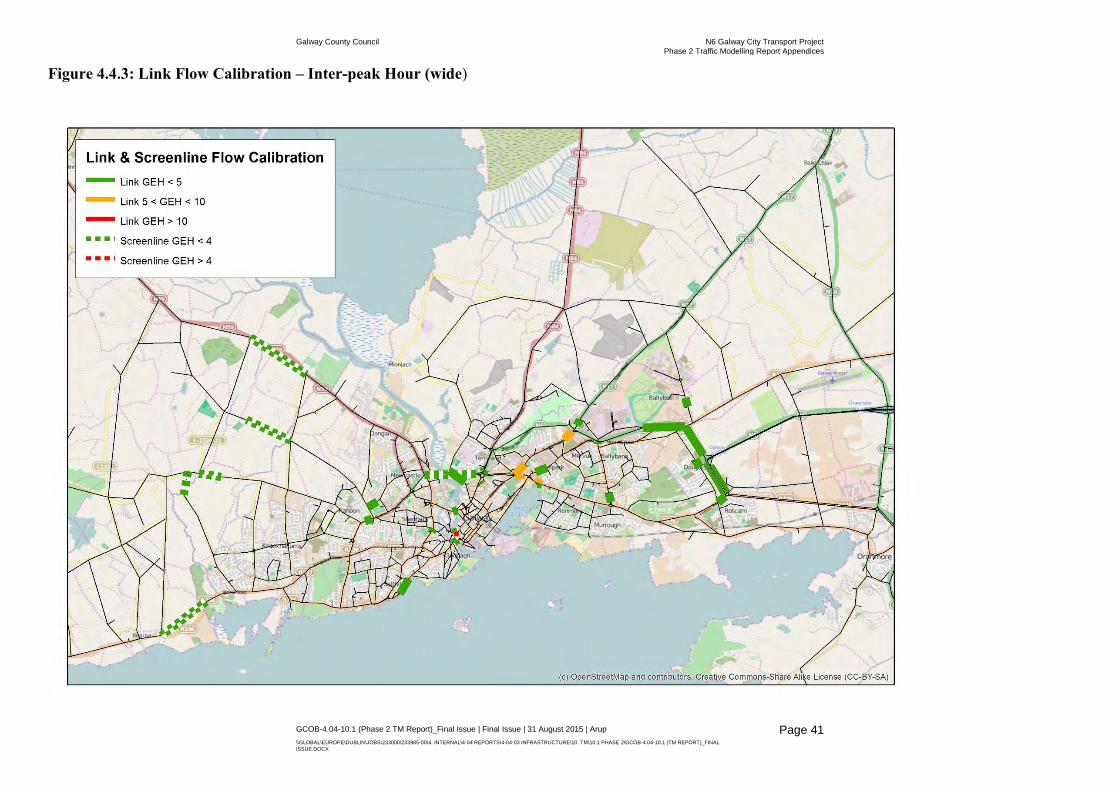
Figures 4.4.1 to 4.4.4 present the link calibration results on a map. The map includes the individual links and screenline links used for model calibration.
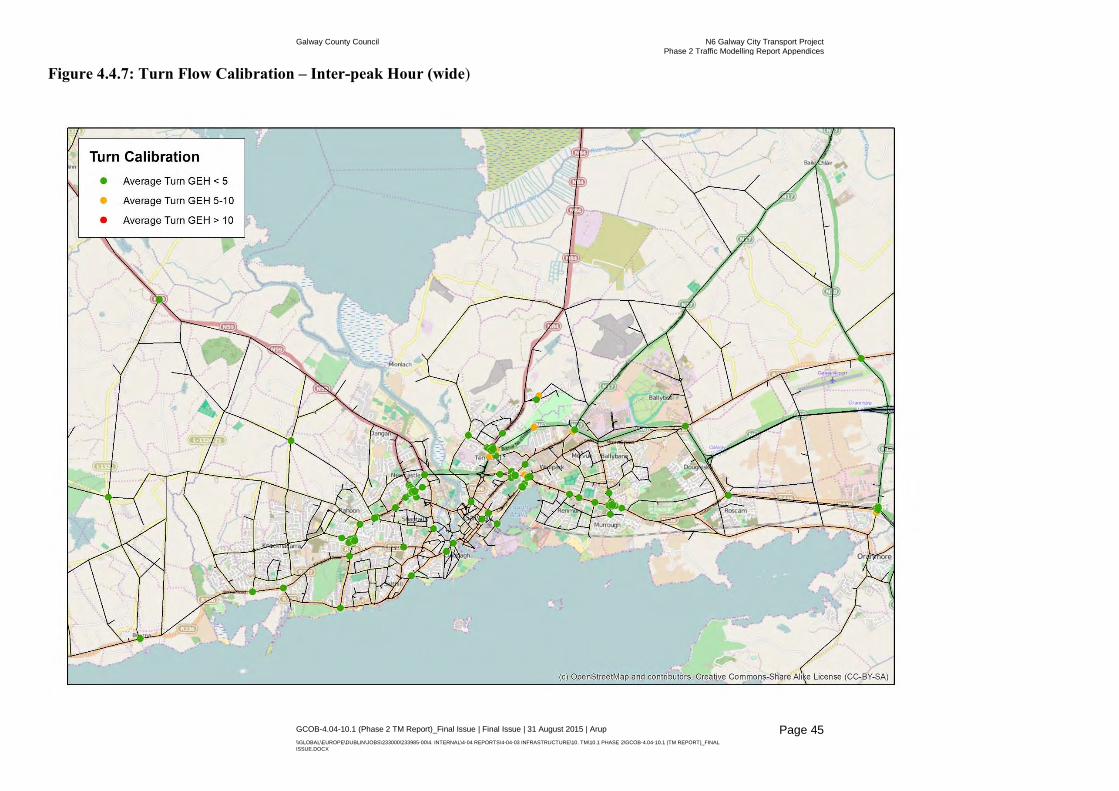
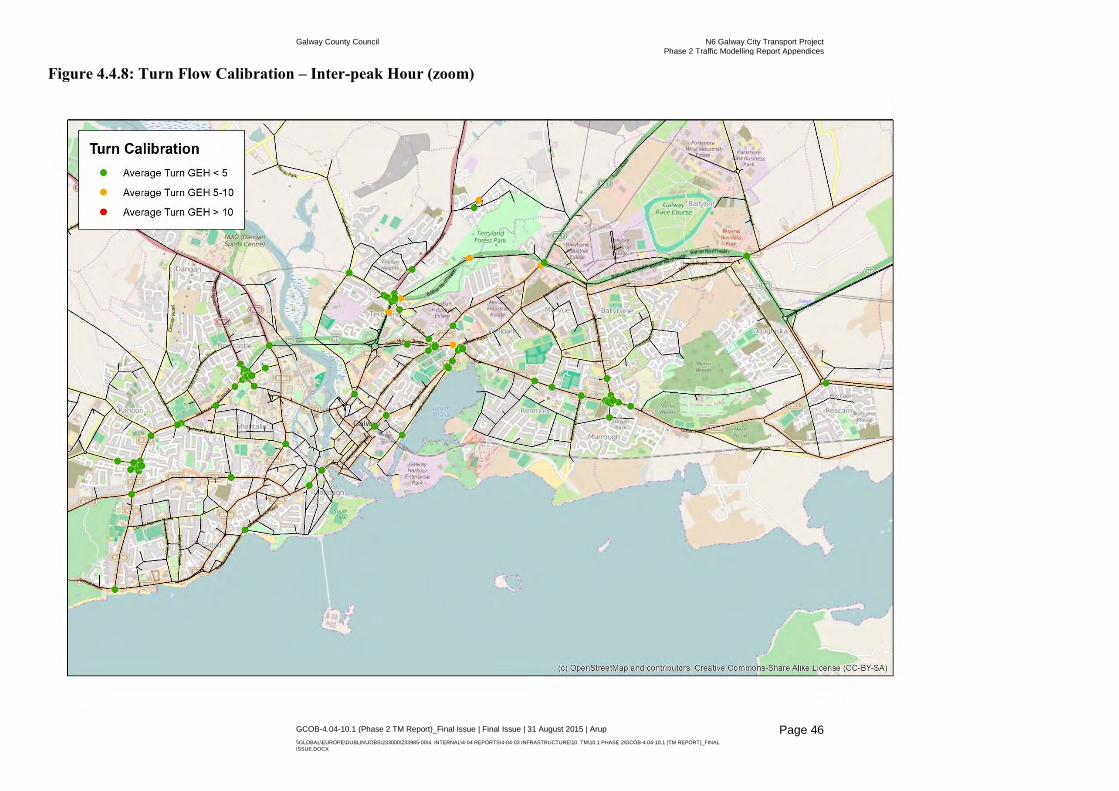
Figures 4.4.5 to 4.4.8 present the turn calibration results on a map. The map includes all turns used for model calibration. For presentational purposes, average GEH values at junctions for the turn counts are shown on the map.
Galway County Council N6 Galway City Transport Project
Phase 2 Traffic Modelling Report Appendices
GCOB-4.04-10.1 (Phase 2 TM Report)_Final Issue | Final Issue | 31 August 2015 | Arup
\\GLOBAL\EUROPE\DUBLIN\JOBS\233000\233985-00\4. INTERNAL\4-04 REPORTS\4-04-03 INFRASTRUCTURE\10. TM\10.1 PHASE 2\GCOB-4.04-10.1 (TM REPORT)_FINAL
ISSUE.DOCX
Page 39
Figure 4.4.1: Link and Screenline Flow Calibration – Morning Peak Hour (wide)

Galway County Council N6 Galway City Transport Project
Phase 2 Traffic Modelling Report Appendices
GCOB-4.04-10.1 (Phase 2 TM Report)_Final Issue | Final Issue | 31 August 2015 | Arup
\\GLOBAL\EUROPE\DUBLIN\JOBS\233000\233985-00\4. INTERNAL\4-04 REPORTS\4-04-03 INFRASTRUCTURE\10. TM\10.1 PHASE 2\GCOB-4.04-10.1 (TM REPORT)_FINAL
ISSUE.DOCX
Page 40
Figure 4.4.2: Link Flow Calibration – Morning Peak Hour (zoom)
Galway County Council N6 Galway City Transport Project
Phase 2 Traffic Modelling Report Appendices
GCOB-4.04-10.1 (Phase 2 TM Report)_Final Issue | Final Issue | 31 August 2015 | Arup
\\GLOBAL\EUROPE\DUBLIN\JOBS\233000\233985-00\4. INTERNAL\4-04 REPORTS\4-04-03 INFRASTRUCTURE\10. TM\10.1 PHASE 2\GCOB-4.04-10.1 (TM REPORT)_FINAL
ISSUE.DOCX
Page 41
Figure 4.4.3: Link Flow Calibration – Inter-peak Hour (wide)

Galway County Council N6 Galway City Transport Project
Phase 2 Traffic Modelling Report Appendices
GCOB-4.04-10.1 (Phase 2 TM Report)_Final Issue | Final Issue | 31 August 2015 | Arup
\\GLOBAL\EUROPE\DUBLIN\JOBS\233000\233985-00\4. INTERNAL\4-04 REPORTS\4-04-03 INFRASTRUCTURE\10. TM\10.1 PHASE 2\GCOB-4.04-10.1 (TM REPORT)_FINAL
ISSUE.DOCX
Page 42
Figure 4.4.4: Link Flow Calibration – Inter-peak Hour (zoom)

Galway County Council N6 Galway City Transport Project
Phase 2 Traffic Modelling Report Appendices
GCOB-4.04-10.1 (Phase 2 TM Report)_Final Issue | Final Issue | 31 August 2015 | Arup
\\GLOBAL\EUROPE\DUBLIN\JOBS\233000\233985-00\4. INTERNAL\4-04 REPORTS\4-04-03 INFRASTRUCTURE\10. TM\10.1 PHASE 2\GCOB-4.04-10.1 (TM REPORT)_FINAL
ISSUE.DOCX
Page 43
Figure 4.4.5: Turn Flow Calibration – Morning Peak Hour (wide)

Galway County Council N6 Galway City Transport Project
Phase 2 Traffic Modelling Report Appendices
GCOB-4.04-10.1 (Phase 2 TM Report)_Final Issue | Final Issue | 31 August 2015 | Arup
\\GLOBAL\EUROPE\DUBLIN\JOBS\233000\233985-00\4. INTERNAL\4-04 REPORTS\4-04-03 INFRASTRUCTURE\10. TM\10.1 PHASE 2\GCOB-4.04-10.1 (TM REPORT)_FINAL
ISSUE.DOCX
Page 44
Figure 4.4.6: Turn Flow Calibration – Morning Peak Hour (zoom)
Galway County Council N6 Galway City Transport Project
Phase 2 Traffic Modelling Report Appendices
GCOB-4.04-10.1 (Phase 2 TM Report)_Final Issue | Final Issue | 31 August 2015 | Arup
\\GLOBAL\EUROPE\DUBLIN\JOBS\233000\233985-00\4. INTERNAL\4-04 REPORTS\4-04-03 INFRASTRUCTURE\10. TM\10.1 PHASE 2\GCOB-4.04-10.1 (TM REPORT)_FINAL
ISSUE.DOCX
Page 45
Figure 4.4.7: Turn Flow Calibration – Inter-peak Hour (wide)
Galway County Council N6 Galway City Transport Project
Phase 2 Traffic Modelling Report Appendices
GCOB-4.04-10.1 (Phase 2 TM Report)_Final Issue | Final Issue | 31 August 2015 | Arup
\\GLOBAL\EUROPE\DUBLIN\JOBS\233000\233985-00\4. INTERNAL\4-04 REPORTS\4-04-03 INFRASTRUCTURE\10. TM\10.1 PHASE 2\GCOB-4.04-10.1 (TM REPORT)_FINAL
ISSUE.DOCX
Page 46
Figure 4.4.8: Turn Flow Calibration – Inter-peak Hour (zoom)

Galway County Council N6 Galway City Transport Project
Phase 2 Traffic Modelling Report Appendices
GCOB-4.04-10.1 (Phase 2 TM Report)_Final Issue | Final Issue | 31 August 2015 | Arup
\\GLOBAL\EUROPE\DUBLIN\JOBS\233000\233985-00\4. INTERNAL\4-04 REPORTS\4-04-03 INFRASTRUCTURE\10. TM\10.1 PHASE 2\GCOB-4.04-10.1 (TM REPORT)_FINAL
ISSUE.DOCX
Page 47
4.5 Journey Time Validation PAG (Unit 5.2 Table 5.2.2 and 5.2.3) says that modelled times along routes should be within 15% of surveyed times (or 1 minute if higher) for more than 85% of routes.
The journey time routes are shown in Figure 4.5.1. Table 4.5.1 shows the journey time validation for each route as a whole. In the morning peak 91% of routes satisfy the validation criteria, with 86% in the inter-peak. Of the remaining routes, all are within 27% of the observed time, which demonstrates that there are no serious issues with the model.
The overall journey time in the morning peak is within acceptable thresholds being 5% lower than the observed time, and 1% higher in the inter-peak, which demonstrates that the model is not systematically biased towards being too fast or slow. The slighter lower journey times in the more congested morning peak are logical, as it can be difficult to replicate large observed delays in SATURN due to the assignment procedure’s tendency to re-route traffic away from junctions with large delays.
Figure 4.5.1 shows the journey time routes used in the assessment. Data sample size for certain journey time routes from the TomTom database was insufficient to provide full confidence in the observed results. Therefore, journey time comparisons were not undertaken on these routes. An additional check was carried out to validate the model distance against the TomTom distance for each route. The model distance was found to be within a few percent of the TomTom distance on all routes, which gives us confidence in the model network and also demonstrates consistency between the model and observed data.
Figure 4.5.1: Journey Time Routes

Galway County Council N6 Galway City Transport Project
Phase 2 Traffic Modelling Report Appendices
GCOB-4.04-10.1 (Phase 2 TM Report)_Final Issue | Final Issue | 31 August 2015 | Arup
\\GLOBAL\EUROPE\DUBLIN\JOBS\233000\233985-00\4. INTERNAL\4-04 REPORTS\4-04-03 INFRASTRUCTURE\10. TM\10.1 PHASE 2\GCOB-4.04-10.1 (TM REPORT)_FINAL
ISSUE.DOCX
Page 48
Table 4.5.1: Journey Time Validation (times are shown in seconds)
Route Morning Peak Hour Inter-peak Hour
Observed Modelled %Diff Observed Modelled %Diff 1 IN 1,058 1,118 6% 630 682 8% 2 IN 1,626 1,393 -14% 1,188 1,049 -12% 3 IN 555 575 4% 236 291 23% 4A IN 787 737 -6% 621 623 0% 4B IN 859 787 -8% 602 626 4% 5 IN 1,106 998 -10% 940 910 -3% 6 IN 995 934 -6% 789 884 12% 7 IN 1,507 1,345 -11% 1,189 1,056 -11% 8 IN 1,118 1,276 14% 794 842 6% 10 IN 595 445 -25% 379 412 9% 11 IN 1,332 976 -27% 782 853 9% 1 OUT 721 653 -9% 677 651 -4% 3 OUT 230 264 15% 229 265 16% 4A OUT 820 701 -14% 671 705 5% 4B OUT 597 670 12% 600 663 11% 5 OUT 1,106 1,006 -9% 975 995 2% 7 OUT 1,036 1,141 10% 1,110 1,114 0% 8 OUT 574 621 8% 676 681 1% 9 OUT 310 287 -8% 328 287 -13% 10 OUT 658 680 3% 370 433 17% 11 OUT 815 831 2% 789 864 10% All routes 18,405 17,438 -5% 16,986 17,120 1% Within 15% 91% 86%
A discussion of the routes that fall outside the 15% acceptability criteria is provided below, which should be borne in mind during forecasting and appraisal.
Morning Peak
For 10IN the delays at the Briarhill junction from the R339 inbound are lower in the model compared to the observed data.
For 11IN delays on R338 Dublin Road inbound are lower in the model compared to the observed data.
Inter-peak
For 3IN and 3OUT the cruise speed on the Western Distributor Road is on the low side, and the delay at Deane roundabout is also slightly lower than observed.
For 10OUT the delays at the Briarhill junction are lower in the model compared to the observed data.
4.6 Validation against Independent Counts A set of counts were excluded from the counts used in matrix estimation so they could be used to carry out an independent check on the model to see how well the model flows match the observed counts. The counts reserved for independent validation are the ATCs that form screenlines 2, 4 and 5.

Galway County Council N6 Galway City Transport Project
Phase 2 Traffic Modelling Report Appendices
GCOB-4.04-10.1 (Phase 2 TM Report)_Final Issue | Final Issue | 31 August 2015 | Arup
\\GLOBAL\EUROPE\DUBLIN\JOBS\233000\233985-00\4. INTERNAL\4-04 REPORTS\4-04-03 INFRASTRUCTURE\10. TM\10.1 PHASE 2\GCOB-4.04-10.1 (TM REPORT)_FINAL
ISSUE.DOCX
Page 49
Table 4.6.1 and 4.6.2 show the link count validation for the independent counts excluded from matrix estimation for the AM and Inter Peak Hours respectively. In total, 83% (5/6) of links satisfy both the validation criteria in the morning peak, with 100% in the inter-peak, thus satisfying the requirements of PAG.
Table 4.6.1: Trip Matrix Calibration for Screenlines used in Matrix Estimation – AM Peak Hour
Screenline Total Flows (pcus)
Obs Mod Diff GEH
2 IN 5,933 5,644 -5% 4
2 OUT 2,105 2,176 3% 2
4 IN 3,948 3,895 -1% 1
4 OUT 3,786 4,119 9% 5
5 IN 4,136 4,415 7% 4
5 OUT 1,649 1,612 -2% 1
Total Flow within 5% 83%
Total GEH < 4 83%
Table 4.6.2: Trip Matrix Calibration for Screenlines used in Matrix Estimation – Inter Peak Average Hour
Screenline Total Flows (pcus)
Obs Mod Diff GEH
2 IN 2,553 2,645 4% 2
2 OUT 2,714 2,620 -3% 2
4 IN 3,691 3,679 0% 0
4 OUT 3,501 3,672 5% 3
5 IN 2,229 2,289 3% 1
5 OUT 2,143 2,189 2% 1
Total Flow within 5% 100%
Total GEH < 4 100%
4.7 Impact of Matrix Estimation on Trip Length Distribution
It is important to monitor the changes that matrix estimation makes, in particular PAG recommends monitoring the changes to trip length distribution.
The graphs below present the change in trip length distribution for car trips in the morning peak and inter-peak models as a result of matrix estimation. The trip length distribution after matrix estimation matches the trip length distribution before matrix estimation quite well across the range of trip distances, however there is an increase in the shorter distance trips in the 0-6km bands, mainly in the morning peak hour, which results in a reduction in average trip length of 11% in the AM and 4% in the IP. This is not considered significant and is a reasonable impact of the estimation process.
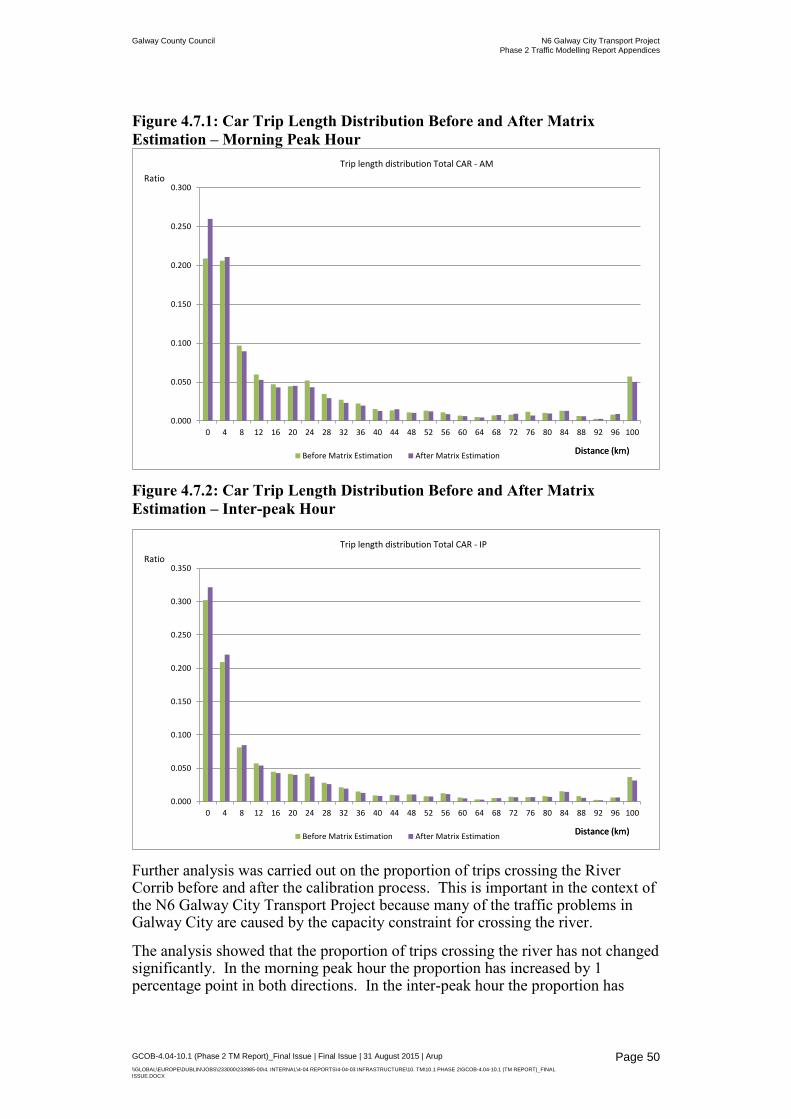
Galway County Council N6 Galway City Transport Project
Phase 2 Traffic Modelling Report Appendices
GCOB-4.04-10.1 (Phase 2 TM Report)_Final Issue | Final Issue | 31 August 2015 | Arup
\\GLOBAL\EUROPE\DUBLIN\JOBS\233000\233985-00\4. INTERNAL\4-04 REPORTS\4-04-03 INFRASTRUCTURE\10. TM\10.1 PHASE 2\GCOB-4.04-10.1 (TM REPORT)_FINAL
ISSUE.DOCX
Page 50
Figure 4.7.1: Car Trip Length Distribution Before and After Matrix Estimation – Morning Peak Hour
Figure 4.7.2: Car Trip Length Distribution Before and After Matrix Estimation – Inter-peak Hour
Further analysis was carried out on the proportion of trips crossing the River Corrib before and after the calibration process. This is important in the context of the N6 Galway City Transport Project because many of the traffic problems in Galway City are caused by the capacity constraint for crossing the river.
The analysis showed that the proportion of trips crossing the river has not changed significantly. In the morning peak hour the proportion has increased by 1 percentage point in both directions. In the inter-peak hour the proportion has
0.000
0.050
0.100
0.150
0.200
0.250
0.300
0 4 8 12 16 20 24 28 32 36 40 44 48 52 56 60 64 68 72 76 80 84 88 92 96 100
Before Matrix Estimation After Matrix EstimationDistance (km)
Trip length distribution Total CAR - AM
Distance (km)
Ratio
0.000
0.050
0.100
0.150
0.200
0.250
0.300
0.350
0 4 8 12 16 20 24 28 32 36 40 44 48 52 56 60 64 68 72 76 80 84 88 92 96 100
Before Matrix Estimation After Matrix EstimationDistance (km)
Trip length distribution Total CAR - IP
Distance (km)
Ratio

Galway County Council N6 Galway City Transport Project
Phase 2 Traffic Modelling Report Appendices
GCOB-4.04-10.1 (Phase 2 TM Report)_Final Issue | Final Issue | 31 August 2015 | Arup
\\GLOBAL\EUROPE\DUBLIN\JOBS\233000\233985-00\4. INTERNAL\4-04 REPORTS\4-04-03 INFRASTRUCTURE\10. TM\10.1 PHASE 2\GCOB-4.04-10.1 (TM REPORT)_FINAL
ISSUE.DOCX
Page 51
increased by 1 percentage point west to east and by 3 percentage points east to west.
4.8 Demand Model Calibration Results It is necessary to calibrate the demand model parameters such that the change in travel demand in response to changes in travel costs is sensible.
Two realism tests are required to test the sensitivity of the demand model: one measures the change to vehicle kilometres in response to a 10% fuel price increase, and one measures the change to PT trips in response to a 10% PT fares increase.
The measure used to check the sensitivity of the model is called ‘elasticity’, where a bigger elasticity value corresponds to a more sensitive model.
The realism tests have shown that the sensitivity of the demand model in response to changes in fuel price and PT fares is sensible and within the ranges recommended in WebTAG. This has been achieved with a set of demand model parameters that are also within the ranges recommended in WebTAG.
The elasticity of car vehicle kilometres to a 10% fuel price increase is -0.20, within the target range of -0.19 to -0.43. The fuel price elasticity is at the low end of the target range; however this could be expected in an area like Galway where there are currently limited alternatives to the car. Appropriate elasticity values disaggregated by purpose have been achieved.
The elasticity of public transport trips to a 10% fare price increase is -0.45, within the target range of -0.2 to -0.9.

Galway County Council N6 Galway City Transport Project
Phase 2 Traffic Modelling Report Appendices
GCOB-4.04-10.1 (Phase 2 TM Report)_Final Issue | Final Issue | 31 August 2015 | Arup
\\GLOBAL\EUROPE\DUBLIN\JOBS\233000\233985-00\4. INTERNAL\4-04 REPORTS\4-04-03 INFRASTRUCTURE\10. TM\10.1 PHASE 2\GCOB-4.04-10.1 (TM REPORT)_FINAL
ISSUE.DOCX
Page 52
5 Future Year Model Development
5.1 Introduction This section sets out the development of the future year GIM for the scheme opening year (2019) and design year (2034). These forecast years will be used for assessing and comparing the performance of the various options. Once a preferred option is selected, a forecast year (2049) will also be prepared.
5.2 Future Year Network Development The future year ‘Do-Minimum’ network includes the 2012 base network plus all the schemes (highway and PT) that are already built or are committed or likely to be built by 2019 and 2034. The list of schemes to be included was developed in coordination with Galway City Council, Galway County Council, NRA and NTA. A full list of the schemes can be found in Appendix E along with a map showing their location.
The future year ‘Do-Something’ networks include the Do-Minimum plus the option(s) to be tested. Each Do-Something network has been ‘optioneered’ in the highway model based on analysis of modelled flows and delays in the 2034 Design Year. The optioneering focussed on the junctions along the Do-Something scheme itself rather than any existing or Do-Minimum junctions, with the exception of the N84/N6 Kirwan Junction and the N6/R338 Junction (i.e. Galway Shopping Centre junction) where signal timings only were adjusted to reflect the change in traffic priority at these junctions due to the Do-Something schemes.
In addition to the validated 2012 base year network, the future year networks developed are:
2019 Opening Year Do-Minimum
2019 Opening Year Do-Something(s):
o Orange Route Option
o Green Route Option
o Yellow Route Option
o Blue Route Option
o Pink Route Option
o Red Route Option
o PT Alternative
2034 Design Year Do-Minimum
2034 Design Year Do-Something(s):
o Orange Route Option
o Green Route Option
Galway County Council N6 Galway City Transport Project
Phase 2 Traffic Modelling Report Appendices
GCOB-4.04-10.1 (Phase 2 TM Report)_Final Issue | Final Issue | 31 August 2015 | Arup
\\GLOBAL\EUROPE\DUBLIN\JOBS\233000\233985-00\4. INTERNAL\4-04 REPORTS\4-04-03 INFRASTRUCTURE\10. TM\10.1 PHASE 2\GCOB-4.04-10.1 (TM REPORT)_FINAL
ISSUE.DOCX
Page 53
o Yellow Route Option
o Blue Route Option
o Pink Route Option
o Red Route Option
o PT Alternative
Further details of each scheme option are discussed in Section 1.5 of this report.
5.3 Future Year Matrix Development
5.3.1 Population and Employment Forecasts The NRA PAG outlines an approach to forecasting traffic based on national growth rates derived from the National Transport Model. During the inception of the N6 GCTP, it was agreed that a more detailed approach to forecasting travel demand would be required, in order to capture the planned growth in population and employment at a local level in Galway. This approach would require input from key stakeholders of the NTA, Galway County Council and Galway City Council. Future year population forecasts were developed by demographers Future Analytics in conjunction with above stakeholders. The forecasts were from a base population through the projection of population change and its major demographic components: births, deaths and migration.
The following forecast scenarios were agreed for use on this project:
Low: M2F2 Traditional (Scenario 1). The traditional scenario follows the Central Statistics Office (CSO) moderate path of seeing a return towards the 1996 patterns of inter-regional migration (specifically). The population in the West increases at a moderate pace of natural growth in line with the measured outflow of migrants (net) elsewhere.
Medium: M2F1 (Scenario 1a). This scenario includes an adjustment on the fertility rate to assume that it reaches 2.1% by 2026.
High: M2F1 (Scenario 3a) Galway Centric. This scenario redirects a quantum of migrants to the West Region, specifically to Galway County and Galway City. It sees 25% of the inter-regional migrants that would otherwise move to Dublin redirected west. It also allows for the fertility rate of 2.1% by 2026.
The NTA then applied a top-down approach to distribute the population forecasts across the GIM model zones. The methodology used to distribute growth within the study area is outlined in the NTA note on the GIM forecasting process included in Appendix I.
An assumption was made that the overall growth in employment would be in line with the population growth. This methodology is consistent with the approach adopted in the demographic forecasts for the NRA National Transport Model
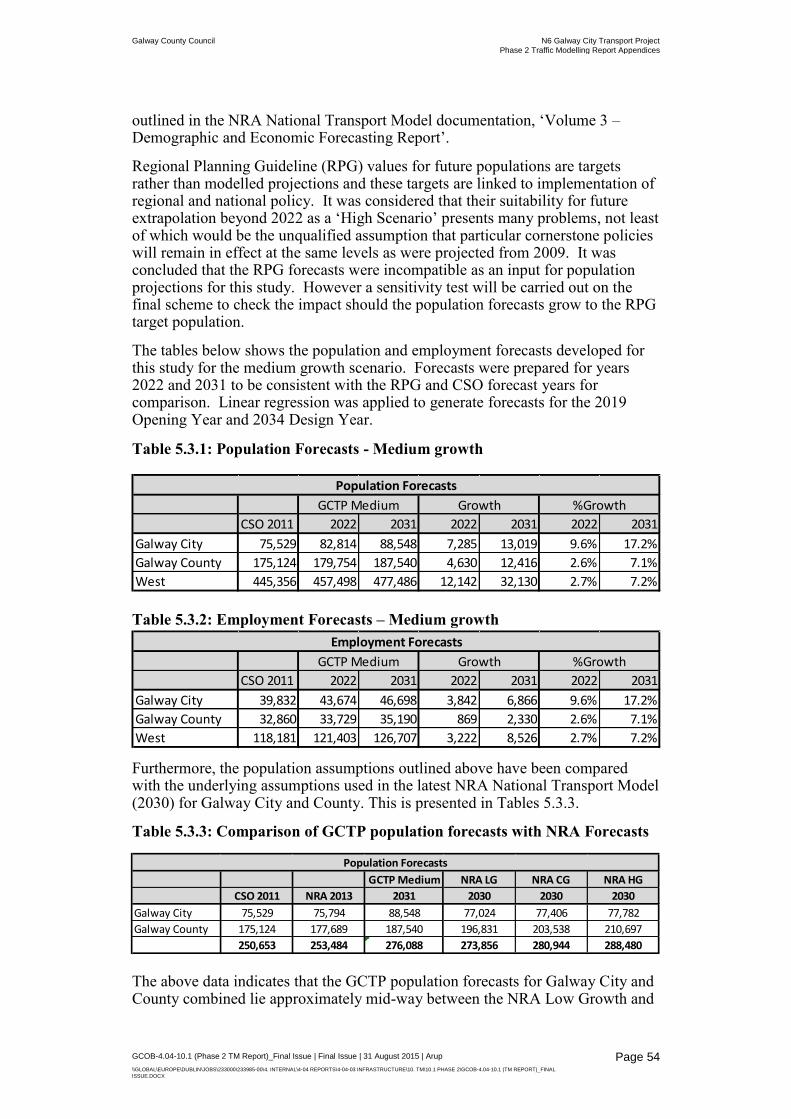
Galway County Council N6 Galway City Transport Project
Phase 2 Traffic Modelling Report Appendices
GCOB-4.04-10.1 (Phase 2 TM Report)_Final Issue | Final Issue | 31 August 2015 | Arup
\\GLOBAL\EUROPE\DUBLIN\JOBS\233000\233985-00\4. INTERNAL\4-04 REPORTS\4-04-03 INFRASTRUCTURE\10. TM\10.1 PHASE 2\GCOB-4.04-10.1 (TM REPORT)_FINAL
ISSUE.DOCX
Page 54
outlined in the NRA National Transport Model documentation, ‘Volume 3 – Demographic and Economic Forecasting Report’.
Regional Planning Guideline (RPG) values for future populations are targets rather than modelled projections and these targets are linked to implementation of regional and national policy. It was considered that their suitability for future extrapolation beyond 2022 as a ‘High Scenario’ presents many problems, not least of which would be the unqualified assumption that particular cornerstone policies will remain in effect at the same levels as were projected from 2009. It was concluded that the RPG forecasts were incompatible as an input for population projections for this study. However a sensitivity test will be carried out on the final scheme to check the impact should the population forecasts grow to the RPG target population.
The tables below shows the population and employment forecasts developed for this study for the medium growth scenario. Forecasts were prepared for years 2022 and 2031 to be consistent with the RPG and CSO forecast years for comparison. Linear regression was applied to generate forecasts for the 2019 Opening Year and 2034 Design Year.
Table 5.3.1: Population Forecasts - Medium growth
Table 5.3.2: Employment Forecasts – Medium growth
Furthermore, the population assumptions outlined above have been compared with the underlying assumptions used in the latest NRA National Transport Model (2030) for Galway City and County. This is presented in Tables 5.3.3.
Table 5.3.3: Comparison of GCTP population forecasts with NRA Forecasts
The above data indicates that the GCTP population forecasts for Galway City and County combined lie approximately mid-way between the NRA Low Growth and
CSO 2011 2022 2031 2022 2031 2022 2031
Galway City 39,832 43,674 46,698 3,842 6,866 9.6% 17.2%
Galway County 32,860 33,729 35,190 869 2,330 2.6% 7.1%
West 118,181 121,403 126,707 3,222 8,526 2.7% 7.2%
Employment Forecasts
GCTP Medium Growth %Growth
GCTP Medium NRA LG NRA CG NRA HG
CSO 2011 NRA 2013 2031 2030 2030 2030
Galway City 75,529 75,794 88,548 77,024 77,406 77,782
Galway County 175,124 177,689 187,540 196,831 203,538 210,697
250,653 253,484 276,088 273,856 280,944 288,480
Population Forecasts
CSO 2011 2022 2031 2022 2031 2022 2031
Galway City 75,529 82,814 88,548 7,285 13,019 9.6% 17.2%
Galway County 175,124 179,754 187,540 4,630 12,416 2.6% 7.1%
West 445,356 457,498 477,486 12,142 32,130 2.7% 7.2%
Population Forecasts
GCTP Medium Growth %Growth

Galway County Council N6 Galway City Transport Project
Phase 2 Traffic Modelling Report Appendices
GCOB-4.04-10.1 (Phase 2 TM Report)_Final Issue | Final Issue | 31 August 2015 | Arup
\\GLOBAL\EUROPE\DUBLIN\JOBS\233000\233985-00\4. INTERNAL\4-04 REPORTS\4-04-03 INFRASTRUCTURE\10. TM\10.1 PHASE 2\GCOB-4.04-10.1 (TM REPORT)_FINAL
ISSUE.DOCX
Page 55
Central Growth scenarios. The GCTP approach forecasts the majority of population growth in the region to occur in the Galway City area.
5.3.2 Overview of Method to Develop Future Year Matrices The process to develop future year matrices based on the population and employment forecasts can be summarised as follows:
Generate future year trip ends using the version of the National Trip End Model (NTEM) developed specifically for GIM;
Calculate the growth rates between base and future year NTEM trip ends;
Apply the growth rates to the validated base year trip ends to generate target future year trip ends (taking account of changes to car occupancies)
Factor the base year trip matrices using a row and column balancing procedure, to produce future year ‘unconstrained’ trip matrices
Run the DIADEM demand model in order to constrain the trip matrices to future year costs (such as changes in values of time, vehicle operating costs and congestion levels)
5.4 Growth Scenario The medium growth scenario was developed for this phase of the project in order to compare the different options against each other on an equal basis. Once a preferred option is selected, low and high growth scenarios will also be prepared and the preferred option will be tested in both additional scenarios.
5.5 Greenfield Sites Due to the incremental nature of the GIM system, careful treatment was required to include new developments that are located on Greenfield sites, i.e. where there is little or no population or jobs in the base year. Such developments included Ardaun and the Rahoon Business Park.
For these developments, the initial trip generation rates, mode share and trip distributions were cloned from nearby zones with similar land use to the new developments.
5.6 Vehicle Occupancy Vehicle occupancies were reduced in line with the forecast reduction in vehicle occupancies published in WebTAG. It is important to take this into account when producing traffic forecasts as it results in an additional increase in cars on the roads.
The table below presents the vehicle occupancies.
Table 5.6.1: Forecast Vehicle Occupancies (Persons per vehicle)
Car User Class 2012 2019 2034
Commute 1.06 1.06 1.05

Galway County Council N6 Galway City Transport Project
Phase 2 Traffic Modelling Report Appendices
GCOB-4.04-10.1 (Phase 2 TM Report)_Final Issue | Final Issue | 31 August 2015 | Arup
\\GLOBAL\EUROPE\DUBLIN\JOBS\233000\233985-00\4. INTERNAL\4-04 REPORTS\4-04-03 INFRASTRUCTURE\10. TM\10.1 PHASE 2\GCOB-4.04-10.1 (TM REPORT)_FINAL
ISSUE.DOCX
Page 56
Car User Class 2012 2019 2034
Education 2.18 2.14 2.05 Employers Business 1.44 1.42 1.40 Other 2.16 2.11 2.03
5.7 Car Ownership An increase in car ownership was forecast using the car ownership model developed as part of the NTA’s Greater Dublin Area model. It is important to take this into account when producing traffic forecasts as it impacts on the number of cars on the roads.
The table below presents the vehicle densities by modelled year calculated from the NTA’s car ownership model.
Table 5.7.1: Vehicle Density (Cars per 1000 people over 17s)
Area 2012 2019 2034
Galway Model Extent 637 664 668
5.8 Goods Vehicle Growth For the GCTP it was assumed that goods vehicle trips (Light Goods Vehicles and Heavy Goods Vehicles) will grow in proportion to the growth in jobs at each model zone.
5.9 Future Year Parameters The following parameters all impact how the demand model adjusts the travel demand matrices in response to changes in travel costs.
5.9.1 Vehicle Operating Costs Vehicle Operating Costs (VOCs) were assumed to remain constant in real terms through time, as recommended in the NRA PAG.
5.9.2 Values of Time Values of time were increased in line with the forecast growth in values of time published in WebTAG.
Table 5.9.1: Forecast Values of Time (Cent per Minute)
User Class 2012 2019 2034
Commute 16.17 17.87 23.43 Education 33.25 36.79 45.74 Employers Business 60.36 69.26 94.34 Other 29.70 32.85 40.84 LGV 35.87 42.14 55.85 HGV1 39.05 46.24 62.12 HGV2 37.73 44.72 60.18

Galway County Council N6 Galway City Transport Project
Phase 2 Traffic Modelling Report Appendices
GCOB-4.04-10.1 (Phase 2 TM Report)_Final Issue | Final Issue | 31 August 2015 | Arup
\\GLOBAL\EUROPE\DUBLIN\JOBS\233000\233985-00\4. INTERNAL\4-04 REPORTS\4-04-03 INFRASTRUCTURE\10. TM\10.1 PHASE 2\GCOB-4.04-10.1 (TM REPORT)_FINAL
ISSUE.DOCX
Page 57
5.9.3 Public Transport Fares Fares were assumed to remain constant in real terms through time. This ensures consistency with the similar assumption made for highway VOCs.
5.10 Future Year Matrix Totals A comparison of the morning peak hour trip matrix totals for the Base Year, 2019 Opening Year Do Minimum and 2034 Design Year Do Minimum scenarios are outlined in the tables below. The matrix totals do not include for any scheme impacts at this stage, however the Do Minimum matrices allow for demand responses due to the Do Minimum schemes listed in Appendix E.
The growth in car trips is 11% between 2012 and 2019 and 23% between 2012 and 2034. The main reason why the growth in car trips is higher than the growth in population and the growth in public transport trips is because of the increase in car ownership and the reduction in vehicle occupancy.
Table 5.10.1: Matrix Totals 2019 Opening Year Morning Peak Hour Trips Mode Units 2012 Base 2019 Do-Min Growth %Growth Car Veh 20,116 22,351 2,235 11% LGV Veh 2,923 3,058 135 5% HGV Veh 711 744 34 5% Public Transport Persons 1,452 1,472 20 1%
Table 5.10.2: Matrix Totals 2034 Design Year
Morning Peak Hour Trips Mode Units 2012 Base 2034 Do-Min Growth %Growth Car Veh 20,116 24,655 4,539 23% LGV Veh 2,923 3,373 450 15% HGV Veh 711 809 99 14% Public Transport Persons 1,452 1,697 245 17%
5.11 Future Year Matrix Analysis The PAG requires a quantitative assessment of the impact of the traffic forecasting process to be undertaken upon the following criteria:
Trip Length Distribution; Trip End Growth; and Zone to Zone Growth.
5.11.1 Trip Length Distribution The graphs below show the change in trip length distribution between the 2012 Base and 2034 Design Year for car trips in the morning peak hour and inter-peak hour, respectively. There has been an increase in the proportion of shorter distance trips, which is logical because the increase in congestion and the increase in value of time would both encourage shorter journeys.

Galway County Council N6 Galway City Transport Project
Phase 2 Traffic Modelling Report Appendices
GCOB-4.04-10.1 (Phase 2 TM Report)_Final Issue | Final Issue | 31 August 2015 | Arup
\\GLOBAL\EUROPE\DUBLIN\JOBS\233000\233985-00\4. INTERNAL\4-04 REPORTS\4-04-03 INFRASTRUCTURE\10. TM\10.1 PHASE 2\GCOB-4.04-10.1 (TM REPORT)_FINAL
ISSUE.DOCX
Page 58
Figure 5.11.1: Change in Trip Length Distribution – Morning Peak Hour
Figure 5.11.2: Change in Trip Length Distribution – Inter-peak Hour
0.000
0.050
0.100
0.150
0.200
0.250
0.300
0.350
0 4 8 12 16 20 24 28 32 36 40 44 48 52 56 60 64 68 72 76 80 84 88 92 96 100
2012 Base 2034 Do-MinimumDistance (km)
Trip length distribution Total CAR - IP
Distance (km)
Ratio
0.000
0.050
0.100
0.150
0.200
0.250
0.300
0 4 8 12 16 20 24 28 32 36 40 44 48 52 56 60 64 68 72 76 80 84 88 92 96 100
2012 Base 2034 Do-MinimumDistance (km)
Trip length distribution Total CAR - AM
Distance (km)
Ratio

Galway County Council N6 Galway City Transport Project
Phase 2 Traffic Modelling Report Appendices
GCOB-4.04-10.1 (Phase 2 TM Report)_Final Issue | Final Issue | 31 August 2015 | Arup
\\GLOBAL\EUROPE\DUBLIN\JOBS\233000\233985-00\4. INTERNAL\4-04 REPORTS\4-04-03 INFRASTRUCTURE\10. TM\10.1 PHASE 2\GCOB-4.04-10.1 (TM REPORT)_FINAL
ISSUE.DOCX
Page 59
5.11.2 Trip End Growth An assessment of the Trip End Growth (TEG) between the Base and Design Year demand in the AM Peak and Inter Peak was undertaken to assess if there were any significant changes in demand at trip end level when compared to the overall growth between the Base and Design Year demand.
The assessment indicated that the percentage increase between several trip ends in the Base and Design Year demand was significant but that the actual increase in the number of trips was only minor. In order to assess the true magnitude of TEG, the GEH statistic was applied to the Base and Design Year trip ends in order to take account of not only the difference between the Base and Design Year demand, but also the magnitude of the difference.
Figure 5.11.3 and Figure 5.11.4 illustrate the GEH (>10) between the Base and Design Year demand in the AM Peak and Inter Peak respectively. The PAG guidance on the GEH statistic indicates that any GEH statistic above 10 warrants further investigation. The figures show that there are a number of both origin and destination zones with a GEH statistic above 10 in each time period.
A review was undertaken to assess the origin and destination trips end growth whereby a GEH of 10 or more was calculated. As expected the review indicated that the zones with a GEH over 10 were key future development sites such as Menlough, Ballybaan residential development sites and the Headford Road, Ardaun and Rahoon employment development sites. These zones were seeded and assigned a significant demand in the future year model as per the forecasting process set out in Section 5.5 of this report In addition, forecast growth in the Galway University Hospital, Merlin Park Hospital and Galway Airport also counted for some of the high trip end growth values.

Galway County Council N6 Galway City Transport Project
Phase 2 Traffic Modelling Report Appendices
GCOB-4.04-10.1 (Phase 2 TM Report)_Final Issue | Final Issue | 31 August 2015 | Arup
\\GLOBAL\EUROPE\DUBLIN\JOBS\233000\233985-00\4. INTERNAL\4-04 REPORTS\4-04-03 INFRASTRUCTURE\10. TM\10.1 PHASE 2\GCOB-4.04-10.1 (TM REPORT)_FINAL
ISSUE.DOCX
Page 60
Figure 5.11.3: AM Trip End Growth (2012 to 2034)
Figure 5.11.4: IP Trip End Growth (2012 to 2034)
10.00
12.00
14.00
16.00
18.00
20.00
22.00
24.00
26.00
0 50 100 150 200 250
GEH
Zones
Origin Growth Destination Growth
10.00
11.00
12.00
13.00
14.00
15.00
16.00
17.00
18.00
19.00
20.00
0 50 100 150 200 250
GEH
Zones
Origin Growth Destination Growth

Galway County Council N6 Galway City Transport Project
Phase 2 Traffic Modelling Report Appendices
GCOB-4.04-10.1 (Phase 2 TM Report)_Final Issue | Final Issue | 31 August 2015 | Arup
\\GLOBAL\EUROPE\DUBLIN\JOBS\233000\233985-00\4. INTERNAL\4-04 REPORTS\4-04-03 INFRASTRUCTURE\10. TM\10.1 PHASE 2\GCOB-4.04-10.1 (TM REPORT)_FINAL
ISSUE.DOCX
Page 61
5.11.3 Zone to Zone Growth The same procedure for TEG was also undertaken for zone to zone growth. The GEH statistic for each origin-destination pair was assessed to show any significant outliers or issues in the AM Peak and Inter Peak demand.
The GEH statistic on a zone to zone basis for each period is shown in Figures 5.11.5 and 5.11.6.The figures show that there is only one GEH statistic greater than 10 in the Inter Peak and no GEH above 10 in AM Peak. Once again a review was undertaken to assess the origin and destination zones with a GEH greater than 10. The review illustrated that the zone with the high GEH statistic was a residential zone in the Grangemore area which saw an increase in intra-zonal trips, with no impacts on the modelled network.
Figure 5.11.5: AM Zone to Zone Growth (2012 to 2034)
0.00
2.00
4.00
6.00
8.00
10.00
12.00
0 20000 40000 60000 80000
GEH
Zone to Zone No.
GEH < 10 GEH >10

Galway County Council N6 Galway City Transport Project
Phase 2 Traffic Modelling Report Appendices
GCOB-4.04-10.1 (Phase 2 TM Report)_Final Issue | Final Issue | 31 August 2015 | Arup
\\GLOBAL\EUROPE\DUBLIN\JOBS\233000\233985-00\4. INTERNAL\4-04 REPORTS\4-04-03 INFRASTRUCTURE\10. TM\10.1 PHASE 2\GCOB-4.04-10.1 (TM REPORT)_FINAL
ISSUE.DOCX
Page 62
Figure 5.11.6: IP Zone to Zone Growth (2012 to 2034)
0.00
2.00
4.00
6.00
8.00
10.00
12.00
0 20000 40000 60000 80000
GEH
Zone to Zone No.
GEH < 10 GEH >10
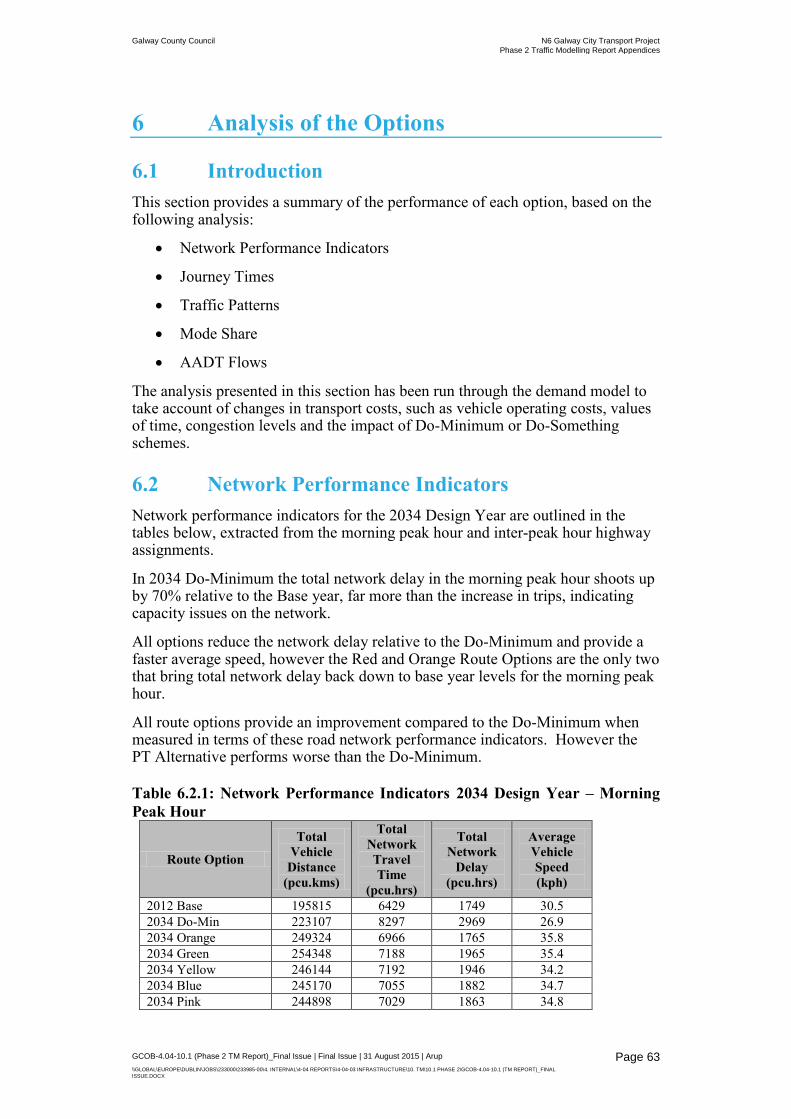
Galway County Council N6 Galway City Transport Project
Phase 2 Traffic Modelling Report Appendices
GCOB-4.04-10.1 (Phase 2 TM Report)_Final Issue | Final Issue | 31 August 2015 | Arup
\\GLOBAL\EUROPE\DUBLIN\JOBS\233000\233985-00\4. INTERNAL\4-04 REPORTS\4-04-03 INFRASTRUCTURE\10. TM\10.1 PHASE 2\GCOB-4.04-10.1 (TM REPORT)_FINAL
ISSUE.DOCX
Page 63
6 Analysis of the Options
6.1 Introduction This section provides a summary of the performance of each option, based on the following analysis:
Network Performance Indicators
Journey Times
Traffic Patterns
Mode Share
AADT Flows
The analysis presented in this section has been run through the demand model to take account of changes in transport costs, such as vehicle operating costs, values of time, congestion levels and the impact of Do-Minimum or Do-Something schemes.
6.2 Network Performance Indicators Network performance indicators for the 2034 Design Year are outlined in the tables below, extracted from the morning peak hour and inter-peak hour highway assignments.
In 2034 Do-Minimum the total network delay in the morning peak hour shoots up by 70% relative to the Base year, far more than the increase in trips, indicating capacity issues on the network.
All options reduce the network delay relative to the Do-Minimum and provide a faster average speed, however the Red and Orange Route Options are the only two that bring total network delay back down to base year levels for the morning peak hour.
All route options provide an improvement compared to the Do-Minimum when measured in terms of these road network performance indicators. However the PT Alternative performs worse than the Do-Minimum. Table 6.2.1: Network Performance Indicators 2034 Design Year – Morning Peak Hour
Route Option
Total Vehicle
Distance (pcu.kms)
Total Network Travel Time
(pcu.hrs)
Total Network
Delay (pcu.hrs)
Average Vehicle Speed (kph)
2012 Base 195815 6429 1749 30.5 2034 Do-Min 223107 8297 2969 26.9 2034 Orange 249324 6966 1765 35.8 2034 Green 254348 7188 1965 35.4 2034 Yellow 246144 7192 1946 34.2 2034 Blue 245170 7055 1882 34.7 2034 Pink 244898 7029 1863 34.8

Galway County Council N6 Galway City Transport Project
Phase 2 Traffic Modelling Report Appendices
GCOB-4.04-10.1 (Phase 2 TM Report)_Final Issue | Final Issue | 31 August 2015 | Arup
\\GLOBAL\EUROPE\DUBLIN\JOBS\233000\233985-00\4. INTERNAL\4-04 REPORTS\4-04-03 INFRASTRUCTURE\10. TM\10.1 PHASE 2\GCOB-4.04-10.1 (TM REPORT)_FINAL
ISSUE.DOCX
Page 64
Route Option
Total Vehicle
Distance (pcu.kms)
Total Network Travel Time
(pcu.hrs)
Total Network
Delay (pcu.hrs)
Average Vehicle Speed (kph)
2034 Red 248107 6901 1751 36.0 2034 PT Alternative 221743 8452 3151 26.2
Table 6.2.2: Network Performance Indicators 2034 Design Year – Inter-peak Hour
Route Option
Total Vehicle
Distance (pcu.kms)
Total Network Travel Time
(pcu.hrs)
Total Network
Delay (pcu.hrs)
Average Vehicle Speed (kph)
2012 Base 133907 3989 795 33.6 2034 Do-Min 159598 5126 1357 31.1 2034 Orange 180244 4958 1092 36.3 2034 Green 181975 5005 1122 36.4 2034 Yellow 173725 5003 1177 34.7 2034 Blue 174918 5031 1169 34.8 2034 Pink 176666 5021 1138 35.2 2034 Red 179794 4964 1138 36.2 2034 PT Alternative 159598 5126 1357 31.1
6.3 Journey Times Journey time analysis has been undertaken for three key routes in Galway City, in order to compare the performance of each option. These routes were identified in Phase 1 as key routes, and journey times on these routes are a key performance indicator on which all options are tested.
The table below presents the journey time analysis for the three routes.
The journey time analysis shows that the Red Route Option performs best at reducing journey times on the three routes, saving an average of 9 minutes (33% reduction) on the inbound routes and 5 minutes (26% reduction) on the outbound routes. The biggest journey time savings for the Red Route Option are on the N6 (Route 1), this is logical as the N6 is upgraded under the Red Route Option; however the relief that this brings to the other two routes is also significant.
The Orange Route Option performs second best, saving an average of 6 minutes (22%) on the inbound routes and 4 minutes (21% reduction) on the outbound routes. This is closely followed by the Green Route Option, which in turn is closely followed the Blue, Yellow and Pink Route Options.
The PT Alternative provides a dis-improvement in car journey times on two of the three routes inbound compared to the Do-Minimum, and a minor change on the outbound routes.

Galway County Council N6 Galway City Transport Project
Phase 2 Traffic Modelling Report Appendices
GCOB-4.04-10.1 (Phase 2 TM Report)_Final Issue | Final Issue | 31 August 2015 | Arup
\\GLOBAL\EUROPE\DUBLIN\JOBS\233000\233985-00\4. INTERNAL\4-04 REPORTS\4-04-03 INFRASTRUCTURE\10. TM\10.1 PHASE 2\GCOB-4.04-10.1 (TM REPORT)_FINAL
ISSUE.DOCX
Page 65
Table 6.3.1: Journey Times 2034 Design Year
Figure 6.3.1: Journey Time Routes
6.4 Traffic Patterns The GIM predicts changes to travel patterns based on the population and job forecasts and the changes in travel costs (for example changes in congestion). The strongest change is a re-distribution of trips as people change their destination (e.g. where they work or shop) based on the changes in travel costs over a number of years.
In the 2034 Do-Minimum, the overall growth in car trips to/from/through Galway city is 20%. However the re-distribution impacts result in the growth in car trips crossing the River Corrib of just 11%, because the capacity constraints to cross the river suppress some of the cross-river trips.
In the 2034 Do-Something(s), the overall growth in car trips remains at 20%, but the growth in car trips crossing the River Corrib increases to 37% on average across the Route Options, because the increased capacity to cross the river relieves the suppressed demand.

Galway County Council N6 Galway City Transport Project
Phase 2 Traffic Modelling Report Appendices
GCOB-4.04-10.1 (Phase 2 TM Report)_Final Issue | Final Issue | 31 August 2015 | Arup
\\GLOBAL\EUROPE\DUBLIN\JOBS\233000\233985-00\4. INTERNAL\4-04 REPORTS\4-04-03 INFRASTRUCTURE\10. TM\10.1 PHASE 2\GCOB-4.04-10.1 (TM REPORT)_FINAL
ISSUE.DOCX
Page 66
6.5 Mode Share The other change in travel patterns predicted by the GIM is a change in travel mode based on the changes in travel costs.
The tables below present the mode share between private vehicle and public transport for the 2012 Base and 2034 Design Year, extracted from the model for the morning peak hour.
The mode share analysis shows that there is a low public transport mode share of just 5.0% in the Base Year. As can be seen below, the impact of the Do-Something options on mode share is minimal.
The PT Alternative increases PT mode share to 5.8%, which is a 17% increase in PT trips relative to the Do-Minimum. However due to the overall low PT mode share, this represents less than a 1% reduction in car trips.
Table 6.5.1: Mode Share 2034 Design Year
Morning Peak Hour Person Trips Option Car PT %Car %PT
2012 Base 27,478 1,452 95.0% 5.0% 2034 Do-Minimum 32,898 1,697 95.1% 4.9% 2034 Orange 32,956 1,639 95.3% 4.7% 2034 Green 32,960 1,635 95.3% 4.7% 2034 Yellow 32,928 1,667 95.2% 4.8% 2034 Blue 32,943 1,651 95.2% 4.8% 2034 Pink 32,959 1,636 95.3% 4.7% 2034 Red 32,955 1,639 95.3% 4.7% 2034 PT Alternative 32,614 1,992 94.2% 5.8%
Whilst the model indicates a marginal increase in PT mode share for the PT Alternative scenario, it is clear that the public transport alternative, as based on the existing plans adopted for Galway, does not provide an adequate solution to reducing congestion levels in the city.
As noted in Section 7.6, the public transport strategy for Galway will be re-examined as part of a wider integrated transport strategy identifying the needs of pedestrians, cyclists, public transport users and motorists. This strategy will examine the multi-modal transport needs of Galway in the context of the full, partial or non-delivery of the preferred route option for this study.
6.6 Annual Average Daily Traffic (AADT) To estimate the annual average daily traffic (AADT), factors were developed that allowed extrapolation of AM peak hour traffic flows to AADT.
PAG suggests using the Permanent Counter method to estimate AADT, however the NRA permanent counters are located some distance from Galway city. The Localised Period Count method was therefore preferable and has been applied using 72 ATC count locations around Galway City (7 days, November 2012) which were used as part of the development of the GIM.
Factors were developed based on regression analysis of the 72 ATCs to go from AM peak hour to Weekly Average Daily Traffic (WADT). The regression
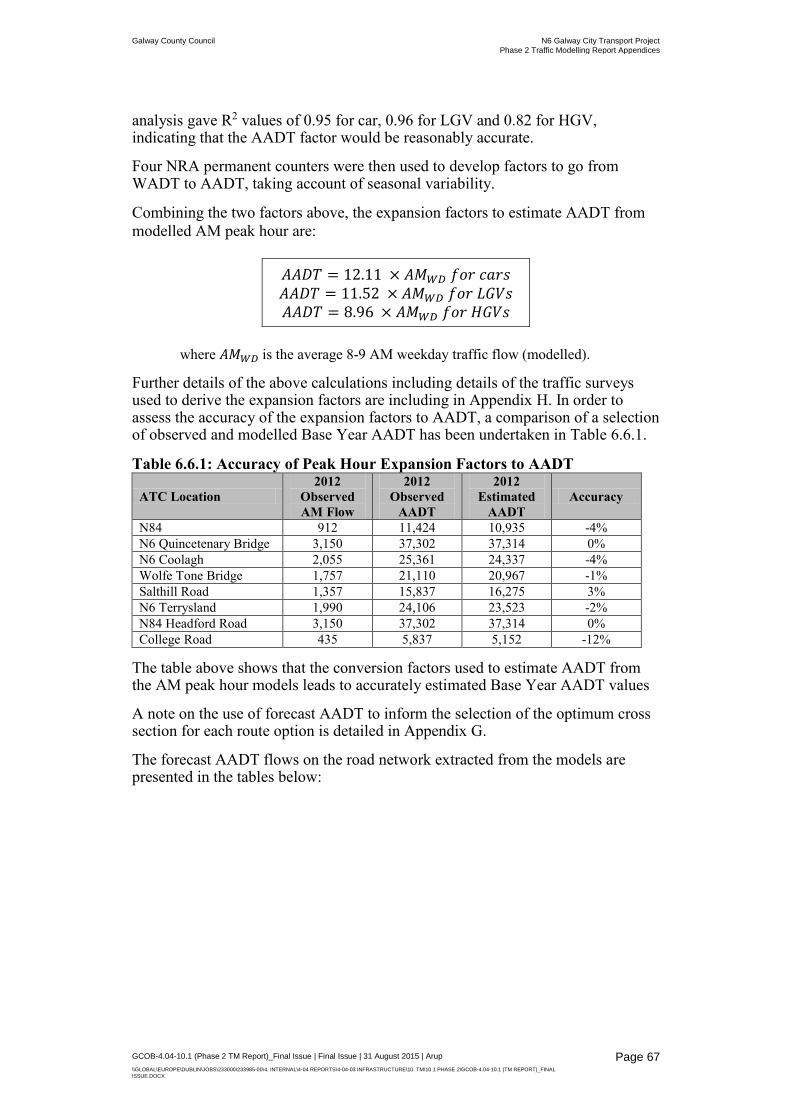
Galway County Council N6 Galway City Transport Project
Phase 2 Traffic Modelling Report Appendices
GCOB-4.04-10.1 (Phase 2 TM Report)_Final Issue | Final Issue | 31 August 2015 | Arup
\\GLOBAL\EUROPE\DUBLIN\JOBS\233000\233985-00\4. INTERNAL\4-04 REPORTS\4-04-03 INFRASTRUCTURE\10. TM\10.1 PHASE 2\GCOB-4.04-10.1 (TM REPORT)_FINAL
ISSUE.DOCX
Page 67
analysis gave R2 values of 0.95 for car, 0.96 for LGV and 0.82 for HGV, indicating that the AADT factor would be reasonably accurate.
Four NRA permanent counters were then used to develop factors to go from WADT to AADT, taking account of seasonal variability.
Combining the two factors above, the expansion factors to estimate AADT from modelled AM peak hour are:
𝐴𝐴𝐷𝑇 = 12.11 × 𝐴𝑀𝑊𝐷 𝑓𝑜𝑟 𝑐𝑎𝑟𝑠 𝐴𝐴𝐷𝑇 = 11.52 × 𝐴𝑀𝑊𝐷 𝑓𝑜𝑟 𝐿𝐺𝑉𝑠 𝐴𝐴𝐷𝑇 = 8.96 × 𝐴𝑀𝑊𝐷 𝑓𝑜𝑟 𝐻𝐺𝑉𝑠
where 𝐴𝑀𝑊𝐷 is the average 8-9 AM weekday traffic flow (modelled).
Further details of the above calculations including details of the traffic surveys used to derive the expansion factors are including in Appendix H. In order to assess the accuracy of the expansion factors to AADT, a comparison of a selection of observed and modelled Base Year AADT has been undertaken in Table 6.6.1.
Table 6.6.1: Accuracy of Peak Hour Expansion Factors to AADT
ATC Location 2012
Observed AM Flow
2012 Observed
AADT
2012 Estimated
AADT Accuracy
N84 912 11,424 10,935 -4% N6 Quincetenary Bridge 3,150 37,302 37,314 0% N6 Coolagh 2,055 25,361 24,337 -4% Wolfe Tone Bridge 1,757 21,110 20,967 -1% Salthill Road 1,357 15,837 16,275 3% N6 Terrysland 1,990 24,106 23,523 -2% N84 Headford Road 3,150 37,302 37,314 0% College Road 435 5,837 5,152 -12%
The table above shows that the conversion factors used to estimate AADT from the AM peak hour models leads to accurately estimated Base Year AADT values
A note on the use of forecast AADT to inform the selection of the optimum cross section for each route option is detailed in Appendix G.
The forecast AADT flows on the road network extracted from the models are presented in the tables below:
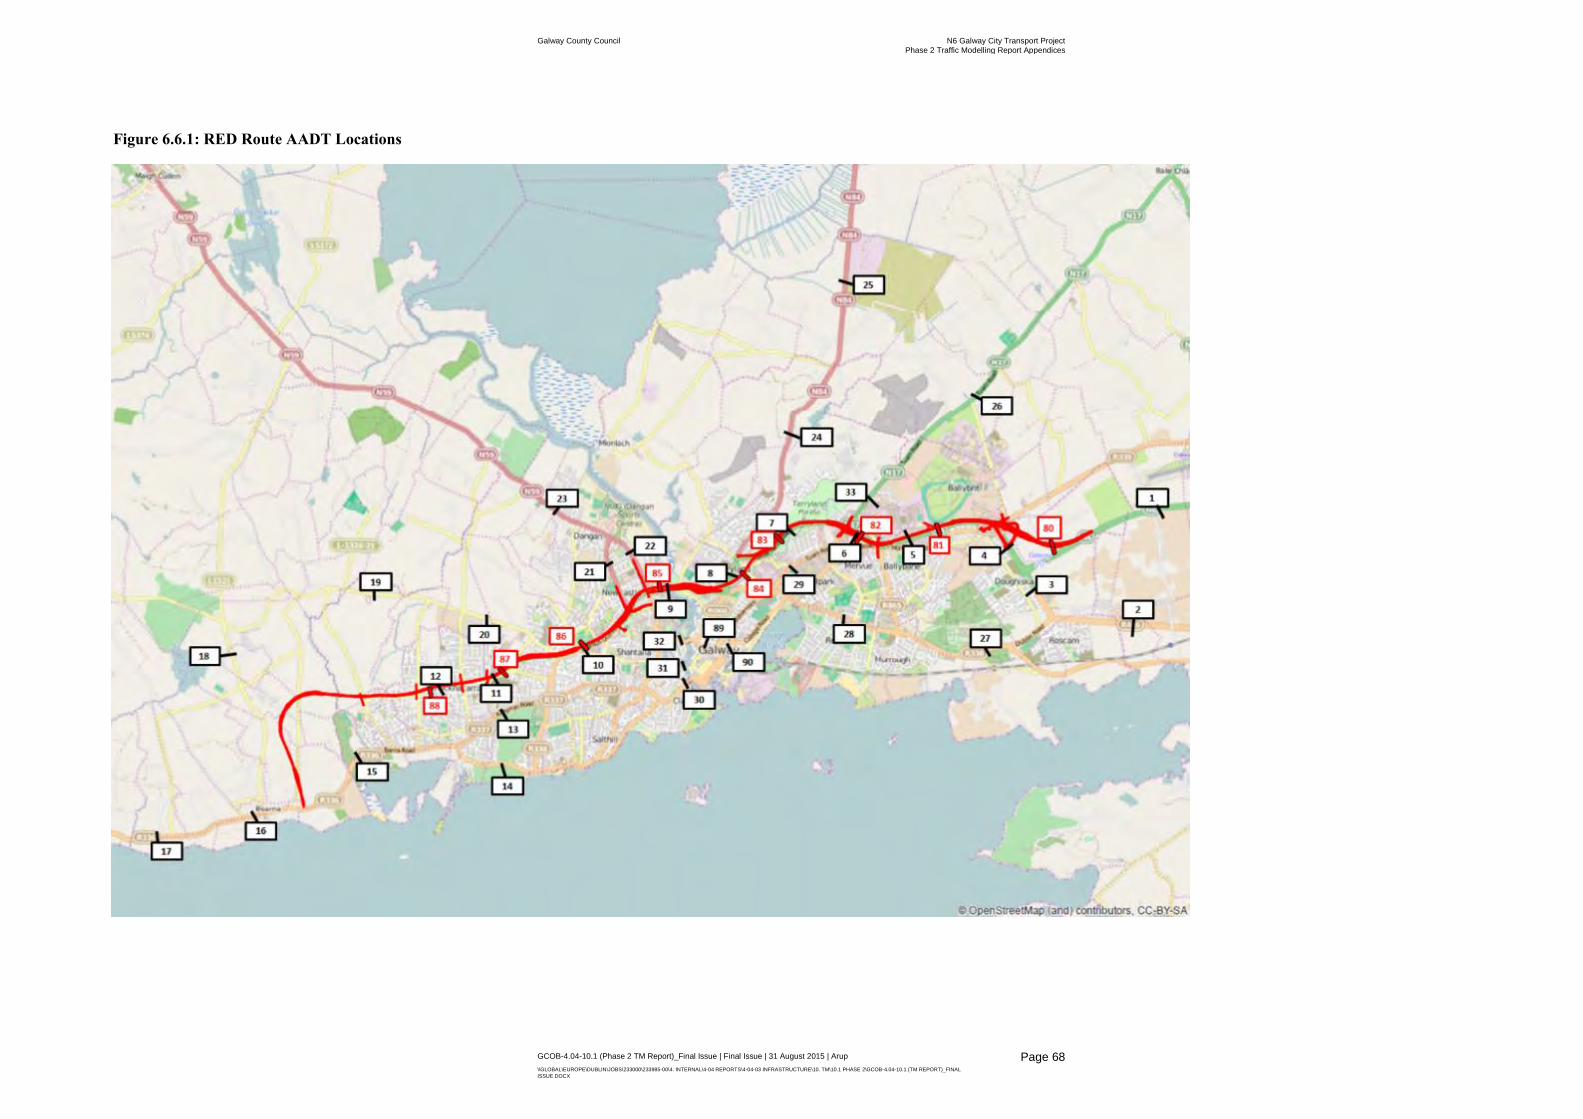
Galway County Council N6 Galway City Transport Project
Phase 2 Traffic Modelling Report Appendices
GCOB-4.04-10.1 (Phase 2 TM Report)_Final Issue | Final Issue | 31 August 2015 | Arup
\\GLOBAL\EUROPE\DUBLIN\JOBS\233000\233985-00\4. INTERNAL\4-04 REPORTS\4-04-03 INFRASTRUCTURE\10. TM\10.1 PHASE 2\GCOB-4.04-10.1 (TM REPORT)_FINAL
ISSUE.DOCX
Page 68
Figure 6.6.1: RED Route AADT Locations

Galway County Council N6 Galway City Transport Project
Phase 2 Traffic Modelling Report Appendices
GCOB-4.04-10.1 (Phase 2 TM Report)_Final Issue | Final Issue | 31 August 2015 | Arup
\\GLOBAL\EUROPE\DUBLIN\JOBS\233000\233985-00\4. INTERNAL\4-04 REPORTS\4-04-03 INFRASTRUCTURE\10. TM\10.1 PHASE 2\GCOB-4.04-10.1 (TM REPORT)_FINAL
ISSUE.DOCX
Page 69
Table 6.6.1: Red Route AADT 2034 Design Year
AADT Point Location AADT % HGV AADT % HGV
1 N6 South of Galway Airport 21,900 2.9% 49,900 2.1%
2 R446 West of Oranmore Business Park 20,200 4.9% 15,500 5.9%
3 R446 South of N6 Roundabout 14,400 3.3% 17,300 4.2%
4 N6 South of Briarhill 31,100 2.8% 10,000 4.1%
5 N6 Near Ballybrit Business park 37,000 4.5% 67,100 2.9%
6 N6 between N17 and R865 32,000 3.0% 53,900 2.5%
7 N6 Between N84 and N17 33,800 2.8% 72,200 2.3%
8 N6 East of Quincentenary Bridge 29,900 4.7% 27,300 4.4%
9 N6 - On Quincentenary Bridge 34,800 3.3% 59,800 2.3%
10 R338 at Westside Playing fields 11,500 2.5% 39,900 1.7%
11 Western Distributor Rd between Clybaun Rd and R338 12,800 0.8% 30,400 0.8%
12 Western Distributor Rd between Clybaun Rd and Ballymoneen Rd 10,600 0.7% 15,900 0.8%
13 R337 Kingston Road. Kingston 7,100 1.4% 7,300 0.4%
14 R336. Salthill Road Upper. Galway Golf Course. 18,400 0.7% 15,900 0.4%
15 R336. Barna Road. Barna Woods 16,600 0.9% 9,700 0.4%
16 R336. Barna Road. Barna. Creagan bus stop 13,400 1.0% 15,200 0.9%
17 R336. Barna Road. West of Barna. Garrynagry 11,400 1.2% 13,300 1.0%
18 L1321. At Loughinch. South East of Bearna Golf Club 1,100 0.1% 800 0.2%
19 Boleybeg Road. Between Cappagh Road and Ballymoneen Road 2,000 0.8% 1,800 0.9%
20 Rahoon Road. Between Clybaun Rd and Bothar Stiofain 5,000 0.4% 5,800 0.5%
21 N59. Thomas Hynes road. Between Hazel Park and Cherry Park 4,300 1.7% 7,300 2.2%
22 N59. Upper Newcastle Road. Between R338 and Corrib Village 15,900 1.4% 17,100 1.1%
23 N59. Barnacranny. Between chesnut Ln and Circular Rd 18,400 1.3% 19,600 1.3%
24 N84. South of Ballindooly. Ballindooly Lough 10,600 2.1% 12,800 1.7%
25 N84. North of Ballindooly 17,300 1.3% 17,300 1.3%
26 N17. Tuam Road. NorthEast of Parkmore Road 19,300 1.6% 16,400 2.2%
27 R338. Dublin Road. West of Junction with Coast Road. 13,500 4.5% 8,800 2.6%
28 R338. Dublin road. Between Renmore Rd and M. Collins road 18,600 3.3% 17,500 1.6%
29 R336. Tuam Road. Mervue Business Park 14,500 2.6% 9,200 2.3%
30 Wolfe Tone Bridge 20,800 2.6% 14,600 2.2%
31 O'Briens Bridge 9,100 1.9% 6,800 2.3%
32 Salmon Weir Bridge 16,700 1.7% 11,600 2.0%
33 N17. Tuam Road. NorthEast of School Road 14,900 2.0% 14,300 3.2%
89 Eglington Street 7,800 2.6% 4,400 2.9%
90 R336 South of Eyre Square 13,600 2.5% 12,400 1.7%
80 Expressway - RED - Briarhill Junction 49,900 2.1%
81 Expressway - RED - South of Ballybrit Business Park 63,500 3.1%
82 Expressway - RED - Between N17 and R865 53,900 2.5%
83 Expressway -RED - Between N17 and N84 72,200 2.3%
84 Expressway -RED - Between N84 and R8338 43,900 2.3%
85 Expressway - RED - New Corrib Crossing (Local Road) 12,400 2.2%
86 Expressway - RED -R338 at Westside Playing fields 39,900 1.7%
87 Expressway - RED -Western Distributor Rd between Clybaun Rd and R338 30,400 0.8%
88 Expressway - RED -Western Distributor Rd between Clybaun Rd and Ballymoneen Rd 15,900 0.8%
DS - RED - 2034D
M li
nks
DS
links
DM - 2034

Galway County Council N6 Galway City Transport Project
Phase 2 Traffic Modelling Report Appendices
GCOB-4.04-10.1 (Phase 2 TM Report)_Final Issue | Final Issue | 31 August 2015 | Arup
\\GLOBAL\EUROPE\DUBLIN\JOBS\233000\233985-00\4. INTERNAL\4-04 REPORTS\4-04-03 INFRASTRUCTURE\10. TM\10.1 PHASE 2\GCOB-4.04-10.1 (TM REPORT)_FINAL
ISSUE.DOCX
Page 70
Figure 6.6.1: Blue Route AADT Locations

Galway County Council N6 Galway City Transport Project
Phase 2 Traffic Modelling Report Appendices
GCOB-4.04-10.1 (Phase 2 TM Report)_Final Issue | Final Issue | 31 August 2015 | Arup
\\GLOBAL\EUROPE\DUBLIN\JOBS\233000\233985-00\4. INTERNAL\4-04 REPORTS\4-04-03 INFRASTRUCTURE\10. TM\10.1 PHASE 2\GCOB-4.04-10.1 (TM REPORT)_FINAL
ISSUE.DOCX
Page 71
Table 6.6.2: Blue Route AADT 2034 Design Year
AADT Point Location AADT % HGV AADT % HGV
1 N6 South of Galway Airport 21,900 2.9% 33,900 2.0%
2 R446 West of Oranmore Business Park 20,200 4.9% 22,900 4.8%
3 R446 South of N6 Roundabout 14,400 3.3% 23,600 3.1%
4 N6 South of Briarhill 31,100 2.8% 28,500 3.5%
5 N6 Near Ballybrit Business park 37,000 4.5% 27,400 4.7%
6 N6 between N17 and R865 32,000 3.0% 24,100 3.3%
7 N6 Between N84 and N17 33,800 2.8% 20,800 3.4%
8 N6 East of Quincentenary Bridge 29,900 4.7% 31,600 4.0%
9 N6 - On Quincentenary Bridge 34,800 3.3% 29,400 2.7%
10 R338 at Westside Playing fields 11,500 2.5% 5,800 2.0%
11 Western Distributor Rd between Clybaun Rd and R338 12,800 0.8% 9,900 0.2%
12 Western Distributor Rd between Clybaun Rd and Ballymoneen Rd 10,600 0.7% 5,700 0.2%
13 R337 Kingston Road. Kingston 7,100 1.4% 5,000 1.2%
14 R336. Salthill Road Upper. Galway Golf Course. 18,400 0.7% 17,300 0.5%
15 R336. Barna Road. Barna Woods 16,600 0.9% 9,500 0.8%
16 R336. Barna Road. Barna. Creagan bus stop 13,400 1.0% 6,200 1.0%
17 R336. Barna Road. West of Barna. Garrynagry 11,400 1.2% 13,400 1.0%
18 L1321. At Loughinch. South East of Bearna Golf Club 1,100 0.1% 300 0.3%
19 Boleybeg Road. Between Cappagh Road and Ballymoneen Road 2,000 0.8% 1,500 1.1%
20 Rahoon Road. Between Clybaun Rd and Bothar Stiofain 5,000 0.4% 4,300 0.4%
21 N59. Thomas Hynes road. Between Hazel Park and Cherry Park 4,300 1.7% 3,000 0.8%
22 N59. Upper Newcastle Road. Between R338 and Corrib Village 15,900 1.4% 15,400 0.9%
23 N59. Barnacranny. Between chesnut Ln and Circular Rd 18,400 1.3% 19,800 0.7%
24 N84. South of Ballindooly. Ballindooly Lough 10,600 2.1% 17,200 1.5%
25 N84. North of Ballindooly 17,300 1.3% 18,200 1.4%
26 N17. Tuam Road. NorthEast of Parkmore Road 19,300 1.6% 20,600 1.9%
27 R338. Dublin Road. West of Junction with Coast Road. 13,500 4.5% 9,600 3.5%
28 R338. Dublin road. Between Renmore Rd and M. Collins road 18,600 3.3% 18,700 2.0%
29 R336. Tuam Road. Mervue Business Park 14,500 2.6% 13,200 2.5%
30 Wolfe Tone Bridge 20,800 2.6% 17,300 2.3%
31 O'Briens Bridge 9,100 1.9% 7,800 2.1%
32 Salmon Weir Bridge 16,700 1.7% 14,900 2.0%
33 N17. Tuam Road. NorthEast of School Road 14,900 2.0% 18,300 2.1%
89 Eglington Street 7,800 2.6% 6,400 3.0%
90 R336 South of Eyre Square 13,600 2.5% 12,800 1.6%
60 Expressway - BLUE - Briarhill Junction - 33,900 2.0%
61 Expressway - BLUE - Parkmore - 30,500 1.3%
62 Expressway - BLUE - Between N17 and N84 - 50,700 1.6%
63 Expressway - BLUE - New Corrib Crossing - 34,600 2.0%
64 Expressway - BLUE - N59 Link Road - 12,000 2.0%
65 Expressway - BLUE - Rahoon Link Road - 19,100 2.0%
66 Expressway - BLUE - Between Ballymoneen and Cappagh Road - 10,500 0.8%
67 Expressway - BLUE - @ Ballard - 10,500 0.8%
68 Expressway - BLUE - Junction with new Bearna Link Road - 10,500 0.8%
69 New Bearna Link Road - BLUE - North of R336 - 12,100 0.7%
DS - BLUE - 2034
DM
lin
ksD
S lin
ks
DM - 2034

Galway County Council N6 Galway City Transport Project
Phase 2 Traffic Modelling Report Appendices
GCOB-4.04-10.1 (Phase 2 TM Report)_Final Issue | Final Issue | 31 August 2015 | Arup
\\GLOBAL\EUROPE\DUBLIN\JOBS\233000\233985-00\4. INTERNAL\4-04 REPORTS\4-04-03 INFRASTRUCTURE\10. TM\10.1 PHASE 2\GCOB-4.04-10.1 (TM REPORT)_FINAL
ISSUE.DOCX
Page 72
Figure 6.6.3: Green Route AADT Locations

Galway County Council N6 Galway City Transport Project
Phase 2 Traffic Modelling Report Appendices
GCOB-4.04-10.1 (Phase 2 TM Report)_Final Issue | Final Issue | 31 August 2015 | Arup
\\GLOBAL\EUROPE\DUBLIN\JOBS\233000\233985-00\4. INTERNAL\4-04 REPORTS\4-04-03 INFRASTRUCTURE\10. TM\10.1 PHASE 2\GCOB-4.04-10.1 (TM REPORT)_FINAL
ISSUE.DOCX
Page 73
Table 6.6.3: Green Route AADT 2034 Design Year
AADT Point Location AADT % HGV AADT % HGV
1 N6 South of Galway Airport 21,900 3% 47,000 2.0%
2 R446 West of Oranmore Business Park 20,200 5% 12,200 6.9%
3 R446 South of N6 Roundabout 14,400 3% 12,400 4.1%
4 N6 South of Briarhill 31,100 3% 25,100 3.5%
5 N6 Near Ballybrit Business park 37,000 4% 25,900 5.8%
6 N6 between N17 and R865 32,000 3% 23,900 3.8%
7 N6 Between N84 and N17 33,800 3% 20,900 4.5%
8 N6 East of Quincentenary Bridge 29,900 5% 30,600 4.7%
9 N6 - On Quincentenary Bridge 34,800 3% 31,100 2.9%
10 R338 at Westside Playing fields 11,500 2% 7,600 2.2%
11 Western Distributor Rd between Clybaun Rd and R338 12,800 1% 11,200 0.2%
12 Western Distributor Rd between Clybaun Rd and Ballymoneen Rd 10,600 1% 5,600 0.1%
13 R337 Kingston Road. Kingston 7,100 1% 4,400 1.1%
14 R336. Salthill Road Upper. Galway Golf Course. 18,400 1% 16,900 0.6%
15 R336. Barna Road. Barna Woods 16,600 1% 6,500 0.6%
16 R336. Barna Road. Barna. Creagan bus stop 13,400 1% 5,200 0.5%
17 R336. Barna Road. West of Barna. Garrynagry 11,400 1% 14,500 1.0%
18 L1321. At Loughinch. South East of Bearna Golf Club 1,100 0% 2,000 0.8%
19 Boleybeg Road. Between Cappagh Road and Ballymoneen Road 2,000 1% 300 0.6%
20 Rahoon Road. Between Clybaun Rd and Bothar Stiofain 5,000 0% 12,800 1.7%
21 N59. Thomas Hynes road. Between Hazel Park and Cherry Park 4,300 2% 3,200 1.4%
22 N59. Upper Newcastle Road. Between R338 and Corrib Village 15,900 1% 15,800 1.1%
23 N59. Barnacranny. Between chesnut Ln and Circular Rd 18,400 1% 21,500 1.1%
24 N84. South of Ballindooly. Ballindooly Lough 10,600 2% 21,800 1.3%
25 N84. North of Ballindooly 17,300 1% 18,700 1.4%
26 N17. Tuam Road. NorthEast of Parkmore Road 19,300 2% 19,800 1.8%
27 R338. Dublin Road. West of Junction with Coast Road. 13,500 5% 11,000 3.6%
28 R338. Dublin road. Between Renmore Rd and M. Collins road 18,600 3% 18,400 2.1%
29 R336. Tuam Road. Mervue Business Park 14,500 3% 13,600 1.8%
30 Wolfe Tone Bridge 20,800 3% 17,600 2.2%
31 O'Briens Bridge 9,100 2% 7,800 2.0%
32 Salmon Weir Bridge 16,700 2% 15,200 2.0%
33 N17. Tuam Road. NorthEast of School Road 14,900 2% 20,700 2.2%
89 Eglington Street 7,800 3% 6,600 3.0%
90 R336 South of Eyre Square 13,600 3% 13,500 1.4%
43 Expressway - GREEN - Briarhill Junction - 36,600 1.4%
44 Expressway - GREEN - Parkmore - 36,600 1.4%
45 Expressway - GREEN - Between N17 and N84 - 49,800 1.3%
46 Realligned N84 - GREEN - South of Expressway Junction - 21,800 1.3%
47 Expressway - GREEN - New Corrib Crossing - 32,000 1.8%
48 Expressway - GREEN - Between Rahoon Rd and Letteragh Rd - 32,400 1.2%
49 Expressway - GREEN - Between Ballymoneen and Cappagh Road - 18,000 0.8%
50 Expressway - GREEN - @ Forramoyle - 11,100 1.0%
DS - GREEN - 2034
DM
lin
ksD
S lin
ks
DM - 2034

Galway County Council N6 Galway City Transport Project
Phase 2 Traffic Modelling Report Appendices
GCOB-4.04-10.1 (Phase 2 TM Report)_Final Issue | Final Issue | 31 August 2015 | Arup
\\GLOBAL\EUROPE\DUBLIN\JOBS\233000\233985-00\4. INTERNAL\4-04 REPORTS\4-04-03 INFRASTRUCTURE\10. TM\10.1 PHASE 2\GCOB-4.04-10.1 (TM REPORT)_FINAL
ISSUE.DOCX
Page 74
Figure 6.6.4: Yellow Route AADT Locations

Galway County Council N6 Galway City Transport Project
Phase 2 Traffic Modelling Report Appendices
GCOB-4.04-10.1 (Phase 2 TM Report)_Final Issue | Final Issue | 31 August 2015 | Arup
\\GLOBAL\EUROPE\DUBLIN\JOBS\233000\233985-00\4. INTERNAL\4-04 REPORTS\4-04-03 INFRASTRUCTURE\10. TM\10.1 PHASE 2\GCOB-4.04-10.1 (TM REPORT)_FINAL
ISSUE.DOCX
Page 75
Table 6.6.4: Yellow Route AADT 2034 Design Year
AADT Point Location AADT % HGV AADT % HGV
1 N6 South of Galway Airport 21,900 3% 37,000 2.2%
2 R446 West of Oranmore Business Park 20,200 5% 21,400 5.0%
3 R446 South of N6 Roundabout 14,400 3% 19,900 3.1%
4 N6 South of Briarhill 31,100 3% 9,600 4.0%
5 N6 Near Ballybrit Business park 37,000 4% 51,200 2.8%
6 N6 between N17 and R865 32,000 3% 32,900 1.9%
7 N6 Between N84 and N17 33,800 3% 29,000 2.2%
8 N6 East of Quincentenary Bridge 29,900 5% 30,100 3.8%
9 N6 - On Quincentenary Bridge 34,800 3% 25,800 3.3%
10 R338 at Westside Playing fields 11,500 2% 5,800 2.7%
11 Western Distributor Rd between Clybaun Rd and R338 12,800 1% 10,000 0.2%
12 Western Distributor Rd between Clybaun Rd and Ballymoneen Rd 10,600 1% 5,700 0.2%
13 R337 Kingston Road. Kingston 7,100 1% 4,300 0.9%
14 R336. Salthill Road Upper. Galway Golf Course. 18,400 1% 16,400 0.5%
15 R336. Barna Road. Barna Woods 16,600 1% 7,200 0.5%
16 R336. Barna Road. Barna. Creagan bus stop 13,400 1% 5,800 0.5%
17 R336. Barna Road. West of Barna. Garrynagry 11,400 1% 14,700 0.9%
18 L1321. At Loughinch. South East of Bearna Golf Club 1,100 0% 1,700 0.4%
19 Boleybeg Road. Between Cappagh Road and Ballymoneen Road 2,000 1% 400 2.8%
20 Rahoon Road. Between Clybaun Rd and Bothar Stiofain 5,000 0% 6,300 0.4%
21 N59. Thomas Hynes road. Between Hazel Park and Cherry Park 4,300 2% 3,300 1.0%
22 N59. Upper Newcastle Road. Between R338 and Corrib Village 15,900 1% 15,600 0.9%
23 N59. Barnacranny. Between chesnut Ln and Circular Rd 18,400 1% 19,600 0.7%
24 N84. South of Ballindooly. Ballindooly Lough 10,600 2% 12,400 1.7%
25 N84. North of Ballindooly 17,300 1% 16,700 1.3%
26 N17. Tuam Road. NorthEast of Parkmore Road 19,300 2% 18,500 2.3%
27 R338. Dublin Road. West of Junction with Coast Road. 13,500 5% 11,400 3.9%
28 R338. Dublin road. Between Renmore Rd and M. Collins road 18,600 3% 18,400 2.6%
29 R336. Tuam Road. Mervue Business Park 14,500 3% 14,500 2.5%
30 Wolfe Tone Bridge 20,800 3% 17,200 2.2%
31 O'Briens Bridge 9,100 2% 7,900 2.2%
32 Salmon Weir Bridge 16,700 2% 14,400 2.1%
33 N17. Tuam Road. NorthEast of School Road 14,900 2% 16,600 3.4%
89 Eglington Street 7,800 3% 6,900 2.8%
90 R336 South of Eyre Square 13,600 3% 11,700 1.6%
51 Expressway - YELLOW - Briarhill Junction - 37,000 2.2%
52 Expressway - YELLOW - South of Ballybrit Business Park - 49,200 2.9%
53 Expressway - YELLOW - Between N17 and R865 - 32,900 1.9%
54 Expressway - YELLOW- Between N17 and N84 - 23,900 1.8%
55 Expressway - YELLOW - New Corrib Crossing - 39,500 1.6%
56 Expressway - YELLOW - N59 Link Road - 11,400 2.1%
57 Expressway - YELLOW - Rahoon Link Road - 18,700 1.6%
58 Expressway - YELLOW - Between Ballymoneen and Cappagh Road - 15,200 0.8%
59 Expressway - YELLOW - @ Forramoyle - 10,800 1.0%
DS - YELLOW - 2034
DM
lin
ksD
S lin
ks
DM - 2034

Galway County Council N6 Galway City Transport Project
Phase 2 Traffic Modelling Report Appendices
GCOB-4.04-10.1 (Phase 2 TM Report)_Final Issue | Final Issue | 31 August 2015 | Arup
\\GLOBAL\EUROPE\DUBLIN\JOBS\233000\233985-00\4. INTERNAL\4-04 REPORTS\4-04-03 INFRASTRUCTURE\10. TM\10.1 PHASE 2\GCOB-4.04-10.1 (TM REPORT)_FINAL
ISSUE.DOCX
Page 76
Figure 6.6.5: Orange Route AADT Locations

Galway County Council N6 Galway City Transport Project
Phase 2 Traffic Modelling Report Appendices
GCOB-4.04-10.1 (Phase 2 TM Report)_Final Issue | Final Issue | 31 August 2015 | Arup
\\GLOBAL\EUROPE\DUBLIN\JOBS\233000\233985-00\4. INTERNAL\4-04 REPORTS\4-04-03 INFRASTRUCTURE\10. TM\10.1 PHASE 2\GCOB-4.04-10.1 (TM REPORT)_FINAL
ISSUE.DOCX
Page 77
Table 6.6.5: Orange Route AADT 2034 Design Year
AADT Point Location AADT % HGV AADT % HGV
1 N6 South of Galway Airport 21,900 3% 46,200 1.9%
2 R446 West of Oranmore Business Park 20,200 5% 18,500 5.7%
3 R446 South of N6 Roundabout 14,400 3% 20,300 3.9%
4 N6 South of Briarhill 31,100 3% 10,500 4.3%
5 N6 Near Ballybrit Business park 37,000 4% 68,000 2.8%
6 N6 between N17 and R865 32,000 3% 54,300 2.3%
7 N6 Between N84 and N17 33,800 3% 29,300 3.4%
8 N6 East of Quincentenary Bridge 29,900 5% 35,500 4.1%
9 N6 - On Quincentenary Bridge 34,800 3% 27,100 3.1%
10 R338 at Westside Playing fields 11,500 2% 4,900 1.9%
11 Western Distributor Rd between Clybaun Rd and R338 12,800 1% 10,000 0.2%
12 Western Distributor Rd between Clybaun Rd and Ballymoneen Rd 10,600 1% 5,600 0.1%
13 R337 Kingston Road. Kingston 7,100 1% 4,800 1.1%
14 R336. Salthill Road Upper. Galway Golf Course. 18,400 1% 16,900 0.5%
15 R336. Barna Road. Barna Woods 16,600 1% 9,000 0.7%
16 R336. Barna Road. Barna. Creagan bus stop 13,400 1% 15,600 0.9%
17 R336. Barna Road. West of Barna. Garrynagry 11,400 1% 13,800 1.0%
18 L1321. At Loughinch. South East of Bearna Golf Club 1,100 0% 200 0.2%
19 Boleybeg Road. Between Cappagh Road and Ballymoneen Road 2,000 1% 1,500 1.0%
20 Rahoon Road. Between Clybaun Rd and Bothar Stiofain 5,000 0% 5,400 0.6%
21 N59. Thomas Hynes road. Between Hazel Park and Cherry Park 4,300 2% 2,900 1.2%
22 N59. Upper Newcastle Road. Between R338 and Corrib Village 15,900 1% 15,100 0.9%
23 N59. Barnacranny. Between chesnut Ln and Circular Rd 18,400 1% 18,400 0.6%
24 N84. South of Ballindooly. Ballindooly Lough 10,600 2% 14,000 1.7%
25 N84. North of Ballindooly 17,300 1% 17,000 1.4%
26 N17. Tuam Road. NorthEast of Parkmore Road 19,300 2% 17,100 2.4%
27 R338. Dublin Road. West of Junction with Coast Road. 13,500 5% 9,000 3.1%
28 R338. Dublin road. Between Renmore Rd and M. Collins road 18,600 3% 18,500 1.7%
29 R336. Tuam Road. Mervue Business Park 14,500 3% 11,000 2.4%
30 Wolfe Tone Bridge 20,800 3% 16,600 2.2%
31 O'Briens Bridge 9,100 2% 7,800 2.2%
32 Salmon Weir Bridge 16,700 2% 15,000 1.9%
33 N17. Tuam Road. NorthEast of School Road 14,900 2% 14,000 3.5%
89 Eglington Street 7,800 3% 5,300 3.3%
90 R336 South of Eyre Square 13,600 3% 13,200 1.6%
34 Expressway - ORANGE - Briarhill Junction - 46,200 1.9%
35 Expressway - ORANGE - South of Ballybrit Business Park - 62,400 2.9%
36 Expressway - ORANGE - Between N17 and R865 - 54,300 2.3%
37 Expressway - ORANGE - Between N17 and N84 - 71,200 2.2%
38 Expressway - ORANGE - New Corrib Crossing - 35,700 1.9%
39 Expressway - ORANGE - N59 Link Road - 8,300 2.0%
40 Expressway - ORANGE - Rahoon Link Road - 19,100 2.2%
41 Expressway - ORANGE - Between Ballymoneen and Cappagh Road - 12,700 0.8%
42 Expressway - ORANGE - At Junction with R336 - 11,300 0.8%
DS - Orange - 2034
DM
lin
ksD
S lin
ks
DM - 2034

Galway County Council N6 Galway City Transport Project
Phase 2 Traffic Modelling Report Appendices
GCOB-4.04-10.1 (Phase 2 TM Report)_Final Issue | Final Issue | 31 August 2015 | Arup
\\GLOBAL\EUROPE\DUBLIN\JOBS\233000\233985-00\4. INTERNAL\4-04 REPORTS\4-04-03 INFRASTRUCTURE\10. TM\10.1 PHASE 2\GCOB-4.04-10.1 (TM REPORT)_FINAL
ISSUE.DOCX
Page 78
Figure 6.6.6: Pink Route AADT Locations

Galway County Council N6 Galway City Transport Project
Phase 2 Traffic Modelling Report Appendices
GCOB-4.04-10.1 (Phase 2 TM Report)_Final Issue | Final Issue | 31 August 2015 | Arup
\\GLOBAL\EUROPE\DUBLIN\JOBS\233000\233985-00\4. INTERNAL\4-04 REPORTS\4-04-03 INFRASTRUCTURE\10. TM\10.1 PHASE 2\GCOB-4.04-10.1 (TM REPORT)_FINAL
ISSUE.DOCX
Page 79
Table 6.6.6: Pink Route AADT 2034 Design Year
AADT Point Location AADT % HGV AADT % HGV
1 N6 South of Galway Airport 21,900 2.9% 31,800 2.3%
2 R446 West of Oranmore Business Park 20,200 4.9% 25,900 4.0%
3 R446 South of N6 Roundabout 14,400 3.3% 31,100 2.8%
4 N6 South of Briarhill 31,100 2.8% 30,700 3.2%
5 N6 Near Ballybrit Business park 37,000 4.5% 29,800 4.2%
6 N6 between N17 and R865 32,000 3.0% 26,000 2.6%
7 N6 Between N84 and N17 33,800 2.8% 21,500 3.0%
8 N6 East of Quincentenary Bridge 29,900 4.7% 32,400 3.9%
9 N6 - On Quincentenary Bridge 34,800 3.3% 28,900 2.7%
10 R338 at Westside Playing fields 11,500 2.5% 5,500 2.0%
11 Western Distributor Rd between Clybaun Rd and R338 12,800 0.8% 9,900 0.2%
12 Western Distributor Rd between Clybaun Rd and Ballymoneen Rd 10,600 0.7% 5,800 0.2%
13 R337 Kingston Road. Kingston 7,100 1.4% 5,000 1.4%
14 R336. Salthill Road Upper. Galway Golf Course. 18,400 0.7% 17,300 0.5%
15 R336. Barna Road. Barna Woods 16,600 0.9% 9,600 0.8%
16 R336. Barna Road. Barna. Creagan bus stop 13,400 1.0% 6,800 0.9%
17 R336. Barna Road. West of Barna. Garrynagry 11,400 1.2% 13,400 1.0%
18 L1321. At Loughinch. South East of Bearna Golf Club 1,100 0.1% 1,200 0.4%
19 Boleybeg Road. Between Cappagh Road and Ballymoneen Road 2,000 0.8% 500 2.2%
20 Rahoon Road. Between Clybaun Rd and Bothar Stiofain 5,000 0.4% 4,000 0.5%
21 N59. Thomas Hynes road. Between Hazel Park and Cherry Park 4,300 1.7% 3,000 1.0%
22 N59. Upper Newcastle Road. Between R338 and Corrib Village 15,900 1.4% 15,300 0.8%
23 N59. Barnacranny. Between chesnut Ln and Circular Rd 18,400 1.3% 19,600 0.7%
24 N84. South of Ballindooly. Ballindooly Lough 10,600 2.1% 18,100 1.5%
25 N84. North of Ballindooly 17,300 1.3% 18,500 1.4%
26 N17. Tuam Road. NorthEast of Parkmore Road 19,300 1.6% 20,300 2.0%
27 R338. Dublin Road. West of Junction with Coast Road. 13,500 4.5% 9,800 3.3%
28 R338. Dublin road. Between Renmore Rd and M. Collins road 18,600 3.3% 18,400 1.9%
29 R336. Tuam Road. Mervue Business Park 14,500 2.6% 13,500 2.3%
30 Wolfe Tone Bridge 20,800 2.6% 17,300 2.2%
31 O'Briens Bridge 9,100 1.9% 7,800 2.2%
32 Salmon Weir Bridge 16,700 1.7% 15,000 2.1%
33 N17. Tuam Road. NorthEast of School Road 14,900 2.0% 17,700 2.0%
89 Eglington Street 7,800 2.6% 6,500 3.0%
90 R336 South of Eyre Square 13,600 2.5% 13,000 1.6%
70 Expressway - PINK - Briarhill Junction - 31,800 2.3%
71 Expressway - PINK - Parkmore - 28,300 1.6%
72 Expressway - PINK - Between N17 and N84 - 51,400 1.7%
73 Expressway - PINK - New Corrib Crossing - 35,500 2.0%
74 Expressway - PINK - N59 Link Road - 11,700 2.0%
75 Expressway - PINK - Rahoon Link Road - 19,400 2.1%
76 Expressway - PINK - Between Ballymoneen and Cappagh Road - 11,200 0.8%
77 Expressway - PINK - @ Ballard - 11,200 0.8%
78 Expressway - PINK - Junction with new Bearna Link Road - 10,300 0.8%
79 New Bearna Link Road - PINK - North of R336 - 11,500 0.8%
DS - PINK - 2034D
M li
nks
DS
links
DM - 2034

Galway County Council N6 Galway City Transport Project
Phase 2 Traffic Modelling Report Appendices
GCOB-4.04-10.1 (Phase 2 TM Report)_Final Issue | Final Issue | 31 August 2015 | Arup
\\GLOBAL\EUROPE\DUBLIN\JOBS\233000\233985-00\4. INTERNAL\4-04 REPORTS\4-04-03 INFRASTRUCTURE\10. TM\10.1 PHASE 2\GCOB-4.04-10.1 (TM REPORT)_FINAL
ISSUE.DOCX
Page 80
7 Emerging Preferred Route Corridor
7.1 Overview A comprehensive appraisal of the route options was carried out using the multiple criteria outlined by the Department of Transport in their report ‘Guidelines on a Common Appraisal Framework for Transport Projects and Programmes (June 2009)’. This is in line with the approach of the Project Appraisal Guidelines and considers each option under the following criteria:
Economy;
Safety;
Environment;
Accessibility & Social Inclusion; and
Integration.
Full details of this appraisal are contained in the Chapter 7 of the Route Selection Report.
For the assessment, the options are assessed in three sections. Section 1 extends from the R336 to Galway City boundary line and Section 2 extends from Galway City boundary to the existing N6 in the east of the city. An additional break down at the N6 tie-in at Coolagh has been incorporated in order to compare the junction layouts at the N6 tie in for the Stage 2 assessment. This section is referred to as Section 3 and this is assessed separately as the criteria under which the mainline are assessed are not as relevant to the junction assessment.
A summary matrix of the appraisal of each section using the five criteria is included in the Project Appraisal Matrix below in Tables 7.1.1 & 7.1.2. For the purposes of the overall project appraisal the N6 junction is included in Section 2.
Table 7.1.1: Project Appraisal Section 1 – R336 to City Boundary
Route Option
Economy Safety Environment Accessibility Integration Overall
Red - Similar LP Similar Similar LP
Orange - Similar LP Similar Similar LP
Yellow - Similar P Similar Similar P
Blue - Similar I Similar Similar I
Pink - Similar I Similar Similar I
Green - Similar LP Similar Similar LP

Galway County Council N6 Galway City Transport Project
Phase 2 Traffic Modelling Report Appendices
GCOB-4.04-10.1 (Phase 2 TM Report)_Final Issue | Final Issue | 31 August 2015 | Arup
\\GLOBAL\EUROPE\DUBLIN\JOBS\233000\233985-00\4. INTERNAL\4-04 REPORTS\4-04-03 INFRASTRUCTURE\10. TM\10.1 PHASE 2\GCOB-4.04-10.1 (TM REPORT)_FINAL
ISSUE.DOCX
Page 81
Table 7.1.2: Project Appraisal Section 2 – City Boundary to N6
Route Option Economy Safety Environment Accessibility Integration Overall Red I Similar LP Similar Similar LP Orange LP Similar P Similar Similar LP Yellow P Similar LP Similar Similar LP Blue P Similar I Similar Similar I
Pink P Similar P Similar Similar P
Green P Similar LP Similar Similar LP
Section 1, R336 to city boundary, was assessed independently of the remainder of the route options to ensure that the optimum solution for Bearna is obtained. As the safety, accessibility and integration criteria scored equally for all options, the Environment criterion was the deciding factor on the Bearna section, with Yellow being the preferred route option.
The above matrix indicates that the Pink Route Option is the preferred route option on Section 2, between the city boundary and the existing N6.
Upon completion of this appraisal, the Emerging Preferred Route Corridor was developed as an amalgamation of different route options over the two sections, namely R336 to city boundary and city boundary to N6.
The preferred route option for Section 1 is the Yellow/Green/Pink Route Option and for Section 2 is the Pink Route Option. The N59 Link associated with the Orange Route Option is preferred to that of the Pink Route Option has it has a lesser impact on residential properties and it is also preferable in terms of traffic. This Emerging Preferred Route Corridor is referred to as the Maroon Route Option.
Therefore, the Maroon Route Option is the Yellow/Green Route Option over the initial part of Section 1, connecting the Pink Route Option at Barr hAille and follows to the path of the Pink Route Option to its termination at the N6 in Coolagh, with the exception of the N59 Link. The N59 Link will comprise the link as presented in the Orange Route Option.
The corridor is presented in Figure 7.1.1 overleaf.

Galway County Council N6 Galway City Transport Project
Phase 2 Traffic Modelling Report Appendices
GCOB-4.04-10.1 (Phase 2 TM Report)_Final Issue | Final Issue | 31 August 2015 | Arup
\\GLOBAL\EUROPE\DUBLIN\JOBS\233000\233985-00\4. INTERNAL\4-04 REPORTS\4-04-03 INFRASTRUCTURE\10. TM\10.1 PHASE 2\GCOB-4.04-10.1 (TM REPORT)_FINAL
ISSUE.DOCX
Page 82
Figure 7.1.1: Emerging Preferred Route Corridor

Galway County Council N6 Galway City Transport Project
Phase 2 Traffic Modelling Report Appendices
GCOB-4.04-10.1 (Phase 2 TM Report)_Final Issue | Final Issue | 31 August 2015 | Arup
\\GLOBAL\EUROPE\DUBLIN\JOBS\233000\233985-00\4. INTERNAL\4-04 REPORTS\4-04-03 INFRASTRUCTURE\10. TM\10.1 PHASE 2\GCOB-4.04-10.1 (TM REPORT)_FINAL
ISSUE.DOCX
Page 83
7.2 Emerging Preferred Route Corridor Analysis This section provides a summary of the performance of the Emerging Preferred Route Corridor (EPRC), based on the following Key Performance Indicators:
Network Performance
Journey Times
AADT Flows
The analysis presented in this section has been run through the demand model to take account of changes in transport costs, such as vehicle operating costs, values of time, congestion levels and the impact of Do-Minimum or Do-Something schemes.
7.3 Network Performance Network performance indicators for the 2034 Design Year are outlined in the table below, extracted from the morning peak hour and inter-peak hour highway assignments.
The tables below show that the EPRC reduces total network delay by circa 38% in the AM peak and 18% in the inter peak periods, when compared with the Do-Minimum.
Table 7.3.1: Network Performance Indicators 2034 Design Year – Morning Peak Hour
Route Option
Total Vehicle
Distance (pcu.kms)
Total Network
Travel Time (pcu.hrs)
Total Network
Delay (pcu.hrs)
Average Vehicle
Speed (kph)
2012 Base 195815 6429 1749 30.5
2034 Do-Min 223107 8297 2969 26.9
2034 EPRC 249305 6969 1830 35.8 Table 7.3.2: Network Performance Indicators 2034 Design Year – Inter-peak Hour
Route Option
Total Vehicle
Distance (pcu.kms)
Total Network
Travel Time (pcu.hrs)
Total Network
Delay (pcu.hrs)
Average Vehicle
Speed (kph)
2012 Base 133907 3989 795 33.6
2034 Do-Min 159598 5126 1357 31.1
2034 EPRC 180369 4979 1112 36.2

Galway County Council N6 Galway City Transport Project
Phase 2 Traffic Modelling Report Appendices
GCOB-4.04-10.1 (Phase 2 TM Report)_Final Issue | Final Issue | 31 August 2015 | Arup
\\GLOBAL\EUROPE\DUBLIN\JOBS\233000\233985-00\4. INTERNAL\4-04 REPORTS\4-04-03 INFRASTRUCTURE\10. TM\10.1 PHASE 2\GCOB-4.04-10.1 (TM REPORT)_FINAL
ISSUE.DOCX
Page 84
7.4 Journey Times As with the route options analysed in Chapter 6, a journey time analysis has been undertaken for three key routes in Galway City, in order to analyse the performance of the EPRC in terms of journey times. These routes were identified in Phase 1 as key routes, and journey times on these routes are a key performance indicator on which all options are tested.
Table 7.4.1 below presents the journey time analysis for the three routes in the 2034 AM peak period.
The journey time analysis shows that the EPRC saves an average of 6 minutes (20% reduction) on the inbound routes and 2 minutes (10% reduction) on the outbound routes. The biggest journey time savings for the EPRC, in the AM peak period, are on the N6 (Route 1) and N84 (Route 3) in the inbound directions.
Table 7.4.1: Journey Times (in Minutes) 2034 Design Year
2034 Journey Times
DM AM peak hour EPRC
Inb
ou
nd
Route 1 IN 33 25
Route 2 IN 26 24
Route 3 IN 21 15
Average 27 21
Ou
tbo
un
d
Route 1 OUT 28 23
Route 2 OUT 19 18
Route 3 OUT 10 10
Average 19 17

Galway County Council N6 Galway City Transport Project
Phase 2 Traffic Modelling Report Appendices
GCOB-4.04-10.1 (Phase 2 TM Report)_Final Issue | Final Issue | 31 August 2015 | Arup
\\GLOBAL\EUROPE\DUBLIN\JOBS\233000\233985-00\4. INTERNAL\4-04 REPORTS\4-04-03 INFRASTRUCTURE\10. TM\10.1 PHASE 2\GCOB-4.04-10.1 (TM REPORT)_FINAL
ISSUE.DOCX
Page 85
Figure 7.4.1: Journey Time Routes
7.5 Annual Average Daily Traffic (AADT) The forecast AADT flows on the EPRC road network extracted from the model are presented in Table 7.5.1 below. Figure 7.5.1 illustrates the points at which AADT values were taken.

Galway County Council N6 Galway City Transport Project
Phase 2 Traffic Modelling Report Appendices
GCOB-4.04-10.1 (Phase 2 TM Report)_Final Issue | Final Issue | 31 August 2015 | Arup
\\GLOBAL\EUROPE\DUBLIN\JOBS\233000\233985-00\4. INTERNAL\4-04 REPORTS\4-04-03 INFRASTRUCTURE\10. TM\10.1 PHASE 2\GCOB-4.04-10.1 (TM REPORT)_FINAL
ISSUE.DOCX
Page 86
Figure 7.5.1: EPRC Route AADT Locations

Galway County Council N6 Galway City Transport Project
Phase 2 Traffic Modelling Report Appendices
GCOB-4.04-10.1 (Phase 2 TM Report)_Final Issue | Final Issue | 31 August 2015 | Arup
\\GLOBAL\EUROPE\DUBLIN\JOBS\233000\233985-00\4. INTERNAL\4-04 REPORTS\4-04-03 INFRASTRUCTURE\10. TM\10.1 PHASE 2\GCOB-4.04-10.1 (TM REPORT)_FINAL
ISSUE.DOCX
Page 87
Table 7.5.1: EPRC AADT 2034 Design Year
AADT Point Location AADT % HGV AADT % HGV
1 N6 South of Galway Airport 21,900 3% 31,300 2%
2 R446 West of Oranmore Business Park 20,200 5% 26,000 4%
3 R446 South of N6 Roundabout 14,400 3% 30,900 3%
4 N6 South of Briarhill 31,100 3% 30,500 2%
5 N6 Near Ballybrit Business park 37,000 4% 28,400 4%
6 N6 between N17 and R865 32,000 3% 24,800 3%
7 N6 Between N84 and N17 33,800 3% 20,200 3%
8 N6 East of Quincentenary Bridge 29,900 5% 32,000 4%
9 N6 - On Quincentenary Bridge 34,800 3% 28,600 3%
10 R338 at Westside Playing fields 11,500 2% 5,700 2%
11 Western Distributor Rd between Clybaun Rd and R338 12,800 1% 9,300 0%
12 Western Distributor Rd between Clybaun Rd and Ballymoneen Rd 10,600 1% 5,200 0%
13 R337 Kingston Road. Kingston 7,100 1% 4,500 1%
14 R336. Salthill Road Upper. Galway Golf Course. 18,400 1% 16,200 0%
15 R336. Barna Road. Barna Woods 16,600 1% 7,000 1%
16 R336. Barna Road. Barna. Creagan bus stop 13,400 1% 5,500 1%
17 R336. Barna Road. West of Barna. Garrynagry 11,400 1% 14,300 1%
18 L1321. At Loughinch. South East of Bearna Golf Club 1,100 0% 2,000 1%
19 Boleybeg Road. Between Cappagh Road and Ballymoneen Road 2,000 1% 200 1%
20 Rahoon Road. Between Clybaun Rd and Bothar Stiofain 5,000 0% 3,400 1%
21 N59. Thomas Hynes road. Between Hazel Park and Cherry Park 4,300 2% 3,100 1%
22 N59. Upper Newcastle Road. Between R338 and Corrib Village 15,900 1% 15,600 1%
23 N59. Barnacranny. Between chesnut Ln and Circular Rd 18,400 1% 21,500 1%
24 N84. South of Ballindooly. Ballindooly Lough 10,600 2% 18,600 1%
25 N84. North of Ballindooly 17,300 1% 18,900 1%
26 N17. Tuam Road. NorthEast of Parkmore Road 19,300 2% 20,500 2%
27 R338. Dublin Road. West of Junction with Coast Road. 13,500 5% 10,000 4%
28 R338. Dublin road. Between Renmore Rd and M. Collins road 18,600 3% 18,300 2%
29 R336. Tuam Road. Mervue Business Park 14,500 3% 13,400 2%
30 Wolfe Tone Bridge 20,800 3% 17,000 2%
31 O'Briens Bridge 9,100 2% 7,600 2%
32 Salmon Weir Bridge 16,700 2% 14,500 2%
33 N17. Tuam Road. NorthEast of School Road 14,900 2% 18,100 2%
89 Eglington Street 7,800 3% 6,400 3%
90 R336 South of Eyre Square 13,600 3% 12,600 2%
98 Expressway - EPR - Briarhill Junction - 31,300 2%
99 Expressway - EPR - Parkmore - 31,400 2%
100 Expressway - EPR - Between N17 and N84 - 54,600 2%
101 Expressway - EPR - New Corrib Crossing - 38,700 2%
102 Expressway - EPR - N59 Link Road - 12,500 2%
103 Expressway - EPR - Rahoon Link Road - 21,100 2%
104 Expressway - EPR - Between Ballymoneen and Cappagh Road - 15,200 1%
105 Expressway - EPR - at Turskey West - 10,700 1%
106 Expressway - EPR - North of R336 Junction - 10,700 1%
2034 DM 2034 EPRCD
M li
nks
DS
Lin
ks

Galway County Council N6 Galway City Transport Project
Phase 2 Traffic Modelling Report Appendices
GCOB-4.04-10.1 (Phase 2 TM Report)_Final Issue | Final Issue | 31 August 2015 | Arup
\\GLOBAL\EUROPE\DUBLIN\JOBS\233000\233985-00\4. INTERNAL\4-04 REPORTS\4-04-03 INFRASTRUCTURE\10. TM\10.1 PHASE 2\GCOB-4.04-10.1 (TM REPORT)_FINAL
ISSUE.DOCX
Page 88
7.6 Galway Transport Strategy and Next Steps As noted previously, the public transport alternative, as based on the existing plans adopted for Galway, does not provide an adequate solution to reducing congestion levels in the city.
Through consultation with key stakeholders including the NRA, NTA, Galway County Council and Galway City Council the need for a wider integrated transport strategy for Galway has been identified which will identify the level of service requirements for each mode of transport; including walking, cycling, public transport and private vehicle.
The Galway Transport Strategy will include an in-depth analysis of existing and future travel demand in Galway City and its environs in order to establish the optimum provision for public transport, cycling and walking.
The Strategy will identify a series of supporting infrastructure, operational and policy measures to help optimise travel by sustainable modes in order to meet both the current and future travel needs of Galway.
The strategy will be formulated into an Integrated Transport Management Programme which will set out a phased and costed plan of transportation measures for Galway City over a 20 to 30 year horizon.
A review of the preferred route option will be undertaken in the context of the recommendations of the wider Galway Transport Strategy at Stage 3 of this project.

Appendix A
Traffic Count Locations

Galway County Council N6 Galway City Transport Project
Phase 2 Traffic Modelling Report Appendices
GCOB-4.04-10.1 (Phase 2 TM Report)_Final Issue | Final Issue | 31 August 2015 | Arup
\\GLOBAL\EUROPE\DUBLIN\JOBS\233000\233985-00\4. INTERNAL\4-04 REPORTS\4-04-03 INFRASTRUCTURE\10. TM\10.1 PHASE 2\GCOB-4.04-10.1 (TM REPORT)_FINAL
ISSUE.DOCX
Page A1
A1

Appendix B
Tom Tom Speed Data Sample Sizes

Galway County Council N6 Galway City Transport Project
Phase 2 Traffic Modelling Report Appendices
GCOB-4.04-10.1 (Phase 2 TM Report)_Final Issue | Final Issue | 31 August 2015 | Arup
\\GLOBAL\EUROPE\DUBLIN\JOBS\233000\233985-00\4. INTERNAL\4-04 REPORTS\4-04-03 INFRASTRUCTURE\10. TM\10.1 PHASE 2\GCOB-4.04-10.1 (TM REPORT)_FINAL
ISSUE.DOCX
Page B1
B1

Appendix C
Model Zone System

Galway County Council N6 Galway City Transport Project
Phase 2 Traffic Modelling Report Appendices
GCOB-4.04-10.1 (Phase 2 TM Report)_Final Issue | Final Issue | 31 August 2015 | Arup
\\GLOBAL\EUROPE\DUBLIN\JOBS\233000\233985-00\4. INTERNAL\4-04 REPORTS\4-04-03 INFRASTRUCTURE\10. TM\10.1 PHASE 2\GCOB-4.04-10.1 (TM REPORT)_FINAL
ISSUE.DOCX
Page C1
C1

Appendix D
Highway Link and Turn Count

Galway County Council N6 Galway City Transport Project
Phase 2 Traffic Modelling Report Appendices
GCOB-4.04-10.1 (Phase 2 TM Report)_Final Issue | Final Issue | 31 August 2015 | Arup
\\GLOBAL\EUROPE\DUBLIN\JOBS\233000\233985-00\4. INTERNAL\4-04 REPORTS\4-04-03 INFRASTRUCTURE\10. TM\10.1 PHASE 2\GCOB-4.04-10.1 (TM REPORT)_FINAL
ISSUE.DOCX
Page D1
D1

Appendix E
List of Future Year Do-Minimum

Galway County Council N6 Galway City Transport Project
Phase 2 Traffic Modelling Report Appendices
GCOB-4.04-10.1 (Phase 2 TM Report)_Final Issue | Final Issue | 31 August 2015 | Arup
\\GLOBAL\EUROPE\DUBLIN\JOBS\233000\233985-00\4. INTERNAL\4-04 REPORTS\4-04-03 INFRASTRUCTURE\10. TM\10.1 PHASE 2\GCOB-4.04-10.1 (TM REPORT)_FINAL
ISSUE.DOCX
Page E1
E1

Appendix F
NTA NDFM Development Report

Galway County Council N6 Galway City Transport Project
Phase 2 Traffic Modelling Report Appendices
GCOB-4.04-10.1 (Phase 2 TM Report)_Final Issue | Final Issue | 31 August 2015 | Arup
\\GLOBAL\EUROPE\DUBLIN\JOBS\233000\233985-00\4. INTERNAL\4-04 REPORTS\4-04-03 INFRASTRUCTURE\10. TM\10.1 PHASE 2\GCOB-4.04-10.1 (TM REPORT)_FINAL
ISSUE.DOCX
Page F1
F1

Appendix G
Cross-section selection

Galway County Council N6 Galway City Transport Project
Phase 2 Traffic Modelling Report Appendices
GCOB-4.04-10.1 (Phase 2 TM Report)_Final Issue | Final Issue | 31 August 2015 | Arup
\\GLOBAL\EUROPE\DUBLIN\JOBS\233000\233985-00\4. INTERNAL\4-04 REPORTS\4-04-03 INFRASTRUCTURE\10. TM\10.1 PHASE 2\GCOB-4.04-10.1 (TM REPORT)_FINAL
ISSUE.DOCX
Page G1
G1

Appendix H
AADT Expansion Factors

Galway County Council N6 Galway City Transport Project
Phase 2 Traffic Modelling Report Appendices
GCOB-4.04-10.1 (Phase 2 TM Report)_Final Issue | Final Issue | 31 August 2015 | Arup
\\GLOBAL\EUROPE\DUBLIN\JOBS\233000\233985-00\4. INTERNAL\4-04 REPORTS\4-04-03 INFRASTRUCTURE\10. TM\10.1 PHASE 2\GCOB-4.04-10.1 (TM REPORT)_FINAL
ISSUE.DOCX
Page H1
H1

Appendix I
NTA GIM Forecasting - Briefing Note 1

Galway County Council N6 Galway City Transport Project
Phase 2 Traffic Modelling Report Appendices
GCOB-4.04-10.1 (Phase 2 TM Report)_Final Issue | Final Issue | 31 August 2015 | Arup
\\GLOBAL\EUROPE\DUBLIN\JOBS\233000\233985-00\4. INTERNAL\4-04 REPORTS\4-04-03 INFRASTRUCTURE\10. TM\10.1 PHASE 2\GCOB-4.04-10.1 (TM REPORT)_FINAL
ISSUE.DOCX
Page I1
I1